ELSEVIER Geomorphology 17 (1996) 99-113 GEOMORPHOIOGY Evaluating eolian-climatic interactions using a regional climate model from Hanford, Washington(USA) Larry D. Stetler *, David R. Gaylord Biological Systems Engineering, Washington State University, Pullman, WA 99164-6120, USA Department of Geology, Washington State University, Pullman, WA 99164-2812, USA Received 28 March 1994; revised 4 November 1994; accepted 5 June 1995 Abstract A regional climate model (RCM) developed for the Hanford Site, Washington illustrates a potentially useful method for assessing eolian responses to regional climate change. The RCM is based on long-term relations between fundamental climatic variables of precipitation, temperature, and wind speed. Modelled data are integrated into eolian-climatic scenarios through maps of eolian susceptibility, plots of sand dune mobility, and calculated trends of unvegetated dune sand volumes. Results demonstrate the sensitivity of eolian-climatic interactions to small changes in precipitation. Analyses suggest that continuation of the 1977-1987 trend toward a cooler (-0.16°C) and wetter (+ 1.8 cm yr-1) climate over the next 10-15 years will result in a decrease of ~ 18% in the volume of unvegetated dune sand. Further temperature reductions ~Lotaling0.7°C would promote precipitation increases of 30% leading to an additional reduction of 98% in the volume of unvegetated dune sand. Modelling scenarios for a possible global warming of + 4°C indicate that annual precipitation at Hanford would be negligible and vegetation would be eliminated from dune surfaces. Sand dune mobility would increase by over 400%. 1. Introduction Recent geological investigations have been di- rected toward global climate change and the subse- quent impact these changes might have on the char- acter of eolian-induced modifications of the surface of Earth (Lancaster, 1991; Swinehart, 1991; Muhs, 1991; Forman et al., 1992; Gaylord and Stetler, 1994). Presently, much of the western interior of the United States is mantled by sand dunes. Although many dunes and dune fields are currently inactive, substantial geologic, palynologic, and archaeologic evidence suggests that widespread sand dune activity * Corresponding author. in the western interior reached a peak in the middle and late Holocene (Antevs, 1948; Benedict, 1979; Gaylord, 1982; Ahlbrandt et al., 1983; Forman et al., 1992; Madole, 1994). Climatic thresholds that were breached to prompt this extensive dune activity are not well understood. Consequently, the potential for widespread modem sand dune activity depends upon developing reliable models which can predict the susceptibility of modem stabilized dunes to whole- sale eolian remobilization. Lancaster (1988) and Muhs and Maat (1993) have investigated cause-and-effect relations between cli- mate variables and sand dune mobility. This research has demonstrated that both proxy climate data and extrapolations from general circulation models 0169-555X/96/$15.00 Copyright © 1996 Elsevier Science B.V. All rights reserved. SSDI 0169-555X(95)00097-6

Welcome message from author
This document is posted to help you gain knowledge. Please leave a comment to let me know what you think about it! Share it to your friends and learn new things together.
Transcript
ELSEVIER Geomorphology 17 (1996) 99-113
GEOMORPHOIOGY
Evaluating eolian-climatic interactions using a regional climate model from Hanford, Washington(USA)
Larry D. Stetler *, David R. Gaylord Biological Systems Engineering, Washington State University, Pullman, WA 99164-6120, USA
Department of Geology, Washington State University, Pullman, WA 99164-2812, USA
Received 28 March 1994; revised 4 November 1994; accepted 5 June 1995
Abstract
A regional climate model (RCM) developed for the Hanford Site, Washington illustrates a potentially useful method for assessing eolian responses to regional climate change. The RCM is based on long-term relations between fundamental climatic variables of precipitation, temperature, and wind speed. Modelled data are integrated into eolian-climatic scenarios through maps of eolian susceptibility, plots of sand dune mobility, and calculated trends of unvegetated dune sand volumes. Results demonstrate the sensitivity of eolian-climatic interactions to small changes in precipitation.
Analyses suggest that continuation of the 1977-1987 trend toward a cooler (-0.16°C) and wetter (+ 1.8 cm yr-1) climate over the next 10-15 years will result in a decrease of ~ 18% in the volume of unvegetated dune sand. Further temperature reductions ~Lotaling 0.7°C would promote precipitation increases of 30% leading to an additional reduction of 98% in the volume of unvegetated dune sand. Modelling scenarios for a possible global warming of + 4°C indicate that annual precipitation at Hanford would be negligible and vegetation would be eliminated from dune surfaces. Sand dune mobility would increase by over 400%.
1. Introduction
Recent geological investigations have been di- rected toward global climate change and the subse- quent impact these changes might have on the char- acter of eolian-induced modifications of the surface of Earth (Lancaster, 1991; Swinehart, 1991; Muhs, 1991; Forman et al., 1992; Gaylord and Stetler, 1994). Presently, much of the western interior of the United States is mantled by sand dunes. Although many dunes and dune fields are currently inactive, substantial geologic, palynologic, and archaeologic evidence suggests that widespread sand dune activity
* Corresponding author.
in the western interior reached a peak in the middle and late Holocene (Antevs, 1948; Benedict, 1979; Gaylord, 1982; Ahlbrandt et al., 1983; Forman et al., 1992; Madole, 1994). Climatic thresholds that were breached to prompt this extensive dune activity are not well understood. Consequently, the potential for widespread modem sand dune activity depends upon developing reliable models which can predict the susceptibility of modem stabilized dunes to whole- sale eolian remobilization.
Lancaster (1988) and Muhs and Maat (1993) have investigated cause-and-effect relations between cli- mate variables and sand dune mobility. This research has demonstrated that both proxy climate data and extrapolations from general circulation models
0169-555X/96/$15.00 Copyright © 1996 Elsevier Science B.V. All rights reserved. SSDI 0169-555X(95)00097-6
100 L.D. Stetler, D.R. Gaylord / Geomorphology 17 (1996) 99-113
1 N
4 0 u
u TO a .
121"
I ' A A
A
~~ Seattl'/~ ~J l e A A
P A A
.~A '-,, - A f/~A
~ /" ,A
~ A A ' ,, , /
11g* i
WASHINGTON
River
Pasco Basin
l
117"
Spokane 48*
Hanford Site I 46*
r r "
lli
Scale
Km
0
4N
0
Hanford Site
OSand Dunes
I [] op,..d. ~½s°., . . . . D u n e s
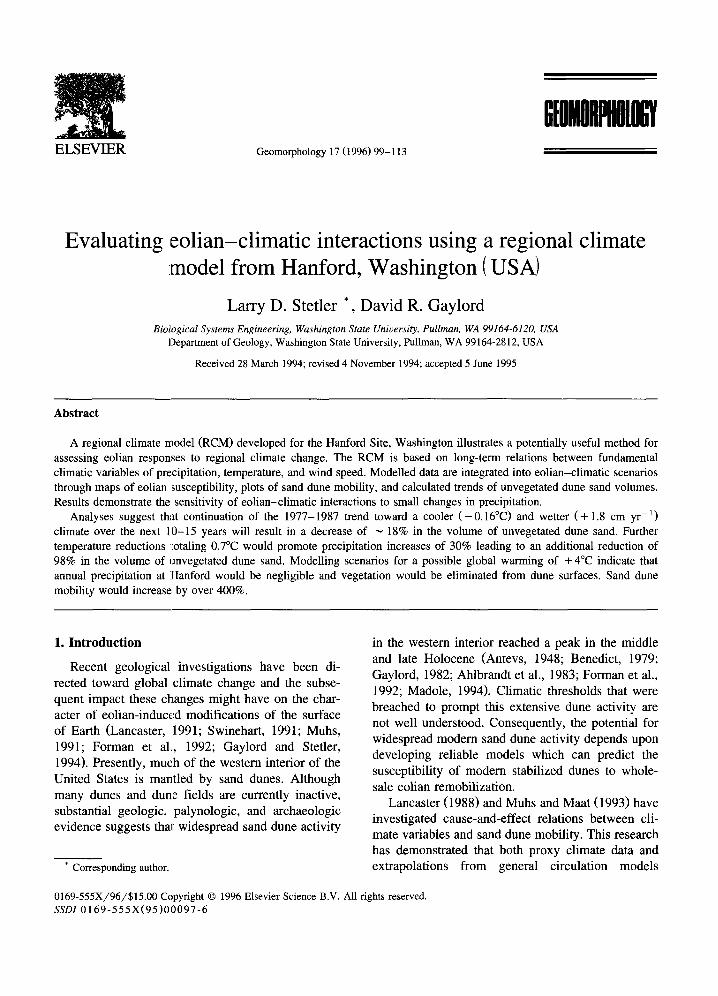
Fig. 1. Overview map showing the location of the Hanford Site and major physiographic features. Inset map illustrates long-term (1948-1987) seasonal wind patterns. Arrows indicate predominant summer (dark) and winter (open) airflow. Modified from Kasper and Glantz (1987).
L.D. Stetler, D.R. Gaylord/ Geomorphology 17 (1996) 99-113 101
(GCMs) have the pol:ential to improve prediction of eolian-climatic interactions. GCMs, in particular hold great promise as predictive tools, although in- herent coarse spatial resolution ( ~ 500 km) and sea- sonal insensitivities to regional conditions, limit the application for meso-scale scenarios.
Following the work of Stetler (1993) and Gaylord and Stetler (1994), this paper develops a meso-scale regional climate model (RCM) for the Hanford Site, Washington (Fig. 1). The model was constructed from and calibrated using the local meteorological record for the reference period 1948-1987. The higher resolution of the RCM (tens of km) permits much more detailed assessment of local eolian- climatic interactions than possible using GCMs. In this paper, we characterize these eolian-climatic in- teractions using maps of eolian susceptibility, pro- duced from a Geographic Information System (GIS), and plots of sand dune mobility.
This study was conducted at the Hanford Site because of the unusually complete meteorological record and archival stereo aerial photographic cover- age. The eolian history of the site has practical importance because of the potential of the site as a low-level nuclear waste storage facility (U.S. Depart- ment of Energy, 1986a,b,1987a,b; Cadwell, 1991). Identification of modern climatic effects and pro- jected future climatic conditions at the site have important ramificatioas for proposed construction of engineered surface bartiers where the waste will be
0
E
16
14
12 10 8 6 4 2 0
~ , ~ -o- PET
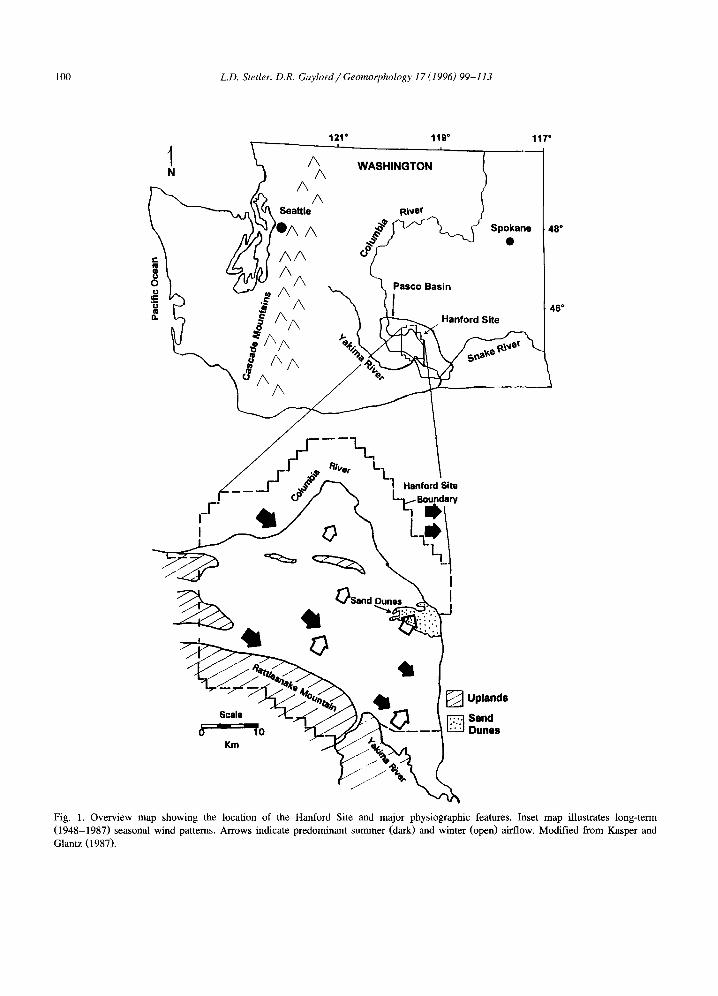
Fig. 2. Annual water budget for Hanford. Data compiled from Stone et al. (1983) and D. Hoitink (pers. commun., 1992).
stored (Cadwell, 1991). When constructed, these bar- tiers must inhibit water infiltration, plant, animal, and human modification, and wind and water erosion for at least 10,000 years. Primary factors goveming the stability of an erodible surface are: (1) climate regime, (2) biota, and (3) textural character of the cover sediment (Stetler, 1993). The Hanford RCM evaluates interactions between these goveming fac- tors, and as such, can become a useful predictive tool in assessing the best possible barrier design.
2. Hanford Site climate
2.1. Fundamental climatic parameters and relations
2.1.1. Overview The modern climate of the Hanford Site (Fig. 1)
is characterized by warm, dry summers and cool, moist winters (Liverman, 1975; Stone et al., 1983; Kasper and Glantz, 1987). The Cascade Range west of the site modifies the generally eastward-tracking Pacific frontal systems lessening the maritime influ- ence on the region. The Rocky Mountains east of the site protect the area from cold Arctic air masses common east of the continental divide.
Precipitation and temperature data for the Hanford Site have been collected since 1912. Wind speed and direction data are available since 1943. In this paper, analyses are focused on the relations between cli- matic variables and the corresponding changes in the geomorphology of sand dunes for the climatic refer- ence period from 1948 to 1987. Documentation of geomorphic changes of sand dunes were made from analysis of remotely sensed data (Gaylord and Stetler, 1994) and detailed field reconnaissance of the site.
2.1.2. Precipitation, temperature, and wind The historical average (1912-1987) of relatively
low precipitation on the Hanford Site (16.0 cm yr -1 ) reflects the influence of the rain shadow leeward of the Cascade Range (Stone et al., 1983). Precipitation averaged 15.3 cm yr -1 from 1912 to 1947 increasing to 16.7 cm yr -1 following 1947. Yearly distribution patterns of precipitation (Fig. 2) have remained es- sentially constant since 1912 with less than 12% of annual precipitation occurring in summer (July-Sep- tember) and 52% in the winter (November-
102 L.D. Stetler, D.R. Gaylord / Geomorphology 17 (1996) 99-113
February). Natural interannual variability (~r) in pre- cipitation since 1947 is 4.8 cm yr -~, or 28.7% of the annual average.
The historical average annual temperature is 11.67°C and is unchanged for the reference period (1947-1987). Daily temperatures range from below 0°C in January to above 32°C in July (Fig. 3). Natural interannual variability (tr) in temperature for the reference period is 0.78°C, or 6.7% of the annual average.
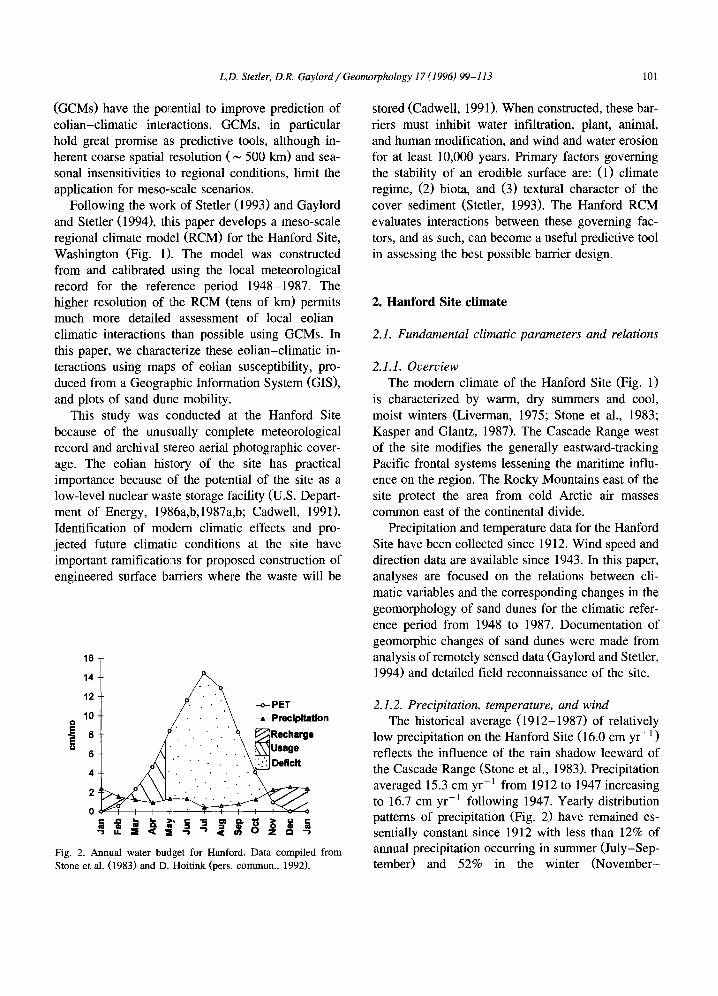
Wind speed and direction data from Stone et al. (1983) and Kasper and Glantz (1987) reveal estab- lished seasonal airflow patterns across the site (Fig. 1). In summer (May to August), winds are domi- nantly from the northwest (Fig. 1, dark arrows) and diurnal temperature variations of 14°C contribute significant to daily wind speed fluctuations. For ex- ample, near-surface ( < 15 m) wind velocities in- crease as heated air rises above the basin floor and is replaced by cooler mountain air descending from the
northwest (Fig. 3). Daily peaks in both near-surface hourly averaged wind speed and temperature occur between 1600 and 2200 h and are 4.5 m s -1 and 28°C, respectively. Daily lows in both hourly aver- aged wind speed and temperature occur between 0400 and 1000 h and are 2.7 m s -~ and 19°C, respectively.
Winter winds (November to February) are domi- nantly from the SW (Fig. 1, open arrows). Unlike the thermally driven summer winds, winter winds origi- nate primarily from regional high-level, eastward- tracking, low-pressure troughs. Passage of these low-pressure troughs produce dominantly cyclonic wind patterns which induce prevailing SW airflow. Intense NNE-directed pressure gradients result when these low pressure zones are juxtaposed with high- pressure cells over Oregon or northern Califoruia--a situation which produces winds with the highest gusts of the year. The brevity of these strong winds combined with the shielding effect of Rattlesnake
9 . 0
E 7 .2
_~ 5 . 4
• ~ 3 . 6 t ' -
1 . 8
0
January
3 2 2 8 o
H e i g h t m
.. . . . . . . . . 1 2 2 - - - - - 6 0 - - - - 3 0
2 4 . . . . . 125 J , o -.-. . . . . . . . . . . . . . . . . . . . . ,.:.'-" ":~-... ~ 16
• . . . . . . "--.:.:'- . . . . ~' ..--. ~ -., 9 12 . . . . . . ~- - : " ' - " "+ "" " E g" 8
0 I I t ! I I
9 . 0
E 7 .2
5 . 4
> • o 3 . 6 _c
1.8
July H e i g h t m /.--.......
. . . . . . . . . . . 1 2 2 / / , - ~ , 3 2 "'.. - - - - - 6 0 : \ , ".. ~ - - 3 0 ;,, f , ,U 2 8
' ~ , . ' . . . . . . 1 5 7 / " \ . • "- . . . . 2 4 . \ , , , . . . . 2 .CA..'" "', e ' , ~_ \ , . . . . . / ~ , • ~ 2 0 . ,,,, ~ , ~ . . . / ~ , , m 16
i i . I ! ' I =. I , I ,
4 8 1'2 1 6 2 0 2 4
Hours
I , I i I I I , I , I
4 8 1 2 1 6 2 0 2 4
H o u r s
Fig. 3. Daily average distributions for wind speed and temperature during January and July. All data collected on the 122-m tower of Hanford Meteorological Station. Modified from Kasper and Glantz (1987).
L.D. Stetle r, D.R. Gaylord / Geomorphology 17 (1996)99-113 103
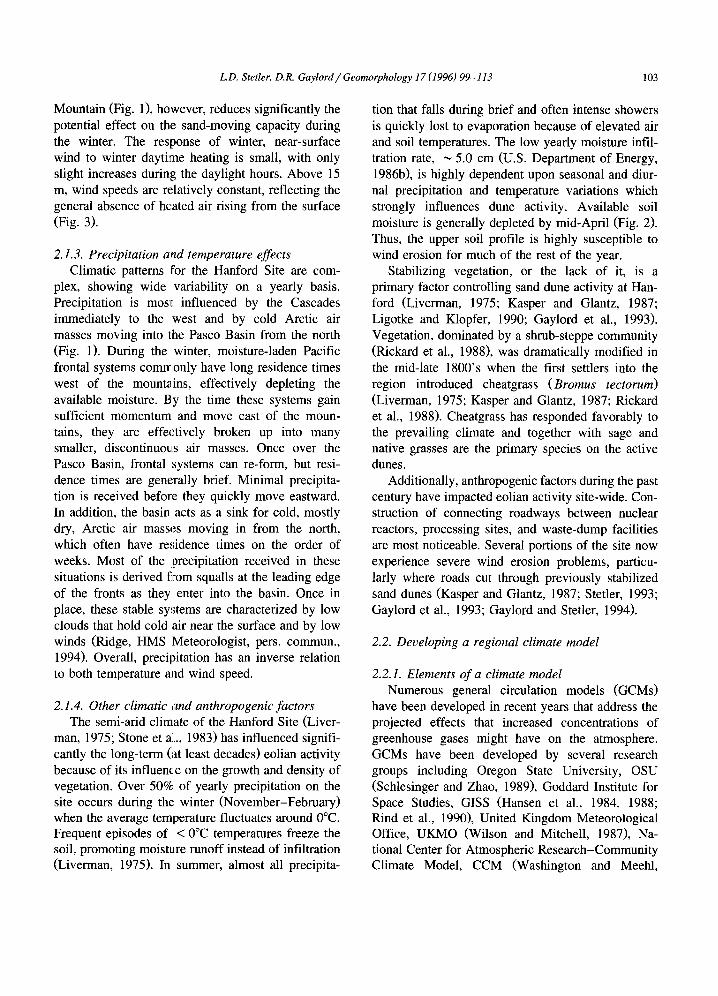
Mountain (Fig. 1), however, reduces significantly the potential effect on the sand-moving capacity during the winter. The response of winter, near-surface wind to winter daytime heating is small, with only slight increases during the daylight hours. Above 15 m, wind speeds are relatively constant, reflecting the general absence of he, ated air rising from the surface (Fig. 3).
2.1.3. Precipitation and temperature effects Climatic patterns for the Hanford Site are com-
plex, showing wide variability on a yearly basis. Precipitation is mos~ influenced by the Cascades immediately to the west and by cold Arctic air masses moving into the Pasco Basin from the north (Fig. 1). During the winter, moisture-laden Pacific frontal systems commonly have long residence times west of the mountains, effectively depleting the available moisture. By the time these systems gain sufficient momentum and move east of the moun- tains, they are effectively broken up into many smaller, discontinuous air masses. Once over the Pasco Basin, frontal systems can re-form, but resi- dence times are generally brief. Minimal precipita- tion is received before they quickly move eastward. In addition, the basin acts as a sink for cold, mostly dry, Arctic air masses moving in from the north, which often have re,;idence times on the order of weeks. Most of the precipitation received in these situations is derived from squalls at the leading edge of the fronts as they enter into the basin. Once in place, these stable sy~;tems are characterized by low clouds that hold cold air near the surface and by low winds (Ridge, HMS Meteorologist, pers. commun., 1994). Overall, precipitation has an inverse relation to both temperature and wind speed.
2.1.4. Other climatic and anthropogenic factors The semi-arid climate of the Hanford Site (Liver-
man, 1975; Stone et aL, 1983) has influenced signifi- cantly the long-term (at least decades) eolian activity because of its influence on the growth and density of vegetation. Over 50% of yearly precipitation on the site occurs during the winter (November-February) when the average temperature fluctuates around 0°C. Frequent episodes of < 0°C temperatures freeze the soil, promoting moisture runoff instead of infiltration (Liverman, 1975). In summer, almost all precipita-
tion that falls during brief and often intense showers is quickly lost to evaporation because of elevated air and soil temperatures. The low yearly moisture infil- tration rate, ~ 5.0 cm (U.S. Department of Energy, 1986b), is highly dependent upon seasonal and diur- nal precipitation and temperature variations which strongly influences dune activity. Available soil moisture is generally depleted by mid-April (Fig. 2). Thus, the upper soil profile is highly susceptible to wind erosion for much of the rest of the year.
Stabilizing vegetation, or the lack of it, is a primary factor controlling sand dune activity at Han- ford (Liverman, 1975; Kasper and Glantz, 1987; Ligotke and Klopfer, 1990; Gaylord et al., 1993). Vegetation, dominated by a shrub-steppe community (Rickard et al., 1988), was dramatically modified in the mid-late 1800's when the first settlers into the region introduced cheatgrass (Bromus tectorum) (Liverman, 1975; Kasper and Glantz, 1987; Rickard et al., 1988). Cheatgrass has responded favorably to the prevailing climate and together with sage and native grasses are the primary species on the active dunes.
Additionally, anthropogenic factors during the past century have impacted eolian activity site-wide. Con- struction of connecting roadways between nuclear reactors, processing sites, and waste-dump facilities are most noticeable. Several portions of the site now experience severe wind erosion problems, particu- larly where roads cut through previously stabilized sand dunes (Kasper and Glantz, 1987; Stetler, 1993; Gaylord et al., 1993; Gaylord and Stetler, 1994).
2.2. Developing a regional climate model
2.2.1. Elements of a climate model Numerous general circulation models (GCMs)
have been developed in recent years that address the projected effects that increased concentrations of greenhouse gases might have on the atmosphere. GCMs have been developed by several research groups including Oregon State University, OSU (Schlesinger and Zhao, 1989), Goddard Institute for Space Studies, GISS (Hansen et al., 1984, 1988; Rind et al., 1990), United Kingdom Meteorological Office, UKMO (Wilson and Mitchell, 1987), Na- tional Center for Atmospheric Research-Community Climate Model, CCM (Washington and Meehl,
104 L.D. Stetler, D.R. Gaylord / Geomorphology 17 (1996) 99-113
1984), Geophysical Fluid Dynamics Laboratory, GFDL (Wetherald and Manabe, 1988), and Labora- toire de M6trorologie Dynamique, LMD (Jous- saume, 1993).
The most important modelling criteria is that the current climate be successfully reproduced (Robock et al., 1993). Most GCMs are calibrated using the global temperature record of the past 100 years and are validated by reproducing the temperature regime of a reference period (usually the past few decades). Once model output is verified, GCMs can produce a snapshot of a projected future equilibrium climate using the time-dependent transient response of the climate system to selected input variables. GCMs have been used successfully to simulate future equi- librium surface air temperatures following increases in anthropogenic CO 2. Models based primarily on CO 2 scenarios, however, do not necessarily reflect actual global response because a time lag occurs between greenhouse gas emission rates and climate change (Kane et al., 1992). In addition, GCM output using modern and projected CO 2 scenarios has not been consistent (Robock et al., 1993). These incon- sistencies may in part reflect the general absence of modelling natural sources of variability such as vol- canic gas emissions, smoke, and wind blown dust (Ghan, 1992; Robock et al., 1993). They may also reflect uncertainty because of an inherent sensitivity to initial conditions and the coarse spatial resolution of the model.
N e v e r t h e l e s s , p r e d i c t i o n s o f g l o b a l warming/cooling made from GCMs have raised awareness of potential problems facing humankind. For initiatives designed to mitigate climate change effects over a particular region to be successful, local climatic variables must also be evaluated. At present, these local variables, which often deviate from the global pattern, are not represented in GCMs (Kane et al., 1992; Robock et al., 1993). This fact, along with the need for improved resolution, led to the develop- ment of the RCM for the Hanford Site.
2.2.2. The Hanford regional climate model The Hanford regional climate model (RCM) con-
sists a set of two predictive climate response equa- tions relating long-term (order of decades) interac- tions between the fundamental climatic variables of precipitation, temperature, and wind speed on and
near the Hanford Site, Washington. Results from the RCM can be evaluated further using eolian-climatic threshold equations (Gaylord and Stetler, 1994), maps of eolian susceptibility, and mobility plots (Stetler, 1993) to better characterize surface responses to changing climatic conditions.
The equations for climate response characterize the long-term relations between yearly averaged pre- cipitation and wind speed:
y = - 0 . 3 1 ( x ) + 0.43 r 2 = 0.99 (1)
and yearly averaged precipitation and temperature:
y = - 0 . 1 9 ( x ) - 0.06 r 2 = 0.99 (2)
where x---% change in average precipitation for a given time interval from the 1948-1987 average of 16.6 cm yr -1, and y = % change in wind speed (1) and temperature (2) for a given time interval from the 1948-1987 averages of 3.4 m s 1 and 11.67°C, respectively.
These simple equations permit estimation of vari- ations in average wind speed and temperature at Hanford by using interannual variations in precipita- tion of up to _+ 30% of the long-term average. For example, average annual precipitation from 1975 to 1980 was 16.4 cm, or 1.2% below the reference period average. Substituting - 1.2 (as x) into Eqs. 1 and 2 yields a wind speed of + 0.06% and a temper- ature of +0.3% from the 1948-1987 average. Ac- tual average annual wind speed and temperature values for the test interval (from Hanford climatic data) were 3.5 m s-~ and 11.3°C, respectively. Both actual values are within 3.5% of predicted wind speed and temperature using Eqs. 1 and 2. Compar- isons of parameters from other recent time intervals confirmed the accuracy of the Hanford RCM in reproducing the current climate.
Results from the Hanford RCM can be used also as a predictive tool for assessing eolian-climatic interactions. Estimating climatic conditions under which the volume of unvegetated dune sand will either increase or decrease in the future are possible by using RCM output with eolian-climatic threshold equations (Gaylord and Stetler, 1994). The RCM is also an integral part of assessing changes (both past and future) in eolian susceptibility and mobility that are caused by subtle shifts in climate (Stetler, 1993; this paper). Ultimately, we anticipate that the type of
L.D. Stetler, D.R. Gaylord/ Geomorphology 17 (1996) 99-113 105
model developed for Hanford can also be used suc- cessfully elsewhere to generate climate response sce- narios based on regional climatic trends. Such results should be beneficial to extrapolations currently ob- tained using GCMs.
3. Modelling eolian processes
3.1. Introduction
Eolian processes on the Hanford Site are illus- trated using: (1) su~,;ceptibility maps derived from GIS analysis of elevation, soil type, sediment tex- tures, and particle entrainment thresholds; and (2) sand dune mobility plots constructed using wind speed, precipitation, and potential evapotranspiration (PET) data. Vegetative effects are inherent compo- nents in the model and are reflected by changes in the total volume of active dune sand and through mobility indices (Stealer, 1993).
In the following sections we briefly describe the remaining variables uLsed to build the model. A more comprehensive description of the Hanford moisture distribution, PET model, airflow-terrain effects, and sediment entrainment theory is given by Stetler (1993).
3.2. Eolian susceptibility
Eolian susceptibility is defined as a measure of the inherent eolian transportability for a given grain size but does not imply an actual rate of transport. In this sense, it is unaffected by moisture and vegeta- tion and is a quantil:ative parameter describing the interactions of impac~E threshold velocity and average grain size. Thus defiaed, eolian susceptibility varies temporally and/or spatially to seasonal changes in wind speed and to changes in average grain size, d, of the sediment. Stetler (1993) calculated impact threshold velocities for a height of 9 m (height of Hanford Meteorological Monitoring Network anemometers) using two impact threshold equations:
(Zingg, 1953):
Ut(9m ) = C log y + u' (3) Y
E
8 " 0 0 .g: w
e- l -
800
7OO
800
5O0
400
3OO
200
100
0
0.0
J
0.1 0.2 0.3 0.4 0.5
Grain Diameter, mm
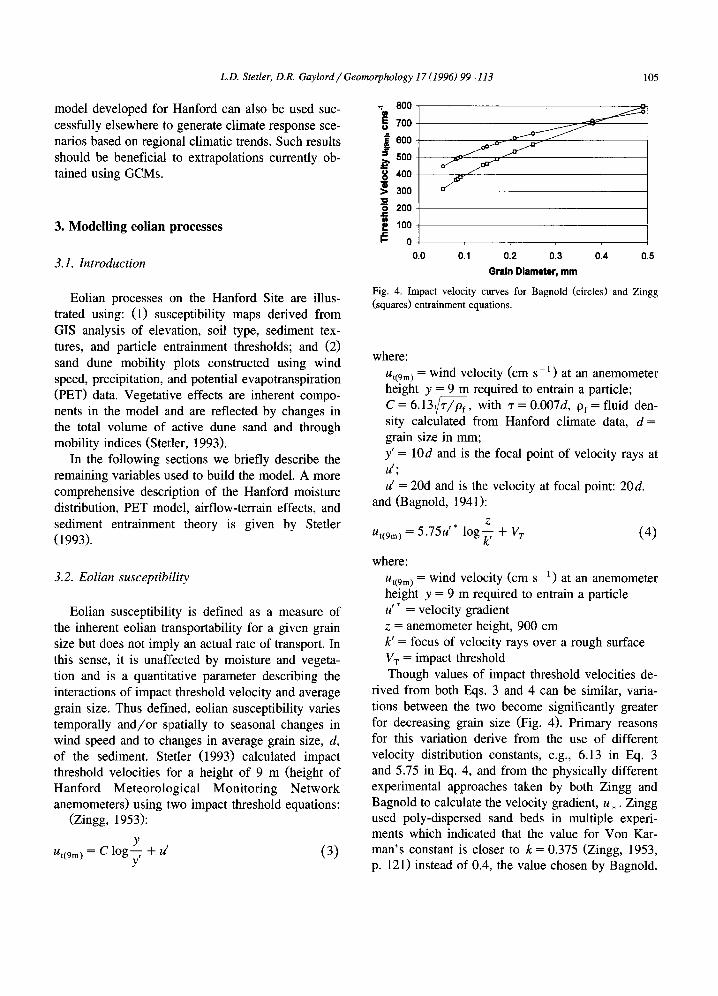
Fig. 4. Impact velocity curves for Bagnold (circles) and Zingg (squares) entrainment equations.
where: Ut(9m ) = wind velocity (cm s -~ ) at an anemometer height y = 9 m required to entrain a particle; C = 6.13 z / f ~ f , with r = 0.007d, Of = fluid den- sity calculated from Hanford climate data, d = grain size in mm; y' = 10d and is the focal point of velocity rays at U p ;
u' = 20d and is the velocity at focal point: 20d. and (Bagnold, 1941):
Z Ut(9m ) = 5.75U'* 1og~" 7 + V r (4)
where: Ut(9m ) = wind velocity (cm s -1) at an anemometer height y = 9 m required to entrain a particle u'* = velocity gradient z = anemometer height, 900 cm k' = focus of velocity rays over a rough surface Vx = impact threshold Though values of impact threshold velocities de-
rived from both Eqs. 3 and 4 can be similar, varia- tions between the two become significantly greater for decreasing grain size (Fig. 4). Primary reasons for this variation derive from the use of different velocity distribution constants, e.g., 6.13 in Eq. 3 and 5.75 in Eq. 4, and from the physically different experimental approaches taken by both Zingg and Bagnold to calculate the velocity gradient, u , . Zingg used poly-dispersed sand beds in multiple experi- ments which indicated that the value for Von Kar- man's constant is closer to k = 0.375 (Zingg, 1953, p. 121) instead of 0.4, the value chosen by Bagnold.
106 L.D. Stetler, D.R. Gaylord/ Geomorphology 17 (1996) 99-113
YAKB HMS
EOCC
200E
ARMY WYEB
WNP2
Scale ~ ~.. / 300A
Km
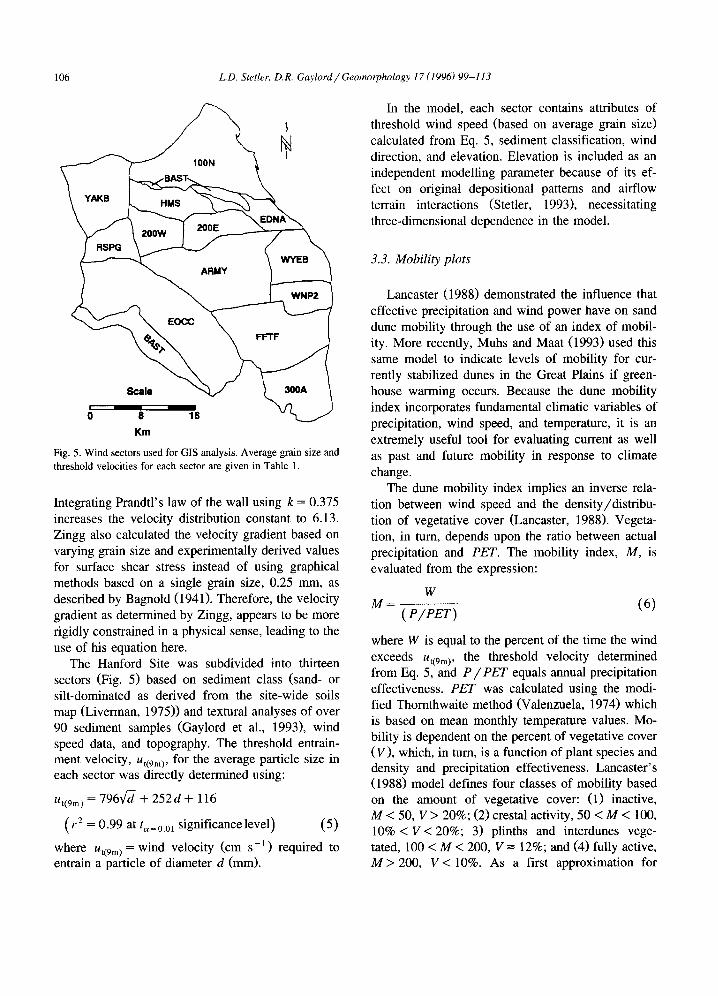
Fig. 5. Wind sectors used for GIS analysis. Average grain size and threshold velocities for each sector are given in Table 1.
Integrating Prandtl's law of the wall using k = 0.375 increases the velocity distribution constant to 6.13. Zingg also calculated the velocity gradient based on varying grain size and experimentally derived values for surface shear stress instead of using graphical methods based on a single grain size, 0.25 mm, as described by Bagnold (1941). Therefore, the velocity gradient as determined by Zingg, appears to be more rigidly constrained in a physical sense, leading to the use of his equation here.
The Hanford Site was subdivided into thirteen sectors (Fig. 5) based on sediment class (sand- or silt-dominated as derived from the site-wide soils map (Liverman, 1975)) and textural analyses of over 90 sediment samples (Gaylord et al., 1993), wind speed data, and topography. The threshold entrain- ment velocity, /gt(9m), for the average particle size in each sector was directly determined using:
ut~9m ) = 796fd- + 2 5 2 d + 116
( r 2 = 0.99 at t,= 0.Ol significance level) (5)
wh ere ut(9m ) = wind velocity (cm s -1) required to entrain a particle of diameter d (mm).
In the model, each sector contains attributes of threshold wind speed (based on average grain size) calculated from Eq. 5, sediment classification, wind direction, and elevation. Elevation is included as an independent modelling parameter because of its ef- fect on original depositional patterns and airflow terrain interactions (Stetler, 1993), necessitating three-dimensional dependence in the model.
3.3. Mobility plots
Lancaster (1988) demonstrated the influence that effective precipitation and wind power have on sand dune mobility through the use of an index of mobil- ity. More recently, Muhs and Maat (1993) used this same model to indicate levels of mobility for cur- rently stabilized dunes in the Great Plains if green- house warming occurs. Because the dune mobility index incorporates fundamental climatic variables of precipitation, wind speed, and temperature, it is an extremely useful tool for evaluating current as well as past and future mobility in response to climate change.
The dune mobility index implies an inverse rela- tion between wind speed and the density/distribu- tion of vegetative cover (Lancaster, 1988). Vegeta- tion, in turn, depends upon the ratio between actual precipitation and PET. The mobility index, M, is evaluated from the expression:
W M (6)
(P/PET)
where W is equal to the percent of the time the wind exceeds ut(9m), the threshold velocity determined from Eq. 5, and P/PET equals annual precipitation effectiveness. PET was calculated using the modi- fied Thornthwaite method (Valenzuela, 1974) which is based on mean monthly temperature values. Mo- bility is dependent on the percent of vegetative cover (V), which, in turn, is a function of plant species and density and precipitation effectiveness. Lancaster's (1988) model defines four classes of mobility based on the amount of vegetative cover: (1) inactive, M < 50, V > 20%; (2) crestal activity, 50 < M < 100, 10% < V< 20%; 3) plinths and interdunes vege- tated, 100 < M < 200, V = 12%; and (4) fully active, M > 200, V< 10%. As a first approximation for
L.D. Stetler, D.R. Gaylord/ Geomorphology 17 (1996) 99-113 107
Hanford, we have adopted Lancaster's critical values of mobility (50, 100, and 200) because we lack a detailed knowledge of vegetation-climate relations for the plant species populating the active sand dunes.
4. Results
4.1. Susceptibility maps
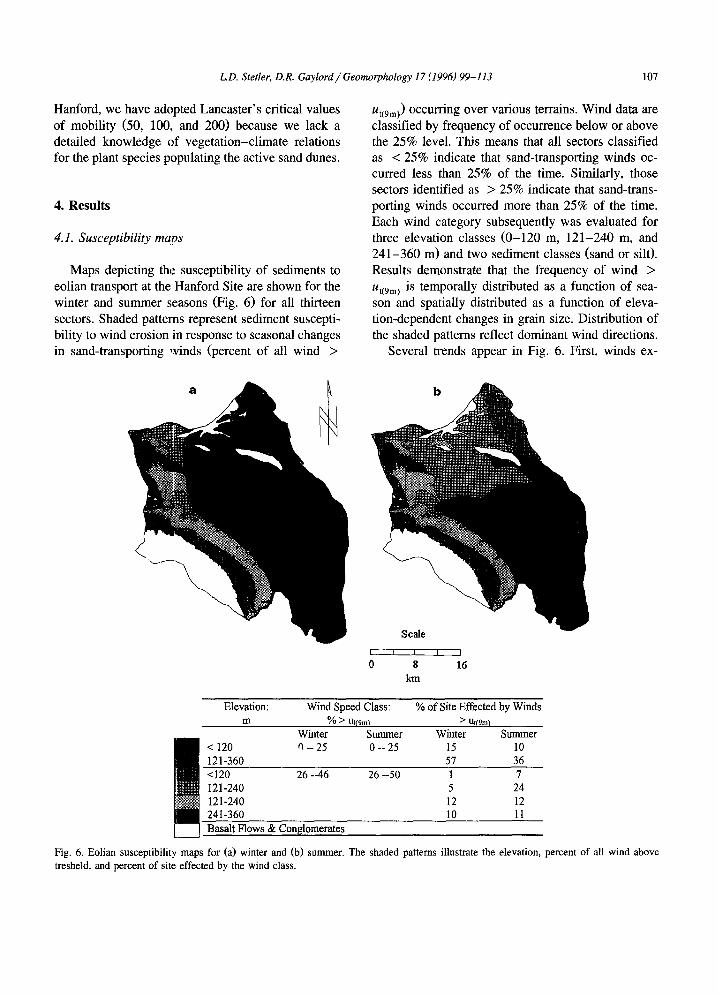
Maps depicting the susceptibility of sediments to eolian transport at the Hanford Site are shown for the winter and summer seasons (Fig. 6) for all thirteen sectors. Shaded patterns represent sediment suscepti- bility to wind erosion in response to seasonal changes in sand-transporting winds (percent of all wind >
Ut(9m)) occurring over various terrains. Wind data are classified by frequency of occurrence below or above the 25% level. This means that all sectors classified as < 25% indicate that sand-transporting winds oc- curred less than 25% of the time. Similarly, those sectors identified as > 25% indicate that sand-trans- porting winds occurred more than 25% of the time. Each wind category subsequently was evaluated for three elevation classes (0 -120 m, 121-240 m, and 241-360 m) and two sediment classes (sand or silt). Results demonstrate that the frequency of wind > Ut(9m ) is temporally distributed as a function of sea- son and spatially distributed as a function of eleva- tion-dependent changes in grain size. Distribution of the shaded patterns reflect dominant wind directions.
Several trends appear in Fig. 6. First, winds ex-
~ c ~ e
i i i i i
0 8 16 kin
Elevation: Wind Speed Class:
m % > ut(9m) > ut(9m) Winter Sununer Winter Summer
< 120 q -- 25 0 -- 25 15 10
121-360 57 36
% of Site Effected by Winds
Basalt Flows & Conglomerates
Fig. 6. Eolian susceptibility maps for (a) winter and (b) summer. The shaded patterns illustrate the elevation, percent of all wind above tresheld, and percent of site effected by the wind class.
<120 26--46 26--50 1 7 121-240 5 24 121-240 12 12 241-360 10 11
108 L.D. Stetler, D.R. Gaylord / Geomorphology 17 (1996) 99-113
ceeding Uff9m) are less likely to occur during winter (Fig. 6a) than summer (Fig. 6b). During the summer season, 26% of the total wind exceeds btt(9m ). Of this amount, 54% of the site experiences these winds > 25% of the time. Conversely, during winter, only 17% of the total wind exceeds Ut(9m ) and 28% of the site experiences effective sand transporting winds > 25% of the time.
Second, the airflow patterns show that the fre- quency of effective sand-transporting winds decrease from SW to NE during the winter (Fig. 6a) and from NW to SE during the summer (Fig. 6). For example, summer sand-transporting winds in the NW comer of the site mainly occur between 26 to 50% of the time and decrease to < 25% in the downwind direc- tion. This decrease in wind power results primarily from flow-deceleration as air-masses descending from higher elevations diffuse across the wide, flat floor of the site. Low elevation ( < 120 m) surfaces west of the Columbia River experience the lowest percentage of effective sand-transporting wind. Win- ter wind patterns across the site show a similar decrease in the frequency of winds > Ut(9rn) but flow from SW to NE.
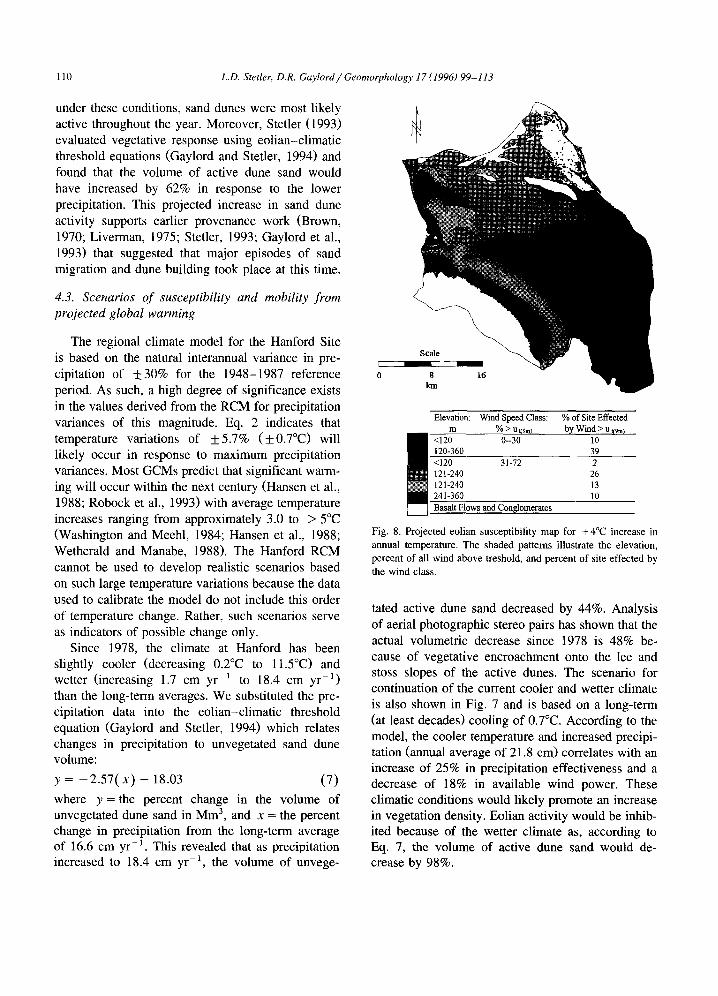
Finally, eolian susceptibility is directly correlated to the site-wide distribution in surface sediment which was deposited primarily as a result of fluvial pro- cesses (Stetler, 1993). At the close of the last glacial period ( ~ 18-12 ka), catastrophic floods originating from collapses of ice dams in northern Idaho and northwest Montana inundated the Hanford area where waters ponded for several weeks (Brown, 1960; Liv- erman, 1975; Waitt, 1985). Gravel and sand were deposited at low elevations across the basin floor. Fine-grained silts carried in slack waters were de- posited on high elevation slopes and in peripheral canyons, generally above 240 m. As a result, sandy soils cover over 78% of the Site at elevations below 240 m, and silt comprises at least 95% of all sedi- ment above 240 m. Fig. 4 illustrates the relation between decreasing impact velocities and decreasing particle size. The smallest diameter particles are located above 240 m in sectors EOCC, RSPG, and YAKB, where entrainment impact velocities average
280 cm s -1 less than sectors characterized by larger grain sizes, such as WYEB and WNP2 (Table 1). Eolian susceptibility, therefore, is lowest in the sandy soils and highest in the silts that occur above
Table 1 Seasonal and yearly average impact threshold velocities (Ut(9m)) for each sector determined by Eq. 3 (sectors are identified in Fig. 5; data are used to produce susceptibility maps; Fig. 6)
Sector Average grain Entrainment velocities (cm s - l )
diameter (mm) winter summer yearly average
WYEB 0.25 568 583 576 WNP2 0.38 693 709 701 FFrF 0.49 790 806 798 300A 0.21 526 541 533 ARMY 0.17 482 496 489 HMS 0.14 445 458 451 200W 0.14 445 458 451 EDNA 0.25 568 583 576 200E 0.15 455 469 462 100N 0.09 364 377 370 EOCC 0.09 374 387 380 RSPG 0.05 305 316 311 YAKB 0.08 359 372 365 Mean 0.19 490 504 497
240 m, particularly along the steep NE-facing slope of Rattlesnake Mountain where the highest percent- age of wind > ut(9m ~ occurs in both summer and winter. In summer, this correlation becomes visual when frequent dust clouds emanate from the high elevation sectors (EOCC, RSPG, and YAKB)--even on days characterized by moderate wind speeds ( 3-4 m s- l ) .
4.2. Sand dune mobility
The following discussion is focused on modem sand dune activity (1948-1987) and on the most active post-glacial episode of dune activity (8-5.4 ka). Modern conditions of sand dune mobility were assessed using Hanford Site climatic data. The time interval of 8-5.4 ka was chosen because previous research has indicated that this was the warmest and driest time period since the last glacial (Chatters, 1990). Climatic conditions were predicted using the Hanford RCM.
Building eolian dunes at Hanford most likely began during the late Pleistocene (Brown, 1960), increased in intensity sometime after 10 ka (Brown, 1970), and continued until the onset of wide-spread vegetative stabilization (before ~ 4.4 ka, Smith, 1992). By 2.5 ka, a cooler climate prevailed and precipitation increased to near-modern levels
L.D. Stetler, D.R. Gaylord / Geomorphology 17 (1996) 99-113 109
50
40
30
20
10
0
0.0
• 100
° / .
0.1 0.2 0.3 0.4
PIPET
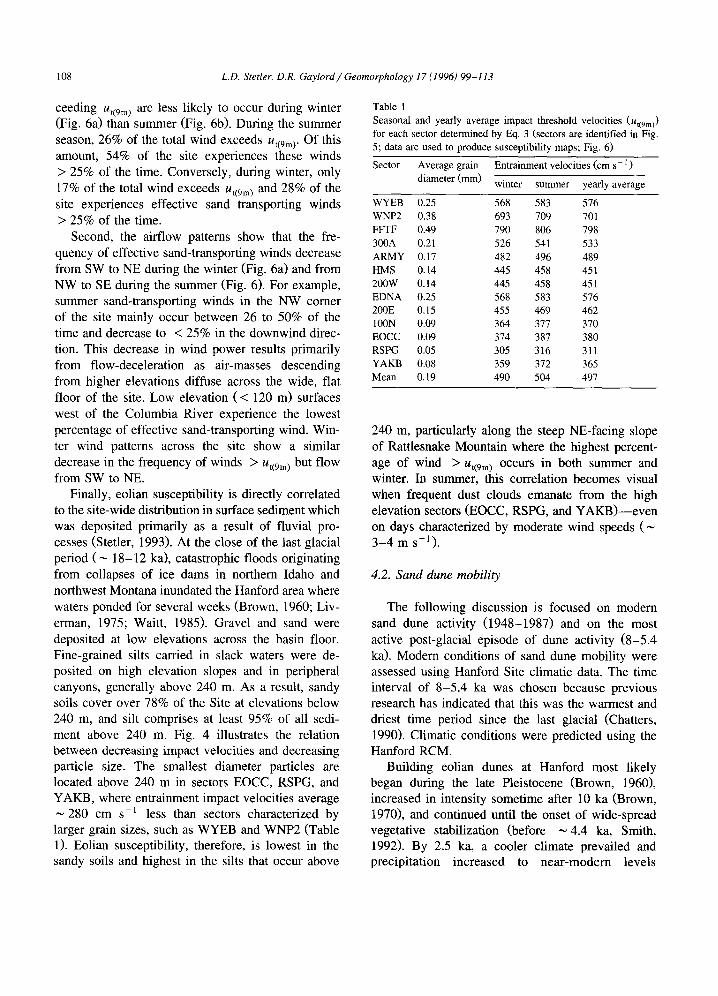
Fig. 7. Sand dune mobility at Hanford for the modem climate ( • ) and for projected precipitation variances of - 3 0 % (O) and +30% (O) below and above modem levels, respectively. Also shown are projected sand dune mobilities in response to a + 4°C (©) and a + 2°C (O) increase in annual temperature.
(Chatters, 1990) promoting soil development and more extensive site-wide vegetative growth. For the past 2.5 ka, dune activity has diminished even fur- ther as stabilizing vegetation has encroached onto the last remnants of actively migrating dunes (Smith, 1992; Gaylord and Stetler, 1994).
1948-1987. Sand dune mobility for the period 1948-1987 is showrL in Fig. 7. During this time period, vegetation across the dunes changed notice- ably in response to long-term ( ~ 15 years) climate changes (Gaylord and Stetler, 1994). These changes in vegetation density are the controlling factor affect- ing the total volume of unvegetated dune sand and are driven by: (1) rapid increases in vegetative cover corresponding to either a few years increased pre- cipitation, and/or (2) differential rates in decomposi- tion of dead vegetation and root mass--which lag behind decreases in precipitation by about 5 years (Liverman, 1975).
Long-term climate changes produce the most last- ing effects on sand dunes and can be observed as changes in dune morphology and migration rates. At Hanford, the active dune field interior is composed primarily of transverse-barchanoid ridge and parabolic dunes that either are surrounded by or are being transformed :into more stabilized forms (Gaylord and Stetler, 1994). Measured migration rates for transverse-barchanoid ridge and parabolic dunes range from 1.4 to 2.4 m yr-1 and average 1.8
m yr -1 Vegetatively influenced dunes are most active at the centers and crests because stabilizing vegetation anchors the upwind limbs. Migration rates for these dunes range from < 0.5 to 2.0 m yr-1 and average 1.0 m yr -1 (Gaylord et al., 1993; Gaylord and Stetler, 1994).
8-5.4 ka. Estimates of ancient dune mobility at Hanford are based on paleoclimatic data from Chat- ters (1990). His pollen and tree-line studies indicate that during the Altithermal interval (8-5.4 ka), the regional climate, i.e., the entire Columbia Plateau, was characterized by precipitation levels that were at least 30% below modem values. Sand dunes on the site likely experienced a peak in activity in response to the warmer and drier climate where both precipita- tion and spring-wanning occurred earlier in the year than at present (Chatters, 1990).
Reconstruction of projected dune mobility follow- ing a 30% decrease in precipitation was accom- plished by incorporating Chatter's precipitation data into the RCM from which new temperature and wind regimes were estimated using Eqs. 1 and 2. By varying precipitation and temperature to include the earlier spring moisture and warming, we estimated precipitation effectiveness levels by calculating new PET values. The wind regime was determined by multiplying the current monthly average wind speed by +9.8% (derived from Eq. 1) and calculating available sand-moving wind power from Eq. 3. This resulted in an increase in W of 16% annually. Over- all, we have estimated that the Hanford Altithermal climate was characterized by an average precipita- tion of 11.6 cm yr-1, an average wind speed at 9.0 m of 380 cm s- 1, and an average annual temperature of 12.4°C. Hansen et al. (1988) presented data from the GISS model that indicated the average tempera- ture during the Altithermal increased by 0.5 to 1.0°C above modem conditions. Eq. 2 of our model reveals a temperature increase for this time interval of 0.7°C.
The projected response in sand dune mobility from the more arid conditions during the Altithermal is also shown in Fig. 7. Modelling a 30% decrease in precipitation and a 5.7% increase in temperature resulted in a projected PET for the Altithermal of > 120 cm yr -1, twice the modem level. Such a PET would have had led to a decrease of nearly 50% in the average precipitation effectiveness (0.18 to 0.1) and to diminished vegetative cover. We believe that
110 L.D. Stetler, D.R. Gaylord / Geomorphology 17 (1996) 99-113
under these conditions, sand dunes were most likely active throughout the year. Moreover, Stetler (1993) evaluated vegetative response using eolian-climatic threshold equations (Gaylord and Stetler, 1994) and found that the volume of active dune sand would have increased by 62% in response to the lower precipitation. This projected increase in sand dune activity supports earlier provenance work (Brown, 1970; Liverman, 1975; Stetler, 1993; Gaylord et al., 1993) that suggested that major episodes of sand migration and dune building took place at this time.
4.3. Scenarios of susceptibility and mobility from projected global warming
The regional climate model for the Hanford Site is based on the natural interannual variance in pre- cipitation of +30% for the 1948-1987 reference period. As such, a high degree of significance exists in the values derived from the RCM for precipitation variances of this magnitude. Eq. 2 indicates that temperature variations of _+5.7% (_+0.7°C) will likely occur in response to maximum precipitation variances. Most GCMs predict that significant warm- ing will occur within the next century (Hansen et al., 1988; Robock et al., 1993) with average temperature increases ranging from approximately 3.0 to > 5°C (Washington and Meehl, 1984; Hansen et al., 1988; Wetherald and Manabe, 1988). The Hanford RCM cannot be used to develop realistic scenarios based on such large temperature variations because the data used to calibrate the model do not include this order of temperature change. Rather, such scenarios serve as indicators of possible change only.
Since 1978, the climate at Hanford has been slightly cooler (decreasing 0.2°C to 11.5°C) and wetter (increasing 1.7 cm yr 1 to 18.4 cm yr -1) than the long-term averages. We substituted the pre- cipitation data into the eolian-climatic threshold equation (Gaylord and Stetler, 1994) which relates changes in precipitation to unvegetated sand dune volume:
y = - 2 . 5 7 ( x ) - 18.03 (7)
where y = the percent change in the volume of unvegetated dune sand in Mm 3, and x = the percent change in precipitation from the long-term average of 16.6 cm yr -1 . This revealed that as precipitation increased to 18.4 cm yr ~, the volume of unvege-
Elevation: Wind SpeedClass: %ofSite Effected m %> u~gm~ by Wmd > u~9~
<120 0--30 I0 120-360 39 <120 31-72 2 121-240 26 121-240 13 241-360 10 Basalt Flows and Conglomerates
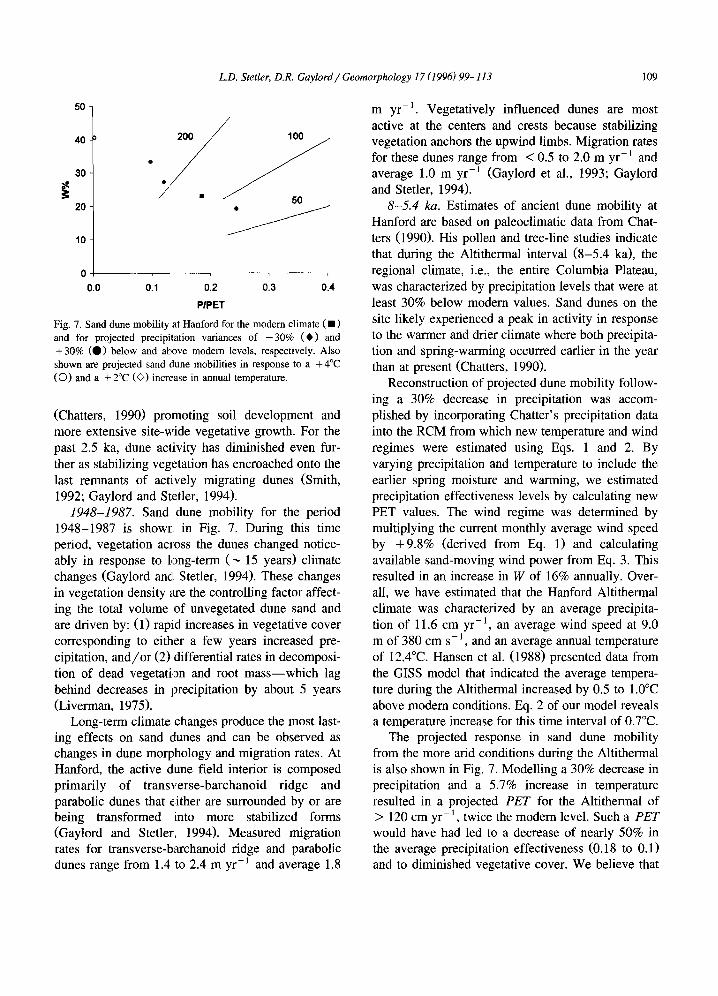
Fig. 8. Projected eolian susceptibility map for + 4°C increase in annual temperature. The shaded patterns illustrate the elevation, percent of all wind above treshold, and percent of site effected by the wind class.
tated active dune sand decreased by 44%. Analysis of aerial photographic stereo pairs has shown that the actual volumetric decrease since 1978 is 48% be- cause of vegetative encroachment onto the lee and stoss slopes of the active dunes. The scenario for continuation of the current cooler and wetter climate is also shown in Fig. 7 and is based on a long-term (at least decades) cooling of 0.7°C. According to the model, the cooler temperature and increased precipi- tation (annual average of 21.8 cm) correlates with an increase of 25% in precipitation effectiveness and a decrease of 18% in available wind power. These climatic conditions would likely promote an increase in vegetation density. Eolian activity would be inhib- ited because of the wetter climate as, according to Eq. 7, the volume of active dune sand would de- crease by 98%.
L.D. Stetler, D.R. Gaylord / Geomorphology 17 (1996) 99-113 111
We also include mobility (Fig. 7, open circle) and susceptibility (Fig. 8) scenarios for a + 4°C tempera- ture rise, which is the projected GCM average for global warming. The,;e scenarios, however, are lim- ited by the structure of the model and are to be used as indicators of probable magnitudes of change only. Not surprisingly, this level of warming would in- crease sand-moving wind power by 43% and virtu- ally eliminate precipitation. This scenario suggests a constant state of dune activity and mobility. In such a climate, vegetation would cease to be a factor and unvegetated (active) sand dune volume would in- crease by 450%. Susceptibility to eolian entrainment also increases (Fig. 8) and over 50% of the site would experience sand-moving wind between 30 and 72% of the time. In the absence of vegetation, however, potential for wind erosion would probably exist as long as the winds exceeded the threshold velocity. Finally, we present sand dune mobility for a + 2°C wanning as shown also in Fig. 7 (open diamond). The large difference in mobility between the +2°C and +4°C scenarios results from the projected precipitation falling virtually to zero for the latter case. It becomes apparent that vegetative cover is a critical factor governing sand dune mobil- ity and these scenarios illustrate its sensitivity to long-term variations in precipitation and temperature.
5. Conclusions
Analyses of long-term (1948-1987) climate data at the Hanford Site, Washington led to development of a regional climate model (RCM) which has poten- tial as a useful method[ for assessing eolian responses to regional climate ch~rnge. The RCM consists of two climate-response equ~ttions that relate fundamental climatic variables of precipitation, temperature, and wind speed. The model is calibrated for natural interannual variances of ___30% in precipitation. Model output provides a foundation upon which both past and future eolian-climatic interactions can be assessed.
Findings presented in this paper demonstrate that eolian susceptibility, defined by impact threshold velocity, depends on l:emporal shifts in wind direc- tion and spatial changes in soil texture. Prevailing NW summer winds are effective sand-movers 26%
of the time. Eolian susceptibility is greatest at eleva- tions above 240 m where the sediment is finer-grained than at lower elevations because impact velocities are lowest for these sediments. During winter, effec- tive sand-moving winds, occurring 17% of the time, are primarily from the SW, and contain the highest wind gusts of the year. Eolian susceptibility across the site is lowest during this time because of topo- graphic shielding.
Studies of sand dune mobility and unvegetated dune volume at Hanford suggest the area is close to the eolian-climatic threshold. Mobility since 1977, however, has decreased in response to increased precipitation. Active sand dunes that were, prior to 1977, generally transverse and barchanoid in charac- ter have become more parabolic in form as vegeta- tive cover has expanded. Continuation of 1977-1987 precipitation trends could lead to the elimination of active sand dunes at the site. In contrast, RCM-based projections of dune mobility during the Altithermal interval indicate that a reduction of 50% in effective precipitation likely triggered an increase in active dune volume of 62%. Global wanning scenarios from GCMs indicate temperature increases more than 5 times above Altithermal warming are possible. Under these climatic conditions, the RCM projects potential increases in sand dune mobility of over 400%.
The techniques developed and used in this paper still are being refined. Nevertheless, they illustrate the potential utility of a well-tested RCM to eolian- climatic studies. Such RCMs will complement global-scale predictions from GCMs and allow eval- uations of potential widespread eolian mobility in sensitive arid and semi-add lands.
Acknowledgements
Research presented in this paper was conducted as part of the senior author's doctoral dissertation in the Department of Geology, Washington State Univer- sity. Financial support for the work was provided in part by the Northwest College and University Asso- ciation for Science grant DE-FG06-89ER-75522. Yearly climate records for Hanford were provided by Dana Hoitink. Insights into possible vegetative re- sponses to varying climates were provided by H.
112 L.D. Stetler, D.R. Gaylord / Geomorphology 17 (1996) 99-113
Brad Musick and is gratefully acknowledged. Signif- icant improvements to an early version of the manuscript were provided by D.R. Muhs and an anonymous reviewer and are greatly appreciated.
References
Ahlbrandt, T.S. Swinehart, J.B. and Maroney, D.G., 1983. The dynamic Holocene dune fields of the Great Plains and Rocky Mountain basins, U.S.A. In: M.E. Brookfield and T.S. Ahlbrandt (Editors), Eolian Sediments and Processes. Devel- opments in Sedimentology, 38, Elsevier, Amsterdam, pp. 379-406.
Antevs, E.V., 1948. The Great Basin, with emphasis on glacial and postglacial times. Univ. Utah Bull., 38: 168-191.
Bagnold, R.A., 1941. The Physics of Blown Sand and Desert Dunes. Methuen and Co., London, 265 pp.
Benedict, J.B., 1979. Getting away from it all: a study of man, mountains, and the two-drought Altithermal. 26th Annual Meeting, Plains Anthropological Association, Denver, Colo., 11 pp.
Brown, D.J., 1960. An eolian deposit beneath 200-west area. General Electric Co. Report, RW-67549, 11 pp.
Brown, R.E., 1970. Interrelations of geological formations and processes affecting ecology as exposed at Rattlesnake Springs, Hanford Project. Arid Land Ecology Program Reprint Series No. 3, Pacific Northwest Laboratory Report BNWL-B-29, 39
Pp. Cadwell, L.L., 1991. Hanford Site protective barriers development
program. Fiscal year 1990 Highlights Pacific Northwest Labo- ratory, PNL-7831.
Chatters, J.C., 1990. Paleoecology and paleoclimates of the Columbia Basin region. Pacific Northwest Laboratory Report No. PNL-SA, 60 pp.
Forman, S.L., Goetz, A.F.H. and Yuhas, R.H., 1992. Large-scale stabilized dunes on the High Plains of Colorado: understand- ing the landscape response to Holocene climates with the aid of images from space. Geology, 20: 145-148.
Gaylord, D.R., 1982. Holocene paleoclimatic fluctuations revealed from dune and interdune strata in Wyoming. J. Arid Environ., 18: 123-138.
Gaylord, D.R., Stetler, L.D., Smith, G.D. and Marrs, R.W., 1993. Summary report of 1990 eolian characterization studies, Han- ford Site, Washington. Pacific Northwest Laboratory Report No. PNL-8862 UC-702, 109 pp.
Gaylord, D.R. and Stetler, L.D., 1994. Eolian-climatic thresholds and sand dunes at the Hanford Site, south-central Washington, USA. J. Arid Environ., 28: 95-116.
Ghan, S.J., 1992. The GCM credibility gap. Climate Change, 21: 345-346.
Hansen, J., Lacis, A., Rind, D., Russell, G., Stone, P., Fung, I., Ruedy, R. and Lerner, J., 1984. Climate sensitivity: analysis of feedback mechanisms. In: J. Hansen and T. Takahashi (Edi-
tors), Climate Processes and Climate Sensitivity. American Geophysical Union, Washington, D.C., pp. 130-163.
Hansen, J., Fung, I., Lacis, A., Rind, D., Lebedeff, S., Ruedy, R., Russell, G. and Stone, P., 1988. Global climate changes as forecast by Goddard Institute for Space Studies three-dimen- sional model. J. Geophys. Res., 93(D8): 9341-9364.
Joussaume, S., 1993. Paleoclimatic tracers: an investigation using an atmospheric general circulation model under ice age condi- tions, 1. Desert dust. J. Geophys. Res., 98(D2): 2767-2805.
Kane, S., Reilly, J. and Tobey, J., 1992. An empirical study of the economic effects of climate change on world agriculture. Climate Change, 21: 17-35.
Kasper, R.B. and Glantz, C.S., 1987. Preliminary estimate of potential sand transport and surface wind patterns at the U.S. Department of Energy's Hanford Site. Westinghouse Hanford Report WHC-EP-0058, 59 pp.
Lancaster, N., 1988. Development of linear dunes in the south- western Kalahari, southern Africa. J. Arid Environ., 14: 233- 244.
Lancaster, N., 1991. Reaction of eolian geomorphic systems to climatic change. Geological Society of America Annual Meet- ing, San Diego, Calif., October 21-24, Abstracts with Pro- grams, 23: 5, A283.
Ligotke, M.W. and Klopfer, D.C., 1990. Soil erosion rates from mixed soil and gravel surfaces in a wind tunnel. Pacific Northwest Laboratory, PNL-7435, UC-702, 108 pp.
Liverman, J.L., 1975. Final environmental statement, waste man- agement operations, Hartford Reservation, Richland, Washing- ton. ERDA-1538, 1 and 2, Energy Research and Development Administration, Washington, D.C.
Madole, R.F., 1994. Stratigraphic evidence of desertification in the west-central Great Plains within the past 1000 yr. Geology, 22(6): 481-486.
Muhs, D.R., 1991. The potential response of Great Plains eolian sands to greenhouse warming and precipitation reduction. Geological Society of America National Meeting, San Diego, Calif., Abstracts with Programs, 23: 5, A285.
Muhs, D.R. and Maat, P.B., 1993. The potential response of eolian sands to greenhouse warming and precipitation reduc- tion on the Great Plains of the U.S.A.J. Arid Environ., 25: 351-361.
Rickard, W.H., Rodgers, L.E., Vaughn, B.E. and Liebetran, S.F., 1988. Shrub-steppe: balance and change in a semi-arid terres- trial ecosystem. Developments in Agriculture and Manage- ment-Forest Ecology, 20, Elsevier, Amsterdam, 272 pp.
Rind, D., Goldberg, R., Hansen, J., Rosenzweig, C. and Ruedy, R., 1990. Potential evapotranspiration and the likelihood of future drought. J. Geophys. Res., 95(D7): 9983-10004.
Robock, A., Turco, R.P., Harwell, M.A., Ackerman, T.P., An- dressen, R., Chang, H. and Sivakumar, M.V.K., 1993. Use of general circulation model output in the creation of climate change scenarios for impact analysis. Climate Change, 23: 293-335.
Schlesinger, M.E. and Zhao, Zong-Ci, 1989. Seasonal climate changes induced by doubled CO 2 as simulated by the OSU atmospheric GCM/mixed-layer ocean model. J. Climate, 2: 459-495.
L.D. Stetler, D.R. Gaylord / Geomorphology 17 (1996) 99-113 113
Smith, G.D., 1992. Sedimentology, stratigraphy and geoarchaeol- ogy of the Tsulim site, on the Hanford Site, Washington. Unpubl. M.S. Thesis, Washington State University, 169 pp.
Stetler, L.D., 1993. Eolian dynamics and Holocene eolian sedi- mentation at the Hanford Site, Washington. unpub. Ph.D. Dissertation, Washingtcn State University, 181 pp.
Stone, W.A., Thorp, J.M., Gifford, O.P. and Hoitink, D.J., 1983. Climatological summaiy for the Hanford area. PNL-4622, UC-11.
Swinehart, J.B., 1991. Holocene eolian dune activity in the Ne- braska Sand Hills--more than skin deep. Geological Society of America National Meeting, San Diego, Calif., Abstracts with Programs, 23: 5, A284.
U.S. Department of Energy (DOE), 1986a. Environmental assess- ment: Reference reposil:ory location, Hanford Site, Washing- ton. DOE/RW-0070.
U.S. Department of Energy (DOE), 1986b. Draft environmental impact statement: disposal of Hanford defense high level, transuranic and tank wastes. DOE/EIS-0113.
U.S. Department of Energy (DOE), 1987a. Interim Hanford waste management plan. DOE/RL-87-13.
U.S. Department of Energy (DOE), 1987b. Final environmental
impact statement: disposal of Hanford defense high-level, transuranic, and tank waste. DOE/EIS-0113.
Valenzuela, A., 1974. The behavior of evapotranspiration and evaporation equations under varying climatic conditions. Un- publ. Ph.D. dissertation, Washington State University, 205 pp.
Waitt, R.B., 1985. Case for periodic, colossal jokulhaups from Pleistocene Lake Missoula. Geol. Soc. Am. Bull., 96: 1271- 1286.
Washington, W.M. and Meehl, G.A., 1984. Seasonal cycle experi- ment on the climate sensitivity due to a doubling of CO 2 with an atmospheric general circulation model coupled to a simple mixed-layer ocean model. J. Geophys. Res., 89: 9475-9503.
Wetherald, R.T. and Manabe, S., 1988. Cloud feedback processes in a general circulation model. J. Atmos. Sci., 45(8): 1397- 1415.
Wilson, C.A. and Mitchell, J.F.B., 1987. A 2XCO 2 climate sensitivity experiment with a global climate model including a simple ocean. J. Geophys. Res., 92: 13315-13343.
Zingg, A.W., 1953. Wind-tunnel studies of the movement of sedimentary material. Proc. 5th Hydraulics Conference, Iowa State University Studies Engineering Bulletin, 34:111-135.
Related Documents