Mar Biol (2009) 156:2107–2120 DOI 10.1007/s00227-009-1241-y 123 ORIGINAL PAPER Eutrophication and trophic structure in response to the presence of the eelgrass Zostera noltii Alexandra Baeta · Ivan Valiela · Francesca Rossi · Rute Pinto · Pierre Richard · Nathalie Niquil · João C. Marques Received: 8 August 2008 / Accepted: 17 June 2009 / Published online: 2 July 2009 © Springer-Verlag 2009 Abstract In estuaries, eelgrass meadows contribute to fundamental ecosystem functions of estuaries, providing food to several predators and buVering the negative eVects of eutrophication. We asked whether the presence of the eelgrass Zostera noltii decreased the nitrogen concentration in the overlying water, aVected the sources of nitrogen sequestrated by primary producers and changed the benthic and pelagic food web structures. We also studied the importance of these food webs in providing food to Wsh. We compared bare sediment to sediment covered by a Z. noltii meadow, and examined nutrient concentrations in the water column and 15 N in primary producers as indicators of anthropogenic inputs of nutrients. We then measured both 13 C and 15 N in the tissues of plants and consumers to establish food web structures. There were no diVerences in the concentrations and sources of nitrogen between sites. Rather, 15 N values indicated anthropogenic inputs of N (e.g. sewage discharges, agriculture) in both sites. There were no major diVerences in the structure of the planktonic food web, which was in part sustained by particulate organic matter and supported most predator Wsh, and in the structure of the benthic food web. Nonetheless, there were diVerences in the sources of food for omnivore consumers and for the detritivore Scrobicularia plana. Overall, the benthic food web did not use food derived from the eelgrass or macroalgae deposited on the substratum. Suspension feeders used particulate and sediment organic matter, whereas the 13 C and 15 N values of the other consumers indicated a likely contribution of benthic microalgae. Fur- thermore, in both habitats we found large variability in the isotope signatures of benthic macrofauna consumers, which did not allow distinguishing clearly diVerent trophic groups and indicated a high level of omnivory and a mixed diet opportunistically making use of the availability of food in the surroundings. Introduction Nutrient enrichment due to human activities may increase eutrophication of aquatic habitats and severely impact the identity and diversity of primary producers and consumers with consequent alterations in the food-web structure, eco- system productivity and nutrient recycling. Estuaries, which are critical habitats for nutrient recycling and ecosys- tem productivity, often receive large inputs of nutrients derived from human-activities and agricultural discharges, followed by severe eutrophication events (Valiela et al. 1997; Cloern 2001; Bode et al. 2006; Lotze et al. 2006). In these habitats, one of the most relevant aspects of eutrophi- cation is the proliferation of fast-growing macroalgae, which may replace slow-growing macrophytes and signiW- cantly decrease areal extent of seagrass meadows and the ecological value of the entire estuary (Short and Wyllie- Echeverria 1996; Howarth 1988; Bricker et al. 1999; Valiela 2006). Communicated by U. Sommer. A. Baeta (&) · F. Rossi · R. Pinto · J. C. Marques Department of Zoology, IMAR, Institute of Marine Research, University of Coimbra, 3004-517 Coimbra, Portugal e-mail: [email protected] I. Valiela The Ecosystems Center, Marine Biological Laboratory, Woods Hole, MA 02543, USA A. Baeta · P. Richard · N. Niquil Centre de Recherche sur les Ecosystèmes Littoraux Anthropisés, UMR6217, CNRS, IFREMER, Université de La Rochelle, Avenue Michel Crépeau, 17042 La Rochelle, France

Welcome message from author
This document is posted to help you gain knowledge. Please leave a comment to let me know what you think about it! Share it to your friends and learn new things together.
Transcript
Mar Biol (2009) 156:2107–2120
DOI 10.1007/s00227-009-1241-yORIGINAL PAPER
Eutrophication and trophic structure in response to the presence of the eelgrass Zostera noltii
Alexandra Baeta · Ivan Valiela · Francesca Rossi · Rute Pinto · Pierre Richard · Nathalie Niquil · João C. Marques
Received: 8 August 2008 / Accepted: 17 June 2009 / Published online: 2 July 2009© Springer-Verlag 2009
Abstract In estuaries, eelgrass meadows contribute tofundamental ecosystem functions of estuaries, providingfood to several predators and buVering the negative eVectsof eutrophication. We asked whether the presence of theeelgrass Zostera noltii decreased the nitrogen concentrationin the overlying water, aVected the sources of nitrogensequestrated by primary producers and changed the benthicand pelagic food web structures. We also studied theimportance of these food webs in providing food to Wsh.We compared bare sediment to sediment covered by aZ. noltii meadow, and examined nutrient concentrations inthe water column and �15N in primary producers as indicatorsof anthropogenic inputs of nutrients. We then measuredboth �13C and �15N in the tissues of plants and consumersto establish food web structures. There were no diVerencesin the concentrations and sources of nitrogen between sites.Rather, �15N values indicated anthropogenic inputs of N(e.g. sewage discharges, agriculture) in both sites. Therewere no major diVerences in the structure of the planktonicfood web, which was in part sustained by particulateorganic matter and supported most predator Wsh, and in the
structure of the benthic food web. Nonetheless, there werediVerences in the sources of food for omnivore consumersand for the detritivore Scrobicularia plana. Overall, thebenthic food web did not use food derived from the eelgrassor macroalgae deposited on the substratum. Suspensionfeeders used particulate and sediment organic matter,whereas the �13C and �15N values of the other consumersindicated a likely contribution of benthic microalgae. Fur-thermore, in both habitats we found large variability in theisotope signatures of benthic macrofauna consumers, whichdid not allow distinguishing clearly diVerent trophic groupsand indicated a high level of omnivory and a mixed dietopportunistically making use of the availability of food inthe surroundings.
Introduction
Nutrient enrichment due to human activities may increaseeutrophication of aquatic habitats and severely impact theidentity and diversity of primary producers and consumerswith consequent alterations in the food-web structure, eco-system productivity and nutrient recycling. Estuaries,which are critical habitats for nutrient recycling and ecosys-tem productivity, often receive large inputs of nutrientsderived from human-activities and agricultural discharges,followed by severe eutrophication events (Valiela et al.1997; Cloern 2001; Bode et al. 2006; Lotze et al. 2006). Inthese habitats, one of the most relevant aspects of eutrophi-cation is the proliferation of fast-growing macroalgae,which may replace slow-growing macrophytes and signiW-cantly decrease areal extent of seagrass meadows and theecological value of the entire estuary (Short and Wyllie-Echeverria 1996; Howarth 1988; Bricker et al. 1999;Valiela 2006).
Communicated by U. Sommer.
A. Baeta (&) · F. Rossi · R. Pinto · J. C. MarquesDepartment of Zoology, IMAR, Institute of Marine Research, University of Coimbra, 3004-517 Coimbra, Portugale-mail: [email protected]
I. ValielaThe Ecosystems Center, Marine Biological Laboratory, Woods Hole, MA 02543, USA
A. Baeta · P. Richard · N. NiquilCentre de Recherche sur les Ecosystèmes Littoraux Anthropisés, UMR6217, CNRS, IFREMER, Université de La Rochelle, Avenue Michel Crépeau, 17042 La Rochelle, France
123
2108 Mar Biol (2009) 156:2107–2120
In estuaries, seagrass meadows as compared to bare sed-iment may largely contribute to the estuarine functioning,by sustaining longer and more complex food webs, whichmay aVect ecosystem productivity and stability under envi-ronmental change. Seagrasses increase sedimentation ofWne sediment particles and thus enhance quantity and qual-ity of food for many macrofauna invertebrates, which arethe fundamental trophic link between basal resources andpredators such as Wsh and seabirds. Seagrass meadows alsorepresent a nursery for Wsh of economic value and a refugeefrom predators (Duarte 2002). Furthermore, seagrasses,particularly Z. noltii, may contribute to carbon and nutrientsequestration and storage for longer periods than macro-algae, thereby keeping the water overlying the meadow ofhigher quality that the water overlying bare sediment andmitigating eutrophication eVects (Cebrian 1999).
Natural abundance of stable isotopes (�13C and �15N) ofdetritus, primary producers and consumers are extensivelyused to assess trophic structure of communities (Tieszenet al. 1983; Peterson and Fry 1987; Kwak and Zedler 1997;McClelland et al. 1997; Riera et al. 2000; Abreu et al.2006; Bode et al. 2006). Carbon stable isotope data are typ-ically used in ecological research to determine which pri-mary producer components are the ultimate carbon sourceassimilated by higher trophic level consumers (Fry andSherr 1984; Peterson and Fry 1987). Consumers typicallyhave �13C values similar (generally within 1‰) to theirfood source (DeNiro and Epstein 1978; Wada et al. 1991),yielding slightly more enriched values. Nitrogen stable iso-topes are more often used to study trophic levels in commu-nities (Wada et al. 1991). Organisms tend to fractionatenitrogen positively by 3–4‰ (Wada et al. 1991; Post 2002)
at each trophic level. Thus, higher trophic levels will havehigher �15N values due to the discriminatory retention ofthe heavy isotope over the light one (Post 2002). Further-more, high levels of �15N in primary producers can be usedas an alternative method to establish the level of humaneutrophication since anthropogenic sources of nitrogen aregenerally enriched in the heavy isotope compared to naturalsources (Cole et al. 2006).
In this study, we investigated whether nitrogen concen-trations of the water column, sources of nitrogen for pri-mary producers, and trophic relationships between primaryproducers, consumers and predators of the benthic and thewater column food web diVered in a site where Z. noltii wasabundant and a site characterised by bare sediment.
Materials and methods
Study site
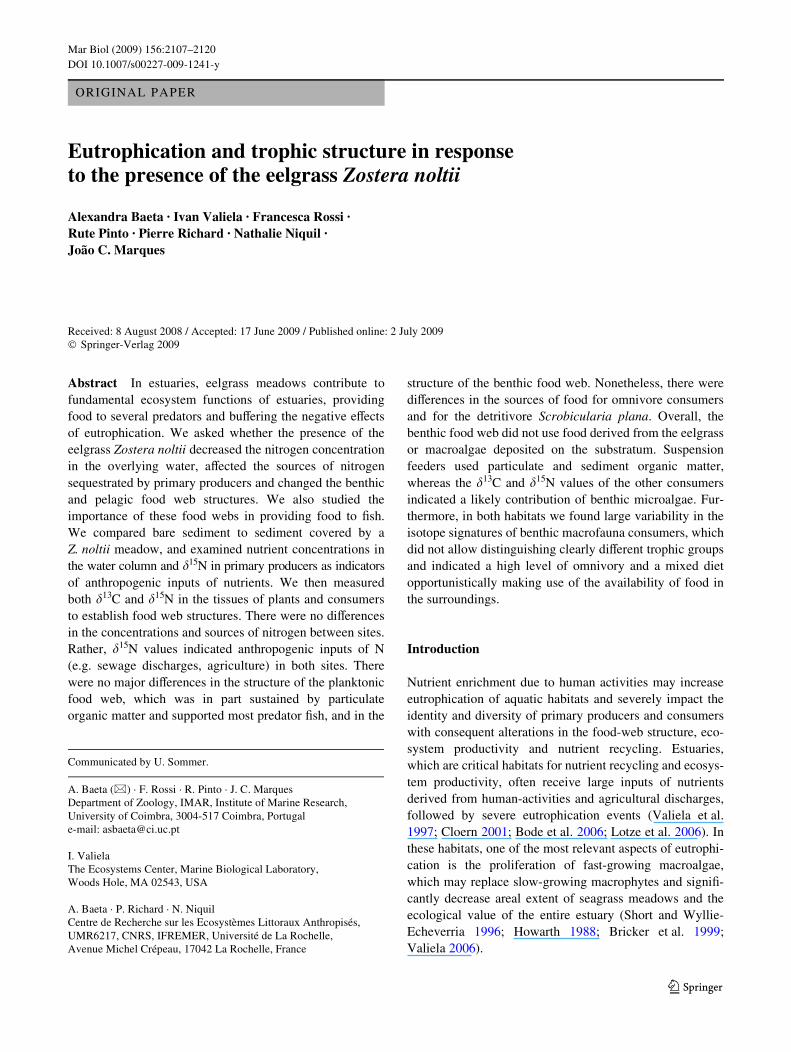
The Mondego estuary, on the western coast of Portugal is arelatively small (1,600 ha), warm-temperate, polyhaline,intertidal system located on the Atlantic coast of Portugal,consisting of two arms, north and south (Fig. 1). The south-ern arm is characterised by intertidal mudXats (almost 75%of the area) exposed during low tide. The tidal range variesbetween 0.35 and 3.3 m depending on the site and tidecoeYcient, while water residence time varies between2 (northern arm) and 3 days (southern arm).
In the early 1990s, the communication between the twoarms of the estuary became totally interrupted in theupstream area. The combined eVect of an increased water
Fig. 1 Mondego estuary map showing sampling sites: Zostera and bare sediment sites (grey circles). Change in the area covered by Zostera noltii in the south arm of the Mondego estuary. Mapping of benthic vegetation is based on Weld observations, aerial photographs and GIS methodology (Arc View GIS version 8.2)
123
Mar Biol (2009) 156:2107–2120 2109
residence time and of nutrient concentrations became majordriving forces behind the occurrence of seasonal Ulva spp.blooms and a concomitant severe reduction of the areaoccupied by Z. noltii beds, and also of Z. noltii biomass inthe areas where it still remained (Marques et al. 1997), as afunction of competition with macroalgae (Marques et al.2003). The shift in benthic primary producers has changedtrophic structure of benthos (Marques et al. 1997, 2003;Pardal et al. 2000, 2004; Cardoso et al. 2004, 2005; Patrícioand Marques 2006; Dolbeth et al. 2007).
Since 1998 the Z. noltii has been recovering and Ulva spp.blooms reducing (Lillebø et al. 2007), due to the decreasednutrient discharges from the river and the partial re-openingof the communication between the north and south arms(Neto 2004; Neto et al., submitted for publication).
Sample collection and preparation
To assess the relative nutrient enrichment at the two sites,we measured concentrations of nitrate (NO3
¡), ammonium(NH4
+), phosphate (PO43¡), and chlorophyll a in the water
column. We also compared the �15N in primary producerscollected in benthos and the bulk organic matter in the sedi-ment (sedimentary organic matter, SOM) and in the watercolumn (particulate organic matter, POM) between the twosites as a measure of the eutrophication level.
To examine and compare the food web structurebetween the two study sites, we measured �13C and �15N inprimary producers, bulk sediment and consumers. We sam-pled particulate organic matter (POM), sedimentary organicmatter (SOM), meiofauna, seagrass, macroalgae, macro-benthos and zooplankton at each of the two sites. Fish werecollected at the bare sediment site. Given their high mobil-ity, we retained collection in both sites irrelevant for thepurpose of this study. Samples for nutrient analyses andPOM were collected monthly from November 2005 to July2006. Plants and animals were collected in November2005, February, May and July 2006. At each site and sam-pling date, Wve samples were taken from an area of about4 £ 4 m and pooled before analyses. Samples taken at eachtime in each site are considered here as replicates sincethere were no temporal diVerences (Baeta et al. 2009).Water for nutrient concentration (700 ml) was Wlteredthrough a pre-combusted 0.45 �m pore size, 4.7-cm diame-ter glass Wbre Wlters (Whatman GFF Wlter). In addition,700 ml of water was passed through a Whatman GFF Wlterto measure Chl a concentration in the collected material(Parsons et al. 1985). All Wlters and water samples werestored on ice until arrival at the laboratory, when they weretransferred to the freezer (¡18°C). POM was obtained byWltering 0.5–1 l of seawater, from a depth of 0.5 m belowthe surface, onto pre-combusted (450°C, 4 h) WhatmanGFF Wlters with a low-pressure vacuum pump.
Sediment samples from the upper 1 cm were collectedwith an acrylic corer (31 mm of diameter). For the meio-fauna, sediment samples were collected, and the top 3 cmof each sediment core was then passed through 500 and 38 �msieves. Meiofauna were examined from the 38 �m fraction,and 50–300 individuals were collected for isotope analyses.Seagrass leaves and roots, and macroalgae were collectedby hand and gently cleaned of epiphytic material. Macro-invertebates were also taken manually from each site, andheld in Wltered seawater for 24 h to allow their guts to clear.
Zooplankton was collected at each site by towing aBongo net (0.5 m diameter, 200 �m mesh size) against thecurrent for 20 min. The zooplankton samples for isotopeanalysis were composites of 20–200 individuals. Resident(Atherina boyeri, Pomatoschistus microps, Pomatoschi-stus minutus, Syngnathus abaster, Syngnathus acus) andtransient (Dicentrarchus labrax, Diplodus vulgaris, Soleasolea) Wsh species were collected using a 2 m beam trawl,with a 5 mm stretched mesh size on the cod end. Thetrawls were carried out during the night at low-waterspring tides.
All samples were rinsed with Milli-Q water, beforefreeze-drying. Filters with POM were also rinsed with afew millilitres of ammonium formate to remove the saltsthat may damage the combustion columns of the IRMS ele-mental analyser. Despite ammonium formate may alter the�15N, no trace of ammonium formate is left in the Wlterbecause it sublimates when the Wlters are freeze-dried over-night (P. Richard, personal communication). When dry,samples were ground (Wlters with POM were kept whole)into homogenous powder using mortar and pestle,weighted, and loaded into tin capsules. For the macrofauna,we removed the shell from molluscs and skeleton fromcrustaceans. For the zooplankton, we analysed the entireanimals, given their small size. For Wsh, the muscle of thedorsal region was analysed.
Samples were analysed using an EA-IRMS (Isoprime,Micromass, UK). Isotopic values were expressed in the �unit notation as deviations from standards (Vienna Pee DeeBelemnite for �13C and N2 in air for �15N) following theformula: �13C or �15N = [(Rsample/Rstandard) ¡ 1] £ 103,where R is 13C/12C or 15N/14N. The precision of the mea-surement was 0.2‰ for both carbon and nitrogen.
Results
Eutrophication level
There were no signiWcant diVerences in NO3¡, NH4
+,PO4
3¡ and chlorophyll a concentrations, and in the totalnitrogen to phosphorus ration (DIN/PO4
3¡) between thetwo sites (Table 1).
123
2110 Mar Biol (2009) 156:2107–2120
Nitrate concentrations ranged from 0.06 to 0.96 mg L¡1
(Fig. 2). Concentrations of NH4+ and PO4
3¡ were usuallymuch lower than those of NO3
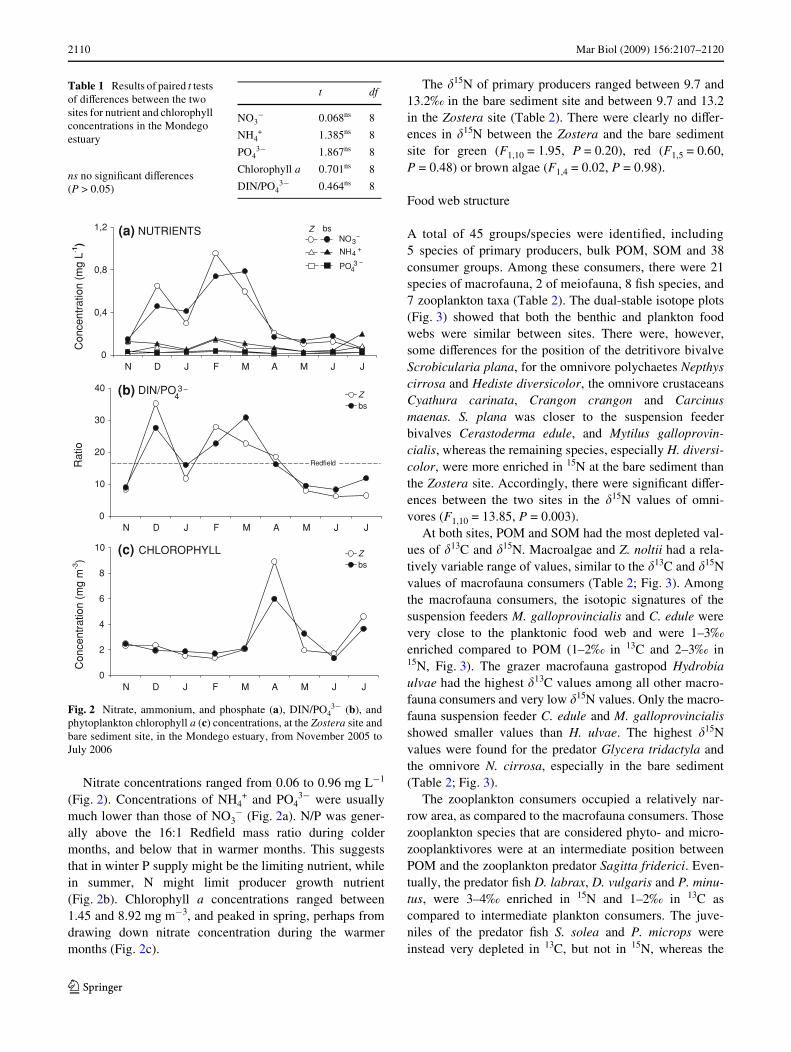
¡ (Fig. 2a). N/P was gener-ally above the 16:1 RedWeld mass ratio during coldermonths, and below that in warmer months. This suggeststhat in winter P supply might be the limiting nutrient, whilein summer, N might limit producer growth nutrient(Fig. 2b). Chlorophyll a concentrations ranged between1.45 and 8.92 mg m¡3, and peaked in spring, perhaps fromdrawing down nitrate concentration during the warmermonths (Fig. 2c).
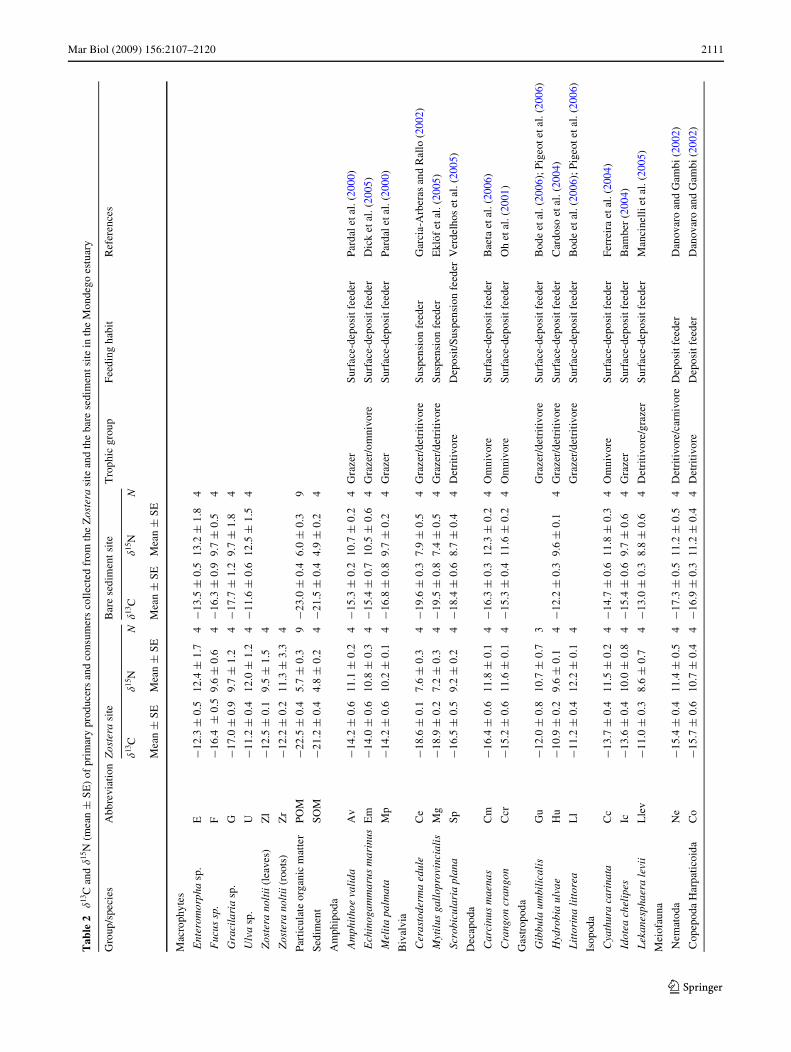
The �15N of primary producers ranged between 9.7 and13.2‰ in the bare sediment site and between 9.7 and 13.2in the Zostera site (Table 2). There were clearly no diVer-ences in �15N between the Zostera and the bare sedimentsite for green (F1,10 = 1.95, P = 0.20), red (F1,5 = 0.60,P = 0.48) or brown algae (F1,4 = 0.02, P = 0.98).
Food web structure
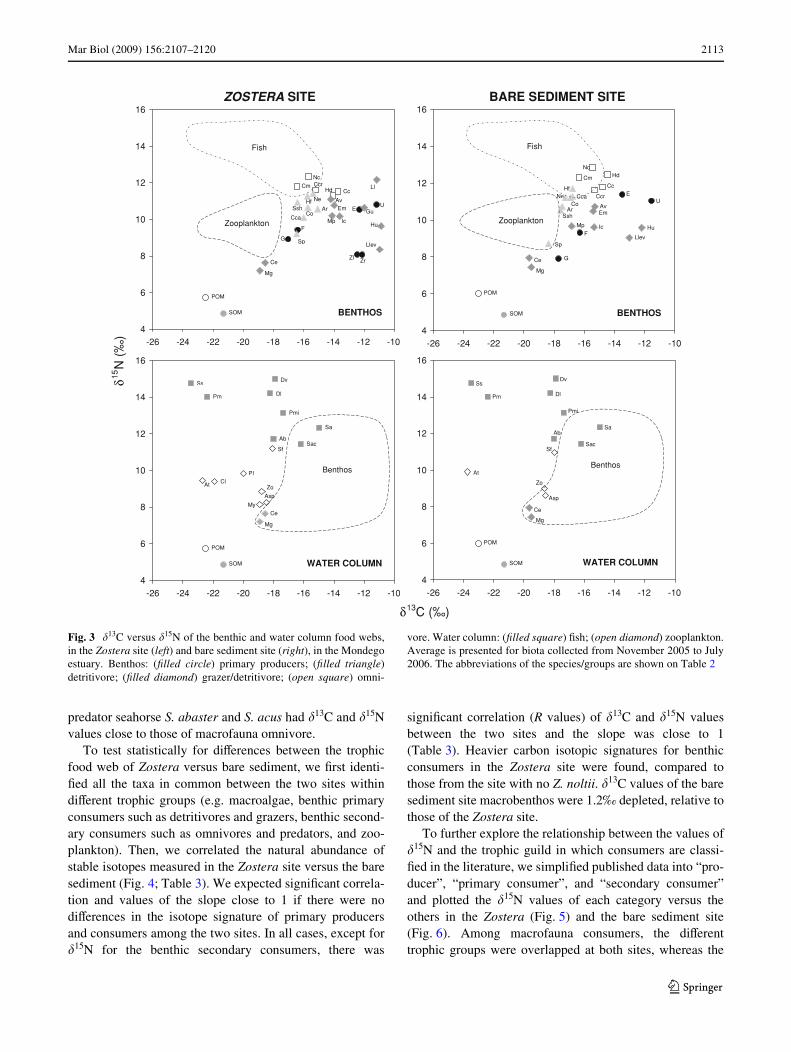
A total of 45 groups/species were identiWed, including5 species of primary producers, bulk POM, SOM and 38consumer groups. Among these consumers, there were 21species of macrofauna, 2 of meiofauna, 8 Wsh species, and7 zooplankton taxa (Table 2). The dual-stable isotope plots(Fig. 3) showed that both the benthic and plankton foodwebs were similar between sites. There were, however,some diVerences for the position of the detritivore bivalveScrobicularia plana, for the omnivore polychaetes Nepthyscirrosa and Hediste diversicolor, the omnivore crustaceansCyathura carinata, Crangon crangon and Carcinusmaenas. S. plana was closer to the suspension feederbivalves Cerastoderma edule, and Mytilus galloprovin-cialis, whereas the remaining species, especially H. diversi-color, were more enriched in 15N at the bare sediment thanthe Zostera site. Accordingly, there were signiWcant diVer-ences between the two sites in the �15N values of omni-vores (F1,10 = 13.85, P = 0.003).
At both sites, POM and SOM had the most depleted val-ues of �13C and �15N. Macroalgae and Z. noltii had a rela-tively variable range of values, similar to the �13C and �15Nvalues of macrofauna consumers (Table 2; Fig. 3). Amongthe macrofauna consumers, the isotopic signatures of thesuspension feeders M. galloprovincialis and C. edule werevery close to the planktonic food web and were 1–3‰enriched compared to POM (1–2‰ in 13C and 2–3‰ in15N, Fig. 3). The grazer macrofauna gastropod Hydrobiaulvae had the highest �13C values among all other macro-fauna consumers and very low �15N values. Only the macro-fauna suspension feeder C. edule and M. galloprovincialisshowed smaller values than H. ulvae. The highest �15Nvalues were found for the predator Glycera tridactyla andthe omnivore N. cirrosa, especially in the bare sediment(Table 2; Fig. 3).
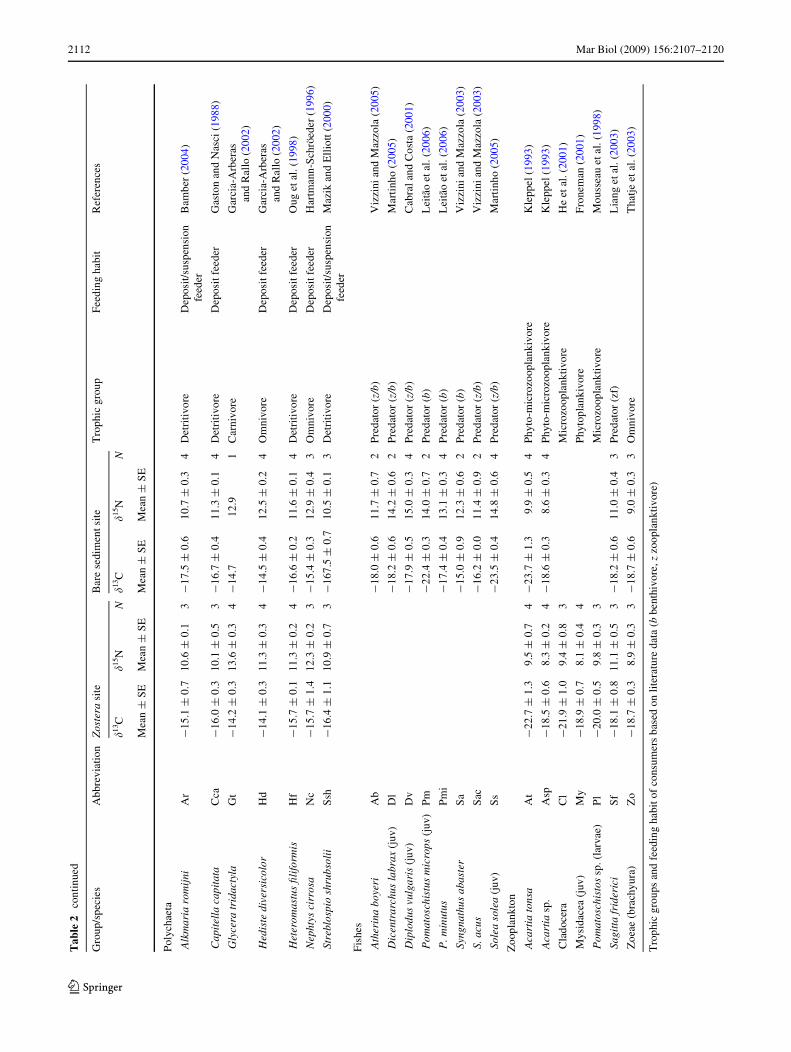
The zooplankton consumers occupied a relatively nar-row area, as compared to the macrofauna consumers. Thosezooplankton species that are considered phyto- and micro-zooplanktivores were at an intermediate position betweenPOM and the zooplankton predator Sagitta friderici. Even-tually, the predator Wsh D. labrax, D. vulgaris and P. minu-tus, were 3–4‰ enriched in 15N and 1–2‰ in 13C ascompared to intermediate plankton consumers. The juve-niles of the predator Wsh S. solea and P. microps wereinstead very depleted in 13C, but not in 15N, whereas the
Table 1 Results of paired t tests of diVerences between the two sites for nutrient and chlorophyll concentrations in the Mondego estuary
t df
NO3¡ 0.068ns 8
NH4+ 1.385ns 8
PO43¡ 1.867ns 8
Chlorophyll a 0.701ns 8
DIN/PO43¡ 0.464ns 8
ns no signiWcant diVerences (P > 0.05)
Fig. 2 Nitrate, ammonium, and phosphate (a), DIN/PO43¡ (b), and
phytoplankton chlorophyll a (c) concentrations, at the Zostera site andbare sediment site, in the Mondego estuary, from November 2005 toJuly 2006
Con
cent
ratio
n (m
g L-1
)
0
0,4
0,8
1,2
N D J F M A M J J
NUTRIENTSNO
NH
PO
4
3
4
Z bs
+
3
Rat
io
0
10
20
30
40
N D J F M A M J J
Zbs
DIN/PO 43
Redfield
Con
cent
ratio
n (m
g m
-3)
0
2
4
6
8
10
N D J F M A M J J
Zbs
CHLOROPHYLL(c)
(b)
(a)
123
Mar Biol (2009) 156:2107–2120 2111
Tab
le2
�13C
and
�15
N (
mea
n§
SE
) of
pri
mar
y pr
oduc
ers
and
cons
umer
s co
llec
ted
from
the
Zos
tera
sit
e an
d th
e ba
re s
edim
ent s
ite in
the
Mon
dego
est
uary
Gro
up/s
peci
esA
bbre
viat
ion
Zos
tera
site
Bar
e se
dim
ent s
ite
Tro
phic
gro
upF
eedi
ng h
abit
Ref
eren
ces
�13C
�15N
N�13
C�15
NN
Mea
n§
SEM
ean§
SEM
ean§
SEM
ean§
SE
Mac
roph
ytes
Ent
erom
orph
a sp
.E
¡12
.3§
0.5
12.4§
1.7
4¡
13.5
§0.
513
.2§
1.8
4
Fuc
us s
p.F
¡16
.4 §
0.5
9.6§
0.6
4¡
16.3
§0.
99.
7§
0.5
4
Gra
cila
ria
sp.
G¡
17.0
§0.
99.
7§
1.2
4¡
17.7
§1.
29.
7§
1.8
4
Ulv
a sp
.U
¡11
.2§
0.4
12.0§
1.2
4¡
11.6
§0.
612
.5§
1.5
4
Zos
tera
nol
tii (
leav
es)
Zl
¡12
.5§
0.1
9.5§
1.5
4
Zos
tera
nol
tii (
root
s)Z
r¡
12.2
§0.
211
.3§
3.3
4
Part
icul
ate
orga
nic
mat
ter
POM
¡22
.5§
0.4
5.7§
0.3
9¡
23.0
§0.
46.
0§
0.3
9
Sedi
men
tSO
M¡
21.2
§0.
44.
8§
0.2
4¡
21.5
§0.
44.
9§
0.2
4
Am
phip
oda
Am
phit
hoe
vali
daA
v¡
14.2
§0.
611
.1§
0.2
4¡
15.3
§0.
210
.7§
0.2
4G
raze
rS
urfa
ce-d
epos
it f
eede
rPa
rdal
eta
l. (2
000)
Ech
inog
amm
arus
mar
inus
Em
¡14
.0§
0.6
10.8§
0.3
4¡
15.4
§0.
710
.5§
0.6
4G
raze
r/om
nivo
reS
urfa
ce-d
epos
it f
eede
rD
ick
etal
. (20
05)
Mel
ita
palm
ata
Mp
¡14
.2§
0.6
10.2§
0.1
4¡
16.8
§0.
89.
7§
0.2
4G
raze
rS
urfa
ce-d
epos
it f
eede
rPa
rdal
eta
l. (2
000)
Biv
alvi
a
Cer
asto
derm
a ed
ule
Ce
¡18
.6§
0.1
7.6§
0.3
4¡
19.6
§0.
37.
9§
0.5
4G
raze
r/de
trit
ivor
eS
uspe
nsio
n fe
eder
Gar
cia-
Arb
eras
and
Ral
lo (
2002
)
Myt
ilus
gal
lopr
ovin
cial
isM
g¡
18.9
§0.
27.
2§
0.3
4¡
19.5
§0.
87.
4§
0.5
4G
raze
r/de
trit
ivor
eS
uspe
nsio
n fe
eder
Ekl
öf e
tal.
(200
5)
Scro
bicu
lari
a pl
ana
Sp¡
16.5
§0.
59.
2§
0.2
4¡
18.4
§0.
68.
7§
0.4
4D
etri
tivo
reD
epos
it/S
uspe
nsio
n fe
eder
Ver
delh
os e
tal.
(200
5)
Dec
apod
a
Car
cinu
s m
aena
sC
m¡
16.4
§0.
611
.8§
0.1
4¡
16.3
§0.
312
.3§
0.2
4O
mni
vore
Sur
face
-dep
osit
fee
der
Bae
ta e
tal.
(200
6)
Cra
ngon
cra
ngon
Ccr
¡15
.2§
0.6
11.6§
0.1
4¡
15.3
§0.
411
.6§
0.2
4O
mni
vore
Sur
face
-dep
osit
fee
der
Oh
etal
. (20
01)
Gas
trop
oda
Gib
bula
um
bili
cali
sG
u¡
12.0
§0.
810
.7§
0.7
3G
raze
r/de
trit
ivor
eS
urfa
ce-d
epos
it f
eede
rB
ode
etal
. (20
06);
Pig
eot e
tal.
(200
6)
Hyd
robi
a ul
vae
Hu
¡10
.9§
0.2
9.6§
0.1
4¡
12.2
§0.
39.
6§
0.1
4G
raze
r/de
trit
ivor
eS
urfa
ce-d
epos
it f
eede
rC
ardo
so e
tal.
(200
4)
Lit
tori
na li
ttor
eaL
l¡
11.2
§0.
412
.2§
0.1
4G
raze
r/de
trit
ivor
eS
urfa
ce-d
epos
it f
eede
rB
ode
etal
. (20
06);
Pig
eot e
tal.
(200
6)
Isop
oda
Cya
thur
a ca
rina
taC
c¡
13.7
§0.
411
.5§
0.2
4¡
14.7
§0.
611
.8§
0.3
4O
mni
vore
Sur
face
-dep
osit
fee
der
Ferr
eira
eta
l. (2
004)
Idot
ea c
heli
pes
Ic¡
13.6
§0.
410
.0§
0.8
4¡
15.4
§0.
69.
7§
0.6
4G
raze
rS
urfa
ce-d
epos
it f
eede
rB
ambe
r (2
004)
Lek
anes
phae
ra le
vii
Lle
v¡
11.0
§0.
38.
6§
0.7
4¡
13.0
§0.
38.
8§
0.6
4D
etri
tivo
re/g
raze
rS
urfa
ce-d
epos
it f
eede
rM
anci
nelli
eta
l. (2
005)
Mei
ofau
na
Nem
atod
aN
e¡
15.4
§0.
411
.4§
0.5
4¡
17.3
§0.
511
.2§
0.5
4D
etri
tivo
re/c
arni
vore
Dep
osit
fee
der
Dan
ovar
o an
d G
ambi
(20
02)
Cop
epod
a H
arpa
tico
ida
Co
¡15
.7§
0.6
10.7§
0.4
4¡
16.9
§0.
311
.2§
0.4
4D
etri
tivo
reD
epos
it f
eede
rD
anov
aro
and
Gam
bi (
2002
)
123
2112 Mar Biol (2009) 156:2107–2120
Tab
le2
cont
inue
d
Tro
phic
gro
ups
and
feed
ing
habi
t of
cons
umer
s ba
sed
on li
tera
ture
dat
a (b
ben
thiv
ore,
z z
oopl
ankt
ivor
e)
Gro
up/s
peci
esA
bbre
viat
ion
Zos
tera
sit
eB
are
sedi
men
t site
Tro
phic
gro
upFe
edin
g ha
bit
Ref
eren
ces
�13C
�15N
N�13
C�15
NN
Mea
n§
SEM
ean§
SEM
ean§
SEM
ean§
SE
Pol
ycha
eta
Alk
mar
ia r
omij
niA
r¡
15.1
§0.
710
.6§
0.1
3¡
17.5
§0.
610
.7§
0.3
4D
etri
tivo
reD
epos
it/su
spen
sion
fe
eder
Bam
ber
(200
4)
Cap
itel
la c
apit
ata
Cca
¡16
.0§
0.3
10.1§
0.5
3¡
16.7
§0.
411
.3§
0.1
4D
etri
tivo
reD
epos
it fe
eder
Gas
ton
and
Nas
ci (
1988
)
Gly
cera
trid
acty
laG
t¡
14.2
§0.
313
.6§
0.3
4¡
14.7
12.9
1C
arni
vore
Gar
cia-
Arb
eras
an
d R
allo
(20
02)
Hed
iste
div
ersi
colo
rH
d¡
14.1
§0.
311
.3§
0.3
4¡
14.5
§0.
412
.5§
0.2
4O
mni
vore
Dep
osit
fee
der
Gar
cia-
Arb
eras
an
d R
allo
(20
02)
Het
erom
astu
s W
lifo
rmis
Hf
¡15
.7§
0.1
11.3§
0.2
4¡
16.6
§0.
211
.6§
0.1
4D
etri
tivo
reD
epos
it fe
eder
Oug
eta
l. (1
998)
Nep
htys
cir
rosa
Nc
¡15
.7§
1.4
12.3§
0.2
3¡
15.4
§0.
312
.9§
0.4
3O
mni
vore
Dep
osit
fee
der
Har
tman
n-S
chrö
eder
(19
96)
Stre
blos
pio
shru
bsol
iiS
sh¡
16.4
§1.
110
.9§
0.7
3¡
167.
5§
0.7
10.5
§0.
13
Det
riti
vore
Dep
osit/
susp
ensi
on
feed
erM
azik
and
Ell
iott
(200
0)
Fis
hes
Ath
erin
a bo
yeri
Ab
¡18
.0§
0.6
11.7
§0.
72
Pred
ator
(z/
b)V
izzi
ni a
nd M
azzo
la (
2005
)
Dic
entr
arch
us la
brax
(ju
v)D
l¡
18.2
§0.
614
.2§
0.6
2Pr
edat
or (
z/b)
Mar
tinh
o (2
005)
Dip
lodu
s vu
lgar
is (
juv)
Dv
¡17
.9§
0.5
15.0
§0.
34
Pred
ator
(z/
b)C
abra
l and
Cos
ta (
2001
)
Pom
atos
chis
tus
mic
rops
(ju
v)P
m¡
22.4
§0.
314
.0§
0.7
2Pr
edat
or (
b)L
eitã
o et
al. (
2006
)
P. m
inut
usP
mi
¡17
.4§
0.4
13.1
§0.
34
Pred
ator
(b)
Lei
tão
etal
. (20
06)
Syng
nath
us a
bast
erS
a¡
15.0
§0.
912
.3§
0.6
2Pr
edat
or (
b)V
izzi
ni a
nd M
azzo
la (
2003
)
S. a
cus
Sac
¡16
.2§
0.0
11.4
§0.
92
Pred
ator
(z/
b)V
izzi
ni a
nd M
azzo
la (
2003
)
Sole
a so
lea
(juv
)S
s¡
23.5
§0.
414
.8§
0.6
4Pr
edat
or (
z/b)
Mar
tinh
o (2
005)
Zoo
plan
kton
Aca
rtia
tons
aA
t¡
22.7
§1.
39.
5§
0.7
4¡
23.7
§1.
39.
9§
0.5
4Ph
yto-
mic
rozo
opla
nkiv
ore
Kle
ppel
(19
93)
Aca
rtia
sp.
Asp
¡18
.5§
0.6
8.3§
0.2
4¡
18.6
§0.
38.
6§
0.3
4Ph
yto-
mic
rozo
opla
nkiv
ore
Kle
ppel
(19
93)
Cla
doce
raC
l¡
21.9
§1.
09.
4§
0.8
3M
icro
zoop
lank
tivor
eH
e et
al. (
2001
)
Mys
idac
ea (
juv)
My
¡18
.9§
0.7
8.1§
0.4
4Ph
ytop
lank
ivor
eF
rone
man
(20
01)
Pom
atos
chis
tos
sp. (
larv
ae)
Pl
¡20
.0§
0.5
9.8§
0.3
3M
icro
zoop
lank
tivor
eM
ouss
eau
etal
. (19
98)
Sagi
tta
frid
eric
iS
f¡
18.1
§0.
811
.1§
0.5
3¡
18.2
§0.
611
.0§
0.4
3Pr
edat
or (
zf)
Lia
ng e
tal.
(200
3)
Zoe
ae (
brac
hyur
a)Z
o¡
18.7
§0.
38.
9§
0.3
3¡
18.7
§0.
69.
0§
0.3
3O
mni
vore
Tha
tje e
tal.
(200
3)
123
Mar Biol (2009) 156:2107–2120 2113
predator seahorse S. abaster and S. acus had �13C and �15Nvalues close to those of macrofauna omnivore.
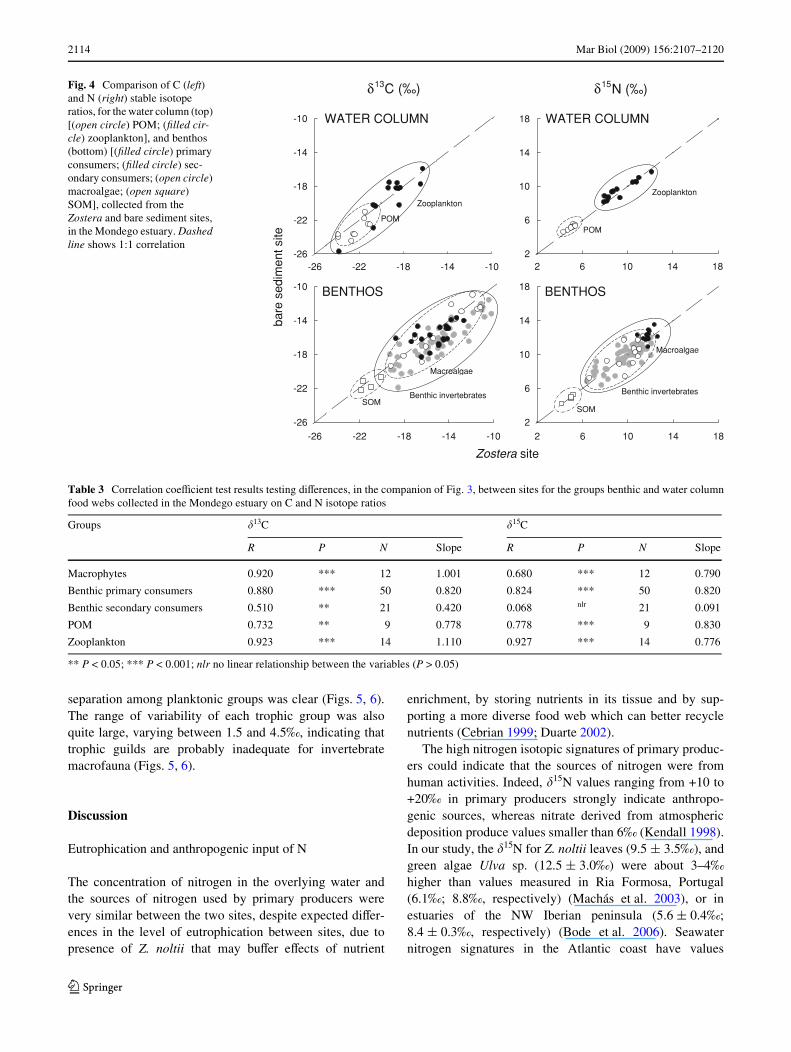
To test statistically for diVerences between the trophicfood web of Zostera versus bare sediment, we Wrst identi-Wed all the taxa in common between the two sites withindiVerent trophic groups (e.g. macroalgae, benthic primaryconsumers such as detritivores and grazers, benthic second-ary consumers such as omnivores and predators, and zoo-plankton). Then, we correlated the natural abundance ofstable isotopes measured in the Zostera site versus the baresediment (Fig. 4; Table 3). We expected signiWcant correla-tion and values of the slope close to 1 if there were nodiVerences in the isotope signature of primary producersand consumers among the two sites. In all cases, except for�15N for the benthic secondary consumers, there was
signiWcant correlation (R values) of �13C and �15N valuesbetween the two sites and the slope was close to 1(Table 3). Heavier carbon isotopic signatures for benthicconsumers in the Zostera site were found, compared tothose from the site with no Z. noltii. �13C values of the baresediment site macrobenthos were 1.2‰ depleted, relative tothose of the Zostera site.
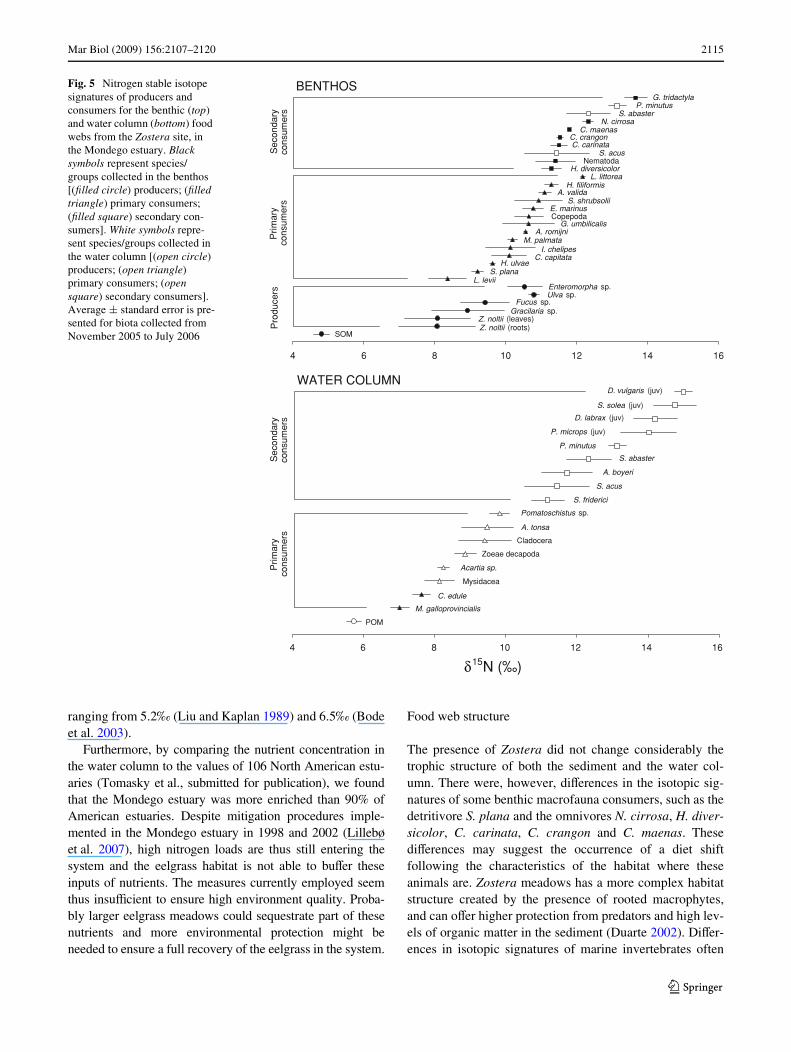
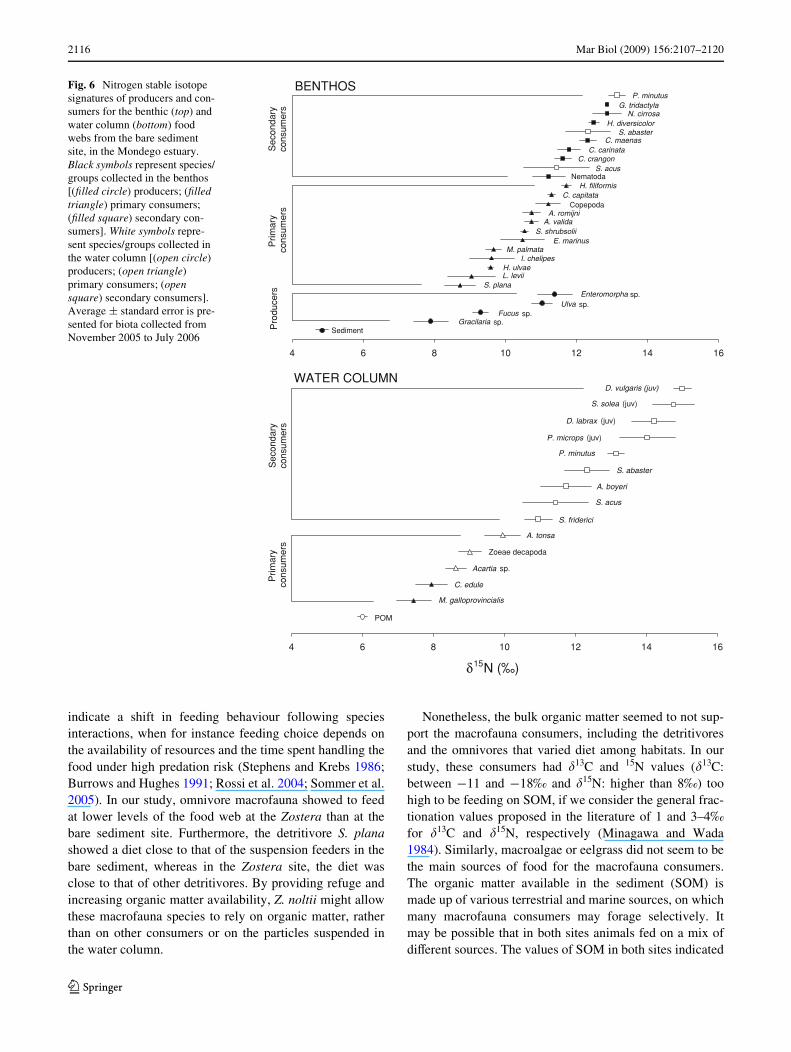
To further explore the relationship between the values of�15N and the trophic guild in which consumers are classi-Wed in the literature, we simpliWed published data into “pro-ducer”, “primary consumer”, and “secondary consumer”and plotted the �15N values of each category versus theothers in the Zostera (Fig. 5) and the bare sediment site(Fig. 6). Among macrofauna consumers, the diVerenttrophic groups were overlapped at both sites, whereas the
Fig. 3 �13C versus �15N of the benthic and water column food webs,in the Zostera site (left) and bare sediment site (right), in the Mondegoestuary. Benthos: (Wlled circle) primary producers; (Wlled triangle)detritivore; (Wlled diamond) grazer/detritivore; (open square) omni-
vore. Water column: (Wlled square) Wsh; (open diamond) zooplankton.Average is presented for biota collected from November 2005 to July2006. The abbreviations of the species/groups are shown on Table 2
ZOSTERA
SITE
BARE SEDIMENT SITE
δ15N
(‰
)
4
6
8
10
12
14
16
-26 -24 -22 -20 -18 -16 -14 -12 -10
POM
SOM BENTHOS
Mg
Ce
UE
Llev
Mp Ic
Em
F
G Sp
Hu
Hd
Nc
Av
Cc
Hf
Cm Ccr
Cca
SshCo
Ne
Ar
Fish
Gu
Ll
Zl Zr
Zooplankton
4
6
8
10
12
14
16
-26 -24 -22 -20 -18 -16 -14 -12 -10
POM
SOM BENTHOS
Mg
Ce
UE
Llev
Mp Ic
Em
F
G
Sp
Hu
HdNc
Av
CcHf
Cm
CcrCca
Ssh
CoNe
Ar
Fish
Zooplankton
4
6
8
10
12
14
16
-26 -24 -22 -20 -18 -16 -14 -12 -10
POM
SOM WATER COLUMN
Mg
Ce
Benthos
At ClPl
Sf
Zo
My
Asp
Sac
Sa
Ab
Pmi
Dl
Dv
Pm
Ss
4
6
8
10
12
14
16
-26 -24 -22 -20 -18 -16 -14 -12 -10
POM
SOM WATER COLUMN
Mg
Ce
At
Sf
Zo
Asp
Sac
SaAb
Pmi
Dl
Dv
Pm
Ss
Benthos
δ13C (‰)
123
2114 Mar Biol (2009) 156:2107–2120
separation among planktonic groups was clear (Figs. 5, 6).The range of variability of each trophic group was alsoquite large, varying between 1.5 and 4.5‰, indicating thattrophic guilds are probably inadequate for invertebratemacrofauna (Figs. 5, 6).
Discussion
Eutrophication and anthropogenic input of N
The concentration of nitrogen in the overlying water andthe sources of nitrogen used by primary producers werevery similar between the two sites, despite expected diVer-ences in the level of eutrophication between sites, due topresence of Z. noltii that may buVer eVects of nutrient
enrichment, by storing nutrients in its tissue and by sup-porting a more diverse food web which can better recyclenutrients (Cebrian 1999; Duarte 2002).
The high nitrogen isotopic signatures of primary produc-ers could indicate that the sources of nitrogen were fromhuman activities. Indeed, �15N values ranging from +10 to+20‰ in primary producers strongly indicate anthropo-genic sources, whereas nitrate derived from atmosphericdeposition produce values smaller than 6‰ (Kendall 1998).In our study, the �15N for Z. noltii leaves (9.5 § 3.5‰), andgreen algae Ulva sp. (12.5 § 3.0‰) were about 3–4‰higher than values measured in Ria Formosa, Portugal(6.1‰; 8.8‰, respectively) (Machás et al. 2003), or inestuaries of the NW Iberian peninsula (5.6 § 0.4‰;8.4 § 0.3‰, respectively) (Bode et al. 2006). Seawaternitrogen signatures in the Atlantic coast have values
Fig. 4 Comparison of C (left) and N (right) stable isotope ratios, for the water column (top) [(open circle) POM; (Wlled cir-cle) zooplankton], and benthos (bottom) [(Wlled circle) primary consumers; (Wlled circle) sec-ondary consumers; (open circle) macroalgae; (open square) SOM], collected from the Zostera and bare sediment sites, in the Mondego estuary. Dashed line shows 1:1 correlation
δ13C (‰) δ15N (‰)
bare
sed
imen
t site
-26
-22
-18
-14
-10
-26 -22 -18 -14 -10
POM
Zooplankton
WATER COLUMN
2
6
10
14
18
2 6 10 14 18
WATER COLUMN
Zooplankton
POM
-26
-22
-18
-14
-10
-26 -22 -18 -14 -10
BENTHOS
Macroalgae
Benthic invertebratesSOM
2
6
10
14
18
2 6 10 14 18
Benthic invertebrates
Macroalgae
BENTHOS
SOM
Zostera site
Table 3 Correlation coeYcient test results testing diVerences, in the companion of Fig. 3, between sites for the groups benthic and water columnfood webs collected in the Mondego estuary on C and N isotope ratios
** P < 0.05; *** P < 0.001; nlr no linear relationship between the variables (P > 0.05)
Groups �13C �15C
R P N Slope R P N Slope
Macrophytes 0.920 *** 12 1.001 0.680 *** 12 0.790
Benthic primary consumers 0.880 *** 50 0.820 0.824 *** 50 0.820
Benthic secondary consumers 0.510 ** 21 0.420 0.068 nlr 21 0.091
POM 0.732 ** 9 0.778 0.778 *** 9 0.830
Zooplankton 0.923 *** 14 1.110 0.927 *** 14 0.776
123
Mar Biol (2009) 156:2107–2120 2115
ranging from 5.2‰ (Liu and Kaplan 1989) and 6.5‰ (Bodeet al. 2003).
Furthermore, by comparing the nutrient concentration inthe water column to the values of 106 North American estu-aries (Tomasky et al., submitted for publication), we foundthat the Mondego estuary was more enriched than 90% ofAmerican estuaries. Despite mitigation procedures imple-mented in the Mondego estuary in 1998 and 2002 (Lillebøet al. 2007), high nitrogen loads are thus still entering thesystem and the eelgrass habitat is not able to buVer theseinputs of nutrients. The measures currently employed seemthus insuYcient to ensure high environment quality. Proba-bly larger eelgrass meadows could sequestrate part of thesenutrients and more environmental protection might beneeded to ensure a full recovery of the eelgrass in the system.
Food web structure
The presence of Zostera did not change considerably thetrophic structure of both the sediment and the water col-umn. There were, however, diVerences in the isotopic sig-natures of some benthic macrofauna consumers, such as thedetritivore S. plana and the omnivores N. cirrosa, H. diver-sicolor, C. carinata, C. crangon and C. maenas. ThesediVerences may suggest the occurrence of a diet shiftfollowing the characteristics of the habitat where theseanimals are. Zostera meadows has a more complex habitatstructure created by the presence of rooted macrophytes,and can oVer higher protection from predators and high lev-els of organic matter in the sediment (Duarte 2002). DiVer-ences in isotopic signatures of marine invertebrates often
Fig. 5 Nitrogen stable isotope signatures of producers and consumers for the benthic (top) and water column (bottom) food webs from the Zostera site, in the Mondego estuary. Black symbols represent species/groups collected in the benthos [(Wlled circle) producers; (Wlled triangle) primary consumers; (Wlled square) secondary con-sumers]. White symbols repre-sent species/groups collected in the water column [(open circle) producers; (open triangle) primary consumers; (open square) secondary consumers]. Average § standard error is pre-sented for biota collected from November 2005 to July 2006 SOM
Z. noltii (leaves)
Fucus sp. Gracilaria sp.
Z. noltii (roots)
Ulva sp.Enteromorpha sp.
L. leviiS. plana
H. ulvaeC. capitata
I. chelipesM. palmata
A. romijniG. umbilicalis
CopepodaE. marinus
S. shrubsoliiA. valida
H. filiformis
H. diversicolorNematoda
C. carinata
C. maenas
L. littorea
N. cirrosa
G. tridactyla
S. acus
S. abasterP. minutus
C. crangon
4 6 8 10 12 14 16
Pro
duce
rs
Prim
ary
cons
umer
sS
econ
dary
co
nsum
ers
BENTHOS
POM
M. galloprovincialis
C. edule
Mysidacea
Acartia sp.
Zoeae decapoda
Cladocera
A. tonsa
Pomatoschistus sp.
S. friderici
S. acus
S. solea (juv)
4 6 8 10 12 14 16
A. boyeri
S. abaster
D. labrax (juv)
D. vulgaris (juv)
P. microps (juv)
P. minutus
Sec
onda
ry
cons
umer
sP
rimar
y co
nsum
ers
WATER COLUMN
δ15N (‰)
123
2116 Mar Biol (2009) 156:2107–2120
indicate a shift in feeding behaviour following speciesinteractions, when for instance feeding choice depends onthe availability of resources and the time spent handling thefood under high predation risk (Stephens and Krebs 1986;Burrows and Hughes 1991; Rossi et al. 2004; Sommer et al.2005). In our study, omnivore macrofauna showed to feedat lower levels of the food web at the Zostera than at thebare sediment site. Furthermore, the detritivore S. planashowed a diet close to that of the suspension feeders in thebare sediment, whereas in the Zostera site, the diet wasclose to that of other detritivores. By providing refuge andincreasing organic matter availability, Z. noltii might allowthese macrofauna species to rely on organic matter, ratherthan on other consumers or on the particles suspended inthe water column.
Nonetheless, the bulk organic matter seemed to not sup-port the macrofauna consumers, including the detritivoresand the omnivores that varied diet among habitats. In ourstudy, these consumers had �13C and 15N values (�13C:between ¡11 and ¡18‰ and �15N: higher than 8‰) toohigh to be feeding on SOM, if we consider the general frac-tionation values proposed in the literature of 1 and 3–4‰for �13C and �15N, respectively (Minagawa and Wada1984). Similarly, macroalgae or eelgrass did not seem to bethe main sources of food for the macrofauna consumers.The organic matter available in the sediment (SOM) ismade up of various terrestrial and marine sources, on whichmany macrofauna consumers may forage selectively. Itmay be possible that in both sites animals fed on a mix ofdiVerent sources. The values of SOM in both sites indicated
Fig. 6 Nitrogen stable isotope signatures of producers and con-sumers for the benthic (top) and water column (bottom) food webs from the bare sediment site, in the Mondego estuary. Black symbols represent species/groups collected in the benthos [(Wlled circle) producers; (Wlled triangle) primary consumers; (Wlled square) secondary con-sumers]. White symbols repre-sent species/groups collected in the water column [(open circle) producers; (open triangle) primary consumers; (open square) secondary consumers]. Average § standard error is pre-sented for biota collected from November 2005 to July 2006
SedimentGracilaria sp.
Fucus sp. Ulva sp.
Enteromorpha sp.S. plana
L. leviiH. ulvae
I. chelipesM. palmata
E. marinusS. shrubsolii
A. validaA. romijni
Copepoda
Nematoda
C. capitata
S. acusC. crangon
H. filiformis
C. carinataC. maenas
S. abasterH. diversicolor
N. cirrosaG. tridactyla
P. minutus
4 6 8 10 12 14 16
Prim
ary
cons
umer
sS
econ
dary
co
nsum
ers
Pro
duce
rs
BENTHOS
POM
M. galloprovincialis
C. edule
Acartia sp.
A. tonsa
Zoeae decapoda
S. friderici
S. acus
S. solea (juv)
4 6 8 10 12 14 16
A. boyeri
S. abaster
D. labrax (juv)
D. vulgaris (juv)
P. microps (juv)
P. minutus
Prim
ary
cons
umer
sS
econ
dary
co
nsum
ers
WATER COLUMN
δ15N (‰)
123
Mar Biol (2009) 156:2107–2120 2117
a mix of terrestrial organic matter, very depleted in 13C(¡30 to ¡23‰, Fry and Sherr 1984), microalgae (between¡21 and ¡12‰ for �13C and between 5 and 8‰ for �15N,France 1995; Currin et al. 1995; Riera et al. 1996, 1999;Herman et al. 2000; Moens et al. 2002; Page and Lastra2003) and macroalgae (¡18 to ¡11‰, in this study). Micro-algae indeed represent a fundamental source of food forbenthic macrofauna in many estuaries, especially on inter-tidal bare sediment (Herman et al. 2000; Middelburg et al.2000; Rossi et al. 2009). In the bare site, sediment micro-algae were more abundant than in the Zostera site and theisotopic values of microalgae measured in November 2008ranged between ¡13 and ¡14‰ for �13C and 6‰ for �15N(Alexandra Baeta, personal observation). It may thus bepossible that animals foraged on a mix of surface detritus,macroalgae and benthic microalgae, selecting for benthicmicroalgae when available.
Recently, empirical studies have found variable �15Nvalues within trophic levels and demonstrated that the gen-erally recognised average 3–4‰ �15N increase at each tro-phic level (e.g. Minagawa and Wada 1984) does not alwaysapply to the marine system because food sources are tem-porally and spatially variable and because consumers varytheir metabolism depending on the source of food ingested(Sommer et al. 2005; Vanderklift and Ponsard 2003). Fur-thermore, omnivory is a very common feature in estuarinehabitats and it may further complicate the interpretation ofisotopic signatures of consumers and their food sources(Svensson et al. 2007; Jaschinski et al. 2008). In our study,it is possible that 15N enriched values of macrofauna spe-cies compared to the �15N of SOM or macroalgae were dueto a diVerent metabolism of these consumers with respect totheir nitrogen sources. In addition, the high frequency ofomnivory may explain why �15N values overlapped amongthe trophic groups in which macrofauna species are catego-rised. We indeed found that the �15N values for the herbi-vores and detritivores (primary consumers) of the benthosranged from 7.8 to 12.2‰ and overlapped to those of thepredators/omnivores (secondary consumers), which rangedfrom 10.8 to 14.2‰. This variability in trophic signaturesmay have important consequences for interpreting aquaticfood webs because it may undermine the estimates ofenergy or mass Xow through food webs, when such esti-mates are based on the assumption that trophic levels arediscrete. Indeed, considering discrete trophic levels cannotcapture the complex trophic interactions and the omnivorytypical of natural environment, underestimating the Xow ofenergy in the ecosystem (Vander Zanden and Rasmussen2001; Post 2002; Vanderklift and Ponsard 2003; Bode et al.2006).
Compared to the benthic food web, the food web of thewater column was less complex. The values of �13C for theorganic matter suspended in the water column (POM) were
in agreement with the literature values of surface waters inthe latitudinal range around 40°N (from ¡25 to ¡18‰,Goerick et al. 1994) and were within the range for estuarineand coastal marine phytoplankton from other temperateregions (see Gearing et al. 1984). Taking into account afractionation of 3–4‰ for �15N and of 1‰ for �13C, in bothsites the link between the food web of benthos and thewater column was clearly represented by the suspensionfeeders M. galloprovincialis and C. edule. The �13C ofC. edule (¡18‰) was similar to other studies that sug-gested C. edule has a diet based on plankton microalgaeand organic matter (POM) mixed with benthic microalgaeresuspended on the overlying water (Rossi et al. 2004). Inaddition, a part of the water column trophic web was sup-ported by POM. The primary consumer A. tonsa, a micro-zooplanktivore and other phyto-microzooplanktivorescould forage on POM and transfer part of this carbon andnitrogen up to the food web. Fish fed on a mixed diet thatmay include both allochthonous and autochthonous foodsources, from both the benthos and the plankton. Forinstance, the juveniles of S. solea and P. microps were toodepleted in 13C to indicate they only foraged on planktonconsumers. It may be possible they used other sourcesderived from the terrestrial food web, as found in the Rhoneriver (Darnaude 2005). Furthermore, the 13C enrichment ofother Wsh (A. boyeri, P. minutus, D. labrax, D. vulgaris)was up to 5‰ compared to the copepod A. tonsa and to theother phyto-microzooplanktivores. They were thus tooenriched in 13C to suggest a diet exclusive on these species.Rather, their diet could include benthic consumers andother plankton consumers (Acartia sp. and zoeae).
In conclusion, in the Mondego estuary the presence ofthe eelgrass Z. noltii did not alter nutrient enrichment andthe transfer of these nutrients and carbon in the food web,since we found very similar trophic structures between baresediment and sediment occupied by Z. noltii. The benthicfood web revealed more complex than the water columnfood web and evidenced high variability in the isotopic sig-natures, probably due to the variability of food sources andthe physiological characteristics of the macrofauna. Wesuggest that macrofauna could rely on a complex mix ofmicroalgae, macroalgae and detritus, actively selecting forthe most nutritive food sources when available. Other stud-ies are, however, needed to establish the trophic signiW-cance of the diVerent food sources and, in particular, ofbenthic microalgae.
Acknowledgments This study has beneWted from the constructivecomments of two anonymous reviewers. The authors are grateful toFilipe Martinho, João Neto, and Ana Bessa for Weld assistance duringsample collection, and Gaël Guillou for the isotope analysis. We alsothank Sophia Fox, and Mirta Teichberg, for helpful discussions andvaluable comments on the manuscript. This research was supported byFCT (Fundação para a Ciência e Tecnologia) through a Ph.D. Grant
123
2118 Mar Biol (2009) 156:2107–2120
attributed to Alexandra Baeta (SFRH/BD/23574/2005), and a FLAD/IMAR Grant (04/06). Additional funding for stable isotope analysiswas provided by IMAR—Institute of Marine Research, through theR&D project RECONNECT (PTDC/MAR/64627/2006) and WISER(FP7-ENV-2008-1).
References
Abreu PC, Costa CSB, Bemvenuti C, Odebrecht C, Granéli W, AnesioAM (2006) Eutrophication processes and trophic interactions in ashallow estuary: preliminary results based on stable isotope anal-ysis (�13C and �15N). Estuar Coast 29:277–285
Baeta A, Cabral HN, Marques JC, Pardal MA (2006) Feeding ecologyof the green crab Carcinus maenas (L., 1758) in a temperate estu-ary, Portugal. Crustaceana 79:1181–1193
Baeta A, Pinto R, Valiela I, Richard P, Niquil N, Marques JC (2009)�15N and �13C in the Mondego estuary food web: seasonal varia-tion in producers and consumers. Mar Environ Res 67:109–116
Bamber RN (2004) Temporal variation and monitoring of importantlagoonal communities and species in Wales. Bangor, CCWMarine Monitoring Report no 12. p 42
Bode A, Carrera P, Lens S (2003) The pelagic foodweb in the upwell-ing ecosystem of Galicia (NW Spain) during spring: natural abun-dance of stable carbon and nitrogen isotopes. ICES J Mar Sci60:11–22
Bode A, Alvarez-Ossorio MT, Varela M (2006) Phytoplankton andmacrophyte contributions to littoral food webs in the Galicianupwelling estimated from stable isotopes. Mar Ecol Prog Ser318:89–102
Bricker SB, Clement CG, Pirhalla DE, Orlando SP, Farrow DRG(1999) National Estuarine Eutrophication Assessment: eVects ofnutrient enrichment in the nation’s estuaries. NOAA, NationalOcean Service, Special Projects OYce and the National Centersfor Coastal Ocean Science. Silver Spring, MD, p 71
Burrows MT, Hughes RN (1991) Variation in foraging behaviouramong individuals and populations of dogwhelks, Nucella lapil-lus: natural constraints on energy intake. J Anim Ecol 60:497–514
Cabral HN, Costa MJ (2001) Distribution, abundance, feeding ecologyand growth of 0-group seabass, Dicentrarchus labrax (L., 1758),in the Tagus estuary. J Mar Biol Assoc UK 81:679–682
Cardoso PG, Pardal MA, Lillebø AI, Ferreira SM, RaVaelli D,Marques JC (2004) Dynamic changes in seagrass assemblagesunder eutrophication and implications for recovery. J Exp MarBiol Ecol 302:233–248
Cardoso PG, Brandão A, Pardal MA, RaVaelli D, Marques JC (2005)Resilience of Hydrobia ulvae populations to anthropogenic andnatural disturbances. Mar Ecol Prog Ser 289:191–199
Cebrian J (1999) Patterns in the fate of production in plant communi-ties. Am Nat 154:449–468
Cloern JE (2001) Our evolving conceptual model of the coastal eutro-phication problem. Mar Ecol Prog Ser 210:223–253
Cole ML, Kroeger KD, McClelland JW, Valiela I (2006) EVects ofwatershed land use on nitrogen concentrations and �15N nitrogenon groundwater. Biogeochemistry 77:199–215
Currin CA, Newell SY, Paerl HW (1995) The role of standing deadSpartina alterniXora and benthic microalgae in salt marsh foodwebs: considerations based on multiple stable isotope analysis.Mar Ecol Prog Ser 121:99–116
Danovaro R, Gambi C (2002) Biodiversity and trophic structure ofnematode assemblages in seagrass systems: evidence for a cou-pling with changes in food availability. Mar Biol 141:667–677
Darnaude AM (2005) Fish ecology and terrestrial carbon use in coastalareas: implications for marine Wsh production. J Animal Ecol74:864–876
DeNiro MJ, Epstein S (1978) InXuence of diet on the distribution ofcarbon isotopes in animals. Geochim Cosmochim Acta 42:495–506
Dick JTA, Johnson MP, McCambridge S, Johnson J, Carson VEE,Kelly DW, MacNeil C (2005) Predatory nature of the littoralamphipod Echinogammarus marinus: gut content analysis andeVects of alternative food and substrate heterogeneity. Mar EcolProg Ser 291:151–158
Dolbeth M, Cardoso PG, Ferreira SM, Verdelhos T, RaVaelli D, PardalMA (2007) Anthropogenic and natural disturbance eVects on amacrobenthic estuarine community over a 10-year period. MarPollut Bull 54:576–585
Duarte CM (2002) The future of seagrass meadows. Environ Conserv29:192–206
Eklöf JS, de la Torre Castro M, Adelsköld L, Jiddawi NS, Kautsky N(2005) DiVerences in macrofaunal and seagrass assemblages inseagrass beds with and without seaweed farms. Estuar Coast ShelfSci 63:385–396
Ferreira SM, Pardal MA, Lillebø AI, Cardoso PG, Marques JC (2004)Population dynamics of Cyathura carinata (Isopoda) in a eutro-phic temperate estuary. Estuar Coast Shelf Sci 61:669–677
France RL (1995) Carbon-13 enrichment in benthic compared toplanktonic algae: foodweb implications. Mar Ecol Prog Ser124:307–312
Froneman PW (2001) Feeding ecology of the mysid, Mesopodopsiswooldridgei, in a temperate estuary along the eastern seaboard ofSouth Africa. J Plankton Res 23:999–1008
Fry B, Sherr EB (1984) �13C measurements as indicators of carbonXow in marine and freshwater ecosystems. Contrib Mar Sci27:13–47
Garcia-Arberas L, Rallo A (2002) Life cycle, demography and second-ary production of the polychaete Hediste divesicolor in a non-polluted estuary in the Bay of Biscay. Mar Ecol 23:237–251
Gaston GR, Nasci JC (1988) Trophic structure of macrobenthic com-munities in the Calcasieu estuary, Louisiana. Estuaries11(3):201–211
Gearing JN, Gearing PJ, Rudnick DT, Requejo AJ, Hutchins MJ(1984) Isotopic variability of organic carbon in a phytoplankton-based temperate estuary. Geochim Cosmochim Acta 48:1089–1098
Goerick R, Montoya JP, Fry B (1994) Physiology of isotopic fraction-ation in algae and cyanobacteria. In: Lajtha K, Michener RH (eds)Stable isotopes in ecology and environmental science. BlackwellScience Publications, Oxford, pp 187–221
Hartmann-Schröeder G (1996) Annelida, Borstenwürmer, Polychaeta.Gustav Fischer Verlag, Jena, p 648
He ZH, Qin JG, Wang Y, Jiang H, Wen Z (2001) Biology of Moinamongolica (Moinidae, Cladocera) and perspective as live food formarine Wsh larvae: review. Hydrobiologia 457:25–37
Herman PMJ, Middelburg JJ, Widdows J, Lucas CH, Heip CHR(2000) Stable isotopes as trophic tracers: combining Weld sam-pling and manipulative labelling of food resources for macroben-thos. Mar Ecol Prog Ser 204:79–92
Howarth RW (1988) Nutrient limitation of net primary production inmarine ecosystems. Annu Rev Ecol Syst 19:89–110
Jaschinski S, Brepohl DC, Sommer U (2008) Carbon sources and tro-phic structure in an eelgrass Zostera marina bed, based on stableisotope and fatty acid analyses. Mar Ecol Prog Ser 358:103–114
Kendall C (1998) Tracing nitrogen sources and cycling in catchments.In: Kendall C, McDonnell JJ (eds) Isotope tracers in catchmenthydrology. Elsevier, St. Louis, pp 519–576
Kleppel GS (1993) On the diet of calanoid copepods. Mar Ecol ProgSer 99:183–195
Kwak TJ, Zedler JB (1997) Food web analysis of southern Californiacoastal wetlands using multiple stable isotopes. Oecologia110:262–277
123
Mar Biol (2009) 156:2107–2120 2119
Leitão R, Martinho F, Neto JM, Cabral H, Marques JC, Pardal MA(2006) Feeding ecology, population structure and distributionof Pomatoschistus microps (Krøyer, 1838) and Pomatoschistusminutes (Pallas, 1770) in a temperate estuary, Portugal. EstuarCoast Shelf Sci 66:231–239
Liang TH, Ara K, Miranda LB, Bérgamo AL, Bernardes M (2003) Onthe variability of the chaetognath Sagitta friderici Ritter-Zàhonyat Cananéia Lagoon Estuarine system, São Paulo, Brazil. Hydro-biologia 510:91–102
Lillebø AI, Teixeira H, Pardal MA, Marques JC (2007) Applyingquality status criteria to a temperate estuary before and after themitigation measures to reduce eutrophication symptoms. EstuarCoast Shelf Sci 72:177–187
Liu KK, Kaplan IR (1989) The eastern tropical PaciWc as source of15N-enriched nitrate in seawater oV southern California. LimnolOceanogr 34:820–830
Lotze HK, Lenihan HS, Bourque BJ, Bradbury RH, Cooke RG, KayMC, Kidwell SM, Kirby MX, Peterson CH, Jackson JBC (2006)Depletion, degradation, and recovery potential of estuaries andcoastal seas. Science 312:1806–1809
Machás R, Santos R, Peterson B (2003) Tracing the Xow of organicmatter from primary producers to Wlter feeders in Ria Formosalagoon, southern Portugal. Estuaries 26:846–856
Mancinelli G, Sabetta L, Basset A (2005) Short-term patch dynamicsof macroinvertebrate colonization on decaying reed detritus in amediterranean lagoon (Lake Alimini Grande, Apulia, SE Italy).Mar Biol 148:271–283
Marques JC, Pardal MA, Nielsen SN, Jørgensen SE (1997) Analysisof the properties of exergy and biodiversity along an estuarinegradient of eutrophication. Ecol Modell 102:155–167
Marques JC, Nielsen SN, Pardal MA, Jørgensen SE (2003) Impactof eutrophication and river management within a framework ofecosystem theories. Ecol Modell 166:147–168
Martinho FMD (2005) O estuário do Mondego como viveiro para aictiofauna: Ecologia dos juvenis de Dicentrarchus labrax,Platichthys Xesus e Solea solea. Master Thesis, Universidade deCoimbra, Coimbra
Mazik K, Elliott M (2000) The eVects of chemical pollution on the bio-turbation potential of estuarine intertidal mudXats. Helgol MarRes 54:99–109
McClelland JW, Valiela I, Michener RH (1997) Nitrogen-stable iso-tope signatures in estuarine food webs: a record of increasingurbanization in coastal watersheds. Limnol Oceanogr 42:930–937
Middelburg JJ, Barranguet C, Boschker HTS, Herman PMJ, Moens T,Heip CHR (2000) The fate of intertidal microphytobenthos carbon:an in situ 13C-labeling study. Limnol Oceanogr 45:1224–1234
Minagawa M, Wada E (1984) Stepwise enrichment of 15N along foodchains: further evidence and the relation between �15N and animalage. Geochim Cosmochim Acta 48:1135–1140
Moens T, Luyten C, Middelburg JJ, Herman PMJ, Vincx M (2002)Tracing organic matter sources of estuarine tidal Xat nematodeswith stable carbon isotopes. Mar Ecol Prog Ser 234:127–137
Mousseau L, Fortier L, Legendre L (1998) Annual production of Wshlarvae and their prey in relation to size-fractionated primary pro-duction (Scotian Shelf, NW Atlantic). J Mar Sci 55:44–57
Neto JMM (2004) Nutrient enrichment in a temperate macro-tidal sys-tem. Scenario analysis and contribution to coastal management,Ph.D. Thesis, University of Coimbra, Portugal
Neto JM, Patrício J, Teixeira H, Baeta A, Veríssimo H, Pinto R,Marques JC. Long term ecological response of subtidal macro-benthic communities to natural and human induced changes in atemperate NE Atlantic estuary. Implications for management andrestoration. Mar Ecol Prog Ser (submitted for publication)
Oh CW, Hartnoll RG, Nash RDM (2001) Feeding ecology of the com-mon shrimp Crangon crangon in Port Erin Bay, Isle of Man, IrishSea. Mar Ecol Prog Ser 214:211–223
Oug E, Nais K, Rygg B (1998) Relationship between soft bottom mac-rofauna and polycyclic aromatic hydrocarbons (PAH) formsmelter discharge in Norwegian fjords and coastal waters. MarEcol Prog Ser 173:39–52
Page HM, Lastra M (2003) Diet of intertidal bivalves in the Ría deArosa (NW Spain): evidence from stable C and N isotope analy-sis. Mar Biol 143:519–532
Pardal MA, Marques JC, Metelo I, Lillebø AI, Flindt MR (2000)Impact of eutrophication on the life cycle, population dynamicsand production of Ampithoe valida (Amphipoda) along an estua-rine spatial gradient (Mondego estuary, Portugal). Mar Ecol ProgSer 196:207–219
Pardal MA, Cardoso PG, Sousa JP, Marques JC, RaVaelli D (2004)Assessing environmental quality: a novel approach. Mar EcolProg Ser 267:1–8
Parsons TR, Maita Y, Lally CM (1985) Pigments. In: A manual ofchemical and biological methods for seawater analysis. PergamonPress, pp 101e104
Patrício J, Marques JC (2006) Mass balanced models of the food webin three areas along a gradient of eutrophication symptoms in thesouth arm of the Mondego estuary (Portugal). Ecol Modell197:21–34
Peterson BJ, Fry B (1987) Stable isotopes in ecosystems studies. AnnuRev Ecol Syst 18:293–320
Pigeot J, Miramand P, Guyot T, Sauriau PG, Fichet D, Le Moine O,Huet V (2006) Cadmium pathways in an exploited intertidal eco-system with chronic cadmium inputs (Marennes-Oléron, Atlanticcoast, France). Mar Ecol Prog Ser 307:101–114
Post DM (2002) Using stable isotopes to estimate trophic position:models, methods, and assumptions. Ecology 83:703–718
Riera P, Richard P, Grémare A, Blanchard G (1996) Food source ofintertidal nematodes in the Bay of Marennes-Oléron (France), asdetermined by dual stable isotope analysis. Mar Ecol Prog Ser142:303–309
Riera P, Stal LJ, Nieuwenhuize J, Richard P, Blanchard G, Gentil F(1999) Determination of food sources for benthic invertebrates ina salt marsh (Aiguillon Bay, France) by carbon and nitrogen sta-ble isotopes: importance of locally produced sources. Mar EcolProg Ser 87:301–307
Riera P, Stal LJ, Nieuwenhuize J (2000) Heavy �15N in intertidal ben-thic algae and invertebrates in the Scheldt estuary (The Nether-lands): eVects of river nitrogen inputs. Estuar Coast Shelf Sci51:365–372
Rossi F, Herman PMJ, Middelburg JJ (2004) Inter- and intra-speciWcvariation of �13C and �15N in deposit- and suspension-feedingbivalves (Macoma balthica and Cerastoderma edule): evidenceof ontogenetic changes in feeding mode of Macoma balthica.Limnol Oceanogr 49:409–414
Rossi F, Vos M, Middelburg JJ (2009) Species identity, diversity andmicrobial carbon Xow in reassembling macrobenthic communi-ties. Oikos 118:503–512
Short FT, Wyllie-Echeverria S (1996) Natural and human induced dis-turbance of seagrasses. Environ Conserv 23:17–27
Sommer F, Saage A, Santer B, Hansen T, Sommer U (2005) Linkingforaging strategies of marine calanoid copepods to patterns ofnitrogen stable isotope signatures in a mesocosm study. Mar EcolProg Ser 286:99–106
Stephens DW, Krebs JR (1986) Foraging theories. Princeton Univer-sity Press, Princeton
Svensson CJ, Hyndes GA, Lavery PS (2007) Food web analysis in twopermanently open temperate estuaries: consequences of saltmarshloss? Mar Environ Res 64:286–304
Thatje S, Schnack-Schiel S, Arntz WE (2003) Developmental trade-oVs in Subantarctic meroplankton communities and the enigma oflow decapod diversity in high southern latitudes. Mar Ecol ProgSer 260:195–207
123
2120 Mar Biol (2009) 156:2107–2120
Tieszen LL, Boutton TW, Tesdahl KG, Slade NA (1983) Fractionationand turnover of stable carbon isotopes in animal tissues: implica-tions for �13C analysis of diet. Oecologia 57:32–37
Valiela I (2006) Global coastal change. Blackwell Publishing, Oxford,p 368
Valiela I, McClelland J, Hauxwell J, Behr PJ, Hersh D, Foreman K(1997) Macroalgal blooms in shallow estuaries: controls and eco-physiological and ecosystem consequences. Limnol Oceanogr42:1105–1118
Vander Zanden MJ, Rasmussen JB (2001) Variation in �15N and �13Ctrophic fractionation: implications for aquatic food web studies.Limnol Oceonogr 46:2061–2066
VanderKlift MA, Ponsard S (2003) Sources of variation in consumer-diet �15N enrichment: a meta-analysis. Oecologia 136:169–182
Verdelhos T, Neto JM, Marques JC, Pardal MA (2005) The eVect ofeutrophication abatement on the bivalve Scrobicularia plana.Estuar Coast Shelf Sci 63:168–261
Vizzini S, Mazzola A (2003) Seasonal variations in the stable carbonand nitrogen isotope ratios (13C/12C and 15N/14N) of primary pro-ducers and consumers in a western Mediterranean coastal lagoon.Mar Biol 142:1009–1018
Vizzini S, Mazzola A (2005) Feeding ecology of the sand smelt Athe-rina boyeri (Risso 1810) (Osteichthyes, Atherinidae) in the west-ern Mediterranean: evidence for spatial variability based on stablecarbon and nitrogen isotopes. Environ Biol Fishes 72:259–266
Wada EH, Mizutani H, Minagawa M (1991) The use of stable isotopesfor food web analysis. Crit Rev Food Sci Nutr 30:361–371
123
Related Documents