Doble PowerTest Ltd. 5 Weyvern Park Peasmarsh, Guildford, Surrey GU3 1NA United Kingdom tel +44 (0) 1483 514120 fax +44 (0) 1483 514149 www.doble.com 1 ON SITE EXPERIENCES WITH MULTI-TERMINAL IEC PD MEASUREMENTS, UHF PD MEASUREMENTS AND MIXED UHF AND ACOUSTIC PD LOCALIZATION Sebastian Coenen 1 , Maximilian Heindl 1 , Anne Pfeffer 1 , Stefan Tenbohlen 1 , S. Markalous 2 1 - UNIVERSITÄT STUTTGART, GERMANY 2 - LEMKE DIAGNOSTICS GMBH, GERMANY ABSTRACT The reliability of electrical energy networks depends on the quality and availability of electrical equipment like power transformers. Local failures inside their insulation may lead to catastrophic breakdowns and can cause high outage and penalty costs. To prevent these fatal events power transformers are tested towards partial discharge (PD) activity before commissioning and currently also during service. This paper introduces the multi-terminal electric PD measurement set-up of on-site transformer measurements and shows some visualization with a star diagram. Mainly the current work deals with the electromagnetic method, also known as UHF-Method. The UHF-Method with a bandwidth from 300 MHz to 3 GHz bases on the fact, that PDs inside oil filled transformers emit electromagnetic waves measurable with oil valve probes inside the transformer tank. The characteristics of low attenuation of electromagnetic waves propagating through different insulating materials and structures like pressboard, oil and windings are investigated on power transformers in the field. An important step for risk estimation in case of PD activity is to locate the geometrical position of PD sources within the transformer. The paper presents the technique of locating PD sources by using run times of UHF signals and acoustic measurements. 1 INTRODUCTION Defects in transformer insulation cause partial discharges (PD), which can progressively degrade the insulating material and possibly lead to electrical breakdown. Therefore, early detection of partial discharges is important [1]. PD measurements can also provide information about the ageing condition of transformers and thus enable conclusions about their lifetime. The so called UHF PD measuring method (UHF: Ultra High Frequency) bases on the fact that PDs under oil are very fast electrical processes and radiate electromagnetic waves with frequencies up to the ultrahigh range (UHF: 300 – 3000 MHz). The electromagnetic waves are sensitively detectable with UHF probes, see Figure 1. The probes can be inserted into the transformer during full operation using the oil filling valve. As a result of shielding characteristics of the transformer tank against external electromagnetic waves, a clear decision can be made concerning the PD activity of the test object. FIGURE 1: UHF PD probe for standard oil filling valve The moderately attenuated propagation of UHF waves inside transformer tanks is proofed on transformers planned for scrapping. This was shown in a laboratory research in [2] then proofed in [3] and is investigated continuatively in this paper. An important step for risk estimation in case of PD activity is to locate the geometrical position of PD sources within the transformer. The paper presents the technique of locating PD sources by using run times of UHF signals and acoustic measurements.

Welcome message from author
This document is posted to help you gain knowledge. Please leave a comment to let me know what you think about it! Share it to your friends and learn new things together.
Transcript

Doble PowerTest Ltd. 5 Weyvern Park Peasmarsh, Guildford, Surrey GU3 1NA United Kingdom tel +44 (0) 1483 514120 fax +44 (0) 1483 514149 www.doble.com
1
ON SITE EXPERIENCES WITH MULTI-TERMINAL IEC PD MEAS UREMENTS, UHF PD MEASUREMENTS AND MIXED UHF AND ACOUSTIC PD LOCALIZA TION
Sebastian Coenen1, Maximilian Heindl 1, Anne Pfeffer1, Stefan Tenbohlen1, S. Markalous2
1 - UNIVERSITÄT STUTTGART, GERMANY
2 - LEMKE DIAGNOSTICS GMBH, GERMANY ABSTRACT The reliability of electrical energy networks depends on the quality and availability of electrical equipment like power transformers. Local failures inside their insulation may lead to catastrophic breakdowns and can cause high outage and penalty costs. To prevent these fatal events power transformers are tested towards partial discharge (PD) activity before commissioning and currently also during service. This paper introduces the multi-terminal electric PD measurement set-up of on-site transformer measurements and shows some visualization with a star diagram. Mainly the current work deals with the electromagnetic method, also known as UHF-Method. The UHF-Method with a bandwidth from 300 MHz to 3 GHz bases on the fact, that PDs inside oil filled transformers emit electromagnetic waves measurable with oil valve probes inside the transformer tank. The characteristics of low attenuation of electromagnetic waves propagating through different insulating materials and structures like pressboard, oil and windings are investigated on power transformers in the field. An important step for risk estimation in case of PD activity is to locate the geometrical position of PD sources within the transformer. The paper presents the technique of locating PD sources by using run times of UHF signals and acoustic measurements. 1 INTRODUCTION Defects in transformer insulation cause partial discharges (PD), which can progressively degrade the insulating material and possibly lead to electrical breakdown. Therefore, early detection of partial discharges is important [1]. PD measurements can also provide information about the ageing condition of transformers and thus enable conclusions about their lifetime.
The so called UHF PD measuring method (UHF: Ultra High Frequency) bases on the fact that PDs under oil are very fast electrical processes and radiate electromagnetic waves with frequencies up to the ultrahigh range (UHF: 300 – 3000 MHz). The electromagnetic waves are sensitively detectable with UHF probes, see Figure 1. The probes can be inserted into the transformer during full operation using the oil filling valve. As a result of shielding characteristics of the transformer tank against external electromagnetic waves, a clear decision can be made concerning the PD activity of the test object.
FIGURE 1: UHF PD probe for standard oil filling val ve
The moderately attenuated propagation of UHF waves inside transformer tanks is proofed on transformers planned for scrapping. This was shown in a laboratory research in [2] then proofed in [3] and is investigated continuatively in this paper. An important step for risk estimation in case of PD activity is to locate the geometrical position of PD sources within the transformer. The paper presents the technique of locating PD sources by using run times of UHF signals and acoustic measurements.
Doble PowerTest Ltd. 5 Weyvern Park Peasmarsh, Guildford, Surrey GU3 1NA United Kingdom tel +44 (0) 1483 514120 fax +44 (0) 1483 514149 www.doble.com
2
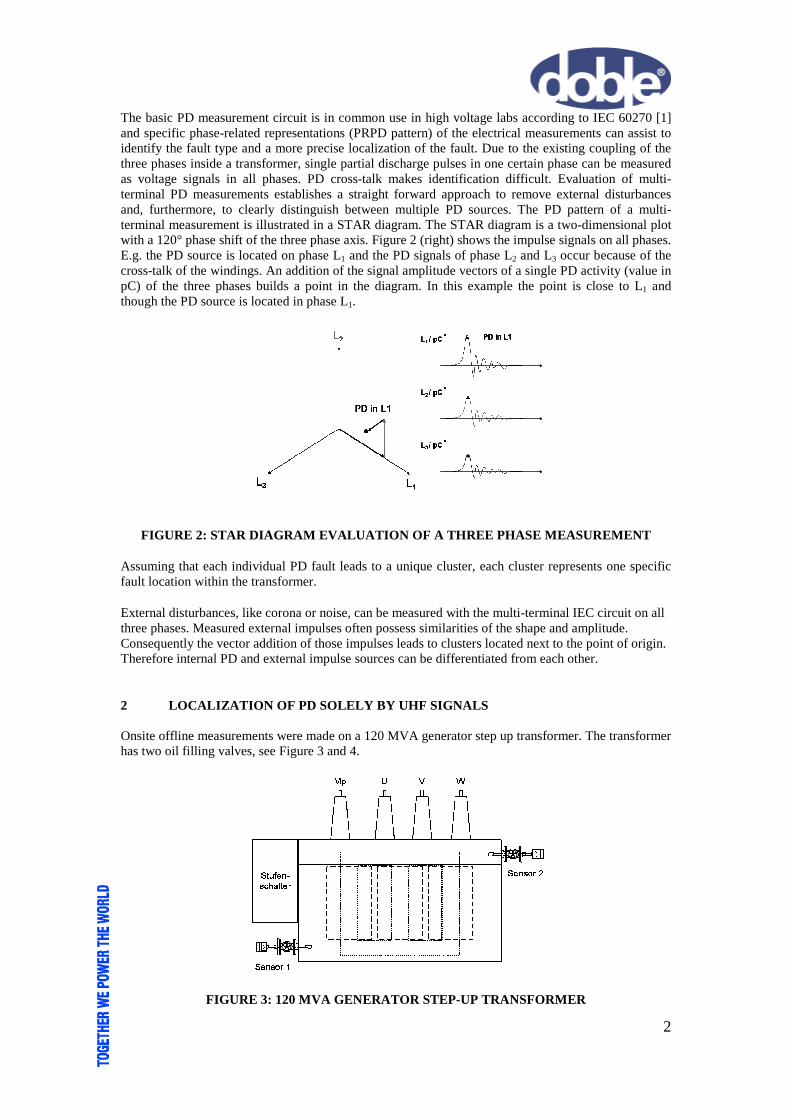
The basic PD measurement circuit is in common use in high voltage labs according to IEC 60270 [1] and specific phase-related representations (PRPD pattern) of the electrical measurements can assist to identify the fault type and a more precise localization of the fault. Due to the existing coupling of the three phases inside a transformer, single partial discharge pulses in one certain phase can be measured as voltage signals in all phases. PD cross-talk makes identification difficult. Evaluation of multi-terminal PD measurements establishes a straight forward approach to remove external disturbances and, furthermore, to clearly distinguish between multiple PD sources. The PD pattern of a multi-terminal measurement is illustrated in a STAR diagram. The STAR diagram is a two-dimensional plot with a 120° phase shift of the three phase axis. Figure 2 (right) shows the impulse signals on all phases. E.g. the PD source is located on phase L1 and the PD signals of phase L2 and L3 occur because of the cross-talk of the windings. An addition of the signal amplitude vectors of a single PD activity (value in pC) of the three phases builds a point in the diagram. In this example the point is close to L1 and though the PD source is located in phase L1.
FIGURE 2: STAR DIAGRAM EVALUATION OF A THREE PHASE MEASUREMENT
Assuming that each individual PD fault leads to a unique cluster, each cluster represents one specific fault location within the transformer.
External disturbances, like corona or noise, can be measured with the multi-terminal IEC circuit on all three phases. Measured external impulses often possess similarities of the shape and amplitude. Consequently the vector addition of those impulses leads to clusters located next to the point of origin. Therefore internal PD and external impulse sources can be differentiated from each other.
2 LOCALIZATION OF PD SOLELY BY UHF SIGNALS Onsite offline measurements were made on a 120 MVA generator step up transformer. The transformer has two oil filling valves, see Figure 3 and 4.
FIGURE 3: 120 MVA GENERATOR STEP-UP TRANSFORMER

Doble PowerTest Ltd. 5 Weyvern Park Peasmarsh, Guildford, Surrey GU3 1NA United Kingdom tel +44 (0) 1483 514120 fax +44 (0) 1483 514149 www.doble.com
3
The first valve is underneath the tap changer housing lower core brace height. The second valve is on the opposite side underneath the oil expansion tank in the cover of the transformer.
FIGURE 4: UHF PROBES INSTALLED AT 120 MVA GENERATOR TRANSFORMER
The first measurement, the so-called dual port Performance Check [4], demonstrates the sensitivity of the measuring system. Wide-band signals of a signal generator (60 V output at 50 Ω) are fed over the first UHF sensor into the transformer tank and measured with the second UHF sensor. Figure 5 shows the received time signal and its FFT. This measurement took place without high voltage.
FIGURE 5: DUAL PORT PERFORMANCE CHECK
From the illustration it is evident that a wide-band signal (right, frequency portions up to 1 GHz) was propagating through the transformer and its active part. Likewise it can be seen that there is sufficient signal-to-noise ratio in the time signal. Therefore the sensors are correctly installed and attached to the measuring instruments. A sensitive UHF measurement is possible.
It was possible to measure UHF signals with both probes, see figure 6. The red signals were recorded with the probe 1 below the tap changer, the blue signals were recorded with the probe 2 on the opposite side. Both figures show two time signals of different PD sources. In Figure 6 (left), probe 1 measured the UHF signals first and additionally with higher amplitude than probe 2. Hence it could be stated, that the PD source is nearer to probe 1. In Figure 6 (right) the amplitudes of both probes are nearly the same and the signals have just a small run time difference. According to that it is assumed, that the PD source of these signals are in the middle of the transformer because of the same distances and run times between the probes. During 30 seconds about 100 time signals of the UHF PD probes were recorded. In order to locate the PD, the run times were calculated by finding the starting time of the signals by defining a signal amplitude threshold value. This definition of the beginning of a signal is quite inaccurate, but it is sufficient however for a first impression.
Doble PowerTest Ltd. 5 Weyvern Park Peasmarsh, Guildford, Surrey GU3 1NA United Kingdom tel +44 (0) 1483 514120 fax +44 (0) 1483 514149 www.doble.com
4
FIGURE 6: SIGNALS MEASURED WITH UHF PD PROBES AT DI FFERENT LOCATIONS
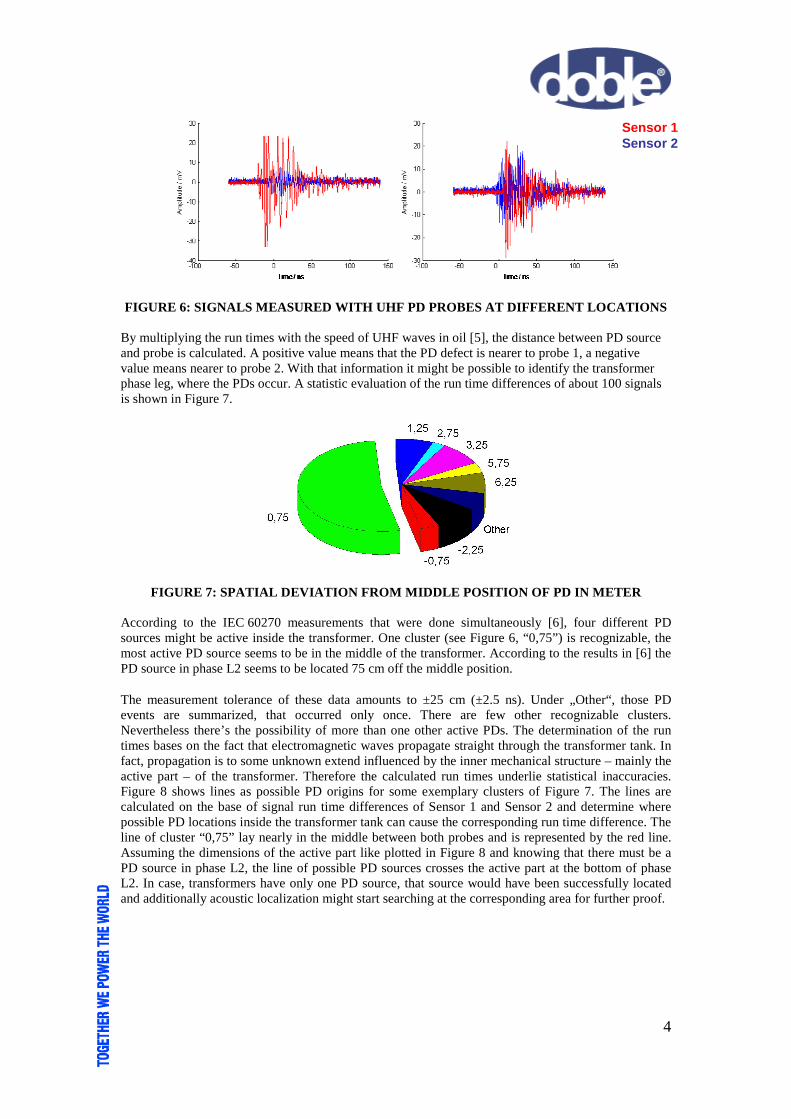
By multiplying the run times with the speed of UHF waves in oil [5], the distance between PD source and probe is calculated. A positive value means that the PD defect is nearer to probe 1, a negative value means nearer to probe 2. With that information it might be possible to identify the transformer phase leg, where the PDs occur. A statistic evaluation of the run time differences of about 100 signals is shown in Figure 7.
FIGURE 7: SPATIAL DEVIATION FROM MIDDLE POSITION OF PD IN METER According to the IEC 60270 measurements that were done simultaneously [6], four different PD sources might be active inside the transformer. One cluster (see Figure 6, “0,75”) is recognizable, the most active PD source seems to be in the middle of the transformer. According to the results in [6] the PD source in phase L2 seems to be located 75 cm off the middle position.
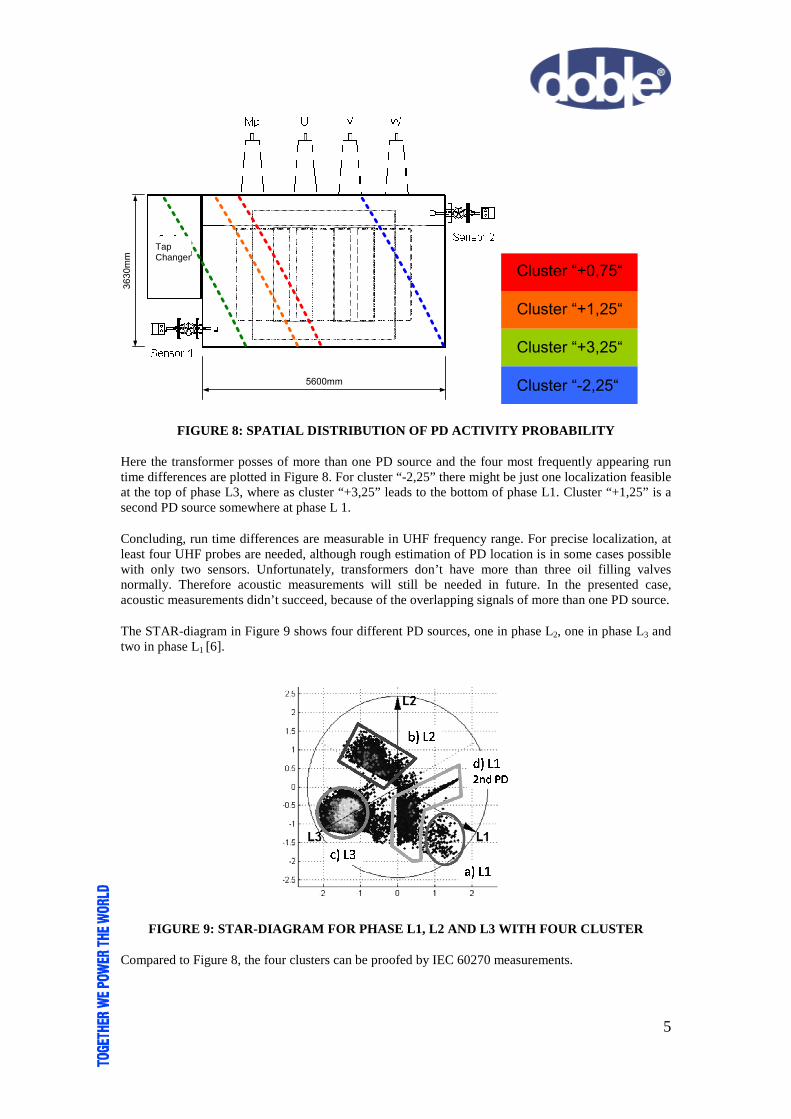
The measurement tolerance of these data amounts to ±25 cm (±2.5 ns). Under „Other“, those PD events are summarized, that occurred only once. There are few other recognizable clusters. Nevertheless there’s the possibility of more than one other active PDs. The determination of the run times bases on the fact that electromagnetic waves propagate straight through the transformer tank. In fact, propagation is to some unknown extend influenced by the inner mechanical structure – mainly the active part – of the transformer. Therefore the calculated run times underlie statistical inaccuracies. Figure 8 shows lines as possible PD origins for some exemplary clusters of Figure 7. The lines are calculated on the base of signal run time differences of Sensor 1 and Sensor 2 and determine where possible PD locations inside the transformer tank can cause the corresponding run time difference. The line of cluster “0,75” lay nearly in the middle between both probes and is represented by the red line. Assuming the dimensions of the active part like plotted in Figure 8 and knowing that there must be a PD source in phase L2, the line of possible PD sources crosses the active part at the bottom of phase L2. In case, transformers have only one PD source, that source would have been successfully located and additionally acoustic localization might start searching at the corresponding area for further proof.
Sensor 1 Sensor 2
Doble PowerTest Ltd. 5 Weyvern Park Peasmarsh, Guildford, Surrey GU3 1NA United Kingdom tel +44 (0) 1483 514120 fax +44 (0) 1483 514149 www.doble.com
5
3630mm
5600mm
Cluster “+0,75“
Cluster “+1,25“
Cluster “+3,25“
Cluster “-2,25“
FIGURE 8: SPATIAL DISTRIBUTION OF PD ACTIVITY PROBA BILITY
Here the transformer posses of more than one PD source and the four most frequently appearing run time differences are plotted in Figure 8. For cluster “-2,25” there might be just one localization feasible at the top of phase L3, where as cluster “+3,25” leads to the bottom of phase L1. Cluster “+1,25” is a second PD source somewhere at phase L 1.
Concluding, run time differences are measurable in UHF frequency range. For precise localization, at least four UHF probes are needed, although rough estimation of PD location is in some cases possible with only two sensors. Unfortunately, transformers don’t have more than three oil filling valves normally. Therefore acoustic measurements will still be needed in future. In the presented case, acoustic measurements didn’t succeed, because of the overlapping signals of more than one PD source.
The STAR-diagram in Figure 9 shows four different PD sources, one in phase L2, one in phase L3 and two in phase L1 [6].
FIGURE 9: STAR-DIAGRAM FOR PHASE L1, L2 AND L3 WITH FOUR CLUSTER
Compared to Figure 8, the four clusters can be proofed by IEC 60270 measurements.
Tap Changer
Doble PowerTest Ltd. 5 Weyvern Park Peasmarsh, Guildford, Surrey GU3 1NA United Kingdom tel +44 (0) 1483 514120 fax +44 (0) 1483 514149 www.doble.com
6
3 PD LOCALIZATION WITH COMBINED UHF AND ACOUSTIC ME ASUREMENTS
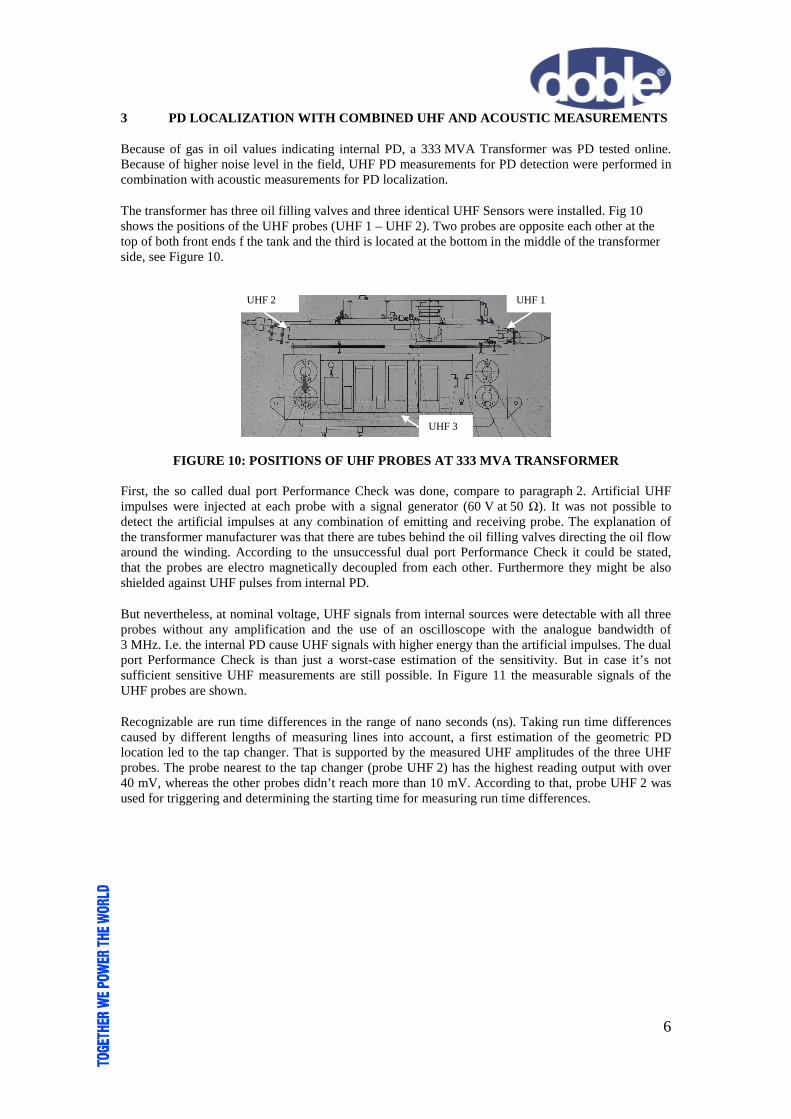
Because of gas in oil values indicating internal PD, a 333 MVA Transformer was PD tested online. Because of higher noise level in the field, UHF PD measurements for PD detection were performed in combination with acoustic measurements for PD localization.
The transformer has three oil filling valves and three identical UHF Sensors were installed. Fig 10 shows the positions of the UHF probes (UHF 1 – UHF 2). Two probes are opposite each other at the top of both front ends f the tank and the third is located at the bottom in the middle of the transformer side, see Figure 10.
FIGURE 10: POSITIONS OF UHF PROBES AT 333 MVA TRANSFORMER First, the so called dual port Performance Check was done, compare to paragraph 2. Artificial UHF impulses were injected at each probe with a signal generator (60 V at 50 Ω). It was not possible to detect the artificial impulses at any combination of emitting and receiving probe. The explanation of the transformer manufacturer was that there are tubes behind the oil filling valves directing the oil flow around the winding. According to the unsuccessful dual port Performance Check it could be stated, that the probes are electro magnetically decoupled from each other. Furthermore they might be also shielded against UHF pulses from internal PD.
But nevertheless, at nominal voltage, UHF signals from internal sources were detectable with all three probes without any amplification and the use of an oscilloscope with the analogue bandwidth of 3 MHz. I.e. the internal PD cause UHF signals with higher energy than the artificial impulses. The dual port Performance Check is than just a worst-case estimation of the sensitivity. But in case it’s not sufficient sensitive UHF measurements are still possible. In Figure 11 the measurable signals of the UHF probes are shown.
Recognizable are run time differences in the range of nano seconds (ns). Taking run time differences caused by different lengths of measuring lines into account, a first estimation of the geometric PD location led to the tap changer. That is supported by the measured UHF amplitudes of the three UHF probes. The probe nearest to the tap changer (probe UHF 2) has the highest reading output with over 40 mV, whereas the other probes didn’t reach more than 10 mV. According to that, probe UHF 2 was used for triggering and determining the starting time for measuring run time differences.
UHF 1 UHF 2
UHF 3

Doble PowerTest Ltd. 5 Weyvern Park Peasmarsh, Guildford, Surrey GU3 1NA United Kingdom tel +44 (0) 1483 514120 fax +44 (0) 1483 514149 www.doble.com
7
-100 -50 0 50 100
-0,012
-0,010
-0,008
-0,006
-0,004
-0,002
0,000
0,002
0,004
0,006
0,008A
mpl
itude
/ V
Time / ns
-100 -50 0 50 100
-0,04
-0,03
-0,02
-0,01
0,00
0,01
0,02
Am
plitu
de /
V
Time / ns
-100 -50 0 50 100
-0,015
-0,010
-0,005
0,000
0,005
0,010
0,015
Am
plitu
de /
V
Zeit (ns)
FIGURE 11: MEASURED RUN TIME DIFFERENCES BETWEEN TH REE UHF PROBES AT DIFFERENT LOCATIONS
Simultaneous IEC 60270 measurements were highly disturbed by audible corona discharges. By using frequency analyses and phase related UHF PD patterns however, UHF measurements were confirmed t not to be affected by the external corona discharge.
An exemplary frequency analysis of the measured signal of probe UHF 2 proofed the shielding characteristic of the tank, see Figure 12.
0 1 2 30,0
0,2
0,4
0,6
0,8
1,0
1,2
1,4
1,6
Frequency / GHz
Am
plitu
de /
Vs
FIGURE 12: FREQUENCY ANALYSIS OF PROBE “UHF 2” This signal features frequency content up to 2 GHz, as emitted by a broad band emitter of UHF waves like an internal PD in oil. External disturbing sources would have been narrow banded, e.g. at around 500 MHz for digital video broadcasting or around 900 MHz or 1800MHZ for global communication systems. For further proof that the signals correlate to a PD, PRPD´s of the signals were recorded,
UHF 1 UHF 2
UHF 3
Doble PowerTest Ltd. 5 Weyvern Park Peasmarsh, Guildford, Surrey GU3 1NA United Kingdom tel +44 (0) 1483 514120 fax +44 (0) 1483 514149 www.doble.com
8
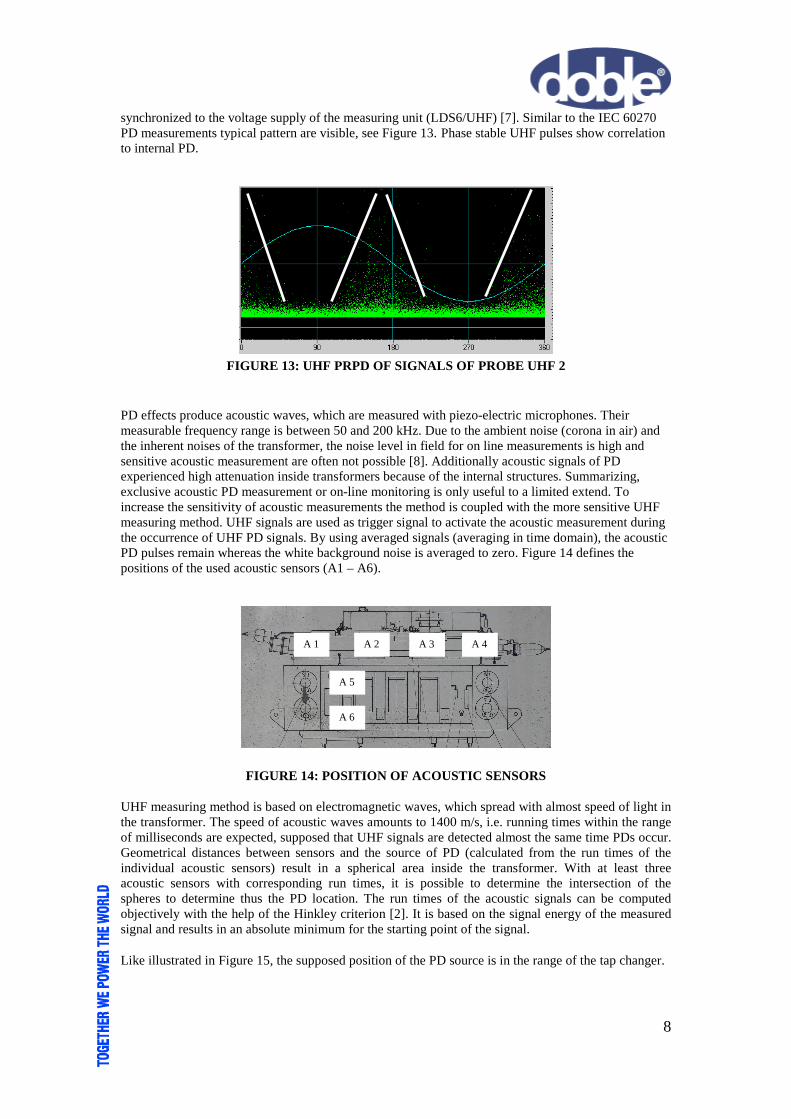
synchronized to the voltage supply of the measuring unit (LDS6/UHF) [7]. Similar to the IEC 60270 PD measurements typical pattern are visible, see Figure 13. Phase stable UHF pulses show correlation to internal PD.
FIGURE 13: UHF PRPD OF SIGNALS OF PROBE UHF 2
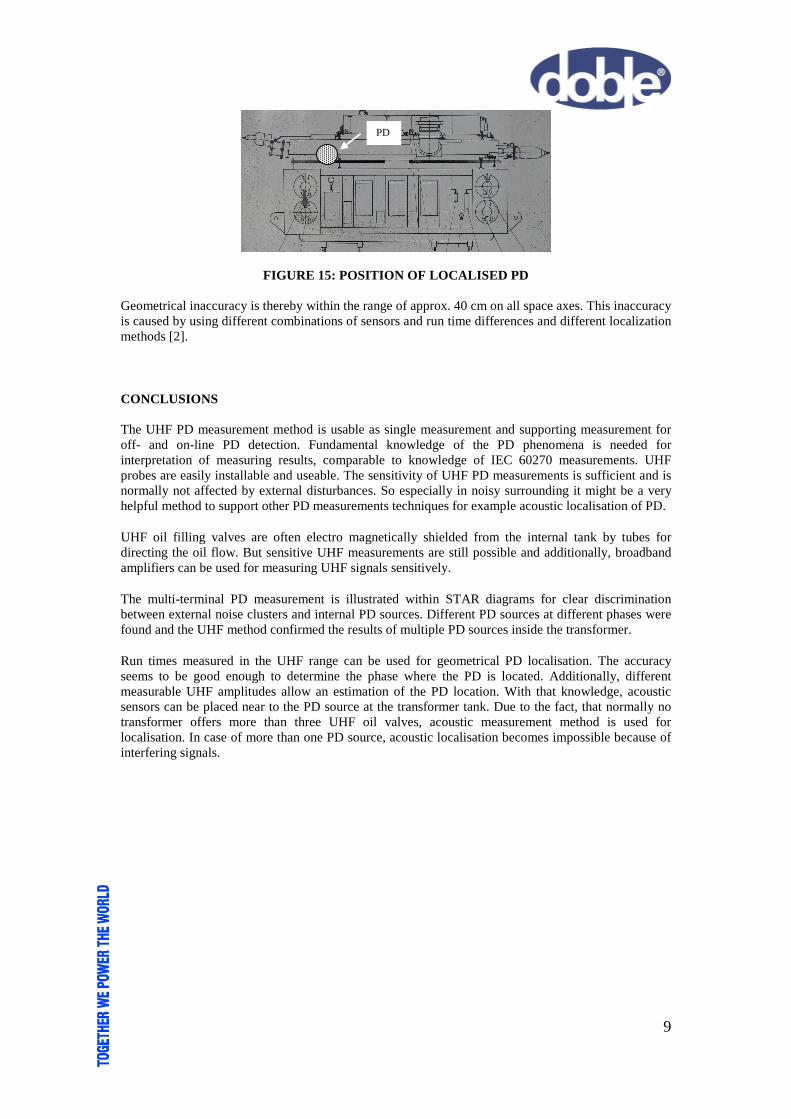
PD effects produce acoustic waves, which are measured with piezo-electric microphones. Their measurable frequency range is between 50 and 200 kHz. Due to the ambient noise (corona in air) and the inherent noises of the transformer, the noise level in field for on line measurements is high and sensitive acoustic measurement are often not possible [8]. Additionally acoustic signals of PD experienced high attenuation inside transformers because of the internal structures. Summarizing, exclusive acoustic PD measurement or on-line monitoring is only useful to a limited extend. To increase the sensitivity of acoustic measurements the method is coupled with the more sensitive UHF measuring method. UHF signals are used as trigger signal to activate the acoustic measurement during the occurrence of UHF PD signals. By using averaged signals (averaging in time domain), the acoustic PD pulses remain whereas the white background noise is averaged to zero. Figure 14 defines the positions of the used acoustic sensors (A1 – A6).
FIGURE 14: POSITION OF ACOUSTIC SENSORS
UHF measuring method is based on electromagnetic waves, which spread with almost speed of light in the transformer. The speed of acoustic waves amounts to 1400 m/s, i.e. running times within the range of milliseconds are expected, supposed that UHF signals are detected almost the same time PDs occur. Geometrical distances between sensors and the source of PD (calculated from the run times of the individual acoustic sensors) result in a spherical area inside the transformer. With at least three acoustic sensors with corresponding run times, it is possible to determine the intersection of the spheres to determine thus the PD location. The run times of the acoustic signals can be computed objectively with the help of the Hinkley criterion [2]. It is based on the signal energy of the measured signal and results in an absolute minimum for the starting point of the signal.
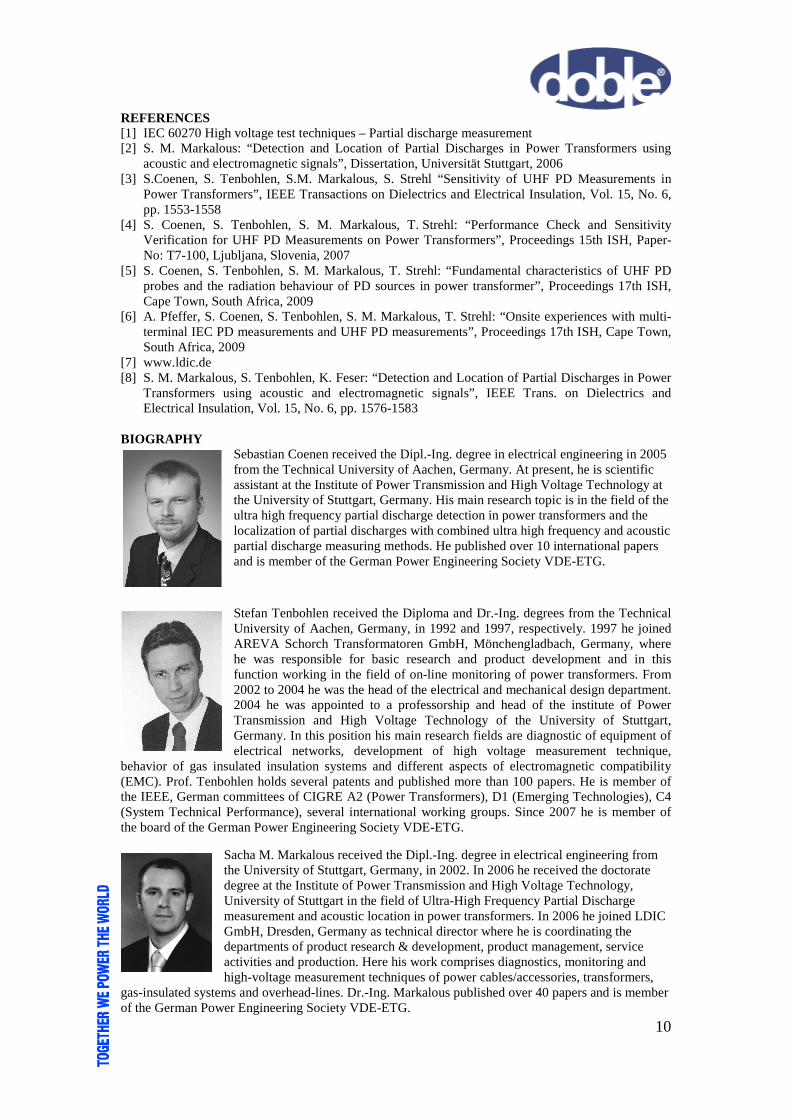
Like illustrated in Figure 15, the supposed position of the PD source is in the range of the tap changer.
A 1 A 3
A 5
A 2 A 4
A 6
Doble PowerTest Ltd. 5 Weyvern Park Peasmarsh, Guildford, Surrey GU3 1NA United Kingdom tel +44 (0) 1483 514120 fax +44 (0) 1483 514149 www.doble.com
9
FIGURE 15: POSITION OF LOCALISED PD Geometrical inaccuracy is thereby within the range of approx. 40 cm on all space axes. This inaccuracy is caused by using different combinations of sensors and run time differences and different localization methods [2].
CONCLUSIONS The UHF PD measurement method is usable as single measurement and supporting measurement for off- and on-line PD detection. Fundamental knowledge of the PD phenomena is needed for interpretation of measuring results, comparable to knowledge of IEC 60270 measurements. UHF probes are easily installable and useable. The sensitivity of UHF PD measurements is sufficient and is normally not affected by external disturbances. So especially in noisy surrounding it might be a very helpful method to support other PD measurements techniques for example acoustic localisation of PD.
UHF oil filling valves are often electro magnetically shielded from the internal tank by tubes for directing the oil flow. But sensitive UHF measurements are still possible and additionally, broadband amplifiers can be used for measuring UHF signals sensitively.
The multi-terminal PD measurement is illustrated within STAR diagrams for clear discrimination between external noise clusters and internal PD sources. Different PD sources at different phases were found and the UHF method confirmed the results of multiple PD sources inside the transformer.
Run times measured in the UHF range can be used for geometrical PD localisation. The accuracy seems to be good enough to determine the phase where the PD is located. Additionally, different measurable UHF amplitudes allow an estimation of the PD location. With that knowledge, acoustic sensors can be placed near to the PD source at the transformer tank. Due to the fact, that normally no transformer offers more than three UHF oil valves, acoustic measurement method is used for localisation. In case of more than one PD source, acoustic localisation becomes impossible because of interfering signals.
PD
Doble PowerTest Ltd. 5 Weyvern Park Peasmarsh, Guildford, Surrey GU3 1NA United Kingdom tel +44 (0) 1483 514120 fax +44 (0) 1483 514149 www.doble.com
10
REFERENCES [1] IEC 60270 High voltage test techniques – Partial discharge measurement [2] S. M. Markalous: “Detection and Location of Partial Discharges in Power Transformers using
acoustic and electromagnetic signals”, Dissertation, Universität Stuttgart, 2006 [3] S.Coenen, S. Tenbohlen, S.M. Markalous, S. Strehl “Sensitivity of UHF PD Measurements in
Power Transformers”, IEEE Transactions on Dielectrics and Electrical Insulation, Vol. 15, No. 6, pp. 1553-1558
[4] S. Coenen, S. Tenbohlen, S. M. Markalous, T. Strehl: “Performance Check and Sensitivity Verification for UHF PD Measurements on Power Transformers”, Proceedings 15th ISH, Paper-No: T7-100, Ljubljana, Slovenia, 2007
[5] S. Coenen, S. Tenbohlen, S. M. Markalous, T. Strehl: “Fundamental characteristics of UHF PD probes and the radiation behaviour of PD sources in power transformer”, Proceedings 17th ISH, Cape Town, South Africa, 2009
[6] A. Pfeffer, S. Coenen, S. Tenbohlen, S. M. Markalous, T. Strehl: “Onsite experiences with multi-terminal IEC PD measurements and UHF PD measurements”, Proceedings 17th ISH, Cape Town, South Africa, 2009
[7] www.ldic.de [8] S. M. Markalous, S. Tenbohlen, K. Feser: “Detection and Location of Partial Discharges in Power
Transformers using acoustic and electromagnetic signals”, IEEE Trans. on Dielectrics and Electrical Insulation, Vol. 15, No. 6, pp. 1576-1583
BIOGRAPHY
Sebastian Coenen received the Dipl.-Ing. degree in electrical engineering in 2005 from the Technical University of Aachen, Germany. At present, he is scientific assistant at the Institute of Power Transmission and High Voltage Technology at the University of Stuttgart, Germany. His main research topic is in the field of the ultra high frequency partial discharge detection in power transformers and the localization of partial discharges with combined ultra high frequency and acoustic partial discharge measuring methods. He published over 10 international papers and is member of the German Power Engineering Society VDE-ETG.
Stefan Tenbohlen received the Diploma and Dr.-Ing. degrees from the Technical University of Aachen, Germany, in 1992 and 1997, respectively. 1997 he joined AREVA Schorch Transformatoren GmbH, Mönchengladbach, Germany, where he was responsible for basic research and product development and in this function working in the field of on-line monitoring of power transformers. From 2002 to 2004 he was the head of the electrical and mechanical design department. 2004 he was appointed to a professorship and head of the institute of Power Transmission and High Voltage Technology of the University of Stuttgart, Germany. In this position his main research fields are diagnostic of equipment of electrical networks, development of high voltage measurement technique,
behavior of gas insulated insulation systems and different aspects of electromagnetic compatibility (EMC). Prof. Tenbohlen holds several patents and published more than 100 papers. He is member of the IEEE, German committees of CIGRE A2 (Power Transformers), D1 (Emerging Technologies), C4 (System Technical Performance), several international working groups. Since 2007 he is member of the board of the German Power Engineering Society VDE-ETG.
Sacha M. Markalous received the Dipl.-Ing. degree in electrical engineering from the University of Stuttgart, Germany, in 2002. In 2006 he received the doctorate degree at the Institute of Power Transmission and High Voltage Technology, University of Stuttgart in the field of Ultra-High Frequency Partial Discharge measurement and acoustic location in power transformers. In 2006 he joined LDIC GmbH, Dresden, Germany as technical director where he is coordinating the departments of product research & development, product management, service activities and production. Here his work comprises diagnostics, monitoring and high-voltage measurement techniques of power cables/accessories, transformers,
gas-insulated systems and overhead-lines. Dr.-Ing. Markalous published over 40 papers and is member of the German Power Engineering Society VDE-ETG.
Related Documents


