ETHNIC RESIDENTIAL PATTERNS AS PREDICTORS OF INTRA- URBAN CHILD MORTALITY INEQUALITY IN ACCRA, GHANA 1 John R. Weeks 2 , Department of Geography, San Diego State University Allan G. Hill, Harvard School of Public Health, Harvard University Arthur Getis, and Department of Geography, San Diego State University Douglas Stow Department of Geography, San Diego State University Abstract As cities of developing nations absorb an increasing fraction of the world’s population increase, questions have arisen about the potential for emerging inequalities in health within places that are already suffering from inadequate infrastructure. In this paper we explore the pattern of child mortality inequalities (as a proxy for overall health levels) within a large sub-Saharan African city —Accra, Ghana—and then we examine the extent to which existing residential patterns by ethnicity may be predictive of any observed intra-urban inequalities in child mortality. We find that the spatial variability in child mortality in Accra is especially associated with the pattern of residential separation of the Ga from other ethnic groups, with the Ga having higher levels of mortality than other ethnic groups. Being of Ga ethnicity exposes a woman and her children to characteristics of the places in Accra where the Ga live, in which one-room dwellings and poor infrastructure predominate. At the individual level, we find that regardless of where a woman lives, if she is of Ga ethnicity and/or is non-Christian, and if she is not married, her risks of having lost a child are elevated. Keywords ethnicity; residential patterns; child mortality; urban; Accra; Ghana INTRODUCTION Most of the world’s population increase over the next few decades is expected to show up in the cities of developing countries (United Nations Population Division, 2006). This will be accomplished through migration from rural to urban areas, draining rural areas of their excess natural increase, along with rates of natural increase in these cities that are already well above replacement level, and also by the spread of cities into surrounding rural areas. This urban transition is occurring within built environments that are already overburdened and, as a result, 1 This research was supported by grant number R21 HD046612-01 from the National Institute of Child Health and Human Development. We also acknowledge the assistance of Measure DHS in making available the Demographic and Health Survey Data for Ghana. Molly Schmelze provided invaluable assistance with the mapping of boundaries. This is a revision of a paper presented at the Annual Meeting of the Association of American Geographers, Denver, Colorado, April 2005. 2Correspondence concerning this article should be addressed to John R. Weeks, Department of Geography, San Diego State University, San Diego, CA 92182-4493; telephone: 619-594-8040; fax: 619-594-4938; e-mail: [email protected]. NIH Public Access Author Manuscript Urban Geogr. Author manuscript; available in PMC 2009 October 7. Published in final edited form as: Urban Geogr. 2006 January 1; 27(6): 526–548. NIH-PA Author Manuscript NIH-PA Author Manuscript NIH-PA Author Manuscript

Welcome message from author
This document is posted to help you gain knowledge. Please leave a comment to let me know what you think about it! Share it to your friends and learn new things together.
Transcript
ETHNIC RESIDENTIAL PATTERNS AS PREDICTORS OF INTRA-URBAN CHILD MORTALITY INEQUALITY IN ACCRA, GHANA1
John R. Weeks2,Department of Geography, San Diego State University
Allan G. Hill,Harvard School of Public Health, Harvard University
Arthur Getis, andDepartment of Geography, San Diego State University
Douglas StowDepartment of Geography, San Diego State University
AbstractAs cities of developing nations absorb an increasing fraction of the world’s population increase,questions have arisen about the potential for emerging inequalities in health within places that arealready suffering from inadequate infrastructure. In this paper we explore the pattern of childmortality inequalities (as a proxy for overall health levels) within a large sub-Saharan African city—Accra, Ghana—and then we examine the extent to which existing residential patterns by ethnicitymay be predictive of any observed intra-urban inequalities in child mortality. We find that the spatialvariability in child mortality in Accra is especially associated with the pattern of residential separationof the Ga from other ethnic groups, with the Ga having higher levels of mortality than other ethnicgroups. Being of Ga ethnicity exposes a woman and her children to characteristics of the places inAccra where the Ga live, in which one-room dwellings and poor infrastructure predominate. At theindividual level, we find that regardless of where a woman lives, if she is of Ga ethnicity and/or isnon-Christian, and if she is not married, her risks of having lost a child are elevated.
Keywordsethnicity; residential patterns; child mortality; urban; Accra; Ghana
INTRODUCTIONMost of the world’s population increase over the next few decades is expected to show up inthe cities of developing countries (United Nations Population Division, 2006). This will beaccomplished through migration from rural to urban areas, draining rural areas of their excessnatural increase, along with rates of natural increase in these cities that are already well abovereplacement level, and also by the spread of cities into surrounding rural areas. This urbantransition is occurring within built environments that are already overburdened and, as a result,
1This research was supported by grant number R21 HD046612-01 from the National Institute of Child Health and Human Development.We also acknowledge the assistance of Measure DHS in making available the Demographic and Health Survey Data for Ghana. MollySchmelze provided invaluable assistance with the mapping of boundaries. This is a revision of a paper presented at the Annual Meetingof the Association of American Geographers, Denver, Colorado, April 2005.2Correspondence concerning this article should be addressed to John R. Weeks, Department of Geography, San Diego State University,San Diego, CA 92182-4493; telephone: 619-594-8040; fax: 619-594-4938; e-mail: [email protected].
NIH Public AccessAuthor ManuscriptUrban Geogr. Author manuscript; available in PMC 2009 October 7.
Published in final edited form as:Urban Geogr. 2006 January 1; 27(6): 526–548.
NIH
-PA Author Manuscript
NIH
-PA Author Manuscript
NIH
-PA Author Manuscript
we can anticipate that many areas within developing cities will become increasingly at risk ofpoor health outcomes. In attempting to understand this process, we are replacing our outmodednotion of a rural–urban dichotomy with a more nuanced view of human settlements asrepresenting a gradient of urbanness both within and between cities (Weeks, 2004; Weeks etal., 2005). The consequence of life along a gradient is that differences in urban characteristicsmay also be associated with inequalities and there is a small, but growing literature suggestingthat sharp inequalities in health are increasingly obvious within cities of developing countries(Montgomery et al., 2003; Montgomery and Hewett, 2005).
Our goal in this paper is to explore the existence of spatial inequalities in health outcomeswithin a major sub-Saharan African city—Accra, Ghana—and to evaluate the extent to whichthose inequalities are predicted by patterns of ethnic residential separation or segregation. Themost obvious potential source of variability in health within a city is the variation insocioeconomic status that exists from one neighborhood to another. People of different socialstrata are virtually never distributed in a random fashion within a city. Thus, to the extent thatpeople with more personal and social resources to maintain a high level of health are groupedresidentially together, and those with fewer of those resources are grouped with themselves,we can anticipate that spatial variability in health outcomes will follow the spatial distributionof socioeconomic status.
A confounding factor in cities within sub-Saharan Africa, however, is the existence of ethnicgroups which tend to reside within certain neighborhoods, rather than being randomlydistributed within a city. To the extent that ethnic groups encompass a range of socioeconomicstatuses within their membership, the consanguineous pattern of residence mixes up the spatialvariability by socioeconomic status and potentially makes it a less powerful predictor of healthinequalities than might otherwise be the case. It may be, then, that we cannot properlyunderstand health inequalities in a sub-Saharan city like Accra without taking ethnic residentialpatterns into account.
THE LINK BETWEEN RESIDENTIAL SEGREGATION AND HEALTHThe literature linking ethnic differences to health and more specifically linking residentialsegregation to health differences is sparse, but there is an increasing body of evidence that avariety of place-based characteristics may have demonstrable impacts on the health of peoplein those places, net of their individual-level risk factors. For example, Timaeus and Lush(1995) used Demographic and Health Survey (DHS) data to show that within the same country,women in different urban areas experienced different levels of health. Weich and his associatesfound that characteristics of the built environment affected measures of depression in London(Weich et al., 2001). Fry et al. (2002) found that in Asia, children in slums had worse healthstatus indicators than children in non-slums. Rytkönen et al. (2001) observed considerablespatial variability in mortality within the city of Oulu, Finland, using the interesting approachof draping a one kilometer grid over the city and measuring death rates within each grid, andthen measuring the resulting spatial variability, which they attribute to differences in thecharacteristics of different places within the city.
The variety of approaches that researchers have taken to link place and health led MacIntyreand her associates to review this literature and propose a conceptual framework that mightmore adequately define exactly what the characteristics of place are that would have an impacton health (MacIntyre et al., 2002; MacIntyre and Ellaway, 2003). In particular, they noted that“few investigators have attempted to hypothesize what features of the local social or physicalenvironment might influence health, and then tested these hypotheses” (MacIntyre et al.,2002, p. 129). Although their work has focused on the west of Scotland, there are presumablycertain kinds of characteristics that make some neighborhoods healthier than others, and they
Weeks et al. Page 2
Urban Geogr. Author manuscript; available in PMC 2009 October 7.
NIH
-PA Author Manuscript
NIH
-PA Author Manuscript
NIH
-PA Author Manuscript
suggested an approach that relies on Maslow’s (1986) hierarchy of human needs. In order ofimportance as derived by Maslow, these include clean air, clean water, nutritious and non-toxicfood, adequate shelter, personal security from harm, hygienic protection, education, healing,housekeeping, work, means of exchange, information, transport, personal relationships,religious activities, participation in other group activities, and play. The ability of aneighborhood to meet these needs of its residents depends upon the society’s level ofdevelopment and wealth, and the geographic distribution of resources within that society. Itmay be possible to create proxies for these overall effects by measuring the materialinfrastructure and collective social functioning, but it is important that we attempt to identifythe pathways by which different aspects of place might influence health. This is complicatedby the fact that each measure of health status may have a different local pathway, and therelevance of those pathways may vary by spatial scale. In short, no matter how much we maybelieve that place affects health, it is not a straightforward task to demonstrate that relationship,and researchers need to lay out their case as carefully as possible.
With those major caveats in mind, we pursue the following major hypotheses as they relate tothe impact of ethnic residential patterns on health within Accra: (1) that ethnic intergroupdifferences may influence the health status of their respective members; and (2) the spatialclustering of ethnic groups (residential segregation) will interact with intergroup differencesto exacerbate any observed health differences among groups.
Ethnic intergroup differences can be divided broadly into: (1) the environmental context inwhich people live, such as the type of housing arrangements and building materials that groupsemploy; (2) the social environment in which people live, including the occupations and thusincomes that different groups see as appropriate for themselves, as well as the extent to whichwomen and children are discriminated against, producing inferior health outcomes for thatsegment of a group’s membership; and (3) the health-seeking behavior of the group in termsof the use of vaccinations, Western medicine versus traditional healers, and attendance at healthclinics and hospitals. All of these cultural practices assume that even when similarly situatedeconomically, some groups may make different choices than other groups and that somechoices may serendipitously be associated with better health outcomes than other choices.
The impact of ethnicity on health in sub-Saharan Africa has not been widely examined.Schellenberg et al. (2003) conducted a Medline search that produced only 102 articles oninequalities of health in sub-Saharan Africa compared to 1,151 in the Americas. Importantly,nearly all of the studies of inequality relating to ethnicity referred specifically to South Africa.One of the more relevant of the articles for sub-Saharan Africa is based on data from theDemographic and Health Surveys in the region, showing that differences in child immunizationrates vary by ethnicity (Brockerhoff and Hewett, 2000). Childhood immunizations bear anobvious relationship to survival among children and survival to adulthood, so that is animportant finding. Brockerhoff and Hewett found specifically for Ghana that members of theAshanti ethnic group were more likely to immunize their children than were members of othergroups. Lado (1992) has observed that the marginalization of women by some ethnic groupsin Africa, particularly in rural areas, may lead to nutritional deficiencies and thus poorer health.Different ethnic groups also have different patterns of polygyny, which may influence thehealth of women within those unions compared to women in monogamous unions, althoughpolygynous unions are much less common in urban than in rural areas (Timaeus and Reynar,1998).
Inequality among groups is largely expected to have the consequence of lowering one or moregroup’s access to higher status occupations and income, limiting the access to health resources,and potentially forcing people into more densely settled neighborhoods with fewer healthamenities. Balk and her associates (Balk et al., 2003) have used Demographic and Health
Weeks et al. Page 3
Urban Geogr. Author manuscript; available in PMC 2009 October 7.
NIH
-PA Author Manuscript
NIH
-PA Author Manuscript
NIH
-PA Author Manuscript
Survey data to show that throughout West Africa the risk of infant death is closely associatedwith the education of mothers and access to clean water and toilet facilities. They did not,however, examine these factors in relation to ethnicity. Schellenberg et al. (2003) found a clearpattern in rural Tanzania for the least well-off families to be significantly less likely to seekhealth care for their ill children, but they did not examine ethnic-specific differences. Note thatit is not necessarily easy to sort out the evidence for cultural differences in health outcomescompared to the effect of income inequality.
The most egregious form of inequality is that which imposed upon a group throughdiscriminatory practices, but there is little evidence of this among Black African ethnic groups.The literature on discrimination as it affects health tends to focus on discrimination againstBlacks in the United States, South Africa, and the United Kingdom (Acevedo-Garcia andLochner, 2003). By implication, most other patterns of residential segregation may be due moreto self-segregation than to forced segregation. Having said this, however, it is important toremember that the history of a city such as Accra is marked by a relatively formal colonialpattern of segregation of Europeans from Africans, existing alongside the self-separation ofdifferent groups from each other (Gugler and Flanagan, 1978; Parker, 2000). Even afterindependence these patterns have remained, despite not being enforced in any official way.
Very little attention has been paid to the social, economic, and health consequences ofresidential segregation by ethnic group outside of the richer nations, with the notable exceptionof Apartheid in South Africa (e.g., Benatar, 1988). It has of course been well-studied in theUnited States, focusing especially on the residential patterns of Blacks compared to Whites(Farley, 1970, 1976, 1984; Clark, 1991; Massey and Denton, 1993; Farley and Frey, 1994;Allen and Turner, 1996; Farley et al., 2000; Emerson et al., 2001), but extended to Hispanicsand Asian groups, as well (Allen and Turner, 1996; Logan et al., 2002). Outside the UnitedStates (and outside of South Africa), residential segregation has received the greatest attentionin Europe, and especially within the United Kingdom, largely with respect to the enclaves ofimmigrants from developing societies (Peach et al., 1981; Van Kempen and Van Weesep,1998; Leloup, 1999; Musterd and Deurloo, 2002; Veldboer et al., 2002).
In sub-Saharan Africa the most relevant cultural traits that might differentiate people socially,economically, and residentially, are related to ethnicity, often linked to mother tongue, whichalso influences religious preference and even the likelihood of migrating within Africa (Anarfi,1993; Bloom, 1998; Forrest, 2004). Within the literature on ethnic group differences in sub-Saharan Africa, two themes seem to dominate: (1) differences have often led to inter-ethnicviolence; and (2) ethnic differences are viewed largely from a rural perspective because it isthere that cultural identities appear to be strongest. To date, there has been almost no researchconducted on the impact of ethnic differences within urban areas of sub-Saharan Africa. Onlyin the Republic of South Africa has there been attention paid to the issue of residentialsegregation (Benatar, 1988), but there the concern has been Black–White differences and therehas been little attention, at least in the literature, to disparities among Black ethnic groups. Themajor research questions have focused on the colonial policies of segregating Europeans fromothers, rather than on differentiation among indigenous groups.
Ethnicity within cities takes on special relevance, however, because it is largely in the citiesthat different ethnic groups interact in an environment in which inter-group rivalry isconstrained by the social structure—cities could not survive if groups did not dampen anyinherent animosity that might exist. That does not mean, however, that ethnicity is notimportant; only that its importance may be more subtle than it would be in rural areas. In mostsub-Saharan African countries, some ethnic groups are economically, culturally, and politicallymore influential than others, and to the extent that this is true, the result may be to producepatterns of residential segregation or separation by ethnic group that may, in turn, lead to
Weeks et al. Page 4
Urban Geogr. Author manuscript; available in PMC 2009 October 7.
NIH
-PA Author Manuscript
NIH
-PA Author Manuscript
NIH
-PA Author Manuscript
disparities in health levels as a result of differential access to income, healthy environments,and health facilities.
In this study there are four major questions that we wish to answer, derived from the majorhypotheses listed above: (1) What is the spatial pattern of health inequalities within the city ofAccra? (2) What is the pattern of residential segregation or separation among ethnic groups inAccra? (3) Is the spatial pattern of residential separation predictive of spatial disparities inhealth? If so, (4) what are the differences among ethnic groups that seem to account for thehealth inequalities?
DATA AND METHODSStudy Site
Accra has been the capital of Ghana since 1877, and its history dates back to the late 15thcentury when the Portuguese built a small fort on the site (Robertson, 1984). For nearly 200years the Europeans tended to stay on the coast and the Africans were inland. However, in thelate 17th century the Ga people relocated to Accra following a violent conflict with the Akwamupeople (Akan ethnic group), who were reportedly jealous of the wealth generated by the Ga intheir role as intermediaries between the Europeans and other African groups in the lucrativetrade in gold and slaves—cocoa was not introduced into the area until the late 19th century(Acquah, 1958). The Ga had been headquartered at Ayawaso, which is now part of the GreaterAccra Metropolitan Area, but the battle with the Akwamu sent them to the coast, where theyhave remained since (Parker, 2000). The Dutch, Danes, Swedes, and British all replaced thePortuguese as the European powers in the area, but it was the British who, by the late 19thcentury, had the strongest hold on the area. The British at that time attacked the Ashanti capitalin Kumasi and declared the area (then known as the Gold Coast) to be a crown colony andmoved the capital to Accra.
The original parts of the city owe nominal allegiance to the more important European colonizers—Christiansborg Castle which the Danes had built, Ushertown where the Dutch had presided,and Jamestown where the British presided. Twenty-first century Greater Accra is a sprawlingurban area of nearly two million people and the neighborhoods reflect multiple strands ofhistory, including: (1) British-imposed residential segregation by race until 1923; (2) thedevelopment of elite areas populated largely by Europeans; (3) parts of the city such as “NewTown” that have been reception areas for migrants into the metropolis; and (4) the general lackof an urban plan, leading to wide disparities in neighborhood formality and infrastructure.
DataThe data for our analysis come from two sources. The first set of data is from an anonymized10% random sample of individual-level census returns from the 2000 Census of Populationand Housing for Accra. These data are comparable to the Public Use Microdata Sample(PUMS) data from the U. S. Censuses of Population and Housing. The sample was created forus by Ghana Statistical Service for the Greater Accra Metropolitan Area. For each of the 1,724enumeration areas (EAs) within Accra, a 10% sample of all records was chosen, resulting ina self-weighted sample for each EA. Because of the relatively small number of cases per EA(a function of the small geographic size of many EAs), we will aggregate the data at the nexthighest level of administrative boundaries known as localities, of which there are 43 in Accra.We will use these data to create measures of ethnic segregation within Accra, and to create ameasure of child mortality.
Our second source of data is from the Ghana Demographic and Health Surveys (DHS),conducted in 1998 and 2003, thus bracketing the census year of 2000. The depth and breadth
Weeks et al. Page 5
Urban Geogr. Author manuscript; available in PMC 2009 October 7.
NIH
-PA Author Manuscript
NIH
-PA Author Manuscript
NIH
-PA Author Manuscript
of the DHS provide a wide range of data, but with the disadvantage that the sample size forAccra is fairly small, thus limiting the extent to which we can analyze those data spatially.Thus, we use the census data to provide the detailed geographic coverage, employing as ourdependent variable the only health-related variable (referring to child survival) that is containedwithin the census data. But we will use the DHS data especially to provide details about thehealth of children among different ethnic groups within Accra.
Our dependent variable of interest is health (morbidity), which can obviously be measured inmultiple ways, but we are limited in this analysis to what can be derived from the census data.The most extreme measure of health and well-being is death (mortality) and, in fact, mortalityrates are the single most common measures of morbidity because there tend to be more andbetter data on mortality than on morbidity (Weeks, 2005). Since morbidity and mortality arehighly intercorrelated, the variability in mortality rates should closely track overall morbiditylevels in a population. Furthermore, the most sensitive aspects of mortality are those occurringat the younger ages, and the under-five mortality is a commonly used index of overall mortality(and thus morbidity) levels in a population. The proportion of children dying before reachingage five closely tracks the overall life expectancy in most populations (Coale and Demeny,1983; INDEPTH Network, 2004) and is indicative of the overall level of well-being of children.This proportion is typically referred to as Q5, which is short-hand for 5q0, the probability ofdying between birth and exact age five.
The calculation of under-five mortality technically requires a complete reproductive history ofwomen, such as those collected in the Demographic and Health Surveys. However, the humanregularities associated with patterns of death allow us to make reasonable inferences about thisprobability from the two questions asked on the census about (1) children ever born to a womanand (2) the number of those children who are still surviving. These two questions do not directlyallow us know what fraction of children born died before reaching age 5, but the work ofWilliam Brass (e.g., Brass, 1971) and his successors has demonstrated that empirically the ratioof children dead to children born to woman aged 30–34 is a very close approximation to under-five mortality (Popoff and Judson, 2004). The principal caveat in interpreting these rates is thatthe time reference is somewhat uncertain, because some of the deaths may have occurred morethan 15 years ago if a woman now aged 30–34 was married at a young age. This can be aproblem if the concern is capturing recent changes in morbidity and mortality, but our interestis in comparing rates in different places at the same point in time, so this should be less of aconcern for us than might otherwise be the case.
Our anonymized census sample file contains data for 6,905 women aged 30–34 in 2000(representing a total of 69,050 such women), of whom 5,655 had given birth to at least onechild. For Accra overall, these data suggest an under-five mortality for boys of 154 deaths byage five per 1,000 live births, and for girls the rate is 148 per 1,000. These rates are somewhathigher than data for Ghana obtained in the 1998 Demographic and Health Survey, even whenlooking at the time reference from that survey of 10–14 years prior to the survey (GhanaStatistical Service and Macro International Inc., 1999). At the same time, we can note that theDemographic and Health Surveys have generated lower estimates of mortality than theDemographic Surveillance System site in Navrongo, Ghana (INDEPTH Network, 2004), so itis not certain that the DHS levels are under-reporting levels of mortality in Ghana, but that isat least possible.
We have plugged the under-five mortality rates into model life tables for West Africa, ascalculated by the INDEPTH Network (2004), to yield life expectancies at birth in Accra of 55years for females and 52 for males. These levels are slightly lower than those reported by theUnited Nations Population Division for Ghana (United Nations Population Division, 2005),
Weeks et al. Page 6
Urban Geogr. Author manuscript; available in PMC 2009 October 7.
NIH
-PA Author Manuscript
NIH
-PA Author Manuscript
NIH
-PA Author Manuscript
but the likely explanation is that the United Nations is heavily dependent upon the Demographicand Health Surveys for its estimates.
In order to disentangle the effects of ethnicity and place of residence (in terms of residentialsegregation) on child mortality, we need data not only at the neighborhood level, but also atthe level of the individual woman. However, since a woman with one child dead may be morelikely to have another child die, we can control for this type of autocorrelation by dichotomizingthe variable into whether or not a woman aged 30–34 who has had a child born alive has thenhad one or more of those children die as of the census date. Of the 5,655 women aged 30–34who had given birth to at least one child, 28% had lost at least one of those children by thetime of the census. Our dependent variable at the neighborhood level reflects this samecalculation, and is the proportion of mothers aged 30–34 who have lost at least one child, andserves as the proxy for the level of child mortality.
The key predictor variables of interest are (1) neighborhood of residences, (2) ethnicity perse, and then (3) more specifically the pattern of residential segregation or separation byethnicity. The concept of neighborhood is not well defined in the literature and most researchersface the same situation as do we with respect to Accra: Data are collected in the census forpredetermined administrative units and they necessarily form the primary building blocks ofany definition of neighborhood. The basic unit of analysis in the 2000 census of Ghana is theenumeration area (EA), of which there are 1,724 within Accra. However, the EAs are smallenough geographically that some of them have few or even no women aged 30–34. For thisreason, we moved up one administrative level, to the locality, for our analysis. There are 43localities within Accra and enough women aged 30–34 in each locality to have sufficientstatistical power for the intended spatial analysis.
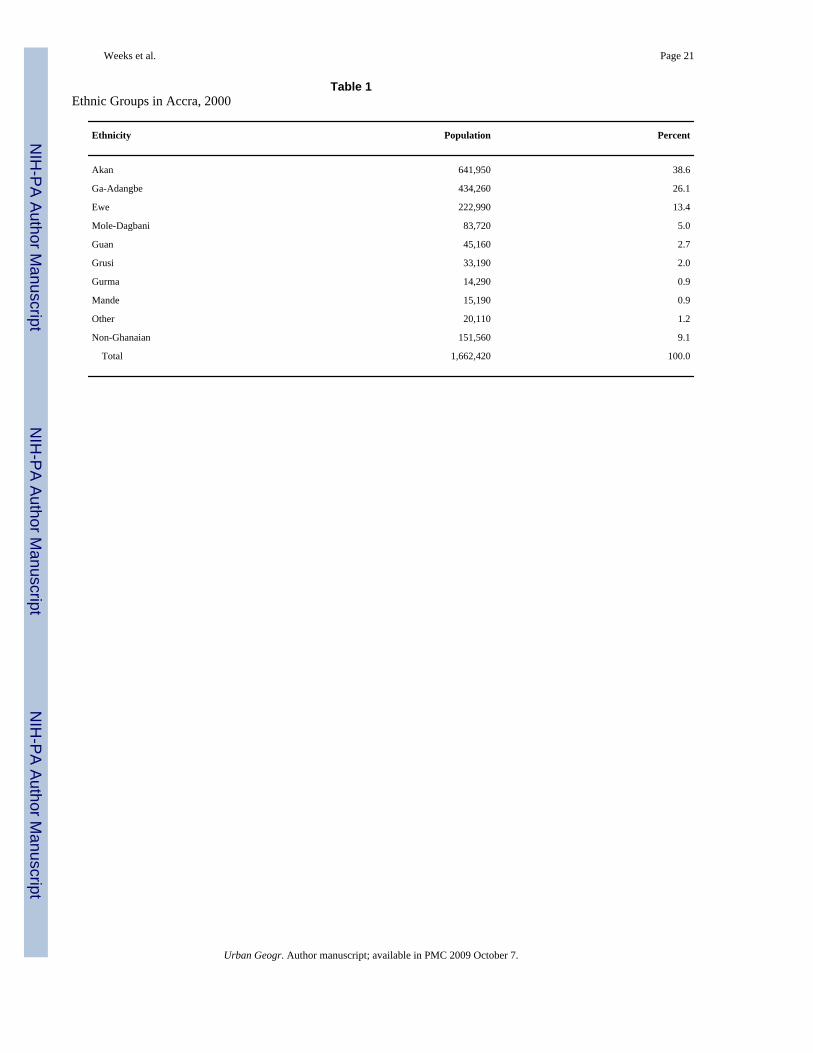
With respect to ethnicity, the population of Accra incorporates members of all of the majorethnic groups in Ghana, and Table 1 shows the census categorizations available to us. Thelargest group, accounting for 38.6% of the population, is the Akan, a grouping that includesAshanti and Fanti, as well as Akuapim, Akyem, and Kwahu. The second most important groupnumerically are the Ga-Adangbe, which includes the Ga and the Adangbe—people of the Accraplains. They account for 26.1% of the total population. Thus, the Akan (largely Ashanti) andthe Ga-Adangbe (largely Ga) account for two-thirds of all Accra residents. Historically, theancient kingdom of Ghana was in the central part of the area comprising the modern country,and the coastal area now occupied by Accra was only sparsely inhabited until about the timethat Europeans began to explore and exploit the area. However, the Ga were the first to movethere, as noted above, and for that reason were able to establish some of the earliest and stillprevalent residential patterns.
The Ewe are the third most populous group. They are largely from the southeastern part ofGhana, between Accra and the border with Togo. The fourth most numerous group is the Mole-Dagbani, also known as Dagomba. They originate in the northern part of Ghana (and intoBurkina Faso) and are heavily influenced by Islam. The Guan are from the northeastern partof the country, but are generally not Muslim. Among the less populous groups, the Gurma andGrusi have their origins in the northern part of Ghana, while the Mande represent a diversewest African ethnic group.
Our interest is not only in ethnicity, but also in the effect of residential segregation by ethnicgroup. We want to know if being embedded within a residentially segregated neighborhoodhas an impact on health. Since there is little evidence of forced segregation by ethnicity withinAccra, the segregation is perhaps more comparable to an enclave effect. We know that in someinstances, such as among Hispanic immigrants in the United States, residence in an ethnicenclave may confer some positive benefits for reproductive health (Weeks et al., 1999; LeClere
Weeks et al. Page 7
Urban Geogr. Author manuscript; available in PMC 2009 October 7.
NIH
-PA Author Manuscript
NIH
-PA Author Manuscript
NIH
-PA Author Manuscript
and Sen, 2001; Peak and Weeks, 2002), but the effect may well be negative for the localpopulation. Thus, we will examine global measures of residential segregation among ethnicgroups, and we will examine patterns at the neighborhood levels, as well as at the individuallevel where we will use the percentage of a woman’s own ethnic group within her EA ofresidence as a measure of her residence within an enclave.
As a global measure of residential segregation we use Wong’s (2003, 2004) spatial index ofdissimilarity, D(s), which is defined as:
(1)
Where D is the widely used non-spatial index of dissimilarity and
(2)
where dij is the length of the shared boundary between areal units i and j, and |zi – zj| is thedifference in the proportion in the group in question between areal units i and j, and wherePi/Ai is the perimeter-area ratio for areal unit i, and MAX (P/A) is the maximum perimeter-arearatio among all areal units in the study. D(s) compares two groups at a time, but Wong hasproduced a multi-group index (S) that is based on the overlay of the standard deviational ellipsescalculated for each group.
Wong (2002) also created a local index of segregation that measures the interaction potentialamong different groups in adjacent polygons. However, that measure has the disadvantage ofbeing non-directional. Thus, a low percentage of Akan relative to Ga would produce a highsegregation index, but a high percentage of Akan relative to Ga would produce the same index.As a result, we have used the classic location quotient (LQ) as the local measure of segregationbetween any two sets of groups in area i:
(3)
where, as with D, a is the group of interest (e.g, the Akan) and b is the comparison group (e.g.,the Ga), and we are summing over all localities (the geographic units serving as proxies forneighborhoods). The LQ has a minimum value of zero, indicating the complete absence ofgroup a relative to group b, and values between zero and one indicate fewer of group a thanexpected given the spatial distribution of group b (so-called “cold spots”). A value of 1 indicatesparity between the two groups, and anything above 1 indicates more of group a than expected(“hot spots”). Since low values can go no lower than 0, whereas high values have no theoreticallimit, it is common to transform the location quotients logarithmically if the distribution isskewed (O’Donoghue and Gleave, 2004). However, in Accra the values were not high enoughabove one to be sufficiently skewed to induce us to introduce the logarithmic transformation.
Weeks et al. Page 8
Urban Geogr. Author manuscript; available in PMC 2009 October 7.
NIH
-PA Author Manuscript
NIH
-PA Author Manuscript
NIH
-PA Author Manuscript
RESULTSWhat Is the Spatial Pattern of Child Mortality Inequalities Within the City of Accra?
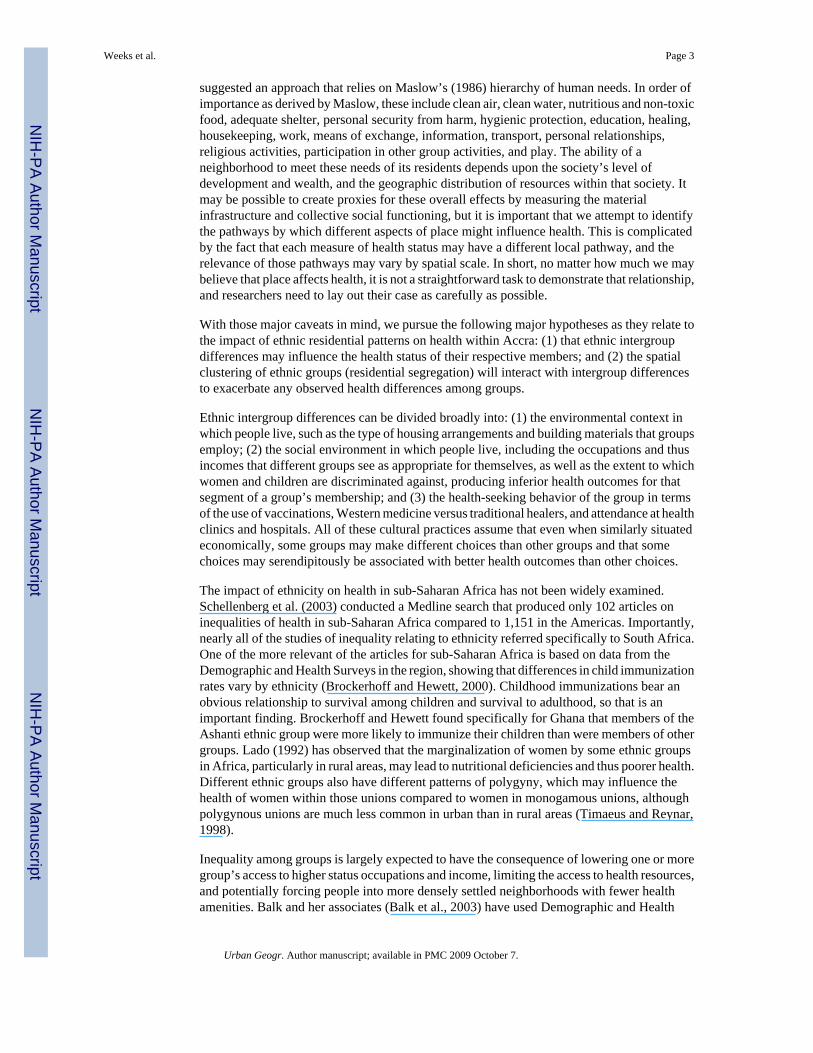
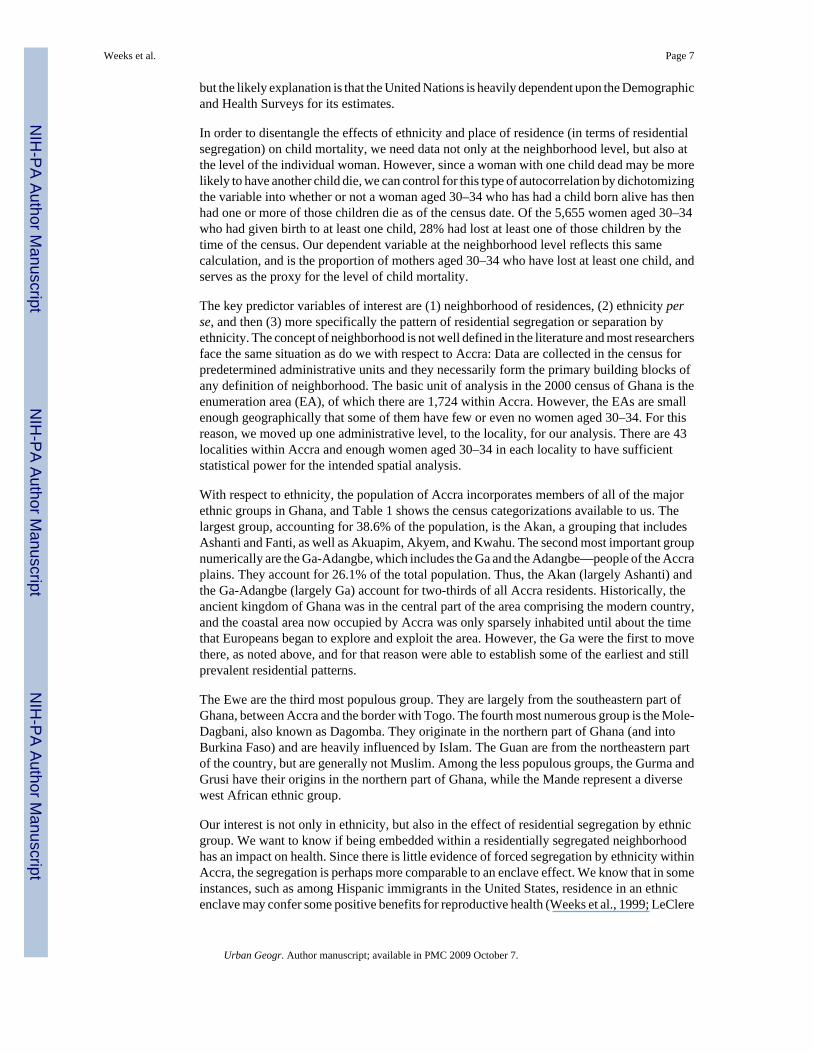
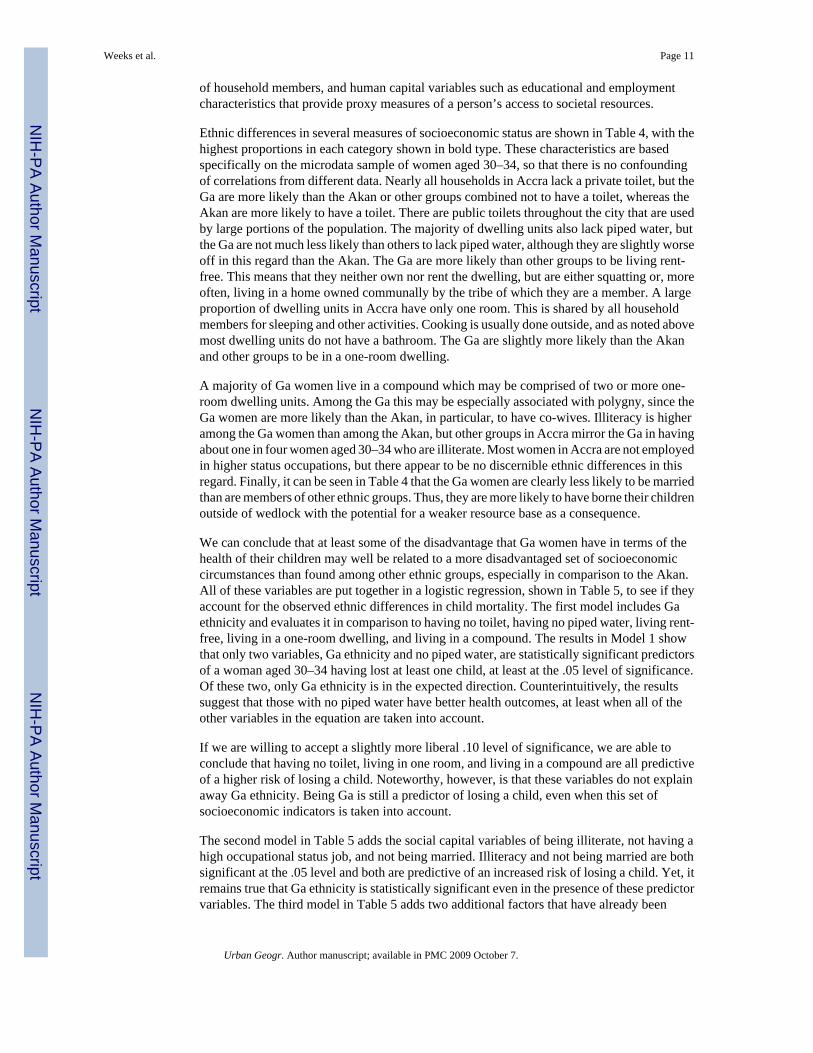
The first question that we ask is whether there is, in fact, any spatial variability in health withinAccra that merits further attention and consideration. Our measure of health refers to childmortality but, as discussed above, the literature suggests a close connection between childhoodmortality and the broader health context of an area. Figure 1 shows the spatial variability inunder-five mortality, measured as the proportion of women aged 30–34 in each locality thathad lost at least one child by that age. This proportion ranges from .13 (associated with a littlemore than 10% of children dying by age five) to .346 (associated with more than 30% ofchildren dying before their fifth birthday). There is obvious spatial variability in this index ofmortality/well-being, with higher proportions of children lost being particularly noticeable inthe southern parts of Accra near the coastline. The existence of spatial autocorrelation isconfirmed by the value of Moran’s I at a critical distance of 1500 meters, which is .67 with anormalized z-score of 3.34, indicating a statistically significant level of spatial autocorrelation.
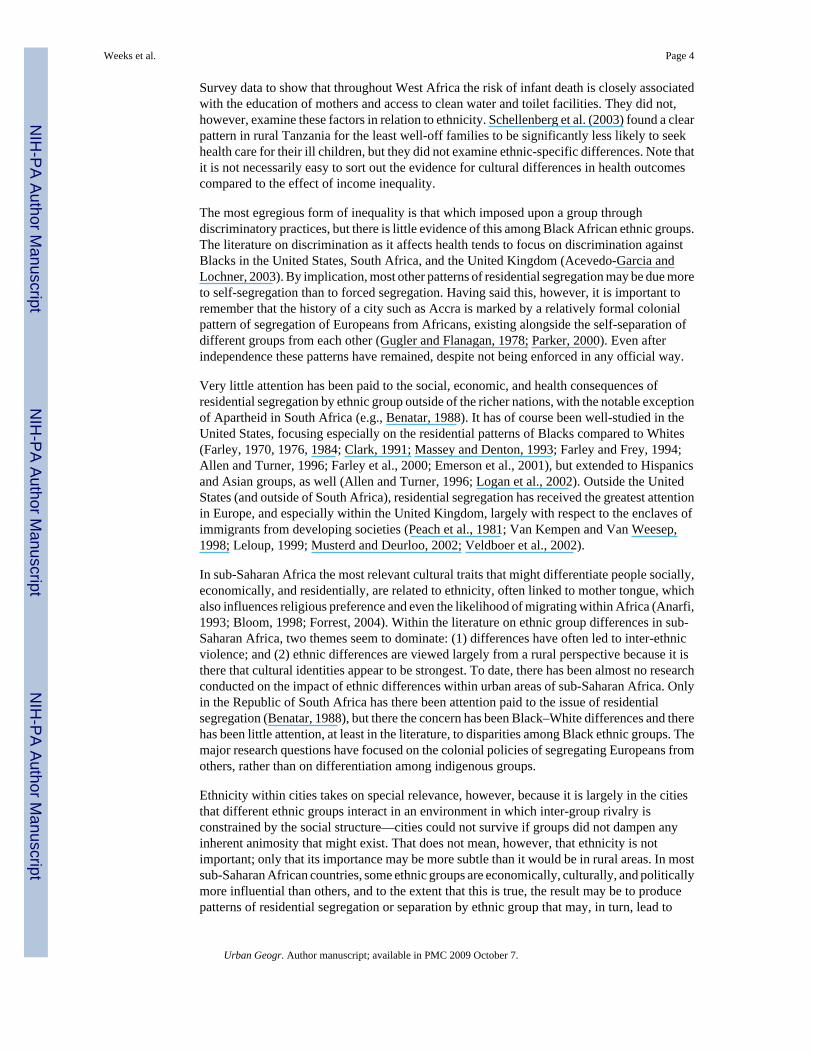
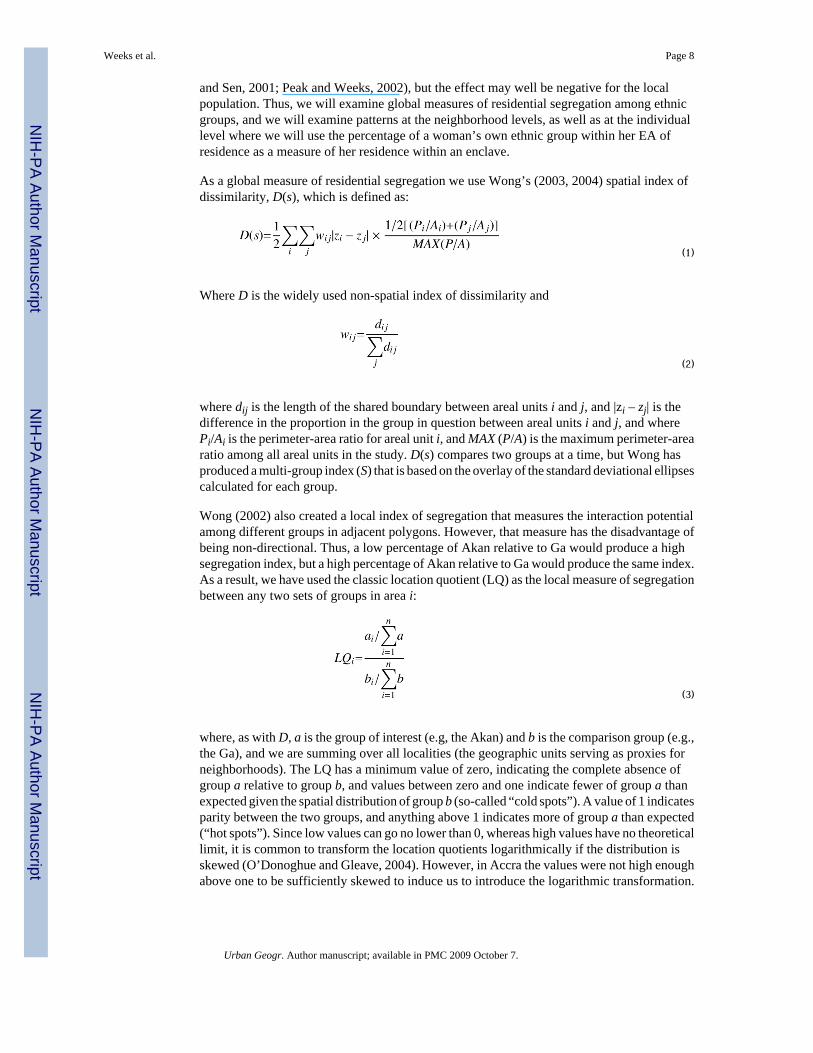
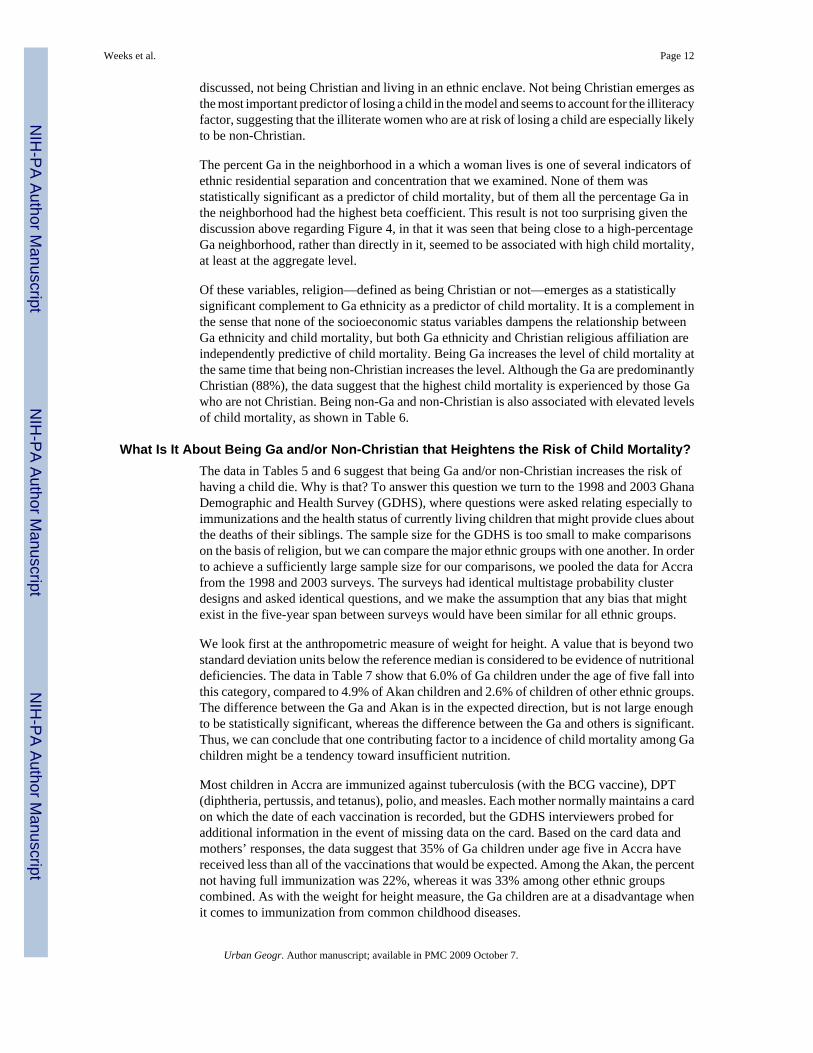
Using the G* statistic as a measure of local spatial autocorrelation, we have identified thoseareas in Accra that are “hot spots” with respect to child mortality. As can be seen in Figure 2,these include the older part of Accra near Ushertown and central Accra and also around Nima.These are areas that are popularly known in Accra to be slums and thus places where we wouldanticipate that health levels would be sub-normal.
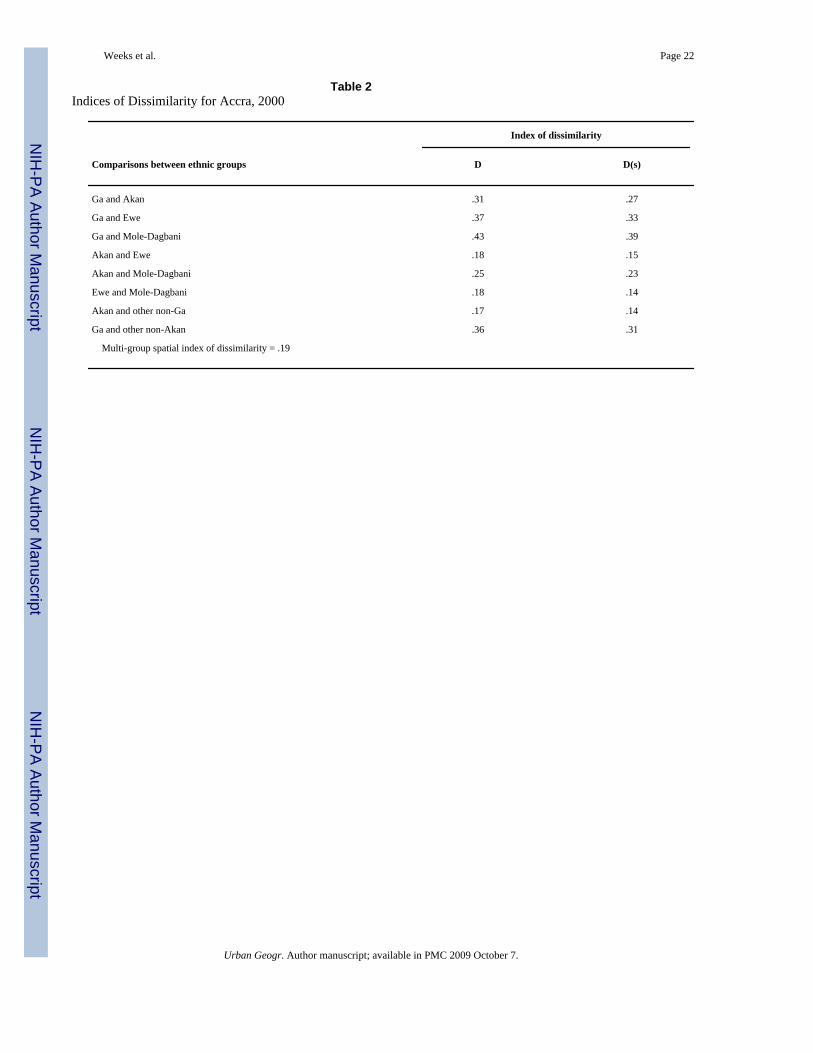
What Is the Spatial Pattern of Residential Segregation?There is variability in child mortality levels within Accra and this variability is not spatiallyrandom, but is clustered in specific parts of the city. If there is a correlation with residentialsegregation, then we expect to see the same spatial variability in that characteristic. First,however, we must establish that there is a global pattern of residential segregation, based onWong’s spatial index of dissimilarity. The results are shown in Table 2, where it can be seenthat the overall multi-group level of segregation is relatively modest at .19, which wouldnormally be interpreted as meaning that 19% of the population would have to move withinAccra in order to eliminate residential segregation. However, it can also be seen that somegroups are more segregated than others. Of the comparisons in Table 2, the top three values ofsegregation all involve the Ga, who are concentrated residentially in the older part of Accranear the original port area, and in general are along the coastline, rather than inland.
Since the largest ethnic groups are the Akan and Ga, accounting for about two-thirds of allAccra residents (Table 1), we will focus attention on the spatial pattern of segregation betweenthese two groups, and between them and all other groups. The data in Table 2 show that thespatial index of dissimilarity between the Akan and Ga is .27, suggesting that even after takingneighborhood adjacency into account, 27% of the Akan or Ga people would have to move inorder to eliminate the spatial mismatch in residency between the two groups. The spatial indexof dissimilarity between the Ga and all other non-Akan groups is .31.
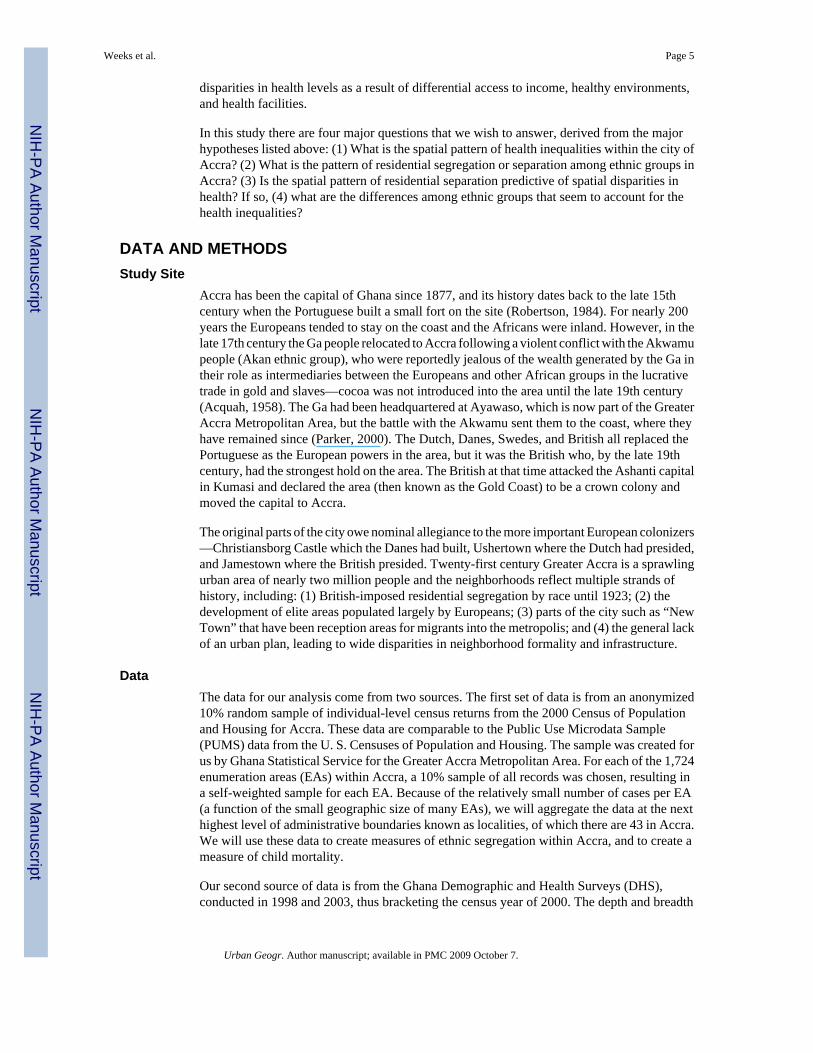
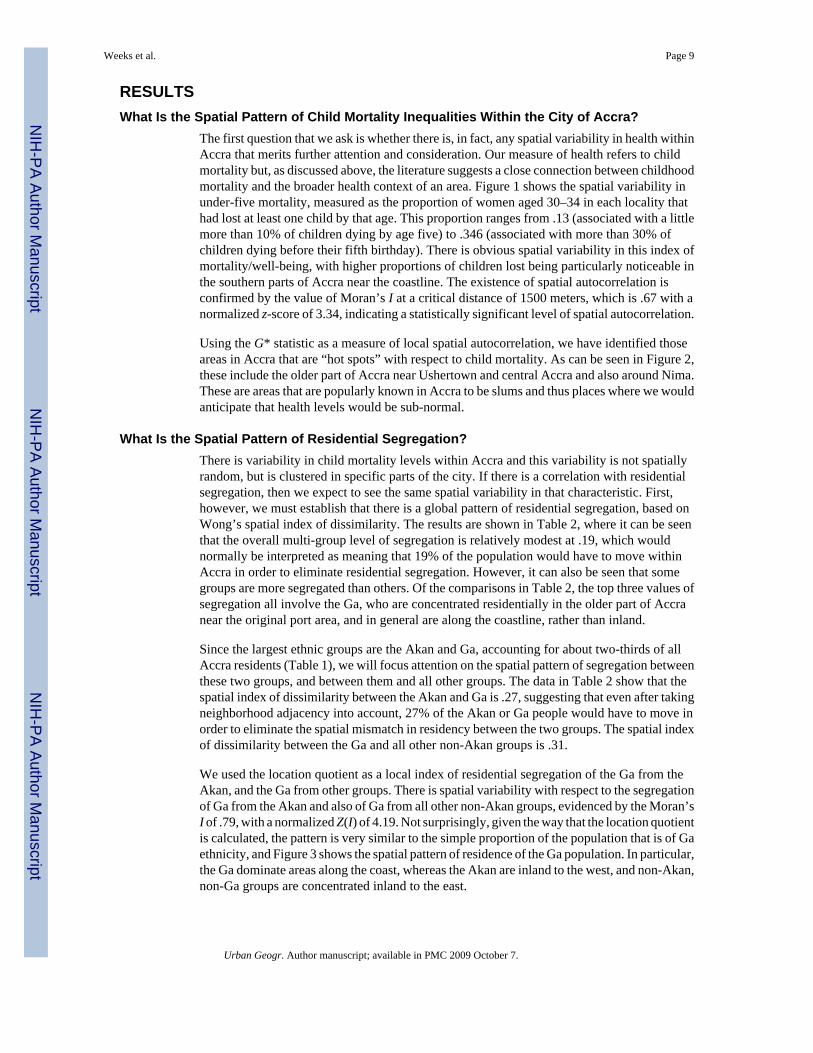
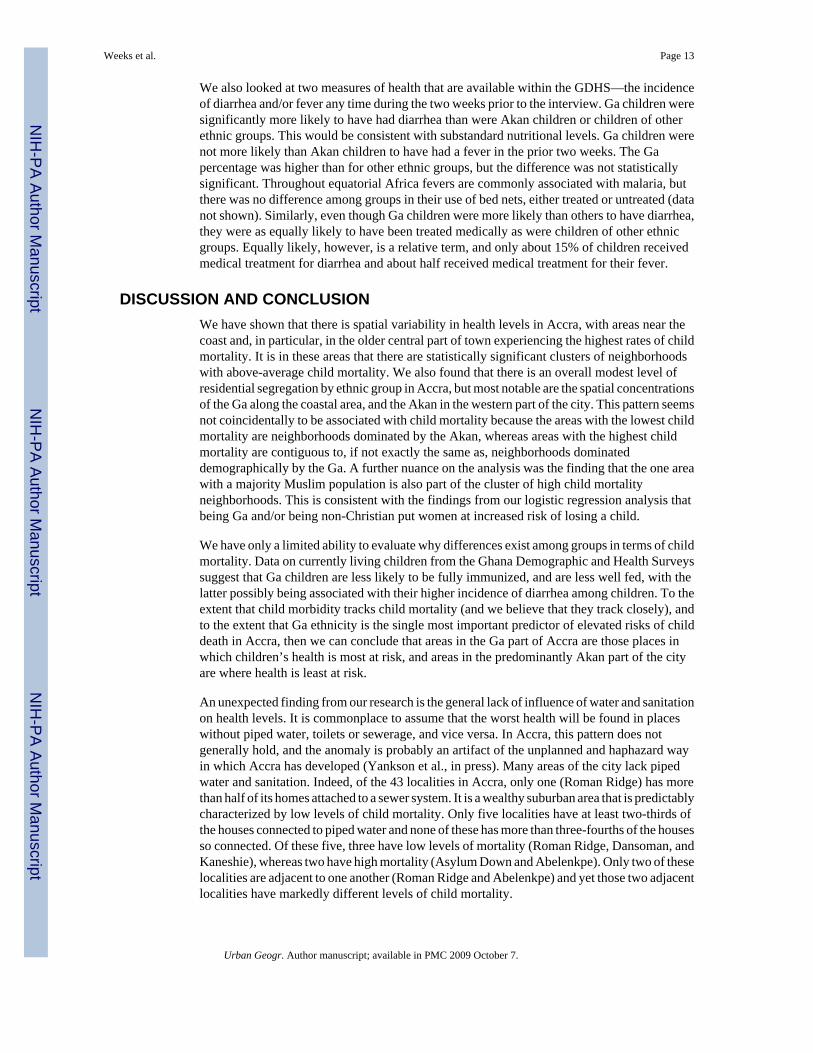
We used the location quotient as a local index of residential segregation of the Ga from theAkan, and the Ga from other groups. There is spatial variability with respect to the segregationof Ga from the Akan and also of Ga from all other non-Akan groups, evidenced by the Moran’sI of .79, with a normalized Z(I) of 4.19. Not surprisingly, given the way that the location quotientis calculated, the pattern is very similar to the simple proportion of the population that is of Gaethnicity, and Figure 3 shows the spatial pattern of residence of the Ga population. In particular,the Ga dominate areas along the coast, whereas the Akan are inland to the west, and non-Akan,non-Ga groups are concentrated inland to the east.
Weeks et al. Page 9
Urban Geogr. Author manuscript; available in PMC 2009 October 7.
NIH
-PA Author Manuscript
NIH
-PA Author Manuscript
NIH
-PA Author Manuscript
The residential pattern of ethnic groups in Accra is distinctive largely for the way in which theGa are concentrated along the coastal part of the city. Virtually every measure of segregation/separation produces the same conclusion that the Ga are spatially distinct from other groups.The Akan are also spatially separate from the Ga and other groups, but not to the same extentas the Ga. It is probably most accurate to represent these patterns less as residential segregationper se, which carries the imputation of deliberate discrimination, but rather the separation ofgroups one from another, the flip side of which represents concentrations of specific groupswithin identified geographic regions of the city.
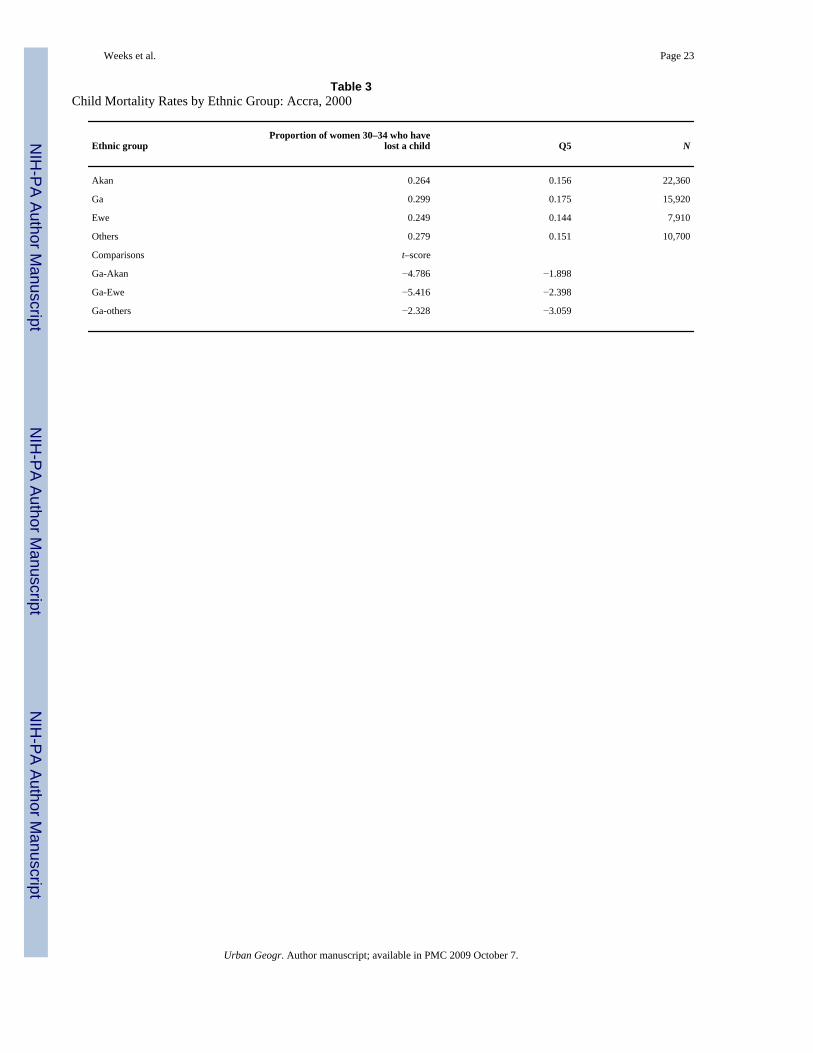
Are Ethnic Concentrations Predictive of Child Mortality?There is spatial variability in child mortality within Accra, the hot spots of which are especiallyin Ushertown, central Accra, and Nima. The first two of these, although not the third, are areasin which a high percentage of the population is of Ga ethnicity. There is also a clear pattern ofresidential separation in which an important characteristic is a concentration of Ga along thecoastal parts of Accra. The correlation coefficient of r = .346 between child mortality and theproportion Ga is a clear indicator of the overlap of these spatial patterns. A greaterpreponderance of Ga in a neighborhood is associated with higher child mortality. This isconsistent with the overall levels of under-five mortality by major ethnic group, as can be seenin Table 3, which includes data for both Q5 and the proportion of women aged 30–34 whohave lost at least one child. The Ga have the highest overall rates of under-five mortality, whilethe Akan and Ewe have the lowest levels.
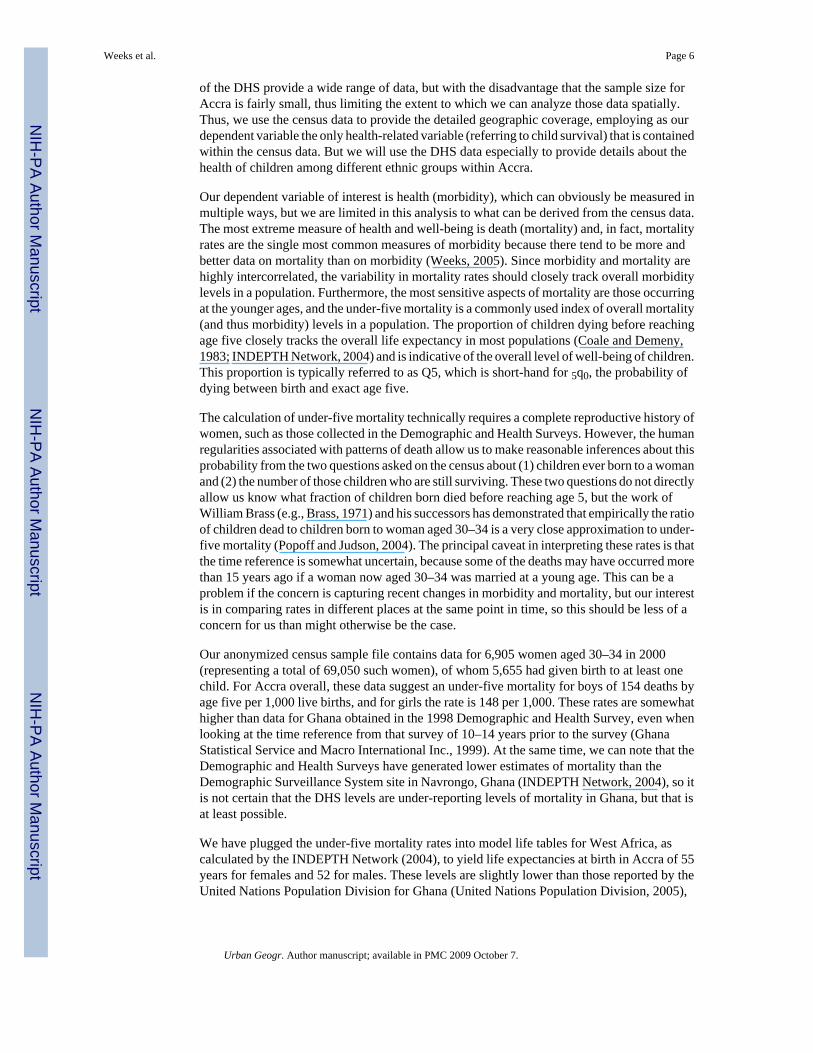
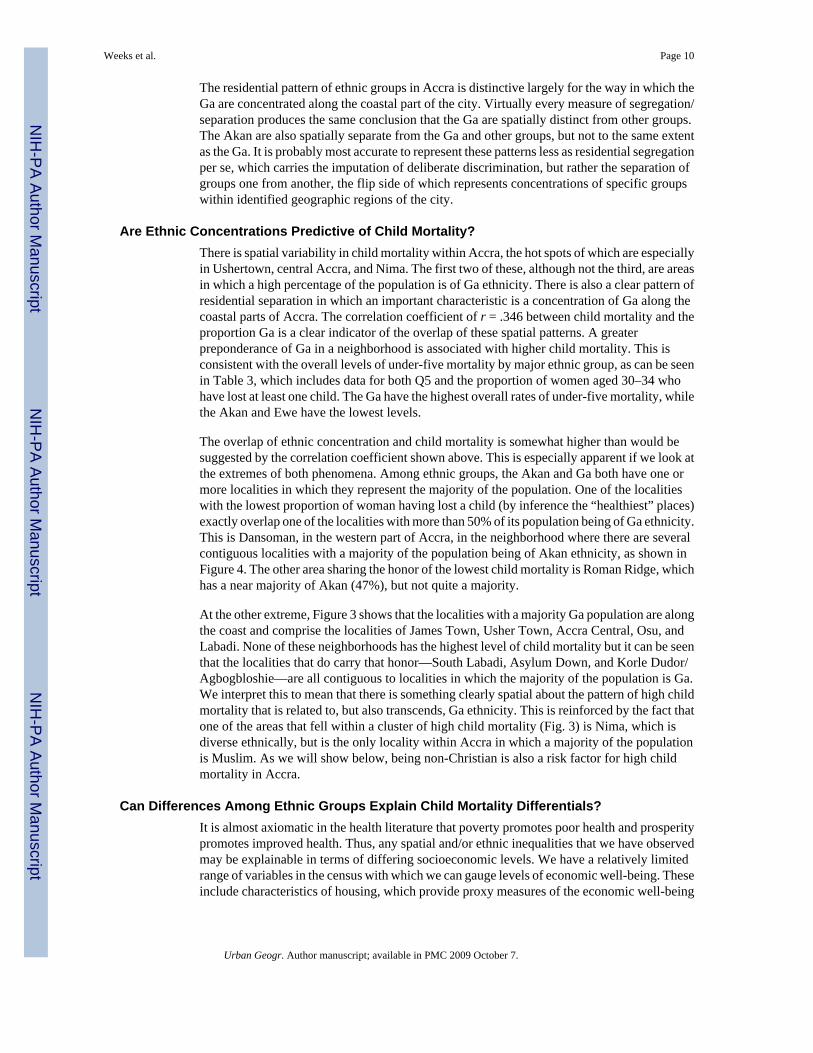
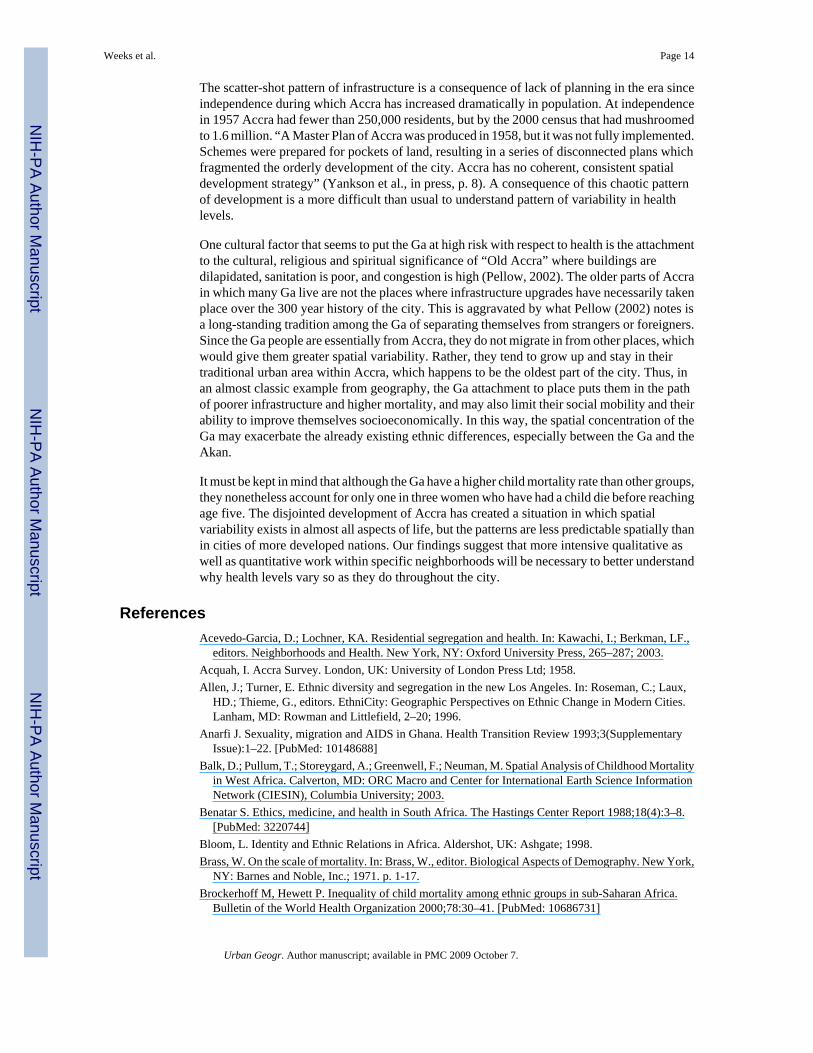
The overlap of ethnic concentration and child mortality is somewhat higher than would besuggested by the correlation coefficient shown above. This is especially apparent if we look atthe extremes of both phenomena. Among ethnic groups, the Akan and Ga both have one ormore localities in which they represent the majority of the population. One of the localitieswith the lowest proportion of woman having lost a child (by inference the “healthiest” places)exactly overlap one of the localities with more than 50% of its population being of Ga ethnicity.This is Dansoman, in the western part of Accra, in the neighborhood where there are severalcontiguous localities with a majority of the population being of Akan ethnicity, as shown inFigure 4. The other area sharing the honor of the lowest child mortality is Roman Ridge, whichhas a near majority of Akan (47%), but not quite a majority.
At the other extreme, Figure 3 shows that the localities with a majority Ga population are alongthe coast and comprise the localities of James Town, Usher Town, Accra Central, Osu, andLabadi. None of these neighborhoods has the highest level of child mortality but it can be seenthat the localities that do carry that honor—South Labadi, Asylum Down, and Korle Dudor/Agbogbloshie—are all contiguous to localities in which the majority of the population is Ga.We interpret this to mean that there is something clearly spatial about the pattern of high childmortality that is related to, but also transcends, Ga ethnicity. This is reinforced by the fact thatone of the areas that fell within a cluster of high child mortality (Fig. 3) is Nima, which isdiverse ethnically, but is the only locality within Accra in which a majority of the populationis Muslim. As we will show below, being non-Christian is also a risk factor for high childmortality in Accra.
Can Differences Among Ethnic Groups Explain Child Mortality Differentials?It is almost axiomatic in the health literature that poverty promotes poor health and prosperitypromotes improved health. Thus, any spatial and/or ethnic inequalities that we have observedmay be explainable in terms of differing socioeconomic levels. We have a relatively limitedrange of variables in the census with which we can gauge levels of economic well-being. Theseinclude characteristics of housing, which provide proxy measures of the economic well-being
Weeks et al. Page 10
Urban Geogr. Author manuscript; available in PMC 2009 October 7.
NIH
-PA Author Manuscript
NIH
-PA Author Manuscript
NIH
-PA Author Manuscript
of household members, and human capital variables such as educational and employmentcharacteristics that provide proxy measures of a person’s access to societal resources.
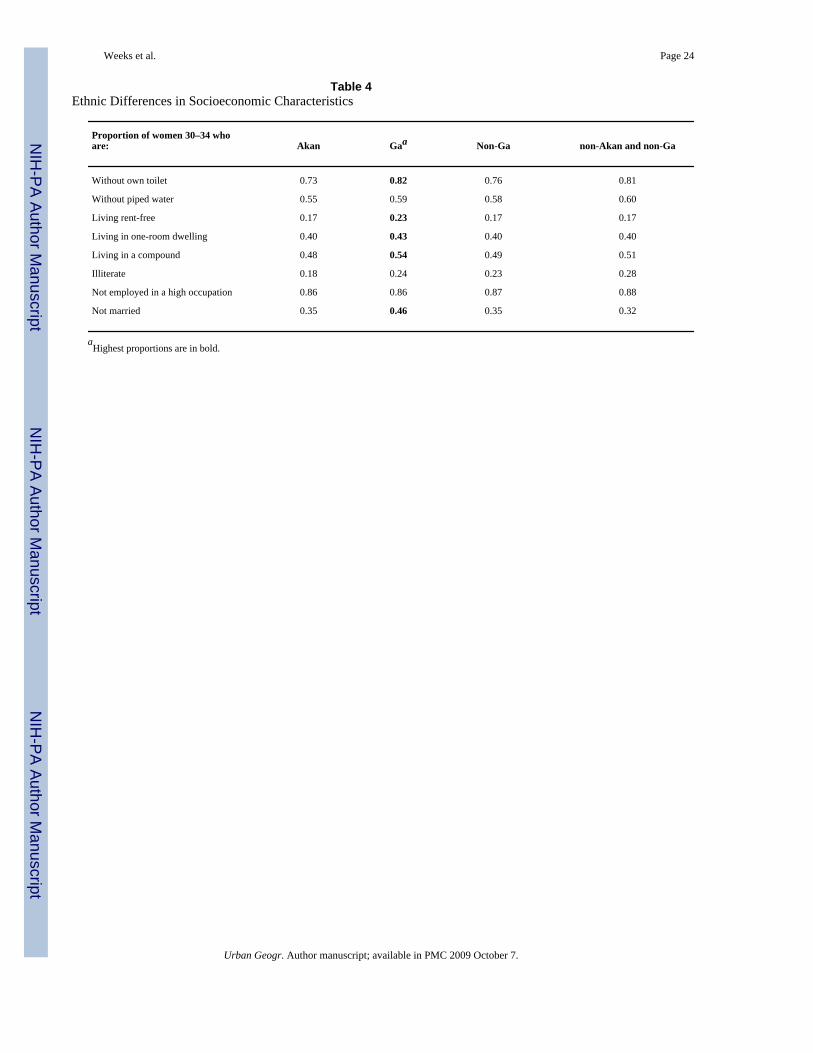
Ethnic differences in several measures of socioeconomic status are shown in Table 4, with thehighest proportions in each category shown in bold type. These characteristics are basedspecifically on the microdata sample of women aged 30–34, so that there is no confoundingof correlations from different data. Nearly all households in Accra lack a private toilet, but theGa are more likely than the Akan or other groups combined not to have a toilet, whereas theAkan are more likely to have a toilet. There are public toilets throughout the city that are usedby large portions of the population. The majority of dwelling units also lack piped water, butthe Ga are not much less likely than others to lack piped water, although they are slightly worseoff in this regard than the Akan. The Ga are more likely than other groups to be living rent-free. This means that they neither own nor rent the dwelling, but are either squatting or, moreoften, living in a home owned communally by the tribe of which they are a member. A largeproportion of dwelling units in Accra have only one room. This is shared by all householdmembers for sleeping and other activities. Cooking is usually done outside, and as noted abovemost dwelling units do not have a bathroom. The Ga are slightly more likely than the Akanand other groups to be in a one-room dwelling.
A majority of Ga women live in a compound which may be comprised of two or more one-room dwelling units. Among the Ga this may be especially associated with polygny, since theGa women are more likely than the Akan, in particular, to have co-wives. Illiteracy is higheramong the Ga women than among the Akan, but other groups in Accra mirror the Ga in havingabout one in four women aged 30–34 who are illiterate. Most women in Accra are not employedin higher status occupations, but there appear to be no discernible ethnic differences in thisregard. Finally, it can be seen in Table 4 that the Ga women are clearly less likely to be marriedthan are members of other ethnic groups. Thus, they are more likely to have borne their childrenoutside of wedlock with the potential for a weaker resource base as a consequence.
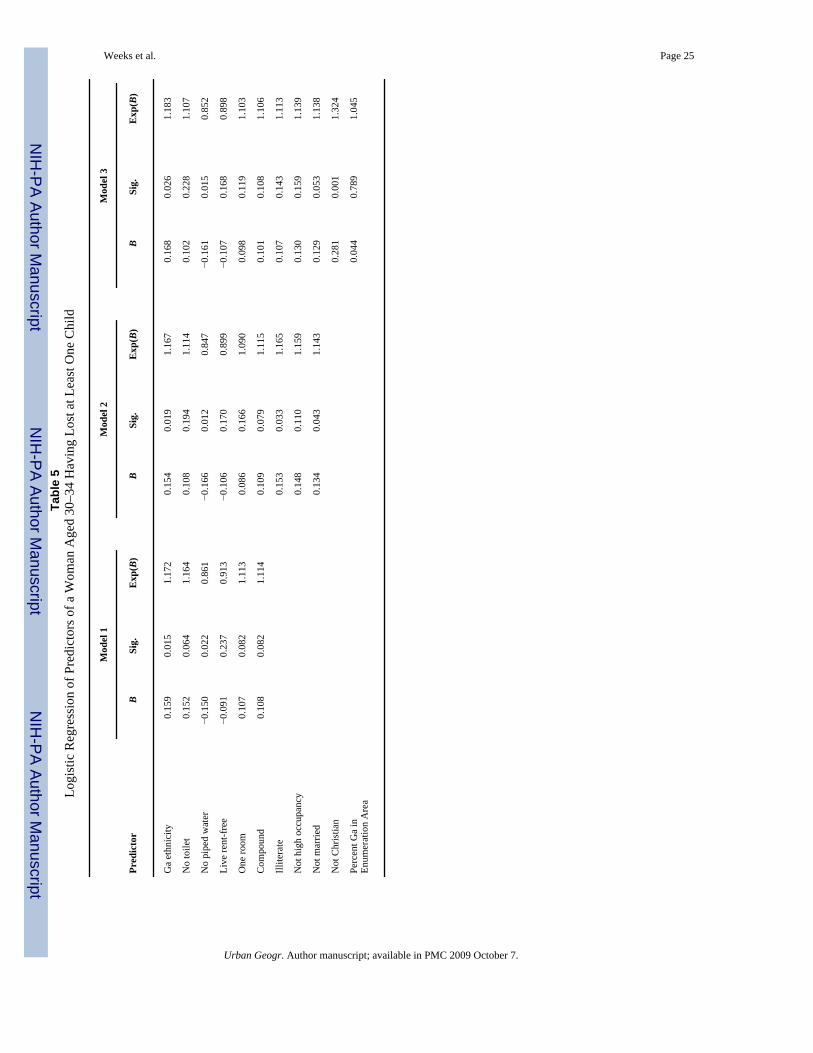
We can conclude that at least some of the disadvantage that Ga women have in terms of thehealth of their children may well be related to a more disadvantaged set of socioeconomiccircumstances than found among other ethnic groups, especially in comparison to the Akan.All of these variables are put together in a logistic regression, shown in Table 5, to see if theyaccount for the observed ethnic differences in child mortality. The first model includes Gaethnicity and evaluates it in comparison to having no toilet, having no piped water, living rent-free, living in a one-room dwelling, and living in a compound. The results in Model 1 showthat only two variables, Ga ethnicity and no piped water, are statistically significant predictorsof a woman aged 30–34 having lost at least one child, at least at the .05 level of significance.Of these two, only Ga ethnicity is in the expected direction. Counterintuitively, the resultssuggest that those with no piped water have better health outcomes, at least when all of theother variables in the equation are taken into account.
If we are willing to accept a slightly more liberal .10 level of significance, we are able toconclude that having no toilet, living in one room, and living in a compound are all predictiveof a higher risk of losing a child. Noteworthy, however, is that these variables do not explainaway Ga ethnicity. Being Ga is still a predictor of losing a child, even when this set ofsocioeconomic indicators is taken into account.
The second model in Table 5 adds the social capital variables of being illiterate, not having ahigh occupational status job, and not being married. Illiteracy and not being married are bothsignificant at the .05 level and both are predictive of an increased risk of losing a child. Yet, itremains true that Ga ethnicity is statistically significant even in the presence of these predictorvariables. The third model in Table 5 adds two additional factors that have already been
Weeks et al. Page 11
Urban Geogr. Author manuscript; available in PMC 2009 October 7.
NIH
-PA Author Manuscript
NIH
-PA Author Manuscript
NIH
-PA Author Manuscript
discussed, not being Christian and living in an ethnic enclave. Not being Christian emerges asthe most important predictor of losing a child in the model and seems to account for the illiteracyfactor, suggesting that the illiterate women who are at risk of losing a child are especially likelyto be non-Christian.
The percent Ga in the neighborhood in a which a woman lives is one of several indicators ofethnic residential separation and concentration that we examined. None of them wasstatistically significant as a predictor of child mortality, but of them all the percentage Ga inthe neighborhood had the highest beta coefficient. This result is not too surprising given thediscussion above regarding Figure 4, in that it was seen that being close to a high-percentageGa neighborhood, rather than directly in it, seemed to be associated with high child mortality,at least at the aggregate level.
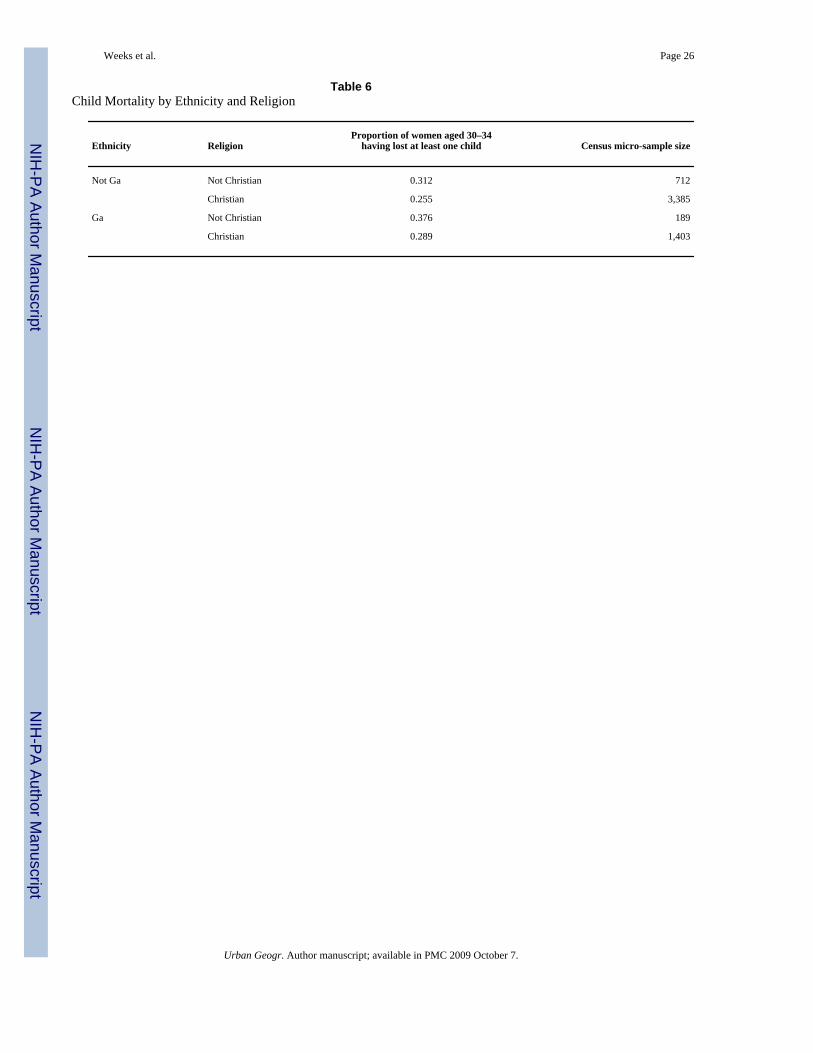
Of these variables, religion—defined as being Christian or not—emerges as a statisticallysignificant complement to Ga ethnicity as a predictor of child mortality. It is a complement inthe sense that none of the socioeconomic status variables dampens the relationship betweenGa ethnicity and child mortality, but both Ga ethnicity and Christian religious affiliation areindependently predictive of child mortality. Being Ga increases the level of child mortality atthe same time that being non-Christian increases the level. Although the Ga are predominantlyChristian (88%), the data suggest that the highest child mortality is experienced by those Gawho are not Christian. Being non-Ga and non-Christian is also associated with elevated levelsof child mortality, as shown in Table 6.
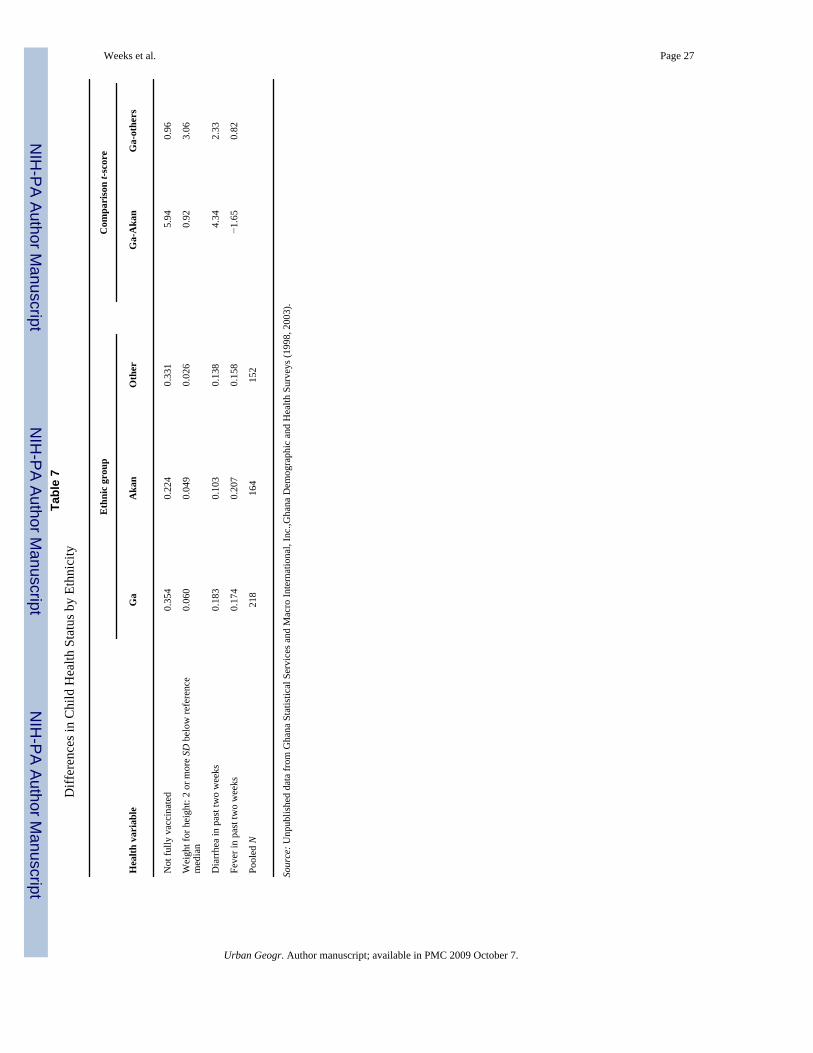
What Is It About Being Ga and/or Non-Christian that Heightens the Risk of Child Mortality?The data in Tables 5 and 6 suggest that being Ga and/or non-Christian increases the risk ofhaving a child die. Why is that? To answer this question we turn to the 1998 and 2003 GhanaDemographic and Health Survey (GDHS), where questions were asked relating especially toimmunizations and the health status of currently living children that might provide clues aboutthe deaths of their siblings. The sample size for the GDHS is too small to make comparisonson the basis of religion, but we can compare the major ethnic groups with one another. In orderto achieve a sufficiently large sample size for our comparisons, we pooled the data for Accrafrom the 1998 and 2003 surveys. The surveys had identical multistage probability clusterdesigns and asked identical questions, and we make the assumption that any bias that mightexist in the five-year span between surveys would have been similar for all ethnic groups.
We look first at the anthropometric measure of weight for height. A value that is beyond twostandard deviation units below the reference median is considered to be evidence of nutritionaldeficiencies. The data in Table 7 show that 6.0% of Ga children under the age of five fall intothis category, compared to 4.9% of Akan children and 2.6% of children of other ethnic groups.The difference between the Ga and Akan is in the expected direction, but is not large enoughto be statistically significant, whereas the difference between the Ga and others is significant.Thus, we can conclude that one contributing factor to a incidence of child mortality among Gachildren might be a tendency toward insufficient nutrition.
Most children in Accra are immunized against tuberculosis (with the BCG vaccine), DPT(diphtheria, pertussis, and tetanus), polio, and measles. Each mother normally maintains a cardon which the date of each vaccination is recorded, but the GDHS interviewers probed foradditional information in the event of missing data on the card. Based on the card data andmothers’ responses, the data suggest that 35% of Ga children under age five in Accra havereceived less than all of the vaccinations that would be expected. Among the Akan, the percentnot having full immunization was 22%, whereas it was 33% among other ethnic groupscombined. As with the weight for height measure, the Ga children are at a disadvantage whenit comes to immunization from common childhood diseases.
Weeks et al. Page 12
Urban Geogr. Author manuscript; available in PMC 2009 October 7.
NIH
-PA Author Manuscript
NIH
-PA Author Manuscript
NIH
-PA Author Manuscript
We also looked at two measures of health that are available within the GDHS—the incidenceof diarrhea and/or fever any time during the two weeks prior to the interview. Ga children weresignificantly more likely to have had diarrhea than were Akan children or children of otherethnic groups. This would be consistent with substandard nutritional levels. Ga children werenot more likely than Akan children to have had a fever in the prior two weeks. The Gapercentage was higher than for other ethnic groups, but the difference was not statisticallysignificant. Throughout equatorial Africa fevers are commonly associated with malaria, butthere was no difference among groups in their use of bed nets, either treated or untreated (datanot shown). Similarly, even though Ga children were more likely than others to have diarrhea,they were as equally likely to have been treated medically as were children of other ethnicgroups. Equally likely, however, is a relative term, and only about 15% of children receivedmedical treatment for diarrhea and about half received medical treatment for their fever.
DISCUSSION AND CONCLUSIONWe have shown that there is spatial variability in health levels in Accra, with areas near thecoast and, in particular, in the older central part of town experiencing the highest rates of childmortality. It is in these areas that there are statistically significant clusters of neighborhoodswith above-average child mortality. We also found that there is an overall modest level ofresidential segregation by ethnic group in Accra, but most notable are the spatial concentrationsof the Ga along the coastal area, and the Akan in the western part of the city. This pattern seemsnot coincidentally to be associated with child mortality because the areas with the lowest childmortality are neighborhoods dominated by the Akan, whereas areas with the highest childmortality are contiguous to, if not exactly the same as, neighborhoods dominateddemographically by the Ga. A further nuance on the analysis was the finding that the one areawith a majority Muslim population is also part of the cluster of high child mortalityneighborhoods. This is consistent with the findings from our logistic regression analysis thatbeing Ga and/or being non-Christian put women at increased risk of losing a child.
We have only a limited ability to evaluate why differences exist among groups in terms of childmortality. Data on currently living children from the Ghana Demographic and Health Surveyssuggest that Ga children are less likely to be fully immunized, and are less well fed, with thelatter possibly being associated with their higher incidence of diarrhea among children. To theextent that child morbidity tracks child mortality (and we believe that they track closely), andto the extent that Ga ethnicity is the single most important predictor of elevated risks of childdeath in Accra, then we can conclude that areas in the Ga part of Accra are those places inwhich children’s health is most at risk, and areas in the predominantly Akan part of the cityare where health is least at risk.
An unexpected finding from our research is the general lack of influence of water and sanitationon health levels. It is commonplace to assume that the worst health will be found in placeswithout piped water, toilets or sewerage, and vice versa. In Accra, this pattern does notgenerally hold, and the anomaly is probably an artifact of the unplanned and haphazard wayin which Accra has developed (Yankson et al., in press). Many areas of the city lack pipedwater and sanitation. Indeed, of the 43 localities in Accra, only one (Roman Ridge) has morethan half of its homes attached to a sewer system. It is a wealthy suburban area that is predictablycharacterized by low levels of child mortality. Only five localities have at least two-thirds ofthe houses connected to piped water and none of these has more than three-fourths of the housesso connected. Of these five, three have low levels of mortality (Roman Ridge, Dansoman, andKaneshie), whereas two have high mortality (Asylum Down and Abelenkpe). Only two of theselocalities are adjacent to one another (Roman Ridge and Abelenkpe) and yet those two adjacentlocalities have markedly different levels of child mortality.
Weeks et al. Page 13
Urban Geogr. Author manuscript; available in PMC 2009 October 7.
NIH
-PA Author Manuscript
NIH
-PA Author Manuscript
NIH
-PA Author Manuscript
The scatter-shot pattern of infrastructure is a consequence of lack of planning in the era sinceindependence during which Accra has increased dramatically in population. At independencein 1957 Accra had fewer than 250,000 residents, but by the 2000 census that had mushroomedto 1.6 million. “A Master Plan of Accra was produced in 1958, but it was not fully implemented.Schemes were prepared for pockets of land, resulting in a series of disconnected plans whichfragmented the orderly development of the city. Accra has no coherent, consistent spatialdevelopment strategy” (Yankson et al., in press, p. 8). A consequence of this chaotic patternof development is a more difficult than usual to understand pattern of variability in healthlevels.
One cultural factor that seems to put the Ga at high risk with respect to health is the attachmentto the cultural, religious and spiritual significance of “Old Accra” where buildings aredilapidated, sanitation is poor, and congestion is high (Pellow, 2002). The older parts of Accrain which many Ga live are not the places where infrastructure upgrades have necessarily takenplace over the 300 year history of the city. This is aggravated by what Pellow (2002) notes isa long-standing tradition among the Ga of separating themselves from strangers or foreigners.Since the Ga people are essentially from Accra, they do not migrate in from other places, whichwould give them greater spatial variability. Rather, they tend to grow up and stay in theirtraditional urban area within Accra, which happens to be the oldest part of the city. Thus, inan almost classic example from geography, the Ga attachment to place puts them in the pathof poorer infrastructure and higher mortality, and may also limit their social mobility and theirability to improve themselves socioeconomically. In this way, the spatial concentration of theGa may exacerbate the already existing ethnic differences, especially between the Ga and theAkan.
It must be kept in mind that although the Ga have a higher child mortality rate than other groups,they nonetheless account for only one in three women who have had a child die before reachingage five. The disjointed development of Accra has created a situation in which spatialvariability exists in almost all aspects of life, but the patterns are less predictable spatially thanin cities of more developed nations. Our findings suggest that more intensive qualitative aswell as quantitative work within specific neighborhoods will be necessary to better understandwhy health levels vary so as they do throughout the city.
ReferencesAcevedo-Garcia, D.; Lochner, KA. Residential segregation and health. In: Kawachi, I.; Berkman, LF.,
editors. Neighborhoods and Health. New York, NY: Oxford University Press, 265–287; 2003.Acquah, I. Accra Survey. London, UK: University of London Press Ltd; 1958.Allen, J.; Turner, E. Ethnic diversity and segregation in the new Los Angeles. In: Roseman, C.; Laux,
HD.; Thieme, G., editors. EthniCity: Geographic Perspectives on Ethnic Change in Modern Cities.Lanham, MD: Rowman and Littlefield, 2–20; 1996.
Anarfi J. Sexuality, migration and AIDS in Ghana. Health Transition Review 1993;3(SupplementaryIssue):1–22. [PubMed: 10148688]
Balk, D.; Pullum, T.; Storeygard, A.; Greenwell, F.; Neuman, M. Spatial Analysis of Childhood Mortalityin West Africa. Calverton, MD: ORC Macro and Center for International Earth Science InformationNetwork (CIESIN), Columbia University; 2003.
Benatar S. Ethics, medicine, and health in South Africa. The Hastings Center Report 1988;18(4):3–8.[PubMed: 3220744]
Bloom, L. Identity and Ethnic Relations in Africa. Aldershot, UK: Ashgate; 1998.Brass, W. On the scale of mortality. In: Brass, W., editor. Biological Aspects of Demography. New York,
NY: Barnes and Noble, Inc.; 1971. p. 1-17.Brockerhoff M, Hewett P. Inequality of child mortality among ethnic groups in sub-Saharan Africa.
Bulletin of the World Health Organization 2000;78:30–41. [PubMed: 10686731]
Weeks et al. Page 14
Urban Geogr. Author manuscript; available in PMC 2009 October 7.
NIH
-PA Author Manuscript
NIH
-PA Author Manuscript
NIH
-PA Author Manuscript
Clark W. Residential preferences and neighborhood racial segregation: A test of the Schelling SegregationModel. Demography 1991;28:1–19. [PubMed: 2015937]
Coale, A.; Demeny, P. Regional Model Life Tables and Stable Populations. New York, NY: AcademicPress; 1983.
Emerson MO, Yancy G, Chai KJ. Does race matter in residential segregation? Exploring the preferencesof White Americans. American Sociological Review 2001;66:922–935.
Farley, R. Growth of the Black Population. Chicago, IL: Markham; 1970.Farley, R. Components of suburban population growth. In: Schwartz, B., editor. The Changing Face of
the Suburbs. Chicago, IL: University of Chicago Press, 10–39; 1976.Farley, R. Blacks and Whites: Narrowing the Gap?. Cambridge, MA: Harvard University Press; 1984.Farley, R.; Danziger, S.; Holzer, HJ. Detroit Divided. New York, NY: Russell Sage Foundation; 2000.Farley R, Frey WH. Changes in the segregation of Whites from Blacks during the 1980s: Small steps
toward a more integrated society. American Sociological Review 1994;59:23–45.Forrest, J. Subnationalism in Africa: Ethnicity, Alliances, and Politics. Boulder, CO: Lynne Rienner
Publishers; 2004.Fry, S.; Cousins, B.; Olivola, K. Health of Children Living in Urban Slums in Asia and the Near East:
Review of Existing Literature and Data. Washington, DC: Environmental Health Project, U. S.Agency for International Development; 2002.
Ghana Statistical Service and Macro International Inc.. Ghana Demographic and Health Survey, 1998.Calverton, MD: Ghana Statistical Service and Macro International; 1999.
Gugler, J.; Flanagan, WG. Urbanization and Social Change in West Africa. Cambridge, UK: CambridgeUniversity Press; 1978.
INDEPTH Network. INDEPTH Model Life Tables for Sub-Saharan Africa. Aldershot, UK: AshgatePublishing Company; 2004.
Lado C. Female labour participation in agricultural production and implications for nutrition and healthin rural Africa. Social Science and Medicine 1992;34:789–807. [PubMed: 1604373]
LeClere, FB.; Sen, R. Residential Enclaves and the Health of U. S. Immigrants. Paper presented at theAnnual Meeting of the Population Association of America; Washington, DC. 2001.
Leloup X. Distance and difference between nationalities: The residential segregation of foreigners in anurban context. Recherches Sociologiques 1999;30(1):31–60.
Logan JR, Alba R, Zhang W. Immigrant Enclaves and Ethnic communities in New York and Los Angeles.American Sociological Review 2002;67(2):299–322.
MacIntyre, S.; Ellaway, A. Neighborhoods and health: An overview. In: Kawachi, I.; Berkman, LF.,editors. Neighborhoods and Health. Oxford, UK: Oxford University Press, 20–44; 2003.
MacIntyre S, Ellaway A, Cummins S. Place effects on health: How can we conceptualise, operationaliseand measure them? Social Science and Medicine 2002;55:125–139. [PubMed: 12137182]
Maslow, A. Toward a Psychology of Being, 2nd Edition. New York, NY: Van Nostrand; 1986.Massey, DS.; Denton, NA. American Apartheid: Segregation and the Making of the Underclass.
Cambridge, MA: Harvard University Press; 1993.Montgomery M, Hewett PC. Urban poverty and health in developing countries: Household and
neighborhood effects. Demography 2005;42(3):397–425. [PubMed: 16235606]Montgomery, MR.; Stren, R.; Cohen, B.; Reed, H., editors. Cities Transformed: Demographic Change
and Its Implications in the Developing World. Washington, DC: National Academies Press; 2003.Musterd S, Deurloo R. Unstable immigrant concentrations in Amsterdam: Spatial segregation and
integration of newcomers. Housing Studies 2002;17(3):487–503.O’Donoghue D, Gleave B. A note on methods for measuring industrial agglomeration. Regional Studies
2004;38(4):419–427.Parker, J. Making the Town: Ga State and Society in Early Colonial Accra. Portsmouth, NH: Heinemann;
2000.Peach, C.; Robinson, V.; Smith, S. Ethnic Segregation in Cities. Atlanta, GA: University of Georgia
Press; 1981.
Weeks et al. Page 15
Urban Geogr. Author manuscript; available in PMC 2009 October 7.
NIH
-PA Author Manuscript
NIH
-PA Author Manuscript
NIH
-PA Author Manuscript
Peak C, Weeks JR. Does community context influence reproductive outcomes of Mexican origin womenin San Diego, California? Journal of Immigrant Health 2002;4(3):125–136. [PubMed: 16228756]
Pellow, D. Landlords and Lodgers: Spatial Organization in an Accra Community. Westport, CT: PraegerPublishers; 2002.
Popoff, C.; Judson, DH. Some methods of estimation for statistically under-developed areas. In: Siegel,JS.; Swanson, DA., editors. The Methods and Materials of Demography, Second Edition. San Diego,CA: Elsevier Academic Press; 2004. p. 603-642.
Robertson, CC. Sharing the Same Bowl: A Socioeconomic History of Women and Class in Accra, Ghana.Bloomington, IN: Indiana University Press; 1984.
Rytkönen M, Rusanen J, Nayha S. Small-area variation in mortality in the city of Oulu, Finland, duringthe period 1978–1995. Health & Place 2001;7:75–79. [PubMed: 11470221]
Schellenberg JA, Victora CG, Mushi A, de Savigny D, Schellenberg D, Mshinda H, Bryce J. Inequalitiesamong the very poor: Health care for children in rural southern Tanzania. The Lancet 2003;361:561–566.
Timaeus I, Lush L. Intra-urban differentials in child health. Health Transition Review 1995;5:163–190.Timaeus I, Reynar A. Polygynist and their wives in sub-Saharan Africa: An analysis of five demographic
and health surveys. Population Studies 1998;52:145–162.United Nations Population Division. World Population Prospects, the 2004 Revision. New York, NY:
United Nations; 2005.United Nations Population Division. World Urbanization Prospects: The 2005 Revision. New York, NY:
United Nations; 2006.Van Kempen R, Van Weesep J. Ethnic residential patterns in Dutch cities: Backgrounds, shifts and
consequences. Urban Studies 1998;35(10):1813–1833.Veldboer L, Kleinhans R, Duyvendak JW. The diversified neighbourhood in western Europe and the
United States: How do countries deal with the spatial distribution of economic and culturaldifferences. Journal of International Migration and Integration 2002;3(1):41–64.
Weeks, JR. Using remote sensing and geographic information systems to identify the underlyingproperties of urban environments. In: Champion, AG.; Hugo, G., editors. New Forms ofUrbanization: Conceptualizing and Measuring Human Settlement in the Twenty-First Century.London, UK: Ashgate Publishing Limited; 2004. p. 325-346.
Weeks, JR. Population: An Introduction to Concepts and Issues, 9th Edition. Belmont, CA: WadsworthThomson Learning; 2005.
Weeks, JR.; Larson, D.; Fugate, D. Patterns of urban land use as assessed by satellite imagery: Anapplication to Cairo, Egypt. In: Entwisle, B.; Stern, PC., editors. Population, Land Use, andEnvironment: Research Directions. Washington, DC: National Academies Press; 2005. p. 265-286.
Weeks JR, Rumbaut RG, Ojeda N. Reproductive outcomes among Mexico-born women in San Diegoand Tijuana: Testing the Migration Selectivity Hypothesis. Journal of Immigrant Health 1999;1(2):77–90. [PubMed: 16228706]
Weich S, Burton E, Blanchard M, Prince M, Sproston K, Erens B. Measuring the built environment:Validity of a site survey instrument for use in urban settings. Health & Place 2001;7:283–292.[PubMed: 11682328]
Wong D. Modeling local segregation: A spatial interaction approach. Geographical and EnvironmentalModelling 2002;6(1):81–97.
Wong D. Implementing spatial segregation measures in GIS. Computers, Environment and UrbanSystems 2003;27:53–70.
Wong D. Comparing traditional and spatial segregation measures: A spatial scale perspective. UrbanGeography 2004;25(1):66–82.
Yankson PW, Kofie RY, Moller-Jensen L. Monitoring urban growth: Urbanization of the fringe areas ofAccra. Bulletin of the Ghana Geographical Association. in press
Weeks et al. Page 16
Urban Geogr. Author manuscript; available in PMC 2009 October 7.
NIH
-PA Author Manuscript
NIH
-PA Author Manuscript
NIH
-PA Author Manuscript
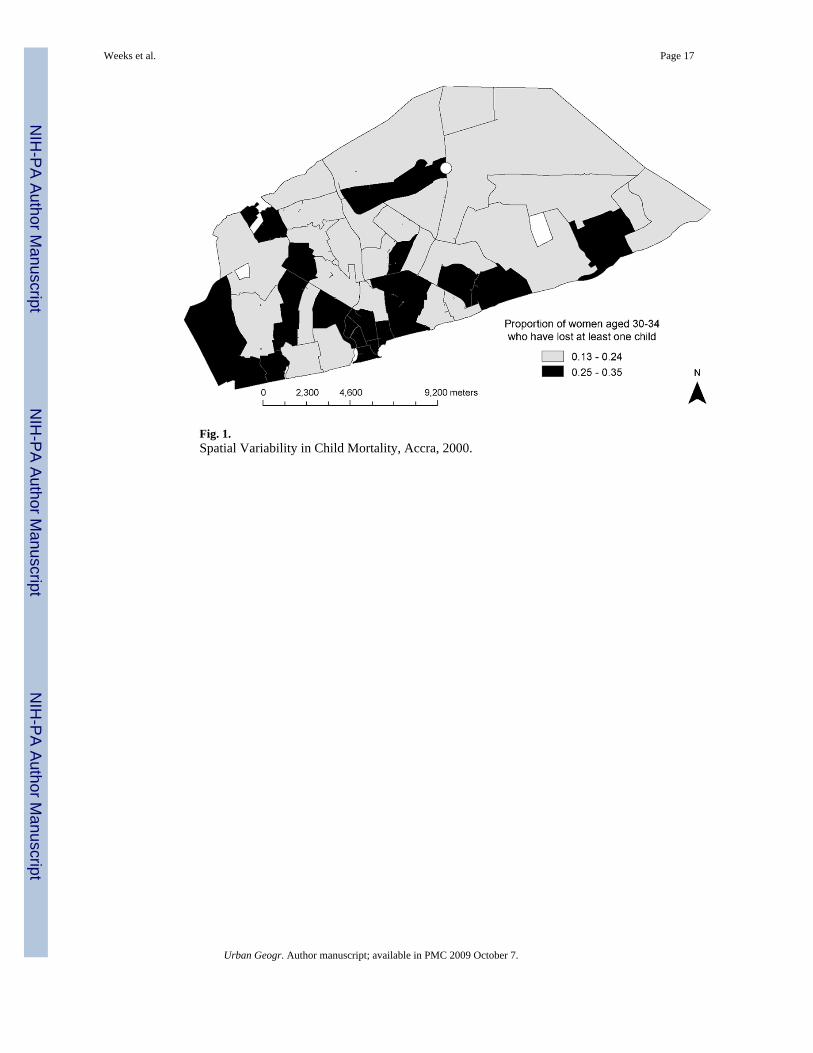
Fig. 1.Spatial Variability in Child Mortality, Accra, 2000.
Weeks et al. Page 17
Urban Geogr. Author manuscript; available in PMC 2009 October 7.
NIH
-PA Author Manuscript
NIH
-PA Author Manuscript
NIH
-PA Author Manuscript
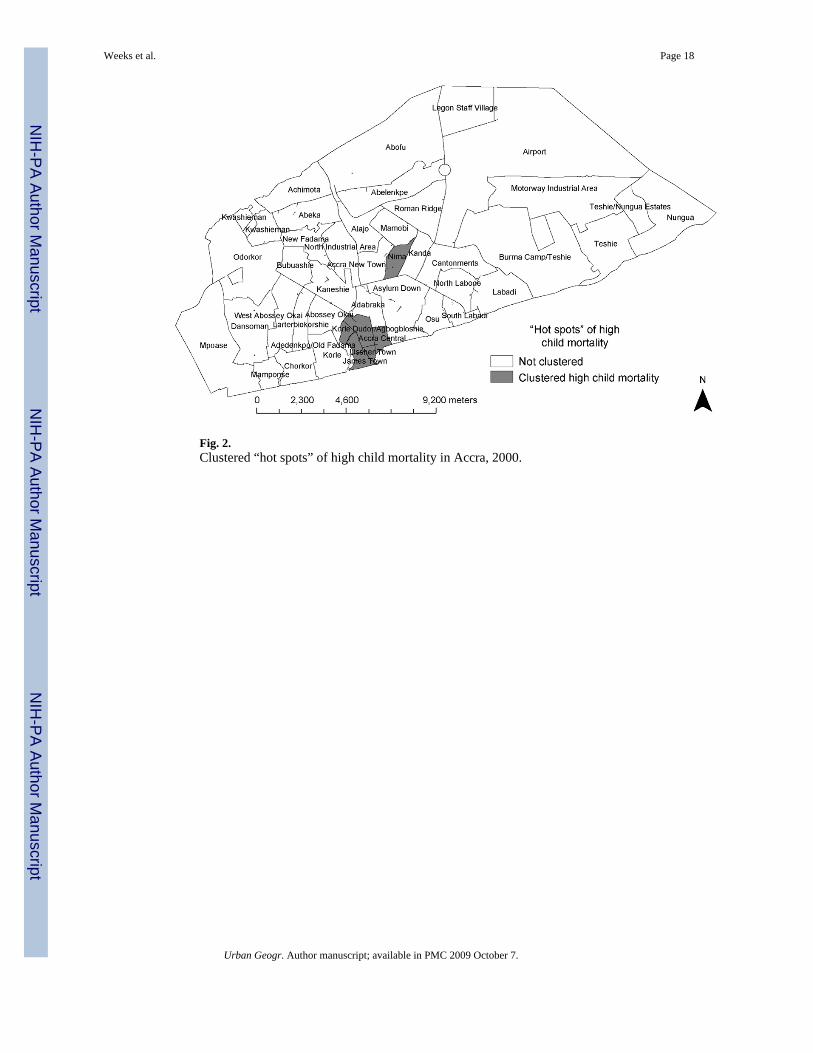
Fig. 2.Clustered “hot spots” of high child mortality in Accra, 2000.
Weeks et al. Page 18
Urban Geogr. Author manuscript; available in PMC 2009 October 7.
NIH
-PA Author Manuscript
NIH
-PA Author Manuscript
NIH
-PA Author Manuscript
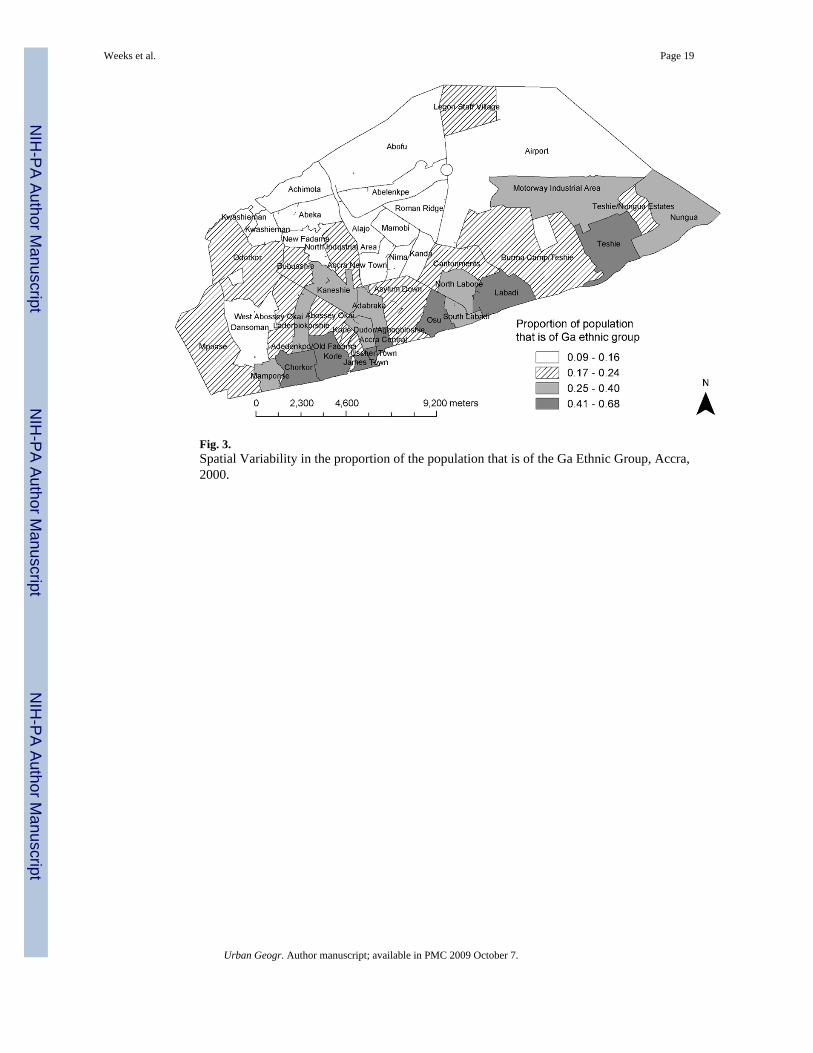
Fig. 3.Spatial Variability in the proportion of the population that is of the Ga Ethnic Group, Accra,2000.
Weeks et al. Page 19
Urban Geogr. Author manuscript; available in PMC 2009 October 7.
NIH
-PA Author Manuscript
NIH
-PA Author Manuscript
NIH
-PA Author Manuscript
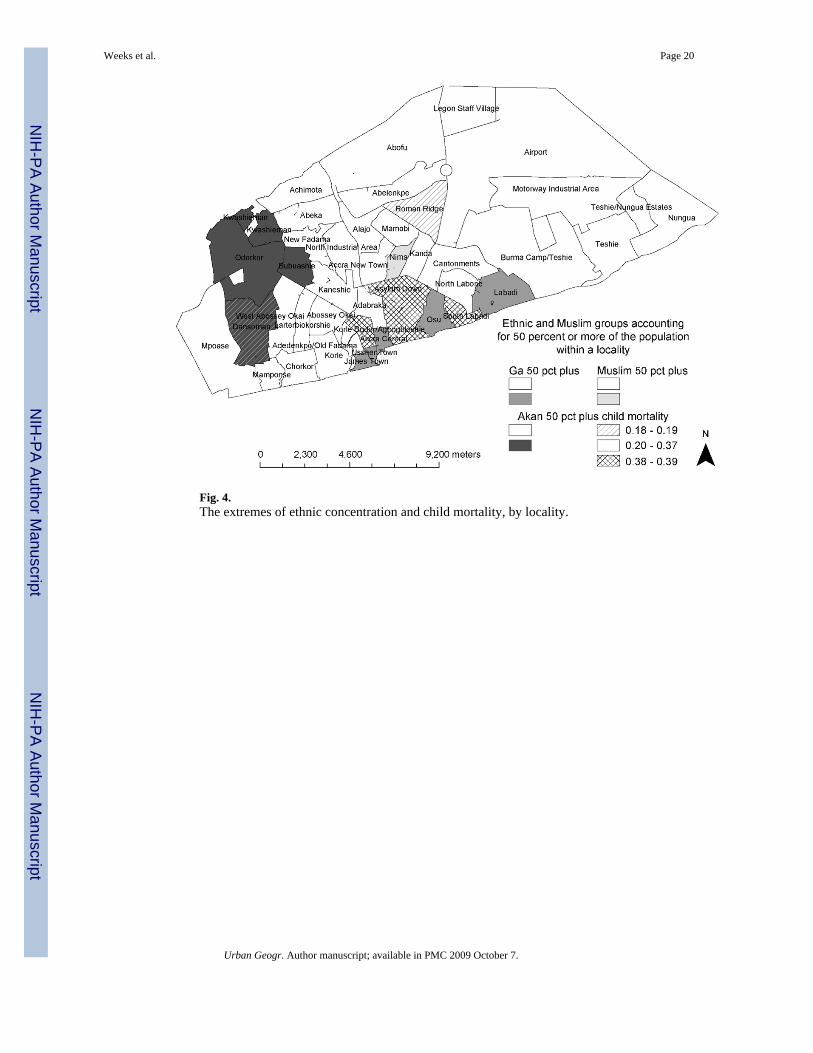
Fig. 4.The extremes of ethnic concentration and child mortality, by locality.
Weeks et al. Page 20
Urban Geogr. Author manuscript; available in PMC 2009 October 7.
NIH
-PA Author Manuscript
NIH
-PA Author Manuscript
NIH
-PA Author Manuscript
NIH
-PA Author Manuscript
NIH
-PA Author Manuscript
NIH
-PA Author Manuscript
Weeks et al. Page 21
Table 1Ethnic Groups in Accra, 2000
Ethnicity Population Percent
Akan 641,950 38.6
Ga-Adangbe 434,260 26.1
Ewe 222,990 13.4
Mole-Dagbani 83,720 5.0
Guan 45,160 2.7
Grusi 33,190 2.0
Gurma 14,290 0.9
Mande 15,190 0.9
Other 20,110 1.2
Non-Ghanaian 151,560 9.1
Total 1,662,420 100.0
Urban Geogr. Author manuscript; available in PMC 2009 October 7.
NIH
-PA Author Manuscript
NIH
-PA Author Manuscript
NIH
-PA Author Manuscript
Weeks et al. Page 22
Table 2Indices of Dissimilarity for Accra, 2000
Index of dissimilarity
Comparisons between ethnic groups D D(s)
Ga and Akan .31 .27
Ga and Ewe .37 .33
Ga and Mole-Dagbani .43 .39
Akan and Ewe .18 .15
Akan and Mole-Dagbani .25 .23
Ewe and Mole-Dagbani .18 .14
Akan and other non-Ga .17 .14
Ga and other non-Akan .36 .31
Multi-group spatial index of dissimilarity = .19
Urban Geogr. Author manuscript; available in PMC 2009 October 7.
NIH
-PA Author Manuscript
NIH
-PA Author Manuscript
NIH
-PA Author Manuscript
Weeks et al. Page 23
Table 3Child Mortality Rates by Ethnic Group: Accra, 2000
Ethnic groupProportion of women 30–34 who have
lost a child Q5 N
Akan 0.264 0.156 22,360
Ga 0.299 0.175 15,920
Ewe 0.249 0.144 7,910
Others 0.279 0.151 10,700
Comparisons t–score
Ga-Akan −4.786 −1.898
Ga-Ewe −5.416 −2.398
Ga-others −2.328 −3.059
Urban Geogr. Author manuscript; available in PMC 2009 October 7.
NIH
-PA Author Manuscript
NIH
-PA Author Manuscript
NIH
-PA Author Manuscript
Weeks et al. Page 24
Table 4Ethnic Differences in Socioeconomic Characteristics
Proportion of women 30–34 whoare: Akan Gaa Non-Ga non-Akan and non-Ga
Without own toilet 0.73 0.82 0.76 0.81
Without piped water 0.55 0.59 0.58 0.60
Living rent-free 0.17 0.23 0.17 0.17
Living in one-room dwelling 0.40 0.43 0.40 0.40
Living in a compound 0.48 0.54 0.49 0.51
Illiterate 0.18 0.24 0.23 0.28
Not employed in a high occupation 0.86 0.86 0.87 0.88
Not married 0.35 0.46 0.35 0.32
aHighest proportions are in bold.
Urban Geogr. Author manuscript; available in PMC 2009 October 7.
NIH
-PA Author Manuscript
NIH
-PA Author Manuscript
NIH
-PA Author Manuscript
Weeks et al. Page 25Ta
ble
5Lo
gist
ic R
egre
ssio
n of
Pre
dict
ors o
f a W
oman
Age
d 30
–34
Hav
ing
Lost
at L
east
One
Chi
ld
Mod
el 1
Mod
el 2
Mod
el 3
Pred
icto
rB
Sig.
Exp
(B)
BSi
g.E
xp(B
)B
Sig.
Exp
(B)
Ga
ethn
icity
0.15
90.
015
1.17
20.
154
0.01
91.
167
0.16
80.
026
1.18
3
No
toile
t0.
152
0.06
41.
164
0.10
80.
194
1.11
40.
102
0.22
81.
107
No
pipe
d w
ater
−0.1
500.
022
0.86
1−0
.166
0.01
20.
847
−0.1
610.
015
0.85
2
Live
rent
-fre
e−0
.091
0.23
70.
913
−0.1
060.
170
0.89
9−0
.107
0.16
80.
898
One
room
0.10
70.
082
1.11
30.
086
0.16
61.
090
0.09
80.
119
1.10
3
Com
poun
d0.
108
0.08
21.
114
0.10
90.
079
1.11
50.
101
0.10
81.
106
Illite
rate
0.15
30.
033
1.16
50.
107
0.14
31.
113
Not
hig
h oc
cupa
ncy
0.14
80.
110
1.15
90.
130
0.15
91.
139
Not
mar
ried
0.13
40.
043
1.14
30.
129
0.05
31.
138
Not
Chr
istia
n0.
281
0.00
11.
324
Perc
ent G
a in
Enum
erat
ion
Are
a0.
044
0.78
91.
045
Urban Geogr. Author manuscript; available in PMC 2009 October 7.
NIH
-PA Author Manuscript
NIH
-PA Author Manuscript
NIH
-PA Author Manuscript
Weeks et al. Page 26
Table 6Child Mortality by Ethnicity and Religion
Ethnicity ReligionProportion of women aged 30–34
having lost at least one child Census micro-sample size
Not Ga Not Christian 0.312 712
Christian 0.255 3,385
Ga Not Christian 0.376 189
Christian 0.289 1,403
Urban Geogr. Author manuscript; available in PMC 2009 October 7.
NIH
-PA Author Manuscript
NIH
-PA Author Manuscript
NIH
-PA Author Manuscript
Weeks et al. Page 27Ta
ble
7D
iffer
ence
s in
Chi
ld H
ealth
Sta
tus b
y Et
hnic
ity
Eth
nic
grou
pC
ompa
riso
n t-s
core
Hea
lth v
aria
ble
Ga
Aka
nO
ther
Ga-
Aka
nG
a-ot
hers
Not
fully
vac
cina
ted
0.35
40.
224
0.33
15.
940.
96
Wei
ght f
or h
eigh
t: 2
or m
ore
SD b
elow
refe
renc
em
edia
n0.
060
0.04
90.
026
0.92
3.06
Dia
rrhe
a in
pas
t tw
o w
eeks
0.18
30.
103
0.13
84.
342.
33
Feve
r in
past
two
wee
ks0.
174
0.20
70.
158
−1.6
50.
82
Pool
ed N
218
164
152
Sour
ce: U
npub
lishe
d da
ta fr
om G
hana
Sta
tistic
al S
ervi
ces a
nd M
acro
Inte
rnat
iona
l, In
c.,G
hana
Dem
ogra
phic
and
Hea
lth S
urve
ys (1
998,
200
3).
Urban Geogr. Author manuscript; available in PMC 2009 October 7.
Related Documents