ENERGY TRANSFER First Quarter 2020 Earnings May 11, 2020

Welcome message from author
This document is posted to help you gain knowledge. Please leave a comment to let me know what you think about it! Share it to your friends and learn new things together.
Transcript
ENERGY TRANSFERFirst Quarter 2020 Earnings
May 11, 2020

FORWARD-LOOKING STATEMENTS / LEGAL DISCLAIMER
2
Management of Energy Transfer LP (ET) will provide this presentation in conjunction with ET’s 1st quarter earnings conference call. On the call, members of management may make statements about future events, outlook and expectations related to Panhandle Eastern Pipe Line Company, LP (PEPL), Sunoco LP (SUN), USA Compression Partners, LP (USAC), Energy Transfer Operating, L.P. (ETO) and ET (collectively, the Partnerships), and their subsidiaries and this presentation may contain statements about future events, outlook and expectations related to the Partnerships and their subsidiaries all of which statements are forward-looking statements. Any statement made by a member of management of the Partnerships on the earnings call and any statement in this presentation that is not a historical fact will be deemed to be a forward-looking statement. These forward-looking statements rely on a number of assumptions concerning future events that members of management of the Partnerships believe to be reasonable, but these statements are subject to a number of risks, uncertainties and other factors, many of which are outside the control of the Partnerships. While the Partnerships believe that the assumptions concerning these future events are reasonable, we caution that there are inherent risks and uncertainties in predicting these future events that could cause the actual results, performance or achievements of the Partnerships and their subsidiaries to be materially different. These risks and uncertainties are discussed in more detail in the filings made by the Partnerships with the Securities and Exchange Commission (SEC), copies of which are available to the public. In addition to the risks and uncertainties disclosed in our SEC filings, the Partnership have also been, or may in the future be, impacted by new or heightened risks related to the COVID-19 pandemic and the recent sharp declines in commodity prices, and we cannot predict the length and ultimate impact of those risks. The Partnerships expressly disclaim any intention or obligation to revise or publicly update any forward-looking statements, whether as a result of new information, future events, or otherwise. This presentation includes certain forward looking non-GAAP financial measures as defined under SEC Regulation G, including estimated adjusted EBITDA. Due to the forward-looking nature of the aforementioned non-GAAP financial measures, management cannot reliably or reasonably predict certain of the necessary components of the most directly comparable forward-looking GAAP measures without unreasonable effort. Accordingly, we are unable to present a quantitative reconciliation of such forward-looking non-GAAP financial measures to their most directly comparable forward-looking GAAP financial measures. All references in this presentation to capacity of a pipeline, processing plant or storage facility relate to maximum capacity under normal operating conditions and with respect to pipeline transportation capacity, is subject to multiple factors (including natural gas injections and withdrawals at various delivery points along the pipeline and the utilization of compression) which may reduce the throughput capacity from specified capacity levels.

Operational Financial Strategic
Q1 2020 HIGHLIGHTS
3
Issued $4.5B of Senior Notes and $1.6B of Preferred Units in January 2020
Strong liquidity of $4B at end of Q1 provides financial flexibility
Completed integration of SemGroup assets and began to realize financial savings
Reported record NGL fractionation and transportation volumes
Midstream gas gathering, Intrastate natural gas and crude oil transportation volumes increased over Q1’19
Placed Panther II Processing Plant into full service in January 2020
Placed Frac VII into service in February 2020
Adjusted EBITDA: $2.64B
- Impacted by $213mm inventory valuation adjustment
DCF: $1.42B
Distribution coverage ratio: 1.72x
Growth Capital spend: ~$1.0B
Distributable cash flow in excess of distributions of $594mm
Primarily demand-fee based, fully integrated franchise with nation-wide scope

2020 EBITDA OUTLOOK
41. Spread margin is pipeline basis, cross commodity and time spreads 2. Fee margins include transport and storage fees from affiliate customers at market rates
2020E EBITDA ~$10.6-$10.8 billion
2019 to 2020 Drivers
+ SEMG integration/synergies
- Legacy contracts/renewals
- Crude/gas spreads
+ Organic Projects+Mariner East system+Fractionation plants (VI, VII)+PE4 Pipeline+Lone Star Express Expansion+Permian processing plants+JC Nolan Diesel Pipeline+Red Bluff Express Pipeline
Fee2
90-95%
Spread1
2.5-5%
Commodity2.5-5%
2020E Adjusted EBITDA Breakout
Taking additional steps to keep assets running efficiently and cash flows steady, including cost reduction measures and reduced 2020 growth capital expenditures
Identified and executing on significant cost cutting initiatives, and expect to save $200 to $250 million relative to 2020 budget

POP w/Fee 9%
Keep-Whole
1%
POP 5%
Demand/ Minimum Volume Commitments
63%
Cost of Service
3%Acreage/ Well Dedication
34%
Fee 85%
EARNINGS SUPPORTED BY PREDOMINANTLY FEE-BASED CONTRACTS
5
2019 Midstream Segment Contract Mix By Volume
Segment1 Contract Structure Strength
Crude Oil Fees from transporting and terminalling
More than 9,500 miles connecting Permian, Bakken and Midcon Basins to U.S. markets, including Nederland terminal
NGL & Refined Products
Fees from dedicated capacity and take-or-pay contracts, storage fees and throughput fees, and fractionation fees, which are primarily frac-or-pay structures
~60 facilities connected to ET’s NGL pipelines, and new frac expansions will bring total fractionation capacity at the Mont Belvieu complex to more than 1 million bpd
Interstate Transport &
Storage
Fees based on reserved capacity, regardless of usage
Connected to all major U.S. supply basins and demand markets, including exports
Midstream
Minimum volume commitment (MVC), acreage dedication, utilization-based fees and percent ofproceeds (POP)
Significant acreage dedications, including assets in Permian, EagleFord, and Marcellus/Utica Basins
IntrastateTransport &
Storage
Reservation charges and transport fees based on utilization
Largest intrastate pipeline system in the U.S. with interconnects to TX markets, as well as major consumption areas throughout the US
Midstream15%
NGL & Refined Products25%
Crude Oil23%
Interstate15%
Intrastate9%
SUN, USAC & Other13%
Q1 2020 Adjusted EBITDA by Segment1
1. Energy Transfer Operating Segments

REVISED CAPEX OUTLOOK – A DISCIPLINED, QUICKER CASH GENERATION CYCLE
6
NGL & Refined Products
• Lone Star Express Expansion • Mariner East system (ME2, ME2X) • Nederland LPG facilities • Fractionation plant VII (placed in service in February)• Fractionation plant VIII (delaying construction of Frac VIII based on current
expectations)1
• Orbit Export facilities (Nederland and Mt. Belvieu) • Multiple projects < $50mm
Midstream • Gathering and processing projects primarily in West Texas, the Northeast, and Eagle Ford (slowed pace of development in accordance with demand)
Crude Oil • Bakken pipeline optimization • Ted Collins Link1 (transitioned Ted Collins Pipeline into Ted Collins Link)• Multiple projects < $50mm
2020E Growth Capital: ~$3.6 billion(Previously ~$3.9-$4.1 billion)
Capex run-rate over next 3-4 years: under $2 billion
1. With delays/revisions to projects, some capital has moved back into 2021
Continuing to evaluate future opportunities with increased return thresholds Unlikely to add major organic growth projects to backlog in current market uncertainty
Believe long-term capex run-rate will result in positive free cash flow starting in 2021
For 2020, evaluating another $300-400 million for potential reduction
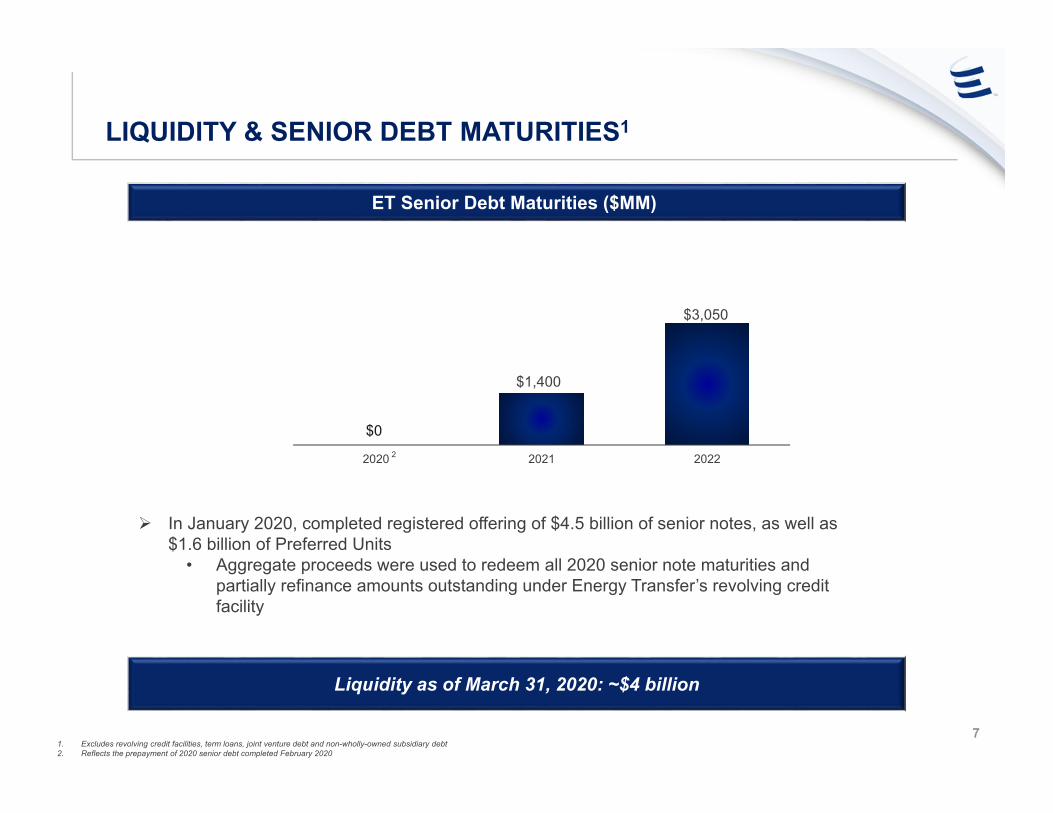
LIQUIDITY & SENIOR DEBT MATURITIES1
71. Excludes revolving credit facilities, term loans, joint venture debt and non-wholly-owned subsidiary debt2. Reflects the prepayment of 2020 senior debt completed February 2020
$0
2020 2021 2022
$3,050
50
$1,400
2
In January 2020, completed registered offering of $4.5 billion of senior notes, as well as $1.6 billion of Preferred Units
• Aggregate proceeds were used to redeem all 2020 senior note maturities and partially refinance amounts outstanding under Energy Transfer’s revolving credit facility
ET Senior Debt Maturities ($MM)
Liquidity as of March 31, 2020: ~$4 billion
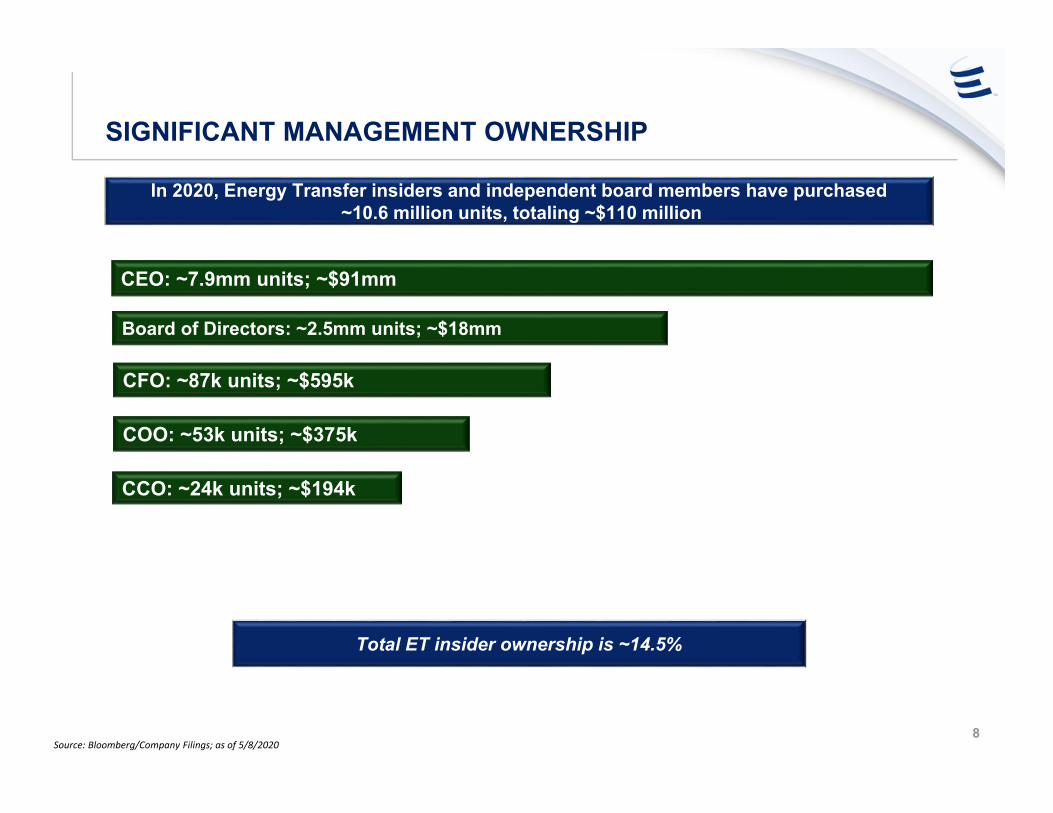
SIGNIFICANT MANAGEMENT OWNERSHIP
8Source: Bloomberg/Company Filings; as of 5/8/2020
Total ET insider ownership is ~14.5%
In 2020, Energy Transfer insiders and independent board members have purchased~10.6 million units, totaling ~$110 million
CEO: ~7.9mm units; ~$91mm
CCO: ~24k units; ~$194k
CFO: ~87k units; ~$595k
COO: ~53k units; ~$375k
Board of Directors: ~2.5mm units; ~$18mm

Canada Assets
Recently In-service & Announced Growth Projects
Dakota Access Pipeline
ETCO Pipeline
Mariner East Pipeline
JC Nolan
Fully-integrated midstream platform enhances ability to offer wide range of services to both domestic and international markets
FULLY INTEGRATED FRANCHISE FROM WELLHEAD TO WATER
Houston TerminalNederland Terminal
Marcus Hook
Marcus Hook Terminal
Eagle Point Terminal
Nederland Terminal
Energy Transfer
Terminals
Asset Overview
Midland Terminal
Houston Terminal
Cushing Terminal
Lake Charles Regas
9

PROJECT SCOPE IN-SERVICE TIMINGNGL & Refined Products
Mont Belvieu’s Frac VI 150 Mbpd fractionator at Mont Belvieu complex In service Q1 2019
Mont Belvieu’s Frac VII 150 Mbpd fractionator at Mont Belvieu complex In service Q1 2020
Mont Belvieu’s Frac VIII 150 Mbpd fractionator at Mont Belvieu complex Q1 2022
Lone Star Express Expansion
24-inch, 352 mile expansion to LS Express Pipeline adding 400,000 bbls/d from Wink, TX to Fort Worth, TX Q4 2020
Mariner East 2 NGLs from Marcellus Shale to MHIC with 275Mbpd capacity upon full completion In service Q4 2018
Mariner East 2X Increase NGL takeaway from the Marcellus to the East Coast w/ storage at Marcus Hook complex Q1 2021
J.C. Nolan Diesel Pipeline (1) 30,000 bbls/d diesel pipeline from Hebert, TX to newly-constructed terminal in Midland, TX In service Q3 2019
LPG Expansion 235,000 bbls/d expansion at Nederland to further integrate Mont Belvieu and Nederland assets and expand LPG export capabilities Q4 2020
Orbit Ethane Export Terminal(1)
800,000 bbl refrigerated ethane storage tank and 175,000 bbl/d ethane refrigeration facility and 20-inch ethane pipeline to connect Mont Belvieu to export terminal Q4 2020
Midstream
Revolution 110 miles of gas gathering pipeline, cryogenic processing plant, NGL pipelines, and frac facility in PA
Plant complete; awaiting pipeline restart
Arrowhead III 200 MMcf/d cryogenic processing plant in Delaware Basin In service Q3 2019
Panther II 200 MMcf/d cryogenic processing plant in Midland Basin In full service Jan. 2020
Crude Oil
Bayou Bridge(1) 212 mile crude pipeline connecting Nederland to Lake Charles / St. James, LA In service Q1 2019
Permian Express 4(1) Provides incremental Permian takeaway capacity, with total capacity of 120Mbpd Fully in service Oct. 1, 2019
Ted Collins Link(2) Up to 275 MBbls/d pipeline connecting Nederland Terminal to Houston Terminal Q4 2021
Intrastate Transport & Storage
Red Bluff Express Pipeline(1) 80-mile pipeline with capacity of at least 1.4 Bcf/d; extension will add an incremental 25 miles of pipeline Fully in service Q3 2019
NTP Pipeline Expansion (1) 36-inch natural gas pipeline expansion, providing 160,000 Mmbtu/d of additional capacity from WTX for deliveries into Old Ocean In service January 2019
DELIVERING ON PROJECT BACKLOG
101. Joint Venture2. Transitioned Ted Collins Pipeline into the Ted Collins Link.

NON-GAAP RECONCILIATION
11Distribution coverage ratio for the three months ended March 31, 2020 is calculated as Distributable Cash Flow attributable to partners, as adjusted, divided by distributions expected to be paid to the partners of ET in respect of the first quarter of 2020, which expected distributions total $825 million.
Related Documents