May 8, 2019 Q1 2019 Earnings Presentation

Welcome message from author
This document is posted to help you gain knowledge. Please leave a comment to let me know what you think about it! Share it to your friends and learn new things together.
Transcript

May 8, 2019
Q1 2019 Earnings Presentation

Q1 2019 Earnings Call Agenda
2
I. Introduction Crystal Gordon, SVP, General Counsel and CAO
II. Operational Highlights Chris Bradshaw, President and CEO
III. Financial Review Jennifer Whalen, SVP and CFO
IV. Concluding Remarks Chris Bradshaw, President and CEO
V. Questions & Answers
Cautionary Statement Regarding Forward-Looking StatementsThis presentation contains “forward-looking statements.” Forward-looking statements give the Company’s current expectations or forecasts of future events. Forward-lookingstatements generally can be identified by the use of forward-looking terminology such as “may,” “will,” “expect,” “intend,” “estimate,” “anticipate,” “believe,” “project,” or “continue,”or other similar words. These statements reflect management’s current views with respect to future events and are subject to risks and uncertainties, both known and unknown.The Company’s actual results may vary materially from those anticipated in forward-looking statements. The Company cautions investors not to place undue reliance on anyforward-looking statements. Such risks, uncertainties and other important factors include, among others, the Company’s dependence on, and the cyclical and volatile nature of, offshore oil and gasexploration, development and production activity, and the impact of general economic conditions and fluctuations in worldwide prices of and demand for oil and natural gas onsuch activity levels; the Company’s reliance on a limited number of customers and the reduction of its customer base resulting from bankruptcies or consolidation; risks thatthe Company’s customers reduce or cancel contracted services or tender processes or obtain comparable services through other forms of transportation; dependence on U.S.government agency contracts that are subject to budget appropriations; cost savings initiatives implemented by the Company’s customers; risks inherent in operating helicopters;the Company’s ability to maintain an acceptable safety record and level of reliability; the impact of increased U.S. and foreign government regulation and legislation, includingpotential government implemented moratoriums on drilling activities; the impact of a grounding of all or a portion of the Company’s fleet for extended periods of time or indefinitelyon the Company’s business, including its operations and ability to service customers, results of operations or financial condition and/or the market value of the affected helicopter(s); the Company’s ability to successfully expand into other geographic and aviation service markets; risks associated with political instability, governmental action, war, actsof terrorism, trade policies and changes in the economic condition in any foreign country where the Company does business, which may result in expropriation, nationalization,confiscation or deprivation of the Company’s assets or result in claims of a force majeure situation; the impact of declines in the global economy and financial markets; theimpact of fluctuations in foreign currency exchange rates on the Company’s asset values and cost to purchase helicopters, spare parts and related services; risks related toinvesting in new lines of aviation service without realizing the expected benefits; risks of engaging in competitive processes or expending significant resources for strategicopportunities, with no guaranty of recoupment; the Company’s reliance on a small number of helicopter manufacturers and suppliers; the Company’s ongoing need to replaceaging helicopters; the Company’s reliance on the secondary helicopter market to dispose of used helicopters and parts; the Company’s reliance on information technology andpotential harm from cyber-security incidents; the impact of allocation of risk between the Company and its customers; the liability, legal fees and costs in connection withproviding emergency response services; adverse weather conditions and seasonality; risks associated with the Company’s debt structure; the Company’s counterparty creditrisk exposure; the impact of operational and financial difficulties of the Company’s joint ventures and partners and the risks associated with identifying and securing joint venturepartners when needed; conflict with the other owners of the Company’s non-wholly owned subsidiaries and other equity investees; adverse results of legal proceedings,significant increases in costs; the Company’s ability to obtain insurance coverage and the adequacy and availability of such coverage; the possibility of labor problems; theattraction and retention of qualified personnel; restrictions on the amount of foreign ownership of the Company’s common stock; and various other matters and factors, manyof which are beyond the Company’s control. In addition, these statements constitute Era Group's cautionary statements under the Private Securities Litigation Reform Act of1995. It is not possible to predict or identify all such factors. Consequently, the foregoing should not be considered a complete discussion of all potential risks or uncertainties.The words "estimate," "project," "intend," "believe," "plan" and similar expressions are intended to identify forward-looking statements. Forward-looking statements speak onlyas of the date of the document in which they are made. Era Group disclaims any obligation or undertaking to provide any updates or revisions to any forward-looking statementto reflect any change in Era Group's expectations or any change in events, conditions or circumstances on which the forward-looking statement is based.
3
This presentation includes EBITDA and Adjusted EBITDA as supplemental measures of the Company’s operating performance. EBITDAis defined as Earnings before Interest (includes interest income and interest expense), Taxes, Depreciation and Amortization. AdjustedEBITDA is defined as EBITDA further adjusted for special items that occurred during the reporting period. Neither EBITDA nor AdjustedEBITDA is a recognized term under generally accepted accounting principles in the U.S. (“GAAP”). Accordingly, they should not be usedas an indicator of, or an alternative to, net income as a measure of operating performance. In addition, EBITDA and Adjusted EBITDAare not intended to be measures of free cash flow available for discretionary use, as they do not take into account certain cash requirements,such as debt service requirements. EBITDA and Adjusted EBITDA have limitations as analytical tools, and you should not consider themin isolation, nor as a substitute for analysis of the Company’s results as reported under GAAP. Because the definitions of EBITDA andAdjusted EBITDA (or similar measures) may vary among companies and industries, they may not be comparable to other similarly titledmeasures used by other companies. The Company also presents net debt, which is a non-GAAP measure, defined as total principalbalance on borrowings less cash and cash equivalents, including escrow balances. Each of these non-GAAP measures has limitationsand therefore should not be used in isolation or as a substitute for the amounts reported in accordance with GAAP.
A reconciliation of EBITDA, Adjusted EBITDA, Adjusted EBITDA further adjusted to exclude gains on asset dispositions, and net debt isincluded in this presentation.
This presentation also includes the Company’s interest coverage ratio and senior secured leverage ratio. The interest coverage ratio isthe ratio for the most recently ended four consecutive fiscal quarters of EBITDA (as defined in the Company’s credit facility) less dividendsand distributions and the amount of any cash proceeds received from the sale of assets included in EBITDA divided by interest expense.The senior secured leverage ratio is calculated by dividing senior secured debt (as defined in the Company’s credit facility) by EBITDA.Neither the interest coverage ratio nor the senior secured leverage ratio is a measure of operating performance or liquidity defined byGAAP and may not be comparable to similarly titled measures presented by other companies. EBITDA is calculated differently underthe Company’s credit facility (as amended) than as presented elsewhere in this presentation.
Non-GAAP Financial Measures Reconciliation
4
Safety Update and Financial Flexibility
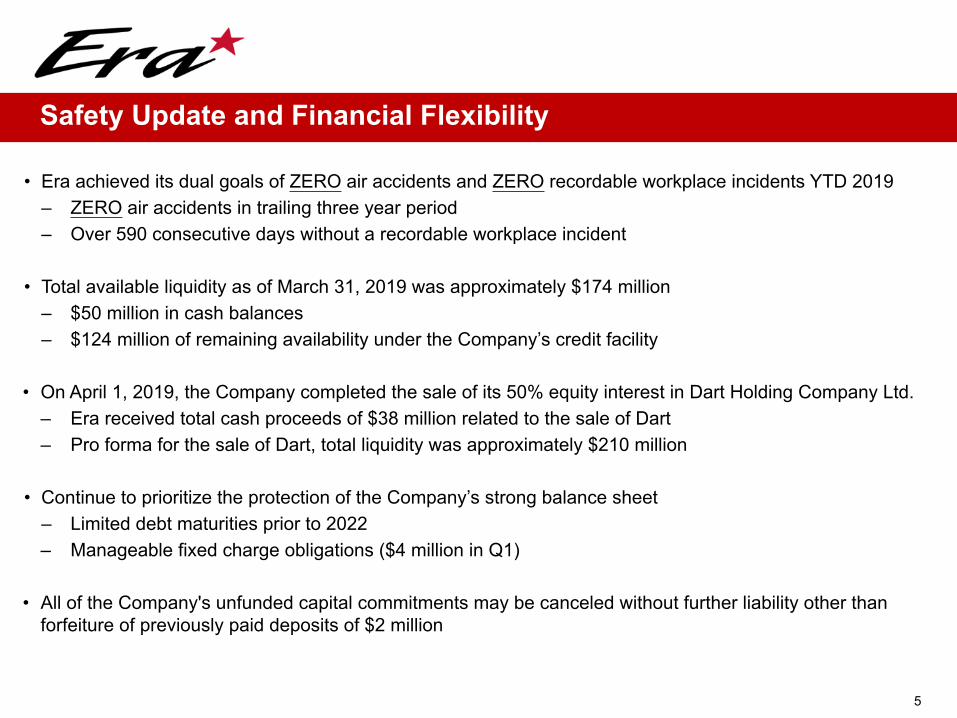
• Era achieved its dual goals of ZERO air accidents and ZERO recordable workplace incidents YTD 2019– ZERO air accidents in trailing three year period– Over 590 consecutive days without a recordable workplace incident
• Total available liquidity as of March 31, 2019 was approximately $174 million– $50 million in cash balances– $124 million of remaining availability under the Company’s credit facility
• On April 1, 2019, the Company completed the sale of its 50% equity interest in Dart Holding Company Ltd.– Era received total cash proceeds of $38 million related to the sale of Dart – Pro forma for the sale of Dart, total liquidity was approximately $210 million
• Continue to prioritize the protection of the Company’s strong balance sheet– Limited debt maturities prior to 2022– Manageable fixed charge obligations ($4 million in Q1)
• All of the Company's unfunded capital commitments may be canceled without further liability other thanforfeiture of previously paid deposits of $2 million
5
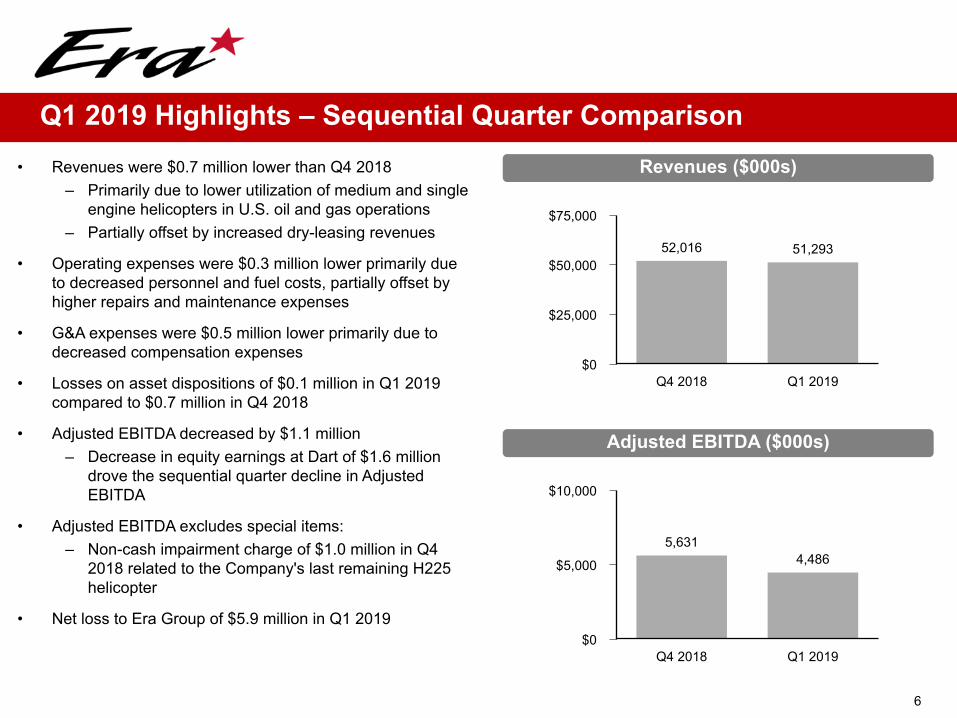
Q1 2019 Highlights – Sequential Quarter Comparison• Revenues were $0.7 million lower than Q4 2018
– Primarily due to lower utilization of medium and singleengine helicopters in U.S. oil and gas operations
– Partially offset by increased dry-leasing revenues
• Operating expenses were $0.3 million lower primarily dueto decreased personnel and fuel costs, partially offset byhigher repairs and maintenance expenses
• G&A expenses were $0.5 million lower primarily due todecreased compensation expenses
• Losses on asset dispositions of $0.1 million in Q1 2019compared to $0.7 million in Q4 2018
• Adjusted EBITDA decreased by $1.1 million– Decrease in equity earnings at Dart of $1.6 million
drove the sequential quarter decline in AdjustedEBITDA
• Adjusted EBITDA excludes special items:– Non-cash impairment charge of $1.0 million in Q4
2018 related to the Company's last remaining H225helicopter
• Net loss to Era Group of $5.9 million in Q1 2019
$75,000
$50,000
$25,000
$0Q4 2018 Q1 2019
52,016 51,293
Revenues ($000s)
6
$10,000
$5,000
$0Q4 2018 Q1 2019
5,6314,486
Adjusted EBITDA ($000s)
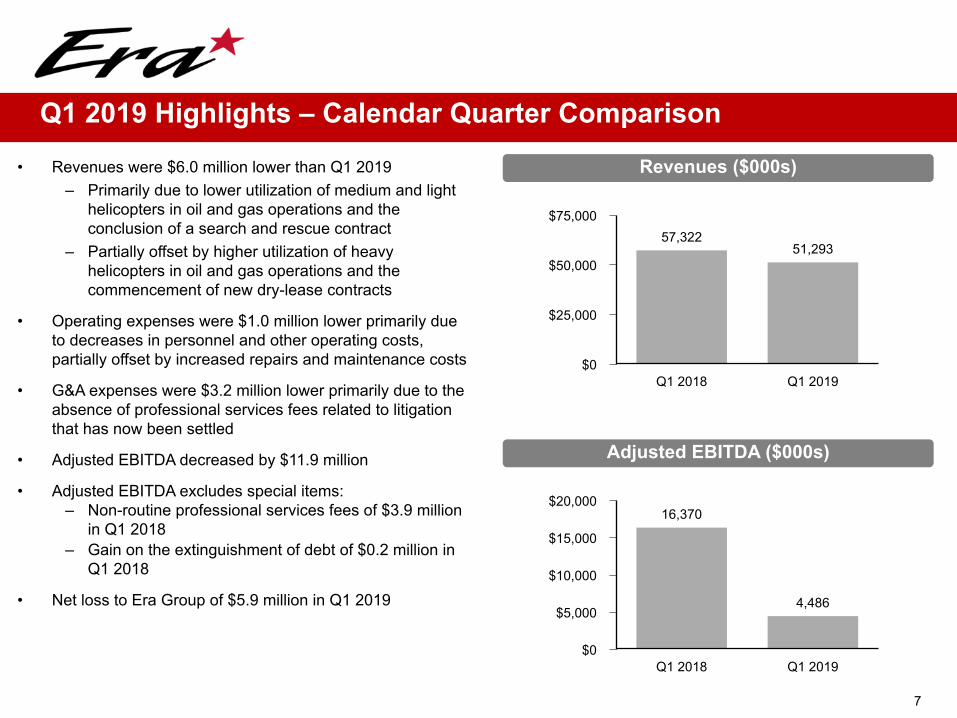
• Revenues were $6.0 million lower than Q1 2019– Primarily due to lower utilization of medium and light
helicopters in oil and gas operations and theconclusion of a search and rescue contract
– Partially offset by higher utilization of heavyhelicopters in oil and gas operations and thecommencement of new dry-lease contracts
• Operating expenses were $1.0 million lower primarily dueto decreases in personnel and other operating costs,partially offset by increased repairs and maintenance costs
• G&A expenses were $3.2 million lower primarily due to theabsence of professional services fees related to litigationthat has now been settled
• Adjusted EBITDA decreased by $11.9 million
• Adjusted EBITDA excludes special items:– Non-routine professional services fees of $3.9 million
in Q1 2018– Gain on the extinguishment of debt of $0.2 million in
Q1 2018
• Net loss to Era Group of $5.9 million in Q1 2019
$75,000
$50,000
$25,000
$0Q1 2018 Q1 2019
57,32251,293
Revenues ($000s)
Q1 2019 Highlights – Calendar Quarter Comparison
7
$20,000
$15,000
$10,000
$5,000
$0Q1 2018 Q1 2019
16,370
4,486
Adjusted EBITDA ($000s)

Appendix
Fleet Overview
HelicoptersAverage
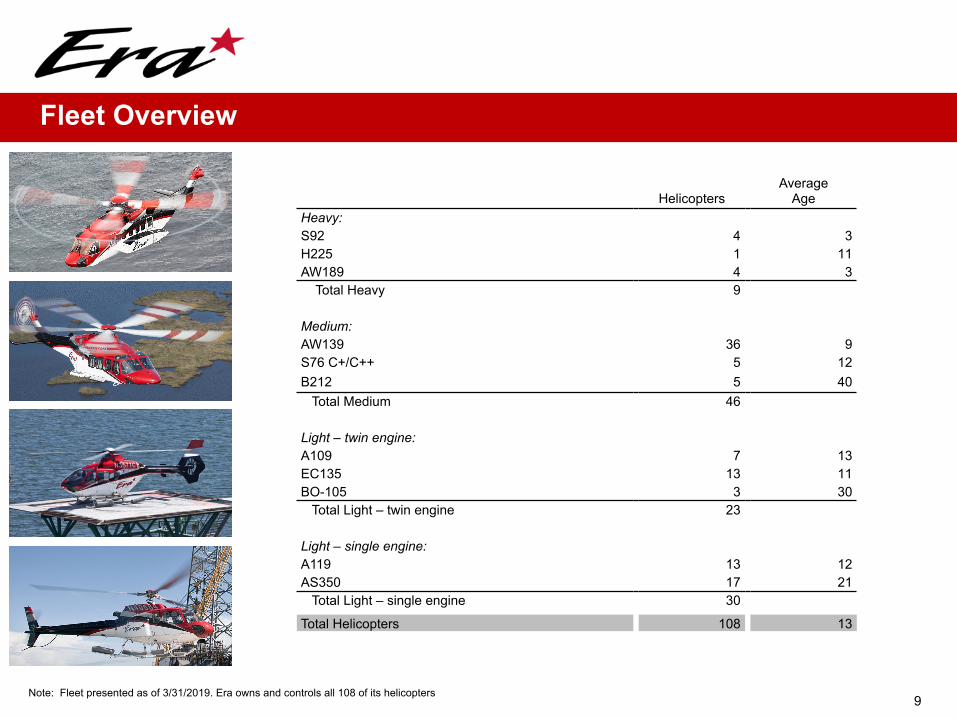
AgeHeavy:S92 4 3H225 1 11AW189 4 3 Total Heavy 9
Medium:AW139 36 9S76 C+/C++ 5 12B212 5 40 Total Medium 46
Light – twin engine:A109 7 13EC135 13 11BO-105 3 30 Total Light – twin engine 23
Light – single engine:A119 13 12AS350 17 21 Total Light – single engine 30
Total Helicopters 108 13
Note: Fleet presented as of 3/31/2019. Era owns and controls all 108 of its helicopters9
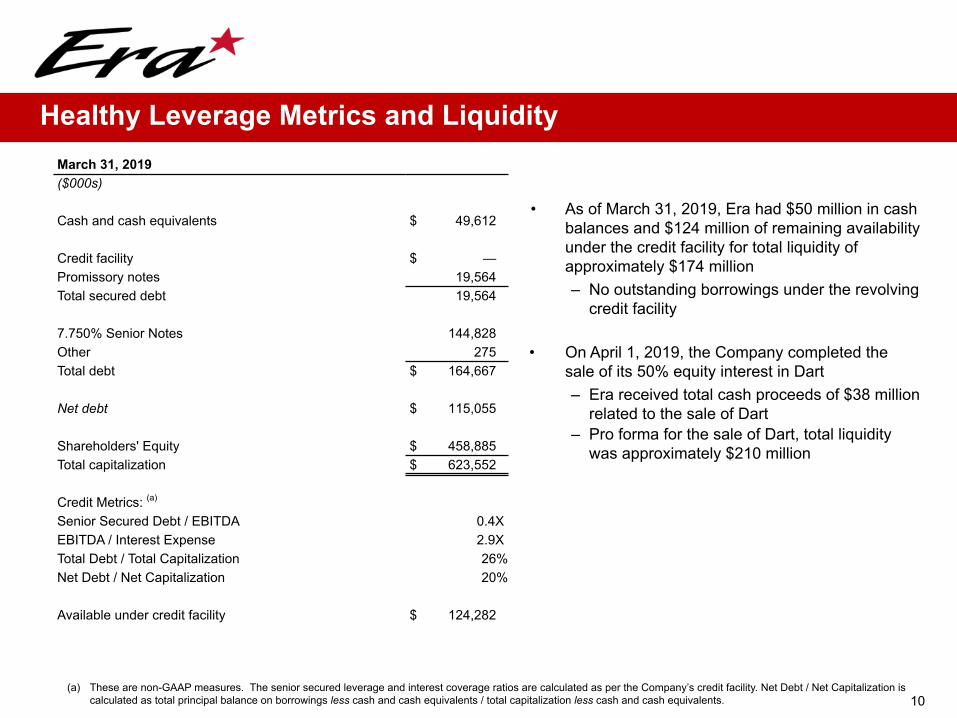
Healthy Leverage Metrics and LiquidityMarch 31, 2019($000s)
Cash and cash equivalents $ 49,612
Credit facility $ —Promissory notes 19,564Total secured debt 19,564
7.750% Senior Notes 144,828Other 275Total debt $ 164,667
Net debt $ 115,055
Shareholders' Equity $ 458,885Total capitalization $ 623,552
Credit Metrics: (a)
Senior Secured Debt / EBITDA 0.4XEBITDA / Interest Expense 2.9XTotal Debt / Total Capitalization 26%Net Debt / Net Capitalization 20%
Available under credit facility $ 124,282
• As of March 31, 2019, Era had $50 million in cashbalances and $124 million of remaining availabilityunder the credit facility for total liquidity ofapproximately $174 million– No outstanding borrowings under the revolving
credit facility
• On April 1, 2019, the Company completed thesale of its 50% equity interest in Dart– Era received total cash proceeds of $38 million
related to the sale of Dart– Pro forma for the sale of Dart, total liquidity
was approximately $210 million
(a) These are non-GAAP measures. The senior secured leverage and interest coverage ratios are calculated as per the Company’s credit facility. Net Debt / Net Capitalization iscalculated as total principal balance on borrowings less cash and cash equivalents / total capitalization less cash and cash equivalents. 10
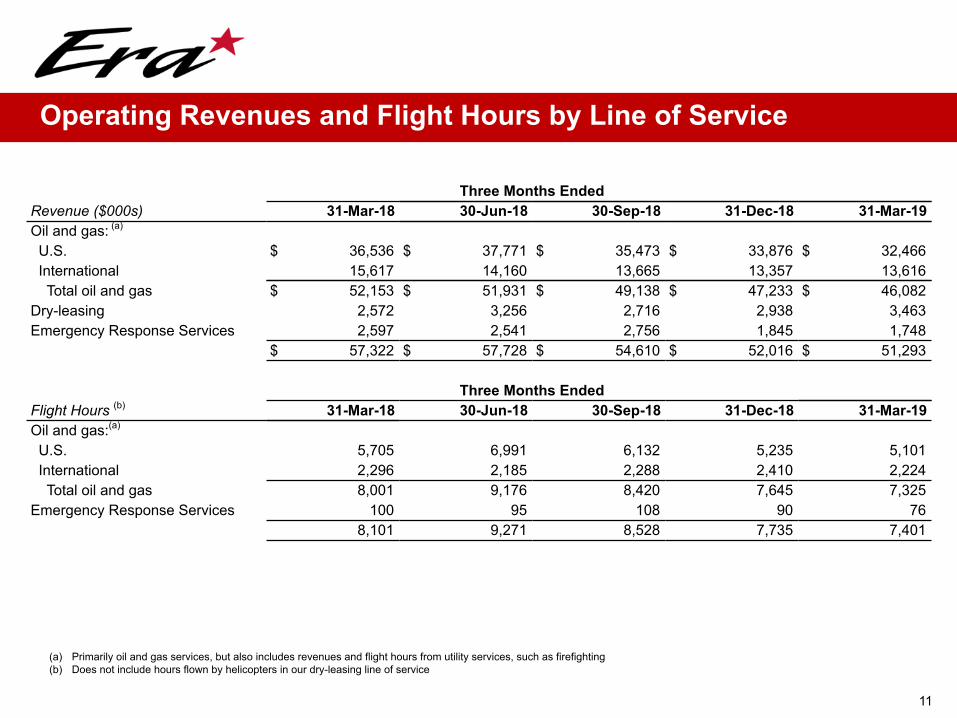
Operating Revenues and Flight Hours by Line of Service
Three Months EndedRevenue ($000s) 31-Mar-18 30-Jun-18 30-Sep-18 31-Dec-18 31-Mar-19Oil and gas: (a)
U.S. $ 36,536 $ 37,771 $ 35,473 $ 33,876 $ 32,466International 15,617 14,160 13,665 13,357 13,616Total oil and gas $ 52,153 $ 51,931 $ 49,138 $ 47,233 $ 46,082
Dry-leasing 2,572 3,256 2,716 2,938 3,463Emergency Response Services 2,597 2,541 2,756 1,845 1,748
$ 57,322 $ 57,728 $ 54,610 $ 52,016 $ 51,293
Three Months EndedFlight Hours (b) 31-Mar-18 30-Jun-18 30-Sep-18 31-Dec-18 31-Mar-19Oil and gas:(a)
U.S. 5,705 6,991 6,132 5,235 5,101International 2,296 2,185 2,288 2,410 2,224Total oil and gas 8,001 9,176 8,420 7,645 7,325
Emergency Response Services 100 95 108 90 768,101 9,271 8,528 7,735 7,401
(a) Primarily oil and gas services, but also includes revenues and flight hours from utility services, such as firefighting(b) Does not include hours flown by helicopters in our dry-leasing line of service
11
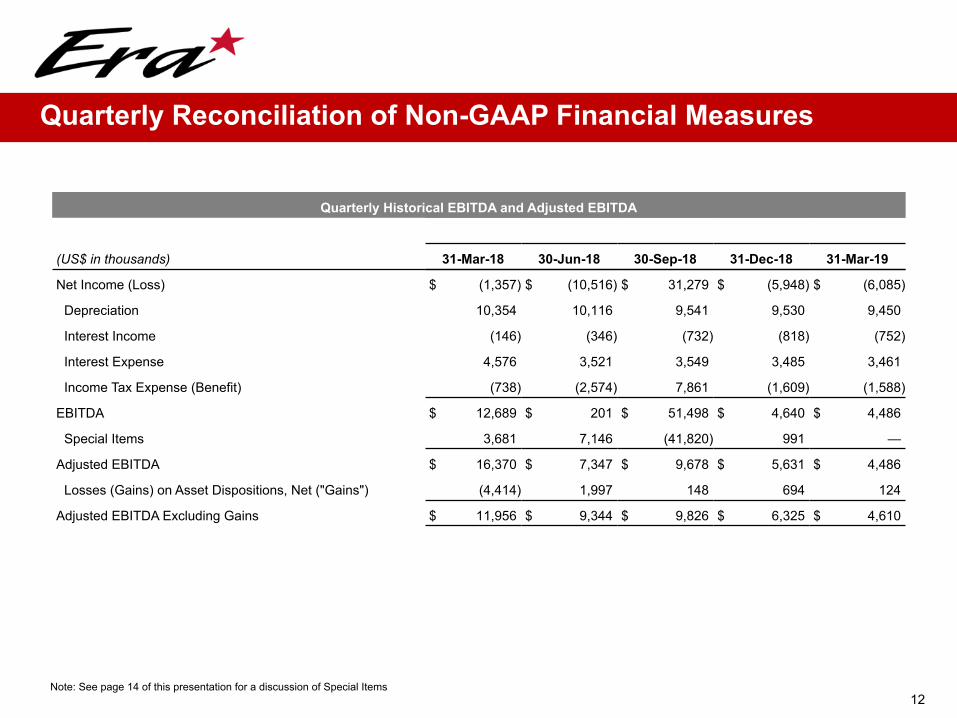
Quarterly Reconciliation of Non-GAAP Financial Measures
Quarterly Historical EBITDA and Adjusted EBITDA
(US$ in thousands) 31-Mar-18 30-Jun-18 30-Sep-18 31-Dec-18 31-Mar-19
Net Income (Loss) $ (1,357) $ (10,516) $ 31,279 $ (5,948) $ (6,085)
Depreciation 10,354 10,116 9,541 9,530 9,450
Interest Income (146) (346) (732) (818) (752)
Interest Expense 4,576 3,521 3,549 3,485 3,461
Income Tax Expense (Benefit) (738) (2,574) 7,861 (1,609) (1,588)
EBITDA $ 12,689 $ 201 $ 51,498 $ 4,640 $ 4,486
Special Items 3,681 7,146 (41,820) 991 —
Adjusted EBITDA $ 16,370 $ 7,347 $ 9,678 $ 5,631 $ 4,486
Losses (Gains) on Asset Dispositions, Net ("Gains") (4,414) 1,997 148 694 124
Adjusted EBITDA Excluding Gains $ 11,956 $ 9,344 $ 9,826 $ 6,325 $ 4,610
Note: See page 14 of this presentation for a discussion of Special Items12
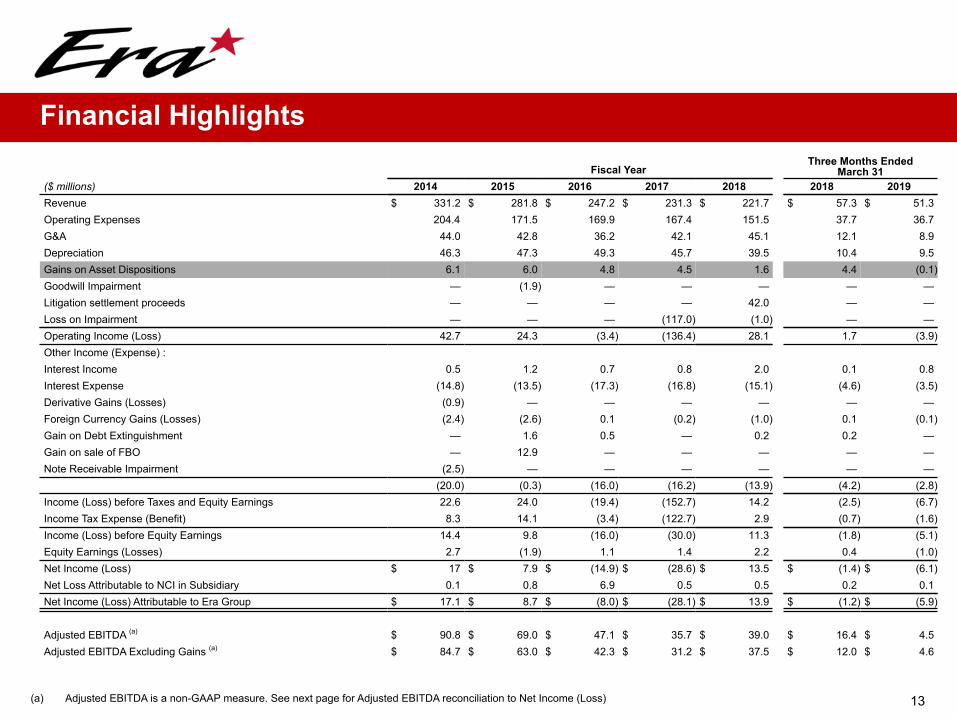
Financial Highlights
Fiscal YearThree Months Ended
March 31($ millions) 2014 2015 2016 2017 2018 2018 2019Revenue $ 331.2 $ 281.8 $ 247.2 $ 231.3 $ 221.7 $ 57.3 $ 51.3Operating Expenses 204.4 171.5 169.9 167.4 151.5 37.7 36.7G&A 44.0 42.8 36.2 42.1 45.1 12.1 8.9Depreciation 46.3 47.3 49.3 45.7 39.5 10.4 9.5Gains on Asset Dispositions 6.1 6.0 4.8 4.5 1.6 4.4 (0.1)Goodwill Impairment — (1.9) — — — — —Litigation settlement proceeds — — — — 42.0 — —Loss on Impairment — — — (117.0) (1.0) — —Operating Income (Loss) 42.7 24.3 (3.4) (136.4) 28.1 1.7 (3.9)Other Income (Expense) :Interest Income 0.5 1.2 0.7 0.8 2.0 0.1 0.8Interest Expense (14.8) (13.5) (17.3) (16.8) (15.1) (4.6) (3.5)Derivative Gains (Losses) (0.9) — — — — — —Foreign Currency Gains (Losses) (2.4) (2.6) 0.1 (0.2) (1.0) 0.1 (0.1)Gain on Debt Extinguishment — 1.6 0.5 — 0.2 0.2 —Gain on sale of FBO — 12.9 — — — — —Note Receivable Impairment (2.5) — — — — — —
(20.0) (0.3) (16.0) (16.2) (13.9) (4.2) (2.8)Income (Loss) before Taxes and Equity Earnings 22.6 24.0 (19.4) (152.7) 14.2 (2.5) (6.7)Income Tax Expense (Benefit) 8.3 14.1 (3.4) (122.7) 2.9 (0.7) (1.6)Income (Loss) before Equity Earnings 14.4 9.8 (16.0) (30.0) 11.3 (1.8) (5.1)Equity Earnings (Losses) 2.7 (1.9) 1.1 1.4 2.2 0.4 (1.0)Net Income (Loss) $ 17 $ 7.9 $ (14.9) $ (28.6) $ 13.5 $ (1.4) $ (6.1)Net Loss Attributable to NCI in Subsidiary 0.1 0.8 6.9 0.5 0.5 0.2 0.1Net Income (Loss) Attributable to Era Group $ 17.1 $ 8.7 $ (8.0) $ (28.1) $ 13.9 $ (1.2) $ (5.9)
Adjusted EBITDA (a) $ 90.8 $ 69.0 $ 47.1 $ 35.7 $ 39.0 $ 16.4 $ 4.5Adjusted EBITDA Excluding Gains (a) $ 84.7 $ 63.0 $ 42.3 $ 31.2 $ 37.5 $ 12.0 $ 4.6
(a) Adjusted EBITDA is a non-GAAP measure. See next page for Adjusted EBITDA reconciliation to Net Income (Loss) 13
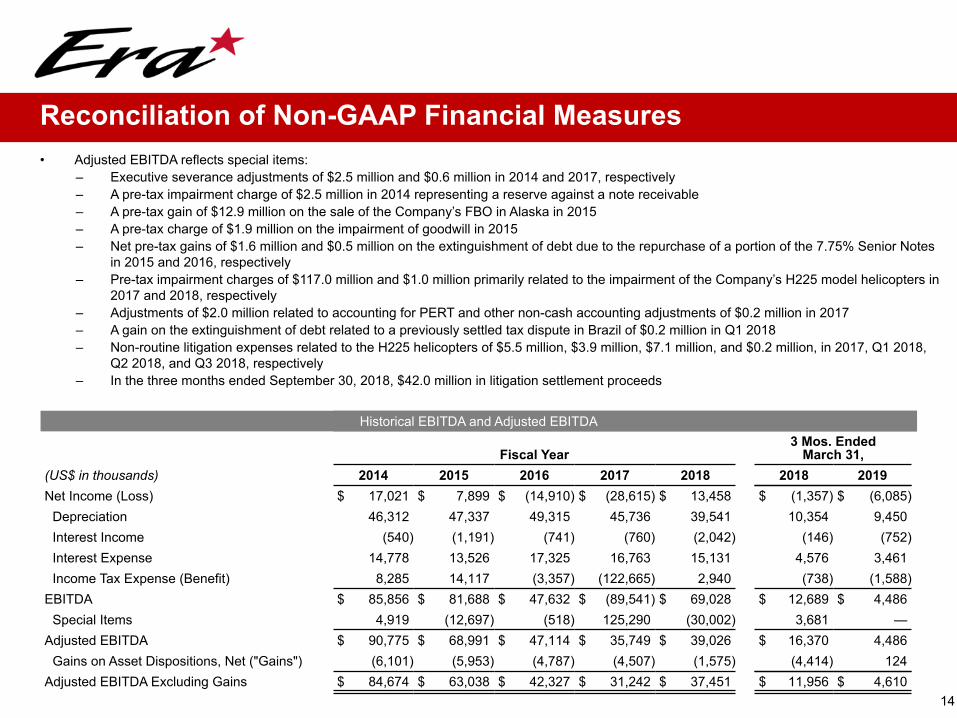
Reconciliation of Non-GAAP Financial Measures• Adjusted EBITDA reflects special items:
– Executive severance adjustments of $2.5 million and $0.6 million in 2014 and 2017, respectively– A pre-tax impairment charge of $2.5 million in 2014 representing a reserve against a note receivable– A pre-tax gain of $12.9 million on the sale of the Company’s FBO in Alaska in 2015– A pre-tax charge of $1.9 million on the impairment of goodwill in 2015– Net pre-tax gains of $1.6 million and $0.5 million on the extinguishment of debt due to the repurchase of a portion of the 7.75% Senior Notes
in 2015 and 2016, respectively– Pre-tax impairment charges of $117.0 million and $1.0 million primarily related to the impairment of the Company’s H225 model helicopters in
2017 and 2018, respectively– Adjustments of $2.0 million related to accounting for PERT and other non-cash accounting adjustments of $0.2 million in 2017– A gain on the extinguishment of debt related to a previously settled tax dispute in Brazil of $0.2 million in Q1 2018– Non-routine litigation expenses related to the H225 helicopters of $5.5 million, $3.9 million, $7.1 million, and $0.2 million, in 2017, Q1 2018,
Q2 2018, and Q3 2018, respectively– In the three months ended September 30, 2018, $42.0 million in litigation settlement proceeds
Historical EBITDA and Adjusted EBITDA
Fiscal Year3 Mos. Ended
March 31,(US$ in thousands) 2014 2015 2016 2017 2018 2018 2019Net Income (Loss) $ 17,021 $ 7,899 $ (14,910) $ (28,615) $ 13,458 $ (1,357) $ (6,085)
Depreciation 46,312 47,337 49,315 45,736 39,541 10,354 9,450Interest Income (540) (1,191) (741) (760) (2,042) (146) (752)Interest Expense 14,778 13,526 17,325 16,763 15,131 4,576 3,461Income Tax Expense (Benefit) 8,285 14,117 (3,357) (122,665) 2,940 (738) (1,588)
EBITDA $ 85,856 $ 81,688 $ 47,632 $ (89,541) $ 69,028 $ 12,689 $ 4,486Special Items 4,919 (12,697) (518) 125,290 (30,002) 3,681 —
Adjusted EBITDA $ 90,775 $ 68,991 $ 47,114 $ 35,749 $ 39,026 $ 16,370 4,486Gains on Asset Dispositions, Net ("Gains") (6,101) (5,953) (4,787) (4,507) (1,575) (4,414) 124
Adjusted EBITDA Excluding Gains $ 84,674 $ 63,038 $ 42,327 $ 31,242 $ 37,451 $ 11,956 $ 4,61014
Related Documents