Estudios Gerenciales 33 (2017) 24–38 ESTUDIOS GERENCIALES www .elsevier.es/estudios gerenciales Article Relationship between determinant factors of disclosure of information on environmental impacts of Brazilian companies Mara Vogt a,∗ , Nelson Hein b , Fabricia Silva da Rosa c , Larissa Degenhart d a PhD student in Accounting Sciences, Regional University of Blumenau, Blumenau, Brazil b Professor, Post-Graduate Program in Accounting Sciences, Blumenau Regional University, Blumenau, Brazil c Professor, Post-Graduate Program in Accounting Sciences, Federal University of Santa Catarina – UFSC, Florianópolis, Brazil d PhD student in Accounting Sciences, Regional University of Blumenau, Blumenau, Brazil a r t i c l e i n f o Article history: Received 10 February 2016 Accepted 18 October 2016 Available online 10 February 2017 JEL classification: Q56 Keywords: Brazilian companies Environmental disclosure Determinant factors Annual Report Sustainability Report a b s t r a c t This study aims at analyzing the relationship between determinant factors of disclosure of information on environmental impacts of Brazilian companies. A descriptive, documental and quantitative research was conducted through a sample of 97 Brazilian companies. In the Sustainability Reports and in the Annual Reports information, five environmental aspects were collected: emissions, effluents, wastes, products and services; and transport, which were used to measure the degree of environmental disclosure. This concludes that there is a relationship between the variables investigated in all analyzed years. The size, audit and Global Reporting Initiative (GRI) are associated with disclosure and the Corporate Sustainability Index (CSI), Pollution Potential (POTEN), governance, stocks, Return on Assets (ROA) and Return on Equity (ROE) are not. © 2016 Universidad ICESI. Published by Elsevier Espa ˜ na, S.L.U. This is an open access article under the CC BY license (http://creativecommons.org/licenses/by/4.0/). Relación entre los factores determinantes de la divulgación de información sobre impactos ambientales de empresas brasile ˜ nas Códigos JEL: Q56 Palabras clave: Empresas Brasile ˜ nas Divulgación de Información Ambiental Factores Determinantes Reporte Anual Reporte de Sostenibilidad r e s u m e n El objetivo de este estudio es analizar la relación entre los factores determinantes de la divulgación de información sobre los impactos ambientales de las empresas brasile ˜ nas. Para esto, una investigación descriptiva, documental y cuantitativa se llevó a cabo con una muestra de 97 empresas de Brasil. En las memorias de sostenibilidad y en la información de los informes anuales en cinco aspectos ambientales se recogió: emisiones, efluentes, residuos, productos y servicios, y el transporte, que se utiliza para medir el grado de divulgación del medio ambiente. Con esto se concluye que existe una relación entre las variables investigadas en todos los a˜ nos analizados. El tama ˜ no, auditoría y el Global Reporting Initiative (GRI) se asocian con la divulgación, mientras que el Índice de Sustentabilidad Empresarial (CSI), la Contaminación Potencial (POTEN), gobierno, acciones, Retorno sobre Activos (ROA) y Rentabilidad sobre Recursos Propios (ROE) no lo están. © 2016 Universidad ICESI. Publicado por Elsevier Espa ˜ na, S.L.U. Este es un art´ ıculo Open Access bajo la licencia CC BY (http://creativecommons.org/licenses/by/4.0/). ∗ Corresponding author at: Rua Antônio da Veiga, 140, Sala C 202, Bairro Victor Konder, Caixa Postal 1507, CEP: 89012-900, Blumenau, SC, Brazil. E-mail address: [email protected] (M. Vogt). http://dx.doi.org/10.1016/j.estger.2016.10.007 0123-5923/© 2016 Universidad ICESI. Published by Elsevier Espa ˜ na, S.L.U. This is an open access article under the CC BY license (http://creativecommons.org/licenses/by/4. 0/).

Welcome message from author
This document is posted to help you gain knowledge. Please leave a comment to let me know what you think about it! Share it to your friends and learn new things together.
Transcript
A
Ro
Ma
b
c
d
a
ARAA
JQ
KBEDAS
CQ
PEDFRR
00
Estudios Gerenciales 33 (2017) 24–38
ESTUDIOS GERENCIALES
www .e lsev ier .es /es tudios gerenc ia les
rticle
elationship between determinant factors of disclosuref information on environmental impacts of Brazilian companies
ara Vogta,∗, Nelson Heinb, Fabricia Silva da Rosac, Larissa Degenhartd
PhD student in Accounting Sciences, Regional University of Blumenau, Blumenau, BrazilProfessor, Post-Graduate Program in Accounting Sciences, Blumenau Regional University, Blumenau, BrazilProfessor, Post-Graduate Program in Accounting Sciences, Federal University of Santa Catarina – UFSC, Florianópolis, BrazilPhD student in Accounting Sciences, Regional University of Blumenau, Blumenau, Brazil
r t i c l e i n f o
rticle history:eceived 10 February 2016ccepted 18 October 2016vailable online 10 February 2017
EL classification:56
eywords:razilian companiesnvironmental disclosureeterminant factorsnnual Reportustainability Report
a b s t r a c t
This study aims at analyzing the relationship between determinant factors of disclosure of information onenvironmental impacts of Brazilian companies. A descriptive, documental and quantitative research wasconducted through a sample of 97 Brazilian companies. In the Sustainability Reports and in the AnnualReports information, five environmental aspects were collected: emissions, effluents, wastes, productsand services; and transport, which were used to measure the degree of environmental disclosure. Thisconcludes that there is a relationship between the variables investigated in all analyzed years. The size,audit and Global Reporting Initiative (GRI) are associated with disclosure and the Corporate SustainabilityIndex (CSI), Pollution Potential (POTEN), governance, stocks, Return on Assets (ROA) and Return on Equity(ROE) are not.
© 2016 Universidad ICESI. Published by Elsevier Espana, S.L.U. This is an open access article under theCC BY license (http://creativecommons.org/licenses/by/4.0/).
Relación entre los factores determinantes de la divulgación de informaciónsobre impactos ambientales de empresas brasilenas
ódigos JEL:56
alabras clave:mpresas Brasilenas
r e s u m e n
El objetivo de este estudio es analizar la relación entre los factores determinantes de la divulgación deinformación sobre los impactos ambientales de las empresas brasilenas. Para esto, una investigacióndescriptiva, documental y cuantitativa se llevó a cabo con una muestra de 97 empresas de Brasil. En lasmemorias de sostenibilidad y en la información de los informes anuales en cinco aspectos ambientales se
ivulgación de Información Ambientalactores Determinanteseporte Anualeporte de Sostenibilidad
recogió: emisiones, efluentes, residuos, productos y servicios, y el transporte, que se utiliza para medir elgrado de divulgación del medio ambiente. Con esto se concluye que existe una relación entre las variablesinvestigadas en todos los anos analizados. El tamano, auditoría y el Global Reporting Initiative (GRI) seasocian con la divulgación, mientras que el Índice de Sustentabilidad Empresarial (CSI), la ContaminaciónPotencial (POTEN), gobierno, acciones, Retorno sobre Activos (ROA) y Rentabilidad sobre Recursos Propios(ROE) no lo están.
© 2016 Universidad ICESI. Publicado por Elsevier Espana, S.L.U. Este es un artıculo Open Access bajo lalicencia CC BY (http://creativecommons.org/licenses/by/4.0/).
∗ Corresponding author at: Rua Antônio da Veiga, 140, Sala C 202, Bairro Victor Konder, Caixa Postal 1507, CEP: 89012-900, Blumenau, SC, Brazil.E-mail address: [email protected] (M. Vogt).
http://dx.doi.org/10.1016/j.estger.2016.10.007123-5923/© 2016 Universidad ICESI. Published by Elsevier Espana, S.L.U. This is an open access article under the CC BY license (http://creativecommons.org/licenses/by/4./).
CQ
PEDDRR
1
htysre
tt2ctFdet
eptbcpneet
piaZ(PDtoBaei
t
M. Vogt et al. / Estudios Gerenciales 33 (2017) 24–38 25
Relac ão entre os determinantes da divulgac ão de informac ões sobre o impactoambiental de empresas brasileiras
lassificac ões JEL:56
alavras-chave:mpresas Brasileiras
r e s u m o
O objetivo do estudo é analisar a relac ão entre os determinantes da divulgac ão de informac ões sobre osimpactos ambientais das empresas brasileiras. Para isso, um estudo descritivo, documental e pesquisaquantitativa foi realizado com uma amostra de 97 empresas do Brasil. Em relatórios de sustentabilidadee informac ões em cinco relatórios anuais, os aspectos ambientais recolhidos foram: emissões, efluentes,resíduos, produtos e servic os, e transporte, que foram usados para medir o grau de divulgac ão ambien-
ivulgac ão de Informac ão Ambientaleterminanteselatório Anualelatório de Sustentabilidade
tal. Este conclui que existe uma relac ão entre as variáveis investigadas em todos os anos analisados. Otamanho, a auditoria e o Global Reporting Initiative (GRI) estão associados com a divulgac ão, enquanto oÍndice de Sustentabilidade Empresarial (ISE), a Poluic ão Potencial (Poten), as ac ões, o governo, o Retornosobre ativos (ROA) e a Rentabilidade sobre Recursos Próprios (ROE) não o estão.
© 2016 Universidad ICESI. Publicado por Elsevier Espana, S.L.U. Este e um artigo Open Access sob uma
. Introduction
In the last 30 years, the impact of companies on the environmentas become a growing concern among environmentalists, legisla-ors, customers, public authorities and society in general. Thus, 15ears ago companies began to emphasize more on environmentaltrategies in the light of institutional pressures. These strategies areeported by using indicators and can be classified according to thenvironmental commitment they represent (Albertini, 2013).
The Legitimacy Theory provides explanations on the motiva-ion of the administration to disseminate information regardinghe environment in environmental reports (Wilmshurst & Frost,000). In this sense, Magness (2006) points out that one of the prin-iples of the Legitimacy Theory is that companies use the disclosureo transmit information on how they deal with the environment.or Kuo and Chen (2013), in recent years, this theory has becomeominant in research about environmental disclosure, since thenvironmental legitimacy discloses the company as environmen-ally responsible.
Nossa (2002) emphasizes that awareness and concern with thenvironment are increasingly present in society. That is why com-anies invest in environmental programs, because they discoverhat polluting is the same as wasting, not being efficient and noteing able to compete. After all, society pressures government andompanies regarding the preservation of the environment, and thisressure increases as the pollution caused by the activities of orga-izations increases. This is when companies set goals to minimizenvironmental impacts on emissions of liquid and gaseous efflu-nts, recycling of materials, among others, in order to legitimizeheir activities.
This study assumes that the environmental performance, trans-arency and economic performance lead companies to disclose
nformation on the environmental impacts. This expectation islso verified in studies conducted by Hackston and Milne (1996),eng, Xu, Dong, and Tam (2010), Bouten, Everaert, and Roberts2012), Wegener, Elayan, Felton, and Li (2013), Rosa, Guesser, Hein,fitscher, and Lunkes (2013) and Rosa, Lunkes, Hein, Vogt, andegenhart (2014), who have specifically investigated the factors
hat lead companies to evidence, from the perspective of the The-ry of Legitimacy. From the perspective of the Theory of Disclosure,raga, Oliveira, and Salotti (2009) and Murcia and Santos (2009)lso found some factors that lead a company to disclosure. How-
ver, none of these studies in particular used the three factors seenn this study.Several scientific researches have been done in the global con-ext in order to verify the environmental disclosure issue from
licenc a CC BY (http://creativecommons.org/licenses/by/4.0/).
the perspective of the Theory of Legitimacy. Few of these studieshave examined the determinant factors and variables of the disclo-sure of information on the environmental impacts of companies,used in this study. Research gaps have been identified in relationto (i) measuring the degree of environmental disclosure; (ii) therelationship between the variables of environmental performancefactors, transparency and economic performance with the degreeof environmental disclosure; and (iii) the relationship betweenthe economic performance factor and the degree of environmen-tal disclosure moderated by the environmental performance andtransparency factors.
Given the aforementioned context the question that guidesthis research emerges: what is the relationship between deter-minants factors of information disclosure on the environmentalimpacts of Brazilian companies listed in Brazil Index 100 (IBrX-100) Stock Exchange, Commodities and Future Market of SãoPaulo (BM&FBovespa). In this sense, in order to answer that ques-tion, the objective of this study is to analyze the relationshipbetween determinants of disclosure of information on the envi-ronmental impacts of Brazilian companies listed on the IBrX-100BM&FBovespa.
The research is justified by the possibility of investigating thevariables that showed conflicting results in the literature, sincesome authors have identified a relationship with positive influencebetween such relationships, and some others, a negative relation-ship. Therefore, it is expected that the findings of this researchcontribute to the existing knowledge on the subject and to provideevidence for further studies.
One aspect that contributes to the originality of the work isthe use of the multi-criteria method Trade-Off Decision Analy-sis (T-ODA), unprecedented in environmental disclosure theme inresearch conducted in national and international level. From thismethod, it was possible to measure the degree of environmentaldisclosure and the relation between the determining factors andvariables with this degree. Nossa (2002) stresses that companiesmust convince society that their environmental practices are notharmful to their profitability, let alone to the environment. There-fore, the identified factors will contribute to the expectations ofsociety, since population can, from these factors that have beenshown to be related to increased environmental disclosure, evalu-ate the company.
To achieve this goal, the paper is organized as follows: in the
second section there is a review of the literature; the third sectiondescribes the used methodology; the fourth section presents theresults. Finally, in the last section there are the conclusions andsuggestions for future research.
2 Geren
2
Ipte
2
loNcba
muitao
sccie2
stt
sant
sep(ii
2
rMmtcttaiis
cew
6 M. Vogt et al. / Estudios
. Theoretical background
The theoretical framework is divided into three subsections.nitially it focuses on the Theory of Legitimacy. Following, weresent the Environmental Disclosure and finally, the assumptionshat were based on the main authors related to the theme, whichnables to base the methodology adopted in this study.
.1. Legitimacy theory
According to Buhr (1998) and Czesnat and Machado (2012), theegitimacy of a company is achieved when they show that theirrganizational activities comply with their social values. Thus, toeu, Warsame, and Pedwell (1998) the fact that there is the need forompanies to operate in a competitive global economy, legitimacyecomes increasingly important, but it is always more difficult tochieve.
Therefore for the company to achieve or maintain legitimacy, itust act in favor of what society establishes, disclosing the meas-
res that were taken. However, in society, there are groups ofndividuals that are usually identified as stakeholders. It is fromhe Legitimacy Theory and stakeholders that the company’s man-gers should communicate to these groups their ways of achievingr protecting legitimacy (Cormier, Gordon, & Magnan, 2004).
The Legitimacy Theory is the lens that interprets a series oftudies on the reports and on the environmental performance ofompanies. This theory is used as an explanation for the reactions ofompanies to threats of their legitimacy. Environmental disclosures a communication mechanism that companies use to meet thexternal pressure and to adapt to socially accepted norms (Mobus,005).
Companies achieve legitimacy from the moment they demon-trate that they are acting according to the values, rules and beliefshat are set by society. Disclosure is one of the means to achievehis end (Boff, 2007; Czesnat & Machado, 2012).
Lu and Abeysekera (2014) argue that this theory focuses on whatociety in general expects from companies, since companies thatre more likely to be subject to public scrutiny, such as large compa-ies, disclose more social and environmental information to meethe expectations of society.
In short, the Legitimacy Theory focuses on society, taking theocial contract as a link between the company and society. How-ver, society is composed of different groups that have differentower between one other to influence companies and other groupsAburaya, 2012). Therefore, we believe that the disclosure of morenformation can contribute to the legitimacy of companies, increas-ng its reputation and recognition of society.
.2. Environmental disclosure
The number of companies that voluntarily disclose their socialesponsibility activities in their reports is increasing (Hackston &ilne, 1996). According to Deegan and Rankin (1997), the fact thatanagers voluntarily report environmental data is due to the fact
hat they consider the information relevant to users. Society mayancel their social contract with the company, unless it commitso the provision of certain information to combat or even offsethe negative news exposed to the public. The disclosure is defineds a set of information related to the activities of an organization,ts performance and financial implications that are associated tot. In recent years environmental disclosure expanded worldwideignificantly (Wang & Bernell, 2013).
By the early twentieth century there was little concern fromompanies regarding to the preservation and restoration of thenvironment. This is because at that time the natural resourcesere considered abundant and managers were using these
ciales 33 (2017) 24–38
resources as an inexhaustible source of raw material at a very lowcost or even zero (Costa, 2006).
From the moment that the effects of the damage to the environ-ment began to manifest in the form of air pollution, contaminationof rivers, seas and soils, degradation of fertile areas, among otherconsequences, society began asking organizations for greater envi-ronmental responsibility. The market selected companies that werecommitted to the preservation, maintenance and restoration of theenvironment, whereas the others would jeopardize the future ofthe planet (Costa, 2006).
In the scientific literature there are social, annual, and sus-tainability reports, among others. In general, environmental reportsinclude information that is related to the company’s managementtoward the environment and society. It is a right and a duty ofsociety to require from companies the responsibility with the envi-ronment (Boff, 2007). The Annual Report of companies is seen astheir business card, since it is intended to express the company’simage (Daub, 2007). At first, there had been few detailed environ-mental information in annual reports (Harte & Owen, 1991).
On the other hand, the term Sustainability Report (SR) hasbecome a linguistic loan from the term Sustainability (Daub, 2007).Over the past decade, Sustainability Reports have been adopted bymore and more companies around the world (Lozano & Huisingh,2011). Science discusses the best way for companies to demon-strate their environmental information. Several scientific studiesare carried out to promote the evaluation of the environmen-tal information performance which is also called environmentaldisclosure (Rosa, Ensslin, & Ensslin, 2009). Social and environmen-tal disclosure can add value to businesses. However, it is not thesame reality in all organizations, which hinders its standardizationbetween them and the evaluation of information by stakeholders(Borges, Rosa, & Ensslin, 2010).
Even if environmental disclosure was supposed to always takeplace in Brazil, the law does not require companies to disclose infor-mation. There is a global trend in which investors seek companiesthat are socially responsible, sustainable and profitable to applytheir resources (Oliveira, Machado, & Beuren, 2012). While com-panies are responsible for economic development, they are alsocriticized because of the negative impact they cause through emis-sions and misuse of natural resources (Suave, Boff, Kroetz, Rosa, &Lunkes, 2012).
The global concern for the environment increases more andmore, as does the need for more studies on the establishment ofenvironmental disclosure value to stakeholders. After all, environ-mental responsibility can be seen as a strategy that companiesadopt to meet the expectations of stakeholders (Aburaya, 2012).
The challenge of environmental preservation has increased andforced companies to improve their disclosure of policies and alsotheir environmental actions. In recent decades, the environmen-tal variables have come to represent the competitive advantage inbuilding relationships with stakeholders in the long run. Therefore,companies around the world need to worry about environmentalpreservation and restoration (Trierweiller, Peixe, Tezza, Bornia, &Campos, 2013).
One of the factors that can influence the company’s abilityto obtain environmental awards is their level of environmentaldisclosure (Hassan & Ibrahim, 2012). The level of disclosure ofenvironmental information reflects on the degree of corporateenvironmental responsibility of the companies. Due to informationasymmetry between stakeholders and senior executives, informa-tion on environmental practices can be easily manipulated, whichresults in impressions management (Meng, Zeng, Tam, & Xu, 2013).
In this context, the voluntary disclosure of social and environ-mental information is an example of the rules and structures thatare implemented by companies to respond to social pressures.These pressures, together with the increasing acceptance of the
Geren
d(tbd
ttTwatmc
2
irpo–
wetsottptnmH
aBfBo
HfB
Ht
He
Hd
pdorcrfees
M. Vogt et al. / Estudios
issemination of structures like the Global Reporting InitiativeGRI), encourage companies to disclose more information on sus-ainability. Traditionally, environmental disclosure is incorporatedroadly in university curricula and is the object of extensive aca-emic research (Villiers, Low, & Samkin, 2014).
Finally, Silva, Vicente, Pfitscher, and Rosa (2013) explain thathe disclosure is understood as a way in which companies meethe demands of their users about the environmental information.herefore, this information is usually disclosed in the companies’ebsites or through reports (Annual Report, Sustainability Report,
nd others). Legitimacy is built and maintained by symbolic actionshat structure the company’s image. Adopting the disclosure is a
ethod of managing the impressions of society, ensuring businessontinuity.
.3. Hypothesis
Once the importance of the discussion of the factors thatnfluence the environmental disclosure of Brazilian companies isecognized, the hypothesis that this research aims to test areresented. To support the developed hypotheses, some resultsbtained in previous studies worldwide on the subject were listed
which presented controversial results.Thus, three research hypotheses about the determining factors
ere established (environmental performance, transparency andconomic performance) and nine sub-hypotheses of the variableshat make up these factors, which help to analyze the relation-hip of the determining factors of the disclosure of informationn the environmental impacts of Brazilian companies. Regardinghe environmental performance factor, Ashcroft (2012) points outhat the concern of society for environmental issues has beenresent for several decades and companies face increasing pressureo demonstrate their environmental performance. Usually compa-ies with good environmental performance are those that discloseore information on the environment (Al-Tuwaijri, Christensen, &ughes, 2004).
The results obtained from the studies of Rosa et al. (2013, 2014)nd Iatridis (2013) revealed that the environmental disclosure ofrazilian companies was positively related to environmental per-
ormance. Thus, given that this study analyzed another period andrazilian companies belonging to the IBrX-100, the first hypothesisf this research emerges and their due sub-hypothesis:
1. There is a relationship between the environmental per-ormance factor and the degree of environmental disclosure ofrazilian companies Analysis of Variance (ANOVA).
1a. The Corporate Sustainability Index (CSI) positively influenceshe degree of environmental disclosure.
1b. The pollution potential positively influences the degree ofnvironmental disclosure.
1c. The Global Reporting Initiative (GRI) positively influences theegree of environmental disclosure.
Some studies have been conducted in order to identify the trans-arency and the variables that comprise it. To Aburaya (2012), theisclosures are defined as the process of disclosure of informationn the impacts of economic activities of the company to the envi-onment and this process can be considered as a means of ensuringorporate governance, which integrates transparency in their envi-onmental performance. The GRI guidelines are an international
ramework to support the reporting standards, which increasesven more the degree of transparency and consistency that is nec-ssary to make information relevant and reliable to the market andociety in general (GRI, 2013). From this context, it was possibleciales 33 (2017) 24–38 27
to elaborate the second hypothesis tested in the present study andtheir sub-hypothesis:
H2. There is a relationship between the transparency factor andthe degree of environmental disclosure of Brazilian companies(ANOVA).
H2a. Environmental audit positively influences the degree of envi-ronmental disclosure.
H2b. Corporate governance positively influences the degree ofenvironmental disclosure.
Several researchers have conducted studies in order to identifythe variables that make up the economic performance related tothe degree of environmental disclosure. According to Groppelli andNikbakht (2002), investors, stakeholders and financial managersare always attentive to the profitability of organizations.
For Gitman (2004) there are several measures of profitabilityand these allow the analyst to assess the company’s profits consid-ering their sales, assets or amount of capital invested by the owners.Among these profitability measures is the Return on Assets (ROA)and Return on Equity (ROE). Without profits no company can attractcapital (Ferreira, 2005; Gitman, 2004).
To Assaf Neto and Lima (2009), profitability indicators areintended to assess the results of a company in respect to certainparameters that reveal their dimensions in the best way. Precisely,the indicators often exert significant influences on the decisionsinvolving the company that is being analyzed. From this context,the third hypothesis of this study is presented and other sub-hypothesis:
H3. There is a relationship between the economic performancefactor and the degree of environmental disclosure of Brazilian com-panies (ANOVA).
H3a. The size positively influences the degree of environmentaldisclosure.
H3b. The stocks positively influence the degree of environmentaldisclosure.
H3c. The Return on Assets (ROA) positively influences the degreeof environmental disclosure.
H3d. Return on Equity (ROE) positively influences the degree ofenvironmental disclosure.
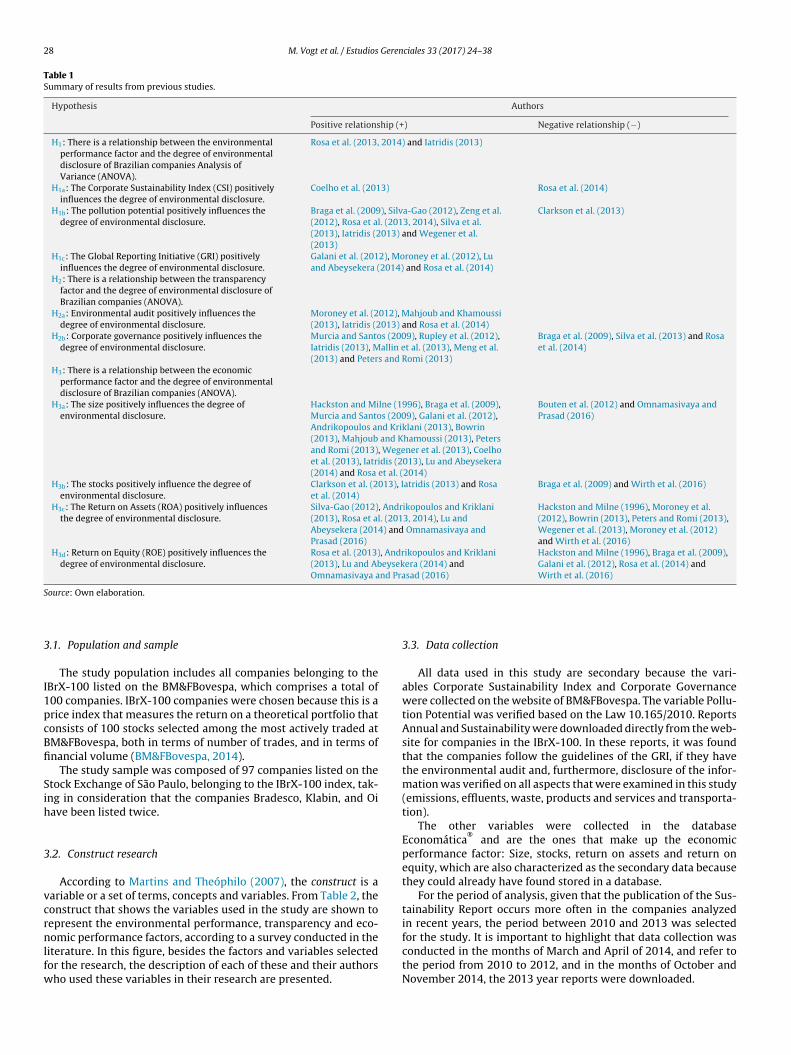
In Table 1 has a summary of the results obtained by other authorson the relationship (positive/negative) verified through hypothesesin this study.
It is noteworthy that even if the studies have been conductedin various parts of the world, environmental disclosure is seen asone of the strategies that companies use to seek acceptance andapproval of their activities on society anywhere. It is an importanttool for the legitimization of the companies, as they can be used toestablish, or maintain legitimacy as the Legitimacy Theory suggeststhat environmental disclosure provides an important way to com-municate and convince stakeholders that the company compliesyour expectations. Nevertheless, reports play an important role inachieving corporate legitimacy (Branco, Eugénio, & Ribeiro, 2008).
3. Methodology
As to the research objectives, this study is characterized asdescriptive. Regarding the procedures adopted in this study, it canbe considered a documentary research. Regarding the researchapproach to the problem, this study is classified as quantitative.
28 M. Vogt et al. / Estudios Gerenciales 33 (2017) 24–38
Table 1Summary of results from previous studies.
Hypothesis Authors
Positive relationship (+) Negative relationship (−)
H1: There is a relationship between the environmentalperformance factor and the degree of environmentaldisclosure of Brazilian companies Analysis ofVariance (ANOVA).
Rosa et al. (2013, 2014) and Iatridis (2013)
H1a: The Corporate Sustainability Index (CSI) positivelyinfluences the degree of environmental disclosure.
Coelho et al. (2013) Rosa et al. (2014)
H1b: The pollution potential positively influences thedegree of environmental disclosure.
Braga et al. (2009), Silva-Gao (2012), Zeng et al.(2012), Rosa et al. (2013, 2014), Silva et al.(2013), Iatridis (2013) and Wegener et al.(2013)
Clarkson et al. (2013)
H1c: The Global Reporting Initiative (GRI) positivelyinfluences the degree of environmental disclosure.
Galani et al. (2012), Moroney et al. (2012), Luand Abeysekera (2014) and Rosa et al. (2014)
H2: There is a relationship between the transparencyfactor and the degree of environmental disclosure ofBrazilian companies (ANOVA).
H2a: Environmental audit positively influences thedegree of environmental disclosure.
Moroney et al. (2012), Mahjoub and Khamoussi(2013), Iatridis (2013) and Rosa et al. (2014)
H2b: Corporate governance positively influences thedegree of environmental disclosure.
Murcia and Santos (2009), Rupley et al. (2012),Iatridis (2013), Mallin et al. (2013), Meng et al.(2013) and Peters and Romi (2013)
Braga et al. (2009), Silva et al. (2013) and Rosaet al. (2014)
H3: There is a relationship between the economicperformance factor and the degree of environmentaldisclosure of Brazilian companies (ANOVA).
H3a: The size positively influences the degree ofenvironmental disclosure.
Hackston and Milne (1996), Braga et al. (2009),Murcia and Santos (2009), Galani et al. (2012),Andrikopoulos and Kriklani (2013), Bowrin(2013), Mahjoub and Khamoussi (2013), Petersand Romi (2013), Wegener et al. (2013), Coelhoet al. (2013), Iatridis (2013), Lu and Abeysekera(2014) and Rosa et al. (2014)
Bouten et al. (2012) and Omnamasivaya andPrasad (2016)
H3b: The stocks positively influence the degree ofenvironmental disclosure.
Clarkson et al. (2013), Iatridis (2013) and Rosaet al. (2014)
Braga et al. (2009) and Wirth et al. (2016)
H3c: The Return on Assets (ROA) positively influencesthe degree of environmental disclosure.
Silva-Gao (2012), Andrikopoulos and Kriklani(2013), Rosa et al. (2013, 2014), Lu andAbeysekera (2014) and Omnamasivaya andPrasad (2016)
Hackston and Milne (1996), Moroney et al.(2012), Bowrin (2013), Peters and Romi (2013),Wegener et al. (2013), Moroney et al. (2012)and Wirth et al. (2016)
H3d: Return on Equity (ROE) positively influences thedegree of environmental disclosure.
Rosa et al. (2013), Andrikopoulos and Kriklani(2013), Lu and Abeysekera (2014) andOmnamasivaya and Prasad (2016)
Hackston and Milne (1996), Braga et al. (2009),Galani et al. (2012), Rosa et al. (2014) andWirth et al. (2016)
S
3
I1pcBfi
Sih
3
vcrnlfw
ource: Own elaboration.
.1. Population and sample
The study population includes all companies belonging to theBrX-100 listed on the BM&FBovespa, which comprises a total of00 companies. IBrX-100 companies were chosen because this is arice index that measures the return on a theoretical portfolio thatonsists of 100 stocks selected among the most actively traded atM&FBovespa, both in terms of number of trades, and in terms ofnancial volume (BM&FBovespa, 2014).
The study sample was composed of 97 companies listed on thetock Exchange of São Paulo, belonging to the IBrX-100 index, tak-ng in consideration that the companies Bradesco, Klabin, and Oiave been listed twice.
.2. Construct research
According to Martins and Theóphilo (2007), the construct is aariable or a set of terms, concepts and variables. From Table 2, theonstruct that shows the variables used in the study are shown toepresent the environmental performance, transparency and eco-
omic performance factors, according to a survey conducted in theiterature. In this figure, besides the factors and variables selectedor the research, the description of each of these and their authorsho used these variables in their research are presented.
3.3. Data collection
All data used in this study are secondary because the vari-ables Corporate Sustainability Index and Corporate Governancewere collected on the website of BM&FBovespa. The variable Pollu-tion Potential was verified based on the Law 10.165/2010. ReportsAnnual and Sustainability were downloaded directly from the web-site for companies in the IBrX-100. In these reports, it was foundthat the companies follow the guidelines of the GRI, if they havethe environmental audit and, furthermore, disclosure of the infor-mation was verified on all aspects that were examined in this study(emissions, effluents, waste, products and services and transporta-tion).
The other variables were collected in the databaseEconomática
®and are the ones that make up the economic
performance factor: Size, stocks, return on assets and return onequity, which are also characterized as the secondary data becausethey could already have found stored in a database.
For the period of analysis, given that the publication of the Sus-tainability Report occurs more often in the companies analyzedin recent years, the period between 2010 and 2013 was selected
for the study. It is important to highlight that data collection wasconducted in the months of March and April of 2014, and refer tothe period from 2010 to 2012, and in the months of October andNovember 2014, the 2013 year reports were downloaded.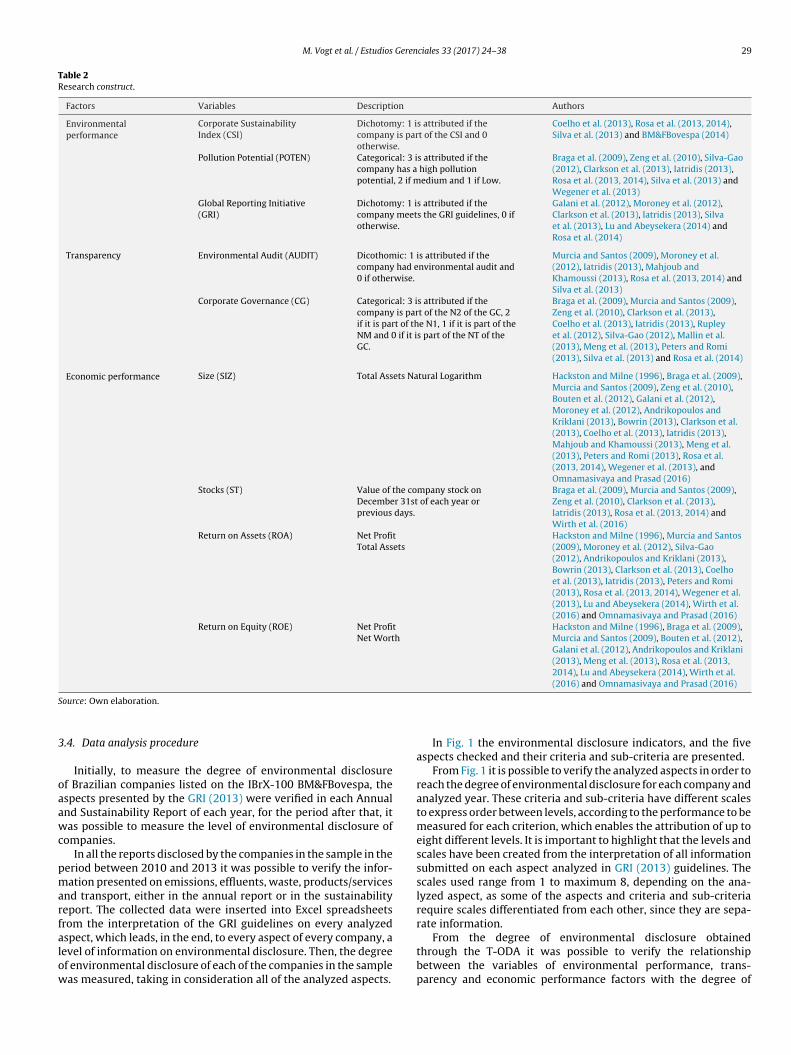
M. Vogt et al. / Estudios Gerenciales 33 (2017) 24–38 29
Table 2Research construct.
Factors Variables Description Authors
Environmentalperformance
Corporate SustainabilityIndex (CSI)
Dichotomy: 1 is attributed if thecompany is part of the CSI and 0otherwise.
Coelho et al. (2013), Rosa et al. (2013, 2014),Silva et al. (2013) and BM&FBovespa (2014)
Pollution Potential (POTEN) Categorical: 3 is attributed if thecompany has a high pollutionpotential, 2 if medium and 1 if Low.
Braga et al. (2009), Zeng et al. (2010), Silva-Gao(2012), Clarkson et al. (2013), Iatridis (2013),Rosa et al. (2013, 2014), Silva et al. (2013) andWegener et al. (2013)
Global Reporting Initiative(GRI)
Dichotomy: 1 is attributed if thecompany meets the GRI guidelines, 0 ifotherwise.
Galani et al. (2012), Moroney et al. (2012),Clarkson et al. (2013), Iatridis (2013), Silvaet al. (2013), Lu and Abeysekera (2014) andRosa et al. (2014)
Transparency Environmental Audit (AUDIT) Dicothomic: 1 is attributed if thecompany had environmental audit and0 if otherwise.
Murcia and Santos (2009), Moroney et al.(2012), Iatridis (2013), Mahjoub andKhamoussi (2013), Rosa et al. (2013, 2014) andSilva et al. (2013)
Corporate Governance (CG) Categorical: 3 is attributed if thecompany is part of the N2 of the GC, 2if it is part of the N1, 1 if it is part of theNM and 0 if it is part of the NT of theGC.
Braga et al. (2009), Murcia and Santos (2009),Zeng et al. (2010), Clarkson et al. (2013),Coelho et al. (2013), Iatridis (2013), Rupleyet al. (2012), Silva-Gao (2012), Mallin et al.(2013), Meng et al. (2013), Peters and Romi(2013), Silva et al. (2013) and Rosa et al. (2014)
Economic performance Size (SIZ) Total Assets Natural Logarithm Hackston and Milne (1996), Braga et al. (2009),Murcia and Santos (2009), Zeng et al. (2010),Bouten et al. (2012), Galani et al. (2012),Moroney et al. (2012), Andrikopoulos andKriklani (2013), Bowrin (2013), Clarkson et al.(2013), Coelho et al. (2013), Iatridis (2013),Mahjoub and Khamoussi (2013), Meng et al.(2013), Peters and Romi (2013), Rosa et al.(2013, 2014), Wegener et al. (2013), andOmnamasivaya and Prasad (2016)
Stocks (ST) Value of the company stock onDecember 31st of each year orprevious days.
Braga et al. (2009), Murcia and Santos (2009),Zeng et al. (2010), Clarkson et al. (2013),Iatridis (2013), Rosa et al. (2013, 2014) andWirth et al. (2016)
Return on Assets (ROA) Net ProfitTotal Assets
Hackston and Milne (1996), Murcia and Santos(2009), Moroney et al. (2012), Silva-Gao(2012), Andrikopoulos and Kriklani (2013),Bowrin (2013), Clarkson et al. (2013), Coelhoet al. (2013), Iatridis (2013), Peters and Romi(2013), Rosa et al. (2013, 2014), Wegener et al.(2013), Lu and Abeysekera (2014), Wirth et al.(2016) and Omnamasivaya and Prasad (2016)
Return on Equity (ROE) Net ProfitNet Worth
Hackston and Milne (1996), Braga et al. (2009),Murcia and Santos (2009), Bouten et al. (2012),Galani et al. (2012), Andrikopoulos and Kriklani(2013), Meng et al. (2013), Rosa et al. (2013,2014), Lu and Abeysekera (2014), Wirth et al.(2016) and Omnamasivaya and Prasad (2016)
S
3
oaawc
pmarfalow
ource: Own elaboration.
.4. Data analysis procedure
Initially, to measure the degree of environmental disclosuref Brazilian companies listed on the IBrX-100 BM&FBovespa, thespects presented by the GRI (2013) were verified in each Annualnd Sustainability Report of each year, for the period after that, itas possible to measure the level of environmental disclosure of
ompanies.In all the reports disclosed by the companies in the sample in the
eriod between 2010 and 2013 it was possible to verify the infor-ation presented on emissions, effluents, waste, products/services
nd transport, either in the annual report or in the sustainabilityeport. The collected data were inserted into Excel spreadsheetsrom the interpretation of the GRI guidelines on every analyzed
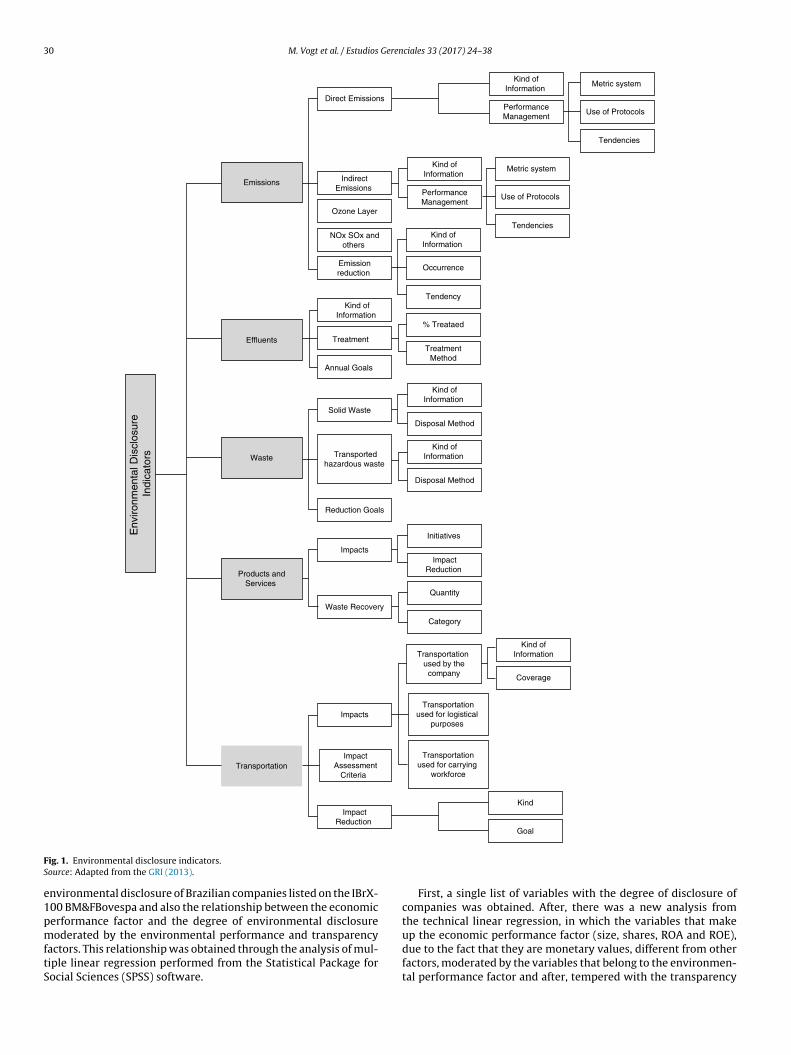
spect, which leads, in the end, to every aspect of every company, aevel of information on environmental disclosure. Then, the degreef environmental disclosure of each of the companies in the sampleas measured, taking in consideration all of the analyzed aspects.In Fig. 1 the environmental disclosure indicators, and the fiveaspects checked and their criteria and sub-criteria are presented.
From Fig. 1 it is possible to verify the analyzed aspects in order toreach the degree of environmental disclosure for each company andanalyzed year. These criteria and sub-criteria have different scalesto express order between levels, according to the performance to bemeasured for each criterion, which enables the attribution of up toeight different levels. It is important to highlight that the levels andscales have been created from the interpretation of all informationsubmitted on each aspect analyzed in GRI (2013) guidelines. Thescales used range from 1 to maximum 8, depending on the ana-lyzed aspect, as some of the aspects and criteria and sub-criteriarequire scales differentiated from each other, since they are sepa-rate information.
From the degree of environmental disclosure obtainedthrough the T-ODA it was possible to verify the relationshipbetween the variables of environmental performance, trans-parency and economic performance factors with the degree of
30 M. Vogt et al. / Estudios Gerenciales 33 (2017) 24–38
Env
ironm
enta
l Dis
clos
ure
Indi
cato
rs
Emission s
Effluent s
Waste
Products andServices
Transpo rtatio n
Direct Emissions
Indi rectEmissions
Ozone Layer
NOx SOx andothers
Emissionreduction
Treatment
Annual Goal s
Solid Waste
Transpo rtedhazardous waste
Reduction Goals
Impacts
Waste Recovery
Impacts
ImpactAssessment
Criteria
ImpactReduction
PerformanceManage ment
Perfor manceManage ment
Kind ofInformat ion
Kind ofInformat ion
Kind ofInformation
Kind ofInformat ion
Kind ofInformat ion
Kind ofInformat ion
Occurrence
Tendency
% Treataed
Treat mentMethod
Disposal Metho d
Disposal Metho d
Initiatives
ImpactReduction
Quantit y
Category
Tran spo rta tio n used by the
company
Transpo rtationused fo r lo gistical
purpo ses
Transpo rtationused fo r carrying
workforce
Metric system
Metric system
Use of Protocols
Use of Prot ocol s
Tend encies
Tend encies
Kind ofInformatio n
Coverage
Kind
Goal
FS
e1pmftS
ig. 1. Environmental disclosure indicators.ource: Adapted from the GRI (2013).
nvironmental disclosure of Brazilian companies listed on the IBrX-00 BM&FBovespa and also the relationship between the economicerformance factor and the degree of environmental disclosure
oderated by the environmental performance and transparencyactors. This relationship was obtained through the analysis of mul-iple linear regression performed from the Statistical Package forocial Sciences (SPSS) software.
First, a single list of variables with the degree of disclosure ofcompanies was obtained. After, there was a new analysis fromthe technical linear regression, in which the variables that make
up the economic performance factor (size, shares, ROA and ROE),due to the fact that they are monetary values, different from otherfactors, moderated by the variables that belong to the environmen-tal performance factor and after, tempered with the transparency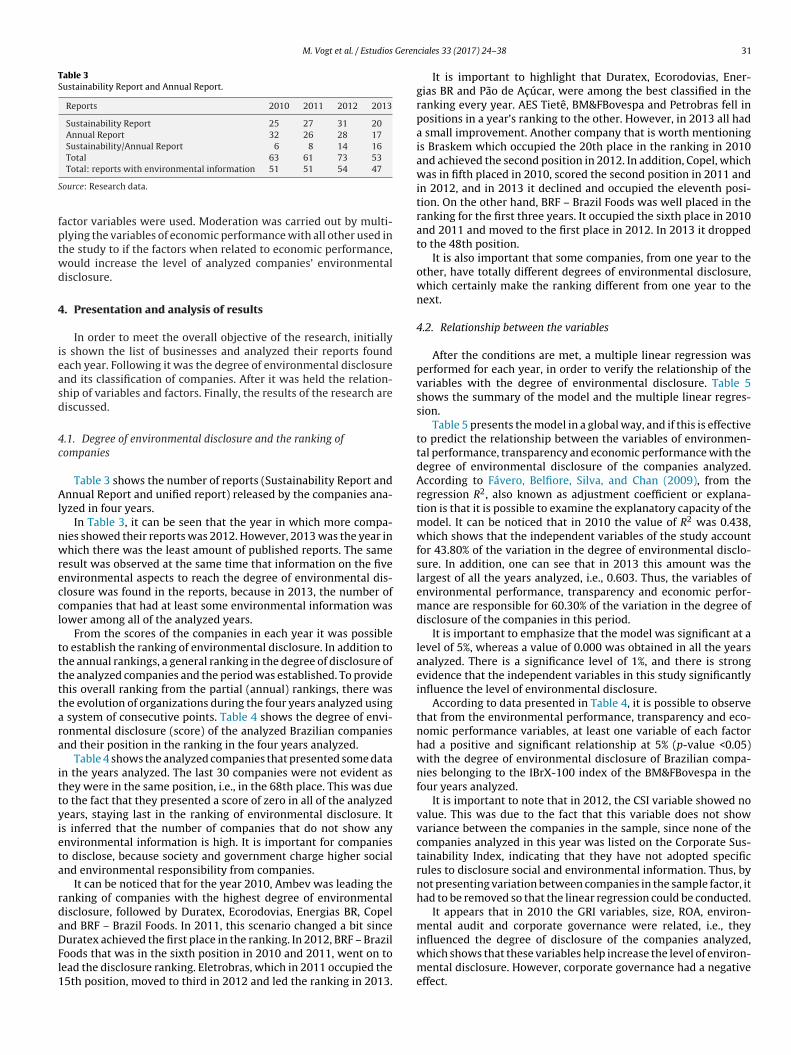
M. Vogt et al. / Estudios Geren
Table 3Sustainability Report and Annual Report.
Reports 2010 2011 2012 2013
Sustainability Report 25 27 31 20Annual Report 32 26 28 17Sustainability/Annual Report 6 8 14 16Total 63 61 73 53
S
fptwd
4
ieasd
4c
Al
nwreccl
tttttara
ittyieta
rdaDFl1
Total: reports with environmental information 51 51 54 47
ource: Research data.
actor variables were used. Moderation was carried out by multi-lying the variables of economic performance with all other used inhe study to if the factors when related to economic performance,ould increase the level of analyzed companies’ environmentalisclosure.
. Presentation and analysis of results
In order to meet the overall objective of the research, initiallys shown the list of businesses and analyzed their reports foundach year. Following it was the degree of environmental disclosurend its classification of companies. After it was held the relation-hip of variables and factors. Finally, the results of the research areiscussed.
.1. Degree of environmental disclosure and the ranking ofompanies
Table 3 shows the number of reports (Sustainability Report andnnual Report and unified report) released by the companies ana-
yzed in four years.In Table 3, it can be seen that the year in which more compa-
ies showed their reports was 2012. However, 2013 was the year inhich there was the least amount of published reports. The same
esult was observed at the same time that information on the fivenvironmental aspects to reach the degree of environmental dis-losure was found in the reports, because in 2013, the number ofompanies that had at least some environmental information wasower among all of the analyzed years.
From the scores of the companies in each year it was possibleo establish the ranking of environmental disclosure. In addition tohe annual rankings, a general ranking in the degree of disclosure ofhe analyzed companies and the period was established. To providehis overall ranking from the partial (annual) rankings, there washe evolution of organizations during the four years analyzed using
system of consecutive points. Table 4 shows the degree of envi-onmental disclosure (score) of the analyzed Brazilian companiesnd their position in the ranking in the four years analyzed.
Table 4 shows the analyzed companies that presented some datan the years analyzed. The last 30 companies were not evident ashey were in the same position, i.e., in the 68th place. This was dueo the fact that they presented a score of zero in all of the analyzedears, staying last in the ranking of environmental disclosure. Its inferred that the number of companies that do not show anynvironmental information is high. It is important for companieso disclose, because society and government charge higher socialnd environmental responsibility from companies.
It can be noticed that for the year 2010, Ambev was leading theanking of companies with the highest degree of environmentalisclosure, followed by Duratex, Ecorodovias, Energias BR, Copelnd BRF – Brazil Foods. In 2011, this scenario changed a bit since
uratex achieved the first place in the ranking. In 2012, BRF – Braziloods that was in the sixth position in 2010 and 2011, went on toead the disclosure ranking. Eletrobras, which in 2011 occupied the5th position, moved to third in 2012 and led the ranking in 2013.ciales 33 (2017) 24–38 31
It is important to highlight that Duratex, Ecorodovias, Ener-gias BR and Pão de Ac úcar, were among the best classified in theranking every year. AES Tietê, BM&FBovespa and Petrobras fell inpositions in a year’s ranking to the other. However, in 2013 all hada small improvement. Another company that is worth mentioningis Braskem which occupied the 20th place in the ranking in 2010and achieved the second position in 2012. In addition, Copel, whichwas in fifth placed in 2010, scored the second position in 2011 andin 2012, and in 2013 it declined and occupied the eleventh posi-tion. On the other hand, BRF – Brazil Foods was well placed in theranking for the first three years. It occupied the sixth place in 2010and 2011 and moved to the first place in 2012. In 2013 it droppedto the 48th position.
It is also important that some companies, from one year to theother, have totally different degrees of environmental disclosure,which certainly make the ranking different from one year to thenext.
4.2. Relationship between the variables
After the conditions are met, a multiple linear regression wasperformed for each year, in order to verify the relationship of thevariables with the degree of environmental disclosure. Table 5shows the summary of the model and the multiple linear regres-sion.
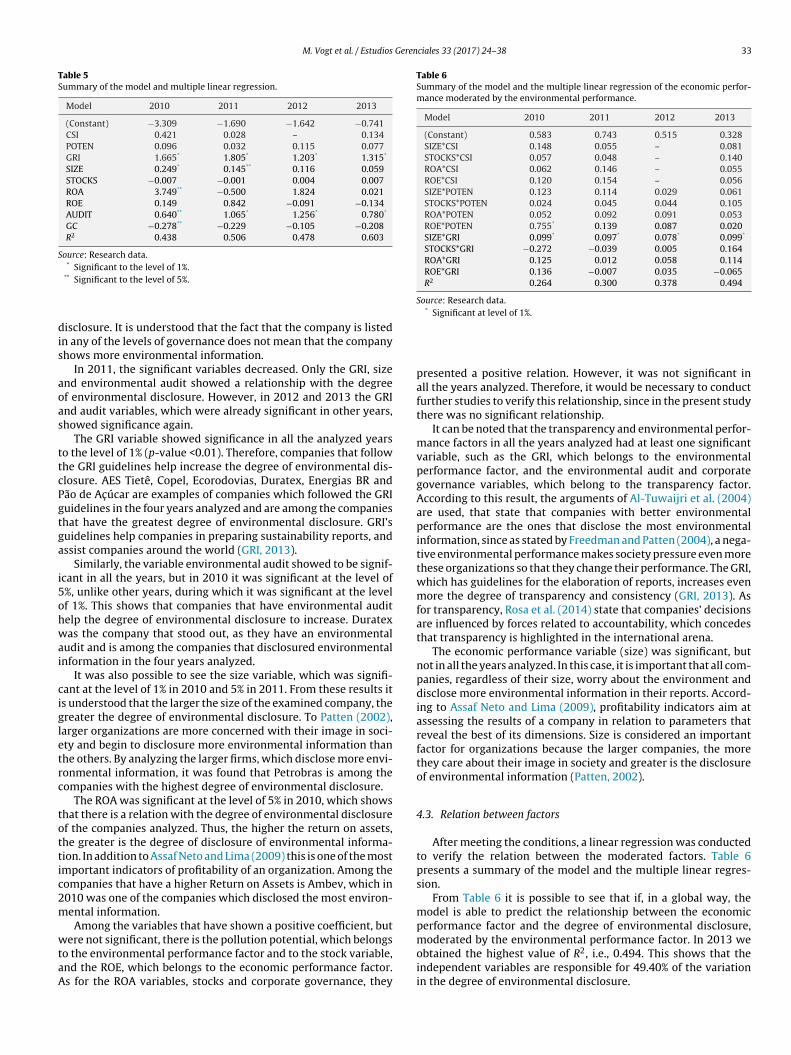
Table 5 presents the model in a global way, and if this is effectiveto predict the relationship between the variables of environmen-tal performance, transparency and economic performance with thedegree of environmental disclosure of the companies analyzed.According to Fávero, Belfiore, Silva, and Chan (2009), from theregression R2, also known as adjustment coefficient or explana-tion is that it is possible to examine the explanatory capacity of themodel. It can be noticed that in 2010 the value of R2 was 0.438,which shows that the independent variables of the study accountfor 43.80% of the variation in the degree of environmental disclo-sure. In addition, one can see that in 2013 this amount was thelargest of all the years analyzed, i.e., 0.603. Thus, the variables ofenvironmental performance, transparency and economic perfor-mance are responsible for 60.30% of the variation in the degree ofdisclosure of the companies in this period.
It is important to emphasize that the model was significant at alevel of 5%, whereas a value of 0.000 was obtained in all the yearsanalyzed. There is a significance level of 1%, and there is strongevidence that the independent variables in this study significantlyinfluence the level of environmental disclosure.
According to data presented in Table 4, it is possible to observethat from the environmental performance, transparency and eco-nomic performance variables, at least one variable of each factorhad a positive and significant relationship at 5% (p-value <0.05)with the degree of environmental disclosure of Brazilian compa-nies belonging to the IBrX-100 index of the BM&FBovespa in thefour years analyzed.
It is important to note that in 2012, the CSI variable showed novalue. This was due to the fact that this variable does not showvariance between the companies in the sample, since none of thecompanies analyzed in this year was listed on the Corporate Sus-tainability Index, indicating that they have not adopted specificrules to disclosure social and environmental information. Thus, bynot presenting variation between companies in the sample factor, ithad to be removed so that the linear regression could be conducted.
It appears that in 2010 the GRI variables, size, ROA, environ-mental audit and corporate governance were related, i.e., they
influenced the degree of disclosure of the companies analyzed,which shows that these variables help increase the level of environ-mental disclosure. However, corporate governance had a negativeeffect.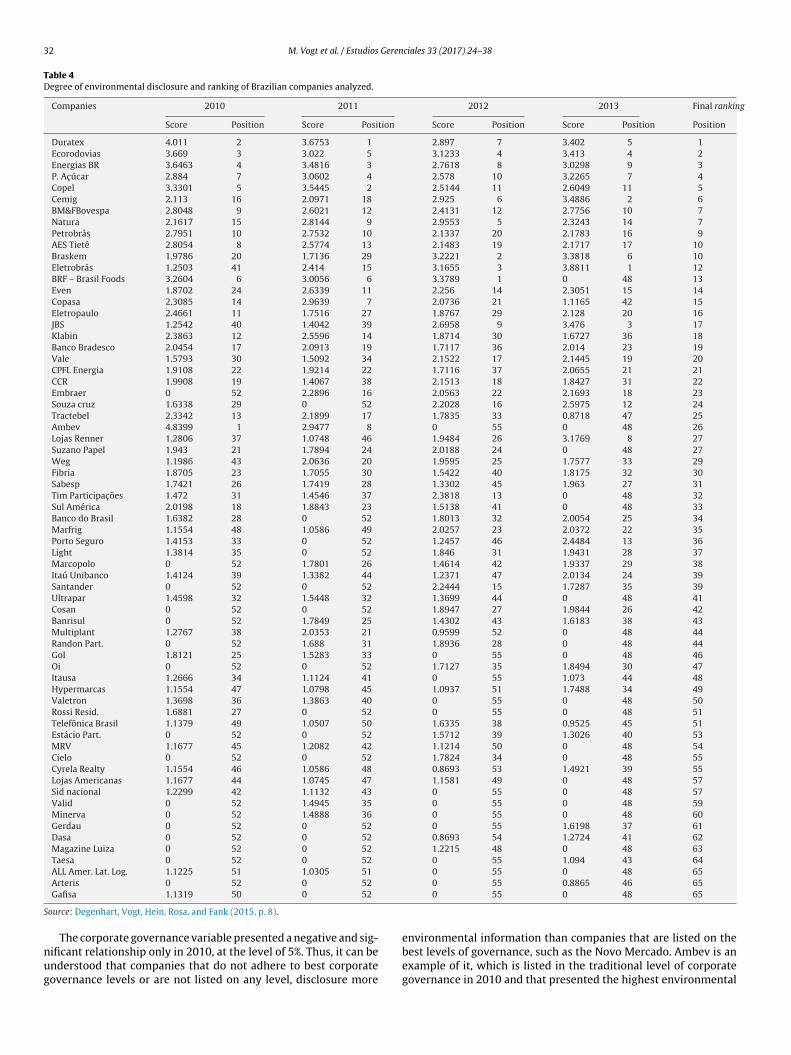
32 M. Vogt et al. / Estudios Gerenciales 33 (2017) 24–38
Table 4Degree of environmental disclosure and ranking of Brazilian companies analyzed.
Companies 2010 2011 2012 2013 Final ranking
Score Position Score Position Score Position Score Position Position
Duratex 4.011 2 3.6753 1 2.897 7 3.402 5 1Ecorodovias 3.669 3 3.022 5 3.1233 4 3.413 4 2Energias BR 3.6463 4 3.4816 3 2.7618 8 3.0298 9 3P. Ac úcar 2.884 7 3.0602 4 2.578 10 3.2265 7 4Copel 3.3301 5 3.5445 2 2.5144 11 2.6049 11 5Cemig 2.113 16 2.0971 18 2.925 6 3.4886 2 6BM&FBovespa 2.8048 9 2.6021 12 2.4131 12 2.7756 10 7Natura 2.1617 15 2.8144 9 2.9553 5 2.3243 14 7Petrobrás 2.7951 10 2.7532 10 2.1337 20 2.1783 16 9AES Tietê 2.8054 8 2.5774 13 2.1483 19 2.1717 17 10Braskem 1.9786 20 1.7136 29 3.2221 2 3.3818 6 10Eletrobrás 1.2503 41 2.414 15 3.1655 3 3.8811 1 12BRF – Brasil Foods 3.2604 6 3.0056 6 3.3789 1 0 48 13Even 1.8702 24 2.6339 11 2.256 14 2.3051 15 14Copasa 2.3085 14 2.9639 7 2.0736 21 1.1165 42 15Eletropaulo 2.4661 11 1.7516 27 1.8767 29 2.128 20 16JBS 1.2542 40 1.4042 39 2.6958 9 3.476 3 17Klabin 2.3863 12 2.5596 14 1.8714 30 1.6727 36 18Banco Bradesco 2.0454 17 2.0913 19 1.7117 36 2.014 23 19Vale 1.5793 30 1.5092 34 2.1522 17 2.1445 19 20CPFL Energia 1.9108 22 1.9214 22 1.7116 37 2.0655 21 21CCR 1.9908 19 1.4067 38 2.1513 18 1.8427 31 22Embraer 0 52 2.2896 16 2.0563 22 2.1693 18 23Souza cruz 1.6338 29 0 52 2.2028 16 2.5975 12 24Tractebel 2.3342 13 2.1899 17 1.7835 33 0.8718 47 25Ambev 4.8399 1 2.9477 8 0 55 0 48 26Lojas Renner 1.2806 37 1.0748 46 1.9484 26 3.1769 8 27Suzano Papel 1.943 21 1.7894 24 2.0188 24 0 48 27Weg 1.1986 43 2.0636 20 1.9595 25 1.7577 33 29Fibria 1.8705 23 1.7055 30 1.5422 40 1.8175 32 30Sabesp 1.7421 26 1.7419 28 1.3302 45 1.963 27 31Tim Participac ões 1.472 31 1.4546 37 2.3818 13 0 48 32Sul América 2.0198 18 1.8843 23 1.5138 41 0 48 33Banco do Brasil 1.6382 28 0 52 1.8013 32 2.0054 25 34Marfrig 1.1554 48 1.0586 49 2.0257 23 2.0372 22 35Porto Seguro 1.4153 33 0 52 1.2457 46 2.4484 13 36Light 1.3814 35 0 52 1.846 31 1.9431 28 37Marcopolo 0 52 1.7801 26 1.4614 42 1.9337 29 38Itaú Unibanco 1.4124 39 1.3382 44 1.2371 47 2.0134 24 39Santander 0 52 0 52 2.2444 15 1.7287 35 39Ultrapar 1.4598 32 1.5448 32 1.3699 44 0 48 41Cosan 0 52 0 52 1.8947 27 1.9844 26 42Banrisul 0 52 1.7849 25 1.4302 43 1.6183 38 43Multiplant 1.2767 38 2.0353 21 0.9599 52 0 48 44Randon Part. 0 52 1.688 31 1.8936 28 0 48 44Gol 1.8121 25 1.5283 33 0 55 0 48 46Oi 0 52 0 52 1.7127 35 1.8494 30 47Itausa 1.2666 34 1.1124 41 0 55 1.073 44 48Hypermarcas 1.1554 47 1.0798 45 1.0937 51 1.7488 34 49Valetron 1.3698 36 1.3863 40 0 55 0 48 50Rossi Resid. 1.6881 27 0 52 0 55 0 48 51Telefônica Brasil 1.1379 49 1.0507 50 1.6335 38 0.9525 45 51Estácio Part. 0 52 0 52 1.5712 39 1.3026 40 53MRV 1.1677 45 1.2082 42 1.1214 50 0 48 54Cielo 0 52 0 52 1.7824 34 0 48 55Cyrela Realty 1.1554 46 1.0586 48 0.8693 53 1.4921 39 55Lojas Americanas 1.1677 44 1.0745 47 1.1581 49 0 48 57Sid nacional 1.2299 42 1.1132 43 0 55 0 48 57Valid 0 52 1.4945 35 0 55 0 48 59Minerva 0 52 1.4888 36 0 55 0 48 60Gerdau 0 52 0 52 0 55 1.6198 37 61Dasa 0 52 0 52 0.8693 54 1.2724 41 62Magazine Luiza 0 52 0 52 1.2215 48 0 48 63Taesa 0 52 0 52 0 55 1.094 43 64ALL Amer. Lat. Log. 1.1225 51 1.0305 51 0 55 0 48 65
S
nug
Arteris 0 52 0 52
Gafisa 1.1319 50 0 52
ource: Degenhart, Vogt, Hein, Rosa, and Fank (2015, p. 8).
The corporate governance variable presented a negative and sig-ificant relationship only in 2010, at the level of 5%. Thus, it can benderstood that companies that do not adhere to best corporateovernance levels or are not listed on any level, disclosure more
0 55 0.8865 46 650 55 0 48 65
environmental information than companies that are listed on thebest levels of governance, such as the Novo Mercado. Ambev is anexample of it, which is listed in the traditional level of corporategovernance in 2010 and that presented the highest environmental
M. Vogt et al. / Estudios Gerenciales 33 (2017) 24–38 33
Table 5Summary of the model and multiple linear regression.
Model 2010 2011 2012 2013
(Constant) −3.309 −1.690 −1.642 −0.741CSI 0.421 0.028 – 0.134POTEN 0.096 0.032 0.115 0.077GRI 1.665* 1.805* 1.203* 1.315*
SIZE 0.249* 0.145** 0.116 0.059STOCKS −0.007 −0.001 0.004 0.007ROA 3.749** −0.500 1.824 0.021ROE 0.149 0.842 −0.091 −0.134AUDIT 0.640** 1.065* 1.256* 0.780*
GC −0.278** −0.229 −0.105 −0.208R2 0.438 0.506 0.478 0.603
Source: Research data.* Significant to the level of 1%.
dis
aoas
ttcPgtga
i5ohwai
cigletrc
tottic2m
wtaA
Table 6Summary of the model and the multiple linear regression of the economic perfor-mance moderated by the environmental performance.
Model 2010 2011 2012 2013
(Constant) 0.583 0.743 0.515 0.328SIZE*CSI 0.148 0.055 – 0.081STOCKS*CSI 0.057 0.048 – 0.140ROA*CSI 0.062 0.146 – 0.055ROE*CSI 0.120 0.154 – 0.056SIZE*POTEN 0.123 0.114 0.029 0.061STOCKS*POTEN 0.024 0.045 0.044 0.105ROA*POTEN 0.052 0.092 0.091 0.053ROE*POTEN 0.755* 0.139 0.087 0.020SIZE*GRI 0.099* 0.097* 0.078* 0.099*
STOCKS*GRI −0.272 −0.039 0.005 0.164ROA*GRI 0.125 0.012 0.058 0.114ROE*GRI 0.136 −0.007 0.035 −0.065R2 0.264 0.300 0.378 0.494
Source: Research data.* Significant at level of 1%.
** Significant to the level of 5%.
isclosure. It is understood that the fact that the company is listedn any of the levels of governance does not mean that the companyhows more environmental information.
In 2011, the significant variables decreased. Only the GRI, sizend environmental audit showed a relationship with the degreef environmental disclosure. However, in 2012 and 2013 the GRInd audit variables, which were already significant in other years,howed significance again.
The GRI variable showed significance in all the analyzed yearso the level of 1% (p-value <0.01). Therefore, companies that followhe GRI guidelines help increase the degree of environmental dis-losure. AES Tietê, Copel, Ecorodovias, Duratex, Energias BR andão de Ac úcar are examples of companies which followed the GRIuidelines in the four years analyzed and are among the companieshat have the greatest degree of environmental disclosure. GRI’suidelines help companies in preparing sustainability reports, andssist companies around the world (GRI, 2013).
Similarly, the variable environmental audit showed to be signif-cant in all the years, but in 2010 it was significant at the level of%, unlike other years, during which it was significant at the levelf 1%. This shows that companies that have environmental auditelp the degree of environmental disclosure to increase. Duratexas the company that stood out, as they have an environmental
udit and is among the companies that disclosured environmentalnformation in the four years analyzed.
It was also possible to see the size variable, which was signifi-ant at the level of 1% in 2010 and 5% in 2011. From these results its understood that the larger the size of the examined company, thereater the degree of environmental disclosure. To Patten (2002),arger organizations are more concerned with their image in soci-ty and begin to disclosure more environmental information thanhe others. By analyzing the larger firms, which disclose more envi-onmental information, it was found that Petrobras is among theompanies with the highest degree of environmental disclosure.
The ROA was significant at the level of 5% in 2010, which showshat there is a relation with the degree of environmental disclosuref the companies analyzed. Thus, the higher the return on assets,he greater is the degree of disclosure of environmental informa-ion. In addition to Assaf Neto and Lima (2009) this is one of the mostmportant indicators of profitability of an organization. Among theompanies that have a higher Return on Assets is Ambev, which in010 was one of the companies which disclosed the most environ-ental information.Among the variables that have shown a positive coefficient, but
ere not significant, there is the pollution potential, which belongso the environmental performance factor and to the stock variable,nd the ROE, which belongs to the economic performance factor.s for the ROA variables, stocks and corporate governance, they
presented a positive relation. However, it was not significant inall the years analyzed. Therefore, it would be necessary to conductfurther studies to verify this relationship, since in the present studythere was no significant relationship.
It can be noted that the transparency and environmental perfor-mance factors in all the years analyzed had at least one significantvariable, such as the GRI, which belongs to the environmentalperformance factor, and the environmental audit and corporategovernance variables, which belong to the transparency factor.According to this result, the arguments of Al-Tuwaijri et al. (2004)are used, that state that companies with better environmentalperformance are the ones that disclose the most environmentalinformation, since as stated by Freedman and Patten (2004), a nega-tive environmental performance makes society pressure even morethese organizations so that they change their performance. The GRI,which has guidelines for the elaboration of reports, increases evenmore the degree of transparency and consistency (GRI, 2013). Asfor transparency, Rosa et al. (2014) state that companies’ decisionsare influenced by forces related to accountability, which concedesthat transparency is highlighted in the international arena.
The economic performance variable (size) was significant, butnot in all the years analyzed. In this case, it is important that all com-panies, regardless of their size, worry about the environment anddisclose more environmental information in their reports. Accord-ing to Assaf Neto and Lima (2009), profitability indicators aim atassessing the results of a company in relation to parameters thatreveal the best of its dimensions. Size is considered an importantfactor for organizations because the larger companies, the morethey care about their image in society and greater is the disclosureof environmental information (Patten, 2002).
4.3. Relation between factors
After meeting the conditions, a linear regression was conductedto verify the relation between the moderated factors. Table 6presents a summary of the model and the multiple linear regres-sion.
From Table 6 it is possible to see that if, in a global way, themodel is able to predict the relationship between the economicperformance factor and the degree of environmental disclosure,moderated by the environmental performance factor. In 2013 we
obtained the highest value of R2, i.e., 0.494. This shows that theindependent variables are responsible for 49.40% of the variationin the degree of environmental disclosure.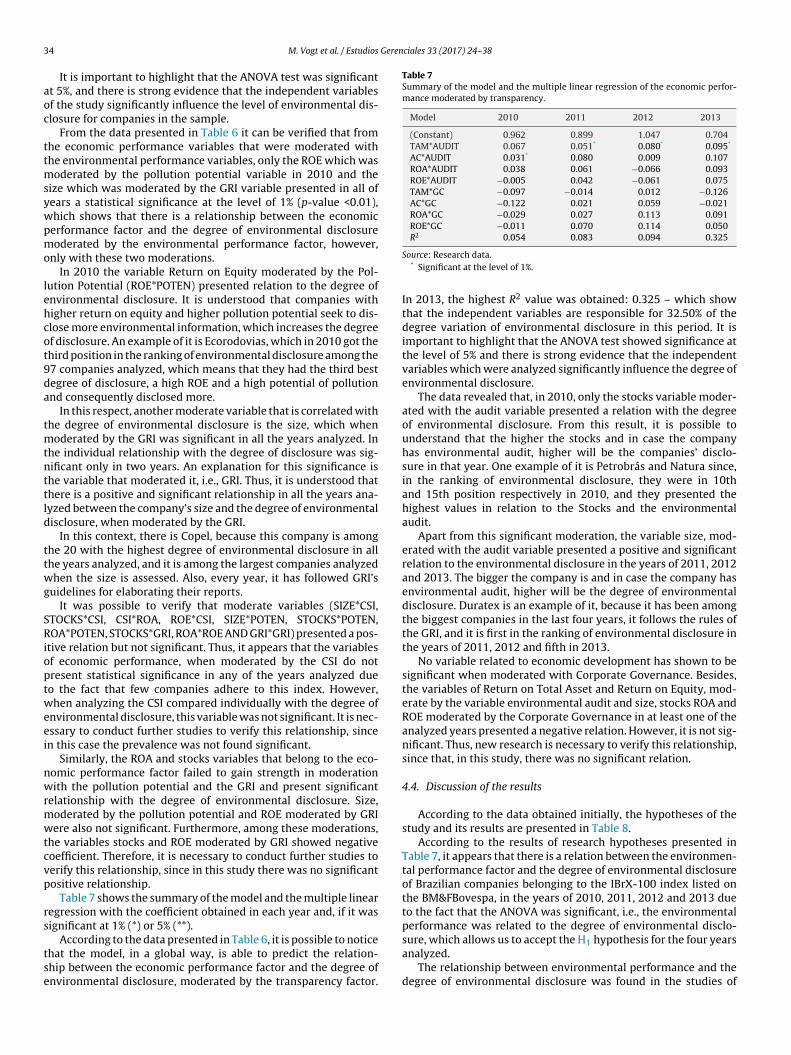
3 Gerenciales 33 (2017) 24–38
aoc
ttmsywpmo
lehcot9da
tmtnttld
ttwg
SRioptweei
nwrmwtcvp
rs
tse
Table 7Summary of the model and the multiple linear regression of the economic perfor-mance moderated by transparency.
Model 2010 2011 2012 2013
(Constant) 0.962 0.899 1.047 0.704TAM*AUDIT 0.067 0.051* 0.080* 0.095*
AC*AUDIT 0.031* 0.080 0.009 0.107ROA*AUDIT 0.038 0.061 −0.066 0.093ROE*AUDIT −0.005 0.042 −0.061 0.075TAM*GC −0.097 −0.014 0.012 −0.126AC*GC −0.122 0.021 0.059 −0.021ROA*GC −0.029 0.027 0.113 0.091ROE*GC −0.011 0.070 0.114 0.050R2 0.054 0.083 0.094 0.325
4 M. Vogt et al. / Estudios
It is important to highlight that the ANOVA test was significantt 5%, and there is strong evidence that the independent variablesf the study significantly influence the level of environmental dis-losure for companies in the sample.
From the data presented in Table 6 it can be verified that fromhe economic performance variables that were moderated withhe environmental performance variables, only the ROE which was
oderated by the pollution potential variable in 2010 and theize which was moderated by the GRI variable presented in all ofears a statistical significance at the level of 1% (p-value <0.01),hich shows that there is a relationship between the economicerformance factor and the degree of environmental disclosureoderated by the environmental performance factor, however,
nly with these two moderations.In 2010 the variable Return on Equity moderated by the Pol-
ution Potential (ROE*POTEN) presented relation to the degree ofnvironmental disclosure. It is understood that companies withigher return on equity and higher pollution potential seek to dis-lose more environmental information, which increases the degreef disclosure. An example of it is Ecorodovias, which in 2010 got thehird position in the ranking of environmental disclosure among the7 companies analyzed, which means that they had the third bestegree of disclosure, a high ROE and a high potential of pollutionnd consequently disclosed more.
In this respect, another moderate variable that is correlated withhe degree of environmental disclosure is the size, which when
oderated by the GRI was significant in all the years analyzed. Inhe individual relationship with the degree of disclosure was sig-ificant only in two years. An explanation for this significance ishe variable that moderated it, i.e., GRI. Thus, it is understood thathere is a positive and significant relationship in all the years ana-yzed between the company’s size and the degree of environmentalisclosure, when moderated by the GRI.
In this context, there is Copel, because this company is amonghe 20 with the highest degree of environmental disclosure in allhe years analyzed, and it is among the largest companies analyzedhen the size is assessed. Also, every year, it has followed GRI’s
uidelines for elaborating their reports.It was possible to verify that moderate variables (SIZE*CSI,
TOCKS*CSI, CSI*ROA, ROE*CSI, SIZE*POTEN, STOCKS*POTEN,OA*POTEN, STOCKS*GRI, ROA*ROE AND GRI*GRI) presented a pos-
tive relation but not significant. Thus, it appears that the variablesf economic performance, when moderated by the CSI do notresent statistical significance in any of the years analyzed dueo the fact that few companies adhere to this index. However,hen analyzing the CSI compared individually with the degree of
nvironmental disclosure, this variable was not significant. It is nec-ssary to conduct further studies to verify this relationship, sincen this case the prevalence was not found significant.
Similarly, the ROA and stocks variables that belong to the eco-omic performance factor failed to gain strength in moderationith the pollution potential and the GRI and present significant
elationship with the degree of environmental disclosure. Size,oderated by the pollution potential and ROE moderated by GRIere also not significant. Furthermore, among these moderations,
he variables stocks and ROE moderated by GRI showed negativeoefficient. Therefore, it is necessary to conduct further studies toerify this relationship, since in this study there was no significantositive relationship.
Table 7 shows the summary of the model and the multiple linearegression with the coefficient obtained in each year and, if it wasignificant at 1% (*) or 5% (**).
According to the data presented in Table 6, it is possible to noticehat the model, in a global way, is able to predict the relation-hip between the economic performance factor and the degree ofnvironmental disclosure, moderated by the transparency factor.
Source: Research data.* Significant at the level of 1%.
In 2013, the highest R2 value was obtained: 0.325 – which showthat the independent variables are responsible for 32.50% of thedegree variation of environmental disclosure in this period. It isimportant to highlight that the ANOVA test showed significance atthe level of 5% and there is strong evidence that the independentvariables which were analyzed significantly influence the degree ofenvironmental disclosure.
The data revealed that, in 2010, only the stocks variable moder-ated with the audit variable presented a relation with the degreeof environmental disclosure. From this result, it is possible tounderstand that the higher the stocks and in case the companyhas environmental audit, higher will be the companies’ disclo-sure in that year. One example of it is Petrobrás and Natura since,in the ranking of environmental disclosure, they were in 10thand 15th position respectively in 2010, and they presented thehighest values in relation to the Stocks and the environmentalaudit.
Apart from this significant moderation, the variable size, mod-erated with the audit variable presented a positive and significantrelation to the environmental disclosure in the years of 2011, 2012and 2013. The bigger the company is and in case the company hasenvironmental audit, higher will be the degree of environmentaldisclosure. Duratex is an example of it, because it has been amongthe biggest companies in the last four years, it follows the rules ofthe GRI, and it is first in the ranking of environmental disclosure inthe years of 2011, 2012 and fifth in 2013.
No variable related to economic development has shown to besignificant when moderated with Corporate Governance. Besides,the variables of Return on Total Asset and Return on Equity, mod-erate by the variable environmental audit and size, stocks ROA andROE moderated by the Corporate Governance in at least one of theanalyzed years presented a negative relation. However, it is not sig-nificant. Thus, new research is necessary to verify this relationship,since that, in this study, there was no significant relation.
4.4. Discussion of the results
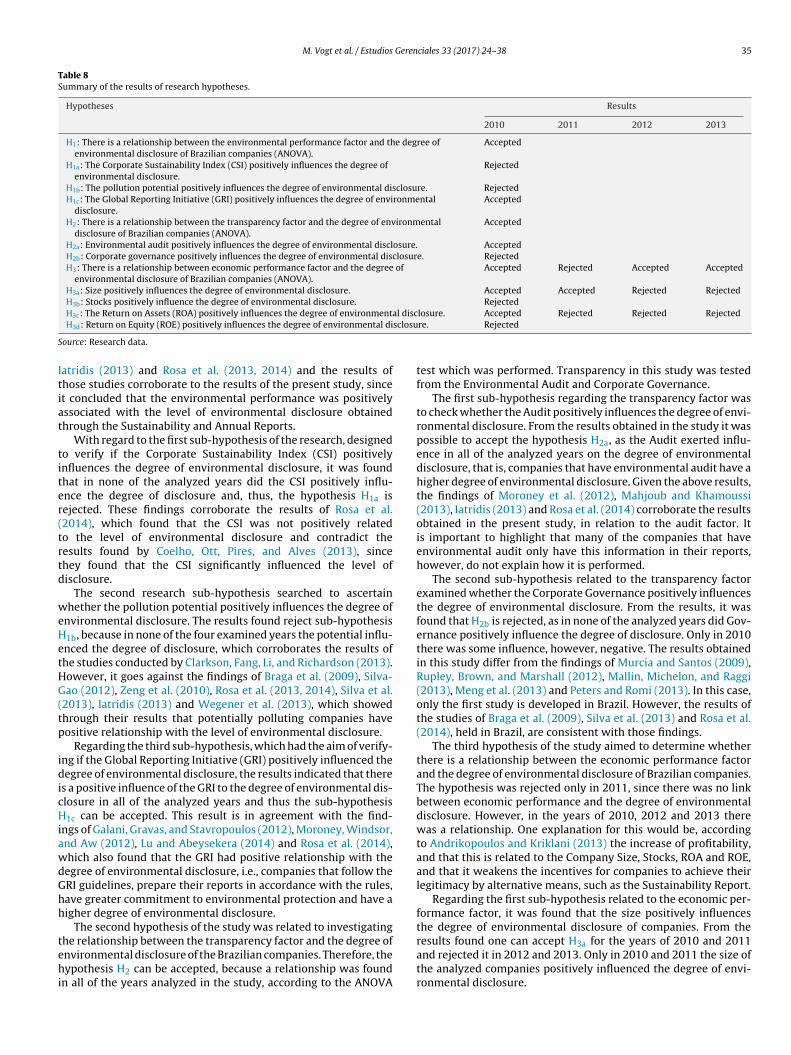
According to the data obtained initially, the hypotheses of thestudy and its results are presented in Table 8.
According to the results of research hypotheses presented inTable 7, it appears that there is a relation between the environmen-tal performance factor and the degree of environmental disclosureof Brazilian companies belonging to the IBrX-100 index listed onthe BM&FBovespa, in the years of 2010, 2011, 2012 and 2013 dueto the fact that the ANOVA was significant, i.e., the environmentalperformance was related to the degree of environmental disclo-
sure, which allows us to accept the H1 hypothesis for the four yearsanalyzed.The relationship between environmental performance and thedegree of environmental disclosure was found in the studies of
M. Vogt et al. / Estudios Gerenciales 33 (2017) 24–38 35
Table 8Summary of the results of research hypotheses.
Hypotheses Results
2010 2011 2012 2013
H1: There is a relationship between the environmental performance factor and the degree ofenvironmental disclosure of Brazilian companies (ANOVA).
Accepted
H1a: The Corporate Sustainability Index (CSI) positively influences the degree ofenvironmental disclosure.
Rejected
H1b: The pollution potential positively influences the degree of environmental disclosure. RejectedH1c: The Global Reporting Initiative (GRI) positively influences the degree of environmental
disclosure.Accepted
H2: There is a relationship between the transparency factor and the degree of environmentaldisclosure of Brazilian companies (ANOVA).
Accepted
H2a: Environmental audit positively influences the degree of environmental disclosure. AcceptedH2b: Corporate governance positively influences the degree of environmental disclosure. RejectedH3: There is a relationship between economic performance factor and the degree of
environmental disclosure of Brazilian companies (ANOVA).Accepted Rejected Accepted Accepted
H3a: Size positively influences the degree of environmental disclosure. Accepted Accepted Rejected RejectedH3b: Stocks positively influence the degree of environmental disclosure. Rejected
al discsclosu
S
Itiat
titer(trtd
weHetHG(tp
idicHiawdGhh
tehi
H3c: The Return on Assets (ROA) positively influences the degree of environmentH3d: Return on Equity (ROE) positively influences the degree of environmental di
ource: Research data.
atridis (2013) and Rosa et al. (2013, 2014) and the results ofhose studies corroborate to the results of the present study, sincet concluded that the environmental performance was positivelyssociated with the level of environmental disclosure obtainedhrough the Sustainability and Annual Reports.
With regard to the first sub-hypothesis of the research, designedo verify if the Corporate Sustainability Index (CSI) positivelynfluences the degree of environmental disclosure, it was foundhat in none of the analyzed years did the CSI positively influ-nce the degree of disclosure and, thus, the hypothesis H1a isejected. These findings corroborate the results of Rosa et al.2014), which found that the CSI was not positively relatedo the level of environmental disclosure and contradict theesults found by Coelho, Ott, Pires, and Alves (2013), sincehey found that the CSI significantly influenced the level ofisclosure.
The second research sub-hypothesis searched to ascertainhether the pollution potential positively influences the degree of
nvironmental disclosure. The results found reject sub-hypothesis1b, because in none of the four examined years the potential influ-nced the degree of disclosure, which corroborates the results ofhe studies conducted by Clarkson, Fang, Li, and Richardson (2013).owever, it goes against the findings of Braga et al. (2009), Silva-ao (2012), Zeng et al. (2010), Rosa et al. (2013, 2014), Silva et al.
2013), Iatridis (2013) and Wegener et al. (2013), which showedhrough their results that potentially polluting companies haveositive relationship with the level of environmental disclosure.
Regarding the third sub-hypothesis, which had the aim of verify-ng if the Global Reporting Initiative (GRI) positively influenced theegree of environmental disclosure, the results indicated that there
s a positive influence of the GRI to the degree of environmental dis-losure in all of the analyzed years and thus the sub-hypothesis1c can be accepted. This result is in agreement with the find-
ngs of Galani, Gravas, and Stavropoulos (2012), Moroney, Windsor,nd Aw (2012), Lu and Abeysekera (2014) and Rosa et al. (2014),hich also found that the GRI had positive relationship with theegree of environmental disclosure, i.e., companies that follow theRI guidelines, prepare their reports in accordance with the rules,ave greater commitment to environmental protection and have aigher degree of environmental disclosure.
The second hypothesis of the study was related to investigatinghe relationship between the transparency factor and the degree of
nvironmental disclosure of the Brazilian companies. Therefore, theypothesis H2 can be accepted, because a relationship was foundn all of the years analyzed in the study, according to the ANOVA
losure. Accepted Rejected Rejected Rejectedre. Rejected
test which was performed. Transparency in this study was testedfrom the Environmental Audit and Corporate Governance.
The first sub-hypothesis regarding the transparency factor wasto check whether the Audit positively influences the degree of envi-ronmental disclosure. From the results obtained in the study it waspossible to accept the hypothesis H2a, as the Audit exerted influ-ence in all of the analyzed years on the degree of environmentaldisclosure, that is, companies that have environmental audit have ahigher degree of environmental disclosure. Given the above results,the findings of Moroney et al. (2012), Mahjoub and Khamoussi(2013), Iatridis (2013) and Rosa et al. (2014) corroborate the resultsobtained in the present study, in relation to the audit factor. Itis important to highlight that many of the companies that haveenvironmental audit only have this information in their reports,however, do not explain how it is performed.
The second sub-hypothesis related to the transparency factorexamined whether the Corporate Governance positively influencesthe degree of environmental disclosure. From the results, it wasfound that H2b is rejected, as in none of the analyzed years did Gov-ernance positively influence the degree of disclosure. Only in 2010there was some influence, however, negative. The results obtainedin this study differ from the findings of Murcia and Santos (2009),Rupley, Brown, and Marshall (2012), Mallin, Michelon, and Raggi(2013), Meng et al. (2013) and Peters and Romi (2013). In this case,only the first study is developed in Brazil. However, the results ofthe studies of Braga et al. (2009), Silva et al. (2013) and Rosa et al.(2014), held in Brazil, are consistent with those findings.
The third hypothesis of the study aimed to determine whetherthere is a relationship between the economic performance factorand the degree of environmental disclosure of Brazilian companies.The hypothesis was rejected only in 2011, since there was no linkbetween economic performance and the degree of environmentaldisclosure. However, in the years of 2010, 2012 and 2013 therewas a relationship. One explanation for this would be, accordingto Andrikopoulos and Kriklani (2013) the increase of profitability,and that this is related to the Company Size, Stocks, ROA and ROE,and that it weakens the incentives for companies to achieve theirlegitimacy by alternative means, such as the Sustainability Report.
Regarding the first sub-hypothesis related to the economic per-formance factor, it was found that the size positively influencesthe degree of environmental disclosure of companies. From theresults found one can accept H3a for the years of 2010 and 2011
and rejected it in 2012 and 2013. Only in 2010 and 2011 the size ofthe analyzed companies positively influenced the degree of envi-ronmental disclosure.
3 Geren
H(B(LrtnhtfP
aesirKIac
mptdao
aewG2sa
eptih
(ce(oR
tmmoipTwd
ttnw
6 M. Vogt et al. / Estudios
Thus, the finding is consistent with the results obtained byackston and Milne (1996), Braga et al. (2009), Murcia and Santos
2009), Galani et al. (2012), Andrikopoulos and Kriklani (2013),owrin (2013), Mahjoub and Khamoussi (2013), Peters and Romi2013), Wegener et al. (2013), Coelho et al. (2013), Iatridis (2013),u and Abeysekera (2014) and Rosa et al. (2014). In this period theesult was in line with the finding of Bouten et al. (2012), who foundhat the size only influences the decision to disclosure, but it doesot influence the degree of environmental disclosure, which mayave happened in the study for the years 2012 and 2013, since inhose two years the hypothesis was rejected. However, it differsrom the findings of Bouten et al. (2012) and Omnamasivaya andrasad (2016).
The second sub-hypothesis related to economic performanceims at verifying if the stocks positively influence the degree ofnvironmental disclosure. From the results found, H3b is rejected,ince the actions of the analyzed companies did not influence itn any of the analyzed years. This finding is consistent with theesults of Braga et al. (2009) and Wirth, Kulczycka, Hausner, andonski (2016). Goes against the findings of Clarkson et al. (2013),
atridis (2013) and Rosa et al. (2014) who found that the stocksre positively related to the degree of environmental disclosure ofompanies.
Regarding the third sub-hypothesis of the economic perfor-ance factor, it sought to verify if the Return on Assets (ROA)
ositively influenced the degree of environmental disclosure. Fromhe results found, H3c was accepted for the year of 2010 and wasiscarded for the years of 2011–2013. Only in 2010 the return onssets of the analyzed companies positively influenced the degreef environmental disclosure.
Given this finding, it can be seen that the results of Hackstonnd Milne (1996), Bowrin (2013), Peters and Romi (2013), Wegenert al. (2013), Moroney et al. (2012) and Wirth et al. (2016), are in lineith the results found in this study. The results identified by Silva-ao (2012), Andrikopoulos and Kriklani (2013), Rosa et al. (2013,014) and Lu and Abeysekera (2014) go against the findings of thistudy, as these authors found that the companies with a higher ROAre more likely to disclose environmental information.
Finally, the fourth sub-hypothesis of the study, in relation toconomic performance, aims to verify if the return on equity (ROE)ositively influences the degree of environmental disclosure. Fromhe results it was found that in all the analyzed years ROA did notnfluence the degree of disclosure of the companies. Thus the H3dypothesis is rejected.
Therefore, studies of Hackston and Milne (1996), Braga et al.2009), Galani et al. (2012), Rosa et al. (2014) and Wirth et al. (2016)orroborate the findings of this research. However, studies by Rosat al. (2013), Andrikopoulos and Kriklani (2013), Lu and Abeysekera2014) and Omnamasivaya and Prasad (2016) go against the resultsf this study, since it found that there was a positive influence ofOE to the degree of environmental disclosure.
Regarding the moderate variables, when looking at the rela-ionship between economic performance factor and the degree of
oderate environmental disclosure by the environmental perfor-ance factors and the transparency of Brazilian companies listed
n the IBrX-100 BM&FBovespa, as a results, it was found that onlyn 2010 the ROE variable, moderated by the potential of pollution,resented a relationship to the degree of environmental disclosure.hus, the greater the ROE of the analyzed companies in this yearas and the greater the pollution potential was, the greater theegree of environmental disclosure obtained.
Another variable that was related to the degree of environmen-
al disclosure was the size, moderate with the GRI, in all the yearshat were analyzed. The Corporate Sustainability Index (CSI) wasot associated with the degree of environmental disclosure, nothen analyzed individually and not so even at the time that wasciales 33 (2017) 24–38
used to moderate other variables. This can be explained by the factthat few companies are listed in this index and, in 2012, none werelisted.
It is also important to highlight that there was a relationshipbetween size (economic performance) and the environmental audit(transparency) in the years of 2011–2013 and, a relation betweenwith moderate Stocks with the Audit in 2010. It is understood thatthe higher the company size is in this period and if the companyhas environmental audit, the greater the degree of environmentaldisclosure. Similarly, the higher the stocks were in 2010 and if thecompany possessed environmental audit, the greater the degree ofdisclosure was.
Given the degree of environmental disclosure of the analyzedcompanies, it is important to notice that these companies: Duratex,Ecorodovias, BR Energias and Pão de Ac úcar, which were listed inthe four analyzed years among the companies that disclosed infor-mation, were also among the companies presented in the studyconducted by Rosa et al. (2014) as the ones that stood out for theirlevel of environmental disclosure in the Annual Reports.
5. Final considerations
In response to the question study of the problem and the gen-eral objective of the research, to analyze the relationship betweendeterminants of information disclosure on the environmentalimpacts of Brazilian companies, there was a relationship betweenthe information disclosure of determinant factors in all of the yearsanalyzed, because the ANOVA test has shown relationship (statis-tically significant at 5%) to the degree of environmental disclosureof the companies analyzed.
It was possible to conclude that the variables that have shownto be more related, both individually, and when being analyzed ina moderated way by others are the variable of size, which belongsto the economic performance factor, the GRI, which belongs to theenvironmental performance factor and the environmental audit,that comprises the transparency factor. Therefore, there was onevariable from each factor. Thus, it is understood that the largerthe size of the companies, if they follow the GRI guidelines, withregard to environmental disclosure in their reports and if they haveenvironmental audit, the greater the degree of environmental dis-closure in relation to the aspects of: Emissions, Effluents, Waste,Products and Services, and Transportation of Brazilian companiesanalyzed, belonging to Brazil 100 Index (IBrX-100) listed on theBM&FBovespa.
It is noteworthy that from the moderation it was possible torelate the variables of economic performance factor to the degreeof environmental disclosure, moderated by the variables that makeup the transparency factors and environmental performance, tomake it possible, check the factors and variables that are relatedand increase the degree of environmental disclosure of analyzedBrazilian companies, which was shown from the results obtainedin this study.
Companies can increase the degree of environmental disclosureif they disclose more information in their reports on their actionson the environment, especially on the aspect of Transportation,since few of the analyzed companies have this information in theirreports. Thus, they will transmit an even better image to society,which in turn will help the company, as investors will see the com-pany through a better perspective and will invest more in theseorganizations.
Still, it is possible to emphasize that there is a pattern of disclo-
sure in the corporate reports of these companies on environmentalinformation, because, they behave differently from each other anddisclose information different from one period to another, whichindicates selection of information for environmental disclosure. It
Geren
iopd
haefeoctar
pttcoform
C
R
A
A
A
A
A
A
B
B
B
B
B
B
B
B
M. Vogt et al. / Estudios
s understood that the level of disclosure is insufficient and somef the causes for that are the lack of disclosure of environmentalractices, the inefficiency of controls and the lack of motivation forissemination, which is a research gap.
Although such relationships can be identified in this study, itas also been able to verify that it is important for companies todvertise a greater amount of information to be legitimized in soci-ty. This happens at the time when they present their activities inavor of the environment and comply with the values and rulesstablished by society. Importantly, it is increasingly difficult forrganizations to achieve legitimacy. Therefore, if companies dis-losure as much information about their environmental actions inhe Sustainability Reports and Annual Reports, they will be able tochieve the desired of legitimizing faster, which reflect the financialesults.
Limitations of this study may be related to the selection of theopulation and sample, the set of indicators that were used andhe techniques for data analysis. It is suggested for future researchhe application of this research in another sample that includes allompanies listed on the BM&FBovespa and even, companies listedn stock exchanges in other countries as well as the use of othereatures, variables and factors. It is also suggested to carry the workn to analyze the level of disclosure in the coming years. Anotherecommendation would be to use other moderations and anotherethod, which could bring different results.
onflict of interests
The authors declare that they have no conflict of interest.
eferences
buraya, R. K. (2012). The relationship between corporate governance and environ-mental disclosure: UK evidence (460 f. Tese (Doutorado)). Inglaterra: DurhamUniversity.
lbertini, E. (2013). A descriptive analysis of environmental disclosure: A longitudi-nal study of French companies. Journal of Business Ethics, 121(2), 233–254.
l-Tuwaijri, S. A., Christensen, T. E., & Hughes, K. E., II. (2004). The relationsamong environmental disclosure, environmental performance, and economicperformance: A simultaneous equations approach. Accounting, Organizations andSociety, 29(5), 447–471.
ndrikopoulos, A., & Kriklani, N. (2013). Environmental disclosure and financialcharacteristics of the firm: The case of Denmark. Corporate Social Responsibilityand Environmental Management, 20(1), 55–64.
shcroft, P. A. (2012). Extent of environmental disclosure of US and Canadian firmsby annual report location. Advances in Accounting, 28(2), 279–292.
ssaf Neto, A., & Lima, F. G. (2009). Curso de administrac ão financeira. São Paulo:Atlas.
M&FBovespa. (2014). Bolsa de Valores, Mercadorias e Futuros de São Paulo. ÍndiceBrasil 100 – IBrX-100.. Retrieved from http://www.bmfbovespa.com.br/indices/ResumoIndice.aspx?Indice=IBRX&Idioma=pt-BR
off, M. L. (2007). Estratégias de legitimidade organizacional de Lindblom naevidenciac ão ambiental e social em relatórios da administrac ão de empresasfamiliares (160 f. Dissertac ão (Mestrado em Ciências Contábeis)). Blumenau:Universidade Regional de Blumenau, Programa de Pós-Graduac ão em CiênciasContábeis do Centro de Ciências Sociais Aplicadas da Universidade Regional deBlumenau.
orges, A. P. da, Rosa, F. S., & Ensslin, S. R. (2010). Evidenciac ão voluntária das práticasambientais: um estudo nas grandes empresas brasileiras de papel e celulose.Produc ão On Line, 20(3), 404–417.
outen, L., Everaert, P., & Roberts, R. W. (2012). How a two-step approach disclosesdifferent determinants of voluntary social and environmental reporting. Journalof Business Finance & Accounting, 39(5–6), 567–605.
owrin, A. R. (2013). Corporate social and environmental reporting in the Caribbean.Social Responsibility Journal, 9(2), 259–280.
raga, J. P., Oliveira, J. R. S., & Salotti, B. M. (2009). Determinantes do nível dedivulgac ão ambiental nas demonstrac ões contábeis de empresas brasileiras.Revista de Contabilidade da UFBA, 3(3), 81–95.
ranco, M. C., Eugénio, T., & Ribeiro, J. (2008). Environmental disclosure in response
to public perception of environmental threats: The case of co-incineration inPortugal. Journal of Communication Management, 12(2), 136–151.uhr, N. (1998). Environmental performance, legislation and annual report disclo-sure: The case of acid rain and Falconbridge. Accounting, Auditing & AccountabilityJournal, 11(2), 163–190.
ciales 33 (2017) 24–38 37
Clarkson, P. M., Fang, X., Li, Y., & Richardson, G. (2013). The relevance of environ-mental disclosures: Are such disclosures incrementally informative? Journal ofAccounting and Public Policy, 32(5), 410–431.
Coelho, F. Q., Ott, E., Pires, C. B., & Alves, T. W. (2013). Uma Análise dos Fatores Difer-enciadores na Divulgac ão de Informac ões Voluntárias sobre o Meio Ambiente.Contabilidade Vista & Revista, 24(1), 112–130.
Cormier, D., Gordon, I. M., & Magnan, M. (2004). Corporate environmental disclosure:Contrasting management’s perceptions with reality. Journal of Business Ethics,49(2), 143–165.
Costa, R. S. da. (2006). Evidenciac ão Contábil das Informac ões Ambientais: UmaAnálise das Empresas do Setor de Papel e Celulose da BOVESPA (146 f. Dissertac ão(Mestrado em Ciências Contábeis e Atuárias)). São Paulo: Pontifícia Universi-dade Católica de São Paulo: PUC-SP, Programa de Estudos Pós-Graduados emCiências Contábeis e Financeiras.
Czesnat, A. O., & Machado, D. D. P. N. (2012). Legitimac ão na evidenciac ão deinformacões socioambientais entre as empresas de telecomunicac ões listadasna Bovespa. Revista Base (Administrac ão e Contabilidade) da UNISINOS, 9(3),291–305.
Daub, C.-H. (2007). Assessing the quality of sustainability reporting: An alternativemethodological approach. Journal of Cleaner Production, 15(1), 75–85.
Deegan, C., & Rankin, M. (1997). The materiality of environmental information tousers of annual reports. Accounting, Auditing & Accountability Journal, 10(4),562–583.
Degenhart, L., Vogt, M., Hein, N., Rosa, F. S. da, & Fank, O. L. (2015). Ranking deEvidenciac ão dos Impactos Ambientais de Empresas Brasileiras: Um Compara-tivo entre os Métodos Multicritérios T-ODA e TOPSIS. In XVII ENGEMA EncontroInternacional sobre Gestão Empresarial e Meio Ambiente.
Fávero, L. P., Belfiore, P., Silva, F. L. da, & Chan, B. L. (2009). Análise de dados: modelagemmultivariada para tomada de decisões. Rio de Janeiro: Elsevier.
Ferreira, J. A. S. (2005). Financ as corporativas: conceitos e aplicac ões. São Paulo: Pear-son Prentice Hall.
Freedman, M., & Patten, D. M. (2004). Evidence on the pernicious effect of financialreport environmental disclosure. Accounting Forum, 28, 27–41.
Galani, D., Gravas, E., & Stavropoulos, A. (2012). Company characteristics and envi-ronmental policy. Business Strategy and the Environment, 21(4), 236–247.
Gitman, L. J. (2004). Princípios de Administrac ão Financeira (10th ed.). São Paulo:Pearson Addison Wesley.
GRI. (2013). Global Reporting Initiative. Elaborac ão de relatórios de sus-tentabilidade. Retrieved from https://www.globalreporting.org/languages/Portuguesebrazil/Pages/Elaborac ão-de-relatórios-de-sustentabilidade.aspx
Groppelli, A. A., & Nikbakht, E. (2002). Administrac ão financeira (2nd ed.). São Paulo:Saraiva.
Hackston, D., & Milne, M. J. (1996). Some determinants of social and environmentaldisclosures in New Zealand companies. Accounting, Auditing & AccountabilityJournal, 9(1), 77–108.
Harte, G., & Owen, D. (1991). Environmental disclosure in the annual reports ofBritish companies: A research note. Accounting, Auditing & Accountability Journal,4(3), 51–61.
Hassan, A., & Ibrahim, E. (2012). Corporate environmental information disclosure:Factors influencing companies’ success in attaining environmental awards. Cor-porate Social Responsibility and Environmental Management, 19(1), 32–46.
Iatridis, G. E. (2013). Environmental disclosure quality: Evidence on environmen-tal performance, corporate governance and value relevance. Emerging MarketsReview, 14, 55–75.
Kuo, L., & Chen, V. Y.-J. (2013). Is environmental disclosure an effective strategyon establishment of environmental legitimacy for organization? ManagementDecision, 51(7), 1462–1487.
Lozano, R., & Huisingh, D. (2011). Inter-linking issues and dimensions in sustaina-bility reporting. Journal of Cleaner Production, 19(2), 99–107.
Lu, Y., & Abeysekera, I. (2014). Stakeholders’ power, corporate characteristics, andsocial and environmental disclosure: Evidence from China. Journal of CleanerProduction, 64, 426–436.
Magness, V. (2006). Strategic posture, financial performance and environmen-tal disclosure: An empirical test of legitimacy theory. Accounting, Auditing &Accountability Journal, 19(4), 540–563.
Mahjoub, L. B., & Khamoussi, H. (2013). Environmental and social policy and earningpersistence. Business Strategy and the Environment, 22(3), 159–172.
Mallin, C., Michelon, G., & Raggi, D. (2013). Monitoring intensity and stakeholders’orientation: How does governance affect social and environmental disclosure?Journal of Business Ethics, 114(1), 29–43.
Martins, G. de A., & Theóphilo, C. R. (2007). Metodologia da investigac ão científica paraciências sociais aplicadas (2nd ed.). São Paulo: Atlas.
Meng, X. H., Zeng, S. X., Tam, C. M., & Xu, X. D. (2013). Whether top executives’turnover influences environmental responsibility: From the perspective of envi-ronmental information disclosure. Journal of Business Ethics, 114(2), 341–353.
Mobus, J. L. (2005). Mandatory environmental disclosures in a legitimacy theorycontext. Accounting, Auditing & Accountability Journal, 18(4), 492–517.
Moroney, R., Windsor, C., & Aw, Y. T. (2012). Evidence of assurance enhancing thequality of voluntary environmental disclosures: An empirical analysis. Account-ing & Finance, 52(3), 903–939.
Murcia, F. D.-R., & Santos, A. dos. (2009). Fatores determinantes do nível de disclosure
voluntário das companhias abertas no Brasil. Revista de Educac ão e Pesquisa emContabilidade (REPeC), 3(2), 72–95.Neu, D., Warsame, H., & Pedwell, K. (1998). Managing public impressions: Envi-ronmental disclosures in annual reports. Accounting, Organizations and Society,23(3), 265–282.
3 Geren
N
O
O
P
P
R
R
R
R
8 M. Vogt et al. / Estudios
ossa, V. (2002). Disclosure Ambiental: Uma Análise do Conteúdo dos Relatórios Ambi-entais de Empresas do Setor de Papel e Celulose em Nível Internacional (246 f.Tese (Doutorado em Controladoria e Contabilidade)). São Paulo: Faculdade deEconomia, Administrac ão e Contabilidade da Universidade de São Paulo.
liveira, A. F. de, Machado, D. G., & Beuren, I. M. (2012). Disclosure Ambien-tal de Empresas de Setores Potencialmente Poluidores Listadas no Índice deSustentabilidade Empresarial (ISE). Revista de Gestão Social e Ambiental, 6(1),20–37.
mnamasivaya, B., & Prasad, M. S. V. (2016). Factors influencing environmentalaccounting and disclosure practices in India: Empirical evidence from NIFTYcompanies. IUP Journal of Accounting Research & Audit Practices, 15(1), 21.
atten, D. M. (2002). The relation between environmental performance and environ-mental disclosure: A research note. Accounting, Organizations and Society, 27(8),763–773.
eters, G. F., & Romi, A. M. (2013). Discretionary compliance with mandatory envi-ronmental disclosures: Evidence from SEC filings. Journal of Accounting andPublic Policy, 32(4), 213–236.
osa, F. S. da, Ensslin, S. R., & Ensslin, L. (2009). Evidenciac ão ambiental: pro-cesso estruturado de revisão de literatura sobre avaliac ão de desempenho daevidenciac ão ambiental. Sociedade, Contabilidade e Gestão, 4(2), 24–37.
osa, F. S. da, Guesser, T., Hein, N., Pfitscher, E. D., & Lunkes, R. J. (2013). Environmen-tal impact management of Brazilian companies: Analyzing factors that influencedisclosure of waste, emissions, effluents, and other impacts. Journal of CleanerProduction, 96(1), 148–160.
osa, F. S. da, Lunkes, R. J., Hein, N., Vogt, M., & Degenhart, L. (2014). Analysis ofthe determinants of disclosure of environmental impacts of Brazilian compa-
nies. Global Advanced Research Journal of Management and Business Studies, 3(6),249–266.upley, K. H., Brown, D., & Marshall, R. S. (2012). Governance, media and the qual-ity of environmental disclosure. Journal of Accounting and Public Policy, 31(6),610–640.
ciales 33 (2017) 24–38
Silva, T. L. da, Vicente, E. F. R., Pfitscher, E. D., & Rosa, F. S. da. (2013). Environmen-tal disclosure – Informac ões sobre Resíduos Sólidos divulgadas pelas empresaspotencialmente poluidoras listadas na BM&FBOVESPA. Revista Ambiente Contá-bil, 5(2), 229–324.
Silva-Gao, L. (2012). The disclosure of environmental capital expenditures: Evidencefrom the electric utility sector in the USA. Corporate Social Responsibility andEnvironmental Management, 19(4), 240–252.
Suave, R., Boff, M. L., Kroetz, M., Rosa, F. S. da, & Lunkes, R. J. (2012). Evidenciac ãoAmbiental: Convergências e Divergências em Diferentes Cenários de ResultadosSegundo a NBC T 15. REAVI – Revista Eletrônica do Alto Vale do Itajaí, 1(2), 53–64.
Trierweiller, A. C., Peixe, B. C. S., Tezza, R., Bornia, A. C., & Campos, L. M. S. (2013).Measuring environmental management disclosure in industries in Brazil withitem response theory. Journal of Cleaner Production, 47, 298–305.
Villiers, C. de, Low, M., & Samkin, G. (2014). The institutionalisation of mining com-pany sustainability disclosures. Journal of Cleaner Production, 84(1), 51–58.
Wang, H., & Bernell, D. (2013). Environmental disclosure in China: An examinationof the green securities policy. The Journal of Environment & Development, 22(4),339–369.
Wegener, M., Elayan, F. A., Felton, S., & Li, J. (2013). Factors influencing corporateenvironmental disclosures. Accounting Perspectives, 12(1), 53–73.
Wilmshurst, T. D., & Frost, G. R. (2000). Corporate environmental reporting: A testof legitimacy theory. Accounting, Auditing & Accountability Journal, 13(1), 10–26.
Wirth, H., Kulczycka, J., Hausner, J., & Konski, M. (2016). Corporate Social Responsi-bility: Communication about social and environmental disclosure by large andsmall copper mining companies. Resources Policy, 49, 53–60.
Zeng, S. X., Xu, X. D., Dong, Z. Y., & Tam, V. W. Y. (2010). Towards corporate environ-
mental information disclosure: An empirical study in China. Journal of CleanerProduction, 18(12), 1142–1148.Zeng, S. X., Xu, X. D., Yin, H. T., & Tam, C. M. (2012). Factors that drive Chineselisted companies in voluntary disclosure of environmental information. Journalof Business Ethics, 109(3), 309–321.
Related Documents