Journal of Plankton Research Vol.20 no.5 pp.1005-1014, 1998 SHORT COMMUNICATION Estimations of mesozooplankton biomass in a coastal upwelling area off NW Spain Antonio Bode, M.Teresa Alvarez-Ossorio and Nicolas Gonzalez Institute) Espahol de Oceanografia, Centro Costero de La Coruna, Apdo. 130, E- 15080 La Coruna, Spain Abstract. The abundance and several estimators of mesozooplankton biomass (dry weight, ash-free dry weight, displacement volume, carbon and nitrogen) were measured in a coastal upwelling area off La Coruna (NW Spain) at monthly intervals between 1990 and 1995. Holoplanktonic copepods dominated in most of the samples, but meroplankton were also important near the coast, especially during late spring and through summer. Gelatinous organisms (medusae, siphonophores and larvaceans) reached significant abundances (-10%) in shelf waters by late summer, but also near the coast in spring. Log-linear equations were computed between dry weight, displacement volume and the other biomass estimators, to allow for interconversion among different measurements. To prevent the influence of meroplankton and gelatinous zooplankton in the estimations of biomass, the equations were adjusted using only samples in which the abundance of each of these groups was <10% of total individuals. Our equations produced carbon and ash-free dry weight estimates that are comparable to those obtained with the ratios given in other studies in the region. However, the esti- mations of mesozooplankton carbon from displacement volume using the adjusted equation with our data are lower than those reported previously for the area, which were computed using equations adjusted with data from a different ecosystem. The use of interconversion factors taken from the literature is discussed, along with the implications of the estimations of mesozooplankton biomass in the computations of the flux of carbon through the ecosystem. The study of zooplankton biomass in upwelling environments has received substantial attention in many regions because of the central role of these organ- isms within the trophic food web. Most zooplankton species, and especially herbivorous copepods, are able to track the environmental variability and take advantage of the fertilization caused by the upwelling and the subsequent increase in primary productivity (e.g. Verheye etal., 1992). In addition, copepods are one of the most important food resources of the early stages of clupeoid fish (James, 1987; Varela et al., 1990), which form large populations in upwelling areas. Zooplankton biomass may either be measured directly as the weight of fresh or dry matter, or, more commonly, estimated indirectly from other measurements. One of the most frequently used indirect methods employs the displacement volume of a formalin-preserved sample which is placed in a graduated cylinder (Cushing et al., 1958; Le Borgne, 1975; Wiebe et al, 1975; Roman et al., 1985; Wiebe, 1988). This method requires the calibration of the displacement volume values against directly measured biomass values, generally as carbon weight. There is a substantial variation in the calibration parameters from one study to another, and the application of a certain set of parameters determined for one region to another may cause large errors. As an example, Vald6s et al. (1990) and Tenore et al. (1995) computed zooplankton carbon in the Galician upwelling (NW Spain) using the equation of Roman et al. (1985), which was originally adjusted © Oxford University Press 1005 by guest on December 25, 2012 http://plankt.oxfordjournals.org/ Downloaded from

Welcome message from author
This document is posted to help you gain knowledge. Please leave a comment to let me know what you think about it! Share it to your friends and learn new things together.
Transcript

Journal of Plankton Research Vol.20 no.5 pp.1005-1014, 1998
SHORT COMMUNICATION
Estimations of mesozooplankton biomass in a coastal upwellingarea off NW Spain
Antonio Bode, M.Teresa Alvarez-Ossorio and Nicolas GonzalezInstitute) Espahol de Oceanografia, Centro Costero de La Coruna, Apdo. 130, E-15080 La Coruna, Spain
Abstract. The abundance and several estimators of mesozooplankton biomass (dry weight, ash-freedry weight, displacement volume, carbon and nitrogen) were measured in a coastal upwelling areaoff La Coruna (NW Spain) at monthly intervals between 1990 and 1995. Holoplanktonic copepodsdominated in most of the samples, but meroplankton were also important near the coast, especiallyduring late spring and through summer. Gelatinous organisms (medusae, siphonophores andlarvaceans) reached significant abundances (-10%) in shelf waters by late summer, but also near thecoast in spring. Log-linear equations were computed between dry weight, displacement volume andthe other biomass estimators, to allow for interconversion among different measurements. To preventthe influence of meroplankton and gelatinous zooplankton in the estimations of biomass, theequations were adjusted using only samples in which the abundance of each of these groups was <10%of total individuals. Our equations produced carbon and ash-free dry weight estimates that arecomparable to those obtained with the ratios given in other studies in the region. However, the esti-mations of mesozooplankton carbon from displacement volume using the adjusted equation with ourdata are lower than those reported previously for the area, which were computed using equationsadjusted with data from a different ecosystem. The use of interconversion factors taken from theliterature is discussed, along with the implications of the estimations of mesozooplankton biomass inthe computations of the flux of carbon through the ecosystem.
The study of zooplankton biomass in upwelling environments has receivedsubstantial attention in many regions because of the central role of these organ-isms within the trophic food web. Most zooplankton species, and especiallyherbivorous copepods, are able to track the environmental variability and takeadvantage of the fertilization caused by the upwelling and the subsequentincrease in primary productivity (e.g. Verheye etal., 1992). In addition, copepodsare one of the most important food resources of the early stages of clupeoid fish(James, 1987; Varela et al., 1990), which form large populations in upwelling areas.Zooplankton biomass may either be measured directly as the weight of fresh ordry matter, or, more commonly, estimated indirectly from other measurements.
One of the most frequently used indirect methods employs the displacementvolume of a formalin-preserved sample which is placed in a graduated cylinder(Cushing et al., 1958; Le Borgne, 1975; Wiebe et al, 1975; Roman et al., 1985;Wiebe, 1988). This method requires the calibration of the displacement volumevalues against directly measured biomass values, generally as carbon weight.There is a substantial variation in the calibration parameters from one study toanother, and the application of a certain set of parameters determined for oneregion to another may cause large errors. As an example, Vald6s et al. (1990) andTenore et al. (1995) computed zooplankton carbon in the Galician upwelling (NWSpain) using the equation of Roman et al. (1985), which was originally adjusted
© Oxford University Press 1005
by guest on Decem
ber 25, 2012http://plankt.oxfordjournals.org/
Dow
nloaded from
A.Bode, M/IAlvarez-Ossorio and N.Gonzalez
v/100 m
2
-
>» GAUCIALa Co
i
-
rufta—^^ 4
N
- 43° 28'
- 43° 24'
43° 20'8° 27" 8° 241 W
Fig. 1. Location of studied stations.
for samples in an oligotrophic area in the Gulf Stream. Bode and Varela (1994),using parallel measurements of displacement volume and dry weight of zooplank-ton off La Corona (NW Spain) provided by Valdds et al. (1991), concluded thatthe use of the equation of Roman et al. (1985) would have caused an overesti-mation of zooplankton carbon in this region. In this paper, we present a set ofequations for interconversion among different zooplankton biomass estimates inthe Galician shelf waters computed using a large number of observations.
Zooplankton samples were collected at approximately monthly intervals fromJanuary 1990 to December 1995 at two stations near the coast of La Corona(Galicia, NW Spain). Station 2 (70 m depth) was typical of mid-shelf waters inthis area (Vald6s et al, 1991; Casas et al, 1997), while station 4 (20 m depth) wasclose to the coast and under the direct influence of the Bay of La Coruiia (Figure1). The stations were sampled during daylight. Zooplankton were collected usingdouble-oblique tows from the surface to 5-10 m from the bottom withJuday-Bogorov nets equipped with flow and depth meters. The size of the meshwas 250 urn, and in the following the term mesozooplankton will be used to namethe material and specimens collected. Several aliquots were taken from eachsample to determine mesozooplankton abundance and biomass. The totalnumber of individuals and their distribution by taxonomic groups were deter-mined in formalin-preserved samples (5% final concentration) observed under abinocular microscope. Specimens were combined in three groups related to thepersistence of the species in the plankton through their life cycles and their bodycomposition: copepods, meroplankton (larvae of molluscs, polychaetes, benthic
1006
by guest on Decem
ber 25, 2012http://plankt.oxfordjournals.org/
Dow
nloaded from
Estimations of mesozooplankton biomass
crustaceans, and fish eggs) and gelatinous zooplankton (chaetognaths, medusae,ctenophores, siphonophores and larvaceans). Mesozooplankton biomass wasmeasured in samples using several methods. The largest specimens of gelatinouszooplankton were removed from these samples. Dry weight (DW) was measuredon unpreserved material collected on pre-ashed (500°C, 24 h) and pre-weighedWhatman GF/C glass fibre filters. The filters with the samples were rinsed withfiltered sea water. Ash-free dry weight (AFDW) was measured on DW samplesafter combustion at 500°C for 24 h (Corral et al., 1981). Displacement volume(DV) was determined on formalin-preserved aliquots stored for 6 weeks aftersampling (Wiebe et al., 1975). Valdes et al. (1991) estimated that the storage ofthese samples would have caused biomass losses of up to 24%. Carbon and nitro-gen contents of mesozooplankton were measured using a Perkin Elmer CHNanalyser on a weighted subsample of dry material after determination of DW.Only DW values were systematically determined in all samples, while the otherbiomass estimators were measured only in some samples.
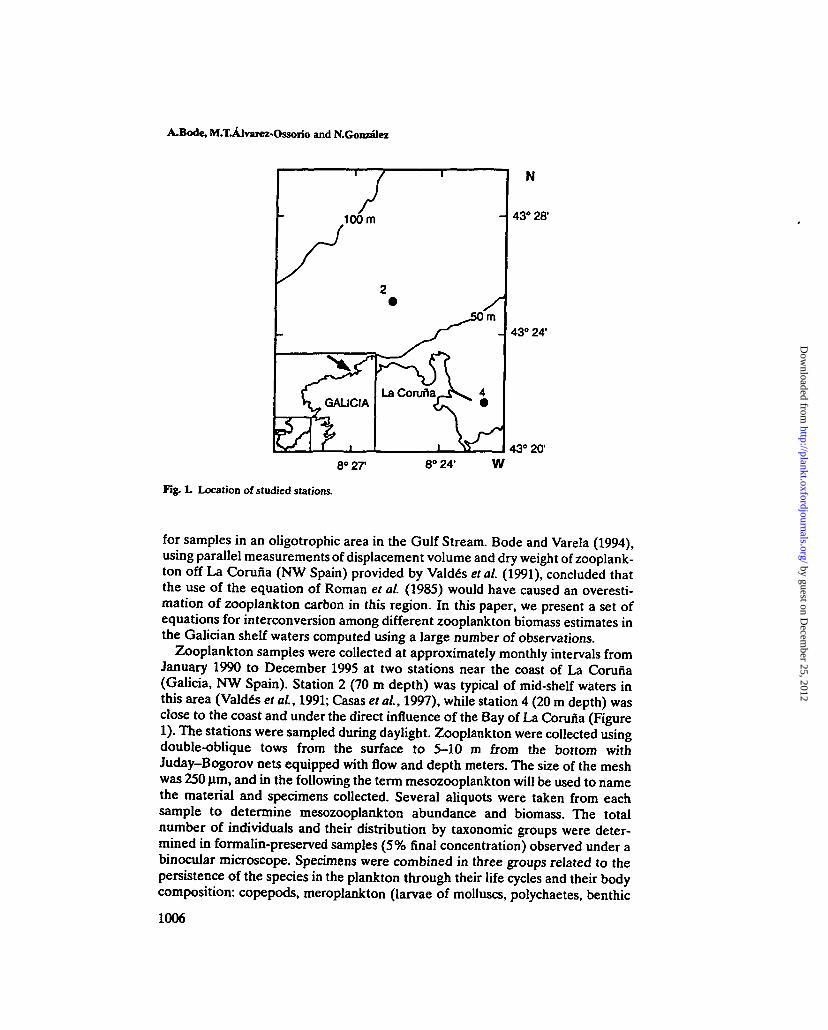
Copepods dominated abundance numbers of mesozooplankton in almost allsamples (Figure 2A). They represented >70% of total individuals counted insamples from station 2, reaching values of nearly 90% in certain months. Thecoastal station also exhibited a high dominance of copepods in winter, earlyspring and late autumn samples, but samples taken during late spring and summerdisplayed a significant abundance of meroplanktonic groups, mostly larvae ofbenthic animals (Figure 2B). Gelatinous zooplankters were generally found inlow numbers at both stations, although they were more abundant at station 2.Average dominance values of -10% occurred in May at station 4 and from Augustto October at station 2 (Figure 2C). These results agree basically with the domin-ance pattern of zooplankton in the area during 1988-1989 as described by Valdeset al. (1991), where more detailed taxonomic information can also be found.
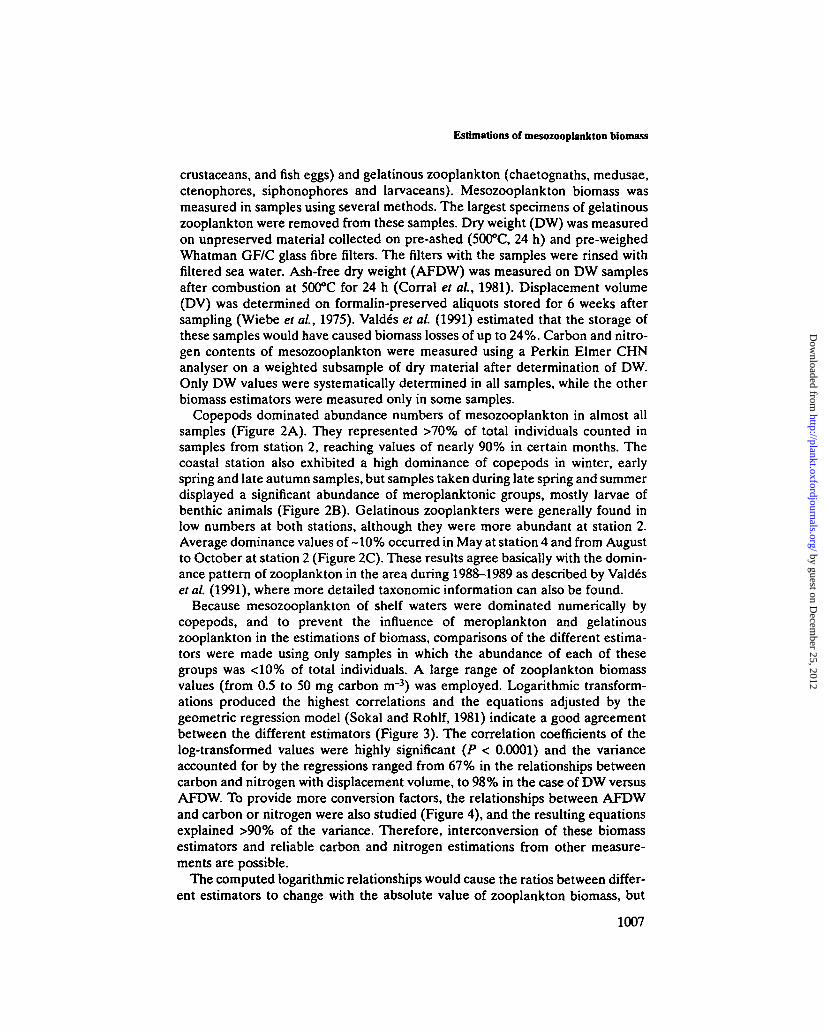
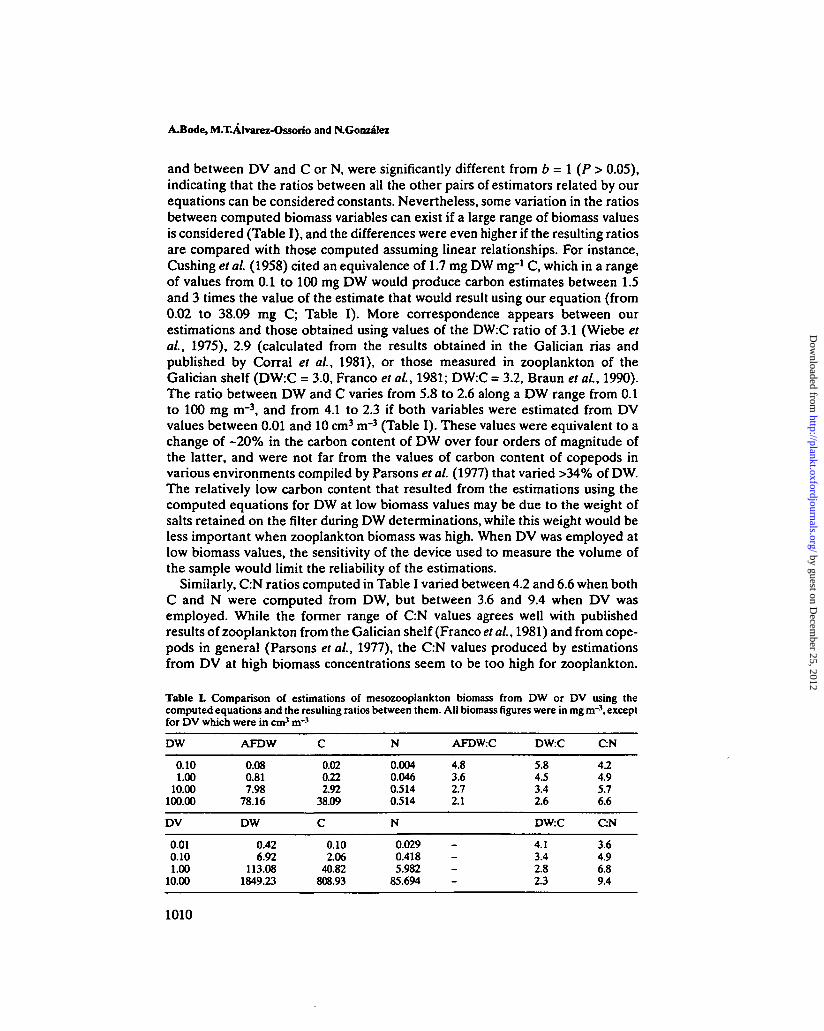
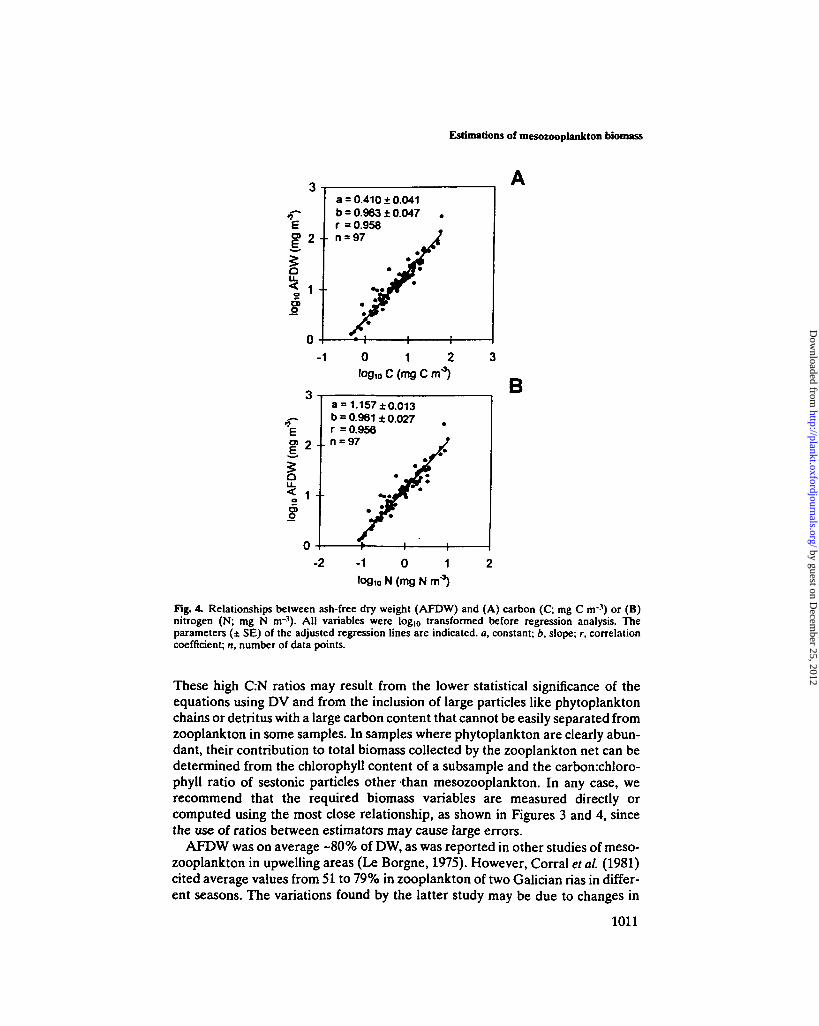
Because mesozooplankton of shelf waters were dominated numerically bycopepods, and to prevent the influence of meroplankton and gelatinouszooplankton in the estimations of biomass, comparisons of the different estima-tors were made using only samples in which the abundance of each of thesegroups was <10% of total individuals. A large range of zooplankton biomassvalues (from 0.5 to 50 mg carbon m~3) was employed. Logarithmic transform-ations produced the highest correlations and the equations adjusted by thegeometric regression model (Sokal and Rohlf, 1981) indicate a good agreementbetween the different estimators (Figure 3). The correlation coefficients of thelog-transformed values were highly significant (P < 0.0001) and the varianceaccounted for by the regressions ranged from 67% in the relationships betweencarbon and nitrogen with displacement volume, to 98% in the case of DW versusAFDW. To provide more conversion factors, the relationships between AFDWand carbon or nitrogen were also studied (Figure 4), and the resulting equationsexplained >90% of the variance. Therefore, interconversion of these biomassestimators and reliable carbon and nitrogen estimations from other measure-ments are possible.
The computed logarithmic relationships would cause the ratios between differ-ent estimators to change with the absolute value of zooplankton biomass, but
1007
by guest on Decem
ber 25, 2012http://plankt.oxfordjournals.org/
Dow
nloaded from

A.Bode, M.T.Alvarez-Ossorio and N.Gonzalez
Copepods100
7S
<*
so
25
I
I' • I1 " IJ F M A M J J A S O N D
Month
Meroplankton
B
Gelatinous zooplankton
S O N 0
Fig. 2. Monthly average (+ SEM) abundance values (%) of the main groups of mesozooplankton atstation 2 (white bars) and station 4 (filled bars) from 1990 to 1993. (A) Copepods. (B) Meroplank-ton (including larvae of benthic polychaetes, molluscs, bryozoans, crustaceans and fish eggs). (C)Gelatinous zooplankton (including chaetognaths, siphonophores, medusae and larvaceans). Thenumber of cases averaged for each month is the same for all graphs and is indicated above bars inthe lower graph (C).
such change would cause significant errors only if the value of the slope of theregression was different from one. To determine the statistical significance ofthese errors, we tested the significance of the differences between the valuescomputed for the slopes (b in Figures 3 and 4) and the value b = l with Student'sr-tests. Only the slopes of the equations for interconversion between DW and C,
1008
by guest on Decem
ber 25, 2012http://plankt.oxfordjournals.org/
Dow
nloaded from

2.0
a •
0.09
0 ±
0.02
0b
« 1.
008
±0.0
17r
= 0.
988
n-9
01
1 1
0.0
0.5
1.0
1.5
2.0
2.5
log
, 0 A
FDW
(m
gm
3)
2.5
2.0
1.5-
i1.0
••
0.5
0.0
8 =
0.58
2 ±0
.036
b»
0.89
7 ±0
.042
r =
0.92
8n
°65 1
1
B
-0.5
0.
0 0.
5 1.
0 1.
5lo
flio
C (
mg
C m
'3)2.
0
•r I2.0-
1.5 1.0-
0.5
0.0
y: -
* r
»n
"1
H-1.
276
±0.0
220.
955
± 0.
051
0.93
348
1-1
.0
-0.5
0.
0 0.
5lo
g,0 N
(mg
N m
3)1.
0
E I > P s
0.0
-0.5
-
-1.0
-1.5
-2.0
-
* * V
• an
. If
* b =
r =
n =
1
yr • -1
.692
±0.
070
0.82
4 ±
0.05
40.
657
641
0.0
1.0
2.0
3.0
-r E I O i
0.0
-0.5
-1.0
-
-1.5
-2.0
/*
a- r =
n °
1 1
y •-1
.242
±0.
082
0.77
1 ±0
.079
0.81
787 H
1-0
.5
0.0
0.5
1.0
1.5
2.0
loa«
oC(m
gCm
'3)
-2.0
a °
-0 6
72 ±
0.0
30b
= 0.
865
±0.0
78f
= 0.
817
n-
87__
, 1
-1.0
-0
.5
0.0
0.5
1.0
Iogi
o N
(mg
N m
"3)
Fig.
3.
Rel
atio
nshi
ps b
etw
een
seve
ral
estim
ator
s of
mes
ozoo
plan
kton
bio
mas
s. (
A)
Dry
wei
ght
(DW
; mg
m"3)
vers
us a
sh-f
ree
dry
wei
ght
(AFD
W; m
g nr
-1).(B
) D
ry w
eigh
t ve
rsus
car
bon
(C; m
g C
nr3
). (
C)
Dry
wei
ght v
ersu
s ni
trog
en (
N; m
g N
nr3
). (
D)
Dis
plac
emen
t vo
lum
e (D
V; c
m3 n
r3)
vers
us d
ry w
eigh
t. (E
)D
ispl
acem
ent v
olum
e ve
rsus
car
bon.
(F)
Dis
plac
emen
t vol
ume
vers
us n
itrog
en. A
ll va
riab
les
wer
e io
gio
tran
sfor
med
bef
ore
regr
essi
on a
naly
sis.
The
par
amet
ers
(± S
E)
of t
he a
djus
ted
regr
essi
on l
ines
are
ind
icat
ed, a
, con
stan
t; b,
slo
pe; r
, cor
rela
tion
coef
ficie
nt;
n, n
umbe
r of
dat
a po
ints
.
by guest on December 25, 2012http://plankt.oxfordjournals.org/Downloaded from
A.Bode, M.T.AIvarez-Ossorio and N.Gonzalez
and between DV and C or N, were significantly different from b = 1 (P > 0.05),indicating that the ratios between all the other pairs of estimators related by ourequations can be considered constants. Nevertheless, some variation in the ratiosbetween computed biomass variables can exist if a large range of biomass valuesis considered (Table I), and the differences were even higher if the resulting ratiosare compared with those computed assuming linear relationships. For instance,Cushing et al. (1958) cited an equivalence of 1.7 mg DW mg-1 C, which in a rangeof values from 0.1 to 100 mg DW would produce carbon estimates between 1.5and 3 times the value of the estimate that would result using our equation (from0.02 to 38.09 mg C; Table I). More correspondence appears between ourestimations and those obtained using values of the DW:C ratio of 3.1 (Wiebe etal., 1975), 2.9 (calculated from the results obtained in the Galician rias andpublished by Corral et al., 1981), or those measured in zooplankton of theGalician shelf (DW:C = 3.0, Franco et al., 1981; DW:C = 3.2, Braun et al., 1990).The ratio between DW and C varies from 5.8 to 2.6 along a DW range from 0.1to 100 mg nr3, and from 4.1 to 2.3 if both variables were estimated from DVvalues between 0.01 and 10 cm3 nr3 (Table I). These values were equivalent to achange of -20% in the carbon content of DW over four orders of magnitude ofthe latter, and were not far from the values of carbon content of copepods invarious environments compiled by Parsons et al. (1977) that varied >34% of DW.The relatively low carbon content that resulted from the estimations using thecomputed equations for DW at low biomass values may be due to the weight ofsalts retained on the filter during DW determinations, while this weight would beless important when zooplankton biomass was high. When DV was employed atlow biomass values, the sensitivity of the device used to measure the volume ofthe sample would limit the reliability of the estimations.
Similarly, C:N ratios computed in Table I varied between 4.2 and 6.6 when bothC and N were computed from DW, but between 3.6 and 9.4 when DV wasemployed. While the former range of C:N values agrees well with publishedresults of zooplankton from the Galician shelf (Franco etal, 1981) and from cope-pods in general (Parsons et al., 1977), the C:N values produced by estimationsfrom DV at high biomass concentrations seem to be too high for zooplankton.
Table L Comparison of estimations of mesozooplankton biomass from DW or DV using thecomputed equations and the resulting ratios between them. All biomass figures were in mg n r \ exceptfor DV which were in cm3 nr J
DW
0.101.00
10.00100.00
DV
0.010.101.00
10.00
AFDW
0.080.817.98
78.16
DW
0.426.92
113.081849.23
C
0.020.222.92
38.09
C
0.102.06
40.82808.93
N
0.0040.0460.5140.514
N
0.0290.4185.982
85.694
AFDW:C
4.83.62.7Zl
-
DW:C
5.84.53.42.6
DW:C
4.13.42.82.3
C:N
4.24.95.76.6
C:N
3.64.96.89.4
1010
by guest on Decem
ber 25, 2012http://plankt.oxfordjournals.org/
Dow
nloaded from
Estimations of mesozooplankton biomass
a = 0.410 ±0.041b = 0.963 ± 0.047r = 0.958n = 97
0 1 2
logio C (mg C m"3)
B
g> 2
OLL.
< 1 i
a = 1.157 ±0.013b = 0.961 ±0.027r = 0.956n = 97
- 2 - 1 0 1 2
logio N (mg N m"3)
Fig. 4. Relationships between ash-free dry weight (AFDW) and (A) carbon (C; mg C nr-1) or (B)nitrogen (N; mg N m~'). All variables were log|0 transformed before regression analysis. Theparameters (± SE) of the adjusted regression lines are indicated, a, constant; b, slope; r, correlationcoefficient; n, number of data points.
These high C:N ratios may result from the lower statistical significance of theequations using DV and from the inclusion of large particles like phytoplanktonchains or detritus with a large carbon content that cannot be easily separated fromzooplankton in some samples. In samples where phytoplankton are clearly abun-dant, their contribution to total biomass collected by the zooplankton net can bedetermined from the chlorophyll content of a subsample and the carbon:chloro-phyll ratio of sestonic particles other than mesozooplankton. In any case, werecommend that the required biomass variables are measured directly orcomputed using the most close relationship, as shown in Figures 3 and 4, sincethe use of ratios between estimators may cause large errors.
AFDW was on average -80% of DW, as was reported in other studies of meso-zooplankton in upwelling areas (Le Borgne, 1975). However, Corral et al. (1981)cited average values from 51 to 79% in zooplankton of two Galician rias in differ-ent seasons. The variations found by the latter study may be due to changes in
1011
by guest on Decem
ber 25, 2012http://plankt.oxfordjournals.org/
Dow
nloaded from

A.Bode, M.T.Alvarez-Ossorio and N.Gonzalez
the abundance of meroplankton in the shallow waters of the rias, since mero-planktonic mollusc larvae may have a large mineral content because of theircalcareous shells. The carbon or nitrogen contents of zooplankton that can becomputed from AFDW using the equations provided in Figure 4 are likely to bequite accurate because of the large significance of the relationship and becausethe slopes of both equations are not significantly different from one (P > 0.05).
In contrast, carbon estimations from DV are very variable in different studies.One millilitre of DV would result in a carbon equivalent from 31 to 69 mg C usingthe equations computed by Le Borgne (1975) in an upwelling area, whereasthe equation of Roman et al. (1985) gives a value of 117 mg C ml"1 DV. Thecomparison between carbon estimates from a large range of DV values using theequation of Roman et al. (1985) and the equation given in Figure 3E reveals thatthe former estimates values >10 times higher than those produced by our equa-tion at DV concentrations of 0.01 cm3 irr3, but only 24% higher for a DV valueof 10 cm3 m~3 (Table II). Therefore, the carbon biomass concentrations ofzooplankton given by Valdds et al. (1990) and Tenore et al. (1995), which werecomputed from DV using the equation of Roman et al. (1985), are likely to be toohigh for this upwelling region. This result is not surprising as the equation ofRoman et al. (1985) was generated for zooplankton larger than 64 urn collectedin mostly oligotrophic waters of the Sargasso Sea, Gulf Stream and slope waters.The overestimation of mesozooplankton carbon is of less importance if the valuescomputed with the same equation are only used for comparative purposesbetween stations or cruises, as in Valdds et al. (1990). However, when the carbonestimations are employed in further computations of zooplankton rates, the over-estimation can produce misleading interpretations of the zooplankton activity. Asan example, Tenore et al. (1995) used estimations of zooplankton carbon fromDV along with measured instantaneous specific carbon grazing rates to computethe grazing impact of the zooplankton community on the phytoplankton stand-ing stock in several cruises. These authors estimate that zooplankton grazing canreduce up to 100% phytoplankton carbon daily during upwelling conditions,which means that zooplankton can effectively control any accumulation of phyto-plankton even in the most productive conditions. However, the phytoplanktonconcentrations shown in the same study and the results reported in other studiesof the Galician upwelling (e.g. Varela et al, 1991; Varela, 1992; Bode et al, 1994;Casas etal, 1997) indicate that the former estimations of grazing impact are likelyto be biased. Using zooplankton carbon values computed from an equation
Table O. Comparison of biomass carbon estimates from DV using the equation of Roman et oL (1985;CR) and the equation obtained in this study (Figure 3E; Cs). Carbon biomass is in mg C nr-1 and DVin cm1 nr-\ Differences between both estimates (CR - Cs) and relative overestimations of CR (100[CR - CsyCs) are given
DV
0.010.101.00
10.00
CR
1.613.5
116.61004.7
Cs
0.12.1
40.8808.9
C R - C S
1.511.575.8
195.8
% overestimation
141055718624
1012
by guest on Decem
ber 25, 2012http://plankt.oxfordjournals.org/
Dow
nloaded from
Estimations of mesozooplankton biomass
adjusted with local data, Bode and Varela (1994) estimated that biomass-specificdaily mesozooplankton ingestion was <5% of phytoplankton biomass and <10%of daily primary production during upwelling conditions off Galicia.
In this study, we provide a set of equations for the computation and intercon-version of various estimators of mesozooplankton biomass in the upwelling areaof NW Spain. AFDW, carbon and nitrogen can be computed from easilymeasured variables like DW and DV. The use of direct measures of carbon orDW to obtain values of zooplankton biomass is recommended, but if thesemeasurements are not available for a particular study, they can be calculatedusing the equations provided. The use of the DV cannot be recommendedbecause of the large uncertainties associated with the estimation of other vari-ables from it, and the equations computed in this study are intended mainly forcomparative purposes with previously published results for the Galicianupwelling. Most of the computed relationships could be applied to the zooplank-ton of similar upwelling areas, as the use of equations from other environmentsmay introduce large errors in subsequent computations using the biomassestimates.
Acknowledgements
This study was part of projects IEO-1007 (Instituto Espanol de Oceanograffa,Spain) and AMB93-0014 (Comisi6n Interministerial de Ciencia y Tecnologia,Spain). We are indebted to M.Varela for his support and to the crew of the R/V'Lura' for assistance in the field. I.Gonzdlez measured zooplankton dry weightsand displacement volumes, and M.L.Fermoso helped with the CHN analysis.
ReferencesBode.A. and Varela.M. (1994) Planktonic carbon and nitrogen budgets for the N-NW Spanish shelf:
The role of pelagic nutrient regeneration during upwelling events. Set Mar., 58,221-231.Bode.A., Casas.B. and Varela.M. (1994) Size-fractionated primary productivity and biomass in the
Galician shelf (NW Spain): Netplankton versus nanoplankton dominance. Sci. Mar, 58,131-141.Braun J.G., AIvarez-Ossorio.M.T., Fernandez de Puelles,M.L. and CaminasJ. A. (1990) Estudio sobre
la estructura, biomasa y producci6n del meso y microzooplancton en la plataforma de Galicia enabril de 1982. BoL tnsL Esp. Oceanogr., 6, 81-%.
Casas.B., Varela.M., Canle.M., Gonza'lez.N. and Bode.A. (1997) Seasonal variations of nutrients,seston and phytoplankton, and upwelling intensity off La Coruna (NW Spain). Estuarine CoastalShelf Sci., 44,767-778.
Corral J., Mass6,C. and AIvarez-Ossorio.M.T. (1981) Un estudio comparado preliminar de la biomasaseca, materia orgSnica, carbono, nitrdgeno, relacidn C/N, y del contenido energetico del zooplanc-ton de las rias de Axosa y Muros. BoL Inst. Esp. Oceanogr, 330,221-240.
CushingJ3.H., Humpfrey.G.F., BanseJC. and Laevastu,T. (1958) Report of the Committee on Termsand Equivalents. Rapp. P.-V. Cons. Int. Explor. Mer, 144,15-16.
FrancoJ.M., Fernandez Reiriz,M.J., Muraro,M.A. and Collazo.R. (1981) Niveles de PCBs y composi-tion quimica del zooplancton de la costa de Galicia (Campana 'Galicia IV'; octubre 1977). Invest./>«<?., 45,165-174.
James.A.G. (1987) Feeding ecology, diet and field-based studies on feeding selectivity of the Capeanchovy Engraulis capensis Gilchrist. S. Afr. J. Mar. ScL, 11,499-512.
Le Borgne.R. (1975) Equivalences entre les mesures de biovolumes, poids sees, poids sees sanscendre, carbone, azote et phosphore du m£sozooplancton de l'Atlantique tropical. Cah. ORSTOMSir. Oceanogr, 13,179-196.
1013
by guest on Decem
ber 25, 2012http://plankt.oxfordjournals.org/
Dow
nloaded from
A.Bode, M.T.Arvarez-Ossorio and N.Gonzalez
Parsons.T.R., Takahashi.M. and Hargrave,B.T. (1977) Biological Oceanographic Processes. PergamonPress, Oxford.
Roman.M.R., Gauzens.A.L. and Cowles.TJ. (1985) Temporal and spatial changes in epipelagicmicrozooplankton and mesozooplankton biomass in warm-core Gulf Stream ring 82-B. Deep-SeaRes., 32,1007-1022.
Sokal.R.R. and Rohlf J J . (1981). Biometry. W.H.Freeman and Co., New York, 859 pp.Tenore.K.R. el al. (1995) Fisheries and oceanography off Galicia, NW Spain: Mesoscale spatial and
temporal changes in physical processes and resultant patterns of biological productivity./ Ceophys.Res.. 100(C6), 10943-10966.
ValdesJ.L., Roman.M.R., Alvarez-Ossorio,M.T., GauzensA.L. and Miranda^A. (1990) Zooplanktoncomposition and distribution off the coast of Galicia, Spain. / Plankton Res., 12,629-643.
Valde's.L., Alvarez-Ossorio,M.T, Lavin.A., Varela,M. and Carballo.R. (1991) Ciclo anual de pariimet-ros hidrogrSficos, nutnentes y plancton en la plataforma continental de La Corufla (NO, Espafla).Bol. Inst. Esp. Oceanogr., 7,91-138.
Varela.M. (1992) Upwelling and phytoplankton ecology in Galician (NW Spain) rias and shelf waters.Bol. Inst. Esp. Oceanogr., 8,57-74.
Varela.M., Alvarez-Ossorip,M.T. and Valdgs.L. (1990) Mltodo para el estudio cuantitativo delcontenido estomacal de la sardina. Resultados preliminares. Bol Inst. Esp. Oceanogr., 6,117-126.
Varela,M., Diaz del Ri'o.G., Alvarez-Ossorio,M.T. and Costasf. (1991) Factors controlling phyto-plankton size class distribution in the upwelling area of the Galician continental shelf (NW Spain).Sci. Mar., 55,505-518.
Verheye.H.M., Hutchings.L., Huggett J.A. and Painting.SJ. (1992) Mesozooplankton dynamics in theBenguela ecosystem, with emphasis on the herbivorous copepods. S. Afr. J. Mar. ScL, 12,561-584.
Wiebe,P.H. (1988) Functional regression equations for zooplankton displacement volume, wetweight, dry weight, and carbon: a correction. Fish. Bull., 86,833-835.
Wiebe,P.H., Boyd,S.H. and CoxJ.L. (1975) Relationships between zooplankton displacementvolume, wet weight, dry weight, and carbon. Fish. Bull., 73,777-786.
Received on April 13,1997; accepted on December 31,1997
1014
by guest on Decem
ber 25, 2012http://plankt.oxfordjournals.org/
Dow
nloaded from
Related Documents


![UPWELLING, EKMAN MASS TRANSPORT AND EL NIÑO, ENS O & …ocw.umb.edu/environmental-earth-and-ocean-sciences/eeos-630-biol… · on Ekman transport and upwelling.] Comments on upwelling](https://static.cupdf.com/doc/110x72/606d25ba60c7861ff966b665/upwelling-ekman-mass-transport-and-el-nio-ens-o-ocwumbeduenvironmental-earth-and-ocean-scienceseeos-630-biol.jpg)