International Research Journal of Engineering and Technology (IRJET) e-ISSN: 2395-0056 Volume: 08 Issue: 03 | Mar 2021 www.irjet.net p-ISSN: 2395-0072 © 2021, IRJET | Impact Factor value: 7.529 | ISO 9001:2008 Certified Journal | Page 1184 Estimation of Traffic Capacity in a 4-lane Divided National Highway (NH-275) & Analysis of Traffic Volume Pranay Raj BS 1 1 Assistant Professor, Dept. of civil Engineering, JVIT Bidadi, Bangalore, Karnataka, India. ---------------------------------------------------------------------***---------------------------------------------------------------------- Abstract - The traffic is increased enormously due to rapid growth of vehicle ownership and increase of population in the urban area of India. Traffic capacity is a key parameter for planning, design and operation of any type of urban roads. In the present study, Traffic flow data is collected on a section of four-lane divided national highway (NH-275) at kumbalgodu in Bangalore. The traffic composition and classified volume of traffic on the study stretch is found. The same set of field data is used in VISSIM and simulated speed-flow curve is developed for the heterogeneous traffic flow. Capacity of 4-lane divided national highway is estimated using the speed flow relationship and it is found to be 5334 PCU/hr/dir. Additionally, speed-volume relationships considering simulated traffic flow with 100% composition for different categories of vehicles are plotted for volume levels starting from near-zero until capacity of the facility. Further, Passenger Car Unit (PCU) of different vehicle categories at different volume levels was found. It has been found that PCU decreases with increase in volume-capacity ratio irrespective of vehicle category. Key Words: Heterogeneous traffic flow, VISSIM, simulation, PCU, traffic capacity 1. INTRODUCTION The vehicular traffic on highways and urban streets has increased substantially due to rapid growth in industrial and economic activities and this scenario has spread through the developed and developing countries both. Increased traffic demand is requiring an efficient traffic flow operations on highway facilities. India has a large road network of about 4.32 million kilometers, and acquired a density of 1.31 km of roads per square kilometer of land, which is quite high when compared with countries like US, Australia, Korea and Sweden where density is around 0.67, 0.11, 1.05 and 1.29 respectively. Traffic volume in India is further likely to increase in future due to substantial growth rate and it may cause severe congestion on all important highways in the country. Many developing nations are facing different levels of difficulties for providing efficient vehicular traffic operations due to mixed nature of traffic. There are several types of vehicles sharing and operating on same carriageway width without any physical segregation between motorized and non-motorized vehicles, and without proper lane discipline. The operating characteristics of these vehicles vary from location to location with varying traffic composition. Several two lane rural highways in India have been widened to four lanes and many new multilane highway projects are in progress so as to meet the requirements of higher traffic with increasing number of commercial vehicles on these highways. Multilane highways need more attention with respect to traffic flow state and capacity analysis due to different lane- changing and overtaking maneuvers as compared to two-lane roads. Fig: 1 Traffic congestion in Bangalore 1.1 ABOUT PTV VISSIM PTV VISSIM is a microscopic multi-modal traffic flow simulation software package developed by PTV Planning Transport Verkehr AG in Karlsruhe, Germany. The name is derived from "Verkehr In Städten – Simulations model" (German for "Traffic in cities - simulation model"). PTV Vissim was first developed in 1992 and is today a global market leader. "Microscopic simulation", sometimes called micro simulation, means each entity (car, train, and person) of reality is simulated individually, i.e. it is represented by a corresponding entity in the simulation, thereby considering all relevant properties. The same holds for the interactions between the entities. The scope of application ranges from various issues of traffic engineering (transport engineering, transportation planning, signal timing), public transport, urban planning over fire protection (evacuation simulation) to 3D visualization (computer animation, architectural animation) for illustrative purpose and communication to the general public. PTV Vissim is part of the PTV Vision Traffic Suite which also includes PTV Visum (traffic analysis and forecasting) and PTV Vistro (signal optimization and traffic impact).

Welcome message from author
This document is posted to help you gain knowledge. Please leave a comment to let me know what you think about it! Share it to your friends and learn new things together.
Transcript
International Research Journal of Engineering and Technology (IRJET) e-ISSN: 2395-0056
Volume: 08 Issue: 03 | Mar 2021 www.irjet.net p-ISSN: 2395-0072
© 2021, IRJET | Impact Factor value: 7.529 | ISO 9001:2008 Certified Journal | Page 1184
Estimation of Traffic Capacity in a 4-lane Divided National Highway
(NH-275) & Analysis of Traffic Volume
Pranay Raj BS1
1Assistant Professor, Dept. of civil Engineering, JVIT Bidadi, Bangalore, Karnataka, India. ---------------------------------------------------------------------***----------------------------------------------------------------------
Abstract - The traffic is increased enormously due to rapid growth of vehicle ownership and increase of population in the urban area of India. Traffic capacity is a key parameter for planning, design and operation of any type of urban roads. In the present study, Traffic flow data is collected on a section of four-lane divided national highway (NH-275) at kumbalgodu in Bangalore. The traffic composition and classified volume of traffic on the study stretch is found. The same set of field data is used in VISSIM and simulated speed-flow curve is developed for the heterogeneous traffic flow. Capacity of 4-lane divided national highway is estimated using the speed flow relationship and it is found to be 5334 PCU/hr/dir. Additionally, speed-volume relationships considering simulated traffic flow with 100% composition for different categories of vehicles are plotted for volume levels starting from near-zero until capacity of the facility. Further, Passenger Car Unit (PCU) of different vehicle categories at different volume levels was found. It has been found that PCU decreases with increase in volume-capacity ratio irrespective of vehicle category.
Key Words: Heterogeneous traffic flow, VISSIM, simulation, PCU, traffic capacity
1. INTRODUCTION The vehicular traffic on highways and urban streets has increased substantially due to rapid growth in industrial and economic activities and this scenario has spread through the developed and developing countries both. Increased traffic demand is requiring an efficient traffic flow operations on highway facilities. India has a large road network of about 4.32 million kilometers, and acquired a density of 1.31 km of roads per square kilometer of land, which is quite high when compared with countries like US, Australia, Korea and Sweden where density is around 0.67, 0.11, 1.05 and 1.29 respectively. Traffic volume in India is further likely to increase in future due to substantial growth rate and it may cause severe congestion on all important highways in the country. Many developing nations are facing different levels of difficulties for providing efficient vehicular traffic operations due to mixed nature of traffic. There are several types of vehicles sharing and operating on same carriageway width without any physical segregation between motorized and non-motorized vehicles, and without proper lane discipline.
The operating characteristics of these vehicles vary from location to location with varying traffic composition. Several two lane rural highways in India have been widened to four
lanes and many new multilane highway projects are in progress so as to meet the requirements of higher traffic with increasing number of commercial vehicles on these highways. Multilane highways need more attention with respect to traffic flow state and capacity analysis due to different lane-changing and overtaking maneuvers as compared to two-lane roads.
Fig: 1 Traffic congestion in Bangalore
1.1 ABOUT PTV VISSIM
PTV VISSIM is a microscopic multi-modal traffic flow simulation software package developed by PTV Planning Transport Verkehr AG in Karlsruhe, Germany. The name is derived from "Verkehr In Städten – Simulations model" (German for "Traffic in cities - simulation model"). PTV Vissim was first developed in 1992 and is today a global market leader. "Microscopic simulation", sometimes called micro simulation, means each entity (car, train, and person) of reality is simulated individually, i.e. it is represented by a corresponding entity in the simulation, thereby considering all relevant properties. The same holds for the interactions between the entities. The scope of application ranges from various issues of traffic engineering (transport engineering, transportation planning, signal timing), public transport, urban planning over fire protection (evacuation
simulation) to 3D visualization (computer animation, architectural animation) for illustrative purpose and communication to the general public. PTV Vissim is part of the PTV Vision Traffic Suite which also includes PTV Visum (traffic analysis and forecasting) and PTV Vistro (signal optimization and traffic impact).
International Research Journal of Engineering and Technology (IRJET) e-ISSN: 2395-0056
Volume: 08 Issue: 03 | Mar 2021 www.irjet.net p-ISSN: 2395-0072
© 2021, IRJET | Impact Factor value: 7.529 | ISO 9001:2008 Certified Journal | Page 1185
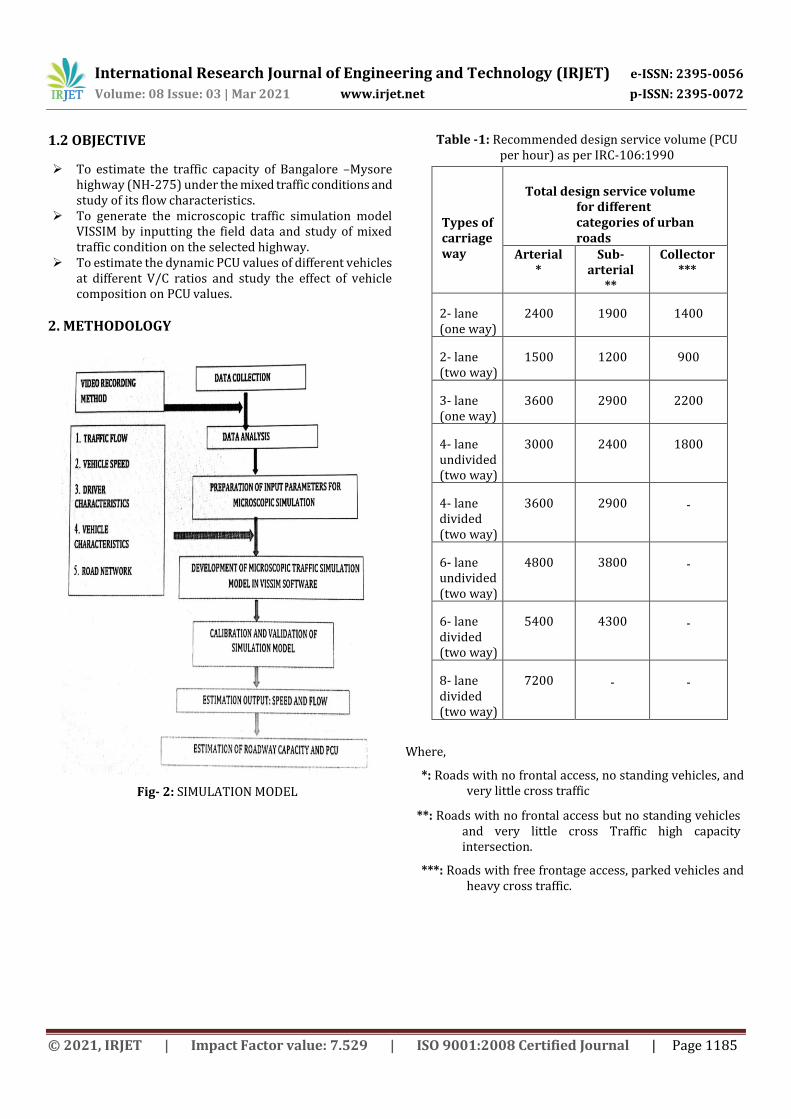
1.2 OBJECTIVE
To estimate the traffic capacity of Bangalore –Mysore highway (NH-275) under the mixed traffic conditions and study of its flow characteristics.
To generate the microscopic traffic simulation model VISSIM by inputting the field data and study of mixed traffic condition on the selected highway.
To estimate the dynamic PCU values of different vehicles at different V/C ratios and study the effect of vehicle composition on PCU values.
2. METHODOLOGY
Fig- 2: SIMULATION MODEL
Table -1: Recommended design service volume (PCU per hour) as per IRC-106:1990
Types of carriage way
Total design service volume
for different categories of urban roads
Arterial *
Sub- arterial
**
Collector ***
2- lane (one way)
2400 1900 1400
2- lane (two way)
1500 1200 900
3- lane (one way)
3600 2900 2200
4- lane undivided (two way)
3000 2400 1800
4- lane divided (two way)
3600 2900 -
6- lane undivided (two way)
4800 3800 -
6- lane divided (two way)
5400 4300 -
8- lane divided (two way)
7200 - -
Where,
*: Roads with no frontal access, no standing vehicles, and very little cross traffic
**: Roads with no frontal access but no standing vehicles and very little cross Traffic high capacity intersection.
***: Roads with free frontage access, parked vehicles and heavy cross traffic.
International Research Journal of Engineering and Technology (IRJET) e-ISSN: 2395-0056
Volume: 08 Issue: 03 | Mar 2021 www.irjet.net p-ISSN: 2395-0072
© 2021, IRJET | Impact Factor value: 7.529 | ISO 9001:2008 Certified Journal | Page 1186
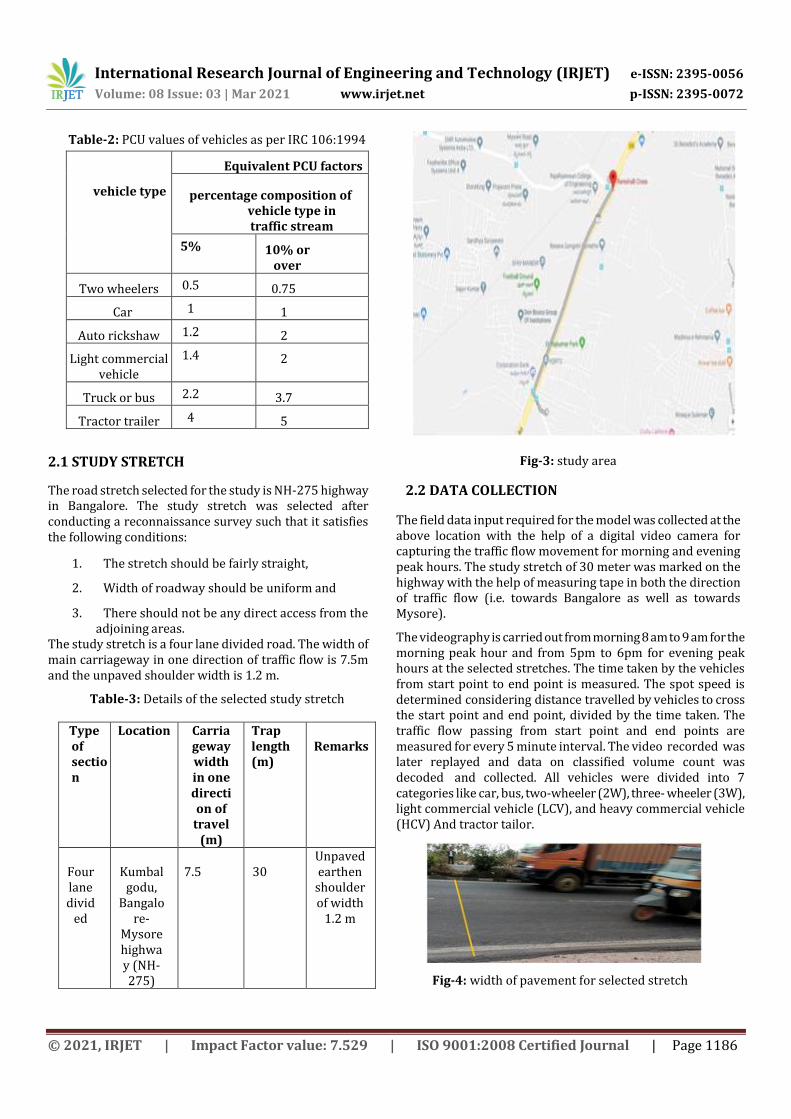
Table-2: PCU values of vehicles as per IRC 106:1994
vehicle type
Equivalent PCU factors
percentage composition of vehicle type in traffic stream
5% 10% or over
Two wheelers 0.5 0.75
Car 1 1
Auto rickshaw 1.2 2
Light commercial vehicle
1.4 2
Truck or bus 2.2 3.7
Tractor trailer 4 5
2.1 STUDY STRETCH
The road stretch selected for the study is NH-275 highway in Bangalore. The study stretch was selected after conducting a reconnaissance survey such that it satisfies the following conditions:
1. The stretch should be fairly straight,
2. Width of roadway should be uniform and
3. There should not be any direct access from the adjoining areas.
The study stretch is a four lane divided road. The width of main carriageway in one direction of traffic flow is 7.5m and the unpaved shoulder width is 1.2 m.
Table-3: Details of the selected study stretch
Type of section
Location Carriageway width in one direction of
travel (m)
Trap length (m)
Remarks
Four lane divid
ed
Kumbal
godu, Bangalo
re- Mysore highway (NH-275)
7.5
30
Unpaved earthen
shoulder of width
1.2 m
Fig-3: study area
2.2 DATA COLLECTION
The field data input required for the model was collected at the above location with the help of a digital video camera for capturing the traffic flow movement for morning and evening peak hours. The study stretch of 30 meter was marked on the highway with the help of measuring tape in both the direction of traffic flow (i.e. towards Bangalore as well as towards Mysore).
The videography is carried out from morning 8 am to 9 am for the morning peak hour and from 5pm to 6pm for evening peak hours at the selected stretches. The time taken by the vehicles from start point to end point is measured. The spot speed is determined considering distance travelled by vehicles to cross the start point and end point, divided by the time taken. The traffic flow passing from start point and end points are measured for every 5 minute interval. The video recorded was later replayed and data on classified volume count was decoded and collected. All vehicles were divided into 7 categories like car, bus, two-wheeler (2W), three- wheeler (3W), light commercial vehicle (LCV), and heavy commercial vehicle (HCV) And tractor tailor.
Fig-4: width of pavement for selected stretch
International Research Journal of Engineering and Technology (IRJET) e-ISSN: 2395-0056
Volume: 08 Issue: 03 | Mar 2021 www.irjet.net p-ISSN: 2395-0072
© 2021, IRJET | Impact Factor value: 7.529 | ISO 9001:2008 Certified Journal | Page 1187
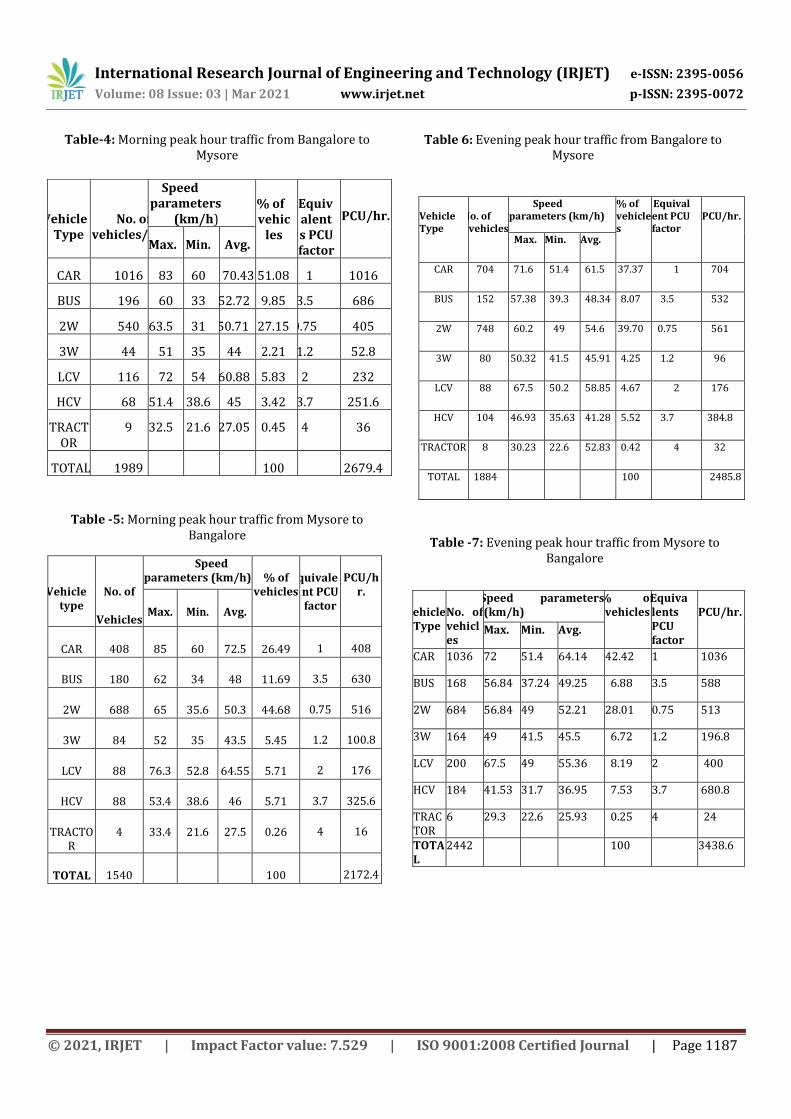
Table-4: Morning peak hour traffic from Bangalore to Mysore
Table -5: Morning peak hour traffic from Mysore to Bangalore
Vehicle type
No. of
Vehicles
Speed parameters (km/h)
% of
vehicles
Equivale
nt PCU factor
PCU/h
r.
Max. Min. Avg.
CAR 408 85 60 72.5 26.49
1
408
BUS 180 62 34 48 11.69
3.5
630
2W 688 65 35.6 50.3 44.68
0.75
516
3W 84 52 35 43.5 5.45
1.2
100.8
LCV 88 76.3 52.8 64.55 5.71
2
176
HCV 88 53.4 38.6 46 5.71
3.7
325.6
TRACTOR
4 33.4 21.6 27.5 0.26
4
16
TOTAL 1540
100
2172.4
Table 6: Evening peak hour traffic from Bangalore to Mysore
Table -7: Evening peak hour traffic from Mysore to Bangalore
Vehicle Type
No. of vehicles/hr.
Speed parameters
(km/h)
% of vehic
les
Equivalents PCU factor
PCU/hr.
Max. Min. Avg.
CAR 1016 83 60 70.43 51.08 1 1016
BUS 196 60 33 52.72 9.85 3.5 686
2W 540 63.5 31 50.71 27.15 0.75 405
3W 44 51 35 44 2.21 1.2 52.8
LCV 116 72 54 60.88 5.83 2 232
HCV 68 51.4 38.6 45 3.42 3.7 251.6
TRACTOR
9 32.5 21.6 27.05 0.45 4 36
TOTAL 1989
100
2679.4
Vehicle Type
No. of
vehicles
Speed parameters (km/h)
% of vehicles
Equivalent PCU factor
PCU/hr.
Max. Min. Avg.
CAR 704 71.6 51.4 61.5 37.37 1 704
BUS 152 57.38 39.3 48.34 8.07 3.5 532
2W 748 60.2 49 54.6 39.70 0.75 561
3W 80 50.32 41.5 45.91 4.25 1.2 96
LCV 88 67.5 50.2 58.85 4.67 2 176
HCV 104 46.93 35.63 41.28 5.52 3.7 384.8
TRACTOR 8 30.23 22.6 52.83 0.42 4 32
TOTAL 1884 100 2485.8
Vehicle
Type
No. of vehicles
Speed parameters (km/h)
% of vehicles
Equivalents PCU factor
PCU/hr.
Max. Min. Avg.
CAR 1036 72 51.4 64.14 42.42 1 1036
BUS 168 56.84 37.24 49.25 6.88 3.5 588
2W 684 56.84 49 52.21 28.01 0.75 513
3W 164 49 41.5 45.5 6.72 1.2 196.8
LCV 200 67.5 49 55.36 8.19 2 400
HCV 184 41.53 31.7 36.95 7.53 3.7 680.8
TRACTOR
6 29.3 22.6 25.93 0.25 4 24
TOTAL
2442 100 3438.6
International Research Journal of Engineering and Technology (IRJET) e-ISSN: 2395-0056
Volume: 08 Issue: 03 | Mar 2021 www.irjet.net p-ISSN: 2395-0072
© 2021, IRJET | Impact Factor value: 7.529 | ISO 9001:2008 Certified Journal | Page 1188
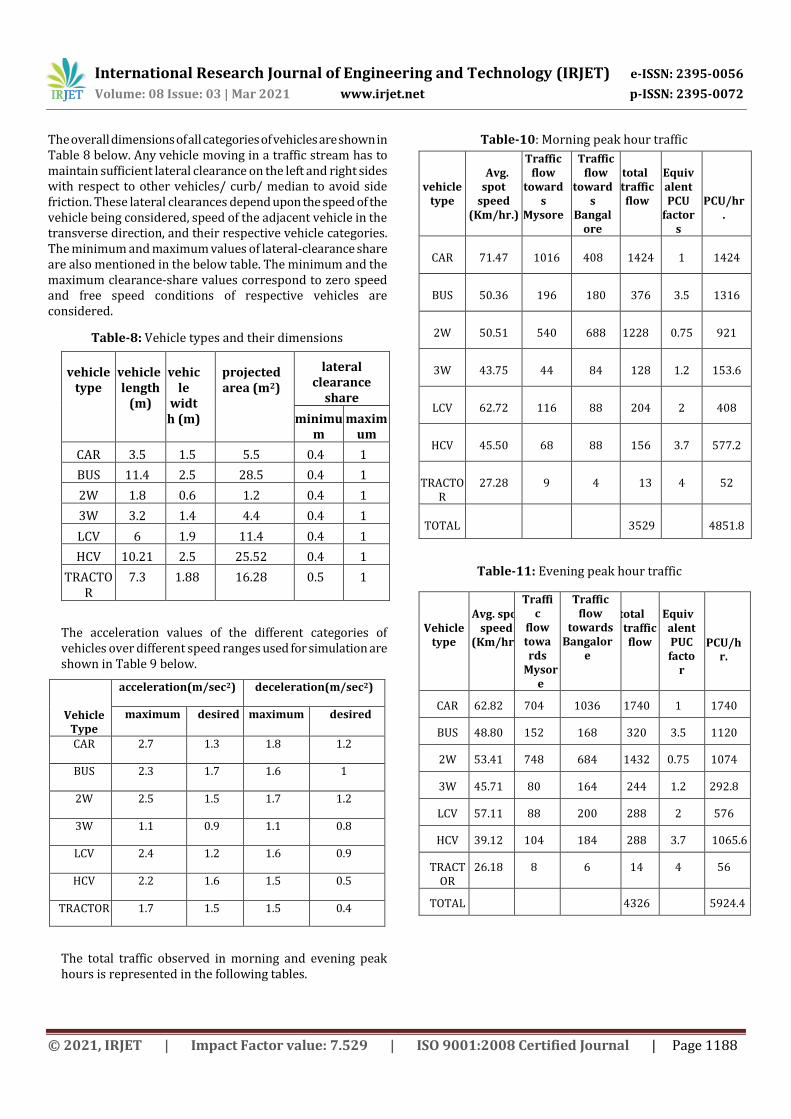
The overall dimensions of all categories of vehicles are shown in Table 8 below. Any vehicle moving in a traffic stream has to maintain sufficient lateral clearance on the left and right sides with respect to other vehicles/ curb/ median to avoid side friction. These lateral clearances depend upon the speed of the vehicle being considered, speed of the adjacent vehicle in the transverse direction, and their respective vehicle categories. The minimum and maximum values of lateral-clearance share are also mentioned in the below table. The minimum and the maximum clearance-share values correspond to zero speed and free speed conditions of respective vehicles are considered.
Table-8: Vehicle types and their dimensions
vehicle type
vehicle length
(m)
vehicle
width (m)
projected area (m2)
lateral clearance
share
minimum
maximum
CAR 3.5 1.5 5.5 0.4 1
BUS 11.4 2.5 28.5 0.4 1
2W 1.8 0.6 1.2 0.4 1
3W 3.2 1.4 4.4 0.4 1
LCV 6 1.9 11.4 0.4 1
HCV 10.21 2.5 25.52 0.4 1
TRACTOR
7.3 1.88 16.28 0.5 1
The acceleration values of the different categories of vehicles over different speed ranges used for simulation are shown in Table 9 below.
Vehicle Type
acceleration(m/sec2) deceleration(m/sec2)
maximum desired maximum desired
CAR 2.7 1.3 1.8 1.2
BUS 2.3 1.7 1.6 1
2W 2.5 1.5 1.7 1.2
3W 1.1 0.9 1.1 0.8
LCV 2.4 1.2 1.6 0.9
HCV 2.2 1.6 1.5 0.5
TRACTOR 1.7 1.5 1.5 0.4
The total traffic observed in morning and evening peak hours is represented in the following tables.
Table-10: Morning peak hour traffic
vehicle type
Avg.
spot speed
(Km/hr.)
Traffic flow
towards
Mysore
Traffic flow
towards
Bangalore
total traffic flow
Equivalent PCU
factors
PCU/hr.
CAR
71.47
1016
408
1424
1
1424
BUS
50.36
196
180
376
3.5
1316
2W
50.51
540
688
1228
0.75
921
3W
43.75
44
84
128
1.2
153.6
LCV
62.72
116
88
204
2
408
HCV
45.50
68
88
156
3.7
577.2
TRACTO
R
27.28
9
4
13
4
52
TOTAL
3529
4851.8
Table-11: Evening peak hour traffic
Vehicle type
Avg. spot
speed (Km/hr.)
Traffic
flow towards
Mysore
Traffic flow
towards Bangalor
e
total traffic flow
Equivalent PUC facto
r
PCU/hr.
CAR 62.82 704 1036 1740 1 1740
BUS 48.80 152 168 320 3.5 1120
2W 53.41 748 684 1432 0.75 1074
3W 45.71 80 164 244 1.2 292.8
LCV 57.11 88 200 288 2 576
HCV 39.12 104 184 288 3.7 1065.6
TRACTOR
26.18 8 6 14 4 56
TOTAL
4326
5924.4
International Research Journal of Engineering and Technology (IRJET) e-ISSN: 2395-0056
Volume: 08 Issue: 03 | Mar 2021 www.irjet.net p-ISSN: 2395-0072
© 2021, IRJET | Impact Factor value: 7.529 | ISO 9001:2008 Certified Journal | Page 1189
3. RESULTS AND DISCUSSIONS
3.1 ANALYSIS OF FIELD DATA
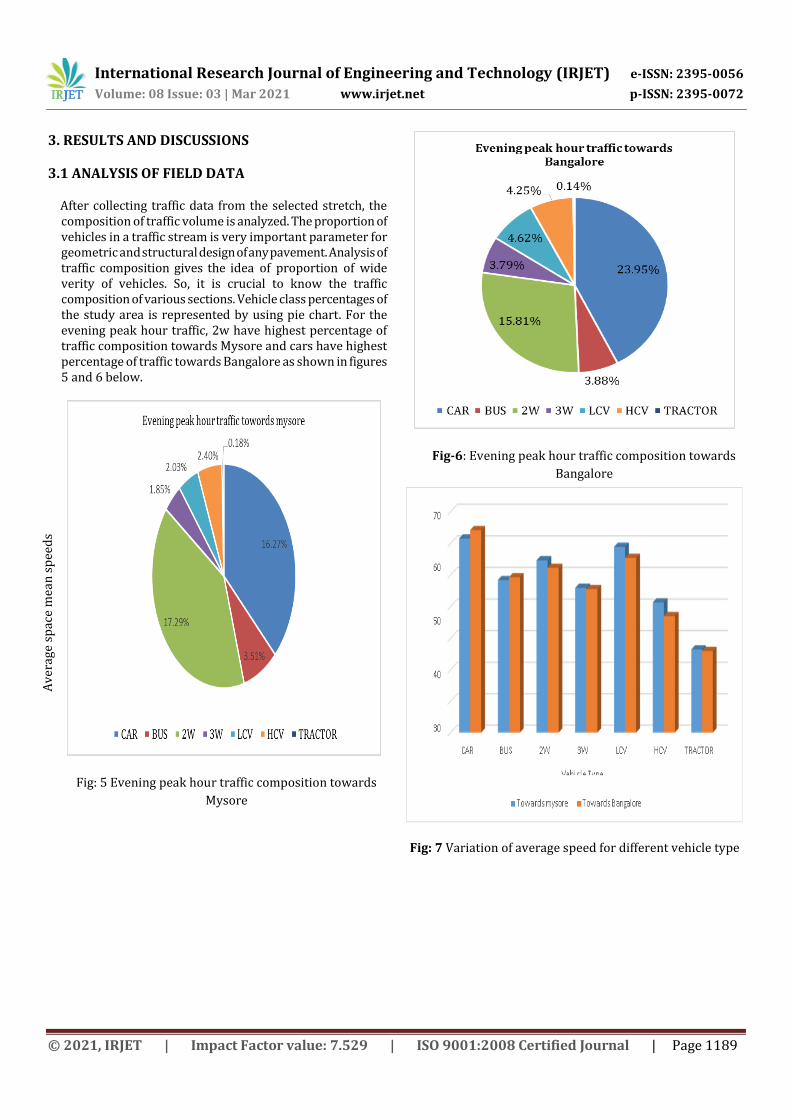
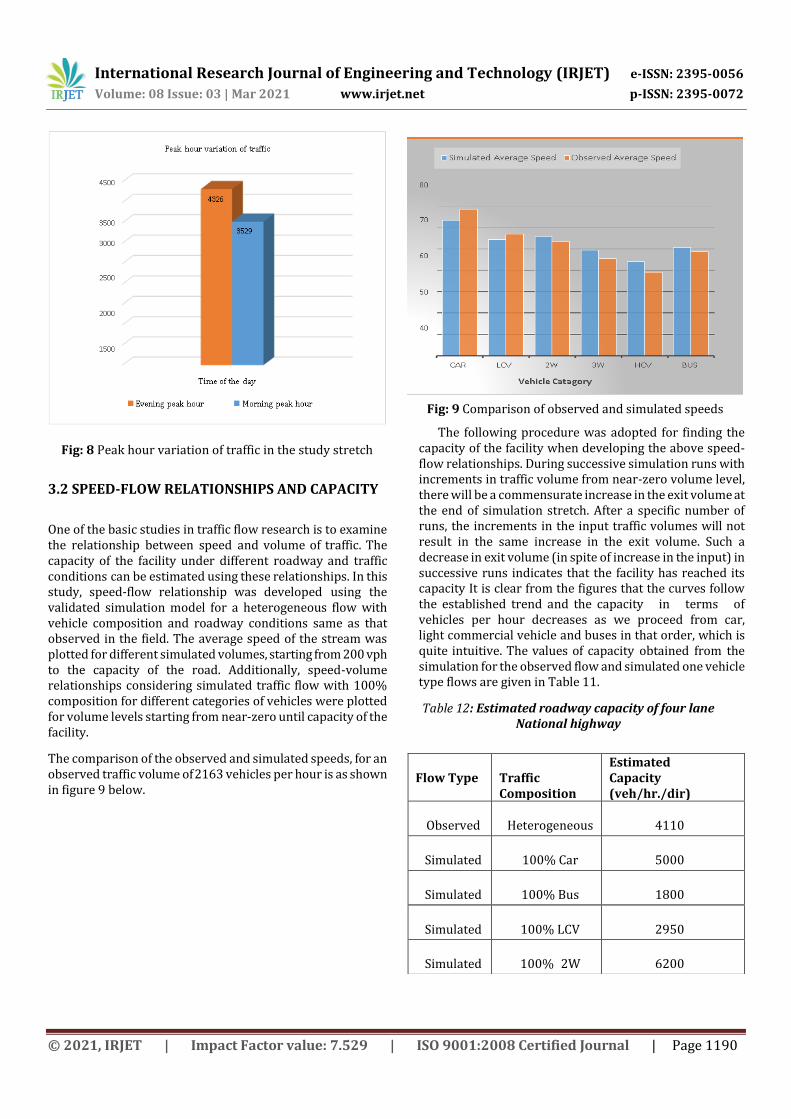
After collecting traffic data from the selected stretch, the composition of traffic volume is analyzed. The proportion of vehicles in a traffic stream is very important parameter for geometric and structural design of any pavement. Analysis of traffic composition gives the idea of proportion of wide verity of vehicles. So, it is crucial to know the traffic composition of various sections. Vehicle class percentages of the study area is represented by using pie chart. For the evening peak hour traffic, 2w have highest percentage of traffic composition towards Mysore and cars have highest percentage of traffic towards Bangalore as shown in figures 5 and 6 below.
Fig: 5 Evening peak hour traffic composition towards
Mysore
Fig-6: Evening peak hour traffic composition towards
Bangalore
Fig: 7 Variation of average speed for different vehicle type
Av
erag
e sp
ace
mea
n s
pee
ds
(Km
/hr)
International Research Journal of Engineering and Technology (IRJET) e-ISSN: 2395-0056
Volume: 08 Issue: 03 | Mar 2021 www.irjet.net p-ISSN: 2395-0072
© 2021, IRJET | Impact Factor value: 7.529 | ISO 9001:2008 Certified Journal | Page 1190
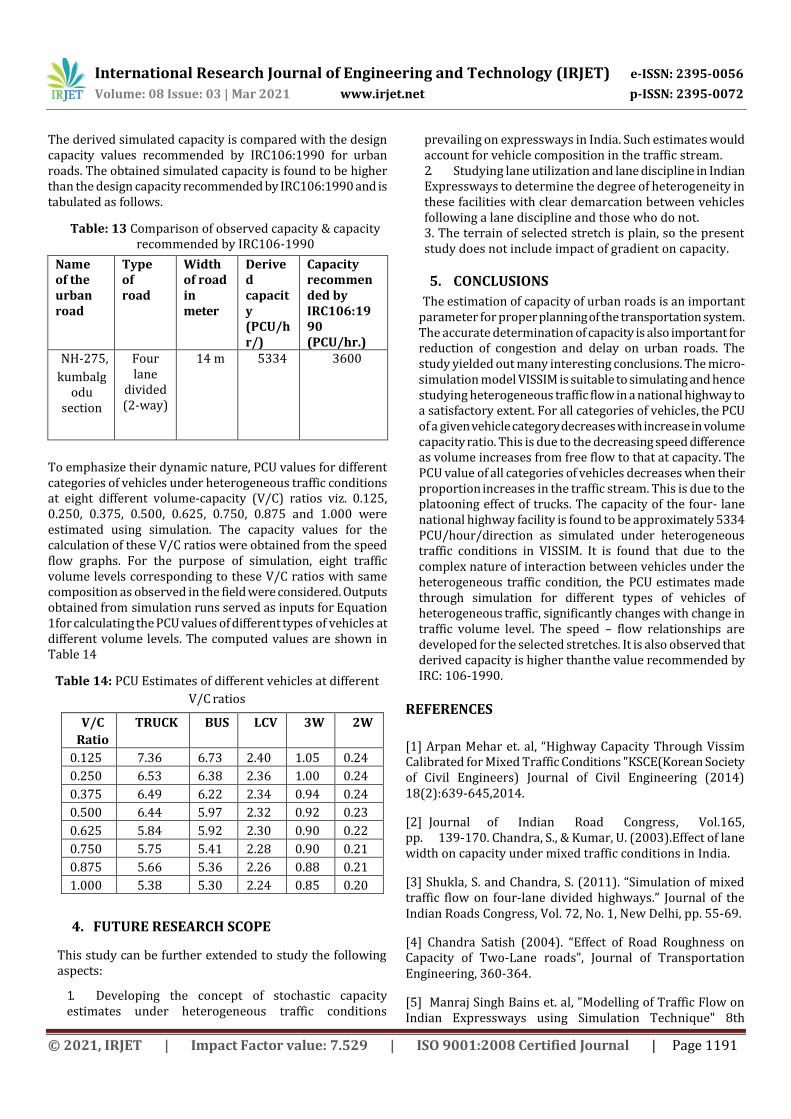
Fig: 8 Peak hour variation of traffic in the study stretch
3.2 SPEED-FLOW RELATIONSHIPS AND CAPACITY
One of the basic studies in traffic flow research is to examine the relationship between speed and volume of traffic. The capacity of the facility under different roadway and traffic conditions can be estimated using these relationships. In this study, speed-flow relationship was developed using the validated simulation model for a heterogeneous flow with vehicle composition and roadway conditions same as that observed in the field. The average speed of the stream was plotted for different simulated volumes, starting from 200 vph to the capacity of the road. Additionally, speed-volume relationships considering simulated traffic flow with 100% composition for different categories of vehicles were plotted for volume levels starting from near-zero until capacity of the facility.
The comparison of the observed and simulated speeds, for an observed traffic volume of 2163 vehicles per hour is as shown in figure 9 below.
Fig: 9 Comparison of observed and simulated speeds
The following procedure was adopted for finding the capacity of the facility when developing the above speed-flow relationships. During successive simulation runs with increments in traffic volume from near-zero volume level, there will be a commensurate increase in the exit volume at the end of simulation stretch. After a specific number of runs, the increments in the input traffic volumes will not result in the same increase in the exit volume. Such a decrease in exit volume (in spite of increase in the input) in successive runs indicates that the facility has reached its capacity It is clear from the figures that the curves follow the established trend and the capacity in terms of vehicles per hour decreases as we proceed from car, light commercial vehicle and buses in that order, which is quite intuitive. The values of capacity obtained from the simulation for the observed flow and simulated one vehicle type flows are given in Table 11.
Table 12: Estimated roadway capacity of four lane National highway
Flow Type
Traffic Composition
Estimated Capacity (veh/hr./dir)
Observed
Heterogeneous
4110
Simulated
100% Car
5000
Simulated
100% Bus
1800
Simulated
100% LCV
2950
Simulated
100% 2W
6200
International Research Journal of Engineering and Technology (IRJET) e-ISSN: 2395-0056
Volume: 08 Issue: 03 | Mar 2021 www.irjet.net p-ISSN: 2395-0072
© 2021, IRJET | Impact Factor value: 7.529 | ISO 9001:2008 Certified Journal | Page 1191
The derived simulated capacity is compared with the design capacity values recommended by IRC106:1990 for urban roads. The obtained simulated capacity is found to be higher than the design capacity recommended by IRC106:1990 and is tabulated as follows.
Table: 13 Comparison of observed capacity & capacity recommended by IRC106-1990
Name of the urban road
Type of road
Width of road in meter
Derived capacity (PCU/hr/)
Capacity recommended by IRC106:1990 (PCU/hr.)
NH-275,
kumbalgodu
section
Four lane
divided (2-way)
14 m 5334 3600
To emphasize their dynamic nature, PCU values for different categories of vehicles under heterogeneous traffic conditions at eight different volume-capacity (V/C) ratios viz. 0.125, 0.250, 0.375, 0.500, 0.625, 0.750, 0.875 and 1.000 were estimated using simulation. The capacity values for the calculation of these V/C ratios were obtained from the speed flow graphs. For the purpose of simulation, eight traffic volume levels corresponding to these V/C ratios with same composition as observed in the field were considered. Outputs obtained from simulation runs served as inputs for Equation 1for calculating the PCU values of different types of vehicles at different volume levels. The computed values are shown in Table 14
Table 14: PCU Estimates of different vehicles at different
V/C ratios
V/C
Ratio
TRUCK BUS LCV 3W 2W
0.125 7.36 6.73 2.40 1.05 0.24
0.250 6.53 6.38 2.36 1.00 0.24
0.375 6.49 6.22 2.34 0.94 0.24
0.500 6.44 5.97 2.32 0.92 0.23
0.625 5.84 5.92 2.30 0.90 0.22
0.750 5.75 5.41 2.28 0.90 0.21
0.875 5.66 5.36 2.26 0.88 0.21
1.000 5.38 5.30 2.24 0.85 0.20
4. FUTURE RESEARCH SCOPE
This study can be further extended to study the following aspects:
1. Developing the concept of stochastic capacity estimates under heterogeneous traffic conditions
prevailing on expressways in India. Such estimates would account for vehicle composition in the traffic stream. 2. Studying lane utilization and lane discipline in Indian Expressways to determine the degree of heterogeneity in these facilities with clear demarcation between vehicles following a lane discipline and those who do not. 3. The terrain of selected stretch is plain, so the present study does not include impact of gradient on capacity.
5. CONCLUSIONS
The estimation of capacity of urban roads is an important parameter for proper planning of the transportation system. The accurate determination of capacity is also important for reduction of congestion and delay on urban roads. The study yielded out many interesting conclusions. The micro-simulation model VISSIM is suitable to simulating and hence studying heterogeneous traffic flow in a national highway to a satisfactory extent. For all categories of vehicles, the PCU of a given vehicle category decreases with increase in volume capacity ratio. This is due to the decreasing speed difference as volume increases from free flow to that at capacity. The PCU value of all categories of vehicles decreases when their proportion increases in the traffic stream. This is due to the platooning effect of trucks. The capacity of the four- lane national highway facility is found to be approximately 5334 PCU/hour/direction as simulated under heterogeneous traffic conditions in VISSIM. It is found that due to the complex nature of interaction between vehicles under the heterogeneous traffic condition, the PCU estimates made through simulation for different types of vehicles of heterogeneous traffic, significantly changes with change in traffic volume level. The speed – flow relationships are developed for the selected stretches. It is also observed that derived capacity is higher than the value recommended by IRC: 106-1990.
REFERENCES
[1] Arpan Mehar et. al, “Highway Capacity Through Vissim Calibrated for Mixed Traffic Conditions "KSCE(Korean Society of Civil Engineers) Journal of Civil Engineering (2014) 18(2):639-645,2014.
[2] Journal of Indian Road Congress, Vol.165, pp. 139-170. Chandra, S., & Kumar, U. (2003).Effect of lane width on capacity under mixed traffic conditions in India.
[3] Shukla, S. and Chandra, S. (2011). “Simulation of mixed traffic flow on four-lane divided highways.” Journal of the Indian Roads Congress, Vol. 72, No. 1, New Delhi, pp. 55-69.
[4] Chandra Satish (2004). “Effect of Road Roughness on Capacity of Two-Lane roads”, Journal of Transportation Engineering, 360-364.
[5] Manraj Singh Bains et. al, "Modelling of Traffic Flow on Indian Expressways using Simulation Technique" 8th
International Research Journal of Engineering and Technology (IRJET) e-ISSN: 2395-0056
Volume: 08 Issue: 03 | Mar 2021 www.irjet.net p-ISSN: 2395-0072
© 2021, IRJET | Impact Factor value: 7.529 | ISO 9001:2008 Certified Journal | Page 1192
International Conference on Traffic and Transportation Studies Changsha, China, ELSEVIER August 1–3,(2012)
[6] Yang, X. and Zhang, N. (2005). “The marginal decrease of lane capacity with the number of lanes on highway.” Proc. of Int. Conf. of Eastern Asia Society for Transportation Studies (EASTS), Vol. 5, pp. 739-749
[7] Chetan R. Patel, G. J. Joshi (2014), „„Mixed Traffic Speed– Flow Behavior under Influence of Road Side Friction and Non-Motorized Vehicles: A Comparative Study of Arterial Roads in India.
[8] Chandra, S. (2004). Capacity estimation procedure for two lane roads under mixed traffic conditions.
[9] Dey, P. P., S. Chandra, & S. Gangopadhyay. (2008). Simulation of mixed traffic flow on two-lane roads.
[10] Hossain, M.J. (2004).Calibration of the microscopic traffic flow simulation model VISSIM for urban conditions in Dhaka city. Master thesis, University of Karlsruhe, Germany.
AUTHOR BIOGRAPHY
Pranay Raj BS B.E., M.TECH., (PhD) Received Bachelor of Engineering in Civil Engineering from PES college of Engineering Mandya in 2014. And also received Master of Technology in Transportation Engineering from Reva Institute of Technology Bangalore in 2016. At presently working as an Assistant Professor, Department of Civil Engineering JVIT, Bidadi, Bangalore.
Related Documents