UCRL-53319 Distribution Category UC-70 UCRL--5 331 9 DE83 000338 Estimation of Tracer Diffusion Coefficients of Ions in Aqueous Solution Donald G. Miller Manuscript date: September 7,1982 LAWRENCE LIVERMORE LABORATORY University of California Livermore, California 94550 Available from: National Technical Information Service U.S. Department of Commerce 5285 Port Royal Road 0 Springfield, VA 22161 0 $5.00 per copy 0 (Microfiche $3.50)

Welcome message from author
This document is posted to help you gain knowledge. Please leave a comment to let me know what you think about it! Share it to your friends and learn new things together.
Transcript

UCRL-53319 Distribution Category UC-70
UCRL--5 331 9
DE83 000338
Estimation of Tracer Diffusion Coefficients of Ions in
Aqueous Solution Donald G. Miller
Manuscript date: September 7,1982
LAWRENCE LIVERMORE LABORATORY University of California Livermore, California 94550
Available from: National Technical Information Service U.S. Department of Commerce 5285 Port Royal Road 0 Springfield, VA 22161 0 $5.00 per copy 0 (Microfiche $3.50)

DISCLAIMER
This report was prepared as an account of work sponsored by an agency of the United States Government. Neither the United States Government nor any agency Thereof, nor any of their employees, makes any warranty, express or implied, or assumes any legal liability or responsibility for the accuracy, completeness, or usefulness of any information, apparatus, product, or process disclosed, or represents that its use would not infringe privately owned rights. Reference herein to any specific commercial product, process, or service by trade name, trademark, manufacturer, or otherwise does not necessarily constitute or imply its endorsement, recommendation, or favoring by the United States Government or any agency thereof. The views and opinions of authors expressed herein do not necessarily state or reflect those of the United States Government or any agency thereof.

DISCLAIMER Portions of this document may be illegible in electronic image products. Images are produced from the best available original document.
,
Abstract . Introduction
CONTENTS
0 . 0 .
. . . . . . . . . . . . . . . . . . . . . . . . . . .
Infinite Dilu-ion Estima-es in General . . . . . . Values of Ai and Their Temperature Dependence . . . . Estimates of Tracer D at Infinite Dilution . . . . . Concentration Dependence of Tracer Diffusion Coefficients
References . . . . . . . . . . . . . . .
0
0 i
1
1 4
6
10 13 17
iii

Q
ESTIMATION OF TRACER DIFFUSION COEFFICIENTS OF IONS IN
AQUEOUS SOLUTION
ABSTRACT
0 Equations are given for estimating tracer diffusion coefficients Di
of ions at infinite dilution in terms of limiting ionic conductances
0 A , . Also given are generalized Nernst-Hartley equations for binary and 1
n n U multicomponent diffusion coefficients D" and Dij, respectively, at
0 i infinite dilution. Data, estimates, and correlations for A at 25OC
0 and other temperatures are discussed. Estimated values of Ai are
tabulated from 0-300°C for ions of waste isolation interest and for ions of
economic interest in geothermal brines. Estimates of their tracer diffusion
coefficients at infinite dilution are tabulated. A rule of thumb, good to a
factor of 2, is presented. Very limited data (available only at 25OC)
0 indicate that D./D. generally declines as the concentration of salt or
supporting electrolyte increases.
1 1
INTRODUCTION
Transport data are frequently required to accurate-1 model systems of
practical interest. Examples are the precipitation of valuable metals from
geothermal brines, the diffusive transport of radioactive isotopes away from a
flooded repository, the diffusion of salt between the two aqueous layers of a
solar pond, the diffusion to and from electrodes in battery'systems, etc.
Clearly, diffusion coefficients are an important transport property.
1

2 Diffusion is complexf since n diffusion coefficients are required for n
solutes in a solvent. Fortunately tracer diffusion, useful in some
applications, is simpler. Unfortunately diffusion coefficients are difficult
to measure even in 1-solute systems, and there are little data--especially at
temperatures greater than 25OC. There are much less data in multicomponent
systems: there is nothing at higher temperatures except a few tracer results,
and the experiments are much more difficult.
It is thus desirable to find ways of estimating diffusion coefficients in
binary and multicomponent systems.
dependences of binary systems are too complex to predict in advance,
especially for electrolytes. Figure 1 shows examples of this complexity.
Moreover, there are not enough systematic data for multicomponent systems to
Unfortunately the concentration
seeawhether binary data can be successfully used to predict multicomponent
properties.
work well for 1-1 strong electrolyte mixtures,
There is a method based on irreversible thermodynamics which does a
1 but which requires extensive
binary transport data. However, for higher valence type mixtures, this method
has not yet been tested.
For very dilute electrolyte solutions, however, it is possible to make
estimates of the diffusion coefficients by generalizing the old Nernst-Hartley
equation.
concentration ratios. The data required are just the limiting ionic
conductances (infinite dilution values) A. as a function of temperature.
The equations’ are given below [Eq. (3) ] and are valid at all
0 1
In this report, we shall be concerned with estimates of tracer diffusion
coefficients at various temperatures, with emphasis on ions with economic
value from geothermal brines and on ions of radioactive isotopes. As noted
earlier, there are few real data to use as guidance for tracer diffusion

c z
2.5
2.0
I .5
. E 0
6 1.0 X In 0
0.5
0
~
I I I I
KCI
-
c - NOCl
CI
05 I .o I .5 2 .o 2.5
. .
3.0
Figure 1. some electrolytes found in brines, seawater, and ground waters.
Concentration dependence of diffusion coefficients at 25OC for
co ieits D~ high concentratio her salts associated with
either brines or salt beds.
temperatures for infinite dilution estimates. Moreover, the complex-forming
transition metals like Zn, Ca, and Fe are not strong electrolytes. Our
expectation is that Di will be lower for'a charged complex ion.
Nernst-Hartley-type equations themselves are poor approximations at finite
concentrations.
0 There are also few data for Ai at higher
Finally,
3

Despite the above-mentioned difficulties, we shall estimate tracer
diffusion coefficients at infinite dilution for a number of ions at different 0
temperatures.
temperatures.
effects on D i
in the light of existing data.
estimates are very approximate.
To do this will require estimates of Ai at different
The results will be tabulated and rules of thumb given; The
from higher concentrations of other salts will be considered
Finally, it is important 'to note that the
INFINITE DILUTION ESTIMATES IN GENERAL
Diffusion can be described by Fick's Law.l For a binary system (one
solute in a solvent) of any concentration, we write in one dimension:
ac -J = D- ax
and for multicomponent systems of n solutes:
i = l,..., n
2 where J, Ji are flows; D, D.. are diffusion coefficients (cm /SI: c,
c. are volume concentrations in mol/dm3, and x is the distance. By
writing out 4. (2), it is clear that a 2-solute system requires 4 diffusion
coefficients and a 3-solute system requires 9, etc. Sometimes the cross terms
13
1
i # j are quite large (and even negative), and can exceed a main term 3 coefficient I)...
11
For infinite dilution in electrolyte solutions which have a common anion
(characteristic of brines and many natural waters), the generalizations of the
Nernst-Hartley equation can be derived from irreversible thermodynamics. 1,4
4

c f
These equations are presented for convenience if more than tracer results are
wanted:
Binary:
i 4 Ao
on (il - in) 0 RT D = - e - F2 A
Multicomponent:
where
0 n
i=l Ao = xi Ai , (4)
and where n refers to the common anion, i (up to n-1) refers to the various
cations, ria is the stoichiometric coefficient of ionization for the common
anion of the ith salt whose formula is C A , A , is the limiting
conductance of ion i, R is the gas constant (8.3144 joules/mol K), T is the
absolute temperature in K, F is the Faraday (96,493 coulombs/equiv), aij is the Kronecker delta, and zi is the valence of ion i with due regard to
sign.
0 1 'ic ria
The equivalent fraction xi is given by
Ni x = - i N ' ( 5 )
where
i = I,..., n-1 (6) Ni - - riCzici
and n-1
i =1 N = C N i t (7 1
where ric is the stoichiometric coefficient of cation it and ci is the
concentration of salt i.
ions.
The Dij correspond to the flows of salts, not
The superscript 0 refers to infinite dilution.
5
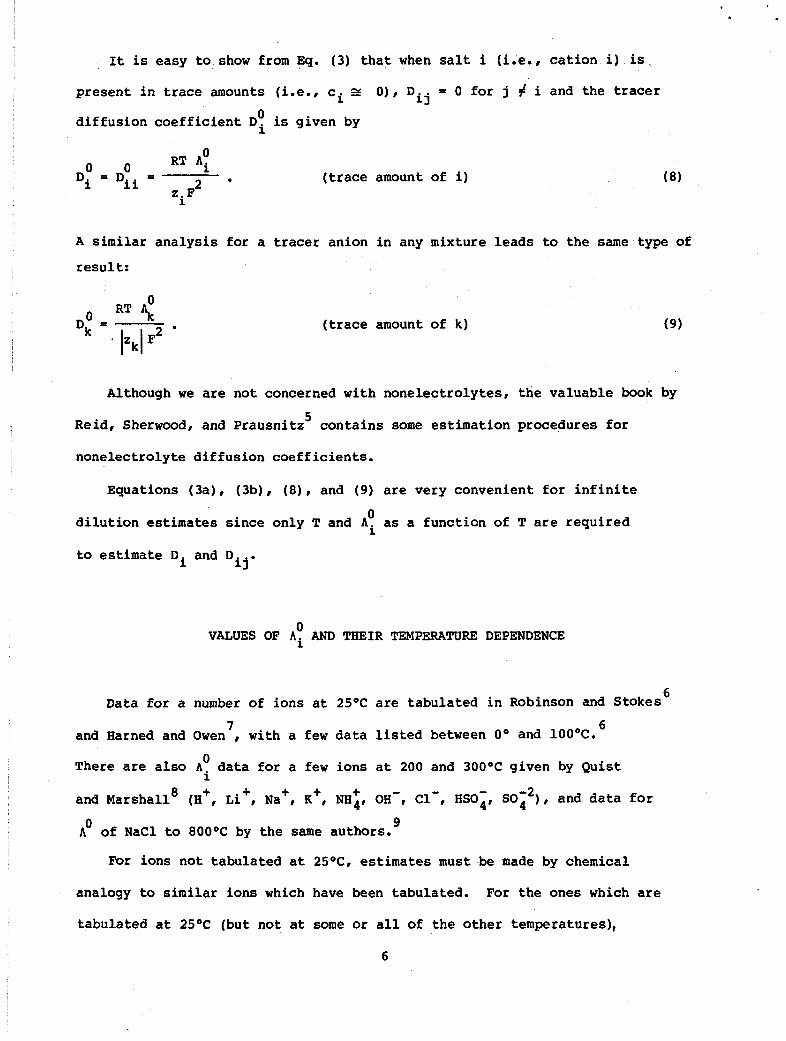
It is easy t o show from Eq. (3) t h a t when s a l t i (i.e., c a t i o n i) is
presen t i n trace amounts (i.e., c i s O ) , D i j - - 0 for j # i and the tracer
d i f f u s i o n c o e f f i c i e n t D 0 i is given by
(trace amount of i)
A similar a n a l y s i s for a tracer anion i n any mixture leads to t h e same type of
result:
(trace amount of k )
Although w e are no t concerned w i t h n o n e l e c t r o l y t e s , t h e va luab le book by
5 I Reid, S h e r W ~ ~ d , and P rausn i t z c o n t a i n s some e s t i m a t i o n procedures for
none lec t ro ly t e d i f f u s i o n c o e f f i c i e n t s .
Equations (3a) , (3b) , (8) , and (9) are very convenient f o r i n f i n i t e
0 d i l u t i o n estimates s i n c e only T and A . as a f u n c t i o n of T are r e q u i r e d
to estimate D and D
1
ij ' i
0 VALUES OF Ai AND THEIR TEMPERATURE DEPENDENCE
6 Data for a number of i o n s a t 25OC are t a b u l a t e d i n Robinson and Stokes
7 6 and Harned and Owen , w i t h a few d a t a listed between 0' and 100°C.
There are also A , data f o r a f e w ions a t 200 and 3OOOC given by Quist
and Marshall8 (H+, ~ i + , Na+r K+, N H ~ , OH-, cl-, HSO;,
A of N a C l to 8OOOC by t h e same authors .
0 1
+ and data for
0 9
For ions no t t a b u l a t e d a t 25OC8 estimates must be made by chemical
analogy to similar i o n s which have been tabulated. For t h e ones which are
t abu la t ed a t 25OC ( b u t no t a t some or a l l of t h e o t h e r temperatures),
6

estimates may be made by assuming t h e i o n i c conductances are p a r a l l e l to or i n
between other i o n s whose A . are close a t 25OC and when possible are
chemical ly similar.
va lue a t 50.C is i n t e r p o l a t e d from a graph of Ca+2 data.
f o r C s
0 1
Thus Sr+2 is assumed to be similar to Ca+2, and t h e
I n add i t ion , va lues
+ and I- a t 5OoC are averages o f 45 and 55OC data i n Ref. 6; t he error
w i l l be no t more than 1-2%.
F igu re 2 shows p l o t s of some data of Q u i s t and Marshall*" and Robinson
and Stokes,' p l u s some exbrapo la t ions f o r Ba+2 and Ag + to 3OOOC which
0 follow t h e g e n e r a l cu rva tu re of t h e o t h e r ions. The A. for b r i n e ions have
been treated as follows:
average between N a andbBa+2; Fe
average between and C1-. Waste i s o l a t i o n ions have been treated
1 +
Zn+2 about 5% more than N a ; C U + ~ as 0.94 of t h e
a b o u t 2.5% more than Ca+2; Pb+2 as an . + +2
+ +2 1
as follows: *Cs+ l i k e C1-; T+ l i k e H ; Sr+2 abou t 7% less than Ba ;
Ra+2 about 2% more t han Ba+2, assuming t h a t Ao
Ce+3 to be l i k e La+3, and La+3 t o be p a r a l l e l to Ba+2 s i n c e Aloe/ A25 Y 3.08
- + 0.04 f o r La+3, Mg+*, Ca+2,_ and-Ba+2 ( t h u s Ce+3 is about 9.7%
+2 0 more than Ba );
t h e same as Ba+2; I- l i k e C1-; and TcO- l i k e Reo; a t 25OC and about 7.5% more 4
than HSO- a t other temperatures.
a t 2 5 O is approximately 65; Ra
l i k e ' t h e rare e a r t h s with Ai = 64 and otherwise
.r 4
These estimates are collected i n Table 1.
A 1 t e
a n e x c e l l e n t paper by Nigrin
i o n i c e n t r o p i e s , e n t r o p i e s of hydrat ion, or charge-to-radius ra t
t h e data base of R e f s . 6-9, -he obt
charge-to-radius ratios. Unfortunately, however, anions do no t correlate w e l l
sted q u a n t i t i e he u i n
e s t i m a t i n g c a t i o n r a d i i are about t h e same as from o u r u s e of chemical
s i m i l a r i t y .
7

1000
800
600 0 .- <
40C
20c
C I I I
200 300 t *c IO0
Figure 2. A! as a function of temperature.
Temperature dependence of experimental limiting ionic conductances
a

c
0 Estimates and data for Ai at various temperatures. Table 1.
AI), cm 2 /(ohm equiv)
Ion O°C 25OC 5OoC 100°C 15OOC 2OOOC 25OOC 30OOC
Experimental Data
H+ 225 350 463 634 752 824 865 894
Na 26.5 50.1 80 151 226 304 382 459 +
c1- 41.0 76.4 117 211 303 391 478 561
HSO; -- 51.2 75 140 212 290 367 440
41 80 127 246 378 525 672 800
~~ ~ ~~~ ~~ ~ ~~ ~~
Ions from Geothermal Brines
A9+ 33.1 61.9 95 175 263 348 427 506
Ba 34.0 . 63.6 101 195 286 372 452 530 +2
28 52.8 84 159 237 319 401 482
29 53.6 85 163 241 319 3 93 466
+2
+2 Zn
cu
30 55 87 16 7 247 32i 403 4 78 +2 Fe
Pb+2 38 69.5 109 20 3 294 382 465 546
Waste Isolation Ions
CS+ 44 77.2 116 210 303 390 478 561
T+ 225 463 634 752 824 86 894
31 95 346 420 493 Sr
35 103 380
37 111 214 314 408
34 64 101 372 452 530 Pu
I 41.4 76.8 117 210 303 391 478 561
+2
+3
- Tc04 -- 55 81 150 228 312 395 473
9

Nigrini" also linearly correlated A: up to 3OOOC in terms of 0 hi at 25OC.
temperatures for +1, +2, +3 cations, and for halogens, monovalent oxyanions,
and divalent oxyanions.
treated. The difference between A . values from his and our temperature
correlations are 6% or less.
Linear coefficients are given at each of several
Because of limited data, few anions could be
0 1
0 ESTIMATES OF TRACER Di AT INFINITE DILUTION
Table 2 contains the results of using the A i from Table 1 in
Eqs. (8) or (9). Because of the T factor in Eqs . (8) and ( 9 ) , the tracer
diffusion coefficient goes up faster with T than does Ai . because of the valence factor z in the denominator, higher valence cations
typically have smaller D: than univalent ions.
0 Moreover,
0 At the bottom of Table 2 are the average Di, excluding H+ and
T'.
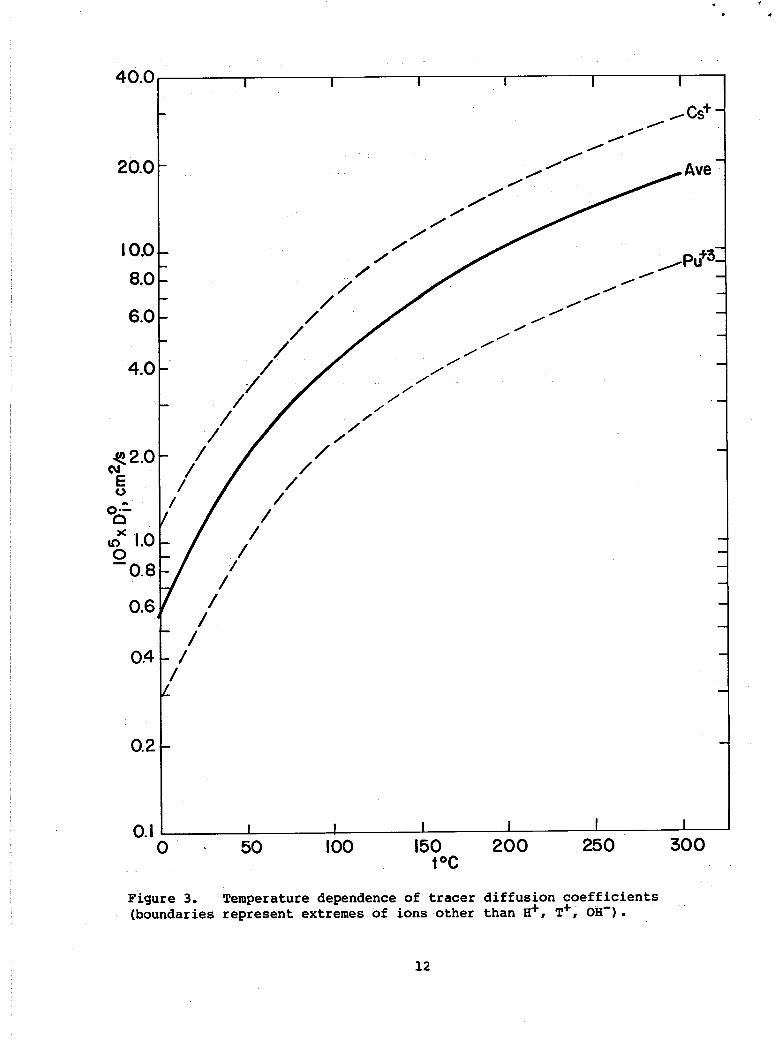
diffusion coefficients of ions other than H , T , and OH- are: at 25OC, half the 25O value at O o , double at 50°, 4 times at looo, 7 times at
150°, 10 times at 2 0 0 ° , 15 times at 250°, and 20 times at 300O. The average
values plus upper and lower limits are plotted in Fig. 3 H and T being
excluded). Figure 3 is thus suitable for crude estimates
noted that the average values in cm /s from Table 2 between 25 and 3OOOC can
be described quite well by the equation
A rough rule of thumb, good to about a factor of 2 is that the tracer
cm /s + + 2
+ +
Campbell" has
2
-3 = 4.205 x 10 exp (-1746/T) 0 i ave D
The calculated value at OOC, however, is 40% too high, but still within the
factor of 2.
10

i
Table 2. Estimates of tracer D 0 at various temperatures at infinite dilution. i
10 5 0 Dit cm2/s
Ion O°C 25OC 5OoC 100°C 15OOC 2OOOC 25OOC 3OOOC
Experimental Data 5.5 9.3 13.4 21.1 28.4 34.8 40.4 45.8
0.65 1.3 2.3 5.0 8.5 12.8 17.8 23.5
1.0 2.0 3.4 7.0 11.4 16.5 22.3 28.7
1.4 2.2 4.7 8.0 12.3 17.1 22.5
SOi2 0.50 1.06 1.8 4.1 7.1 11.1 15.7 20.5
H+
N a+
c 1- I
"mi --
~ Ions from Geothermal Brines
Ag+ 0.81 1.6 2.7 5.8 9.9 14.7 19.9 25.9
Ba 0.41 0.85 1.5 3.2 5.4 7.9 10.6 13.6
0.34 0.70 1.2 2.6 4.5 6.7 9.4 12.3 Zn
+2
+2
+2
+2
cu 0.35 0.71 1.2 2.7 4.6 6.7 9.2 11.9
0.37 0.73 1.3 2.8 4.7 6.9 .9.4 12.2 Fe
Pb+2 0.46 0.93 1.6 3.4 5.6 8.1 10.9 14.0
Waste Isolation Ions
cs+ 1.1 2.1 3.3 7.0 11.4 10.5 22.3 28.7
T+ 5.5 9. 3 13.4 21.1 28.4 34.8 40.4 45.8
Sr +2 . 0.38 0.79 1.4 3.0 5.0 7.3 9.8 12.6
0.43 0.87 1.5 3.3 5.5 8.0 10.8 13.8 Ra
Ce
Pu
1- 1.01 2.0 3.4 7.0 11.4 16.5 22.3 28.7
1.5 2.3 5.0 8. 6 13.2 18.5 24.2
Averagea 0.50 1.2 2.0 4.2 7.0 loe4 14.2 18.4
I +2
+3
+3
0.30 0.62 1.1 2.4 4.0 5.7 7.7 9.9
0.28 0.57 1.0 2.2 3.6 5.2 7.0 9.0 1
TCOi --
a All but H+, T+.
11
40.0
20.0
10.0 8.0
6.0
4.0
2.0 cu E
0.2 d
0 -0.8
0
mx 1.0
0.6
0.4
0.2
0. I
I I I I I I
0 - 50 100 150 200 250 300 t O C
.
Figure 3. (boundaries represent extremes of ions other than H', T', OH').
Temperature dependence of tracer diffusion coefficients
12

Again it is important to note that these infinite dilution values of 3 0
0
Di are very approximate--except for the first group of ions for which
A . was experimentally determined. Errors are greatest for ions whose
values are based on analogy and/or extrapolation, and are of the order of
1
20-30%.
Radioactive tracers can be used to measure Di at high dilution in
diaphragm cells at higher temperatures to a few percent. Consequently it
would be very desirable to measure some for a number of ions.
ultimately be an easier way to get Ai at high temperatures rather than
limiting conductance and transference number measurements.
This may 0
CONCENTRATION DEPENDENCE OF TRACER DIFF'USION COEFFICIENTS
There are some data for tracer diffusion of one ion in its own solution 3
for +1, +2, and -1 valence ions, often up to several mol/dm (Refs. 12-20].
There are also some data for univalent ions in 1-1 solutions of other
salts. 12-20
other solutions.
There do not appear to be any data for igher valence ions in
and the sum
12-20 chloride solutions at 25OC.
13
I

0.8
0.6
0 4
0.2
+ s o l u t i o n s is much t h e same for a l l the ions , except t h a t t h e E3 ratio i s
0 No+ A CI' 0 I'
m
8 a - m 8 e
- - -
0 Figure 4. Concentrat ion 0 - dependence of D i / D p
' 8 m -
- - i n terms of i o n i c s t r e n g t h I. f o r +1 i o n s i n N a C l a t 25OC
I
m - - - - -.
- - i I I I I I I
0 somewhat lower everywhere.
g iven suppor t ing e l e c t r o l y t e is g e n e r a l l y t rue.20
The s i m i l a r i t y of Di/Di f o r a l l i ons i n a
Saturated N a C l is a good
analogy to what would be expected from the n e a r l y s a t u r a t e d Sa l ton Sea
geothermal b r i n e s and from s o l u t i o n s i n bedded sal t . Consequently for T ,
C s , and I-, t h e tracer Do i n such N a C l b r i n e s should be about 1/3 to
1/2 of t h e i r va lues a t i n f i n i t e d i l u t i o n .
+
+ / 1
Figure 5 shows t h a t a l l t h e +2 i ons have a similar d e c l i n e i n t h e i r own +2 +2 +2
so lu t ions . The ions Mg , Ca , Ba+2, and N i are a l l s t r o n g +2
e l e c t r o l y t e s , so t h a t some s i m i l a r i t y is n o t su rp r i s ing . However, Cd
s t r o n g l y complexes w i t h C1- i n i ts own s o l u t i o n s , and t h e bulk of t h e
complex might have been expected to slow down t h e trace ion.
i i I
A possible
1 4 f

.
- 0
A - 8 - -
-.
- A 103
I I I I I I I I I 1 I I A
' * " F a 0
0:8 40 n
A I r
0.6 0 *- 0 \ .- n
0.4
0.2
0
Figure 5. Concentrat ion dependence of D i n ! for +2 c a t i o n s i n t h e i r chlorides a t 25OC i n terms of i o n i c s t r e n g t h I.
conclus ion is t h a t t h e complexed Cd+2 has about t h e same r e l a t i v e properties
as t h e hydrated other +2 ions. 0 On t h e o t h e r hand, t h e D I D i ratio for
CdCl is g r e a t l y a f f e c t e d by the complexing, whereas t he ratio 2
curves for C1- i n o t h e r +2 ion s o l u t i o n s are a l l much t h e same. It should
also be noted tha t t h e ratios for C1- i n KC1 s o l u t i o n s fo l low a curve
d i f f e r e n t from ratios for C1- i n NaCl so lu t ions .
shown i n Fig. 6.
These 25OC r e s u l t s are
omponent system f o r which t r data are a v a i l a b l
+ It is found t h a t g e n e r a l l y tracer Di for Na I
+ K I and C1- f a l l i n between their va lues i n N a C l and K C 1 a t t h e same
15

I I I I 1 I I I I I I I
1.0 - 0 KCI - D p O 0 0 NaCl -
u CaC12 0 0
P a M MgC12 -
A
A
0 - A
A -
I I I I I I I 1 I I I I
0
A i A Ba CI2
0
A A
Figure 6. chlorides at 25OC in terms of ionic strength I.
Concentration dependence of Di/D; for C1' in various
overall concentration. It is expected that this would hold true at least for
other strong electrolyte mixtures at the same overall ionic strength.
Owing to inadequate data, it is difficult to offer any general estimation
rule for tracer D. at high concentrations, other than D decrease with
increasing concentration.
1 i
There appear to be so few data at other than 25OC
that essentially nothing can be said.
with concentration may possibly be similar to the results at 25OC.
Perhaps to 2OO0C, the decline in Di
Thus, in
bedded salt, an arbitrary choice of Di/DP = 0.5 in 5M NaCl will
probably be good to a factor of 2.
experimental tracer data in NaCl for many more ions and at some higher
Clearly it would be desirable to obtain
temperatures.
16

REFERENCES
1. 2.
3. 4.
5.
6.
7.
8. 9.
10 . 11 . 12.
13.
14.
15. 16.
17.
18.
19 . -
D. G. Miller, J. Phys. Chem. 71, 616 (1967). P. J. Dunlop, B. J. Steel, and J. E. Lane, in "Physical Methods of
Chemistry," A. Weissburger and B. W. Rossiter, Eds., Vol. 1, Part IV, Chapt. IV, p. 205 (John Wiley, New York, 1972).
H. Kim, R. Deonier, and G. M. Reinfelds, J. Solution Chem. 2, 445 (1974). D. G. Miller, J. Phys. Chem. 2, 3588 (1967). R. C. Reid, J. M. Prausnit'z, and T. K. Sherwood, "The Properties of Gases and Liquids," 3rd ed. (McGraw-Hill, New York, 1977), Chapter 11.
R. A. Robinson and R. H. Stokes, "Electrolyte Solutions," 2nd ed.,
revised (Butterworths, London, 1965), pp. 463, 465.
H. S. Harned and B. B. Owen, "The Physical Chemistry of Electrolytic Solutions," 3rd ed. (Reinhold Publishing Corp., New York, 1958), p. 231.
A. S. Quist and W. L. Marshall, J. Phys. Chem. 69, 2984 (1965). A. S. Quist and W. L. Marshall, J. Phys. Chem. 72, 684 (1968). A. Nigrini, Am. Jour. Sci. 269, 65 (1970). J. H. Campbell, Lawrence Livermore National Laboratory, Livermore,
Calif., private communication, August 30, 1982.
R. Mills, Rev. Pure App. Chem. 2, 78 (1961). H. G. Hertz, M. Holtz, and R. Mills, J. Chim. Phys. 71, 1355 (1974). H. G. Hertz and R. Mills, J. Chim. Phys. 73, 499 (1976).
K. R. Harris, H. G. Hertz, and R. Mills, J. Chim. Phys. 75, 391 (1978). H. G. Hertz .and R. Mills, J. Phys. Chem. 82, 952 (1978).
H. G. Hertz, K. R. Harris, R. Mills, and L. A. Woolf, Ber. Bunsen Ges. Phys. Chem. 81, 664 (1977). R. 8. Stokes, S. Phang, and R. Mills, J. Solution Chem. 4, 489 (1979).
R. Mills, Australian National University, Canberra, private
communication, May 22, 1981.
20. R. Mills, Australian National University, Canberra, private
communication, March 23, 1982.
21. L. A. Woolf, J. Phys. Chem. 82, 959 (1978) . 22. L. W. Barr, D. G. Miller, and R. Mills, J. Solution Chem. 9,
WTF/lb
17
75 (1980)
LLN L 1982/9
Related Documents