ESTIMATION OF BIOGENIC NMVOCs EMISSIONS OVER THE BALKAN REGION Poupkou A. 1 , Symeonidis P. 1 , Melas D. 1 , Balis D. 1 and Zerefos C. 2,3 1 Laboratory of Atmospheric Physics, Department of Physics, AUTH 2 Lab. of Climatology and Atmospheric Environment, Fac. of Geology, Univ. of Athens 3 National Observatory of Athens

Welcome message from author
This document is posted to help you gain knowledge. Please leave a comment to let me know what you think about it! Share it to your friends and learn new things together.
Transcript
ESTIMATION OF BIOGENIC NMVOCsEMISSIONS OVER THE BALKAN REGION
Poupkou A.1, Symeonidis P.1, Melas D.1,Balis D.1 and Zerefos C.2,3
1Laboratory of Atmospheric Physics, Department of Physics, AUTH2Lab. of Climatology and Atmospheric Environment, Fac. of Geology, Univ. of
Athens3 National Observatory of Athens
GENERAL DESCRIPTION OF THEEMISSION INVENTORY
Estimation of biogenic Isoprene, Monoterpenes and Other VOCsemissions.
Land use types: Forests, Shrub land, Grassland, Agricultural crops.
Spatial resolution: 1km.
Temporal resolution: Typical diurnal variation for every month of a year.
GENERAL METHODOLOGY (1)
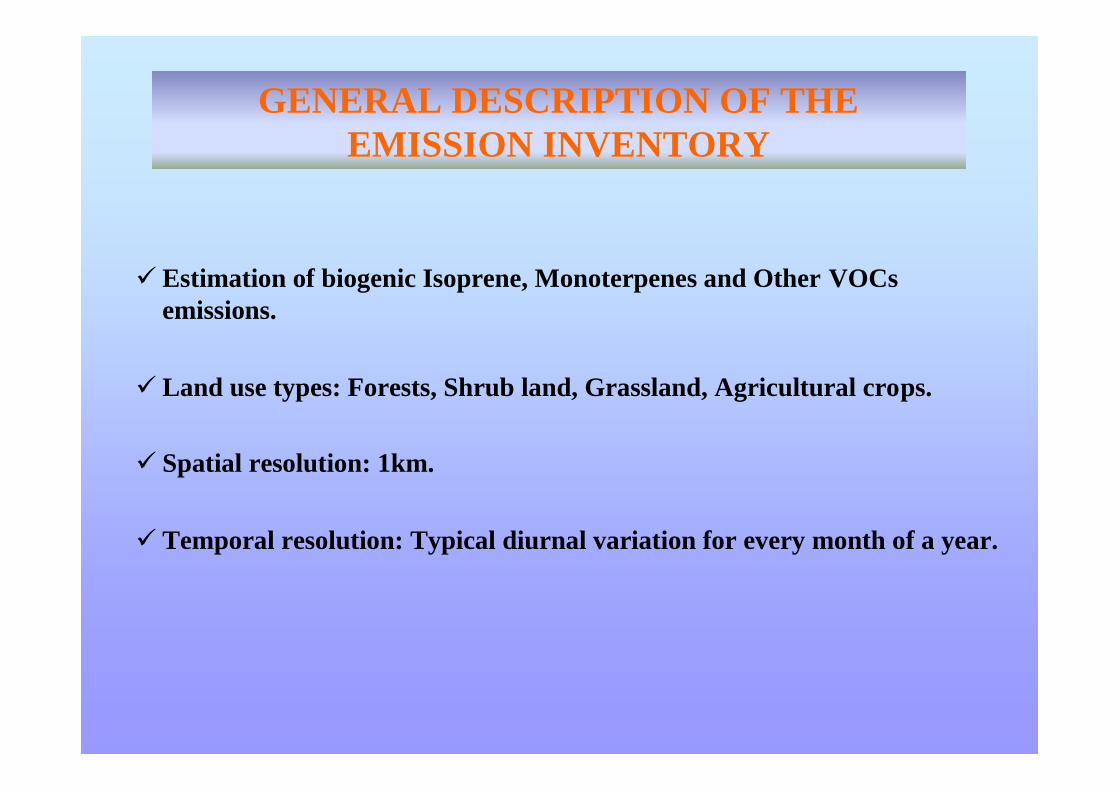
Flux (μg-C m-2 yr-1) = ∫ε. D . γdt
ε= emission potential (μg-C g-1 h-1) of speciesD = foliar biomass density (g m-2)γ= environmental correction factor (unit less ) (Guenther et al., 1993)
γiso = CLiso . CTisoIsoprene :
22
1
1 L
LcC LLiso
)/)(exp(1)/)(exp(
2
1
TRTTTCTRTTTC
CsMT
ssTTiso
L= Photosynthetically Active Radiation flux(μmol photons (400-700nm) m-2 s-1) (PAR)↔
↔ T= Leaf temperature (K)
GENERAL METHODOLOGY (2)
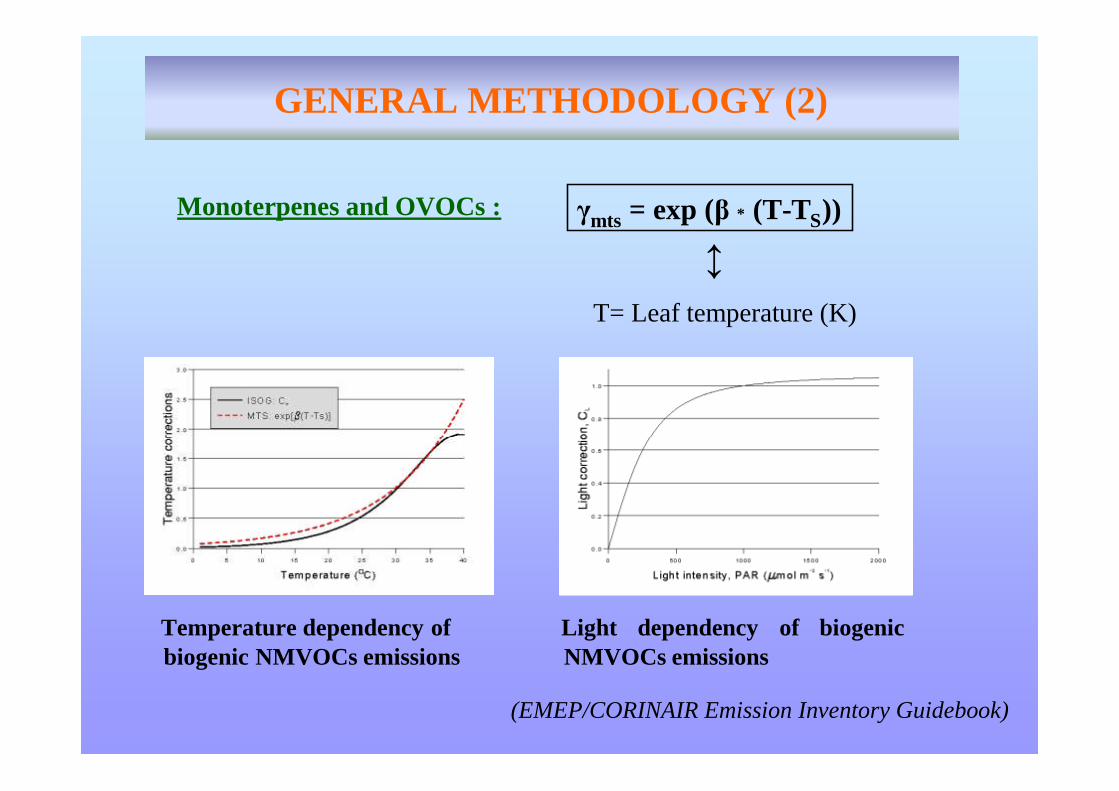
Monoterpenes and OVOCs : γmts = exp (β* (T-TS))
↕T= Leaf temperature (K)
Temperature dependency ofbiogenic NMVOCs emissions
Light dependency of biogenicNMVOCs emissions
(EMEP/CORINAIR Emission Inventory Guidebook)
GIS TECHNOLOGY
A Geographic Information System was used to integrate:
(i) Satellite land-use data
(ii) Vegetation type/species emission potentials and biomass
densities
(iii) Climatic temperature data
(iv) Photosynthetically Active Radiation flux data
in order to produce the spatially and temporally resolved biogenic
NMVOCs emission inventory over the Balkan Region.
LAND USE DATABASE
Data of 1-km nominal spatial resolution based on 1-km AVHRR
data spanning April 1992 through March 1993.
Use of the Seasonal Land Cover Regions classification legend.
Calculations performed for 126 land use types consisted of one
or more vegetation species / types.
Global Land Cover Characterization database (USGS – UNL – JRC)
EMISSION POTENTIALS AND BIOMASS DENSITIESSOURCES
Emission potentials and biomass densities assigned for each land use type for
every month of a year.
• EMEP/CORINAIR Emission Inventory Guidebook, 2002.• Guenther, A., Hewitt, N., Erickson, D., Fall, R., Geron, C., Graedel, T., Harley, P., Klinger, L.,
Lerdau, M., McKay, W., Pierce, T., Scholes, B., Steinbrecher, R., Tallamraju, R., Taylor, J. andZimmerman, P., 1995. A global model of natural volatile organic compound emissions. J. Geophys.Res., 100, pp. 8873-8892.
• Guenther, A., Zimmerman, P. and Wildermuth, M., 1994. Natural volatile organic compoundemission rate estimates for U.S. woodland landscapes. J. Geophys. Res., 28, pp. 1197-1210.
• Geron, C., Guenther, A. and Pierce, T., 1994. An improved model for estimating emissions ofvolatile organic compounds from forests in the Eastern United States. J. Geophys. Res., 99, pp.12773-12792.
• Lamb, B., Gay, D., Westberg, H. and Pierce, T., 1993. A biogenic hydrocarbon emission inventoryfor the U.S.A. using a simple forest canopy model. Atmospheric Environment, 27, pp. 1673-1690.
• Levis, S., Wiedinmyer, C., Bonan, G. B. and Guenther A., 2003. Simulating biogenic volatileorganic compound emissions in the Community Climate System Model. J. Geoph. Res., 108, No.D21, 4659, doi:10.1029/2002JD003203.
• Parra, R., Gasso, S. and Baldasano, J.M., 2004. Estimating the biogenic emissions of non-methanevolatile organic compounds from the North Western Mediterranean vegetation of Catalonia, Spain.Science of the Total Environment, 329, pp. 241–259.
TEMPERATURE DATABASE
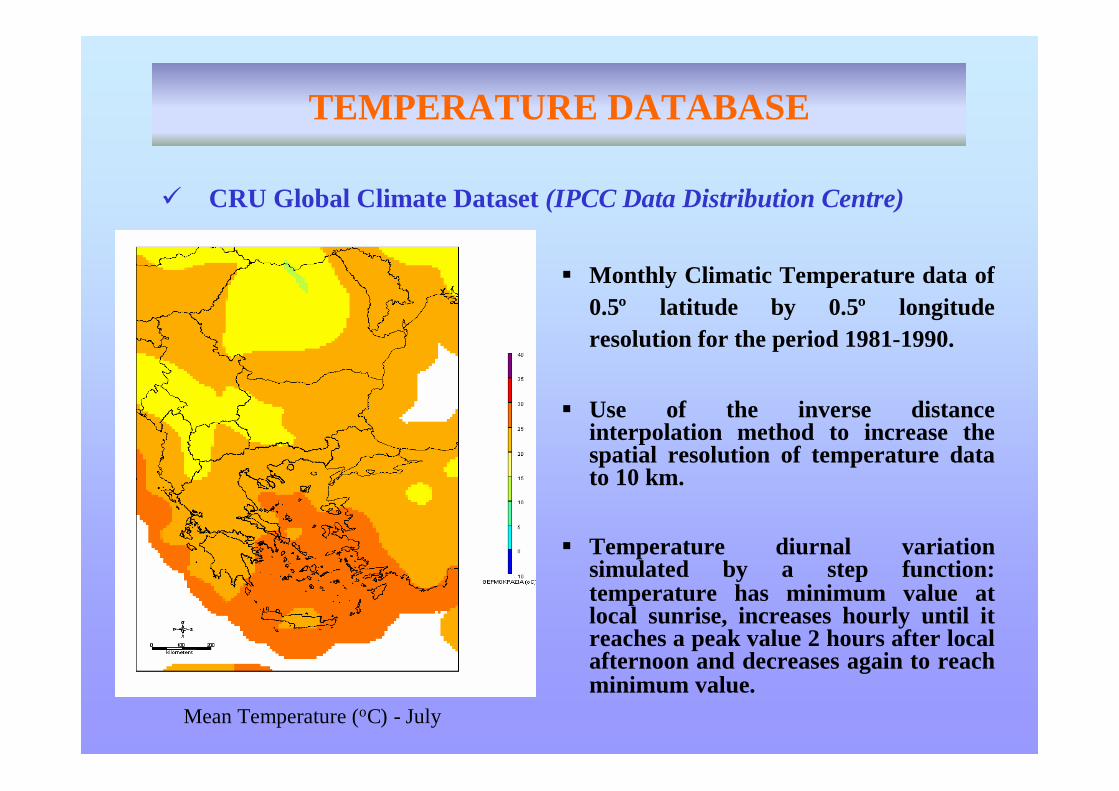
Monthly Climatic Temperature data of0.5º latitude by 0.5º longituderesolution for the period 1981-1990.
Use of the inverse distanceinterpolation method to increase thespatial resolution of temperature datato 10 km.
Temperature diurnal variationsimulated by a step function:temperature has minimum value atlocal sunrise, increases hourly until itreaches a peak value 2 hours after localafternoon and decreases again to reachminimum value.
CRU Global Climate Dataset (IPCC Data Distribution Centre)
Mean Temperature (oC) - July
PHOTOSYNTHETICALLY ACTIVE RADIATION
PAR calculated using the Tropospheric Ultraviolet and Visible model(TUV version 4.0) (Madronich, 1993)
Calculations of typical diurnal variation of PAR for every monthof a year at selected points covering the study area.
Spatial resolution of calculations = 50 km increased to 10 kmusing the inverse distance interpolation method.
Elevation data from the Global Land One-Kilometer BaseElevation (GLOBE) Digital Elevation Model (DEM) of 30’’spatial resolution (National Geophysical Data Center of NOAA).
Total ozone = 300 D.U.
Cloudless sky.
Aerosol optical depth = 0.38
Use of optical properties for continental type aerosols.
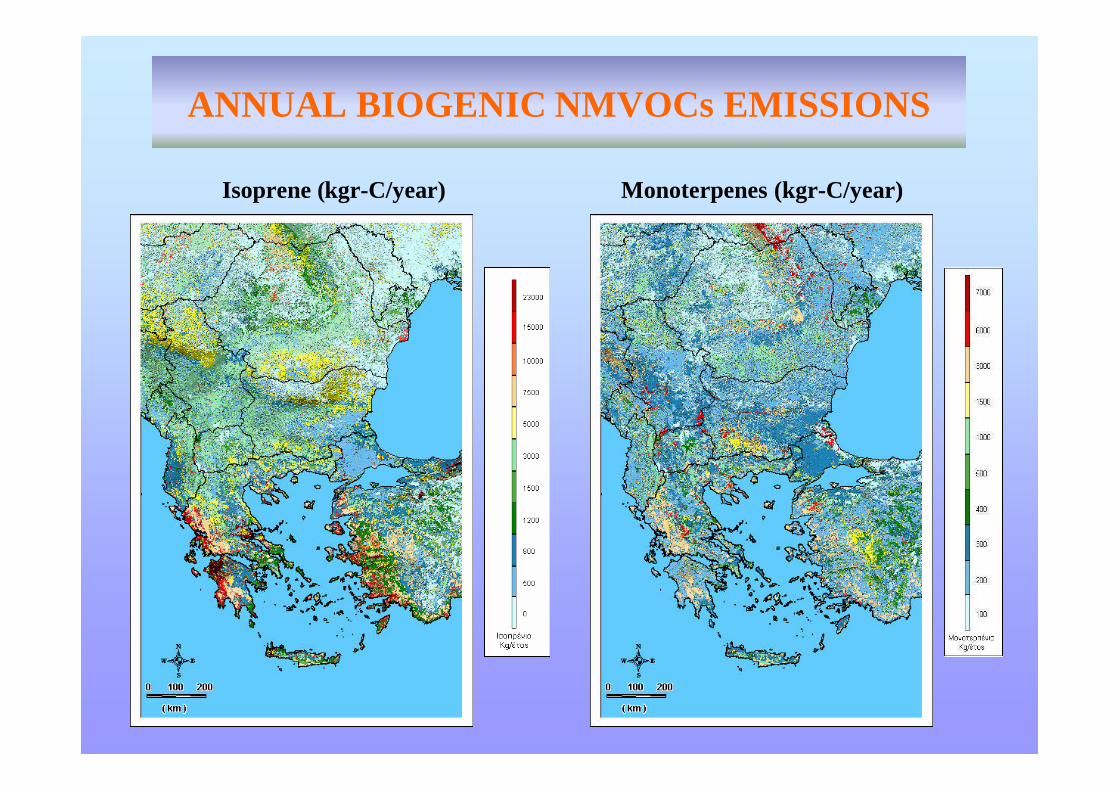
ANNUAL BIOGENIC NMVOCs EMISSIONS
Isoprene (kgr-C/year) Monoterpenes (kgr-C/year)
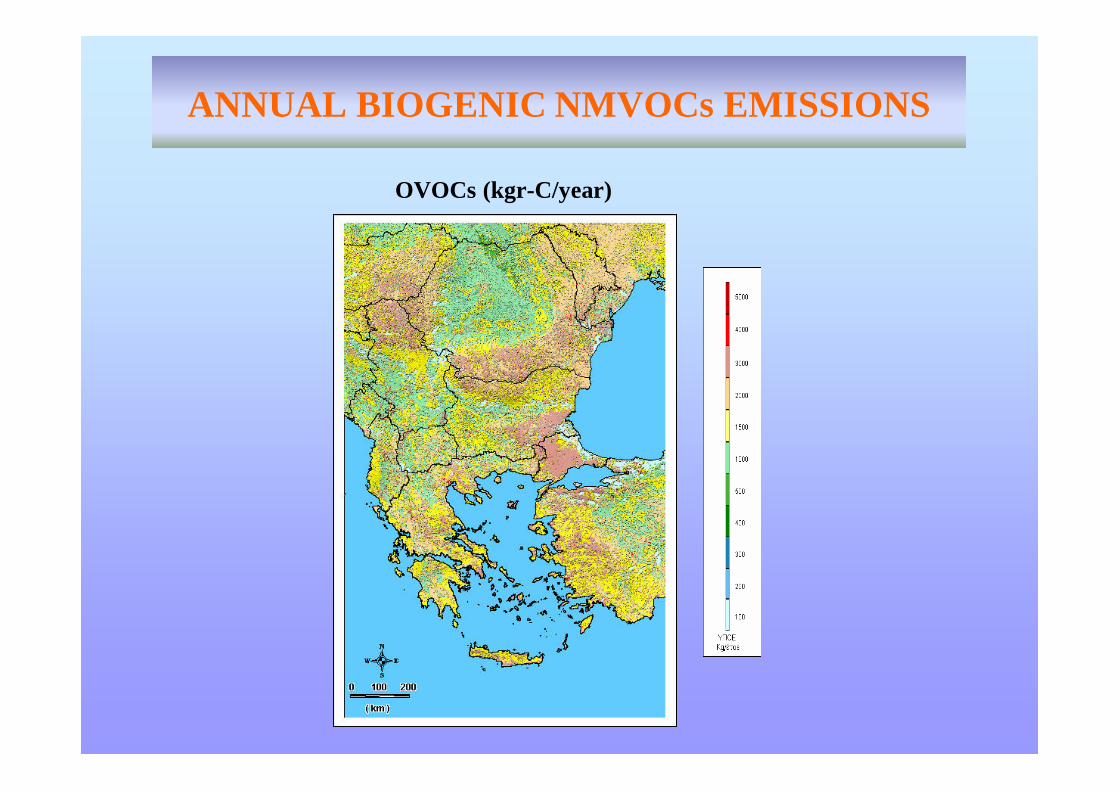
ANNUAL BIOGENIC NMVOCs EMISSIONS
OVOCs (kgr-C/year)
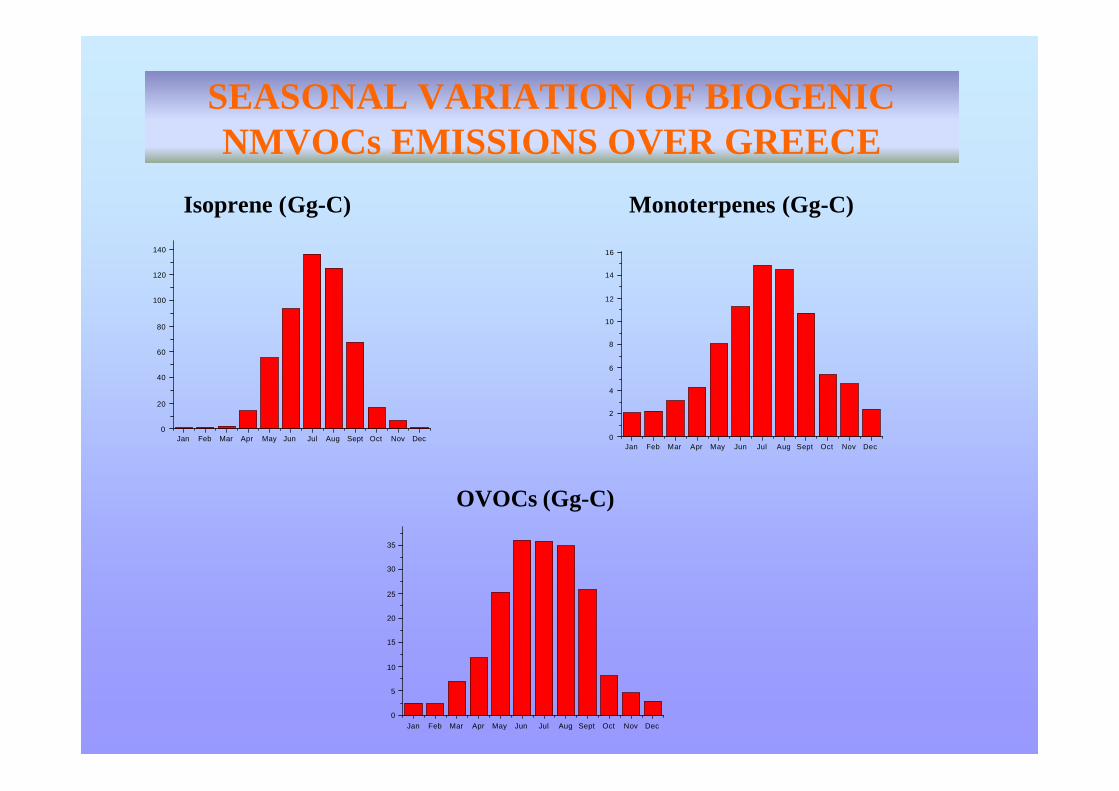
SEASONAL VARIATION OF BIOGENICNMVOCs EMISSIONS OVER GREECE
Jan Feb Mar Apr May Jun Jul Aug Sept Oct Nov Dec0
20
40
60
80
100
120
140
Isoprene (Gg-C) Monoterpenes (Gg-C)
Jan Feb Mar Apr May Jun Jul Aug Sept Oct Nov Dec0
2
4
6
8
10
12
14
16
Jan Feb Mar Apr May Jun Jul Aug Sept Oct Nov Dec0
5
10
15
20
25
30
35
OVOCs (Gg-C)
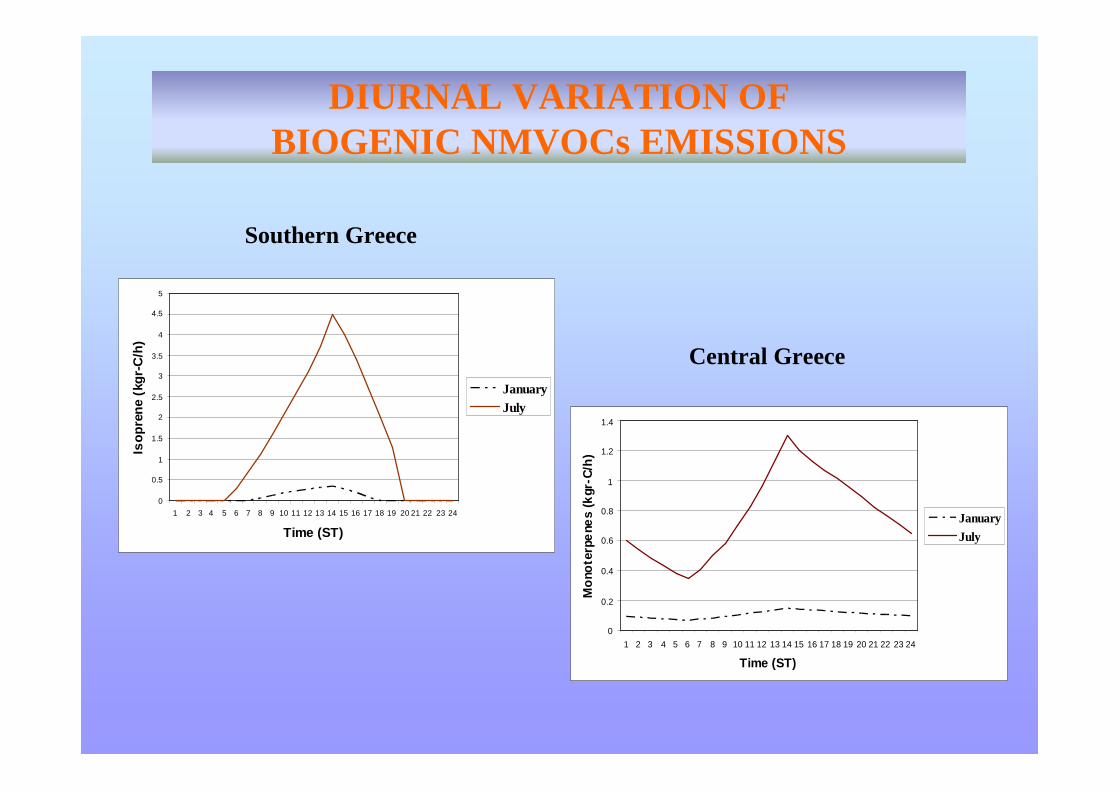
DIURNAL VARIATION OFBIOGENIC NMVOCs EMISSIONS
0
0.5
1
1.5
2
2.5
3
3.5
4
4.5
5
1 2 3 4 5 6 7 8 9 10 11 12 13 14 15 16 17 18 19 20 21 22 23 24
Time (ST)
Iso
pre
ne
(kg
r-C
/h)
JanuaryJuly
0
0.2
0.4
0.6
0.8
1
1.2
1.4
1 2 3 4 5 6 7 8 9 10 11 12 13 14 15 16 17 18 19 20 21 22 23 24
Time (ST)
Mo
note
rpe
nes
(kgr
-C/h
)
JanuaryJuly
Southern Greece
Central Greece
Related Documents