Estimating the Sources and Transport of Nitrogen in the Mississippi River Basin Using Spatially Referenced Modeling Techniques R.B. Alexander, R.A. Smith, G.E. Schwarz, and J. Nolan NAWQA, Nutrient Synthesis Group per Mississippi River Basin Nutrient Worksho March 25-26, 2002 http://water.usgs.gov/nawqa/sparrow/

Estimating the Sources and Transport of Nitrogen in the Mississippi River Basin Using Spatially Referenced Modeling Techniques R.B. Alexander, R.A. Smith,
Dec 17, 2015
Welcome message from author
This document is posted to help you gain knowledge. Please leave a comment to let me know what you think about it! Share it to your friends and learn new things together.
Transcript
Estimating the Sources and Transport of Nitrogen in the Mississippi River Basin
Using Spatially ReferencedModeling Techniques
R.B. Alexander, R.A. Smith, G.E. Schwarz,
and J. Nolan
NAWQA, Nutrient Synthesis Group
Upper Mississippi River Basin Nutrient WorkshopMarch 25-26, 2002
http://water.usgs.gov/nawqa/sparrow/
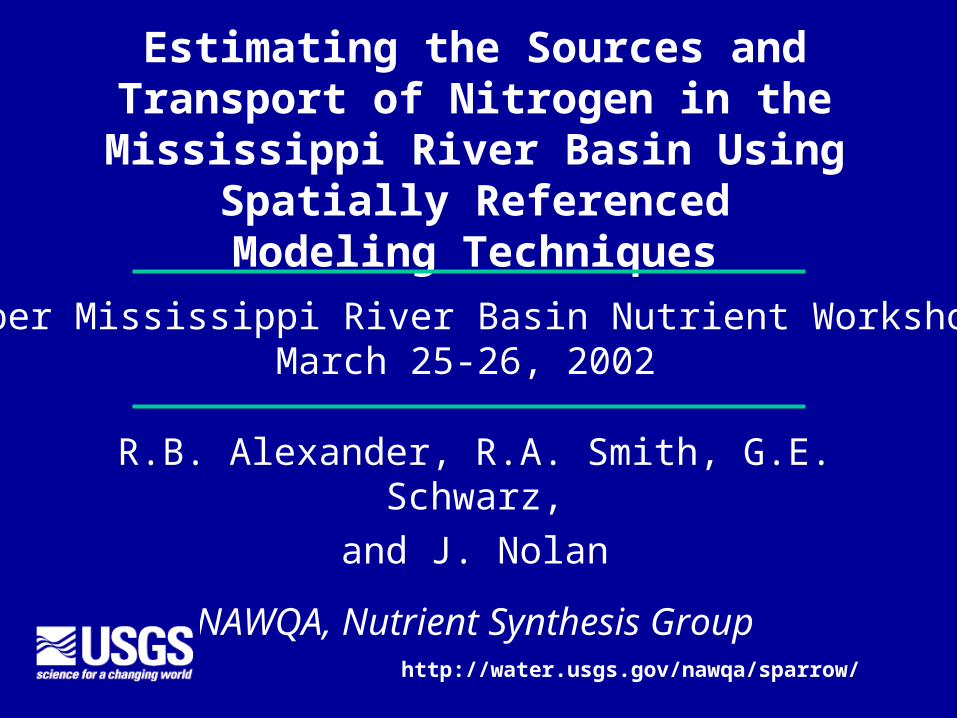
Topics Presented
• Spatially referenced modeling techniques– Background on SPARROW
• Model applications in the Mississippi Basin– N sources and transport
• Updates and enhancements to the models
• Near-term and future research
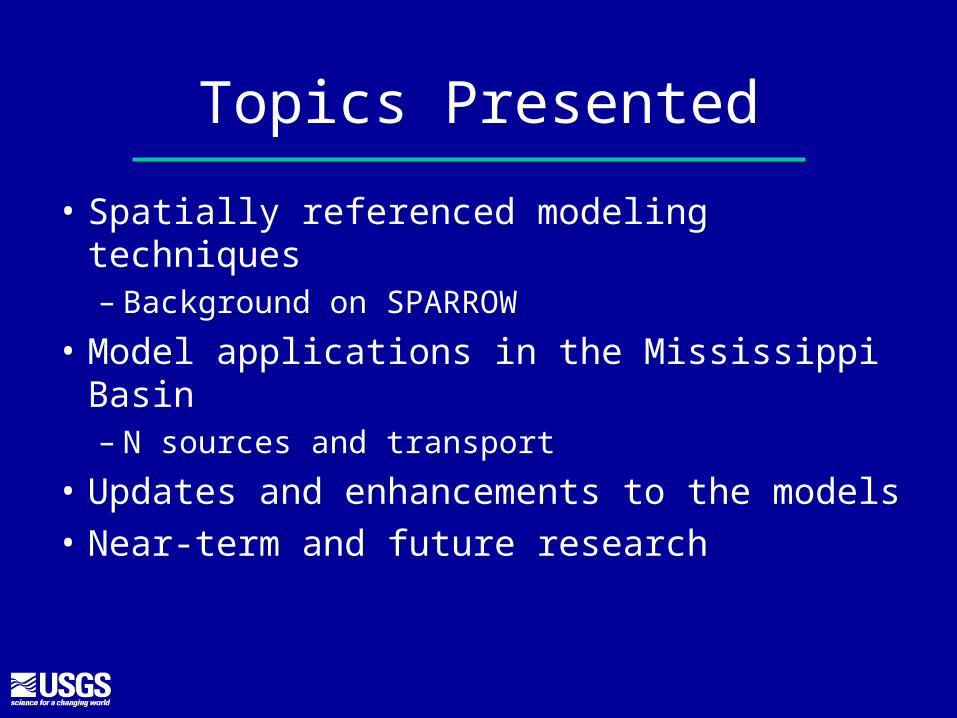
SPARROW (SPAtially Referenced Regression on Watershed Attributes)
Land Use & Sources
Drainage & Impoundments
Landscape Features
Monitoring Data
Integrates watershed data over multiple spatial scales
to predict origin & fate of contaminants
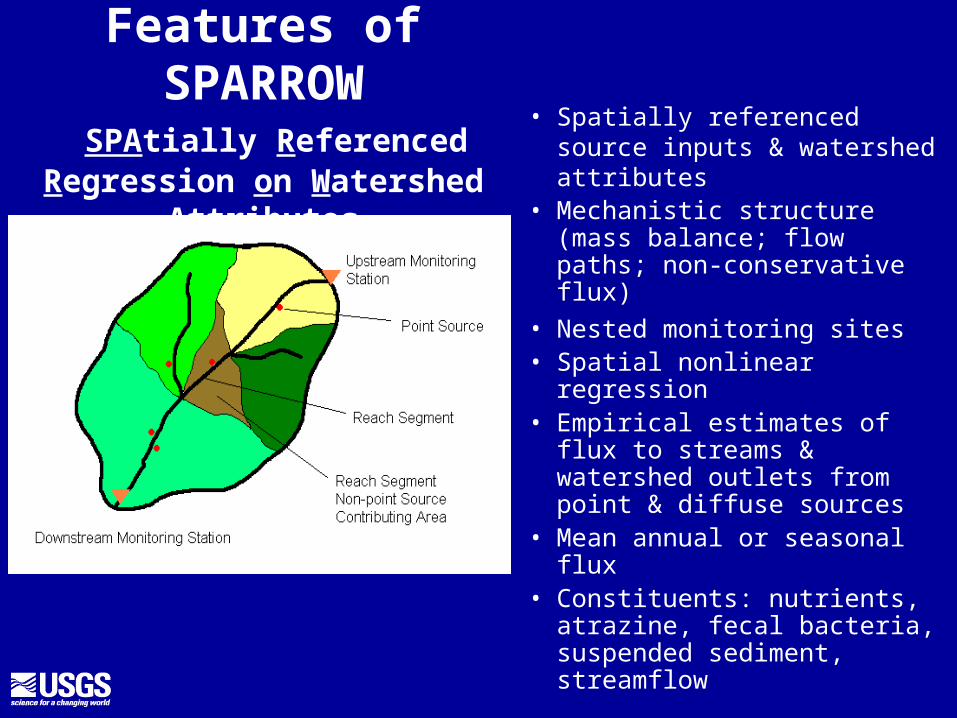
Features of SPARROW SPAtially Referenced Regression
on Watershed Attributes
• Spatially referenced source inputs & watershed attributes
• Mechanistic structure (mass balance; flow paths; non-conservative flux)
• Nested monitoring sites• Spatial nonlinear regression• Empirical estimates of flux to
streams & watershed outlets from point & diffuse sources
• Mean annual or seasonal flux• Constituents: nutrients, atrazine,
fecal bacteria, suspended sediment, streamflow
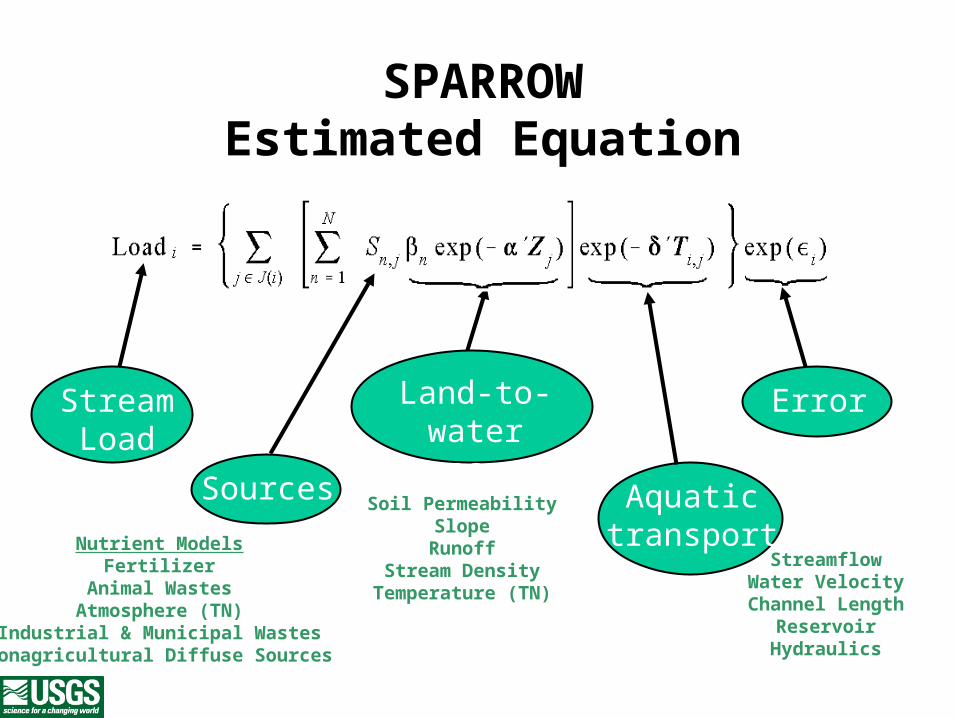
SPARROWEstimated Equation
StreamLoad
Sources
Land-to-watertransport
Aquatictransport
Error
Nutrient ModelsFertilizer
Animal WastesAtmosphere (TN)
Industrial & Municipal WastesNonagricultural Diffuse Sources
Soil PermeabilitySlopeRunoff
Stream DensityTemperature (TN)
StreamflowWater Velocity
Channel LengthReservoir Hydraulics
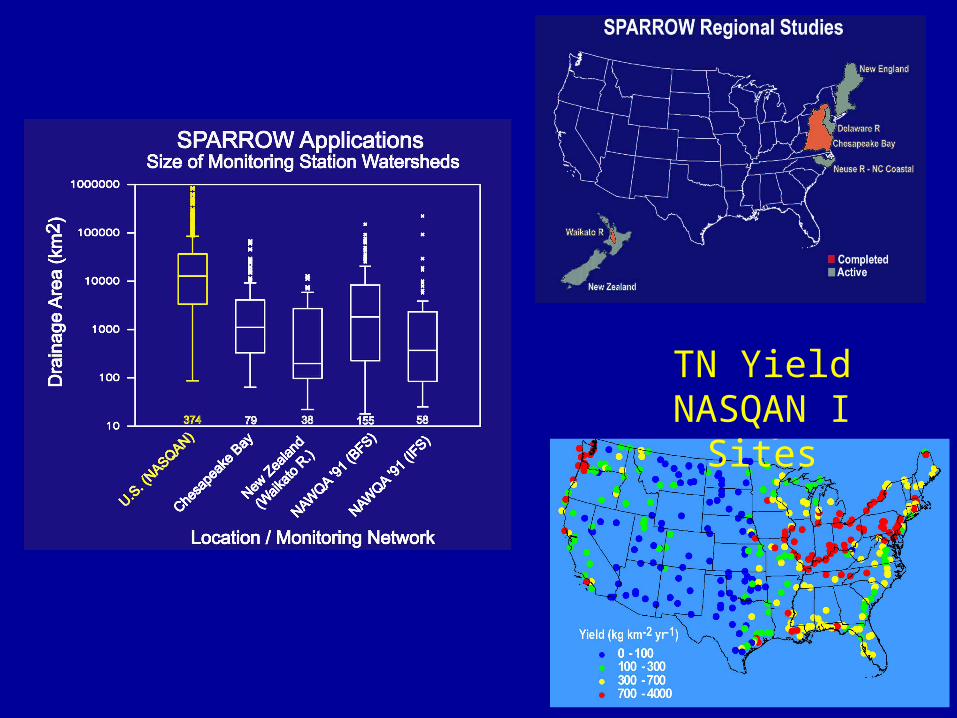
TN Yield NASQAN I Sites
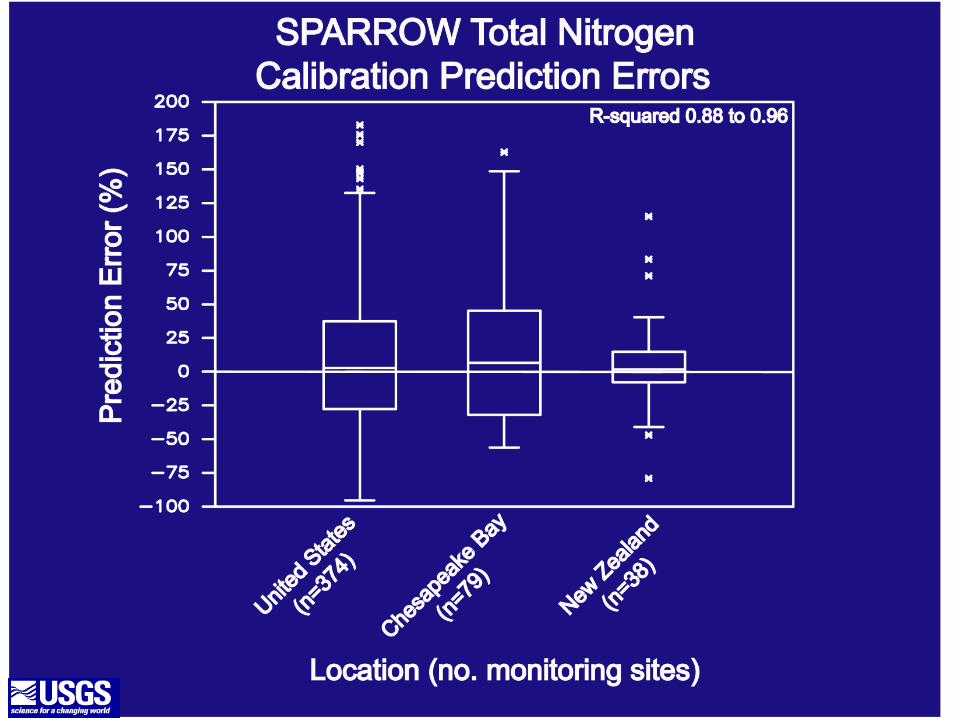
R-square 0.88 to 0.96
• Stream measurements of nutrient flux (monitoring data)
• Literature rate coefficients Catchment yields by land use, per capita waste loads, in-stream decay, reservoir settling rates
Evaluations of SPARROW Models Independent Verification ofCoefficients & Predictions

• Stream measurements of nutrient flux (monitoring data)
• Literature rate coefficients Catchment yields by land use, per capita waste loads, in-stream decay, reservoir settling rates
• Inter-model comparisonsU.S., Chesapeake Bay, Neuse/Tar R, & New Zealand SPARROWs, SWAT, HSPF, RivR-N, GWLF, regression methods, watershed process models, N budgets (NRC, 2000; Valigura et al. 2001 AGU volume; Seitzinger et al. in press)
• Spatial analyses of prediction errors (test of model misspecification)e.g., SCOPE N project (Alexander et al. in press)
Evaluations of SPARROW Models Independent Verification ofCoefficients & Predictions
SPARROW Applications to the Mississippi River Basin
Source Characterization &Nitrogen Delivery to the
Gulf of Mexico
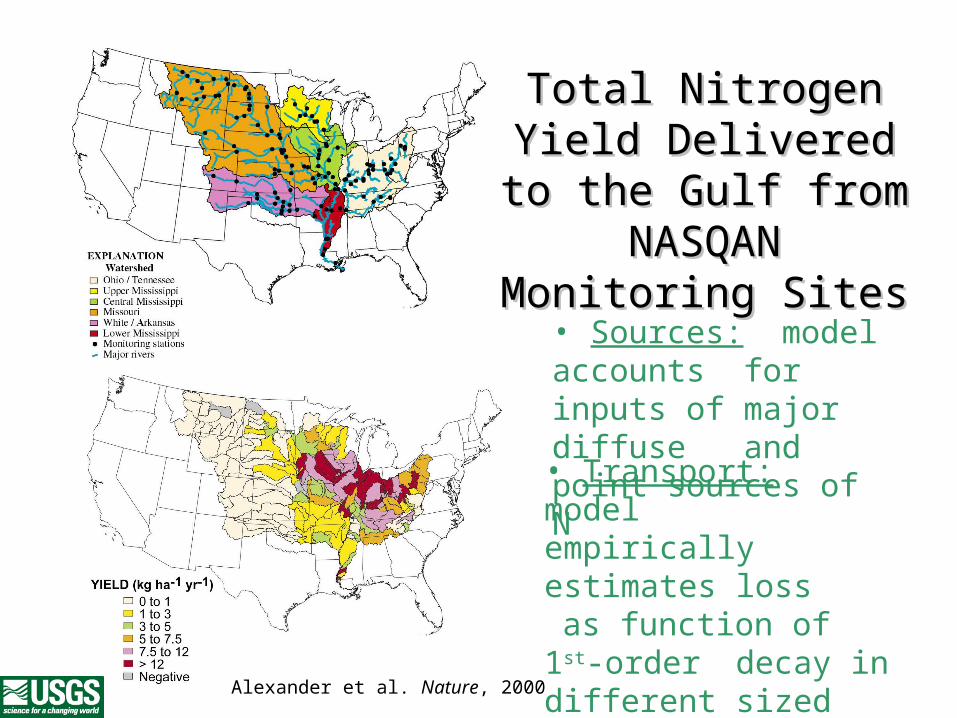
Total Nitrogen Yield Total Nitrogen Yield Delivered to the Gulf Delivered to the Gulf
from NASQAN from NASQAN Monitoring SitesMonitoring Sites
• Transport: model empirically estimates loss
as function of 1st-order decay in different sized channels & water travel time
• Sources: model accounts for inputs of major diffuse and point sources of N
Alexander et al. Nature, 2000
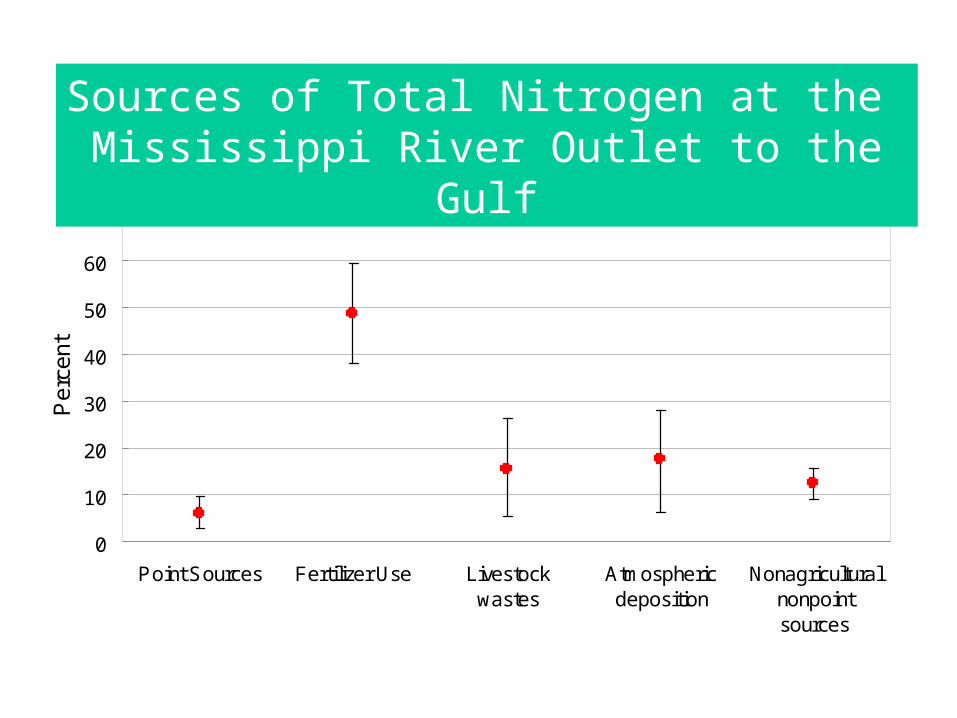
Nitrogen Flux from the Mississippi River to the Gulf of Mexico: Share from Major Sources (with
90 percent confidence intervals)
0
10
20
30
40
50
60
70
Point Sources Fertilizer Use Livestockwastes
Atmosphericdeposition
Nonagriculturalnonpointsources
Per
cent
Sources of Total Nitrogen at the Mississippi River Outlet to the Gulf
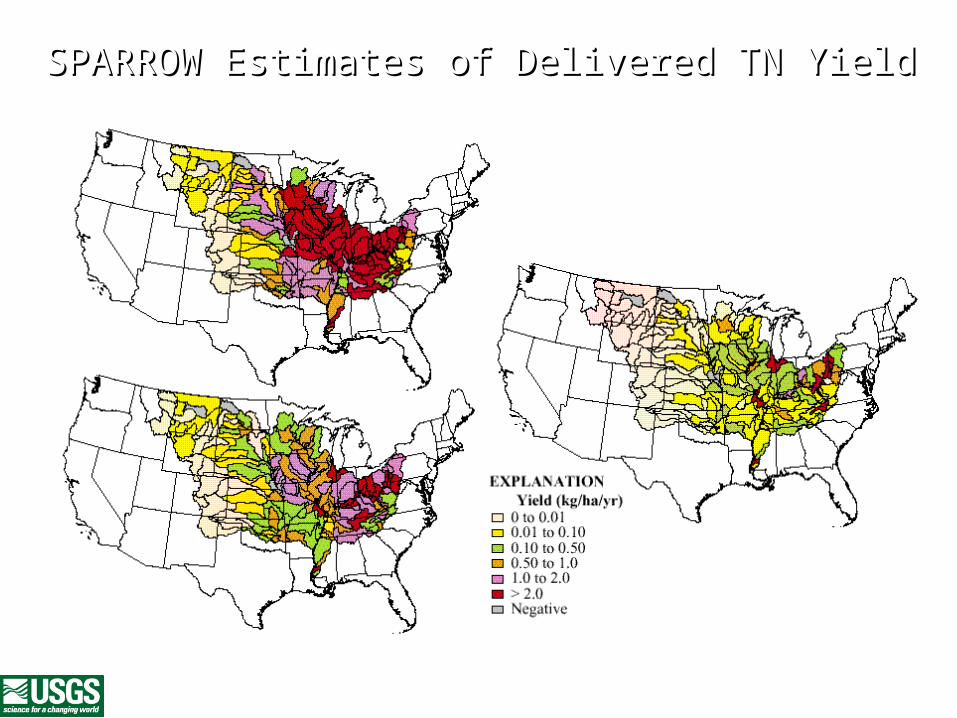
SPARROW Estimates of Delivered TN YieldSPARROW Estimates of Delivered TN Yield
Agriculture
Point Sources
Atmosphere
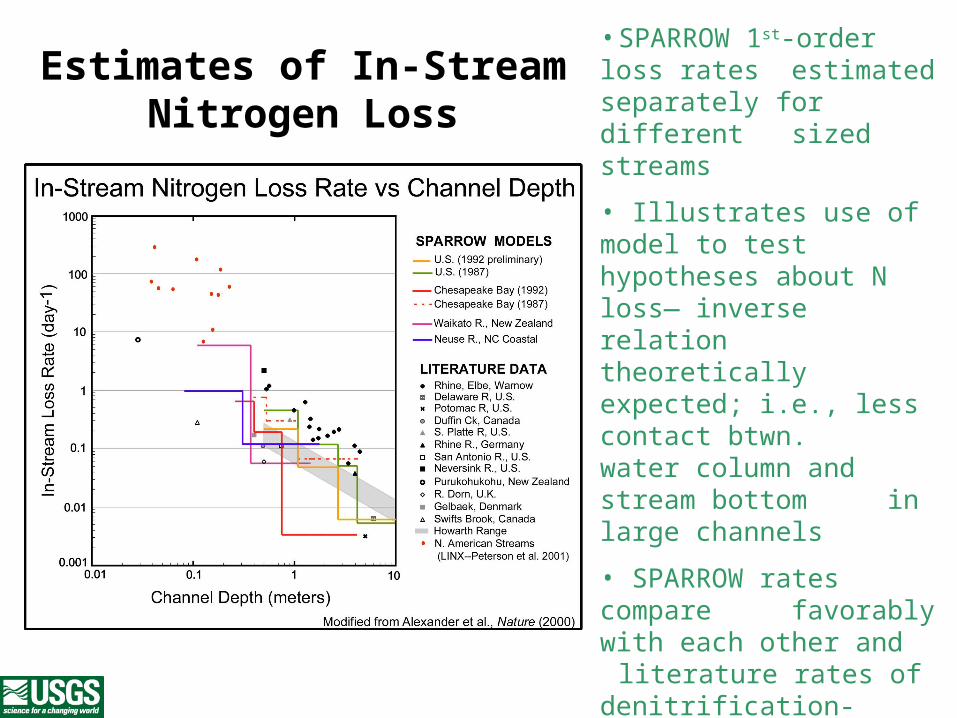
Estimates of In-StreamNitrogen Loss
• SPARROW 1st-order loss rates estimated separately for different sized streams
• Illustrates use of model to test hypotheses about N loss—
inverse relation theoretically expected; i.e., less contact btwn.
water column and stream bottomin large channels
• SPARROW rates compare favorably with each other and
literature rates of denitrification- induced losses; depth major limiting factor explaining N loss
• Other channel properties account for large variability – need to understand mechanisms
• SPARROW provides effective tool for estimating large-scale transport of N
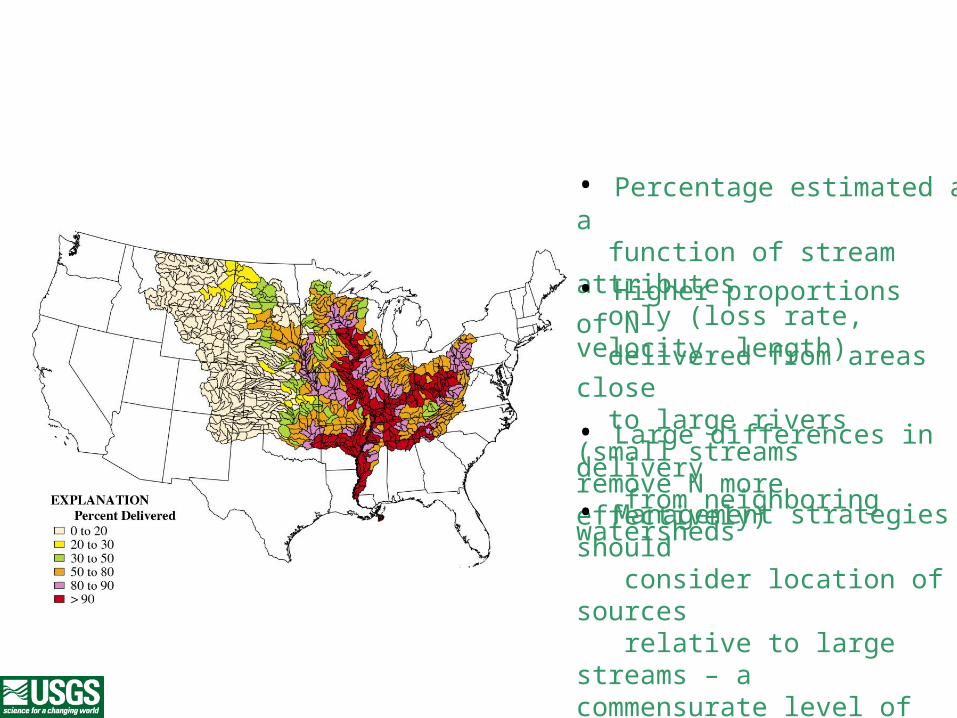
Dendritic Pattern of N Delivery toGulf of Mexico from Watershed Outlets
• Percentage estimated as a function of stream attributes only (loss rate, velocity, length)
• Large differences in delivery from neighboring watersheds
• Higher proportions of N delivered from areas close to large rivers (small streams
remove N more effectively)
• Management strategies should consider location of sources relative to large streams – a
commensurate level of control near large streams will remove more N downstreamAlexander et al. Nature, 2000

SPARROW Modeling
Updates and Enhancements
SPARROW Constituents & Methods
New / updated constituents• Combine 1991 NAWQA with
historical NASQAN WQ data• Nutrients (TN, TP; 1992
update)• Suspended Sediment • Fecal coliform • Atrazine (updated methods)
• Flow / velocity
New methods• Stream load estimation• Calibration accommodates
more spatially and mathematically complex descriptions of transport or storage (e.g., reach-specific decay)
• More spatially detailed watershed infrastructure
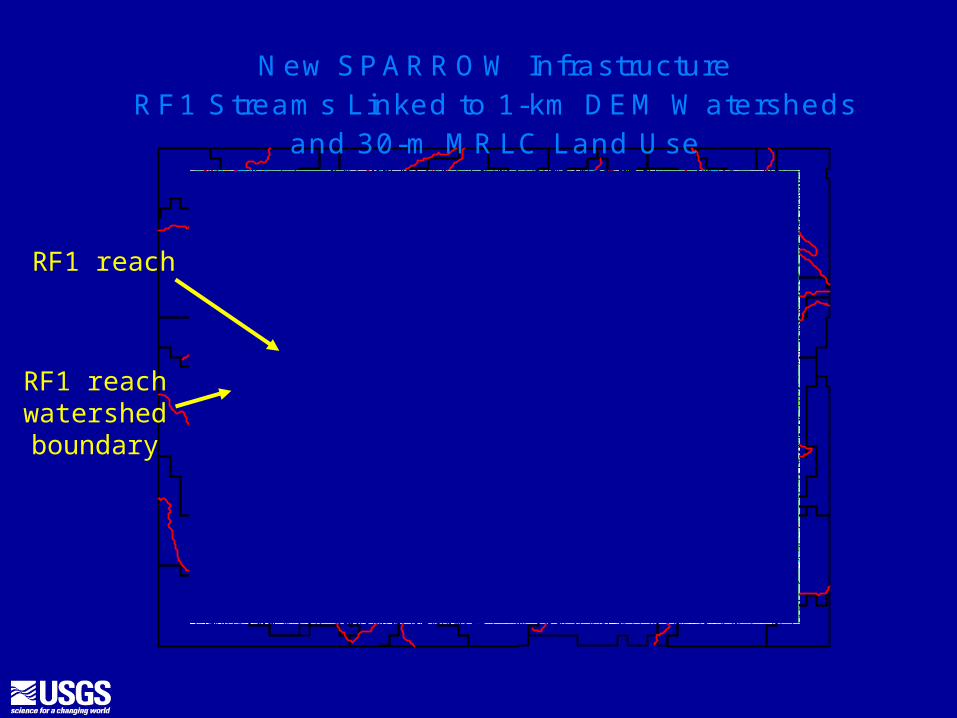
New SPARROW InfrastructureRF1 Streams Linked to 1-km DEM Watersheds
and 30-m MRLC Land Use
RF1 reach
RF1 reachwatershedboundary
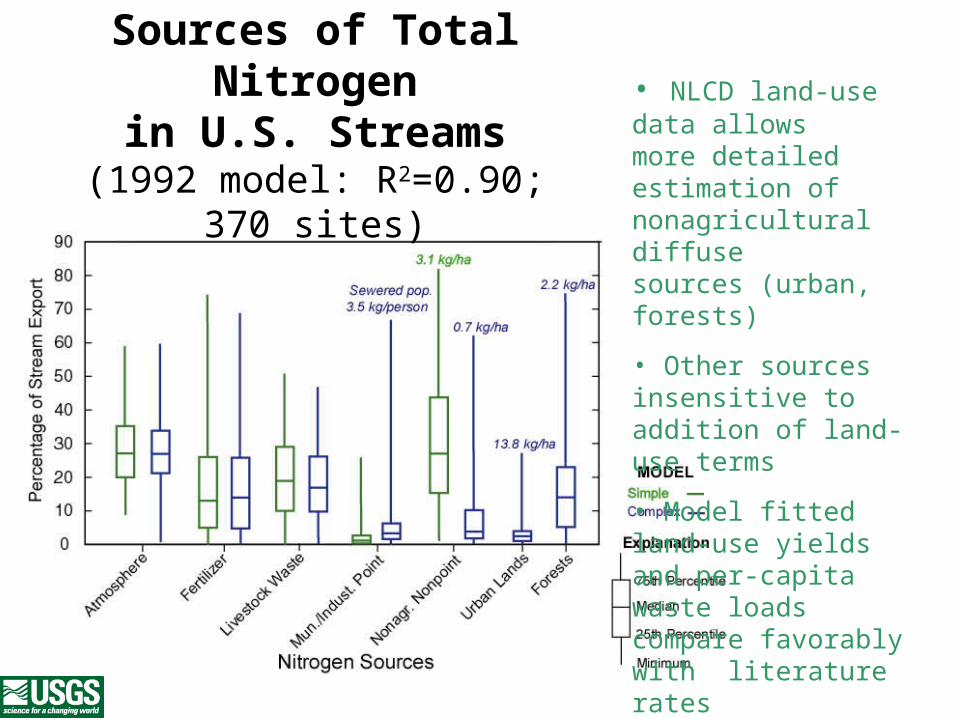
Sources of Total Nitrogenin U.S. Streams
(1992 model: R2=0.90; 370 sites)
• NLCD land-use data allows more detailed estimation of nonagricultural diffuse sources (urban, forests)
• Other sources insensitive to addition of land-use terms
• Model fitted land-use yields and per-capita waste loads compare favorably with literature rates
Alexander et al., Water Resour. Res., in press
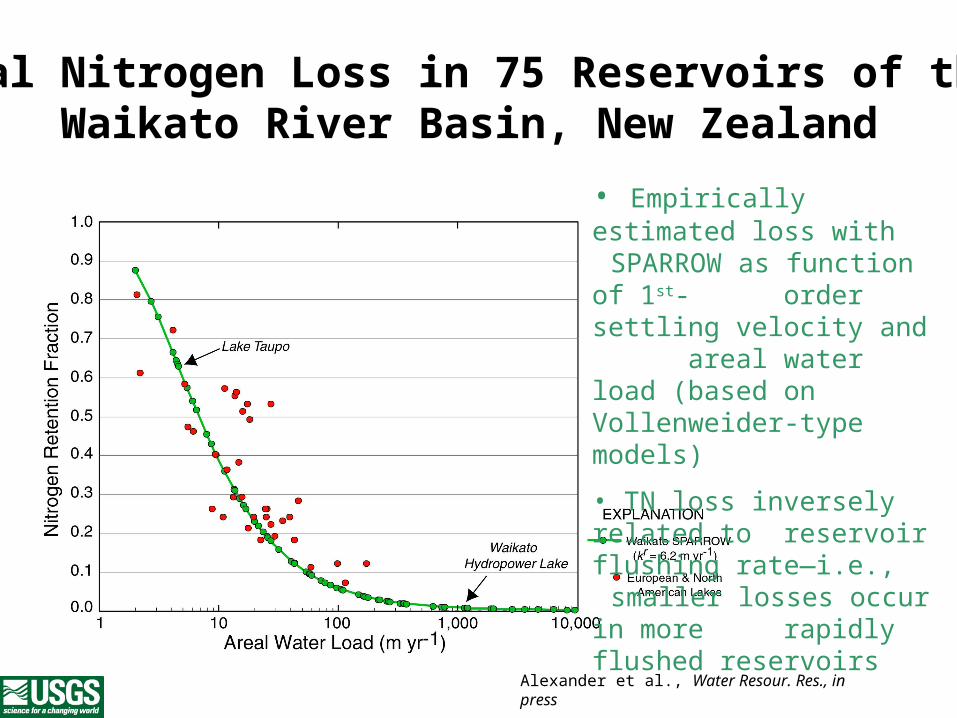
Total Nitrogen Loss in 75 Reservoirs of the Waikato River Basin, New Zealand
• Empirically estimated loss with SPARROW as function of 1st-order settling velocity and areal water load (based on
Vollenweider-type models)
• TN loss inversely related to reservoir flushing rate—i.e., smaller losses occur in more rapidly flushed reservoirs
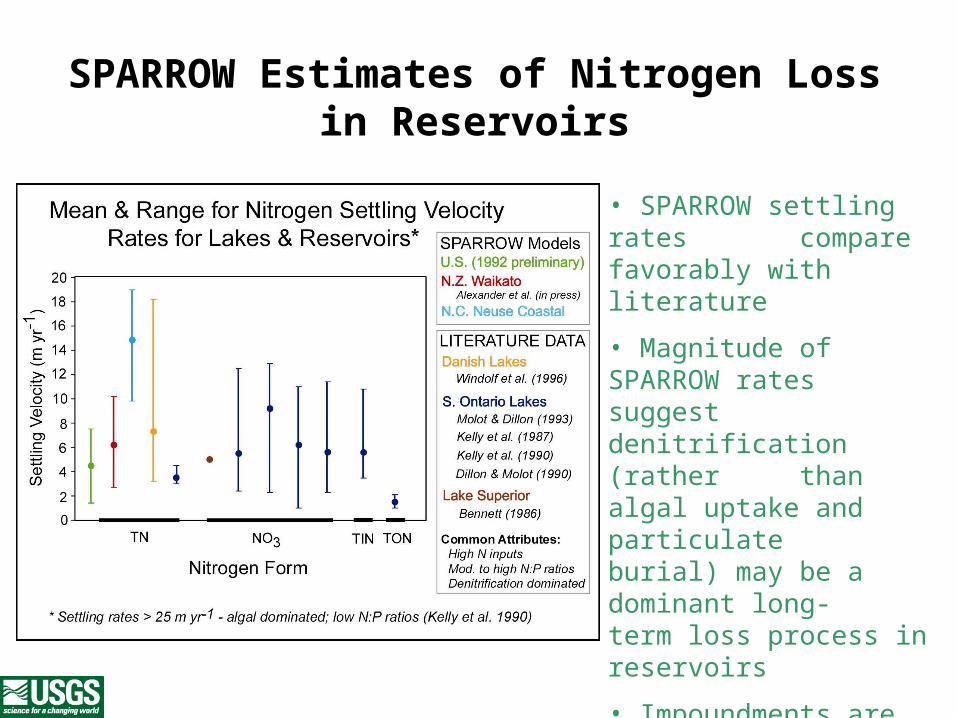
SPARROW Estimates of Nitrogen Lossin Reservoirs
• SPARROW settling rates compare favorably with literature
• Magnitude of SPARROW rates suggest denitrification (rather than algal uptake and particulate burial) may be a dominant long-term loss process in reservoirs
• Impoundments are prominent features of U.S. landscape (> 70,000)—their location and size may be important to
understanding N fate in watersheds
SPARROW Applications
Water-Quality Management
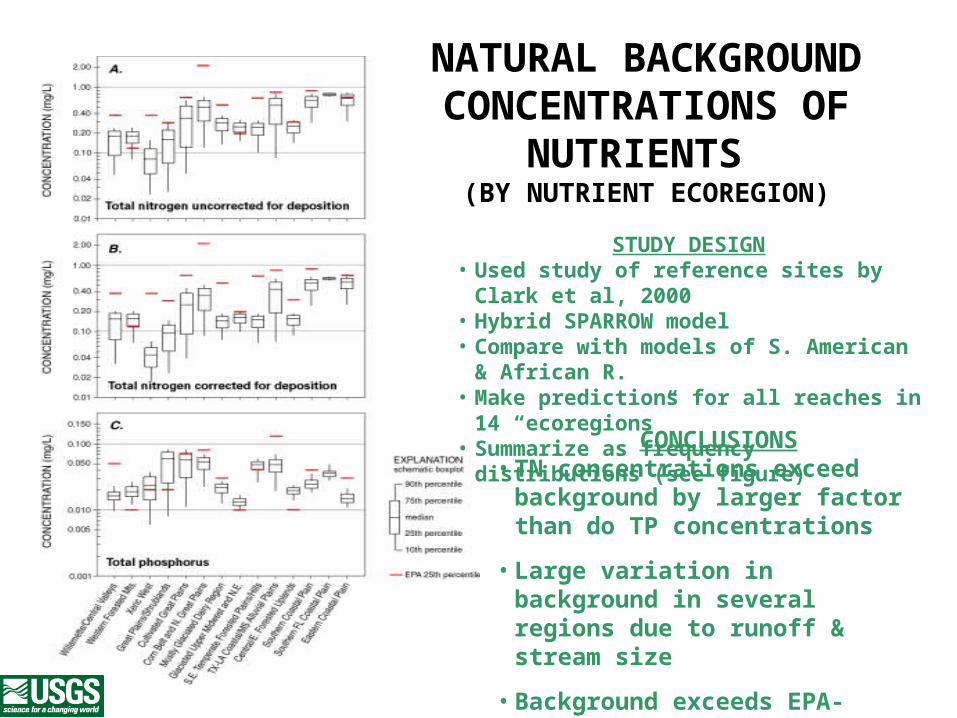
NATURAL BACKGROUND CONCENTRATIONS OF
NUTRIENTS (BY NUTRIENT ECOREGION)
STUDY DESIGN• Used study of reference sites by Clark et al, 2000• Hybrid SPARROW model • Compare with models of S. American & African R.• Make predictions for all reaches in 14 “ecoregions”• Summarize as frequency distributions (see figure)
CONCLUSIONS• TN concentrations exceed background by
larger factor than do TP concentrations
• Large variation in background in several regions due to runoff & stream size
• Background exceeds EPA-proposed criteria in many regions
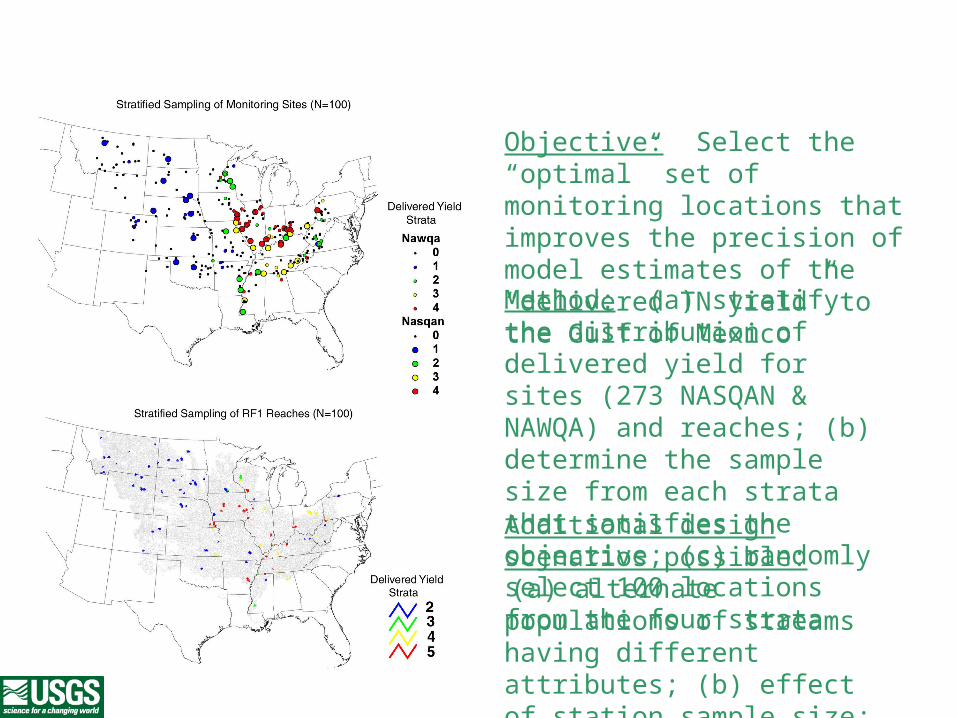
Objective: Select the “optimal” set of monitoring locations that improves the precision of model estimates of the “delivered TN yield” to the Gulf of Mexico
Method: (a) stratify the distribution of delivered yield for sites (273 NASQAN & NAWQA) and reaches; (b) determine the sample size from each strata that satisfies the objective; (c) randomly select 100 locations from the four strata
Network Design Using SPARROW
Additional design scenarios possible: (a) alternate populations of streams
having different attributes; (b) effect of station sample size; (c) different objective functions (e.g., concentration)
SPARROW Near-Term / Future Research
• Temporally variable models:– Stream loads modeled explicitly as function of time
(mean-annual loads estimated for selected time periods such as 1987, 1992, and 1997)
– Account for multi-year terrestrial storage of nutrients
– Include ’91, ’94, and ’97 NAWQA data and 1996-2000 NASQAN data
• Simultaneous multi-contaminant models (e.g., N forms; pesticides)
• NAWQA Cycle II activities (HST, ACT and NEET topical teams)
SPARROW Near-Term / Future Research
• Linking deterministic models to SPARROW– Tests of process hypotheses – More detailed management simulations– examples: TOPMODEL, SWAT, GW models (regional
SPARROWs)
• Evaluation / validation of model source characterizations and in-stream decay rates– N, O isotopes– experimental measurements of denitrification /
mass balance studies
SPARROW Near-Term / Future Research
• Biological modeling– Microbiological (pathogens, indicators)– Chlorophyll and algae– Fish tissue– Benthic invertebrates
• “Emerging” contaminants (e.g., antibiotics)

Cyber Seminar Presentation on Regional Sparrow Models—April 18, 2002
(Chesapeake Bay, New Eng., Neuse/Tar R.)
Studies provide an infrastructure for integrating local monitoring data, research, and management activities
SPARROW Workshop (Fall, 2002)
Three day workshop in Reston, VA:• Introduction to SPARROW modeling for
initiating regional or national studies• Presentation of results from national and
regional studies• Description of new capabilities• Discussion of potential regions, constituents
and applications for future modeling
SPARROW Web Site: http://water.usgs.gov/nawqa/sparrow/

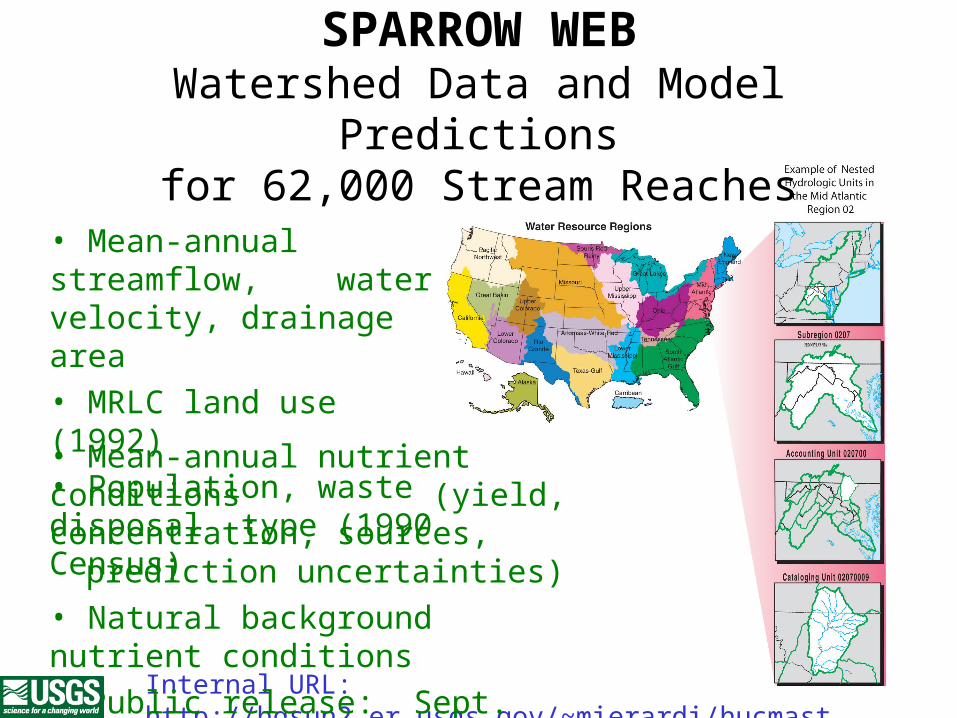
• Mean-annual streamflow, water velocity, drainage area• MRLC land use (1992)• Population, waste disposal type (1990 Census)
Internal URL: http://hqsun2.er.usgs.gov/~mierardi/hucmaster
SPARROW WEBWatershed Data and Model Predictions
for 62,000 Stream Reaches
• Mean-annual nutrient conditions (yield, concentration, sources, prediction uncertainties)
• Natural background nutrient conditions• Public release: Sept. 2002
Related Documents