ESTIMATED DEPTH TO THE WATER TABLE AND ESTIMATED RATE OF RECHARGE IN OUTCROPS OF THE CHICOT AND EVANGELINE AQUIFERS NEAR HOUSTON, TEXAS U.S. GEOLOGICAL SURVEY Water-Resources Investigations Report 96–4018 Prepared in cooperation with the HARRIS-GALVESTON COASTAL SUBSIDENCE DISTRICT

Welcome message from author
This document is posted to help you gain knowledge. Please leave a comment to let me know what you think about it! Share it to your friends and learn new things together.
Transcript

ESTIMATED DEPTH TO THE WATER TABLE AND ESTIMATED RATE OF RECHARGE IN OUTCROPS OF THE CHICOT AND EVANGELINE AQUIFERS NEAR HOUSTON, TEXAS
U.S. GEOLOGICAL SURVEYWater-Resources Investigations Report 96–4018
Prepared in cooperation with theHARRIS-GALVESTON COASTAL SUBSIDENCE DISTRICT

Blank Page

ESTIMATED DEPTH TO THE WATER TABLE AND ESTIMATED RATE OF RECHARGE IN OUTCROPS OF THE CHICOT AND EVANGELINE AQUIFERS NEAR HOUSTON, TEXAS
By J.E. Noble, P.W. Bush, M.C. Kasmarek, and D.L. Barbie
U.S. GEOLOGICAL SURVEY
Water-Resources Investigations Report 96–4018
Prepared in cooperation with theHARRIS-GALVESTON COASTAL SUBSIDENCE DISTRICT
Austin, Texas1996
ii
U.S. DEPARTMENT OF THE INTERIOR
BRUCE BABBITT, Secretary
U.S. GEOLOGICAL SURVEY
Gordon P. Eaton, Director
Any use of trade, product, or firm names is for descriptive purposes only and does not imply endorsement by the U.S. Government.
For additional information write to: Copies of this report can be purchased from:
District Chief U.S. Geological Survey U.S. Geological Survey Branch of Information Services8011 Cameron Rd. Box 25286Austin, TX 78754–3898 Denver, CO 80225–0286
iii
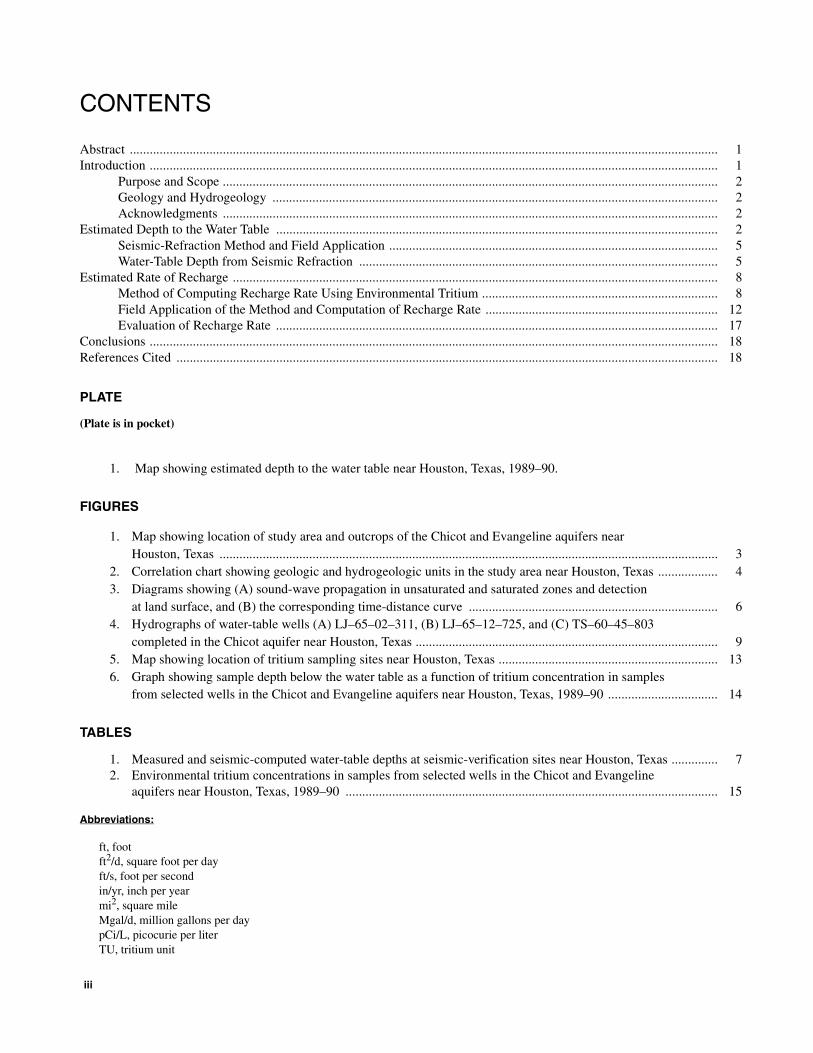
CONTENTS
Abstract ................................................................................................................................................................................. 1Introduction ........................................................................................................................................................................... 1
Purpose and Scope ..................................................................................................................................................... 2Geology and Hydrogeology ...................................................................................................................................... 2Acknowledgments ..................................................................................................................................................... 2
Estimated Depth to the Water Table ..................................................................................................................................... 2Seismic-Refraction Method and Field Application ................................................................................................... 5Water-Table Depth from Seismic Refraction ............................................................................................................ 5
Estimated Rate of Recharge .................................................................................................................................................. 8Method of Computing Recharge Rate Using Environmental Tritium ....................................................................... 8Field Application of the Method and Computation of Recharge Rate ...................................................................... 12Evaluation of Recharge Rate ..................................................................................................................................... 17
Conclusions ........................................................................................................................................................................... 18References Cited ................................................................................................................................................................... 18
PLATE
(Plate is in pocket)
1. Map showing estimated depth to the water table near Houston, Texas, 1989–90.
FIGURES
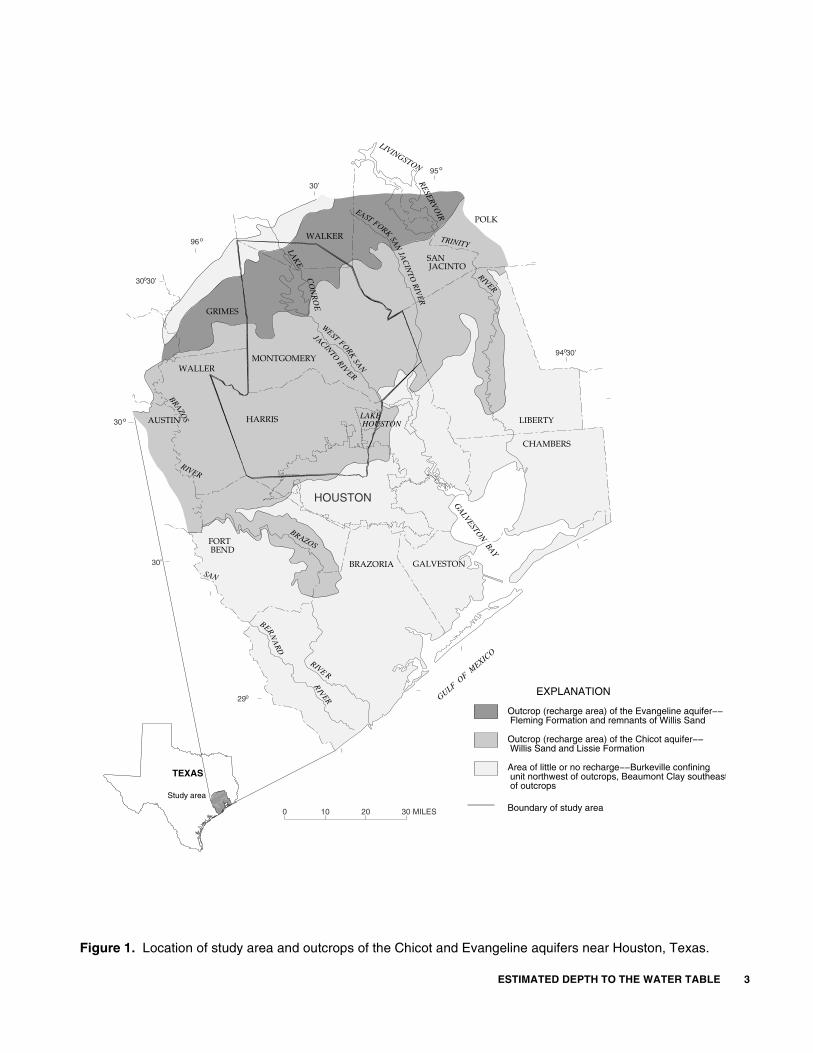
1. Map showing location of study area and outcrops of the Chicot and Evangeline aquifers near Houston, Texas ...................................................................................................................................................... 3
2. Correlation chart showing geologic and hydrogeologic units in the study area near Houston, Texas .................. 43. Diagrams showing (A) sound-wave propagation in unsaturated and saturated zones and detection
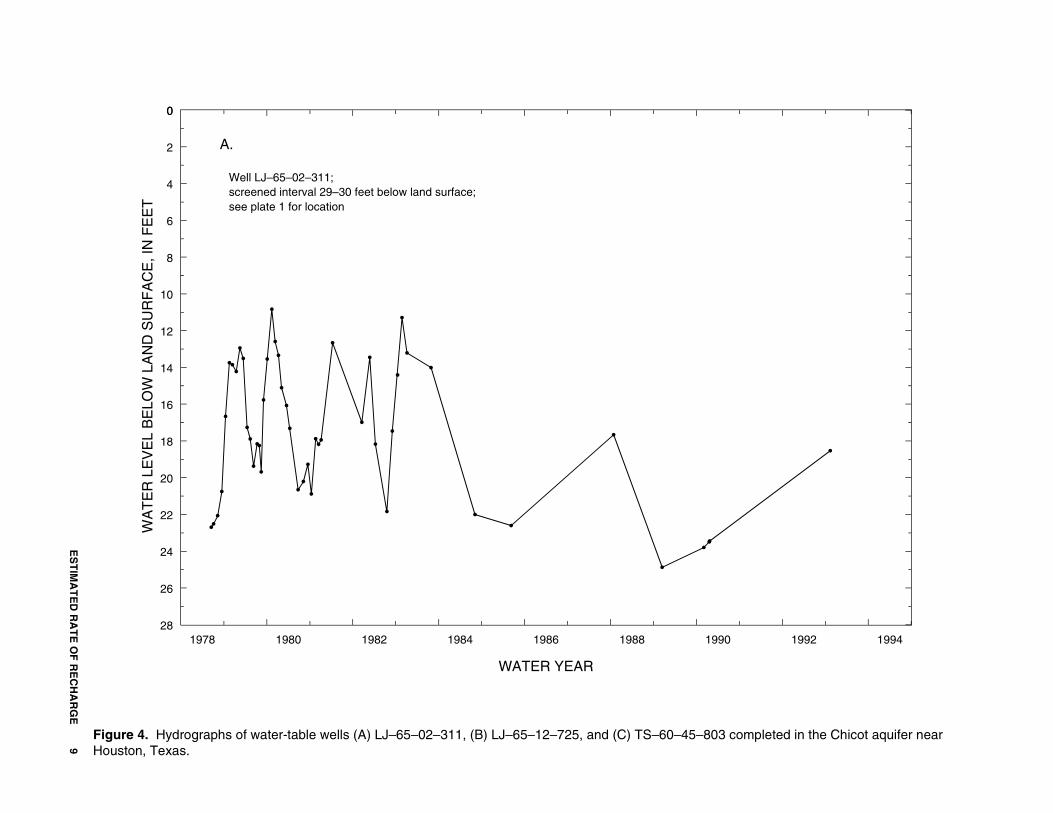
at land surface, and (B) the corresponding time-distance curve ........................................................................... 64. Hydrographs of water-table wells (A) LJ–65–02–311, (B) LJ–65–12–725, and (C) TS–60–45–803
completed in the Chicot aquifer near Houston, Texas ........................................................................................... 95. Map showing location of tritium sampling sites near Houston, Texas .................................................................. 136. Graph showing sample depth below the water table as a function of tritium concentration in samples
from selected wells in the Chicot and Evangeline aquifers near Houston, Texas, 1989–90 ................................. 14
TABLES
1. Measured and seismic-computed water-table depths at seismic-verification sites near Houston, Texas .............. 72. Environmental tritium concentrations in samples from selected wells in the Chicot and Evangeline
aquifers near Houston, Texas, 1989–90 ................................................................................................................ 15
Abbreviations:
ft, footft2/d, square foot per dayft/s, foot per secondin/yr, inch per yearmi2, square mileMgal/d, million gallons per daypCi/L, picocurie per literTU, tritium unit

Blank Page

Abstract 1
Estimated Depth to the Water Table and Estimated Rate of Recharge in Outcrops of the Chicot and Evangeline Aquifers near Houston, Texas
By J.E. Noble, P.W. Bush, M.C. Kasmarek, and D.L. Barbie
Abstract
In 1989, the U.S. Geological Survey, in cooperation with the Harris-Galveston Coastal Subsidence District, began a field study to deter-mine the depth to the water table and to estimate the rate of recharge in outcrops of the Chicot and Evan-geline aquifers near Houston, Texas. The study area comprises about 2,000 square miles of out-crops of the Chicot and Evangeline aquifers in northwest Harris County, Montgomery County, and southern Walker County. Because of the scar-city of measurable water-table wells, depth to the water table below land surface was estimated using a surface geophysical technique, seismic refrac-tion. The water table in the study area generally ranges from about 10 to 30 feet below land surface and typically is deeper in areas of relatively high land-surface altitude than in areas of relatively low land-surface altitude. The water table has demon-strated no long-term trends since ground-water development began, with the probable exception of the water table in the Katy area: There the water table is more than 75 feet deep, probably due to ground-water pumpage from deeper zones. An esti-mated rate of recharge in the aquifer outcrops was computed using the interface method in which environmental tritium is a ground-water tracer. The estimated average total recharge rate in the study area is 6 inches per year. This rate is an upper bound on the average recharge rate during the 37 years 1953–90 because it is based on the deepest penetration (about 80 feet) of postnuclear-testing tritium concentrations. The rate, which represents one of several components of a complex regional
hydrologic budget, is considered reasonable but is not definitive because of uncertainty regarding the assumptions and parameters used in its computa-tion.
INTRODUCTION
Knowledge of the rate of recharge to the Chicot and Evangeline aquifers in the Houston, Texas, area is important to local, State, and Federal agencies. The aquifers provide much of the water supply for all uses in the Houston region. Knowledge of the rate of recharge is a key part of understanding the sources of water that sustain pumpage.
Ground-water resources and development of the Chicot and Evangeline aquifers in Harris and Montgomery Counties have been studied since about 1930. At least five ground-water-flow models have been constructed to analyze the flow system in the Houston region (Wood and Gabrysch, 1965; Jorgensen, 1975; Meyer and Carr, 1979; Carr and others, 1985; and Ryder and Ardis, 1991). Results of the model studies indicate that large regional cones of depression have developed in the potentiometric surfaces of the hydro-geologic units pumped, and that recharge to the Chicot and Evangeline aquifers to sustain the pumpage is occurring. Numerous other studies also document water-level declines in the units pumped, for example, Gabrysch and Coplin (1990); Kasmarek and others (1995). However, study of any measurable effects of pumping stresses on water-table altitudes in the outcrop areas of the Chicot and Evangeline aquifers has been outside the scope of the previous studies.
In 1989, the U.S. Geological Survey (USGS), in cooperation with the Harris-Galveston Coastal Subsidence District, began a field study to determine the depth to the water table (uppermost boundary of the saturated zone) and to estimate the rate of recharge in

2 Estimated Depth to the Water Table and Estimated Rate of Recharge in Outcrops of the Chicot and Evangeline Aquifers nearHouston, Texas
outcrops of the Chicot and Evangeline aquifers, as inde-pendent support or confirmation of results obtained from model studies. The study area comprises about 2,000 mi2 of outcrops of the Chicot and Evangeline aquifers in northwest Harris County, Montgomery County, and southern Walker County (fig. 1).
Purpose and Scope
The purpose of this report is to present estimated depths to the water table in the study area and an esti-mated rate of recharge in the outcrops of the Chicot and Evangeline aquifers. Depth to the water table below land surface was estimated using a surface geophysical technique called seismic refraction. Seismic surveys were done at 280 sites in the study area to provide point data from which a map showing estimated depth to the water table was constructed. Change in the depth to the water table from historical depths is discussed. An esti-mated rate of recharge in the aquifer outcrops was com-puted using environmental tritium as a ground-water tracer. Tritium concentrations in samples from 41 wells distributed throughout the study area and reflecting a wide range of depths provide the basis for the recharge-rate computation. The estimated recharge rate is dis-cussed in light of the assumptions necessary to compute it, in comparison to rates obtained using other methods, and in the context of a regional hydrologic budget.
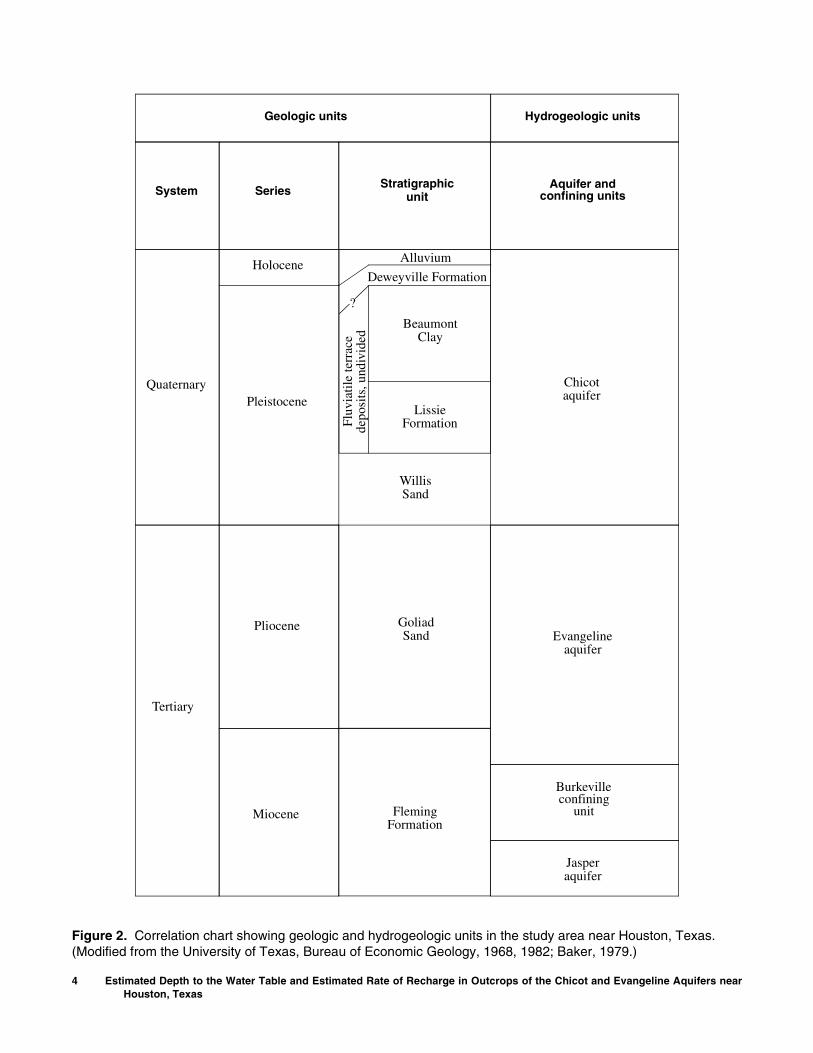
Geology and Hydrogeology
The stratigraphy of the study area (fig. 2) results from a series of discontinuous, regressive depositional episodes separated by the deposition of alternating, transgressive marine shales. These episodes created depositional systems that control the direction and rate of present-day recharge to the sedimentary units. Each system is identified by a characteristic lithology, geom-etry, and orientation. The principal depositional system in the study area consists of fluvial braided to meander-belt facies interspersed with interfluvial-interdeltaic floodbasin facies. Solis (1981) reports that the braided stream deposits grade downdip into wider, meanderbelt point-bar sands that interconnect and develop thick sand accumulations in association with faulting. Regionally, these sands are vertical pathways for recharge to deeper stratigraphic units. The floodbasin facies consist of overbank clays, shales, and silts deposited between the meanderbelts. Both the fluvial facies and the floodbasin facies have been reworked by periodic transgressive events, obscuring the distinction between them.
The Chicot aquifer and underlying Evangeline aquifer consist of Cenozoic deposits of gravel, sand, silt, and clay. The Chicot aquifer is composed of Holocene alluvium; the Holocene/Late Pleistocene Deweyville Formation; and the Pleistocene Beaumont Clay, Lissie Formation, fluviatile terrace deposits, and Willis Sand. The Evangeline aquifer is composed of the Pliocene Goliad Sand and the upper part of the Miocene Fleming Formation. The Evangeline aquifer overlies the Burkeville confining unit and the Jasper aquifer, both part of the Fleming Formation. Regionally, these sediments crop out in subparallel belts that strike southwest-to-northeast across the study area and thicken downdip to the southeast. Although the princi-pal unit of the Evangeline aquifer, the Goliad Sand, does not crop out in the study area, outcrops of the other sed-imentary units of the Chicot and Evangeline aquifers comprise the recharge areas, as delineated by Gabrysch (1977) (fig. 1). The saturated zone in the outcrop areas is characterized by unconfined conditions; whereas con-fined conditions, controlled by the surficial Beaumont Clay, prevail in downdip areas adjacent to the study area.
Hydraulic properties of the Chicot aquifer do not differ appreciably from those of the Evangeline aquifer. Meyer and Carr (1979) used aquifer-test data to esti-mate that transmissivity in the Chicot aquifer ranges from about 3,000 to 25,000 ft2/d; and in the Evangeline aquifer, from about 3,000 to 15,000 ft2/d. Although the Evangeline aquifer generally has lower horizontal hydraulic conductivity than the Chicot aquifer, the Evangeline aquifer usually is more transmissive because of its greater average thickness (Meyer and Carr, 1979, p. 12).
Acknowledgments
The USGS acknowledges assistance in the study by personnel from Harris, Montgomery, and Walker Counties; the Texas Department of Transportation; North Harris Community College of Tomball; Friendswood Development Corporation; and the U.S. Forest Service.
ESTIMATED DEPTH TO THE WATER TABLE
Typically, maps showing depth below land sur-face or altitude above sea level of an aquifer's water table or potentiometric surface are constructed from water-level measurements in wells open to the aquifer.
ESTIMATED DEPTH TO THE WATER TABLE 3
95o
96o
94 30’
30’
30o
30 30’
30’
o
o
o29
HOUSTON
HARRIS
WALKER
LIBERTY
CHAMBERS
GALVESTON
FORT BEND
WALLER
GRIMES
AUSTIN
POLK
MONTGOMERY
BRAZORIA
SAN JACINTO
GULF OF M
EXICO
LIVINGSTON
RESERVOIR
LAKE
CO
NR
OE
LAKE HOUSTON
GALVESTO
N BAY
TRINITY
RIVER
EAST FORKSA
NJA
CIN
TOR
IVE
R
WESTFORK
SAN
JACINTORIV
ER
BRAZOS
RIVER
BRAZOS
RIVER
SAN
BERNA
RD
RIVER
0 10 20 30 MILES
EXPLANATION
Outcrop (recharge area) of the Evangeline aquifer−− Fleming Formation and remnants of Willis Sand
Outcrop (recharge area) of the Chicot aquifer−− Willis Sand and Lissie Formation
Area of little or no recharge−−Burkeville confining unit northwest of outcrops, Beaumont Clay southeast of outcrops
Boundary of study area
TEXAS
Study area
Figure 1. Location of study area and outcrops of the Chicot and Evangeline aquifers near Houston, Texas.
4 Estimated Depth to the Water Table and Estimated Rate of Recharge in Outcrops of the Chicot and Evangeline Aquifers nearHouston, Texas
Stratigraphic
Beaumont
Geologic units Hydrogeologic units
Series Aquifer and
Holocene
Fluv
iatil
e te
rrac
e
Lissie
Willis
Goliad
Fleming
Jasper
Chicot
Burkeville
unit
aquifer
Deweyville Formation
?
Formation
Clay
confiningunit
Formation
Sand
Sand
depo
sits
, und
ivid
ed
System
Quaternary
Tertiary
Pliocene
Miocene
Evangelineaquifer
aquifer
Pleistocene
Alluvium
confining units
Figure 2. Correlation chart showing geologic and hydrogeologic units in the study area near Houston, Texas. (Modified from the University of Texas, Bureau of Economic Geology, 1968, 1982; Baker, 1979.)
ESTIMATED DEPTH TO THE WATER TABLE 5
Water-level data have been collected by the USGS from numerous observation and water-supply wells in the Chicot and Evangeline aquifers for several decades. However, very few of the wells for which data are available are shallow wells accessible for water-level measurement that tap only the uppermost part of the regionally continuous saturated zone. Because of this lack of necessary water-level data in the study area, an indirect method of computing the depth below land surface of the water table at selected sites, the seismic-refraction method, was used to obtain sufficient data from which to construct a map showing depth to the water table.
Seismic-Refraction Method and Field Application
The use of the seismic-refraction method to esti-mate depth to the water table is a recognized surface geophysical technique (Zohdy and others, 1974, p. 80). The method takes advantage of the fact that compres-sional sound-wave velocities in unconsolidated or semiconsolidated clastic rocks increase abruptly at the water table. For example, sound-wave velocities in unsaturated, unconsolidated sands and gravels range from 400 to 600 ft/s; at the water table, the velocity range increases by a factor of 10 to 4,000 to 6,000 ft/s (Haeni, 1988, p. 22).
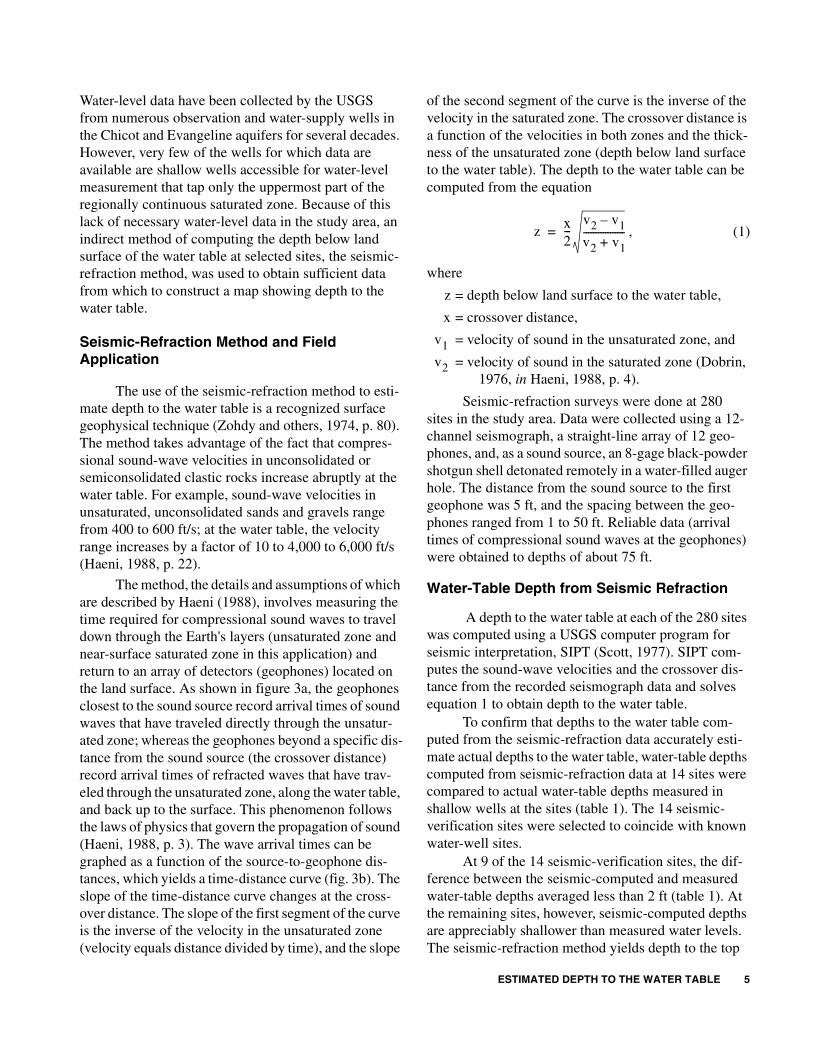
The method, the details and assumptions of which are described by Haeni (1988), involves measuring the time required for compressional sound waves to travel down through the Earth's layers (unsaturated zone and near-surface saturated zone in this application) and return to an array of detectors (geophones) located on the land surface. As shown in figure 3a, the geophones closest to the sound source record arrival times of sound waves that have traveled directly through the unsatur-ated zone; whereas the geophones beyond a specific dis-tance from the sound source (the crossover distance) record arrival times of refracted waves that have trav-eled through the unsaturated zone, along the water table, and back up to the surface. This phenomenon follows the laws of physics that govern the propagation of sound (Haeni, 1988, p. 3). The wave arrival times can be graphed as a function of the source-to-geophone dis-tances, which yields a time-distance curve (fig. 3b). The slope of the time-distance curve changes at the cross-over distance. The slope of the first segment of the curve is the inverse of the velocity in the unsaturated zone (velocity equals distance divided by time), and the slope
of the second segment of the curve is the inverse of the velocity in the saturated zone. The crossover distance is a function of the velocities in both zones and the thick-ness of the unsaturated zone (depth below land surface to the water table). The depth to the water table can be computed from the equation
, (1)
where
z = depth below land surface to the water table,
x = crossover distance,
= velocity of sound in the unsaturated zone, and
= velocity of sound in the saturated zone (Dobrin, 1976, in Haeni, 1988, p. 4).
Seismic-refraction surveys were done at 280 sites in the study area. Data were collected using a 12-channel seismograph, a straight-line array of 12 geo-phones, and, as a sound source, an 8-gage black-powder shotgun shell detonated remotely in a water-filled auger hole. The distance from the sound source to the first geophone was 5 ft, and the spacing between the geo-phones ranged from 1 to 50 ft. Reliable data (arrival times of compressional sound waves at the geophones) were obtained to depths of about 75 ft.
Water-Table Depth from Seismic Refraction
A depth to the water table at each of the 280 sites was computed using a USGS computer program for seismic interpretation, SIPT (Scott, 1977). SIPT com-putes the sound-wave velocities and the crossover dis-tance from the recorded seismograph data and solves equation 1 to obtain depth to the water table.
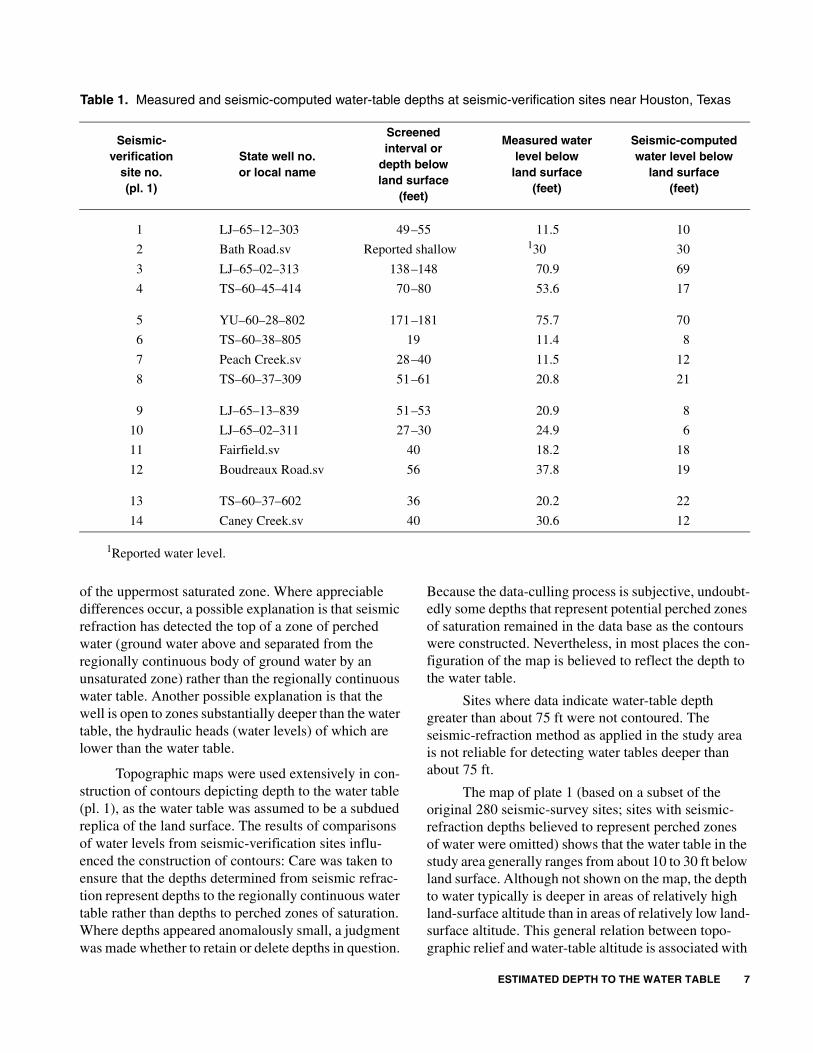
To confirm that depths to the water table com-puted from the seismic-refraction data accurately esti-mate actual depths to the water table, water-table depths computed from seismic-refraction data at 14 sites were compared to actual water-table depths measured in shallow wells at the sites (table 1). The 14 seismic-verification sites were selected to coincide with known water-well sites.
At 9 of the 14 seismic-verification sites, the dif-ference between the seismic-computed and measured water-table depths averaged less than 2 ft (table 1). At the remaining sites, however, seismic-computed depths are appreciably shallower than measured water levels. The seismic-refraction method yields depth to the top
zx2---
v2 v1–
v2 v1+-----------------=
v1
v2

6 Estimated Depth to the Water Table and Estimated Rate of Recharge in Outcrops of the Chicot and Evangeline Aquifers nearHouston, Texas
Figure 3. Diagrams showing (A) sound-wave propagation in unsaturated and saturated zones and detection at land surface, and (B) the corresponding time-distance curve. (Modified from Haeni, 1988, fig. 2.)
ESTIMATED DEPTH TO THE WATER TABLE 7
of the uppermost saturated zone. Where appreciable differences occur, a possible explanation is that seismic refraction has detected the top of a zone of perched water (ground water above and separated from the regionally continuous body of ground water by an unsaturated zone) rather than the regionally continuous water table. Another possible explanation is that the well is open to zones substantially deeper than the water table, the hydraulic heads (water levels) of which are lower than the water table.
Topographic maps were used extensively in con-struction of contours depicting depth to the water table (pl. 1), as the water table was assumed to be a subdued replica of the land surface. The results of comparisons of water levels from seismic-verification sites influ-enced the construction of contours: Care was taken to ensure that the depths determined from seismic refrac-tion represent depths to the regionally continuous water table rather than depths to perched zones of saturation. Where depths appeared anomalously small, a judgment was made whether to retain or delete depths in question.
Because the data-culling process is subjective, undoubt-edly some depths that represent potential perched zones of saturation remained in the data base as the contours were constructed. Nevertheless, in most places the con-figuration of the map is believed to reflect the depth to the water table.
Sites where data indicate water-table depth greater than about 75 ft were not contoured. The seismic-refraction method as applied in the study area is not reliable for detecting water tables deeper than about 75 ft.
The map of plate 1 (based on a subset of the original 280 seismic-survey sites; sites with seismic-refraction depths believed to represent perched zones of water were omitted) shows that the water table in the study area generally ranges from about 10 to 30 ft below land surface. Although not shown on the map, the depth to water typically is deeper in areas of relatively high land-surface altitude than in areas of relatively low land-surface altitude. This general relation between topo-graphic relief and water-table altitude is associated with
Table 1. Measured and seismic-computed water-table depths at seismic-verification sites near Houston, Texas
Seismic-verification
site no.(pl. 1)
State well no.or local name
Screenedinterval or
depth belowland surface
(feet)
Measured waterlevel below
land surface(feet)
Seismic-computedwater level below
land surface(feet)
1 LJ–65–12–303 49.–55 11.5 10
2 Bath Road.sv Reported shallow 130
1Reported water level.
30
3 LJ–65–02–313 138.–148 70.9 69
4 TS–60–45–414 70.–80 53.6 17
5 YU–60–28–802 171.–181 75.7 70
6 TS–60–38–805 19 11.4 8
7 Peach Creek.sv 28.–40 11.5 12
8 TS–60–37–309 51.–61 20.8 21
9 LJ–65–13–839 51.–53 20.9 8
10 LJ–65–02–311 27.–30 24.9 6
11 Fairfield.sv 40 18.2 18
12 Boudreaux Road.sv 56 37.8 19
13 TS–60–37–602 36 20.2 22
14 Caney Creek.sv 40 30.6 12
8 Estimated Depth to the Water Table and Estimated Rate of Recharge in Outcrops of the Chicot and Evangeline Aquifers nearHouston, Texas
local flow systems, as originally described by Tóth (1963). Generally, recharge occurs in topographically high areas, and some fraction of the recharge (that which does not flow vertically downward to deeper aquifer zones) discharges in adjacent topographically low areas, such as those occupied by streams.
An exception to the regional generalization about the relation between topographic relief and water-table altitude is in the southwestern part of the study area near Katy, where the water table is deeper than 75 ft below land surface. A probable explanation for the relatively deep water table near Katy is that pumpage from deeper zones in the aquifers in the Houston region (about 320 Mgal/d in 1994 [Harris-Galveston Coastal Subsidence District, written commun.,1995]) has induced recharge in the area, which in turn has lowered the water table from its original altitude. The latest comprehensive regional ground-water-flow model that includes the Houston region is the source of this explanation. A map of simulated induced recharge or reduced discharge in outcrop areas of the aquifers caused by pumpage (Ryder and Ardis, 1991, fig. 39) shows part of the area of great-est increase in recharge in the Houston region (3 to 4 in/yr) coincident with the southwestern part of the study area where the water table is deeper than 75 ft.
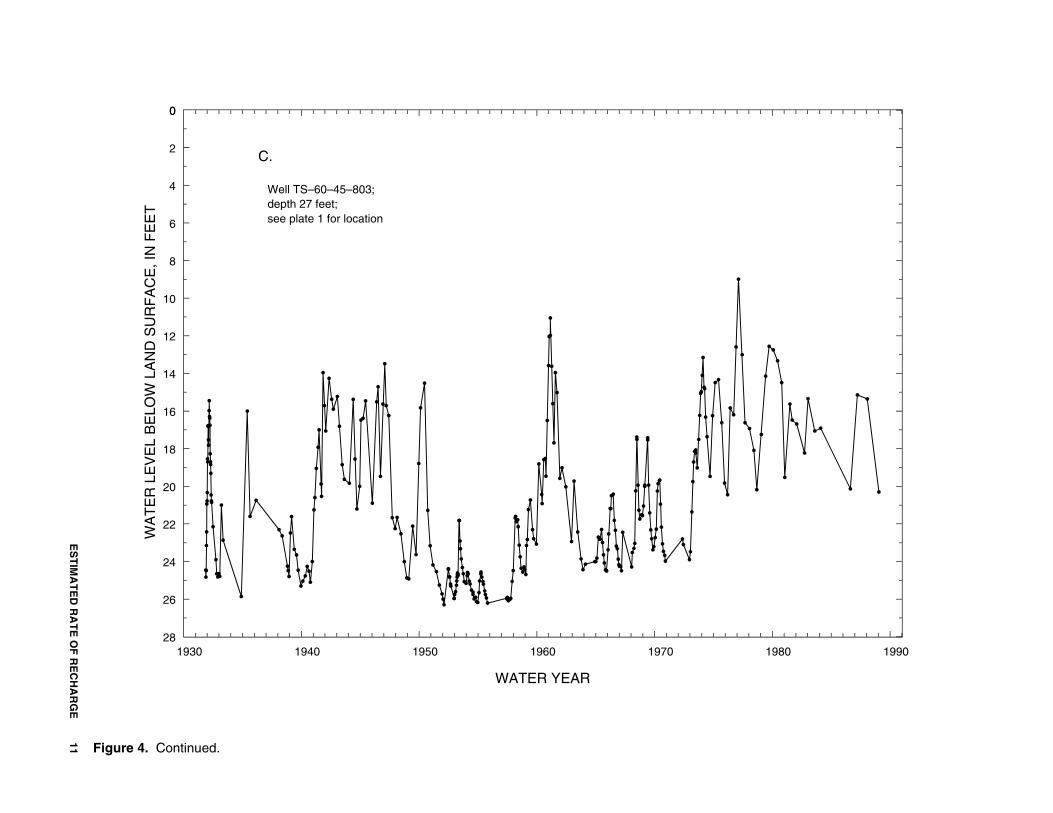
With the probable exception of the water table in the Katy area, the water table has demonstrated no long-term trends since ground-water development began. Long-term water-level data from shallow wells in the study area are scarce, but three available hydrographs (fig. 4) support this assumption: No appreciable water-level trend is apparent. Another indication that the water table has not changed appreciably in most of the study area is its relative proximity to land surface. Mapped water-table depths generally in the 10- to 30-ft range do not allow for appreciable decline to have occurred.
ESTIMATED RATE OF RECHARGE
Tritium, a radioactive isotope of hydrogen with an atomic mass of 3, makes an excellent tracer for studying ground-water processes that occur on a scale of less than 100 years (Plummer and others, 1993, p. 257). Tritium is particularly suited for recharge studies because it enters the hydrologic cycle as part of the water mole-cules in precipitation, has a half-life1 of 12.43 years, and its concentrations in precipitation were increased sub-
stantially by atmospheric nuclear testing during 1953–62.
Tritium is produced naturally by the interaction of cosmic radiation with nitrogen and oxygen in the upper atmosphere (Pearson and others, 1975, p. 4). Before atmospheric nuclear testing, the amount of tritium in the environment was very small. Concentrations in precipi-tation before 1953 are not well known. Thatcher (1962, in Plummer and others, 1993, p. 260) estimates a prob-able range in concentration of 2 to 8 TU (1 TU equals 1 tritium atom in 1018 hydrogen atoms, or 3.24 pCi/L). Payne (1972, in Knott and Olimpio, 1986, p. 10) esti-mates a range of 2 to 25 TU. Beginning in 1953 as a result of the start of atmospheric nuclear testing, the concentrations of tritium in precipitation began to rise, peaking at about 2,000 TU at Waco, Tex., the nearest USGS sampling station, in May 1962.
Because of radioactive decay, ground water derived exclusively from precipitation before 1953 would have maximum tritium concentrations of 0.2 to 0.8 TU by the early 1990s (Plummer and others, 1993, p. 260). If ground water has larger tritium con-centrations, some fraction of the water must have come from precipitation after 1953. Thus tritium can be a marker for recharge that occurred after 1953; and fur-ther, the greatest depth below the water table at which postnuclear-testing tritium concentrations are found can be used to compute a rate for recharge that has occurred since 1953.
Method of Computing Recharge Rate Using Environmental Tritium
Andres and Egger (1985) call the method of com-puting recharge rate using environmental tritium in this study the interface method, in which "interface" refers to the deepest point below the water table to which tri-tium at postnuclear-testing concentrations has traveled. The basis for the method is that the vertical distance downward from the water table that tritium at postnu-clear-testing concentrations has traveled is equal to the rate of travel multiplied by the time of travel (time dif-ference between tritium sampling year and 1953). Put succinctly,
. (2)
The method requires the assumption that ground-water flow is mainly vertical and downward (Plummer and others, 1993, p. 260). The outcrop lithology created by specific depositional systems, as previously
1The time required for one-half of the atoms of a radioactive element to disintegrate.
dis ce depth( )tan rate time×=
ES
TIM
AT
ED
RA
TE
OF
RE
CH
AR
GE
9
0
28
0
2
4
6
8
10
12
14
16
18
20
22
24
26
WA
TE
R L
EV
EL
BE
LOW
LA
ND
SU
RF
AC
E, I
N F
EE
T
1978 1980 1982 1984 1986 1988 1990 1992 1994
WATER YEAR
A.
Well LJ–65–02–311;screened interval 29–30 feet below land surface;see plate 1 for location
Figure 4. Hydrographs of water-table wells (A) LJ–65–02–311, (B) LJ–65–12–725, and (C) TS–60–45–803 completed in the Chicot aquifer near Houston, Texas.

10 Estim
ated D
epth
to th
e Water T
able an
d E
stimated
Rate o
f Rech
arge in
Ou
tcrop
s of th
e Ch
icot an
d E
vang
eline A
qu
ifers near
Ho
usto
n, T
exas
0
28
0
2
4
6
8
10
12
14
16
18
20
22
24
26
WA
TE
R L
EV
EL
BE
LOW
LA
ND
SU
RF
AC
E, I
N F
EE
T
1974 1976 1978 1980 1982 1984 1986 1988 1990 1992 1994 1996
WATER YEAR
B.
Well LJ–65–12–725;screened interval 29–49 feet below land surface;see plate 1 for location
Figure 4. Continued.
ES
TIM
AT
ED
RA
TE
OF
RE
CH
AR
GE
11
0
28
0
2
4
6
8
10
12
14
16
18
20
22
24
26
WA
TE
R L
EV
EL
BE
LOW
LA
ND
SU
RF
AC
E, I
N F
EE
T
1930 1940 1950 1960 1970 1980 1990
WATER YEAR
C.
Well TS–60–45–803;depth 27 feet;see plate 1 for location
Figure 4. Continued.
12 Estimated Depth to the Water Table and Estimated Rate of Recharge in Outcrops of the Chicot and Evangeline Aquifers nearHouston, Texas
described, is conducive to vertical flow, particularly in the near-surface parts of the saturated zone. Mainly downward vertical flow is a reasonable assumption when the study area is considered from a broad perspec-tive as part of the principal recharge area of a vast regional aquifer system: On a regional scale, ground water in the principal recharge area moves downward as a "slug" from the water table to deeper parts of the aqui-fer system; although on a local scale, it is acknowledged that some fraction of the recharge discharges in topo-graphically low areas, commonly to streams.
An implicit assumption of the method is that the water table demonstrates no long-term trends during the period from 1953 to the time of sampling. With the probable exception of the water table in the southwestern part of the study area as previously dis-cussed, this assumption is believed to be valid.
The method also is based on the assumptions that tritium moves within the aquifer at a rate equal to the average interstitial velocity of ground-water flow. The volume of water per unit area that entered the saturated zone during the period between the tritium sampling year and 1953 divided by the length of the period (aver-age specific discharge during the period) is equal to the average recharge rate during the period. Given those assumptions and the fact that, in ground-water flow,
(3)
(Lohman and others, 1972, p. 13), an equation for recharge rate is developed from equations 2 and 3 as follows:
, (4)
, (5)
, (6)
and finally,
. (7)
Because the recharge rate computed from equation 7 (commonly expressed in inches per year) is based on the deepest penetration below the water table of postnuclear-testing tritium concentrations, it represents an upper bound on the average recharge rate
during the time between the tritium sampling year and 1953.
Field Application of the Method and Computation of Recharge Rate
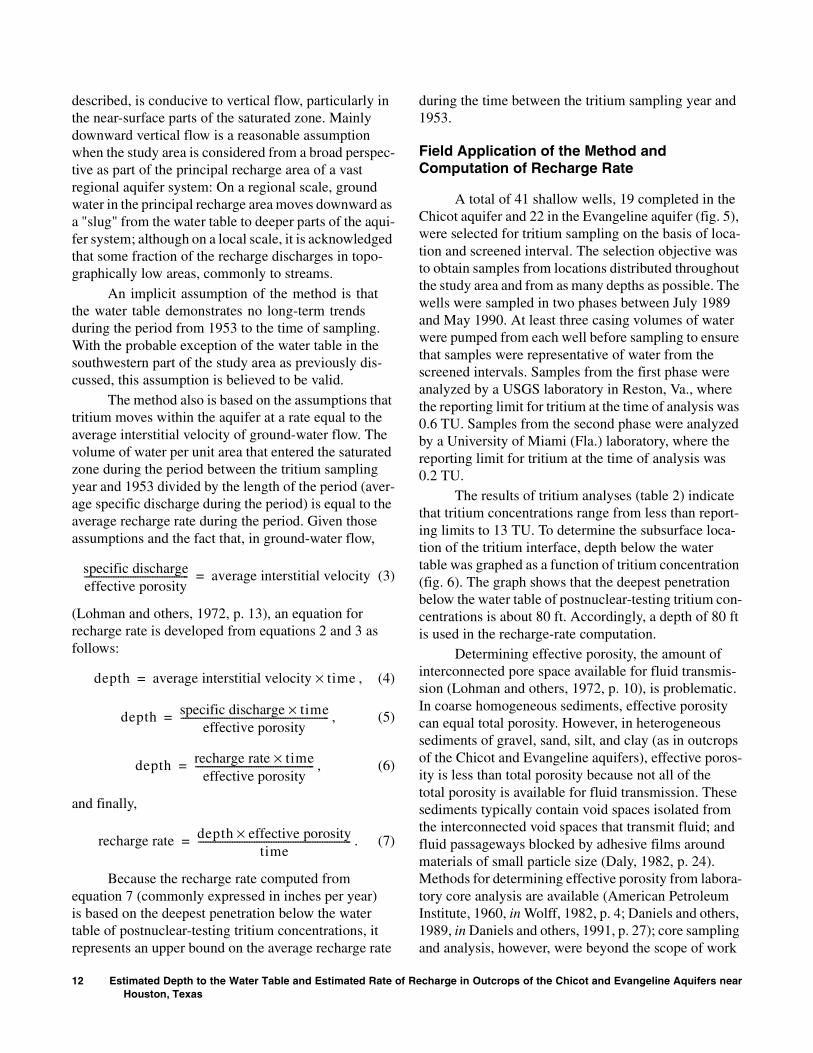
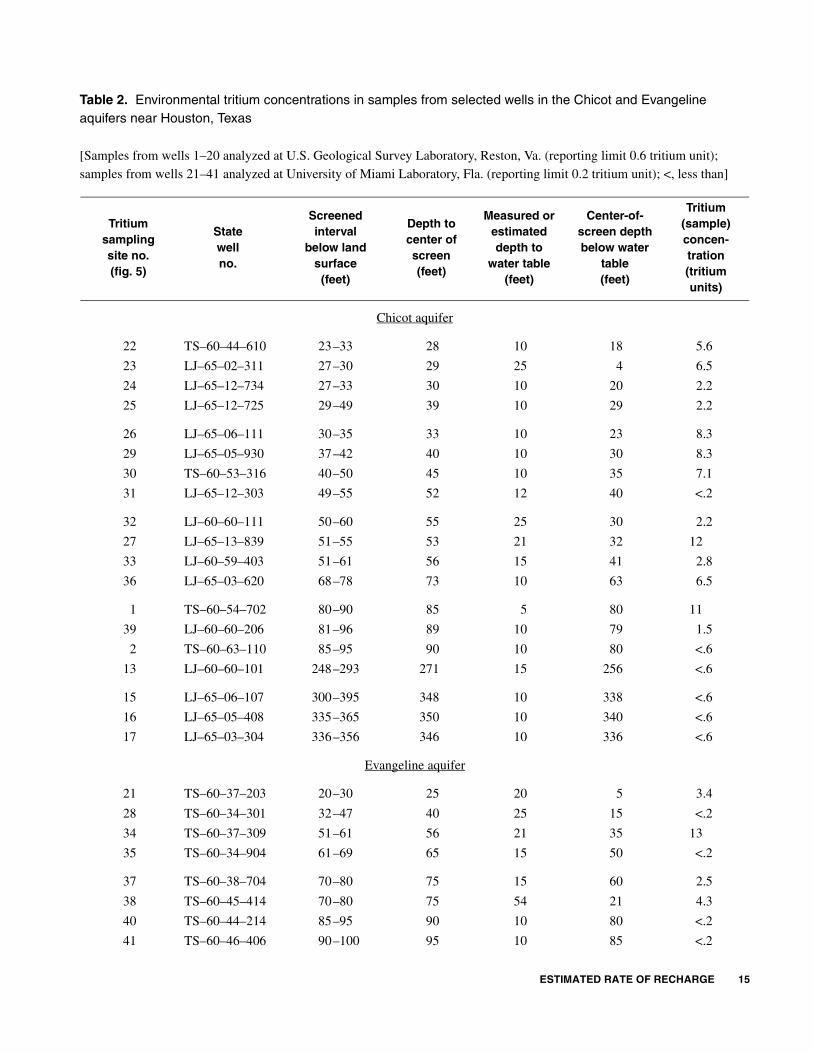
A total of 41 shallow wells, 19 completed in the Chicot aquifer and 22 in the Evangeline aquifer (fig. 5), were selected for tritium sampling on the basis of loca-tion and screened interval. The selection objective was to obtain samples from locations distributed throughout the study area and from as many depths as possible. The wells were sampled in two phases between July 1989 and May 1990. At least three casing volumes of water were pumped from each well before sampling to ensure that samples were representative of water from the screened intervals. Samples from the first phase were analyzed by a USGS laboratory in Reston, Va., where the reporting limit for tritium at the time of analysis was 0.6 TU. Samples from the second phase were analyzed by a University of Miami (Fla.) laboratory, where the reporting limit for tritium at the time of analysis was 0.2 TU.
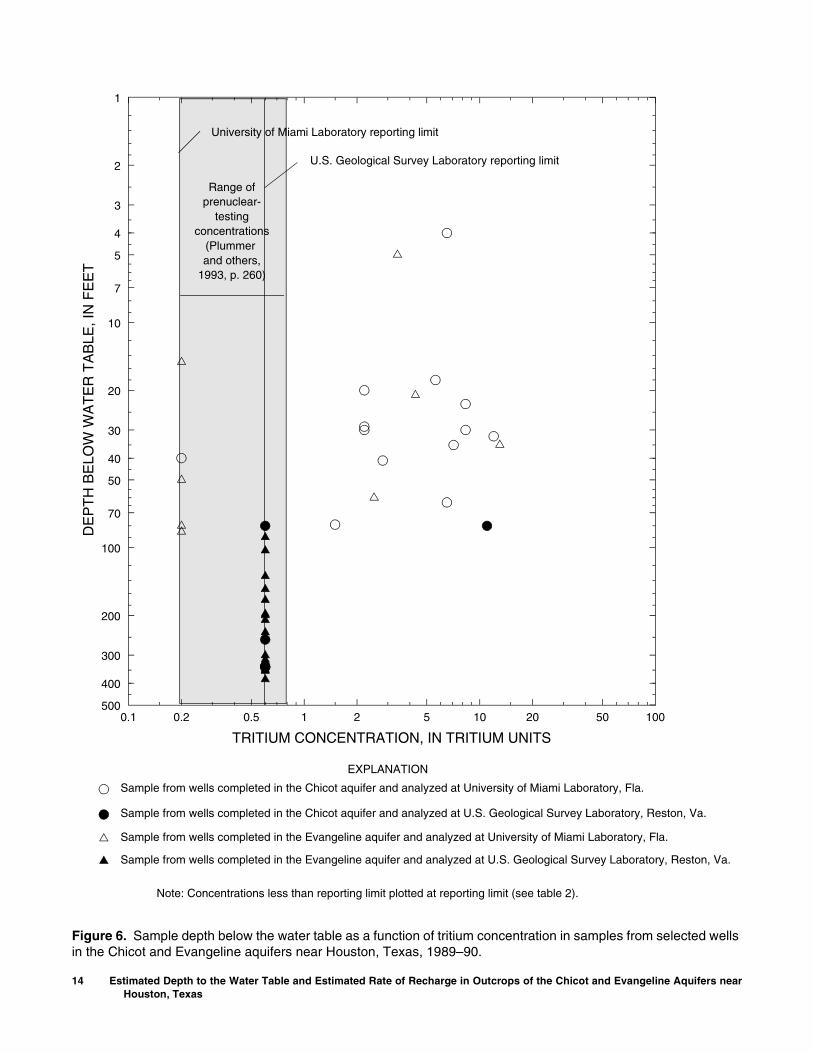
The results of tritium analyses (table 2) indicate that tritium concentrations range from less than report-ing limits to 13 TU. To determine the subsurface loca-tion of the tritium interface, depth below the water table was graphed as a function of tritium concentration (fig. 6). The graph shows that the deepest penetration below the water table of postnuclear-testing tritium con-centrations is about 80 ft. Accordingly, a depth of 80 ft is used in the recharge-rate computation.
Determining effective porosity, the amount of interconnected pore space available for fluid transmis-sion (Lohman and others, 1972, p. 10), is problematic. In coarse homogeneous sediments, effective porosity can equal total porosity. However, in heterogeneous sediments of gravel, sand, silt, and clay (as in outcrops of the Chicot and Evangeline aquifers), effective poros-ity is less than total porosity because not all of the total porosity is available for fluid transmission. These sediments typically contain void spaces isolated from the interconnected void spaces that transmit fluid; and fluid passageways blocked by adhesive films around materials of small particle size (Daly, 1982, p. 24). Methods for determining effective porosity from labora-tory core analysis are available (American Petroleum Institute, 1960, in Wolff, 1982, p. 4; Daniels and others, 1989, in Daniels and others, 1991, p. 27); core sampling and analysis, however, were beyond the scope of work
specific dischargeeffective porosity------------------------------------------- average interstitial velocity=
depth average interstitial velocity time×=
depth specific discharge time×effective porosity
-------------------------------------------------------------=
depth recharge rate time×effective porosity
-------------------------------------------------=
recharge rate depth effective porosity×time
---------------------------------------------------------------=
ESTIMATED RATE OF RECHARGE 13
FM 149FM 1375
I−45
State 105
FM 1488
FM 2920
State 249
FM 1960US 290 I−45
FM 1960
Sta
te 6
I−610
I−10 US 90
FM 1375
State 105
FM 1774
1488
FM
I−45 US
75
US
59
FM 2920
US 290
FM 1314
US
59
SAN
JACINTO
LEWIS CREEK RESERVOIR
Lake
Peach
WESTCreek Willow
FORKMill
Cry
stal
SAN
Creek
Spring
RIV
ER
Creek
Creek
WillowLittle Cypress Creek
Creek
Cypress
Creek
Cypre
ss
CreekBear
CreekSouth
Mayde
Creek
LAKE C
ON
ROE
RIVER
Caney CreekLittle Caney Creek
Caney Creek
Creek
JACINTO
Cre
ek
Cr.
St
e war
ts
Creek
Lan g ham
Dinn er Creek
Creek
Spring
30 o
15’
o30 30’
95 45’o
30’
95 15’o
WALKER COUNTY
COUNTY
GR
IME
S CO
UN
TY
WALLER COUNTY
WA
LLER C
OU
NTY
HARRIS COUNTY
LIBERTY
CO
UN
TY
MONTGOMERY
SAN
JACIN
TO
COUNTY
HARRIS COUNTY
WALLER
KATY
NEW WAVERLY
MONTGOMERY
CONROE
MAGNOLIA
TOMBALL
HOUSTON
283
5
35
18 4038
4
21 34
37
612
9
1
8
239
32
11
1314
33
36
17
19
23
24
25
31
27
1629
2015
26
10
41
22
30
7
0 5 10 15 20 MILES
EXPLANATION
Tritium sampling siteIdentification number refers to table 2
20
Figure 5. Location of tritium sampling sites near Houston, Texas.
14 Estimated Depth to the Water Table and Estimated Rate of Recharge in Outcrops of the Chicot and Evangeline Aquifers nearHouston, Texas
1
500
2
3
4
5
7
10
20
30
40
50
70
100
200
300
400
DE
PT
H B
ELO
W W
AT
ER
TA
BLE
, IN
FE
ET
0.1 1000.2 0.5 1 2 5 10 20 50
TRITIUM CONCENTRATION, IN TRITIUM UNITS
EXPLANATION
Sample from wells completed in the Chicot aquifer and analyzed at University of Miami Laboratory, Fla.
Sample from wells completed in the Chicot aquifer and analyzed at U.S. Geological Survey Laboratory, Reston, Va.
Sample from wells completed in the Evangeline aquifer and analyzed at University of Miami Laboratory, Fla.
Sample from wells completed in the Evangeline aquifer and analyzed at U.S. Geological Survey Laboratory, Reston, Va.
University of Miami Laboratory reporting limit
U.S. Geological Survey Laboratory reporting limit
Range ofprenuclear-
testingconcentrations
(Plummer and others,
1993, p. 260)
Note: Concentrations less than reporting limit plotted at reporting limit (see table 2).
Figure 6. Sample depth below the water table as a function of tritium concentration in samples from selected wells in the Chicot and Evangeline aquifers near Houston, Texas, 1989–90.
ESTIMATED RATE OF RECHARGE 15
Table 2. Environmental tritium concentrations in samples from selected wells in the Chicot and Evangeline aquifers near Houston, Texas—Continued
Tritiumsamplingsite no.(fig. 5)
Statewellno.
Screenedinterval
below landsurface
(feet)
Depth tocenter ofscreen(feet)
Measured orestimateddepth to
water table(feet)
Center-of-screen depthbelow water
table(feet)
Tritium(sample)concen-tration(tritium units)
Chicot aquifer
22 TS–60–44–610 23.–33 28 10 18 5.6
23 LJ–65–02–311 27.–30 29 25 4 6.5
24 LJ–65–12–734 27.–33 30 10 20 2.2
25 LJ–65–12–725 29.–49 39 10 29 2.2
26 LJ–65–06–111 30.–35 33 10 23 8.3
29 LJ–65–05–930 37.–42 40 10 30 8.3
30 TS–60–53–316 40.–50 45 10 35 7.1
31 LJ–65–12–303 49.–55 52 12 40 <.2
32 LJ–60–60–111 50.–60 55 25 30 2.2
27 LJ–65–13–839 51.–55 53 21 32 12
33 LJ–60–59–403 51.–61 56 15 41 2.8
36 LJ–65–03–620 68.–78 73 10 63 6.5
1 TS–60–54–702 80.–90 85 5 80 11
39 LJ–60–60–206 81.–96 89 10 79 1.5
2 TS–60–63–110 85.–95 90 10 80 <.6
13 LJ–60–60–101 248.–293 271 15 256 <.6
15 LJ–65–06–107 300.–395 348 10 338 <.6
16 LJ–65–05–408 335.–365 350 10 340 <.6
17 LJ–65–03–304 336.–356 346 10 336 <.6
Evangeline aquifer
21 TS–60–37–203 20.–30 25 20 5 3.4
28 TS–60–34–301 32.–47 40 25 15 <.2
34 TS–60–37–309 51.–61 56 21 35 13
35 TS–60–34–904 61.–69 65 15 50 <.2
37 TS–60–38–704 70.–80 75 15 60 2.5
38 TS–60–45–414 70.–80 75 54 21 4.3
40 TS–60–44–214 85.–95 90 10 80 <.2
41 TS–60–46–406 90.–100 95 10 85 <.2
Table 2. Environmental tritium concentrations in samples from selected wells in the Chicot and Evangeline aquifers near Houston, Texas
[Samples from wells 1–20 analyzed at U.S. Geological Survey Laboratory, Reston, Va. (reporting limit 0.6 tritium unit); samples from wells 21–41 analyzed at University of Miami Laboratory, Fla. (reporting limit 0.2 tritium unit); <, less than]
16 Estimated Depth to the Water Table and Estimated Rate of Recharge in Outcrops of the Chicot and Evangeline Aquifers nearHouston, Texas
in this study. Accordingly, an appropriate effective porosity to use in the computation of recharge rate in the Chicot and Evangeline outcrop area was determined from hydrogeologic literature and judgment based on knowledge of the lithologic characteristics of the out-crops.
Knott and Olimpio (1986), in a somewhat similar application of equation 7 to compute recharge rates at two sites in a "relatively homogeneous" sand and gravel aquifer using environmental tritium, assumed that effec-tive porosity is the same as total porosity. Total porosi-ties of 36 and 34 percent were determined from laboratory analyses and used in their recharge-rate com-putations.
Based on numerous laboratory analyses, Morris and Johnson (1967, tables 5, 6) report mean total poros-ities for gravel, sand, silt, and clay of 31, 34, 46, and 48 percent, respectively. Other compilers of large numbers of total porosities of unconsolidated sedimentary depos-its (Manger, 1963, table 4; Wolff, 1982, table 4.2.1)
report values of generally similar magnitudes. Thus a reasonable assumption is that total porosity in the out-crops of the Chicot and Evangeline aquifers probably is in the 30- to 50-percent range. Although materials of small particle size typically have larger total porosi-ties than materials of large particle size, materials of small particle size have proportionately less intercon-nected pore space and, consequently, smaller effective porosities than materials of large particle size (Daly, 1982, p. 25). The degree to which effective porosity differs from total porosity in the Chicot and Evangeline aquifers is controlled primarily by the fraction of aqui-fer sediments consisting of fine-grained sand, silt, and clay particles. In turn, the spatial distribution of these sediments controls the direction and rate of recharge to the aquifers. These lithologic characteristics, and the particle size and distribution of sediments in the Chi-cot and Evangeline aquifers, are direct results of the depositional episodes noted previously.
Evangeline aquifer—Continued
3 TS–60–35–204 110.–130 120 30 90 <0.6
4 TS–60–45–114 118.–128 123 20 103 <.6
5 TS–60–42–202 146.–161 154 20 134 <.6
6 TS–60–45–513 158.–168 163 10 153 <.6
7 TS–60–53–315 165.–196 181 10 171 <.6
8 TS–60–54–405 205.–215 210 10 200 <.6
9 TS–60–53–210 212.–222 217 20 197 <.6
10 TS–60–36–802 215.–235 225 15 210 <.6
11 LJ–60–60–110 237.–395 316 15 301 <.6
12 TS–60–45–613 245.–250 248 10 238 <.6
14 LJ–60–60–103 260.–400 330 15 315 <.6
18 TS–60–43–511 342.–384 363 10 353 <.6
19 LJ–65–03–209 360.–407 384 35 349 <.6
20 LJ–60–62–715 390.–400 395 10 385 <.6
Table 2. Environmental tritium concentrations in samples from selected wells in the Chicot and Evangeline aquifers near Houston, Texas—Continued
Tritiumsamplingsite no.(fig. 5)
Statewellno.
Screenedinterval
below landsurface
(feet)
Depth tocenter ofscreen(feet)
Measured orestimateddepth to
water table(feet)
Center-of-screen depthbelow water
table(feet)
Tritium(sample)concen-tration(tritium units)

ESTIMATED RATE OF RECHARGE 17
The authors infer from the information available and from consultation with other scientists familiar with the hydrogeology of the study area (E.T. Baker, U.S. Geological Survey, oral commun., 1995; D.J. Nyman, U.S. Geological Survey (retired), oral commun., 1995; J.M. Sharp, Jr., Department of Geology, University of Texas, oral commun., 1995; L.E. Garner, Bureau of Economic Geology, University of Texas, oral commun., 1995) that effective porosity in the outcrop area of the Chicot and Evangeline aquifers likely ranges from about 20 to 25 percent. Accordingly, an effective poros-ity in the middle of that range (23 percent) is used in the recharge-rate computation.
Using 37 years as the tritium "travel time" (sam-pling year 1990 minus 1953) and the above estimates for interface depth (80 ft) and effective porosity (0.23), average recharge rate is computed from equation 7:
.
Evaluation of Recharge Rate
As readily seen from equation 7, the accuracy of the computed recharge rate as an upper bound on the average recharge rate between 1953 and 1990 depends directly on the accuracy of the interface depth and the effective porosity. Although the graph of depth below the water table as a function of tritium concentration (fig. 6) shows a well-defined break between prenuclear- and postnuclear-testing tritium concentrations, a poten-tial source of error in the interface depth is the fact that only 5 of the 41 wells sampled for tritium (table 2) had measured water levels; the remainder (of necessity) were estimated from seismic refraction. The tenuous nature of the effective porosity estimate is evident from the discussion in the previous section.
From a regional perspective, recharge moves downward as a "slug" into the deep regional flow sys-tem. However, as previously discussed, some fraction of the recharge discharges locally—a fraction that is not accounted for in equation 7. Thus the computed average recharge rate represents total recharge to the saturated zone, not net recharge to the deep regional flow system. An implication of local discharge is that the assumption of vertical flow, while reasonable from a regional per-spective, is violated to some extent on a local scale: If the downward flow of water (and thus tritium) from the water table is not predominantly vertical, the actual average recharge rate could be different from the 6 in/yr computed assuming vertical flow.
The computed average recharge rate compares favorably with ranges of recharge rate obtained from two recent studies using methods other than environ-mental tritium. The latest comprehensive regional ground-water-flow model that includes the Houston region indicates simulated recharge rate in the range of 0 to 4 in/yr in the study area of this report (Ryder and Ardis, 1991, fig. 38). This range of recharge rate is com-patible with the computed average rate of 6 in/yr, con-sidering the fact that regional ground-water-flow models, by virtue of their relatively large grid-block spacing, cannot simulate local flow systems (Sun and Johnston, 1994, p. 7). Only part of the total recharge, depending on the grid spacing, topographic relief, and stream density, is simulated.
A water-budget analysis involving rainfall and runoff data from four basins in the recharge areas of the Chicot and Evangeline aquifers and two basins in adja-cent parts of the aquifers confined beneath the Beau-mont Clay yielded an estimated 4 to 10 in/yr recharge (R.K. Gabrysch and Fred Liscum, U.S. Geological Survey [retired], and U.S. Geological Survey, written commun., 1995). Recharge computed from a basin water budget represents the fraction of total recharge that is not discharged within the basin—a rate that prob-ably is less than total recharge but more than net recharge to deep aquifer zones.
The natural regional ground-water-flow system in the Houston region has been profoundly altered by decades of substantial withdrawals of water. Large regional cones of depression have developed in the potentiometric surfaces of the hydrogeologic units pumped. Simulated regional horizontal flow vectors superimposed on cones of depression in permeable zones of the Chicot and Evangeline aquifers (Ryder and Ardis, 1991, figs. 44–46) indicate that water to sus-tain pumpage in the Houston region flows toward the center of pumpage from tens of miles away in all direc-tions. Thus, the sources of water to sustain pumpage—induced recharge, capture from natural discharge, and storage in permeable zones and confining units—are spread over a very large geographic area. An estimated recharge rate for the study area (regardless of its verac-ity) represents one of several components of a complex regional hydrologic budget.
Tempered by the above information, an average total recharge rate of 6 in/yr in the study area is consid-ered a reasonable estimate. However, it is not definitive because of uncertainty regarding the assumptions and parameters used in its computation.
recharge rate80 ft 0.23×
37 yr--------------------------- 12
inft-----× 6
inyr-----= =

18 Estimated Depth to the Water Table and Estimated Rate of Recharge in Outcrops of the Chicot and Evangeline Aquifers nearHouston, Texas
CONCLUSIONS
Several conclusions regarding the depth to the water table and the rate of recharge in outcrops of the Chicot and Evangeline aquifers follow from the analy-ses of seismic-refraction and environmental tritium data.
1. The water table in the study area generally ranges from about 10 to 30 ft below land surface and typically is deeper in areas of relatively high land-surface altitude than in areas of relatively low land-surface altitude.
2. In the southwestern part of the study area near Katy, the water table is more than 75 ft below land surface. A probable explanation for the relatively deep water table near Katy, indicated by recent regional ground-water-flow modeling, is that ground-water pumpage from deeper zones in the aquifers in the Houston region (about 320 Mgal/d in 1994) has induced recharge in the area, which in turn has lowered the water table from its original altitude.
3. With the exception of the water table in the Katy area, the water table has demonstrated no long-term trends since ground-water development began. Mapped water-table depths generally in the 10- to 30-ft range do not allow for appreciable decline to have occurred.
4. The estimated average total recharge rate in the study area is 6 in/yr. This rate is an upper bound on the average recharge rate during the 37 years 1953–90 because it is based on the deepest penetration (about 80 ft) of postnuclear-testing tritium concentrations. The rate is total recharge to the saturated zone, rather than net recharge to the deep regional flow system, because some fraction of the total recharge discharges locally, mainly to streams.
5. The estimated average total recharge rate, which represents one of several components of a complex regional hydrologic budget, is considered reasonable because it compares favorably with recharge rates in the study area obtained from recent ground-water-flow modeling and water-budget analyses. However, the rate is not definitive because of uncertainty regarding the assumptions and parameters used in its computation.
REFERENCES CITED
American Petroleum Institute, 1960, Recommended practice for core-analysis procedure: American Petroleum Institute API–RP–40, 55 p.
Andres, Gerhard, and Egger, Richard, 1985, A new tritium interface method for determining the recharge rate of deep groundwater in the Bavarian Molasse Basin: Journal of Hydrology, v. 82, no. 1/2, p. 27–38.
Baker, E.T., Jr., 1979, Stratigraphic and hydrogeologic framework of part of the Coastal Plain of Texas: Texas Department of Water Resources Report 236, 43 p.
Carr, J.E., Meyer, W.R., Sandeen, W.M., and McLane, I.R., 1985, Digital models for simulation of ground-water hydrology of the Chicot and Evangeline aquifers along the Gulf Coast of Texas: Texas Department of Water Resources Report 289, 101 p.
Daly, C.J., 1982, Evaluation of procedures for determining selected aquifer parameters: U.S. Army Corps of Engineers, Cold Regions Research and Engineering Laboratory Report 82–41, 103 p.
Daniels, D.P., Fritz, S.J., and Leap, D.I., 1989, Measurement of recharge rates through an unsaturated glacial till by tritium analyses: Indiana Water Resources Institute Technical Report 181, 83 p.
______1991, Estimating recharge rates through unsaturated glacial till by tritium tracing: Groundwater, v. 29, no. 1, p. 26–34.
Dobrin, M.B., 1976, Introduction to geophysical prospecting (3d ed.): New York, McGraw-Hill, 630 p.
Gabrysch, R.K., 1977, Approximate areas of recharge to the Chicot and Evangeline aquifer systems in the Houston-Galveston area, Texas: U.S. Geological Survey Open-File Report 77–754, 1 sheet.
Gabrysch, R.K., and Coplin, L.S., 1990, Land-surface subsidence resulting from ground-water withdrawals in the Houston-Galveston region, Texas, through 1987: Harris-Galveston Coastal Subsidence District Report of Investigations 90–01, 53 p.
Haeni, F.P., 1988, Application of seismic-refraction techniques to hydrologic studies: U.S. Geological Survey Techniques of Water-Resources Investigations, book 2, chap. D2, 86 p.
Jorgensen, D.G., 1975, Analog model studies of ground-water hydrology in the Houston district, Texas: Texas Water Development Board Report 190, 84 p.
Kasmarek, M.C., Coplin, L.S., and Santos, H.X., 1995, Water-level altitudes 1995, water-level changes 1977–95 and 1994–95, and compaction 1973–94, in the Chicot and Evangeline aquifers, Houston-Galveston region, Texas: U.S. Geological Survey Open-File Report 95–182, 8 sheets.

REFERENCES CITED 19
Knott, J.F., and Olimpio, J.C., 1986, Estimation of recharge rates to the sand and gravel aquifer using environmental tritium, Nantucket Island, Massachusetts: U.S. Geological Survey Water-Supply Paper 2297, 26 p.
Lohman, S.W., and others, 1972, Definitions of selected ground-water terms—revisions and conceptual refinements: U.S. Geological Survey Water-Supply Paper 1988, 21 p.
Manger, G.E., 1963, Porosity and bulk density of sedimentary rocks: U.S. Geological Survey Bulletin 1144–E, 55 p.
Meyer, W.R., and Carr, J.E., 1979, A digital model for simulation of ground-water hydrology in the Houston area, Texas: Texas Department of Water Resources LP–103, 27 p.
Morris, D.A., and Johnson, A.I., 1967, Summary of hydrologic and physical properties of soil materials, as analyzed by the hydrologic laboratory of the U.S. Geological Survey 1948–60: U.S. Geological Survey Water-Supply Paper 1839–D, 42 p.
Payne, B.R., 1972, Isotope hydrology: Advanced Hydroscience, v. 8, p. 95–138.
Pearson, F.J., Rettman, P.L., and Wyerman, T.A., 1975, Environmental tritium in the Edwards aquifer, central Texas, 1963–71: U.S. Geological Survey Open-File Report 74–362, 32 p.
Plummer, L.N., Michel, R.L., Thurman, E.M., and Glynn, P.D., 1993, Environmental tracers for age dating young ground water, in Alley, W.M., ed., 1993, Regional ground-water quality: New York, Van Nostrand Reinhold, 634 p.
Ryder, P.D., and Ardis, A.F., 1991, Hydrology of the Texas Gulf Coast aquifer systems: U.S. Geological Survey Open-File Report 91–64, 147 p. [Pending publication as U.S. Geological Survey Professional Paper 1416–E.]
Scott, J.H., 1977, SIPT—A seismic refraction inverse modeling program for timeshare terminal computer system: U.S. Geological Survey Open-File Report 77–365, 35 p.
Solis, R.F., 1981, Upper Tertiary and Quaternary depositional systems, central Coastal Plain, Texas—regional geology of the coastal aquifer and potential liquid-waste repositories: Austin, University of Texas, Bureau of Economic Geology Report of Investigations 108, 89 p.
Sun, R.J., and Johnston, R.H., 1994, Regional aquifer-system analysis program of the U.S. Geological Survey, 1978–92: U.S. Geological Survey Circular 1099, 126 p.
Thatcher, L.L., 1962, The distribution of tritium fallout over North America: Bulletin of the International Association of Scientific Hydrology v. 7, no. 2, p. 48–58.
Tóth, J., 1963, A theoretical analysis of groundwater flow in small drainage basins: Journal of Geophysical Research, v. 68, no. 16, p. 4,795–4,812.
University of Texas, Bureau of Economic Geology, 1968, Geologic atlas of Texas, Beaumont sheet: Austin, scale 1:250,000.
______1982, Geologic atlas of Texas, Houston sheet: Austin, scale 1:250,000.
Wolff, R.G., 1982, Physical properties of rocks—porosity, permeability, distribution coefficients, and dispersivity: U.S. Geological Survey Open-File Report 82–166, 118 p.
Wood, L.A., and Gabrysch, R.K., 1965, Analog model study of ground water in the Houston district, Texas: Texas Water Commission Bulletin 6508, 103 p.
Zohdy, A.A.R., Eaton, G.P., and Mabey, D.R., 1974, Application of surface geophysics to ground-water investigations: U.S. Geological Survey Techniques of Water-Resources Investigations, book 2, chap. D1, 116 p.
Related Documents


![Z ] À } v Z ] o · 2018 Estimated Bachelors Degree Only 2018 Estimated Graduate Degree 2018 Estimated Total Businesses 2018 Estimated Total Employees 2018 Estimated Employee population](https://static.cupdf.com/doc/110x72/5f05c8587e708231d414ae8d/z-v-z-o-2018-estimated-bachelors-degree-only-2018-estimated-graduate-degree.jpg)