Clemson University TigerPrints All Dissertations Dissertations 8-2012 Essays on Service Improvisation Competence: Empirical Evidence from e Hospitality Industry Enrico Secchi Clemson University, [email protected] Follow this and additional works at: hps://tigerprints.clemson.edu/all_dissertations Part of the Management Sciences and Quantitative Methods Commons is Dissertation is brought to you for free and open access by the Dissertations at TigerPrints. It has been accepted for inclusion in All Dissertations by an authorized administrator of TigerPrints. For more information, please contact [email protected]. Recommended Citation Secchi, Enrico, "Essays on Service Improvisation Competence: Empirical Evidence from e Hospitality Industry" (2012). All Dissertations. 999. hps://tigerprints.clemson.edu/all_dissertations/999

Welcome message from author
This document is posted to help you gain knowledge. Please leave a comment to let me know what you think about it! Share it to your friends and learn new things together.
Transcript

Clemson UniversityTigerPrints
All Dissertations Dissertations
8-2012
Essays on Service Improvisation Competence:Empirical Evidence from The Hospitality IndustryEnrico SecchiClemson University, [email protected]
Follow this and additional works at: https://tigerprints.clemson.edu/all_dissertations
Part of the Management Sciences and Quantitative Methods Commons
This Dissertation is brought to you for free and open access by the Dissertations at TigerPrints. It has been accepted for inclusion in All Dissertations byan authorized administrator of TigerPrints. For more information, please contact [email protected].
Recommended CitationSecchi, Enrico, "Essays on Service Improvisation Competence: Empirical Evidence from The Hospitality Industry" (2012). AllDissertations. 999.https://tigerprints.clemson.edu/all_dissertations/999

Essays on Service Improvisation Competence:Empirical Evidence from The Hospitality
Industry
A Dissertation
Presented to
the Graduate School of
Clemson University
In Partial Fulfillment
of the Requirements for the Degree
Doctor of Philosophy
Management
by
Enrico Secchi
August 2012
Accepted by:
Dr. Aleda V. Roth, Committee Chair
Dr. Thomas A. Mroz
Dr. Gulru Ozkan
Dr. Rohit Verma
Abstract
This dissertation explores the service design antecedents and the performance
outcomes of Service Improvisation Competence (Serv–IC)—the ability of service em-
ployees to deviate from established processes and routines in order to timely respond
to unexpected events, using available resources.
Service operations and strategy research have strongly highlighted the im-
portance of possessing flexibility in order to face the uncertainty derived from the
interaction with the external environment (Tansik and Chase 1988, Eisenhardt and
Tabrizi 1995, Brown and Eisenhardt 1998, Frei et al. 1999, Menor et al. 2001, Frei
2006). An important component of the ability of service firms to adapt to customer
requests, expectations, and needs rests in the systemic ability of frontline employ-
ees to creatively adapt to the challenges posed by the constant struggle to satisfy
customers.
This dissertation is composed of three essays. In Essay 1, we build the theoret-
ical framework necessary to advance a theory of Service Improvisation Competence,
and we propose a nomological network that links service delivery design choices—
facility design, managerial practices, information distribution, and the procedures
that regulate customer–contact—to the development of a Service Improvisation Com-
petence (Serv–IC). Furthermore, Essay 1 offers a causal theory of the effects of Serv-IC
on service outcomes.
ii

Essay 2 builds on the theoretical foundations of Essay 1, as well as on previ-
ous empirical and theoretical work (Moorman and Miner 1998b, Weick 1998, Miner
et al. 2001, Vera and Crossan 2005), and develops psychometrically sound measures
of Service Improvisation Competence, using a survey of frontline hotel employees. In
addition, in Essay 2 we operationalize and test a model of antecedents and outcomes
of Serv–IC constructed on the theoretical framework proposed in Essay 1, using path
analysis. We find that the development of a Service Improvisation Competence is
the result of a holistic design process which takes into consideration simultaneously
the different design elements presented in Essay 1. Employee empowerment plays a
pivotal role in the enactment of a Service Improvisation Competence (Serv–IC), by
fully mediating the relationship between strategic design choices and Serv–IC. We
also confirm the insights of Mintzberg (1994), and show that an increase in scripting
of the service encounter leads to a decrease in improvisation only up to a certain
point, after which the increase in scripting becomes counterproductive to the end
of standardization, and results in an increase in improvisation. In other words, the
intended managerial goal of increasing the degree of scripting (increase in standard-
ization) results in the opposite outcomes (increase in the amount of deviations from
scripted behaviors).
Essay 3 builds on the results of the previous essays and—applying econo-
metrics methods to a survey of hotel managers—deepens our understanding of the
differential effect of Serv–IC on the financial performance of distinct typologies of
service offerings. First, we develop a theoretically–driven typology of service firms,
based on the operational characteristics of the service delivery system—i.e. how much
the service encounter follows a predetermined “script”—and on the experiential con-
tent of the service offering—i.e. how much the service encounter is intended to elicit
an emotional response. Then, using a Two Stage Least Squares (2SLS) procedure,
iii

we estimate the effect of Serv–IC on performance outcomes within the previously
identified service types. We find that Serv–IC has a positive influence on occupancy
rates in highly experiential hotels, and has a negative effect on room rates as well
as occupancy. Moreover, we find preliminary evidence that Serv–IC is a necessary
element in the ability to provide a service that is at the same time highly scripted
and possesses high experiential content.
Collectively, the three essays provide a nuanced picture of the role that Serv–
IC plays in the design and implementation of service operations. The development
of such competence requires a focused and deliberate arrangement of several orga-
nizational and operational elements, which can potentially outweigh its benefits. In
addition, depending on the type of service offered and hence on the characteristics
of the target market, Serv–IC can have a deleterious effect on performance and cus-
tomer satisfaction. Nonetheless, we show that when Serv–IC, and the service delivery
design choices that lead to its development, are aligned with the service concept and
the target market, it can be a powerful driver of customer satisfaction and, ultimately,
loyalty.
iv

Dedication
To my parents.
v

Acknowledgments
As for any long and draining journey, there are many people without whom I
would not have reached my destination. I wish to thank my dissertation committee
members who helped carry me for a significant portion of my journey. First and
foremost, my thanks go to Dr. Aleda Roth, who has been my mentor since I began
my Ph.D. program and who has shown me how to successfully navigate the treachery
waters of academia and empirical research. Her enthusiasm and passion for every
project that she is involved in are a constant reminder of my love for scientific inquiry
and for our discipline.
I could not have made it without Dr. Rohit Verma’s involvement. He has
provided me with invaluable support, giving me access to the resources of the Cornell
University’s Center for Hospitality Research and by constantly offering detailed and
insightful comments on my work. I also could not have made it without Dr. Gulru
Ozkan, who was always willing to spend time going over my papers and providing
helpful advice on what needed to be done. I want to thank Dr. Tom Mroz, who
has always been available to spend his valuable time with me to quiet my many
uncertainties and doubts over methodological issues.
Then, I want to extend my gratitude to the Management Department of Clem-
son University and its chair, Dr. V “Sri” Sridharan, for giving me the opportunity to
realize a life–long dream to come to the United States to pursue my graduate educa-
vi

tion. In addition I wish to thank the staff of the Center for Hospitality Research, at
Cornell University, which provided essential support in the collection of the data for
my dissertation as well as the opportunity to participate in the QUIS12 conference
to become part of the service management research community. A special thank goes
to Mark Davis of Bentley University and to IBM, that provided the scholarship that
allowed me to take part in the Art & Science of Services Conference, at the IBM
Research Center, in Almaden, CA.
I also wish to thank the professors that I have been lucky enough to work with:
Tom Zagenczyk, who always encouraged me and offered a great example of how to
navigate the tenure process without ever looking discouraged or overwhelmed; Mark
McKnew, who showed me what it means to be a great teacher; and Steve Cantrell,
Janis Miller, and Wayne Stewart, who shared their research agendas and methods
with me, expanding my knowledge of the field of Management.
A very special thank you goes to my travel companions: Tracy and David, who
always managed to make me feel lucky that I had the chance to share with them any
thought and feeling that went through my brain during these past years. Michelle,
who always inspired me with her work ethic and determination. And Stefan, who has
been the best friend I could possibly want to share a house with.
More importantly, I want to thank my family: not only would I not be here
without their help but I also would not be who I am. I cannot express in words my
gratitude to my mother, who showed me what it means to be a wonderful human
being and a true scholar at heart, able to to change her mind and her ways in light of
new evidence. And to my father, whose kind and reassuring smile always reminds me
that there are important things in life other than books and research. My brothers
deserve a special thank for the help and support they always provided. Davide has
been a constant example in his worldwide search for a place to be the scholar that he
vii

wants to be and for his inexhaustible drive for knowledge and understanding. Marco,
with his successful service business, always challenges my preconceptions and gives
me new ways to look at the world of service management: the fact that he manages
to do so while producing and serving beer makes it all the more amazing.
Finally, my biggest debt of gratitude goes to Francesca. She has been closer
to me than anyone else, even when an entire ocean separated us. Without her to lean
upon, I would have fallen too many times to recover, and I would have never found
the strength and motivation to take this journey to its conclusion.
viii
Table of Contents
Title Page . . . . . . . . . . . . . . . . . . . . . . . . . . . . . . . . . . . i
Abstract . . . . . . . . . . . . . . . . . . . . . . . . . . . . . . . . . . . . ii
Dedication . . . . . . . . . . . . . . . . . . . . . . . . . . . . . . . . . . . v
Acknowledgments . . . . . . . . . . . . . . . . . . . . . . . . . . . . . . . vi
List of Tables . . . . . . . . . . . . . . . . . . . . . . . . . . . . . . . . . xi
List of Figures . . . . . . . . . . . . . . . . . . . . . . . . . . . . . . . . . xii
Introduction . . . . . . . . . . . . . . . . . . . . . . . . . . . . . . . . . . 1
Essay 1: Towards a Theory of Service Improvisation Competence . . 51.1 Introduction . . . . . . . . . . . . . . . . . . . . . . . . . . . . . . . . 61.2 The Organizational Improvisation Construct . . . . . . . . . . . . . . 81.3 Improvisation Competence in Services . . . . . . . . . . . . . . . . . 151.4 The Design of Service Improvisation
Competence . . . . . . . . . . . . . . . . . . . . . . . . . . . . . . . . 191.5 Outcomes of Service Improvisation
Competence . . . . . . . . . . . . . . . . . . . . . . . . . . . . . . . . 311.6 Conclusions . . . . . . . . . . . . . . . . . . . . . . . . . . . . . . . . 39
Essay 2. An Empirical Analysis of Service Improvisation Compe-tence: Perspectives from Hotel Employees . . . . . . . . . . . . . . 422.1 Introduction . . . . . . . . . . . . . . . . . . . . . . . . . . . . . . . . 432.2 Model and Hypotheses . . . . . . . . . . . . . . . . . . . . . . . . . . 472.3 Research Design and Methodology . . . . . . . . . . . . . . . . . . . . 652.4 Analysis and Results . . . . . . . . . . . . . . . . . . . . . . . . . . . 802.5 Discussion and Conclusions . . . . . . . . . . . . . . . . . . . . . . . 93
Essay 3. A Typology of Service Delivery: Econometric Analysis ofthe Effects of Improvisation on Business Performance . . . . . . . 96
ix

3.1 Introduction . . . . . . . . . . . . . . . . . . . . . . . . . . . . . . . . 973.2 Theoretical Background
and Research Framework . . . . . . . . . . . . . . . . . . . . . . . . . 1013.3 Research Model and Hypotheses Development . . . . . . . . . . . . . 1163.4 Data Collection and Measures . . . . . . . . . . . . . . . . . . . . . . 1273.5 Analysis and Results . . . . . . . . . . . . . . . . . . . . . . . . . . . 1403.6 Discussion and Conclusions . . . . . . . . . . . . . . . . . . . . . . . 151
Conclusions and Discussion . . . . . . . . . . . . . . . . . . . . . . . . . 1624.1 How can we measure Serv–IC? . . . . . . . . . . . . . . . . . . . . . . 1634.2 How does a service firm develop a Serv–IC? . . . . . . . . . . . . . . 1644.3 What are the effects of Serv–IC on performance? . . . . . . . . . . . 1674.4 Contributions . . . . . . . . . . . . . . . . . . . . . . . . . . . . . . . 169
Appendices . . . . . . . . . . . . . . . . . . . . . . . . . . . . . . . . . . . 172A Measurement Development and
Pilot Study . . . . . . . . . . . . . . . . . . . . . . . . . . . . . . . . 173B Employee Survey . . . . . . . . . . . . . . . . . . . . . . . . . . . . . 178C Employee Survey Descriptives . . . . . . . . . . . . . . . . . . . . . . 188D Manager Survey . . . . . . . . . . . . . . . . . . . . . . . . . . . . . . 193E Manager Survey Descriptives . . . . . . . . . . . . . . . . . . . . . . . 204
Bibliography . . . . . . . . . . . . . . . . . . . . . . . . . . . . . . . . . . 207
x

List of Tables
2.1 Properties Descriptives . . . . . . . . . . . . . . . . . . . . . . . . . . 662.2 Respondent Characteristics . . . . . . . . . . . . . . . . . . . . . . . 672.3 Operating Characteristics . . . . . . . . . . . . . . . . . . . . . . . . 672.4 Improvisation Competence CFA . . . . . . . . . . . . . . . . . . . . . 722.5 Experiential Service Design Strategy CFA . . . . . . . . . . . . . . . 742.6 First–Order Constructs CFA . . . . . . . . . . . . . . . . . . . . . . . 772.7 Correlations Between Constructs . . . . . . . . . . . . . . . . . . . . 832.8 Parameter Estimates and Hypotheses Tests . . . . . . . . . . . . . . . 863.1 Approaches to the Management of Customer–Induced Variability . . 1093.2 Hotel Rating and Categories . . . . . . . . . . . . . . . . . . . . . . . 1283.3 Hotel Operating Characteristics . . . . . . . . . . . . . . . . . . . . . 1283.4 Respondent Characteristics . . . . . . . . . . . . . . . . . . . . . . . 1293.5 Correlations and Descriptive Statistics . . . . . . . . . . . . . . . . . 1303.6 Group Profiles . . . . . . . . . . . . . . . . . . . . . . . . . . . . . . . 1323.7 Harman’s Test of Common Method Variance . . . . . . . . . . . . . . 1353.8 Confirmatory Factor Analysis of Constructs . . . . . . . . . . . . . . 1383.9 Underidentification and Weak IV Tests in Equations Predicting RevPAR1433.10 Underidentification and Weak IV Tests in Equations Predicting ADR 1433.11 Underidentification and Weak IV Tests in Equations Predicting Occu-
pancy . . . . . . . . . . . . . . . . . . . . . . . . . . . . . . . . . . . 1433.12 Anderson Canon. Corr. LM Statistic . . . . . . . . . . . . . . . . . . 1443.13 Sargan–Hansen Test of Overidentification . . . . . . . . . . . . . . . . 1453.14 Difference in Sargan Test of Exogeneity (For EMP and CIU) . . . . . 1453.15 Results of First Stage Regressions Predicting Serv–IC . . . . . . . . . 1473.16 Results of OLS and Second Stage of 2SLS Regressions . . . . . . . . . 1483.17 Influence of Serv–IC on Performance Within– and Between–Groups . 1503.18 Summary of Tests of Hypotheses . . . . . . . . . . . . . . . . . . . . 151A.1 Pilot Study CFA . . . . . . . . . . . . . . . . . . . . . . . . . . . . . 177
xi

List of Figures
0.1 Overview of Theoretical Framework . . . . . . . . . . . . . . . . . . . 21.2 Addressing Customer-Induced Variability . . . . . . . . . . . . . . . . 171.3 Antecedents and Outcomes of Serv–IC . . . . . . . . . . . . . . . . . 201.4 Hypothesized Relationship between Scripting and Improvisation . . . 301.5 A Typology of Services . . . . . . . . . . . . . . . . . . . . . . . . . . 382.1 Roth and Menor’s Service Strategy Triad . . . . . . . . . . . . . . . . 482.2 Theory–Based Research Model . . . . . . . . . . . . . . . . . . . . . . 502.3 Frequency Distribution of Respondents’ Amount of Time in Contact
with Guests . . . . . . . . . . . . . . . . . . . . . . . . . . . . . . . . 672.4 Path Model Results . . . . . . . . . . . . . . . . . . . . . . . . . . . . 842.5 Quadratic Effect of Scripting on Improvisation . . . . . . . . . . . . . 892.6 Interaction between Stars and IC . . . . . . . . . . . . . . . . . . . . 923.1 A Typology of Service Delivery Systems . . . . . . . . . . . . . . . . 993.2 Scripting and Experience in Service Operations . . . . . . . . . . . . 1023.3 Requisite Variety . . . . . . . . . . . . . . . . . . . . . . . . . . . . . 1083.4 The Service Encounter as the Locus of Variation . . . . . . . . . . . . 110A.1 Instrument Development Process (from Menor and Roth (2007)) . . . 174
xii
Introduction
This dissertation defines the construct of Service Improvisation Competence
(Serv–IC)—the ability of service employees to deviate from established processes and
routines in order to timely respond to unexpected events, using available resources—
and examines its service design antecedents and its performance outcomes.
We draw from research in the field of Organizational Improvisation (Edvards-
son et al. 1995, Eisenhardt and Tabrizi 1995, Crossan et al. 1996, Orlikowski 1996,
Moorman and Miner 1998a, Weick 1998, Crossan 1998, e Cunha et al. 1999, Kamoche
et al. 2002, Vera and Crossan 2005, John et al. 2006, e Cunha et al. 2009), Strategy
(Mintzberg 1978, Skaggs and Youndt 2004, Crossan and Hurst 2006), Service Op-
erations (Levitt 1976, Chase 1981, Huete and Roth 1988, Tansik and Chase 1988,
Stewart and Chase 1999, Frei et al. 1999, Verma et al. 2001, Cook et al. 2002, Roth
and Menor 2003a, Stuart and Tax 2004, Frei 2006, Victorino 2008, Voss et al. 2008,
Victorino et al. 2008, 2012), and Service Marketing (Shostack 1982, Grove and Fisk
1983, Shostack 1987, Surprenant and Solomon 1987, Zeithaml et al. 1988, Bitner 1990,
Grove and Fisk 1992, Bitner 1992, Price et al. 1995, Hartline and Ferrell 1996, Bitner
et al. 1997, Palmer 2010), to provide a comprehensive theory of the role that Serv–IC
can play in the design and delivery of high–contact services.
This dissertation is comprised of three essays. Essay 1 develops the theoretical
1

Figure 0.1: Overview of Theoretical Framework
foundations of a theory of Service Improvisation Competence by combining different
streams of literature and advancing a set of propositions on the antecedents and
outcomes of Service Improvisation Competence. Figure 0.1 illustrates the general
framework of the theory presented in Essay 1.
Drawing from the work of (Voss et al. 2008), we examine service delivery
design choices, categorized as Stageware (i.e., physical environement), Orgware (i.e.,
HR policies), Linkware (i.e., mechanisms that transfer of information through the
organization), and Customerware (i.e. design of encounters between the customers
and the service delivery employees). We propose that design choices that promote
a transparent environment, easily accessible resources, adequate training and hiring
practices, and constant information diffusion at all levels of the organization foster
an environment in which Serv–IC can be systemically developed. In addition we
posit that the customerware choices, and in particular the degree of rigidity and
complexity of service delivery procedures, will have a nonlinear relationship with Serv–
IC. Consistently with the stream of strategy research initiated by Mintzberg (1978),
we hypothesize that an attempt to rely too heavily on planning and control will lead to
an unintended increase in improvisational activities, which reduces standardization.
Counter to conventional wisdom, tight scripting will increase variation in the system.
Essay 2 builds on the theoretical developments of Essay 1 and proposes a test of
2

the proposition advanced there. Using a survey of frontline hotel employees, in Essay
2 we test the influence of Strategic Design Choices (Stageware, Orgware, Linkware)
and of Process Design Choices (Customerware) on the development of Serv–IC, as
well as its direct and indirect effects on Customer Satisfaction. Using Structural
Equations Modeling, we find support for the theoretical framework in general, and
especially for the hypotheses concerning Strategic Design Choices and the nonlinear
relationship between Customerware choices and Serv–IC. The effects of Serv–IC on
customer satisfaction are not uniform. Rather, they are moderated by hotel type.
Serv–IC has a positive effect on 1, 2, and 3 star hotels, while it has a negative effect
in 4 and 5 star hotels. This can be interpreted as seeing improvisation as an experience
enhancement, rather than as a cost reduction tool.
Essay 3 refines our understanding of the settings in which Serv–IC can be a vi-
able tool to achieve positive business performance outcomes, using data from a survey
of hotel managers. We first develop a service design typology based on the degree to
which service offerings are intended to elicit an emotional response in the customers
(Customer Experience), and on the degree to which service delivery procedures are
rigid and complex (Degree of Scripting). This typology allows us to perform a more
accurate test of differential impact of Serv–IC on performance across service types, in
contrast to Essay 2, which was based on the star rating. Furthermore, we measured
hotel business performance using Occupancy, Average Daily Rate (ADR), and Rev-
enue per Available Room (RevPAR)—which are commonly used in the hospitality
industry to assess hotel performance.
Taken collectively, the three essays in this dissertation provide a new compre-
hensive theory of Service Improvisation Competence in Service Operations Strategy.
The development of a Serv–IC needs a consistent set of design choices, focused on hir-
ing employees with customer–oriented attitudes, investing substantially in employee
3

training, and creating an environment that allows personal initiative by providing the
material and immaterial resources, as well as an appropriate set of incentives. The
decision on whether to invest in the development of such a competence is therefore
non–trivial. The service typology developed in this dissertation provides strategic
guidance on the positioning of the service, with respect to the expected influence of
Serv–IC on performance.
The research presented in the three essays opens future avenues of research.
Our proposed service design typology does not exhaust the possible comparisons of
the effects of Serv–IC across different settings. Improvisation could have a different
effect across service encounters in the same setting (e.g., hetel check–in vs concierge
services), or it could have different effects depending on the specific service processes.
A priority for future research is the analysis of specific service delivery processes and
the effect of improvisation within and between them. Service Improvisation Compe-
tence is also likely to have different effects among different industries and different
cultures. Cross–industry and cross–cultural studies would constitute a natural exten-
sion of this research.
4

Essay 1.Towards a Theory of ServiceImprovisation Competence
Abstract
This paper develops the construct of Service Improvisation Competence (Serv–IC)—
the ability of service employees to deviate from established processes and routines in
order to timely respond to unexpected events, using available resources—as a novel way
to manage customer-induced variability in service delivery systems. We first discuss
the literature on Organizational Improvisation, and we propose a novel operationaliza-
tion of the Improvisation construct, which brings together different perspectives found
in the literature. Second, we discuss the relevance of the concept of Improvisation in
the service environments, where we advance a set of propositions that examine the
service design drivers and the service performance outcomes of developing a Service
Improvisation Competence.
5

1.1 Introduction
This essay advances a comprehensive theory of Service Improvisation Compe-
tence (Serv–IC)—the systemic ability of the service firm’s employees to deviate from
established processes and routines in order to timely respond to unexpected events
using available resources—which lays the foundations of the empirical work in Essays
2 and 3. Drawing from research in the fields of Organizational Behavior, Strategy,
Service Operations Management, and Services Marketing, we build a nomological
net that links service design choices to the development of Serv–IC, and Serv–IC to
service performance outcomes.
Many service organizations—especially in high-contact environments—are faced
with a high variety of customer requests, unexpected contingencies, and uncertainties
introduced by plain and simple interactions with a substantial number of unique
human beings. The more customer variability is introduced in the system, the
more service delivery employees have to possess the ability to adapt to unforeseen
circumstances—both individually and collectively. Service employees and service or-
ganizations deal with the uncertainty introduced by customer contact with a wide
array of strategies, from complete elimination of face–to–face interactions to the pro-
vision of a highly personalized customer experience (see Huete and Roth 1988).
Consequently, service offerings are often conceptualized in terms of the quan-
tity of options offered to the customer. On one end of the spectrum, we find completely
standardized services, which produce value by relying on streamlined, consistent pro-
cesses and a limited set of options (e.g., McDonald’s restaurant chain). On the other
end are highly customized services, which are designed to offer a wide range of op-
tions to customers (e.g. a high–end gourmet restaurant). Conventional wisdom in
operations management suggests this: the more service design choices move toward
6
customization, the more the operating costs increase, and the service system expe-
riences a general loss of efficiency (Frei 2006, Fitzsimmons and Fitzsimmons 2008).
However, some service organizations exhibit the ability to reap some of the advantages
of both strategies: for example, Southwest Airlines famously manages to achieve the
efficiency advantages of extremely consistent and streamlined operations while at the
same time providing a highly engaging, often personalized, flight experience (Heskett
and Sasser Jr. 2010).
Building on the organizational improvisation literature (Moorman and Miner
1998a, Weick 1998, e Cunha et al. 1999, Crossan and Sorrenti 2002) and from research
in services management (Grove and Fisk 1992, Bitner 1992, Roth and Jackson III
1995, Voss et al. 2008), we build a comprehensive theory of service organizational
design choices and outcomes of developing the systemic ability of service firms to
improvise in the face of customer variability. We operationally define the construct of
Service Improvisation Competence (Serv–IC)—the systemic ability of service firm’s
employees to deviate from established processes and routines in order to timely re-
spond to unexpected events, using available resources; and we analyze its implications
and relevance to service management and strategic design choices.
We argue that service firms that develop such a competence can achieve a
significant competitive advantage by increasing customer value without the loss of
efficiency that is characteristic of more personalized services. Consistently with the
literature on service scripting (Tansik and Smith 1991, 2000, Victorino 2008, Victorino
et al. 2008), as well as the literature on service delivery design and strategic operations
(Goldstein et al. 2002, Roth and Menor 2003b), our theory postulates that the effective
design of such competence relies on a set of consistently aligned strategic design
choices, and that its positive outcomes depend on the coherence of these choices with
the target market and the intended service concept.
7

In this paper, we first review the literature on organizational improvisation,
and we operationalize the Serv–IC construct. Then, we develop a theoretical model
of the design of a service delivery system that possess the ability to improvise, as well
as determine the outcomes of developing a service improvisation competence. In the
end, we discuss the implications of our theoretical framework, as well as how it lays
the foundations for future empirical research.
1.2 The Organizational Improvisation Construct
The concept of organizational improvisation has been developed in the field of
organizational behavior as way to account for the ability of organizations to respond
to situations where advance contingency planning is not possible or not effective,
and which are characterized by significant levels of ambiguity and uncertainty (Weick
1993). The main task of organizing in such a turbulent environment, some authors
observe, is that of striking a balance between the aspects of the organization that
are structured and rigid, and those that should be allowed to vary freely in response
to environmental stimuli (Kamoche et al. 2002). Using the terminology introduced
by March (1991), organizations have to find an equilibrium between exploration and
exploitation activities.
The idea of improvisation is, therefore, not one of uncontrolled chaos, but one
of accurate design of a system in which some parts are allowed free variation in order
to provide the requisite variety that compensates for environmental turbulence (Ashby
1958, Menor et al. 2001, Akgun et al. 2007). It is, in other words, one possible—and
sometimes necessary—way to introduce adaptability and agility into a system.
The necessity of the development of a specific improvisation construct stems
from empirical as well as theoretical reasons. Scholars engaged in research of settings
8

characterized by significant task and outcome uncertainty noted that the persons
involved frequently resorted to “ad–hoc” solutions to the problems at hand, sometimes
consciously disregarding established policies and sometimes for the lack of procedures
indicating the expected behavior (Kamoche and e Cunha 2001). Eisenhardt and
Tabrizi (1995) illustrate how accurate planning of new product development (NPD) is
effective in reducing development time only in mature product categories and that, on
the other hand, loose processes and recourse to improvisation are more effective as the
novelty of the product increases. Similarly, Moorman and Miner (1998a) show that
improvisation in NPD efforts increases with the increase in environmental turbulence.
Similar findings are common in the study of new venture creation (Baker et al. 2003,
Baker and Nelson 2005) as well as crisis management (Weick 1993, e Cunha et al.
2009, Arora et al. 2010).
From a theoretical perspective, scholars engaged in strategy research have long
argued that the discrepancy between plans and their implementation should be cen-
tral concern in strategy research (Mintzberg 1994). This led to the development of
the concepts of intended and realized strategies, where the plans developed in ad-
vance are the intended strategy, while the actual pattern of decision outcomes over
time is the realized strategy (Mintzberg 1978). The starting point of this stream of
research is that, in many situations, the two strategies are not coincident. Roth and
van der Velde (1991a) and Roth and Jackson III (1995) discuss the implications to
service operations strategy of this stream of research. Similarly to what NPD and
entrepreneurship scholars reported, strategy researchers found that when environmen-
tal uncertainty increases it is sometimes impossible or counterproductive to adhere
to previously designed plans. Organizational Improvisation researchers embrace this
theoretical insight and introduce the idea that—by carefully designing appropriate
routines—the intended strategy itself can be conceived in such a way as to encourage
9

and foster an open-ended, improvised, realized strategy (Brown and Eisenhardt 1998,
Crossan et al. 1996).
It can be easily seen how this idea can be used to shed light on a wide variety
of organizational phenomena. Indeed, the broad conceptualization of the construct
is reflected by the multitude of definitions in the literature. Construct definitions
go from the more general “the ability to creatively adapt” (John et al. 2006, p.248)
or “reworking precomposed material and designs in relation to unanticipated ideas
conceived, shaped, and transformed under the special conditions of performance,
thereby adding unique features to every creation” (Berliner 1994, p.241, cited in Weick
(1998)) to more operational definitions, such as “the degree to which composition and
execution converge in time” (Moorman and Miner 1998b, p.698) or “improvisation
refers to the conception of action as it unfolds, drawing on the available resources”
(e Cunha et al. 2009, p.661).
An exhaustive review of the literature on organizational improvisation goes
beyond the scope of this essay, and, therefore, we refer interested readers to the ex-
cellent reviews of the literature already available in previous work (e.g., Moorman
and Miner 1998b, Cunha et al. 2002, Kamoche et al. 2003). Our discussion is fo-
cused on the elements that constitute the basis of Service Improvisation Competence
construct and development efforts. We attempt to reconcile the different conceptions
of the improvisation construct that emerge from the extant literature and develop
an operational definition that fits the service operations strategy focus of this paper.
Similar attempts to shift the characterization of the organizational improvisation
construct from a unidimensional to a multidimensional conception have already been
made in the literature. In particular, Vera and Crossan (2005) combined the aspects
of creativity and spontaneity to characterize the phenomenon of improvisation, and
10

e Cunha et al. (1999) integrated the aspects of spontaneity and bricolage (i.e. rear-
ranging available resources) to craft their definition of improvisation. We argue that
creativity, spontaneity, and bricolage are all first–order dimensions of a second–order
Serv–IC construct, that reflects the improvisation behavior. All these dimensions are
necessary for Serv–IC. Hence, we propose that the theoretical space of the Serv–IC
construct is identified by the intersection of these three dimensions.
Previous literature on organizational improvisation either considered these di-
mensions as coincident with improvisation, or as completely different constructs that
often coincide—but are not a constituent part of—improvisation. In the following
paragraphs, we will discuss each of the dimensions separately and assess their valid-
ity with respect to the phenomenon under investigation as well as discussing their
discriminant validity with respect to one another and related constructs.
1.2.1 Creativity
The study of creativity, which has a long history in psychological and organi-
zational research, can be conceptualized in several different ways. Given the strategic,
operational focus of our research, we adopt an outcome-based operationalization of
the creativity construct (Amabile 1983). More specifically, we are concerned with cre-
ative behaviors that are relevant to operational processes. This perspective is widely
adopted in organizational studies, where creativity can be defined as “products, ideas,
or procedures that satisfy two conditions: (1) they are novel or original and (2) they
are potentially relevant for, or useful to, an organization” (Oldham and Cummings
1996, p.608).
The creative aspect of improvisational behavior is often emphasized in the
literature (Barrett 1998, Crossan 1998, e Cunha et al. 1999) in that the character of
11

novelty is one of the most salient and striking features of improvisation in its artistic
as well as organizational manifestations. However, not all creative behaviors can be
characterized as improvisation. More specifically, improvisation studies of interest
describe generation of novel solutions to face a previously unknown event (Vera and
Crossan 2005). In organizations, the expression of creativity often takes the form of
the partial or total modification of an established process or routine, and involving the
conception of a non–predefined way to reach the goal of customer satisfaction. Cre-
ativity is, in a sense, the substantive aspect of improvisation, answering the question
of what class of behaviors can be conceptualized as improvisation.
1.2.2 Spontaneity
When engaging in improvisation, “individuals must respond in the moment
to stimuli” (Crossan 1998, p.595). Spontaneity involves the minimization of the re-
sponse time to an unexpected occurrence. This dimension highlights the fact that
the specific actions are not, by definition, planned in advance, although improvisers
often have a “repertoire” from which they draw elements to craft an effective action.
Thus, the conception and the enactment of a behavior have to be extremely close in
time (e Cunha et al. 1999). A service employee can develop a creative solution to a
customer problem but can take the time to consult with managers, gather additional
information, and think about the best course of action. These steps may well involve
a high degree of creativity, but they resemble more going back to the drawing board
and planning a new response rather than the improvisation of an action. In other
words, creativity is a necessary but not sufficient condition to define improvisational
behaviors.
Therefore, in agreement with Moorman and Miner (1998a) and Vera and
12
Crossan (2005), we include in our definition a temporal component to our Serv–IC
construct. If the creative component qualifies the construct in a substantive way—
answering the question of what constitutes improvisation—the spontaneity aspect
answers the question of when does a behavior have to happen to be considered im-
provised. If we operationally define the response time as the amount of time between
the unplanned event and the enactment of behaviors that counteract or accommo-
date the perturbing event, then we can qualify a behavior as improvisational. In this
case, the response time is perceived to be relatively short, tending toward a real–time
response, by the service delivery personnel and/or by the customer.
However, in contrast to some early theory of improvisation (Moorman and
Miner 1998a,b), we consider spontaneity as one dimension of improvisation rather
than encompassing the entire construct space. In fact, while improvisational behav-
iors are always spontaneous by definition, spontaneous behaviors can occur without
necessarily constituting improvised behaviors, such as when normal socially accepted
responses are elicited.
1.2.3 Bricolage
Bricolage occurs when an individual or a group crafts a response to an unfore-
seen situation by rearranging the material (e.g., emergency funds) and immaterial
(e.g., social norms) resources at their disposal. It represents a response construc-
tion/production aspect and answers the question of how an improvisational response
has to be crafted to be considered as such. Namely, the improvised behavior has to
be crafted with the resources immediately available to the performer, in contrast to
relying on the procurement resources that are specifically conceived for the task at
hand.
13

The idea of bricolage, which comes from cultural anthropology, postulates
that social interactions are shaped by the material and immaterial resources available
in the environment (Levi-Strauss 1968, Brown and Duguid 1991) and therefore the
characteristics of the interactions that arise are contingent to environmental factors.
Bricoleur is the French word for tinkerer. The main capability of the bricoleur is
that of creating the means to achieve an end with the resources available, often using
them in a way that they were not designed for (Bansler and Havn 2003, Baker and
Nelson 2005). Several researchers highlight the importance of bricolage activities in
improvisation, emphasizing how improvised behaviors often entail the reconfiguration
of available resources, as driven both by time pressures and availability constraints
(Weick 1998, Ciborra 1999, e Cunha et al. 1999).
This construct has been studied by management scholars in different contexts,
and has at times been referred to as encompassing the entire theoretical space of
improvisation (Eisenberg 1990, Weick 1993) or being a completely separate, although
often co–existing, activity (Ciborra 1999, Baker et al. 2003). As the conceptual de-
velopment of the constructs of improvisation and bricolage progressed, many authors
realized that the idea of bricolage should be included as a constitutive part of the
definition of improvisation (Hatch 1997, Orlikowski and Hofman 1997, Weick 1998).
e Cunha et al. (1999), for example, highlight that the ability to improvise has to in-
clude “the ability to build solutions from available (vis–a–vis optimal) resources, i.e.
bricolage” (e Cunha et al. 1999, p.302). We agree with these authors that whenever
improvisational activities occur, they have to draw upon immediately available tan-
gible and intangible resources, indicating that some form of bricolage is part of the
improvisation construct. On the other hand, bricolage can happen in non-spontaneous
ways and can involve various degrees of planning, indicating that bricolage alone is
not sufficient to define the concept of improvisation.
14

Bringing together the three elements introduced in this section, Section 1.3
discusses the concept of Service Improvisation Competence (Serv–IC), and builds a
construct definition based on the dimensions of Creativity, Spontaneity, and Bricolage.
1.3 Improvisation Competence in Services
The relationship between customer–induced variability and operational effi-
ciency has been the focus of much of service research in operations, as described by
the seminal work of Chase (1978). Chase’s (1981) customer contact model offers
a way to design service delivery systems that reduce such variability by decoupling
those aspects of the process that can be performed in the back office from those that
need to be performed in the presence of the customer (Chase and Tansik 1983, Chase
et al. 1984, Kellogg and Chase 1995). Chase and colleagues contend that the efficiency
of the service delivery system is inversely related to the proportion of total service
production time spent in contact with the customer.
Adopting a different point of view, an important stream of research (mostly
in operations and marketing) has been concerned with the effectiveness of service
systems, namely with the customers’ perceptions of service quality, because such
perceptions are what ultimately determines the sustained success of a service firm
over time (Parasuraman et al. 1988, Bitner 1990, Roth and Jackson III 1995, Soteriou
and Zenios 1999). The dominant model in the assessment of service quality is linked
to the perspective offered by Parasuraman et al. (1988) in the development of the
SERVQUAL instrument. The conceptual framework underlying the idea of service
quality proposed is that customer satisfaction ultimately depends on the perceived
discrepancy between expected and realized performance of the system. Therefore,
the strategy chosen by service firms is how to manage customer–induced uncertainty
15

and, in turn, how it interacts with customer expectations to determine satisfaction
and, ultimately, profitability.
Figure 1.2 shows a framework developed by Frei (2006) to classify different
strategies to manage customer–induced variability. The horizontal axis reports the
cost to serve, which we can interpret as a measure of efficiency. The more we move
right on the axis, the less the service operations will be working efficiently. On the
vertical axis, the quality of the customer experience is given, which refers to the effec-
tiveness aspect of service delivery. The more we move up, the more the service delivery
system is designed to exceed customer expectations. On the main diagonal we find
the classic strategies of “accommodation” and “reduction of variability” (Frei 2006).
Service firms can manage the variability by reducing it, by creating a standardized
service which offers a low–cost, low–quality experience, or they can create a person-
alized, high–cost service. However, the “Holy Grail” of service operations is to move
above that main diagonal and, therefore, reap the benefits of both high quality and
low cost. If service companies that adopt a classic accommodation strategy can find a
way to decrease their cost without reducing the quality of the experience, they would
be able to move to the “Low–Cost Accommodation” semi–quadrant. Conversely, if
a company is employing a classic reduction strategy can find a way to increase the
quality of the service experience without increasing their costs, they can move to the
semi–quadrant labeled Uncompromised Reduction.
Frei (2006) suggests several strategies to achieve both goals. One typical way
to increase the quality of the experience without significantly increasing the costs is
to target a very specific market and offer a high quality product to a highly uniform
segment. Shouldice Hospital (Heskett 1983) is a famous example in the operations
management literature of this strategy. On the other hand, companies focused on
accommodation can reduce their cost by hiring a large number of unskilled workers,
16

which cost less and can provide answers to all sorts of special requests. We refer the
reader to Frei (2006) for a more detailed and comprehensive analysis of cost–reducing
and experience–enhancing devices.
Figure 1.2: Addressing Customer-Induced Variability
Adapted from Frei (2006)
We propose that the use of improvisation can effectively accomplish both of
these goals, by significantly reducing operating costs and increasing customer experi-
ence. On the one hand, improvisation can be used to reduce the costs of accommoda-
tion strategies by enabling service employees to find new ways of managing customers
requests, therefore moving from a classic accommodation towards a low–cost accom-
modation strategy. In the classic accommodation strategy, service companies usually
try to customize the service by providing a vast array of choices to their customers
and designing service processes to deliver each customized solution in a consistent and
17

repeatable way. By allowing improvisation, service companies can leave the details
of the delivery of personalized service to the service delivery personnel and therefore
reduce the complexity of the operations. An example of this strategy can be seen in
restaurants that allow chefs to make modifications to the items on the menu at the
customer’s request.
On the other hand, improvisation can be used to enrich the experience of the
customers, without necessarily increasing costs. Allowing servers to freely interact
with customers and to adapt their behavior to each customer’s characteristics can
significantly increase the quality of the service experience, without necessarily in-
creasing the customization of the service itself. An example of this strategy can be
seen in the airline company Southwest Airlines (Heskett 2003, Heskett and Sasser Jr.
2010). While SWA flight operations are extremely standardized and streamlined,
customer–contact employees are allowed to joke and have fun with customers as they
please, therefore creating a unique brand–specific experience.
So far, few papers have specifically addressed the concept of improvisation in
relationship to services. John et al. (2006) use the jazz metaphor to highlight char-
acteristics of services that make them suitable for improvisational activities. Com-
plexity, variability, and customer involvement are the primary dimensions considered.
They highlight the importance of a basic structure, of employee knowledge and orga-
nizational culture on the outcome of services as performances. e Cunha et al. (2009),
based on similar premises, argue that improvisation can be an important component
of service recovery. Given the intrinsic duality of improvisation, which is at the same
time “about plans and rules, but also deviation and exception” (p. 664), this con-
cept appears particularly fit to a situation in which the planned process fails and an
alternative way of delivery must be selected on the spot. In contrast, we address the
systemic role of Serv–IC in service delivery itself.
18

Building on our previous discussion of the dimensions of organizational impro-
visation, we we offer an operational definition of Service Improvisation Competence
(Serv–IC) as the systemic ability of service firm’s employees to deviate from estab-
lished service processes (creativity) in order to timely respond to unanticipated events
(spontaneity), using the available resources (bricolage).
Given the potentially important role that possessing the ability to improvise
can have on service delivery, our goal is to advance a theoretical model that system-
atically analyzes the influence of a wide set of service and strategic operational design
choices on the development of Serv–IC. The next section attempts to reach this goal
by formulating a set of propositions that link relevant service strategy design choices
to the ability to successfully improvise during service delivery.
1.4 The Design of Service Improvisation
Competence
The systemic ability of service employees to engage in meaningful improvi-
sation does not arise as a response to variability and uncertainty unless the service
delivery system design choices are carefully aimed at developing this specific com-
petence. We, therefore, propose a model of service delivery system design choices
necessary to the development of Serv–IC.
Service researchers have proposed that in order to provide the desired expe-
rience, three elements have to be consistently aligned in services (Roth and Menor
2003b): (1) the targeted market, (2) the bundle of offerings (service concept), and
(3) the service delivery system design choices. Service system design choices, which
are the ones responsible for the characteristics of day–to–day interactions with cus-
19
tomers, make the most substantial impact on the ability of the system to adapt to
customer–induced variability; therefore, they are the main concern of our theoretical
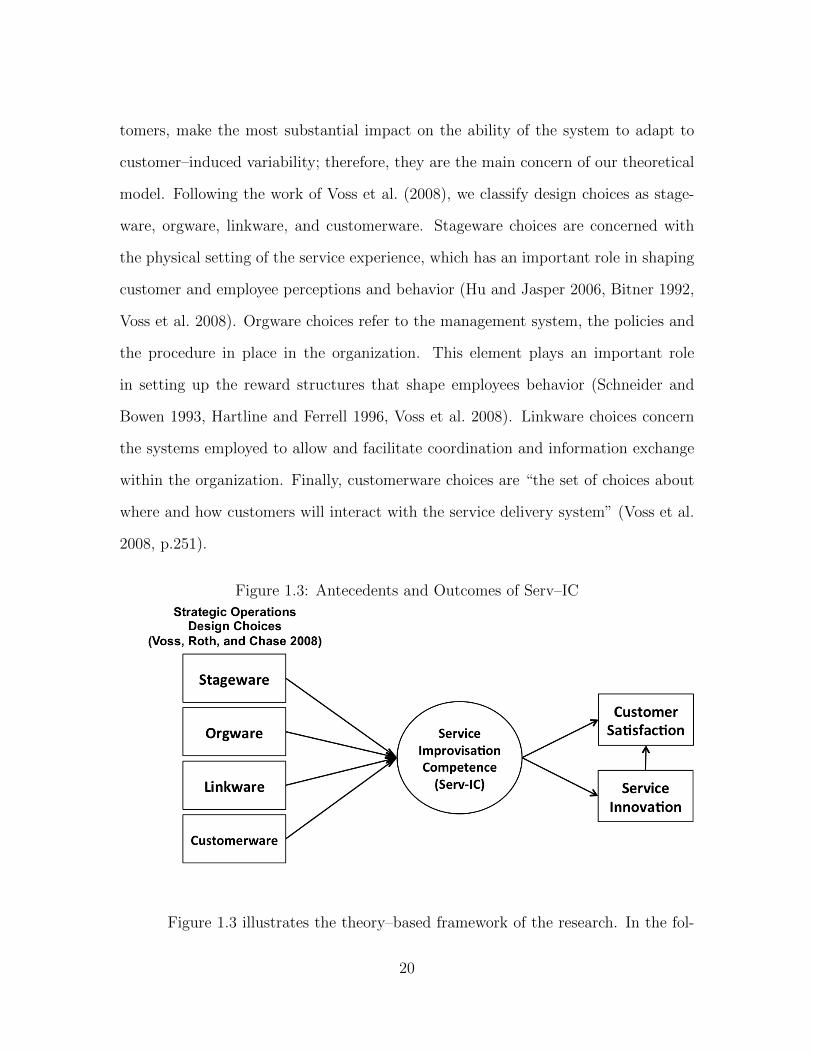
model. Following the work of Voss et al. (2008), we classify design choices as stage-
ware, orgware, linkware, and customerware. Stageware choices are concerned with
the physical setting of the service experience, which has an important role in shaping
customer and employee perceptions and behavior (Hu and Jasper 2006, Bitner 1992,
Voss et al. 2008). Orgware choices refer to the management system, the policies and
the procedure in place in the organization. This element plays an important role
in setting up the reward structures that shape employees behavior (Schneider and
Bowen 1993, Hartline and Ferrell 1996, Voss et al. 2008). Linkware choices concern
the systems employed to allow and facilitate coordination and information exchange
within the organization. Finally, customerware choices are “the set of choices about
where and how customers will interact with the service delivery system” (Voss et al.
2008, p.251).
Figure 1.3: Antecedents and Outcomes of Serv–IC
Figure 1.3 illustrates the theory–based framework of the research. In the fol-
20
lowing section, we develop a set of propositions that detail the specific characteristics
of the design choices leading to Serv–IC, as well as their outcomes.
1.4.1 Stageware
Stageware refers to the physical setting in which the service experience takes
place. This set of choices, which is commonly referred to in the service operations
literature as structural choices (Roth and van der Velde 1991a, Roth and Jackson III
1995, Roth and Menor 2003b), concerns the design of the layout of the facilities as
well as a wide array of other physical attributes of the service setting, such as colors,
furniture, decorations, technology, etc.
The importance of such design elements has been recognized in other dis-
ciplines as well. Most notably, in marketing Bitner (1992) coined the term “ser-
vicescape” to denote the physical setting of service delivery and highlight the im-
portance of physical clues in shaping the feelings and the actual behaviors during
the service encounter. To allow for improvisation, we argue that the stageware must
accomplish two important goals. First, it should allow visibility of the entire “stage”,
so that the employees can easily and promptly identify problems that need special
handling. Second, the design of the physical space must be such that a wide variety of
resources (e.g., material resources such as physical goods, as well as help from other
employees or a superior) is easily accessible.
Service companies have long discovered the importance of visual and other
indicators that allow employees to assess the current state of the delivery system (e.g.,
in a restaurant, clear indicators of what tables have already placed their orders are
easily seen). To successfully engage in improvisation, the service delivery personnel
have to be able to easily assess the condition of the system, possibly at a glance, to
21

be able to take appropriate corrective action if necessary. Where a problem is not
easily identifiable, corrective actions are likely to be late or never taken.
Once a problem has been identified, the ability of the service employee to im-
provise a response is related to the resources available in the immediate surrounding.
That is, the ability to engage in bricolage is enhanced by the abundance of resources
in the immediate environment. Moreover, the ease with which such resources can be
accessed will have a strong influence on the speed of the response and, therefore, on
the ability to shrink the time lapse between an incident and the improvised response.
Therefore, a service environment designed in order to allow employees to have
rapid access to a wide set of resources will increase the ability to engage in improvi-
sational behaviors.
Proposition 1. Stageware design choices that promote a physical envi-
ronment, which is transparent to employees and allows for rapid access to
resources increase the relative degree of service improvisation competence.
1.4.2 Orgware
Orgware refers to the management system, the policies and the procedures in
place in the organization (Voss et al. 2008, p. 251). Orgware choices—which are
analogous to infrastructural choices in traditional service design literature—concern
the design of incentives (such as bonuses and penalties) and HR practices (such as
hiring and training), as well as the general managerial policies that influence the
behavior and the interactions of individuals across the organization. Roth et al.
(1997) refer to the synergies among the HR policies as the “virtuous cycle,” which
links job training and education with recognition and employee involvement.
In general, orgware design choices for Serv–IC should be such as to promote
22

and reward proactive behaviors focused on solving customer problems above all else.
To do so, employees should be provided with the freedom to act without fear of
negative repercussions as well as with a deep knowledge of the system that allows
them to effectively intervene on it.
Indeed, service literature has emphasized the positive effects that the empower-
ment of customer-contact employees can have on service delivery (Bowen and Lawler
1992, Hartline and Ferrell 1996). In our research, empowerment is defined as “a
process of enhancing feelings of self-efficacy among organizational members through
the identification of conditions that foster powerlessness and through their removal
by both formal organizational practices and informal techniques of providing efficacy
information” (Conger and Kanungo 1988, p.474).
The idea of empowerment involves the delegation of responsibilities and deci-
sions to lower levels of the organization, such that much decision–making concerning
service delivery is made by the contact personnel without consulting higher levels of
the organizational hierarchy (Bowen and Lawler 1992). Although empowering ser-
vice employees is necessary to allow them the initiative to engage in improvisation,
a simple delegation of decisional responsibilities is not in itself sufficient. In order to
possess really empowered service workers, the human capital of the firm has to be
developed in such a manner as to provide them with the knowledge and the attitudes
that allow them to make the relevant decisions.
The human capital of a firm is constituted by those characteristics of its em-
ployees, such as skills and specific knowledge, that contribute to the performance of
the firm itself (Roth and Jackson III 1995). The theory of human capital has its
origins in economics with the study of the influence of education on the wealth of
nations, seen as an investment in increasing the capabilities of the people (Schultz
1960, 1961). One of the goals of that early research was to stress that, given the
23

increasing importance of the human factor in production performance compared to
material capital goods, human capital development has to be seriously considered as
an investment rather than a cost, as it is often done. The leap to extending this form
of reasoning to a firm’s internal human capital is not a big one, and a substantial body
of research has developed the implications of human capital management for a firm’s
sustainable competitive advantage (for a review of the relevant literature, see Stiles
and Kulvisaechana 2003). By adopting a resource-based view of the firm (Barney
1991), it is possible to argue that the employment of human resource practices that
increase the stock of a firm’s human capital can and often does yield a sustainable
competitive advantage to the firm, creating a bundle of competencies that is difficult
to imitate (Lado and Wilson 1994).
In particular, the development of a service improvisation competence relies
heavily on the ability of employees to generate variations on the service processes,
which is closely linked with their knowledge of the process itself, the reasons behind
the design choices and their understanding of how the different parts that constitute
the system interact with one another. Without such knowledge, an attempt to impro-
vise would result in chaos rather than in purposefully directed improvisation. Failing
to understand the inner workings of organizational structures and their environments
have been shown to generate disastrous outcomes by scholars of sensemaking in or-
ganizations (Weick 1990, 1993)1. Although in many environments the cost of losing
perspective on the whole system is not likely to have such catastrophic outcomes as
the ones discussed by Weick, these studies offer an important perspective on organi-
zational dynamics. The knowledge of the organization and its processes constitutes
a fundamental basis on which employees can build their improvisations.
1These papers provide a description of the events leading to the Tenerife air disaster—in whichtwo airplanes collided resulting in the death of 583 people—and to the Mann Gulch disaster—whereseveral smokejumpers lost their life.
24
Human capital can be increased by acquiring it from outside the firm, by devel-
oping it internally, or, more frequently, by a combination of both. Therefore, we focus
our attention on hiring and training practices, which are the main ways to acquire
and form human capital in service businesses (Skaggs and Youndt 2004). Goldstein
(2003) and Roth et al. (1997) showed that employee development and training play
a significant role in allowing service employees to better use the service delivery sys-
tem to produce customer satisfaction. We argue that one of the mechanisms through
which the increased performance is achieved is the development of Service Improvi-
sation Competence (Serv–IC). Similarly, hiring employees with extensive experience
and knowledge of the specific service will likely increase their ability to adapt the
processes to better achieve the desired goals, the previous experience likely increas-
ing employees’ exposure to different design solutions to similar problems, thereby
increasing their ability to generate variations.
Finally, we include the consideration of attitude in hiring decisions as a part of
the human capital concept. A common belief in high–contact services environment is
that the service firm should focus on behavioral aspects and personality in the hiring
process and then provide the training. Several successful service companies found
their hiring practices on this principle (Heskett and Sasser Jr. 2010). Although there
is some uncertainty about the link between this practice and financial performance
outcomes, we argue that if the goal of the service company is to develop Serv–IC,
employee attitudes are an important element - along with skills and knowledge—to
be considered in the hiring decision. Previous research indeed suggests that attitudes
are a significant predictor of spontaneous, extra–role behaviors (George and Brief
1992). Investment in screening for employee attitudes as well as knowledge and
skills, therefore, qualifies as an investment in human capital in high–contact service
environments.
25
Proposition 2. Orgware design choices that promote employee–empowering
management practices act to increase the relative degree of service impro-
visation competence.
1.4.3 Linkware
Linkware choices concern the systems employed to allow and facilitate coor-
dination and information exchange within the organization (Voss et al. 2008). Often
referred to as integration choices (Roth and Jackson III 1995), the design elements
included in this category concern the physical as well as organizational structures
that allow information flows to freely circulate across organizational levels as well as
between members at the same hierarchical level.
Information flows play an important role in the development of Serv–IC and
combine with other elements, reinforcing them and enabling the effectiveness of other
design choices. Without appropriate information, it can be a daunting task to iden-
tify a problem, and access to information can be an important asset in crafting an
appropriate response. The availability and accessibility of information, therefore, re-
inforces the availability and accessibility of resources, thereby empowering the service
worker to identify and solve potential problems.
We argue that systems designed to incorporate frequent information exchange
activities as well as the presence of information systems that allow for the rapid
storage and retrieval of information possess a higher level of Service Improvisation
Competence. Some of the most successful service companies have long discovered
the importance of sharing information about the workings of the service delivery
processes at regular scheduled intervals. At the Ritz–Carlton Hotels, for example,
morning lineups and other personnel meetings serve both the purpose of setting up
26

appropriate operations for the day to come and discussing the performance of the
previous day (Hemp 2002). Such regular information exchanges can both prepare the
employees to deal with unusual situations by providing advance warnings as well as
enrich their arsenal of responses by sharing successful actions among peers.
Similarly, the role of technology in services has been widely analyzed (Huete
and Roth 1988, Roth and van der Velde 1989, 1991b, Roth et al. 1996, Harvey et al.
1997, Bitner et al. 2000, Froehle and Roth 2004). This research has shown that in
addition to providing automation to the less contact–intensive parts of the service
delivery process, the implementation of IT systems can provide a useful role in the
dissemination and accessibility of information. As such, it can prove a valid instru-
ment for service employees both in realizing that an unusual situation is materializing
as well as in enabling them to intervene in a timely fashion. In addition, the literature
on the role of information systems in organizations indicates that their presence often
provides support for innovative solutions (Zheng et al. 2011) and allows for rapid
responses during emergencies (Arora et al. 2010).
Proposition 3. Linkware design choices that facilitate a rapid and consis-
tent diffusion of information in the organization act to increase the relative
degree of service improvisation competence.
1.4.4 Customerware
Customerware “is the set of choices about where and how customers will in-
teract with the service delivery system” (Voss et al. 2008, p.251). This aspect of the
service system design plays an important role in shaping the customer experience.
The characteristics of the encounter are directly shaped by the constraints to the
employee and the customer behaviors, especially concerning the degree to which the
27

interaction moves along predetermined patterns. In other words, one of the main
concerns of customerware design choices is how much of the encounter responds to
a prescribed script and what the form of that script is. In general, “a performance
programme, or script, is a pattern of behavior or an operating routine that is trig-
gered by some environmental stimulus.” (Tansik and Smith 1991, p. 35). In service
environments, both the service employee and the customer play some sort of script:
defined by the service firm for the employee and defined by cultural factors and norms,
as well as by the service company itself for the customer. Previous research on script-
ing in service encounters demonstrates that it can play a significant role in customer
satisfaction outcomes (Victorino 2008, Victorino et al. 2008).
The design of the scripts that inform the server behavior is one of the key
aspects in the development of an improvisation competence: it is important to high-
light how the absence of a script results in chaos rather than in a disciplined effort
to improvise. When improvisational activities occur, some aspects or the totality of
a script is modified in order to satisfy a customer (e.g., a restaurant customer asking
for an item not in the menu). These notions imply that, in order for an activity to
qualify as improvisation, an underlying process has to be identifiable and discernible.
From a functional perspective, the process that underlies the improvisation activity
plays an important role, similar to the song structure in musical improvisation (Bar-
rett and Peplowski 1998). Scholars of organizational improvisation have highlighted
how the common knowledge of processes plays an important role in sensemaking (i.e.,
the ability to make sense of the current situation). The deviation from the process is
effective only if both the other service delivery personnel and the customers can make
sense of the situation (Weick 1995). Furthermore, the shared structure provided by
organizational processes serves an important coordination purpose. All the partici-
pants in the process have to make the required adjustments after the improvisation
28
has started (Barrett and Peplowski 1998, e Cunha et al. 2009).
In general, the more the detailed and rigid scripts, the more the service em-
ployee can operate mindlessly (Tansik and Smith 1991). If this can, on the one hand,
mean that conscious cognitive resources are free to engage in other tasks—such as
a conversation with the customer—while the server is executing the script. On the
other hand the habit of following a script can make the server less receptive to disrup-
tive inputs, one of the causes of service failures (Stewart and Chase 1999). Moreover,
scripted interactions are often reported to leave the customer with a sense of lack
of authenticity and empathy on the part of the service employee (Victorino et al.
2008). In general, the more detailed and rigid a script, the higher its complexity and
divergence (Shostack 1987), the less likely the employee will be to engage in impro-
visation. However, when scripts are too rigid or complex, service employees can find
themselves unable to operate according to the requirements of the predefined routines.
Hence, an excessive amount of scripting should result in an increase in improvisation
rather than in high standardization. Following the terminology created by Mintzberg
(1978), excessive reliance on planning and control results in a discrepancy between
the intended and realized strategies.
The challenge of operations design is to find the sweet spot between rigidity
and agility that works for the service concept and the target market (Menor et al.
2001). Although we expect that the optimal level of scripting will differ radically
among services, we can conceptualize the optimal level of script flexibility and com-
plexity as in between the two extremes. We hypothesize a nonlinear relationship
between the degree of scripting and ability to improvise. Therefore, we propose that
the relationship between the degree of scripting and improvisation competence fol-
lows a nonlinear relationship of the form highlighted in Figure 1.4. When service
delivery processes are loose and not binding, the organization will exhibit—ceteris
29

paribus—a higher degree of improvisation competence: the processes are explicitly
designed to allow service employees to find ad-hoc solutions to the contingencies of
the service delivery. Increasing the amount of scripting in the operations can effec-
tively accomplish the goals of increased control and standardization, reducing the
amount of improvisation in the system. However, this strategy works only up to a
certain point. When processes become too complex and too rigid, service delivery
employees increasingly find themselves in the condition of not having the ability to
follow excessively complex instructions or not being able to satisfy a customer due to
the rigidity of the delivery processes. In this case, the amount of improvisation in the
system is likely to increase notwithstanding the intentions of the service designer.
Figure 1.4: Hypothesized Relationship between Scripting and Improvisation
Ser
vice
Impr
ovis
atio
n C
ompe
tenc
e
Degree of Scripting
Minimal Scripting: the delivery system is designed to allow
personal initiative and improvisation
An increase in scripting effectively reduces improvisation thereby increasing managerial
control and standardization
Too much scripting: employees have to deviate from codified processes in order to perform
their job
Proposition 4a. Customerware design choices that rely on minimal script-
ing are associated with a higher relative degree of Service Improvisation
30
Competence, in comparison to a moderate degree of scripting.
Proposition 4b. Customerware design choices that impose an excessive
degree of scripting are associated with a higher relative degree of Ser-
vice Improvisation Competence, in comparison to a moderate degree of
scripting.
1.5 Outcomes of Service Improvisation
Competence
There are two recurring elements in the literature that address the outcomes
of improvisation: the ability to adapt to unforeseen events and the generation of inno-
vations. It has been noted that when service delivery employees—or, more generally,
any kind of workers—are enabled to take charge and devise a way to solve problems
without necessarily adhering to strict procedures, the organization exhibits a higher
degree of flexibility and adaptability (John et al. 2006, Akgun et al. 2007, e Cunha
et al. 2009, Zheng et al. 2011). Therefore, it has been argued that improvisation can
potentially be a very effective tool in high–contact service delivery, given the impor-
tance of adapting to the idiosyncrasies of each customer (John et al. 2006, e Cunha
et al. 2009).
Similarly, the experimental nature of improvisational activities has been often
linked to what is usually referred to as organizational learning (Miner et al. 2001,
Vendelø 2009). Exploring novel solutions to recurring or new problems is often an
important source of the development of new products, processes, or service offerings
(Menor and Roth 2007, 2008a). Moorman and Miner (1998b) argue that organiza-
tional memory—whether in the form of procedures or explicit knowledge—moderates
31

the effect of improvisation on the generation of novel outcomes. Indeed, further stud-
ies show that long–term knowledge is usually only a byproduct, although a potentially
very useful one, of improvisation (Miner et al. 2001). In this section we analyze these
two important outcomes of improvisation in service environments. Subsection 1.5.1
will develop the arguments for Serv–IC leading to an increase in innovations, and
subsection 1.5.2 will argue the role of a Serv–IC in increasing the level of customer
satisfaction, with a discussion of contingent elements of the service system that influ-
ence such relationship.
1.5.1 Service Innovation
The main goal of improvisation is short–term adaptation to contingent events.
It is not, therefore, geared towards the creation of permanent solutions to recur-
ring problems, or in general toward the creation of long–term organizational learning
(Moorman and Miner 1998b, Miner et al. 2001). However, given the right condi-
tions, improvisation can have a substantial influence on organizational routines as
well as on the service offering; by providing a constant source of possible variations,
introducing improvisation in a service system is equivalent to increasing the muta-
tion rate of a gene, by increasing the likelihood that a mutation will perpetuate in
the system. In particular, the success of improvisation in creating new knowledge
that has a long–term effect on the firm will likely depend on the company’s general
approach to innovation, and the ability of the firm to capture this knowledge (Roth
and Marucheck 1994). A constant and consistent use of improvisation can generate
the raw material for innovation in a similar way to what Cohen, March, and Olsen
described as a “garbage–can model” (Cohen et al. 1972): some of the devices dis-
covered through improvisational activities can be effective in solving a broader set
32

of problems than the contingency for which they were devised. The ability of the
organization to successfully recognize and incorporate these innovations into their
processes—some sort of internal absorptive capacity (Cohen and Levinthal 1990)—is
what determines the effectiveness of improvisation in generating new processes and
developing new services to customers.
Indeed, the study of improvisation has been often conducted with respect to
the achievement of innovative outcomes (Miner et al. 2001, Akgun et al. 2007). The
continuous experimentation that characterizes improvisation is likely to result in the
development of new solutions to recurring problems, thereby increasing the number
of innovations in the service delivery system. Consistent with previous literature, we
consider two types of innovations (Roth 1993): process innovations are those that
change delivery service processes and routines in order to improve delivery, reduce
cost, gain efficiency, or increase flexibility; service offering innovations are new services
that satisfy previously unmet customer needs. Improvisation is likely to result in
process innovations because the attention that the employee is required to focus on
the failings of processes already in place, and the effort to overcome such failings. To
a lesser extent, Serv–IC is likely to result in increased awareness of the inadequacy
of current service offerings to satisfy various customer needs. This process requires
a larger number of steps and the deliberate creation of procedures that allow to first
recognize and then fulfill an unmet customer need.
On the other hand, the creation of a system which constantly mutates service
delivery routines can lead to an unwanted “drift” of organizational routines away from
their original conception—practices can change gradually in order to adapt to con-
tingencies until they become completely different from the planned behavior (Miner
et al. 2001, Vendelø 2009). In this case, while improvisation does increase the amount
of innovation in the system, the effects of such innovation activities are likely to be
33

counterproductive. It is one thing to have a system that allows for variations in pro-
cedures in order to better meet the desired goal (useful improvisation), and a different
one to have procedures that are never followed, leading to a situation of chaos. This
problem, which has been framed in terms of “too much exploration” (March 1991,
Vendelø 2009), can derive from two main sources. First, the processes themselves can
be ill–designed to achieve the desired goal. In this case, similar to the problem of
excess scripting, the viable alternative for service workers to satisfy customers is to
improvise and devise a new way to deliver the service. Second, the workers them-
selves might not have the necessary abilities to perform the processes correctly, and,
therefore, they have to improvise in order to reach their goal. Therefore,
Proposition 5. Developing a Service Improvisation Competence acts to
increase in the number of process and service offering innovations.
1.5.2 Customer Satisfaction
The performance of the service delivery system is often defined according to
the expectation paradigm, which postulates that the customer satisfaction with the
service encounter is measured as the gap between the expectations about the ser-
vice characteristics and the actual perception of the service(Parasuraman et al. 1988,
1991). We propose that, in general, the higher the ability of the service system to
adapt to the customer requests, the higher the customer satisfaction. Indeed the ser-
vice literature is very clear in suggesting that the ability to adapt and be responsive
to customers can lead to a competitive advantage for high–contact services (Bitner
1990, Price et al. 1995, Menor et al. 2001, Iravani et al. 2005, John et al. 2006). Fur-
thermore, the engagement in improvisational practices is likely to shift the customer
perceptions of the motives of the service delivery personnel, which, in turn, contribute
34

to the feeling of a satisfactory service experience. This assertion is consistent with
the insights provided by attribution theory (Bitner 1990). However, previous research
shows mixed results when analyzing the effects of constructs that occupy a theoret-
ical space close to that of improvisation. Hartline and Ferrell (1996), for example,
show no significant influence of service employee adaptability on customer satisfac-
tion. Moreover, a large body of research highlights the importance of efficiency gains
in service operations, and the negative effects of human–induced process variation on
service outcomes (Levitt 1972, Chase 1978, Heskett et al. 1994, Stewart and Chase
1999, Xue and Harker 2002).
We previously discussed how the use of improvisation can be a way to break
the trade–off between operational efficiency and adaptability, and move above the
service/cost diagonal described by Frei (2006). However, the contradictory findings
on the relationship between adaptability and customer outcomes suggest that there
are likely to be contingencies that qualify the improvisation–customer satisfaction re-
lationship. Service operations literature suggests that the service concept, the target
market, and the service delivery system should be aligned in order to successfully
realize the intended service strategy (Roth and Menor 2003b). Therefore, when de-
ciding how much improvisation to allow in the service system, the most important
question is: What kind of experience is the customer looking for? Depending on
the service concept and the target market, customers are likely to expect different
levels of emotional engagement as well as different levels of improvisation on the part
of service delivery employees. The discrepancy between such expectations and the
actual delivery is likely to result in a dissatisfied customer.
Particularly important elements of this perceived discrepancy are represented
by: (1) the amount of improvisation allowed in the service delivery system vis a
vis the expected efficiency of the service delivery, and (2) the amount of emotional
35
engagement that the service is supposed to elicit in the customer, where we can picture
a low degree of engagement as a purely transactional interaction and a high degree
of engagement as what is referred to as an experience-centric service (Zomerdijk and
Voss 2010, Pullman and Gross 2004).
There are different ways to go about designing the service delivery when the
service concept is built around a high level of customer engagement: one extreme is to
carefully choreograph every aspect of the experience (i.e., no improvisation allowed),
thereby controlling the cues that are expected to elicit specific emotions in the cus-
tomers, and the other extreme is to allow the customer to freely interact with the
service provider in a highly authentic human relationship (Gilmore and Pine 2007).
Both strategies are viable in achieving the goal of high customer engagement, but the
resulting service experience is quite different. When variations from scripts and rou-
tines are not allowed (i.e. improvisation level is low), the resulting service experience
is a carefully controlled environment, whereby behaviors are often dictated by recog-
nizable roles and rituals (Voss et al. 2008). For example, think of the ritual of wine
pouring in high–end restaurants: in this kind of services, operations management role
is akin to that of a choreographer in a theatrical play.
Alternatively, when high improvisation is allowed, the service experience is
built around the individuality of the servers as well as the customers, and the en-
vironment is much less predictable and with a high degree of personalization and
authenticity (take for example, a traditional no–frills tavern in the heart of Rome).
Drawing from the analogy of musical performances, choreographed experiences are
like a classical concert, where each element in the orchestra plays a specific part
according to the score and the indications of the director. More personalized expe-
riences, however, are like jazz performances, where musicians adapt their playing to
what other members of the band do as well as the response of the audience.
36

At the opposite end of the customer engagement scale, we find services that
are built around high degrees of control and efficiency or services in which there is no
particular need to achieve high levels of efficiency during customer contact but are
still low–cost propositions. When customer engagement is low and and improvisation
is low, service delivery systems are designed around a classic variability reduction
strategy (Levitt 1972, Frei 2006), in which the service provided is highly standardized
and the emphasis is on efficiency; customer contact is reduced to the minimum and the
options for accommodation of special requests are almost completely absent (Chase
1981). Typical examples of this category of services include fast food restaurants
like McDonald’s. The result of this strategic positioning is a highly standardized
service. When customer engagement is low, but improvisation is high, we have a
situation in which there is no specific need to have explicit processes in place for service
delivery. This category—to which we refer to as unstructured services—comprises
simple delivery systems such as newsstands in which the contact with the customer
does not need to be standardized for the creation of value.
In general, services management literature—in particular the stream of lit-
erature that emphasizes authenticity and experience as a central aspect of modern
firm–customer relationships (Pine and Gilmore 1999, Gilmore and Pine 2007)—begins
with the assumption that customers will welcome a higher degree of flexibility on the
part of the service firms. However, services marketing literature on the outcomes
of employee adaptability is ambiguous and inconsistent across contexts and methods
(Bitner et al. 1990, Ashforth and Humphrey 1993, Hartline and Ferrell 1996). One
of the possible causes is the lack of accounting for the nature of service that the cus-
tomer is expecting. Building on these insights, Figure 1.5 introduces a typology of
services based on the amount of engagement (customer experience) and the rigidity of
procedures (degree of scripting) that will be further analyzed and empirically tested
37

in Essay 3. As our typology shows, high–quality, highly engaging service experiences
need not be the result of a personalized and always different service delivery. Indeed
some services craft highly engaging experiences with a carefully orchestrated and
executed performance. Failure to realize this important element of the service propo-
sition can lead to inconsistencies as significant as performing a jazz concert in front
of an audience expecting a classical performance. No matter how high the quality of
the jazz performance, a large part of the audience is likely to be dissatisfied.
Figure 1.5: A Typology of Services
Cus
tom
er E
xper
ienc
e H
igh
Low
Degree of Scripting Low High
Scripted Experience
(e.g. Themed Hotels)
Personalized Experience
(e.g. Boutique Hotels)
Standardized Service
(e.g. Fairfield Inn)
Unstructured Service
(e.g. Independent B&B)
We, therefore, postulate that—although generally a value added for high-
contact services—the outcome of the development of a specific service improvisa-
tion competence is contingent upon the intended service concept as well as customer
expectations.
Proposition 6a. Developing a service improvisation competence acts to
38

increase the relative degree of customer satisfaction.
Proposition 6b. The relationship between service improvisation compe-
tence and customer satisfaction is moderated by the type of service expe-
rience expected by the customer.
1.6 Conclusions
In this essay, we developed the concept of a Service Improvisation Competence
as a valid construct for building flexibility into service delivery systems and achieving
higher degrees of customer satisfaction. We postulate that the development of an
improvisation competence in service environments can be a viable way to address
the problems and exploit the opportunities generated by the variation introduced by
customers during service encounters. Drawing from the literature on organizational
improvisation as well as from the service management literature describing service de-
livery as a performance, we build a comprehensive definition that unifies the different
aspects of improvisation examined by previous authors. By characterizing the impro-
visation construct as multidimensional, we provide an operational definition that can
be easily adapted for further empirical investigations.
We then adapted this construct to the service environment, focusing on the
creation of a systemic ability of the service employees to improvise in the face of unex-
pected circumstances. Given the amount of variability that customers introduce into
the service environment, the development of a specific improvisation competence can
be found to be a viable alternative to detailed contingency planning. We, therefore,
offer the theoretical background for a series of design choices that are likely to result
in such a competence.
Finally, we developed a framework to help us understand in which situations
39

the development of an improvisation competence is a worthwhile endeavor. Our ty-
pology classifies service concepts according to the amount of improvisation allowed in
the service delivery and the amount of customer emotional engagement in the process.
Services designed to elicit a high level of emotional engagement in the customers are
considered experiential in nature (Pullman and Gross 2004).
We argue that the creation of a memorable experience does not necessarily
rely on the high degrees of adaptability and personalization that are typical of a
system with high improvisation competence but can be achieved as well with a high
degree of standardization and control. Of course the type of the resulting experience
is dramatically different: we argue that the failure to account for the differences in the
experience expected by the customer is one of the factors for the inconsistent results
in the literature examining the outcomes of customer-contact employees adaptability.
This essay contributes to the literature on service operations strategy by pro-
viding a novel integrative perspective on the design of service delivery system. It adds
to the current debate on the ability of service providers to deliver memorable experi-
ences. Furthermore, we contribute to the literature on organizational improvisation
by providing a viable operational definition of the improvisation construct, one which
integrates the insights provided by the research thus far.
Our contribution offers a different perspective on the design of service opera-
tions by broadening the designer perspective from the process itself to the multifaceted
reality of how the processes are executed and what kind of execution—instead of just
what kind of processes—is expected by the customers. We believe that this contri-
bution lays a solid foundation for the integration of important issues often associated
with marketing and strategy research in the study of service operations. Our theoret-
ical development provides a comprehensive model that can be tested in a wide variety
of service environments and, therefore, constitutes the basis for future research efforts
40

in this direction.
41

Essay 2.An Empirical Analysis of Service
Improvisation Competence:Perspectives from Hotel Employees
Abstract
In this paper, we operationalize and test the theory of Service Improvisation Compe-
tence (Serv–IC) developed in Essay 1 in hotel services. Service Improvisation Com-
petence is defined as the systemic ability of service firm’s employees to deviate from
established processes and routines in order to timely respond to unanticipated events
using available resources. Drawing from the organizational improvisation literature,
we define the construct of Serv–IC, and we propose an operational definition result-
ing in a multi–item measurement instrument that models Serv–IC as a second–order
latent variable composed of three reflective dimensions: spontaneity, creativity, and
bricolage. Then, using primary data derived from a survey of customer–contact em-
ployees working in Hotels, we test a set of service design choices that lead to the
development of a Serv–IC, as well as its effect on customer satisfaction. Our results
42

show that the relationship between strategic choices and Serv–IC is moderated by em-
ployee empowerment, and that process design plays a prominent role in conjunction
with organizational–level choices. Furthermore, we find that Serv–IC has a positive
influence on customer satisfaction in the lower–tier hotels, but a negative effect in 4
and 5 stars hotels.
2.1 Introduction
In this essay, we operationalize the construct of Service Improvisation Com-
petence (Serv–IC), and provide an empirical test of the theory proposed in Essay
1 using a sample of hotel front–line employees. We first develop the measures for
our target constructs, then evaluate their psychometric validity and finally, test the
theory proposed in Essay 1, concerning the antecedents and outcomes of Serv–IC. We
show that the development of Serv–IC can be an effective way to contrast the effects
of Customer–Induced Uncertainty on service operations, depending on the service
concept and on the service expectations of hotel guests.
Is has been a long–standing mainstay of service operations theory that the
presence of the customer in service operations is detrimental to the efficiency of the
service delivery system (Chase and Tansik 1983, Chase et al. 1984, Kellogg and Chase
1995). Therefore, much of the research in service operations has been devoted to
the streamlining of processes, which results in a seemingly never–ending struggle for
consistency and reliability (Levitt 1972, Shostack 1984, Stewart and Chase 1999).
The common–sense perspective on service design and operations is that processes
should be carefully planned and executed in order to position the service delivery sys-
tem consistently with the intended service strategy (Roth and van der Velde 1991b,
Shostack 1987). In other words, it is unreasonable to assume that “developing a new
43

service based on the subjective ideas contained in the service concept can lead to
costly trial–and–error efforts to translate the concept into reality” (Fitzsimmons and
Fitzsimmons 2008, p.71). However, the uncertainty introduced by customers into ser-
vice operations—and the resulting variance in process execution and performance—
can never be eliminated from a wide category of services, namely services that are
characterized by a medium to high degree of customer direct contact with employ-
ees, requiring a substantial dose of authenticity and personal touch during and after
service delivery.
In high contact services, frontline employees play an important role in success-
fully accommodating the uniqueness of each customer without disrupting the flow of
processes and operations. As the main point of contact between the service organiza-
tion and the customers, front–line employees are often charged with finding a balance
between satisfying the customers’ varied needs, personalities, and expectations and
abiding by the organization’s routines, procedures and governance structures.
A substantial stream of literature in strategy and organizational behavior liter-
ature has compared the role of employees who find themselves in this kind of position
to that of a jazz player who constantly tries to improvise on the melody, the rhythm,
and the harmonic structure of the composition without losing the coordination with
the other players and without compromising the coherence of the entire performance
(Eisenhardt and Tabrizi 1995, Crossan et al. 1996, Orlikowski and Hofman 1997,
Crossan 1998, Weick 1998, Lewin 1998, Moorman and Miner 1998a, e Cunha et al.
1999, Kamoche and e Cunha 2001, Kamoche et al. 2003, Vera and Crossan 2005, John
et al. 2006, Crossan and Hurst 2006, Akgun et al. 2007, Vendelø 2009, Magni et al.
2009, Zheng et al. 2011).
We argue that some companies exhibit a specific competence, which allows
them to successfully deviate from routines when necessary, in order to reach higher
44
degrees of customer satisfaction. We term this competence Service Improvisation
Competence (Serv-IC), and we formally define it as the systemic ability of service
firm’s employees to systemically deviate from service delivery processes and routines
in order to timely respond to unforeseen events, using the available resources. With
the migration of many services to online platforms, the services that provide a per-
sonal contact with the customers are increasingly focusing their efforts toward the
management of the customer experience (Pine and Gilmore 1999, Voss et al. 2008),
that is on the management of the emotions elicited by the service encounter and how
the touch–points between the firm and the customers can be appropriately designed
in order to maximize the likelihood that the customers will both return and speak
positively about the service firms with others (Bitner et al. 1990, Pugh 2001, Schau
et al. 2007).
One example of this trend can be seen in the hospitality industry, which has to
necessarily include a significant component of personal contact and customer presence
in the service provider’s facilities. During the last decade, the development of online
rating systems (e.g. Trip Advisor) and online travel agencies (e.g. Expedia.com,
Bookings.com, and many others) has increased price transparency and the circulation
of customers’ evaluations of hospitality services. This trend led to a split between
hotel companies that decided to compete on price and companies that attempt to
provide a unique and personal service to attract guests. Many large hotel chains
began to diversify their offers by creating boutique hotels, which try to replicate the
feel of uniqueness of independent, high–class properties. The goal is to create brands
that evoke the ideas of competence and care, and that are linked with high levels of
customer satisfaction. In this competitive environment, the development of a Service
Improvisation Competence (Serv–IC), which provides a tailored service with high
emotional content, can mean the difference between a guest who is willing to pay a
45

premium price for a personalized service experience and one who is not.
This paper analyzes the drivers and the customer satisfaction outcomes of de-
veloping Serv–IC using a sample of customer–contact hotel workers. We first analyze
the service delivery design choices that lead to the development of Serv–IC in terms
of facility design, human resource practices, and process design, and then we test the
effect of Serv–IC on customer satisfaction for different hotel categories (as measured
by star ratings).
Although the study of organizational improvisation has received significant
interest in the literature, formal quantitative tests of its antecedents and outcomes
are few (Moorman and Miner 1998a, Vera and Crossan 2005, Magni et al. 2009). In
addition, even if many authors have recognized the relevance of organizational impro-
visation to service delivery (Edvardsson et al. 1995, John et al. 2006, Leybourne 2009,
e Cunha et al. 2009, Daly et al. 2009), there is—to our knowledge—no quantitative
study of organizational improvisation in service environments published to date. The
theory of organizational improvisation is also ripe for a more systematic formalization
of the relationships that link the main constructs: we believe that our model of an-
tecedents and consequences adds substantially to the findings of Moorman and Miner
(1998a) and Vera and Crossan (2005) in creating a nomological network of relation-
ships that can be considered the core for a more substantive theory of organizational
improvisation.
This paper also contributes significantly to the current debate in service man-
agement literature. The creation and management of customer experiences has been
the focus of much literature in the past ten years, and the delivery of experiential
services is increasingly considered a performance similar to a theatrical play (Grove
and Fisk 1992, Pine and Gilmore 1999, Harris et al. 2003, Pullman and Gross 2004,
Stuart and Tax 2004, Voss et al. 2008, Palmer 2010, Zomerdijk and Voss 2010, 2011).
46

Moreover, the creation of scripts, and the role they should play in service delivery
is beginning to receive considerable attention as one of the most important aspects
of service design (Tansik and Smith 1991, Parker and Ward 2000, Tansik and Smith
2000, Harris et al. 2003, Schau et al. 2007, Victorino 2008, Victorino et al. 2008). Our
analysis of the role of improvisation in service delivery contributes significantly to this
line of research, addressing Serv–IC from a perspective that is unique to operations
management: the design and enactment of the processes that constitute the core of
the value creation in service environments.
This essay proceeds as follows: first, in Section 2.2, we develop our theoretical
model and present the eight hypotheses that we will then proceed to test. Section
2.3 details the data collection and the measurement instrument, Section 2.4 provides
the results of the analysis, and finally we discuss the implications of our findings and
the limitations of our research in section 2.5.
2.2 Model and Hypotheses
In this section, we delineate the main elements of our theoretical model. We
will first develop a formal operational definition of Service Improvisation Competence
(Serv–IC), which constitutes the basis for our measurement as well as providing for a
deeper understanding of the construct and its implications. Subsequently, we consider
the design choices that constitute the basis for the development of a Serv–IC. There
are two broad types of design choices: one concerns the broad choices that influence
the makeup of the labor force as well as the facility design and the HR policies,
while the other typology concerns the actual processes and routines that regulate the
workings of the service delivery.
We refer to the first as strategic operations choices and to the latter as customer–
47

Figure 2.1: Roth and Menor’s Service Strategy Triad
Adapted from Roth and Menor (2003a)
Target Market Who are the right customers?
Service Concept What is the product bundle
offered?
Service Delivery System Design
Choices How will services be delivered?
Service Encounters
What happens when service and customer meet and
interact?
contact choices. Both have a considerable effect on Serv–IC, and both have to be
conceived and implemented in a coherent and systemic way. Both strategic and
customer–contact design choices are those that determine how much of the intended
service strategy will be actually enacted as planned (see Roth and Jackson III 1995,
for a discussion of planned and realized strategie in service operations). A failure
to adopt the right set of practices and processes will result in a mismatch between
intended and realized strategy (Mintzberg 1978).
Figure 2.1 illustrates how the service encounter is the result of several factors
that concur to determine the actual behavior of employees and customers (Roth and
Menor 2003b). The desired service encounted only happens if the service delivery
system design choices (stageware, orgware, linkware, and customerware) are in line
with the service concept (what kind of service is delivered) and if the interplay be-
tween those two elements is attuned to who the customers are. In the context of
this study, if the goal of the service system is to deliver a personalized, emotionally
48

engaging service experience, then a set of design choices that lead to the development
of a Service Improvisation Competence is a viable solution. However, if the customers
exhibit only a low level of variability in their requests and expectations, the service
encounter will not be characterized by high levels of improvisational behaviors. Sim-
ilarly, if the customers introduce a considerable amount of variability but the service
delivery system design choices are not coherent with the development of a Serv–IC
(e.g. employees are penalized if they do not strictly follow procedures), then the en-
counter will not be characterized by high degrees of improvisation. In other words,
the entire system should be designed and implemented in a coherent manner in order
to achieve the desired goal.
Figure 2.2 illustrates our research model and the hypotheses that we intend to
test. On the left, we have the service delivery system design choices which influence
Serv–IC. In particular, if the design choices are conceived and implemented in order
to generate an engaging customer experience, they should result in higher levels of
Serv–IC. Similarly, an experiential service concept will be related to the design choices.
The third element—the characteristics of the target market—is represented by how
much uncertainty is introduced in the system by the customers (which influences the
amount of improvisation in the system) and by the hotel star rating, which is an
indication of the characteristics of the market, influencing the effects of Serv–IC on
customer satisfaction.
The following section will discuss the constructs and their relationships in
further detail, and formally derive the hypotheses that will be tested in Section 2.4.
49
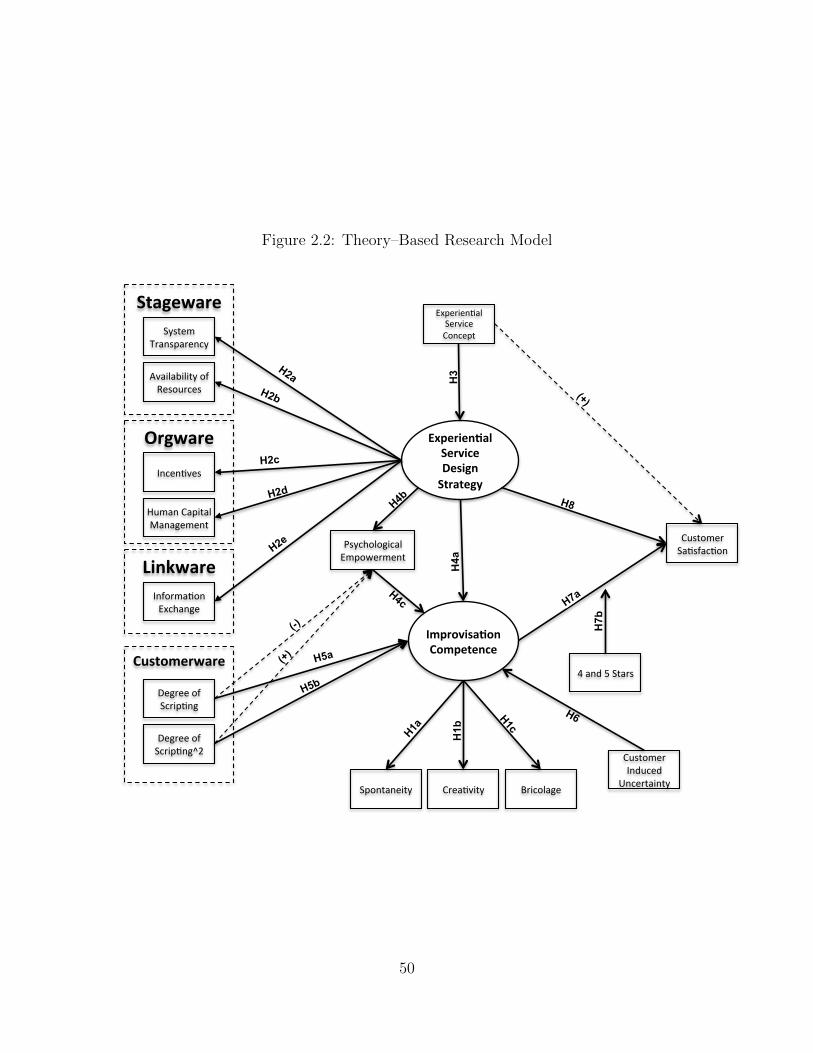
Figure 2.2: Theory–Based Research Model(+)
H4a
H
3
H4b
H4c
H8
H7b
H1b
H1c H1a H6
H5b
H5a
H2e
H2d
4 and 5 Stars
Experien(al Service Design Strategy
Improvisa(on Competence
Orgware
H2a H2b
H2c
Linkware
Customerware
Stageware System
Transparency
Availability of Resources
Incen;ves
Human Capital Management
Informa;on Exchange
Experien;al Service Concept
Degree of Scrip;ng
Degree of Scrip;ng^2 Customer
Induced Uncertainty
Psychological Empowerment
Spontaneity Crea;vity Bricolage
Customer Sa;sfac;on
(-)
(+)
H7a
50

2.2.1 Service Improvisation Competence
One of the goals of this paper is to consolidate these different perspectives into
a single multidimensional construct and to operationalize it in order to measure it in
a service environment. We refer the reader to Essay 1 for a more detailed discussion
of the organizational improvisation literature, its main concepts, and its implications
for service operations. Here, we focus on the translation of the theoretical framework
of Essay 1 into a testable operationalization of concepts and relationships, as applied
to the context of the present research (i.e. the hospitality industry). The hotel
industry is well–suited for Serv–IC. Roth et al. (1997) found that this sector has a
clear orientation in terms of service delivery: “By the nature of the industry, hotels
are in the business of selling service processes which are judged almost exclusively by
their process quality” (p. 8).
The creativity aspect of improvisation entails the introduction of some degree
of novelty into a performance (Oldham and Cummings 1996, Barrett 1998). We are
interested in the service delivery process and in the degree of latitude that service
delivery personnel are able to demonstrate during the service encounter; therefore
we operationally define the creativity dimension of improvisation as the amount and
frequency of deviations from standard service delivery processes. The creativity di-
mension of Serv–IC captures the process dimension of the service delivery. A small
amount of novelty introduced into a process—such as an unusual way to greet a
guest—will be regarded as low in creativity, but not as an absence of creativity;
similarly, a total reinvention of procedures—such as a Ritz–Carlton concierge who
purchased a giant teddy bear and placed it waiting in a limousine for a child who had
lost her own on the premises Bacon and Pugh (2004)—is qualified as a high degree
of Creativity. All the variants in the middle are considered intermediate degrees.
51

As such, creativity is measured on a continuum, not requiring a complete reinven-
tion of the delivery system in order to be present. In addition, it should be noted
that our measures are perceptual, and therefore we don’t need—at this point of our
research—to concern ourselves with some sort of objective degree of deviation from
delivery processes: we are interested in how much service employees feel that their
actions do not conform to established procedures, because the outcomes of the service
delivery processes are highly dependent on perceptions and attributed meanings.
Spontaneity refers to the temporal aspect of improvisation. The ability to
promptly respond to unexpected events is a fundamental component of the improvi-
sation construct, and timeliness has been shown to significantly influence customer
perceptions of service performance (Moorman and Miner 1998a, Miller et al. 2000,
Apte et al. 2007). Therefore, our operationalization of the spontaneity dimension of
improvisation in services reflects the ability to respond to customer requests on the
spot (or in real–time), meaning that the time between the customer’s request and the
worker response is perceived to be short by the individuals involved in the episode
(Vera and Crossan 2005).
Finally, bricolage refers to the crafting of a response with the resources cur-
rently available in the improviser’s immediate environment (Brown and Duguid 2001,
Bansler and Havn 2003, Baker and Nelson 2005). In service environments, bricolage
is operationalized as the frequency by which the service delivery personnel rearranges
whatever is at hand in order to craft a viable response to the customer’s request. The
emphasis of the operationalization of this construct is on adapting what is available
instead of procuring tools and resources that are specifically designed to complete the
task at hand.
Improvisation happens when these three elements coexist, and, therefore, we
propose that it can be measured reflectively as a second–order latent construct. Some
52

questions may arise as to whether the second–order Serv–SIC construct is better
measured as a reflective or formative construct, as it might not appear clear if im-
provisation is better characterized as a composite of the lower–order constructs or
as the cause of the measured score of the lower level constructs. In the former case,
the variance in the construct is determined by the variance in the lower–order di-
mensions, and all the variance captured by the constituting constructs is included in
the second–order composite: this situation is typical of formative measures (Fornell
and Bookstein 1982). In the latter, the variation in the second–order construct leads
to variation in the first–order dimensions, and the higher–order latent variable only
captures the variance in common between the lower–level dimensions (Edwards and
Bagozzi 2000).
We deem the reflective approach to be more appropriate for the Serv–IC con-
struct for several reasons. First, the three dimensions of spontaneity, creativity, and
bricolage are likely to exhibit high levels of co-variation, therefore providing a tenta-
tive indication of the appropriateness of a reflective approach (Diamantopoulos and
Siguaw 2006, Bagozzi 2007). Second, the theoretical basis on which the construct is
formulated rests on the assumption that we observe, for example, spontaneity because
the employee is engaging in improvisation. Finallu—and most importantly—the en-
tire predicament on which our conceptualization of the construct is built is that
improvisation occurs when we observe creative and spontaneous behaviors as well as
a recourse to bricolage activities happening concurrently: hence, we are interested in
measuring the shared variance between these constructs rather than their cumulative
variance.
We therefore propose the following hypothesis.
Hypothesis 1. Service Improvisation Competence is a second–order reflec-
53

tive multidimensional construct constituted by the following dimensions:
(1) the ability to deviate from an existing routine or process (creativity),
(2) the ability to minimize the response time (spontaneity), and (3) the
ability to “make do” with available resources (bricolage).
2.2.2 Experiential Service Design Strategy
The organizational and operational design choices made during the develop-
ment and implementation of the service delivery system play a fundamental role in
shaping the performance of employees during the service encounter. In order to offer
the desired experience to the customers, service operations researchers have high-
lighted the importance of alignment between specific design choices, the service con-
cept, and the target market (Goldstein et al. 2002, Roth and Menor 2003b). We can
conceptually divide design choices between the ones that concern the general strategy
of the service firm and are more related to the organizational level and the ones that
concern specifically the execution of the service delivery processes. The first group is
constituted by the classical service delivery design choices: structural, infrastructural,
and integration choices (Fitzsimmons and Fitzsimmons 2008). Using the theatrical
metaphor proposed by Voss et al. (2008), the structural choices represent the stage
on which the performance takes place (stageware); the infrastructural choices concern
the human aspect of the performance design, i.e. who are performers, what are their
skills, how are they rewarded (orgware); and the integration choices concern the flow
of information among the performers and between the performers and other parts of
the organization (linkware).
The second type of choices concerns the specifics of the performance: what
should be done when, and how. In other words, this is the analogous to the script in
54
a theatrical play (customerware). In the following sections we delineate the charac-
teristics of these choices and their link to the development of a Service Improvisation
Competence.
2.2.2.1 Stageware Choices
Stageware choices—i.e. choices concerning the environment in which the ser-
vice encounter takes place—are considered an important part of the service delivery
design because of the influence that they exercise on customer and employee behaviors
(Bitner 1990, 1992, Roth and Menor 2003b). To successfully engage in improvisation,
the stage has to be designed with two important goals in mind: first, it has to allow
a fast appraisal of the current situation, and second it has to be designed in a way
that allows for rapid access to a wide array of resources. In services, the first design
element—transparency—provides the ability to identify if and where a problem is
occurring, and if an action needs to be taken; the second design element—availability
of resources—provides the raw material for engaging in bricolage activities and allow
for a successful and prompt response. Imagine a situation in a restaurant where the
kitchen is getting behind and there are many potentially unhappy customers waiting
for service. In order to do something, a waiter or a maitre d’ would first need to
realize the problem—commonly used devices such as removing the menus from tables
that have placed their order serve exactly the purpose of making it easy for everybody
to assess the status of the tables. Subsequently, he or she needs access to resources in
order to do something about the problem, such as quickly offering a drink or a snack
to customers and apologizing for the delay.
Designing a system for transparency and accessibility of resources creates a
system similar to that advocated in manufacturing by lean and TQM proponents
(Anderson et al. 1995, Fredendall et al. 2010): by reducing the amount of inventory
55
on the shop floor and empowering workers to act on the production flow, problems
become more readily identified and solved.
2.2.2.2 Orgware Choices
The central element of high–contact service encounters is, not surprisingly, the
human element (Schlesinger and Zornitsky 1991, Roth et al. 1997, Pugh 2001, Cook
et al. 2002, Batt 2002, Goldstein 2003, Froehle 2006). Therefore, some of the most
important strategic choices that any service business has to make concern hiring,
training, and setting the right incentives. The acquisition and development of a
firm’s human capital has been identified by highly regarded service firms as quite
possibly the single most important element in the success (Heskett and Sasser Jr.
2010). Service employees have to possess the right attitude towards customers and
receive a considerable amount of training in order to perform their job satisfactorily,
especially if they are expected to take personal initiative in responding to customers’
needs and requests (Bowen and Lawler 1992).
However, it is not sufficient to hire the right people and train them: incentives
have to be aligned with the expected behavior if the service organization wishes to
develop a culture of experimentation, collaboration, and personal initiative (Vera and
Crossan 2005, Siemsen et al. 2007). Therefore, we argue that in order to develop an
improvisation competence, the service organization has to develop a problem–solving
oriented incentive structure, which encourages trial and error aimed at solving the
customers’ problems by rewarding the achievement of customer satisfaction and not
punishing mistakes made in the attempt to work through a satisfactory solution.
Roth et al. (1997) refer to the synergy between these policies as a “virtuous cycle.”
In other words, the ability of contact personnel to engage in improvisation is
linked to the absence of excessive fear of repercussion for deviating from prescribed
56
routines (Weick 1998, John et al. 2006). Management has to set up an incentive
system that encourages trial and error aimed at solving customers’ problems. More
specifically, incentives have to prioritize effectiveness over efficiency (to a degree)
in order to allow contact personnel to engage in the often wasteful trial–and–error
activities that characterize the crafting of a suitable response to a customer problem
through improvisation. Roth and Marucheck (1994) refer to this notion as “safe for
failing.”
2.2.2.3 Linkware Choices
One important element in the design of engaging service experiences is the
coordination among the several different aspects of the service delivery system and,
therefore, if the information about the performance of different elements is not diffused
throughout the organization, the task of service delivery personnel can be expected
to be more difficult. Linkware design choices concern the systems and policies that
determine the diffusion of information within the service delivery system and between
the service delivery system and the other parts of the organization. Similar to the the
argument we made about the transparency of the physical environment, information
about events that can influence the behavior of customers or other employees during
the service encounter can make the difference in the ability of front–line workers to
successfully adapt to the circumstances. Indeed, the literature on employee empow-
erment repeatedly shows that an updated and constant flow of information about
events and decisions at all levels of the organization plays a pivotal role in allowing
workers to make decisions and take action (Bowen and Lawler 1992, Spreitzer 1995,
Hartline and Ferrell 1996). Similarly, the literature on organizational improvisation
points to the availability and readiness of information as an important enabler of
improvisation for similar reasons (Vera and Crossan 2005, Arora et al. 2010). Indeed,
57
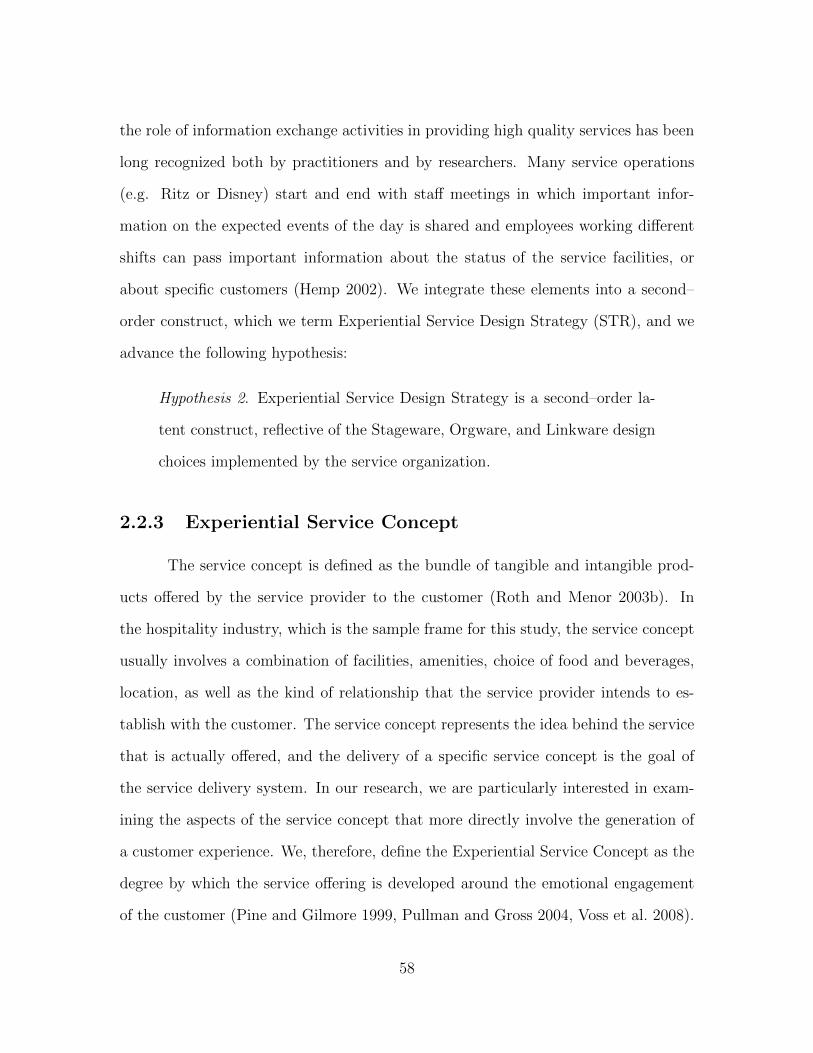
the role of information exchange activities in providing high quality services has been
long recognized both by practitioners and by researchers. Many service operations
(e.g. Ritz or Disney) start and end with staff meetings in which important infor-
mation on the expected events of the day is shared and employees working different
shifts can pass important information about the status of the service facilities, or
about specific customers (Hemp 2002). We integrate these elements into a second–
order construct, which we term Experiential Service Design Strategy (STR), and we
advance the following hypothesis:
Hypothesis 2. Experiential Service Design Strategy is a second–order la-
tent construct, reflective of the Stageware, Orgware, and Linkware design
choices implemented by the service organization.
2.2.3 Experiential Service Concept
The service concept is defined as the bundle of tangible and intangible prod-
ucts offered by the service provider to the customer (Roth and Menor 2003b). In
the hospitality industry, which is the sample frame for this study, the service concept
usually involves a combination of facilities, amenities, choice of food and beverages,
location, as well as the kind of relationship that the service provider intends to es-
tablish with the customer. The service concept represents the idea behind the service
that is actually offered, and the delivery of a specific service concept is the goal of
the service delivery system. In our research, we are particularly interested in exam-
ining the aspects of the service concept that more directly involve the generation of
a customer experience. We, therefore, define the Experiential Service Concept as the
degree by which the service offering is developed around the emotional engagement
of the customer (Pine and Gilmore 1999, Pullman and Gross 2004, Voss et al. 2008).
58

We argue that the development of a service concept that attempts to provide the cus-
tomers with a feeling of caring and authenticity will drive the service design choices
consistent with that end.
Hypothesis 3. The amount of emotional engagement that the service deliv-
ery intends to elicit in the customers is positively related to the adoption
of an Experiential Service Design Strategy.
2.2.4 The Mediating Role of Empowerment
The empowerment of employees is regarded by researchers as an important el-
ement in the achievement of organizational effectiveness and of the ability of workers
to work as a team (Conger and Kanungo 1988). There are several conceptualizations
of the empowerment construct, depending on the level of observation as well as on its
characterization as a set of managerial practices or as a psychological state (Bowen
and Lawler 1992). The most commonly used definition in organizational literature is
that of psychological empowerment. This refers to the feeling of employees that they
are allowed and have the ability to take initiative and act upon their work environ-
ment with a certain degree of autonomy. Psychological empowerment is comprised
by the dimensions of i) meaningfulness, ii) competence, iii) self–determination, and
iv) impact (Spreitzer 1995). In addition to the psychological empowerment, another
important stream of literature considered empowerment as the delegation of respon-
sibilities and decisional power to the lower ranks of the organization (Hartline and
Ferrell 1996, Ahearne et al. 2005). Seibert et al. (2004) refer to the latter as struc-
tural empowerment, in order to emphasize the managerial systems design aspect of
this shift of the locus of decision making in organizations. In this research, we are
concerned with the employee perceptions of the service delivery design, and therefore
59

we adopt the psychological empowerment perspective in our research.
We expect that the experiential set of strategic design choices that we delin-
eated will effectively accomplish the goal of shifting decisional power to front–line
employees, and that they will report a higher degree of autonomy in their decision
making during service delivery. In turn, the increased autonomy will create the nec-
essary conditions for the development of a Service Improvisation Competence in the
service organization (John et al. 2006). We therefore advance the following hypothe-
ses:
Hypothesis 4a. The adoption of an Experiential Service Design Strategy
leads to a comparatively higher degree of employee Psychological Empow-
erment in service delivery.
Hypothesis 4b. A higher level of service employee Psychological Empow-
erment leads to a comparatively higher degree of Service Improvisation
Competence.
In addition, we posit that there will also be a direct effect between design
choices and Serv–IC.
Hypothesis 4c. The adoption of an Experiential Service Delivery Design
Strategy leads to a comparatively higher degree of Service Improvisation
Competence.
2.2.5 Customerware
Customerware design choices refer to the specifics of the service encounter,
such as when the customer and service provider meet and the processes that regulate
the delivery of the service offering (Voss et al. 2008). The customerware choices are
60

often described in terms of the service script, which similar to the role of scripts in
theatrical performances delineate the actions and behaviors that have to be performed
by the service delivery employees during their interactions with the customers (Tansik
and Smith 2000). A script—or “performance programme” (March and Simon 1958)—
is defined as “a pattern of behaviour on an operating routine that is triggered by some
environmental stimulus” (Tansik and Smith 1991, , p.35). Service scripts can exhibit
different levels of elaboration and detail, from delineating the general sequence of
actions during the service encounter to detailing the interaction with customers in
detail, including what to say and how (e.g., it is not infrequent for scripts to include
reminders to conveying specific emotions, such as smiling at the customer). Tansik
and Smith (1991) identify several characteristics of scripts that affect the development
of the service encounter: (1) script intensity refers to the rigidity of the routine,
and the extent to which it delineates the specific actions to be taken by the service
employee; (2) script compexity refers to the detail of the script in terms of the number
of points on which the worker is expected to evaluate the situation before switching to
a different sub–script; (3) the number of scripts that service workers need to memorize
in order to perform their work; (4) the percentage of time that delivery personnel have
to spend executing scripts; and (5) the percentage of duties performed by the worker
delineated in scripts.
An accumulating body of research shows that the detailed scripting of the
service encounter, while leading to gains in efficiency, is often perceived by the service
customers as somewhat “artificial” and lacking in authenticity (Schau et al. 2007,
Victorino et al. 2008, Victorino 2008). Therefore, depending on the goals of the ser-
vice organization, the role of customer–contact design choices is to balance efficiency
and personal interaction with the customers. Logically, we expect that an increase
in the amount of scripting will effectively reduce improvisational activities in the ser-
61

vice delivery system, leading to a more standardized and streamlined service system.
However, when we discussed the role of improvisation in organizational dynamics, we
pointed out that it is often a dangerous fallacy to assume that the processes that are
put in place in the design phase will always be executed as intended by the designer
(Roth and van der Velde 1991a, Mintzberg 1994). In highly scripted environments,
service workers often find themselves in the uncomfortable position of having to me-
diate between customer expectations and process requirements that are too rigid to
accommodate such expectations. In addition, the more rigid and complex the scripts
are, the higher the monitoring costs to ensure that processes are followed to the let-
ter. Consequently, increasing the degree of scripting in service delivery with the goal
of increasing standardization and efficiency in the service delivery will likely work
only up to a point, after which the efficiency gains will incur diminishing returns and
service employees will become more likely to break off script rather that less likely.
We therefore advance the following:
Hypothesis 5. The degree to which the procedures of the service encounter
are scripted is related to the ability to improvise by a nonlinear convex
relationship.
2.2.6 Customer–Induced Uncertainty
Improvisation does not materialize if the customers do not present sufficient
variability to require a response on the part of the service provider. If the delivery
system possesses Serv–IC, but there are no unexpected events to face, the degree to
which the employees will engage in improvisation will be substantially lower.
Customer-Induced Uncertainty is comprised of all the factors that influence
the service delivery process but are out of the direct control of the service delivery
62
system personnel. Schmenner (1986), Tansik and Chase (1988) and Tansik (1990)
propose several aspects of customer behavior as a way to characterize the degree
to which customers introduce variability in the system (see also Tansik and Smith
1991). They consider the dimensions of (1) where and when: the degree of latitude
offered to customers in the decision of the place and time for the service to be per-
formed; (2) what : degree of customization allowed; and (3) how : degree of customer
co-production. Frei (2006) elaborates further on the dimensions of customer–induced
uncertainty classifying them according to the five forms of variability that they pro-
duce: (1) arrival, (2) request, (3) capability, (4) effort, and (5) subjective preference.
We argue that the presence of a Serv–IC in the service organization only
materializes in actual improvisational behaviors in the face of one or more of these
types of variability. This is also what allows us to measure the behaviors of service
workers in order to infer the presence of a specific Improvisation Competence.
Hypothesis 6. The amount of customer–induced uncertainty increases the
amount of improvisation in the service delivery.
2.2.7 Customer Satisfaction
Recent literature in service management has increasingly emphasized the im-
portance of designing the entire customer experience in order to elicit the desired
emotional responses (Pine and Gilmore 1999, Voss 2004, Palmer 2010, Zomerdijk and
Voss 2010). At the center of the customer experience is the generation of feelings
of authenticity and care that can be difficult to achieve if the employee behavior is
completely determined by standardized processes (Pullman and Gross 2004, Gilmore
and Pine 2007, Victorino et al. 2008). Therefore, we argue that the more a service
concept is built on the generation of a well–rounded customer experience (rather
63

than, for example, around convenience and efficiency), the more the customers will
be satisfied.
The development of a Serv–IC, therefore, appears to be a reasonable way to
achieve a more personalized service encounter and a way to provide prompt responses
to customer needs and requests, thereby increasing satisfaction. We advance the
following hypothesis:
Hypothesis 7a. Higher levels of Serv–IC will have a positive influence on
customer satisfaction.
However, we also emphasize the importance of the alignment between service
design choices—and the competences that they develop—and the characteristics of
the market segment to which the service is aimed. In addition, several researchers
have pointed out that in many experiential services, the goal of eliciting emotions
is attained not by providing one–to–one personalized contact but by carefully chore-
ographing the entire environment (Voss et al. 2008)—i.e. they are more like a classical
performance than a jazz one. In the hospitality industry, this is often the case in the
top tier hotels and restaurants: the so–called boutique hotels are a minority of the
high–end market. Therefore, we hypothesize that the effect of Serv–IC on customer
satisfaction will be lower for 4 and 5 stars hotels than it is for lower–tier establish-
ments.
Hypothesis 7b. The relationship between Serv–IC and customer satisfac-
tion will vary by hotel star ratings.
64
2.3 Research Design and Methodology
2.3.1 Sample Frame and Data Collection
The population for this study is composed by Hotel & Hospitality industry
employees who work in customer–contact positions. The hospitality industry is char-
acterized by a high degree of face–to–face interactions between service providers and
customers, and the outcomes of such encounters are often considered among the
most important determinants of customer satisfaction (Morgan et al. 2008, Victorino
2008). The main study was preceded by a pilot study aimed at verifying the validity
of the measures as well as calibrating the model specification for the main study (see
Appendix I for details on measurement development and pilot study).
The pilot study provided provisional support for our main hypotheses and for
the reliability of our measurement instruments. It also showed no difference between
different process types in terms of the amount of improvisation that the employees
performed and in terms of scripting and other design choices. We therefore decided
to drop the reference to specific processes and to broaden the sample frame beyond
front desk employees to all customer–contact hotel workers.
The main study was conducted through the Center for Hospitality Research
(CHR) at Cornell University. We emailed the link to the online survey to the sub-
scribers of the CHR newsletter, explaining the general framework of the study and
asking them to participate. As an incentive to participate in the study, we allowed the
subjects to enter a raffle to win one of several popular consumer electronics products.
The data collection for the main study resulted in 137 usable responses from hotel
workers with job descriptions ranging from front–desk clerk to resta urant waiter to
concierge. The respondents were primarily between 25 and 35 years of age (52.3%),
and the majority had between 8 to 15 years (61.7%) of experience working in the
65

Table 2.1: Properties DescriptivesVariable ProportionHotel ClassFull–Service 54%Resort 21%Other 25%
Hotel LocationCity Center 48%Suburban and Rural 25%Other 25%
Hotel CategoryLuxury and Deluxe 49%Upscale 27%Midscale and lower 24%
Star rating1, 2, and 3 Stars 18%4 and 5 Stars 82%
hospitality industry at the time of the survey. The average number of rooms of prop-
erties in which the respondents worked was 289.45, 48% of the hotels in the sample
were located in an urban area, .25% in a suburban or airport area, and the remaining
27% was classified as a resort. 42% of the sample were 5 stars hotels, 40% 4 stars,
and the remaining 1, 2, or 3 stars. In order to compensate for the lack of reference
to a specific process, we asked participants in the study to indicate what percentage
of their time they spend in contact with customers, and we used that variable as
a control in the data analysis. Respondents spent an average of 57% of their time
in contact with customers, but with a large standard deviation of about 30%. The
distribution of the amount of contact was negatively skewed, indicating that most of
our sample is in high–contact jobs (see Figure 2.3).
66

Table 2.2: Respondent CharacteristicsVariable Median Mode
Age 25–29 Years 25–29 YearsEducation Associate’s Degree Bachelor’s DegreeExperience in hotel Industry 4–7 Years 4–7 YearsTenure with current employer 0–3 Years 0–3 Years
Table 2.3: Operating CharacteristicsVariable Mean Std. Dev.
Rooms 289 323Occupancy in last month 68% 19.5%
Figure 2.3: Frequency Distribution of Respondents’ Amount of Time in Contact withGuests
Freq
uenc
y
Ln(% of work time in contact with customers)
0
10
20
30
40
50
60
70
80
90
1 2 3 4 5
67

2.3.2 Nonresponse Bias
When conducting survey research, there is always the concern that the part of
the population that has not responded to the survey is systematically different from
the respondents, therefore biasing the survey results (Dillman 2007). In order to test if
this nonresponse bias is a significant source of bias in parameter estimates, Armstrong
and Overton (1977) proposed that we can assume that late respondents (the ones that
answered comparatively late to the survey) are likely to be similar to nonrespondents.
We therefore conducted a test of the difference between the last 25% of the survey
respondents and the rest of the respondents. Using several demographic variables
(such as age, experience, educational level, etc.), as well as variables of interest for
the study, we verified that only 3 out of 63 variables tested are significantly different
at an α of 5%. Given that the the 3 variables out of 63 correspond to 4.7% of the
tests performed, this result constitutes good evidence of the absence of significant
nonresponse bias (Armstrong and Overton 1977).
2.3.3 Common Method Bias
Common method variance (CMV) is the portion of the covariance between
different measures that can be attributed to the fact that the different variables
come from the same individual—because of social desirability or the natural tendency
towards consitency—or are collected through the same medium, just to cite its most
common causes. This variance can result in a bias of the estimate of the relationship
between the constructs of interest, which may reflect this CMV rather than the actual
relationship between constructs (Doty and Glick 1998, Podsakoff et al. 2003, Siemsen
et al. 2010). Given the possible consequences of CMV on hypotheses tests, we took
several measures in order to minimize it.
68

First, we made sure that the questions were worded in an unambiguous and
clear way (Podsakoff et al. 2003). To this end, we performed extensive q-sorts and
we gathered feedback from several scholars and experts on wording issues and clarity
(Block 1961, Churchill Jr 1979, Menor and Roth 2008b). We started with a large
pool of items and narrowed our measures to the ones that exhibited the higher con-
sistency and reliability. In addition, we made an effort to keep questions concrete,
focusing on practices and behaviors, rather than perceptions and attitudes: for exam-
ple, the questions about creativity inquired about the frequency of specific behaviors
(Malhotra et al. 2006). In an attempt to minimize CMV due to social desirability,
we also assured the participants of the steps taken to maintain confidentiality, and
reassured them by providing the contacts of IRB board that authorized the study, in
case they have questions or any concern about their privacy (Podsakoff et al. 2003).
Finally, we did not share our theoretical model with the participants in the study,
and we did not explicitly mention the central role of improvisation competence in our
research. The study was presented as generally looking at ways to manage the impact
of customer–induced uncertainty on hotel operations. This precaution should further
help minimize the spurious covariances due to the tendency of research subjects to
act in accordance with what they think the researchers expect from them (Lages and
Piercy 2012).
To assess whther a common method variance was present, we performed the
Harman’s single factor test (Podsakoff et al. 2003, Malhotra et al. 2006, Siemsen et al.
2010). It consists in performing an exploratory factor analysis on the survey items,
and evaluating the non–rotated solution to assess whether a single factor emerges
from the data. The eigenvalues resulting from the EFA lead to the identification
of 8 factors, using the Kaiser method (i.e. eigenvalues greater than 1, Fidell and
Tabachnick 2006). However, the first eigenvalue exhibits a large difference with the
69

second, indicating that there might be a preponderance of one factor over the others.
We, therefore, proceeded to evaluate a confrimatory factor analysis with all item
loadings onto a single factor. This CFA resulted in a very poor fit (CFI=0.434,
RMSEA=0.125), and the single factor explains less than a fourth of the variance in
the items (AVE=0.231, Fornell and Larcker 1981), therefore leading us to conclude
that common method variance is not a significant problem in our sample.
Another common method used to detect CMV in cross-sectional surveys is that
of including a “marker” variable, which is unrelated to the constructs of interest: the
correlation between such variable and the other variables provides an estimate of the
CMV present in the data (Lindell and Whitney 2001, Siemsen et al. 2010). Although
we did not include a marker variable in our survey—for length considerations—Lindell
and Whitney (2001) suggest that the smallest correlation between observed variables
can be used as an indication of the magnitude of common method variance. The
smallest correlations between variables in our sample are between information ex-
change activities and transparency, and between information exchange activities and
spontaneity, both with an absolute value of 0.007.
We therefore conclude that common method variance is not a significant con-
cern in our sample, and hence we can be reasonably confident that our analysis does
not suffer from common method bias.
2.3.4 Measures
This section discusses the operationalization of the constructs as well as the
properties of the measurement instrument. All the constructs are measured with 7-
points Likert scales (Nunnally and Bernstein 1994), ranging from “Strongly Disagree”
to “Strongly Agree.” Given the small sample size it was not possible to run a com-
70

plete Confirmatory Factor Analysis to show the unidimensionality of the first–order
constructs and the reliability of the instrument. Therefore, we ran three separate fac-
tor analyses, one for the second–order Experiential Service Delivery Design Strategy
(STR) construct, one for the second-order Improvisation competence construct, and
one with the rest of the first-order constructs. In addition, we ran a CFA for every
possible combination of two first order constructs, in order to establish discriminant
validity: tables 2.4, 2.5, and 3.4 show the results of the CFA. After specifying the
construct definitions and the theoretical model drawing from the relevant literature,
we created a pool of items using both existing measures (when available) and newly
developed items. Using q-sorting techniques (Churchill Jr 1979, Malhotra and Grover
1998, Rosenzweig and Roth 2007), we purified the items and refined the constructs’
definitions in order to achieve adequate reliability and covering of the construct do-
main. Finally, we conducted a pilot study to test for the measurement properties and
to provide preliminary validation for our research model. The detailed results of the
measurement development phase and of the pilot study are presented in Appendix 1.
The following paragraphs detail the operationalization of each measure and
the measurement characteristics.
2.3.4.1 Service Improvisation
The amount of improvisation in the service delivery system is operationalized
as the frequency at which contact personnel engage in behaviors that we characterize
as reflective of improvisation competence (creativity, spontaneity, bricolage). All the
scales are 7-point Likert scales ranging from “Strongly Disagree” to “Strongly Agree.”
Previous research on organizational improvisation has considered a single dimension
of improvisation (Moorman and Miner 1998a) or has considered multiple dimensions,
without a formal test of the multidimensionality hypothesis. Table 2.4 shows the
71

Table 2.4: Improvisation Competence CFA
Construct/Items (Composite reliability, AVE) Std. Loading t-‐value IMPROVISATION COMPETENCE (Serv-‐IC) ( 0.798 , 0.609 ) Spontaneity (SP) ( 0.792 , 0.597 ) 0.943 a
I oHen have to figure out acKons in the moment 0.779 a I oHen have to respond in the moment to unexpected problems 0.849 21.00 I almost always deal with unanKcipated events on the spot 0.680 12.23
Crea@vity (CR) ( 0.748 , 0.522 ) 0.680 8.22 I oHen deviate from standard rouKnes to respond to guests` requests 0.528 a I oHen try new approaches to solve guests' problems 0.791 14.69 I oHen have to be creaKve to saKsfy customers' needs 0.813 15.31
Bricolage (BR) ( 0.664 , 0.404 ) 0.689 7.26
I oHen pull informaKon from many different sources to respond to guests' requests 0.909 a
I am able to make use of all the resources provided by my employer to respond to guests' requests 0.338 3.64
I oHen make use of several other workers' experKse to saKsfy guests 0.521 6.77 Chi2(24): 48.14 (p=0.0024), CFI: 0.938, RMSEA: 0.087 90% CI RMSEA: 0.051, 0.123 a: loading fixed at 1 for specificaKon
results of the Confirmatory Factor Analysis testing for the second-order structure of
the Improvisation Competence construct. The CFI of of .938 suggests a good fit for
the model (Hu and Bentler 1998, 1999), while the RMSEA of .087 indicates a mediocre
fit, but this estimate does not appear to be precise—i.e. the 90% confidence interval
is rather large—possibly due to the small sample size (Fornell and Larcker 1981).
The average variance extracted of .61 indicates that the majority of the variance in
the first–order constructs is explained by the second–order latent variable, providing
evidence of the substantive validity of the scale (Fornell and Larcker 1981). All the
loadings of the first-order variables onto the second-order variable are significant,
providing support for the unidimensionality of the construct (Anderson and Gerbing
1988, Gerbing and Anderson 1988).
The Service Improvisation Competence (Serv–IC) construct is composed of
three first-order dimensions. The creativity (CR) scale is a mix of newly developed
items and items adapted from Vera and Crossan (2005) and Moorman and Miner
72

(1998a). This scale is intended to measure how much the employees deviate from
established processes in the face of new problems posed by the hotel guests. The
spontaneity (SP) scale is similar to the temporal aspect emphasized by Moorman
and Miner (1998a) as well as Vera and Crossan’s (2005) spontaneity. Therefore, we
adapted items from both scales to create our instrument. Both scales exhibit AVE
higher than .5, composite reliability (ρ) higher than .7 and significant item loadings.
Overall, the scales exhibit sufficient validity and reliability to justify aggregation in
a single average score (Gerbing and Anderson 1988). Bricolage (BR) is a new scale
that measures the degree to which employees craft responses to unexpected events
by rearranging immediately available resources. Although all the item loadings are
significant, the low composite reliability and an AVE of less than .5 indicate that the
measurement might be capturing more than one dimension. On the other hand, this
construct has been deliberately built in order to capture a wide array of behaviors
that we categorize as bricolage. As it is common with measures that are not intended
to capture the “centroid” of the construct, but rather to sample the its theoretical
space, reliability is expected to be low (Little et al. 1999). In addition, the significant
loadings (p < .001) suggest that the items are measuring a unidimensional underlying
construct (Anderson and Gerbing 1988).
2.3.4.2 Experiential Service Design Strategy
The Experiential Service Design Strategy (STR) is modeled as a second–
order latent construct, reflective of the strategic choices actually implemented by
the service organization. The CFI which tests the second–order structure of the con-
struct exhibits reasonably good fit (CFI=.932, RMSEA=.078)—as reported in table
2.5—and all the loadings of the first–order dimensions are significant (p¡.001). The
AVE of .56 suggests that most of the variance in the first–order variables is cap-
73

Table 2.5: Experiential Service Design Strategy CFA
Construct/Items (Composite reliability, AVE) Std. Loading t-‐value EXPERIENTIAL SERVICE DESIGN STRATEGY (STR) ( 0.768 , 0.560 ) Availability of Resources (AOR) ( 0.812 , 0.634 ) 0.784 a
My employer provides me with a wide array of resources to do my job 0.847 a My employer provides extra funds to be used for emergencies 0.652 11.03 I can easily access all I need to do my job 0.871 25.68
Transparency (TR) ( 0.758 , 0.549 ) 0.384 3.51 I am immediately aware of any guest's problem 0.408 a I can easily assess how many guests are being currently served 0.751 12.54 I can easily assess how many guests are waiRng for the service I provide 0.958 16.29
Human Capital Management (HCM) ( 0.733 , 0.492 ) 0.883 15.81 Compared to compeRRon… ...our hotel hires employees with high levels of prior experience 0.648 a ...our hotel hires employees with high levels of educaRon 0.661 10.71 ...our hotel spends more money per employee on training 0.728 13.42 ...our hotel focuses on hiring employees with customer oriented aTtudes 0.761 15.08
InformaPon Exchange AcPviPes (IEA) ( 0.793 , 0.597 ) 0.870 18.71 I regularly receive informaRon about other department's customer-‐related acRviRes 0.717 a
InformaRon about what is going on within the organizaRon is readily shared at all levels 0.778 16.88
The amount of informaRon that I receive regarding other department's acRviRes is sufficient for me to do a good job 0.831 20.50
Status of important success measures is shared rouRnely at all levels 0.759 16.24 Customer-‐Oriented InvcenPves (COI) ( 0.885 , 0.772 ) 0.708 11.90
Management encourages employees to parRcipate in important decisions concerning service delivery 0.785 a
Management rewards proacRve behaviors in the interacRons with guests 0.923 37.60 My managers reward personal iniRaRve in the soluRon of guests' problems 0.922 37.45 Chi2(108) = 185.65 (p=.000), CFI: 0.932, RMSEA: 0.078, 90% CI RMSEA: 0.059, 0.097 a: loading fixed at 1 for specificaRon
74

tured by the second–order STR construct. However, the small size of the loading
of Transparency—although significant—might suggest that the system transparency
does not belong with the other strategic choices, but has indeed a more tactical—or
operational—role in service delivery. Overall, the service strategy construct exhibits
good measurement properties, and its modeling as a second-order reflective latent
factor seems justified. The following paragraphs examine the operationalization and
measurement properties of the first-order dimensions of service strategy.
System Transparency (TR) is a new scale operationalized as the ease with
which the service employees can assess important indicators of the current status of
the service environment (e.g. number of people waiting for service, a co-worker who
is experiencing a problem, etc.). These questions are measured on a 7-point Likert
scale ranging from “Strongly Disagree” to “Strongly Agree.” All the items exhibit
significant loadings (p < .001) which, together with an AVE of .54 provide strong
evidence of unidimensionality. The composite reliability of .75 indicates acceptable
reliability.
Availability of Resources (AOR) is a newly developed scale, measured on a
7-point Likert scale ranging from “Strongly Disagree” to “Strongly Agree.” The scale
measures the amount of resources that are at the immediate disposal of customer-
contact employees, and that can be used to respond to contingencies. The scale
exhibits good measurement properties, with a Composite reliability of .81, an AVE
larger than .6, and significant loadings of all the items (p¡.001).
The Customer Oriented Incentives (COI) scale is new and is operationalized
as the degree to which managers reward proactive behaviors and punish unsuccessful
attempts. It is constituted by new items as well as items adapted from the supervisory
style scale employed by Oldham and Cummings (1996). It is measured on a 7-point
Likert scale ranging from “Strongly Disagree” to “Strongly Agree.” More specifically
75

the scale addresses whether the incentives provided by the organization are conductive
to climate of experimentation and foster a culture which is goal–oriented and centered
around the guests’ needs. The scale exhibits good psychometric properties indicating
both high reliability and unidimensionality (ρ=.882, AVE=.77).
The Human Capital Management (HCM) scale measures management prac-
tices aimed at the acquisition and development of employees’ skills and knowledge as
well as the management of their attitudes relevant to the service delivery. The scale
is composed by items adapted from Sakakibara et al. (1993) and Skaggs and Youndt
(2004). The measure is a 7-point Likert scale ranging from “Strongly Disagree” to
“Strongly Agree.” The composite reliability of .73 indicates acceptable reliability,
and the significant item loadings (p < .001) provide some evidence of unidimension-
ality. However, the AVE of less than .5 suggests that this scale captures different
dimensions of human capital management practices. Indeed, the scale is built around
the identification of a series of practices that increase the likelihood of having workers
that are able to successfully engage in improvisation. More specifically, the scale mea-
sures both hiring and training practices that the literature suggests are conductive
to employee empowerment in the service industry (Bowen and Lawler 1992, Hartline
and Ferrell 1996, Goldstein 2003).
The Information Exchange Activities (IEA) scale is operationalized as the
frequency and usefulness of meetings and other information diffusion techniques in
the organization. The scale is a mix of new items as well as items from the “Real-time
information and communication” scale, adapted from Vera and Crossan (2005). The
scale exhibits good psychometric properties, with composite reliability of .79, and
AVE of .59. All the item loadings are significant (p < .001).
76
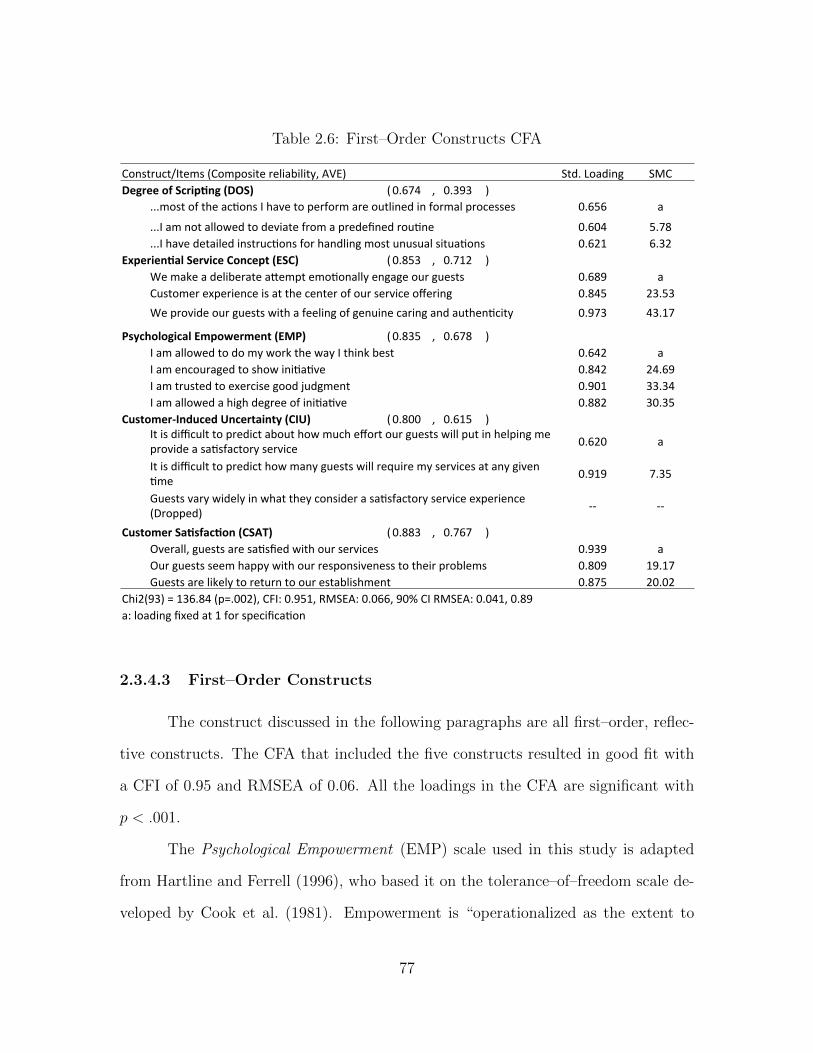
Table 2.6: First–Order Constructs CFA
Construct/Items (Composite reliability, AVE) Std. Loading SMC Degree of Scrip,ng (DOS) ( 0.674 , 0.393 )
...most of the acHons I have to perform are outlined in formal processes 0.656 a
...I am not allowed to deviate from a predefined rouHne 0.604 5.78
...I have detailed instrucHons for handling most unusual situaHons 0.621 6.32 Experien,al Service Concept (ESC) ( 0.853 , 0.712 )
We make a deliberate aRempt emoHonally engage our guests 0.689 a Customer experience is at the center of our service offering 0.845 23.53 We provide our guests with a feeling of genuine caring and authenHcity 0.973 43.17
Psychological Empowerment (EMP) ( 0.835 , 0.678 ) I am allowed to do my work the way I think best 0.642 a I am encouraged to show iniHaHve 0.842 24.69 I am trusted to exercise good judgment 0.901 33.34 I am allowed a high degree of iniHaHve 0.882 30.35
Customer-‐Induced Uncertainty (CIU) ( 0.800 , 0.615 ) It is difficult to predict about how much effort our guests will put in helping me provide a saHsfactory service 0.620 a
It is difficult to predict how many guests will require my services at any given Hme 0.919 7.35
Guests vary widely in what they consider a saHsfactory service experience (Dropped) -‐-‐ -‐-‐
Customer Sa,sfac,on (CSAT) ( 0.883 , 0.767 ) Overall, guests are saHsfied with our services 0.939 a Our guests seem happy with our responsiveness to their problems 0.809 19.17
Guests are likely to return to our establishment 0.875 20.02 Chi2(93) = 136.84 (p=.002), CFI: 0.951, RMSEA: 0.066, 90% CI RMSEA: 0.041, 0.89 a: loading fixed at 1 for specificaHon
2.3.4.3 First–Order Constructs
The construct discussed in the following paragraphs are all first–order, reflec-
tive constructs. The CFA that included the five constructs resulted in good fit with
a CFI of 0.95 and RMSEA of 0.06. All the loadings in the CFA are significant with
p < .001.
The Psychological Empowerment (EMP) scale used in this study is adapted
from Hartline and Ferrell (1996), who based it on the tolerance–of–freedom scale de-
veloped by Cook et al. (1981). Empowerment is “operationalized as the extent to
77
which managers allow employees to use their own initiative and judgment in perform-
ing their jobs” (Hartline and Ferrell 1996, p.59), as perceived by the employees. The
scale exhibits good measurement properties, demonstrating high reliability (compos-
ite reliability of .83) and unidimensionality (AVE of .67 and significant loadings).
The Degree of Scripting (DOS) scale is a new scale based on Tansik and Smith
(2000) conceptualization of scripting in service organizations. The scale measures
the complexity and rigidity of the procedures and routines employed during service
delivery. This is a newly developed scale, and it is intended to provide a measurement
of different aspects of organizational routines design that increase the employee’s
perceptions of operating in a standardized environment. In particular, we look at
the relative amount of actions performed that are outlined in formal procedures, how
much do the procedures allow for a deviation from the codified routines, and how
much detail is provided by service delivery procedures for handling situation that do
not follow in the usual sequence of events. Consequently, our measurement is built
with the goal of theoretical sampling of a wide construct space, and it is not surprising
that reliability and unidimensionality measures (ρ and AVE, see table 3.4) do not
exhibit high values (Little et al. 1999).
Experiential Service Concept (ESC) is measured as the degree of emotional en-
gagement that the service is intended to elicit in the customers (Pullman and Gross
2004). Our operationalization is not conceptualized as encompassing all the dimen-
sions of the service concept, but only the emotional engagement of customers—which
plays an important role in the dynamic relationships between design choices, impro-
visation, and customer satisfaction (Price et al. 1995, Schneider and Bowen 1999,
Palmer 2010, Zomerdijk and Voss 2011). Therefore, we focus our operationalization
of the service concept on the single dimension of how much the service delivery sys-
tem is supposed to elicit emotional engagement and a feeling of authenticity in the
78

guest. The scale exhibits the expected psychometric properties, with high reliability
(ρ=0.85) and convincing evidence of unidimensionality (AVE of 0.71).
Customer-induced Uncertainty (CIU) is a new scale based the types of vari-
ability proposed by Frei (2006) which are most relevant to the hotel industry. In
particular, our scale measures how much the service provider is able to predict the
behavior of guests as it concerns their arrival time (or the time at which they decide
to take advantage of the specific service offered by that particular employee) and the
amount of cooperation that the guest is going to offer during service delivery. Both
of these sources of uncertainty have been shown to have a significant influence on
the variability of service processes as well as on customer satisfaction (Argote 1982,
Bitner et al. 1997, Chase and Dasu 2001, Dickson et al. 2005), and, therefore, are rel-
evant to our analysis of the way in which service businesses manage this variability.
The scale exhibits acceptable psychometric properties, with a ρ of .8 and an AVE of
.67. All the path loadings are significant in the CFA.
The Customer Satisfaction (CSAT) scale is composed by items adapted from
Goldstein (2003) and Rungtusanatham et al. (2005). It is operationalized as the like-
lihood that guests will return to the establishment and as the overall happiness of
customers with the service received. The scale exhibits high reliability and unidimen-
sionality, as reported by the high values of composite reliability and AVE (0.88 and
0.77 respectively).
2.3.4.4 Control Variables
In the analysis of the survey data, we controlled for several variables that
are likely to be related to the dependent variables, based on previous literature. To
correct for the influence that a greater amount of financial resources at the disposal
of the property management can have on customer satisfaction and on the ability
79

to adapt to customers’ requests, we included the natural logarithm of the number of
rooms in the equations that have customer satisfaction and improvisation competence
as a dependent variable. In addition we also controlled for the star rating of the
hotel. The amount of improvisation that occurs in service encounters is also likely to
depend on the amount of time that the employee spend in contact with guests: more
contact-intensive roles (e.g. concierge) are more likely to result in a higher amount
of improvisation, holding the specific service design choices constant. Therefore, we
controlled for the percentage of time that employees spend in contact with customers,
when predicting the improvisation competence variable. In addition, the equations
predicting the individual–level variable of empowerment include educational level and
years of experience in the hospitality industry as controls.
Finally, in order to account for the effect of the individual employee ability in
the feeling of an increased sense of control, we included the respondent’s experience
(in years) and educational level in the equation in which empowerment is a dependent
variable.
2.4 Analysis and Results
Table 2.7 reports descriptive statistics and correlations for all constructs in
the model, and Figure 2.4 and Table 2.4.1 illustrate the results of the model test. Be-
cause of the limitations imposed by the small sample size, all the first order constructs
have been averaged across the items and introduced in the analysis as observed vari-
ables, instead of being modeled as latent constructs (Anderson and Gerbing 1988).
Prior to the analysis (but after the averaging of first–order constructs) we imputed
the missing data using a Multiple Imputation/Expectation Maximization (EMB) al-
gorithm (King et al. 2001, Honaker and King 2010). The EMB algorithm used—the
80

package AmeliaII in the R environment (Honaker et al. 2011)—combines the imputa-
tion of missing data using Maximum Likelihood Expectation Maximization (Demp-
ster et al. 1977)—which is used to calculate the posterior—with bootstrap methods
(Efron and Tibshirani 1993)—used take draws from the distribution of the posteriors.
The procedure assumes that data is multivariate normally distributed, and that the
missing values are missing at random (MAR) (Schafer and Graham 2002, Honaker
et al. 2011). Given that the EM algorithm and Multiple Imputation techniques have
been suggested as the best approaches to missingness of data in structural equation
modeling literature (Schafer and Graham 2002, Allison 2003), the EMB algorithm ap-
pears particularly suited to approach problems of missing values in SEM estimation
techniques.
The analysis presented is the result of a multiple imputation of 10 datasets.
In order to combine the results of the 10 different runs of the analysis, we followed
the indications provided by Honaker and King (2010) and Honaker et al. (2011). The
estimate of the parameter of interest (θ) is obtained as the average of the estimates
across the 10 runs, and the standard errors are computed using the following formula:
SE(θ)2 = 1/mm∑i=1
SE(θi)2 + S2
θ(1 + 1/m) (2.1)
where SE(θ) is the standard error of the estimate of the parameter of interest,
θi is the parameter estimate in the ith dataset, S2θ
is the variance of the standard error
of the estimate across the imputed datasets, and m is the number of imputations.
All the variables that have been included in interactions or higher order terms
have been mean centered prior to the computation of the product terms, in order to
reduce multicollinearity problems (Aiken et al. 1991, Cohen et al. 2003). In order to
reduce computational problems due to the scale difference in the variances of variables
81

involved in the computation, all the variables that had a much larger range that the
others (i.e. number of rooms and percentage of time in contact with the customers)
have been transformed using a natural logarithm. The interaction terms between the
number of stars and the latent variable IC have been obtained by multiplying each
first–order variable constituting Serv–IC (i.e. Creativity, Spontaneity, and Bricolage)
with the other interacting term (e.g. creativity*4&5 stars, bricolage*4&5 stars, etc.),
and creating a latent variable reflective of the multiplied variables (Marsh et al. 2004).
The analysis has been performed with the sem program in Stata 12.
Overall, the model fits the data well (χ2 = 406. 632, d.f. = 268, p <= .001),
and the ratio χ2/df is 1.517, which suggests a good fit of the theoretical model. The
RMSEA of 0.062 (90% Confidence Interval = 0.049, 0.074) is below the recommended
value of .08 suggested by Hu and Bentler (1999) for acceptable fit. Bentler (1990)
CFI index of 0.892 indicates a reasonable fit for such a complex model. In addition,
the squared multiple correlations for the main structural equations are substantial:
the equation predicting customer satisfaction has an R2 of 0.6, and the equation
predicting improvisation competence has an R2 of 0.4. This indicates that our model
explains a significant part of the variance in the variables of interest.
Our hypotheses are generally supported by the data, as well as the paths
that we introduced in order to be consistent with previous literature. H1 and H2,
which test the second order structure of the Service Strategy and of the Improvisation
Competence constructs, have been tested by comparing the results of the confirmatory
factor analyses in tables 2.4 and 2.5 with a factor analysis in which the indicators
load directly on the latent constructs. The two CFAs accounting for the second order
structure of the measures resulted in much better fit compared to the analyses in
which the indicators load on the latent variables directly. Namely, the single–factor
CFA for IC resulted in a χ2 of 114.04 with 27df, a CFI of 0.777, and RMSEA of 0.156,
82

Table 2.7: Correlations Between Constructs
Mean
StandardDeviation
Skewness
151.3Availability3of3Resources
4.831.318
?0.3651.000
2.3Transparency5.18
1.145?0.642
0.337**1.000
3.3Incentives4.901
1.535?0.519
0.662**0.219*
1.0004.3Hum
an3Capital3Managem
ent4.609
1.302?0.215
0.526**0.0543
0.516**1.000
5.3Information3Exchange
4.7981.421
?0.4190.588**
0.357**0.589**
0.614**1.000
6.3Degree3of3Scripting3.466
1.4280.208
0.196*?0.0073
0.11530.280**
0.223**1.000
7.3Service3Concept5.722
1.225?1.105
0.500**0.247**
0.601**0.460**
0.503**0.0473
1.0008.3Em
powerm
ent5.75
1.182?1.175
0.511**0.407**
0.514**0.310**
0.390**?0.1093
0.543**1.000
9.3Creativity5.353
1.124?0.653
?0.510
0.255**?0.020
?0.0793
0.0593?0.201*
0.09330.249**
1.00010.3Spontaneity
5.6351.103
?1.1730.002
0.09230.270
0.02730.0073
?0.1163
0.07730.298**
0.490**1.000
11.3Bricolage5.626
0.978?0.869
0.281**0.123
0.243**0.244**
0.355**0.1363
0.11530.334**
0.381**0.460**
1.00012.3Custom
er?Induced3Uncertainty
4.6791.286
?0.292?0.071
?0.1273
0.1053?0.0513
?0.0153
?0.0343
0.1273?0.0313
?0.0423
0.12230.144
1.00013.3Custom
er3Satisfaction5.897
0.866?1.282
0.522**0.301**
0.530**0.325**
0.393**0.1393
0.651**0.554**
0.171*0.246**
0.369**0.054
1.00014.343Stars3(dum
my)
0.4370.506
0.266?0.029
?0.0643
0.08930.0073
?0.1083
?0.1083
0.03930.015
?0.0363
?0.0383
?0.203*
0.1493?0.0313
1.00015.353Stars3(dum
my)
0.3560.546
?0.2130.265**
0.172*0.1523
0.280**0.283**
0.271**0.1453
0.195*0.0683
0.07930.449**
?0.1153
0.244**?0.680**1.000
Note:32?tailed3pearson3correlations3based3on3the3average3of3scales3across3survey3item
s*p<.05,3**p<.01
61
23
45
1314
78
910
1112
83

Figure 2.4: Path Model Results
0.835**
0.314**
-0.2
35
0.67
4**
0.668**
0.495**
0.432**
-0.2
31**
0.65
0** 0.571** (F
ixed)
0.238*
0.276** -0.131
0.706**
0.637**
4 and 5 Stars
Experien(al Service Design Strategy
Improvisa(on Competence
Orgware
0.426** (Fixed)
Linkware
Customerware
Stageware System
Transparency
Availability of Resources
Incen;ves
Human Capital Management
Informa;on Exchange
Experien;al Service Concept
Degree of Scrip;ng
Degree of Scrip;ng^2 Customer
Induced Uncertainty
Psychological Empowerment
Spontaneity Crea;vity Bricolage
Customer Sa;sfac;on
-0.224**
-0.04
6
0.217*
84

while the single–factor CFA for service strategy resulted in a χ2 of 755.09 with 185df,
a CFI of .625, and an RMSEA of 0.162.
2.4.1 Effect of Design Choices on Improvisation Competence
and Customer Satisfaction
As we expected, the experiential service concept has large and significant effect
on the The Experiential Service Design Strategy, therefore providing support for
Hypothesis 3 (Goldstein et al. 2002, Roth and Menor 2003b). Strategic design choices
have a substantial influence on the delivered service, and consequently service firms
that strive for the creation of a highly engaging service experience resort to design
choices that involve careful selection and training of employees, attention to facilities
design, and consistent diffusion of important information throughout the organization.
In addition, we confirmed insights from previous studies that showed that the creation
of an authentic and engaging customer experience results in higher degrees of customer
satisfaction, as indicated by the path ESC→CSAT (Pine and Gilmore 1999, Schneider
and Bowen 1999, Pullman and Gross 2004, Voss et al. 2008, Zomerdijk and Voss 2010).
85

Tab
le2.
8:P
aram
eter
Est
imat
esan
dH
yp
othes
esT
ests
Direct Effe
cts
Indirect Effe
cts
To
tal Effe
cts
Standardize
d Es4m
ate
Standardize
d Es4m
ate
Standardize
d Es4m
ate
Path
Hypo
thesis
S.E.
t-‐value
S.E.
t-‐value
S.E.
t-‐value
ESC
è STR
H3
0.647 *
* 0.089
7.24
0.647 *
* 0.089
7.24
STR
è Serv-‐IC
H4
a -‐0.235
0.158
-‐1.48
0.330 *
* 0.095
3.47
0.104
0.106
0.98
STR
è EM
P H4
b 0.668 *
* 0.052
12.94
0.668 *
* 0.052
12.94
EMP
è Serv-‐IC
H4
c 0.495 *
* 0.137
3.60
0.495 *
* 0.137
3.60
DOS
è Serv-‐IC
H5
a -‐0.131
0.105
-‐1.24
-‐0.111
* 0.046
-‐2.43
-‐0.268
0.417
-‐1.02
DOS^2
è Serv-‐IC
H5
b 0.276 *
* 0.094
2.93
-‐0.023
0.035
-‐0.65
0.275 *
0.133
2.06
DOS
è EM
P -‐-‐
-‐0.224
**
0.068
-‐3.29
-‐0.224
**
0.068
-‐3.29
DOS^2
è EM
P -‐-‐
-‐0.046
0.070
-‐0.66
-‐0.046
0.070
-‐0.66
CIU
è Serv-‐IC
H6
0.238 *
0.104
2.28
0.238 *
0.104
2.28
Serv-‐IC
è CSAT
H7
a 0.217 *
0.088
2.48
0.217 *
0.088
2.48
ESC
è CSAT
-‐-‐
0.314 *
* 0.089
3.54
0.314 *
* 0.089
3.54
4&5 Stars (Du
mmy) è CSAT
-‐-‐
-‐0.006
0.066
-‐0.10
-‐0.006
0.066
-‐0.10
Serv-‐IC
*4&5 Stars
è CSAT
H7
b -‐0.231
**
0.075
-‐3.09
-‐0.231
**
0.075
-‐3.09
STR
è CSAT
H8
0.432 *
* 0.090
4.80
0.434
0.235
1.85
STR (1,2, &
3 Stars)
è CSAT
0.034 a
0.041
0.04
STR (4&5 Stars)
è CSAT
H8
0.118 a
0.129
0.92
a: te
st of m
oderated
med
ia4o
n repo
rted
for the
differen
t star
categorie
s * p<
.05, ** p<
.01, tw
o-‐tailed t-‐test
86

STR has an effect on the development of an improvisation competence, through
the generation of a feeling of empowerment in service employees. In order to test
for the presence of an indirect effect between STR and Serv–IC, we followed the
indications of a growing body of literature which suggests to test for the significance
of the indirect effect without necessarily establishing the presence of an effect in the
absence of the mediator (Hayes 2009, Zhao et al. 2010, Rucker et al. 2011). One of
the most important reasons for the lack of a significant total effect in the presence of
a significant indirect effect—and one that we think applies to the present study—is
the fact that the test for mediation has a higher power, and the indirect effect is
therefore easier to detect, especially with a small sample size (Zhao et al. 2010).
We tested the significance of the indirect path using the Sobel test for media-
tion (Sobel 1982, Baron and Kenny 1986): the effect is highly significant (p < .001),
and therefore Hypothesis 4 is supported. The total effects have been estimated by re–
running the structural model omitting the indirect paths (Table 2.4.1). This result is
consistent with previous research on empowerment, which shows that organizational
choices result in the creation of an empowerment climate which, in turn, results in the
psychological empowerment of the employees (Conger and Kanungo 1988, Bowen and
Lawler 1992, Randolph 1995, Hartline and Ferrell 1996, Seibert et al. 2004, Wallace
et al. 2011). We can therefore argue that the direct effect of STR on Serv–IC, if it
exists, is certainly much smaller that the indirect effect through empowerment.
In addition STR has a significant effect on Customer Satisfaction (CSAT),
providing evidence in support of our Hypothesis 8. Adopting a design strategy as the
one described here has a direct significant effect on customer satisfaction, independent
of the amount of improvisation that is present in the system. In order to test the
indirect effect of STR on CSAT, we used the procedure proposed by Preacher et al.
(2007) to assess moderated mediation. Moderated mediation is present when one of
87

the paths in the mediated relationship (either from the independent to the mediator,
or from the mediator to the dependent variable) is moderated by another variable
(or by one of the variables in the mediated relationship). In our case the path from
the mediator (Serv–IC) to the dependent variable (CSAT) is moderated by a variable
that is not part of the mediation model (Star Rating). We obtained the standard
error of the indirect effects using the formula proposed by Preacher et al. (2007):
SE2f(θ|Star) = (βIC + βIC∗Stars ∗ Star)2s2αSTR
(2.2)
+ (β2IC + s2
β2IC
)(s2αSTR+ 2sαSTR,βIC∗Stars
+ s2βIC∗Stars
∗ Star2)
Where f(θ|Star) = αSTR(βIC + βIC∗Stars ∗Star) , and βIC is the coefficient of
Serv–IC predicting customer satisfaction, βIC∗Stars is the coefficient of the interaction
between Serv-IC and number of stars (predicting Customer satisfaction), and αSTR
is the coefficient of Experiential Service Design Strategy (STR) predicting Serv–IC.
The result of the test for moderated mediation show no significant indirect
effect of design choices on customer satisfaction.
2.4.2 Effect of Degree of Scripting on Improvisation Compe-
tence
In addition to the strategic design choices, an important element that has a
direct effect on the development of an improvisation competence is the design of the
processes and routines that inform the steps taken in during the service encounter.
The data supports our hypothesis 5 that the degree of scripting of the service en-
counter will have a non–linear relationship with the amount of improvisation. The
88

Figure 2.5: Quadratic Effect of Scripting on Improvisation
Degree of Scripting (Standardized)
Impr
ovis
atio
n C
ompe
tenc
e (S
tand
ardi
zed)
0
0.25
0.5
0.75
-1 -0.75 -0.5 -0.25 0 0.25 0.5 0.75 1 -0.25
quadratic curve estimated in our model is reported in Figure 2.5.
The horizontal axis reports the amount of scripting, and the vertical indicates
the amount of improvisation competence, both standardized. As scripting increases—
that is, as procedures become more binding and complex—the amount of improvisa-
tion in the system decreases at first. However this variance–reduction strategy works
only up to a certain point: when procedures become too binding and complex, the
amount of deviation from the procedures themselves increases in the face of customer–
induced uncertainty. This finding is consistent with previous qualitative research in
organizational improvisation (Brown and Eisenhardt 1997, 1998), as well as with a
broader stream of research in strategy and operations strategy (Mintzberg 1978, Roth
and van der Velde 1991a, Boyer 1998, Crossan and Hurst 2006). In the first part of
the curve, the intended effect of the customer–contact design choices—which is to in-
crease process standardization—is consistent with its effects, while in the second part
of the curve, after the extremeum is reached, increasing routinization no longer works
as a way to increase standardization: in other words, the realized service experience
89

is no longer consistent with the intended one. Such discrepancy can be a source of
problems for the management of employees as well as customers: on the one hand,
the discrepancy between job requests and the decisional latitude that is offered to
the employees is an important source of mental strain, which increases the turnover
rate (Karasek Jr 1979, Dwyer and Ganster 1991, Schneider and Bowen 1993), while
on the other it can easily end up in a mismatch between what customers expect (a
highly standardized service) and what is actually delivered (many workarounds).
In addition, consistently with previous literature, the increase of scripting has
a linear negative effect on the feelings of empowerment of service workers (Tansik and
Smith 2000, Wallace et al. 2011). The linear effect—as compared to the quadratic
effect of scripting on IC—suggests that no matter what the actual behaviors of em-
ployees (i.e. even if they improvise a lot) an increase in routines’ complexity and
rigidity will decrease their feeling of empowerment.
Hypothesis 6 is also supported by the data. The more uncertainty is introduced
in the service operations by guests, the higher the amount of improvisation in the
system. Customer–induced uncertainty is what turns the improvisation competence
into an actual behavior, and therefore makes it possible for us to measure it.
2.4.3 Effect of Service Improvisation Competence on Cus-
tomer Satisfaction
The test of the coefficients for Serv–IC for the different star ratings has been
performed with the methodology proposed by Jaccard and Turrisi (2003). The stan-
dard error of the simple slope of the interaction between Serv–IC and the dummy
90

variable for stars has been computed as:
SEf(θ|stars) =√
(s2βIC
+ Star2 ∗ s2βIC∗Stars
) + 2 ∗ Star ∗ s2βIC ,βIC∗Star
) (2.3)
Where s2βIC
is the variance of the estimate of the coefficient of Serv–IC, s2βIC∗Stars
is the variance of the estimate of coefficient of the interaction term, s2βIC ,βIC∗Star
is the
covariance of the estimates, and stars is the value of the star rating variable at which
we are estimating the coefficient (0 or 1 because stars is a dummy variable what is
0 for 1, 2, and 3 stars and 1 for 4 and 5 stars). The significance test is performed
computing the quotient between the coefficient of Serv–IC at the different values of
stars (i.e., f(θ|Stars) = βIC + βIC∗Stars ∗ Stars) and the standard error reported
in equation 2.3. We can evaluate this critical ratio as a t statistic with N − k − 1
degrees of freedom, where N is the sample size and k is the number of predictors in
the equation with the interactions (Jaccard and Turrisi 2003).
The effect of Serv–IC on customer satisfaction is moderated by the class of
the hotel, therefore providing support for hypothesis 7. Figure 2.6 shows the effect
of IC for different values of hotel star rating. The coefficient of Serv–IC for 1, 2, and
3 stars hotels is significant at p=.003, while the significance test for 4&5 stars hotels
results in a p=.13.
As we hypothesized, the effect of developing an improvisation competence on
customer satisfaction differs among different hotel categories (see Figure 2.6). In
particular, the effect is positive in 1, 2 and 3 star hotels, and it is not significantly
different from 0 in 4 and 5 star hotels. This finding can be interpreted in a way
that is consistent with previous studies of service experiences (e.g. Voss et al. 2008,
Zomerdijk and Voss 2010). In highly experiential services—especially in the hospital-
ity industry—the ritual plays a very important role (for example, having the warm
91

Figure 2.6: Interaction between Stars and IC
1,2, and 3 Stars
4 and 5 Stars
0
0.5
1
1.5
2
2.5
3
3.5
4
4.5
1 2 3 4 5 6 7
Improvisation Competence
Cus
tom
er S
atis
fact
ion
towel in your hands as soon as you enter a Ritz–Carlton hotel), and customers ex-
pect everything to go according to a well–defined routine. Consequently, the role of
operations in this situation is that of choreographing a well–rehearsed script without
deviating from expected behaviors (Voss et al. 2008). Improvisation does not add to
the success of this kind of operations, and it might actually detract from the expe-
rience (however, we might not have enough power to detect such an effect). On the
other hand, service systems that deliver highly engaging experiences can also use the
opposite approach: that is, instead of relying on carefully choreographed experiences,
they can create a highly unstructured environment in which they allow high degrees
of improvisation. An example of these two different approaches can be seen in the
difference between eating in a traditional tavern in the suburbs of Rome versus eating
in a fancy restaurant near the Colosseum. Both can be highly engaging experiences,
but the first relies more on human contact through an unstructured environment,
while the latter creates the experience by carefully choreographing every detail of the
meal, from the table arrangement to the behavior of the servers. Since we are not
92
capturing this important difference in service type, our estimation might be suffering
from endogeneity problems due to missing explanatory variables, and therefore this
result has to be evaluated with caution. This finding, nonetheless points the way to
interesting follow–up research that explores such issues.
2.5 Discussion and Conclusions
In this paper, we used the insights of organizational behavior, strategy, and
service operations literature to build a model of service design focused on the role
of developing an improvisation competence. We developed a psychometrically sound
instrument to measure improvisation competence, combining the insights of previous
research to account for the different dimensions of improvisation (Kamoche et al.
2003, Crossan et al. 2005). We than developed a set of organizational–level and
process–level design choices that influence the development of such a competence,
and we analyzed their impact on service outcomes.
Our research shows that the success of service firms—especially in high–contact
environments—is not the simple outcome of a few choices but arises from the devel-
opment of a coherent system that encompasses a wide variety of components, from
the human element to technical choices. Using the framework presented by Roth and
Menor (2003a), we showed how service design choices and target market need to be
aligned in order to result in a favorable service encounter.
We further highlighted how organizational design choices in service environ-
ments need to operate in an holistic fashion in order to elicit the desired behaviors in
the employees. In other words, it is not sufficient to hire the right employees and train
them: the employees also have to possess adequate resources, and be able to rapidly
assess the state of the system through a constant and relevant flow of information,
93
as well as to be able to rely on processes that are designed accordingly (Vera and
Crossan 2005).
The intended service concept plays an important role in shaping the service
strategy, while at the same time the effort toward emotionally engaging customers and
conveying a feeling of authenticity has a significant direct effect on their satisfaction
with the service experience (Pullman and Gross 2004, Gilmore and Pine 2007). In
turn, the effect of the service concept and of the strategic design choices on the
employees’ behaviors—i.e. the ability to improvise—is mediated by the psychological
empowerment of the workers (Chase et al. 1984, Wemmerlov 1989, Randolph 1995,
Hartline and Ferrell 1996).
An important original contribution of our research is the role that process
design at the customer–contact level plays in addition to strategic–level design choices.
Process design has been an important part of service delivery systems design for a
long time, and a large part of academic as well as practitioner literature has been
concerned with the creation of methods to design and implement efficient and effective
processes (Shostack 1984, Heskett et al. 1994, Verma et al. 2001, Hill et al. 2002, Roth
and Menor 2003a). However, very few researchers have looked—to our knowledge—at
the relationship between the characteristics of the process design with an eye to the
way they get implemented. Service firms often increase the amount of processes that
are documented and standardized as way to create a more consistent and reliable
service delivery: since the start of service operations and marketing research, one
logical way to gain efficiencies in service delivery is to adopt a factory–like model, in
which everybody plays a very specific part without deviating from the assigned role
(Levitt 1972, 1976, Huete and Roth 1988, Stewart and Chase 1999, Frei 2006). We do
not argue that the increase in standardization of procedures can generally lead to an
increase in efficiency and reliability, but we show that—especially when dealing with
94

the human side of service delivery—there is a point in which process standardization
incurs in diminishing returns and then becomes counterproductive.
2.5.1 Limitations and Future Research
As for any research project, the results presented in this essay have to be con-
sidered in light on the limitations imposed by several factors. First, the sample size
does not allow for hasty generalizations. In order to confirm the findings of this study,
we will need to further expand our research using a more extensive data collection,
which would allow us to clarify several of the main issues emerged from this study.
Second, there are many aspects of service delivery in the hospitality industry that we
are not capturing in our study: in particular, due to privacy concerns, we could not
ask for identifying information on the specific chain or brand of the hotel in ques-
tion. Given that hotel groups often use different brands to target different market
segments, we had to rely on a very imprecise proxy for the type of service offered (star
rating). This shortcoming can be overcome by collecting data in collaboration with
sufficiently large hotel groups, which would allow us to directly observe the brand
variable. Finally, the hospitality industry presents characteristics that are not neces-
sarily generalizable to other types of services. For example, it is not straightforward
to generalize our findings about the curvilinear relationship between Scripting and
Serv–IC to higly standardized services like health care delivery. A further avenue of
research is therefore to test our model in service environments with different types of
approaches to process design.
95

Essay 3.A Typology of Service Delivery:
Econometric Analysis of theEffects of Improvisation on
Business Performance
Abstract
This paper builds on the previous two essays and asks the basic question of whether
Service Improvisation Competence (Serv-IC) impacts business performance. We de-
velop a conceptual typology of service delivery systems based on the degree of customer
experience (i.e. how much the service system engages customers emotionally, Pullman
and Gross 2004, Voss et al. 2008) and on the service delivery procedure’s degree of
scripting (i.e. the degree to which the service delivery processes are detailed and rigid,
Tansik and Smith 1991, 2000). Using the insights provided by Essay 2, along with the
typology developed here, we use a 2SLS estimator to assess the effect of Serv–IC on
performance indicators commonly used in the hospitality industry, namely Revenue
per Available Rooms (RevPAR), Average Daily Rate (ADR), and Occupancy. We
96

find that Improvisation generally has a positive influence on Occupancy in the high
service experience groups, and a negative effect on all performance measures in the
more standardized type of service. Moreover, improvisation appears to be a key factor
in adding value to the “scripted experience” service type (i.e. services that deliver a
high level of service experience in a highly scripted environment).
3.1 Introduction
This paper addresses the performance outcomes of the development of the
ability to deviate from standard procedures to accommodate customer–induced un-
certainty in the context of different face–to–face service delivery systems. We improve
upon the theory of Serv–IC developed and tested in Essays 1 and 2. In Essay 1, we
constructed a general theoretical framework and a literature–based nomological net-
work of construct relationships. In Essay 2, we operationalized and tested empirical
measures of the Serv–IC and other relevant constructs. Furthermore, we tested a
model of antecedents and outcomes of Service Improvisation Competence. In this
Essay, using a survey of hotel managers, we empirically test the impact of a Service
Improvisation Competence (Serv–IC)—the ability of frontline service employees to
deviate from established processes or routines in order to timely accommodate unex-
pected events, using available resources—on commonly used performance measures
for the hospitality industry, i.e. Revenue Per Available Room (RevPAR), Average
Daily Rate (ADR), and Occupancy.
We first develop a typology of hotel offerings based on the degree to which the
delivery system is intended to build an emotionally engaging experience for the guest
(Pine and Gilmore 1999, Voss 2004, Stuart and Tax 2004, Pullman and Gross 2004,
Voss et al. 2008, Zomerdijk and Voss 2011), and on the degree to which service delivery
97
procedures and routines are standardized and rigid (i.e., the degree of scripting of
the service delivery process Gioia and Poole 1984, Tansik and Smith 1991, 2000,
Victorino et al. 2008, Victorino and Bolinger 2012). Figure 3.1 presents a two–by–two
matrix that synthesizes our typology, resulting in five distinct types—(1) Personalized
Experiences, which provide a high degree of customer experience in a flexible and
loosely scripted environment (e.g., the customized stay offered by boutique hotels); (2)
Scripted Experiences, which provide a high degree of customer experience combined
with a highly scripted delivery system (e.g., the completely choreographed experience
delivered by themed hotels); (3) Standardized Services, which provide a reliable and
consistent service, with a low degree of customer experience (e.g., the efficiency and
high consistency offered by Fairfield Inn); (4) Unstructured Services, which do not
focus on customer experience nor on efficiency (e.g., a B&B that offers only a place
to stay for the night); and v) Middle Group, which comprises serviced that do not
clearly fall into any of the other “pure” types.
The aim of this research is to shed light on important aspects of process design
and implementation in service delivery, by testing the effects of Serv–IC within each
service delivery system type depicted in Figure 3.1, and offering deeper insights on
the outcomes of Serv–IC than those presented in Essay 2.
Traditional service literature distinguishes between personalized experiences,
where the service delivery adapts to the need of the customer, and standardized
services, where the service delivery system provides a single, highly reliable, service
offering. Customers can be equally satisfied with a highly efficient, no–frills service as
with a highly personalized experience, in that customer satisfaction has been shown
time after time to be related to the discrepancy between expectations and realized
98

Figure 3.1: A Typology of Service Delivery SystemsC
usto
mer
Exp
erie
nce
Hig
h Lo
w
Degree of Scripting Low High
Scripted Experience
(e.g. Themed Hotels)
Personalized Experience
(e.g. Boutique Hotels)
Standardized Service
(e.g. Fairfield Inn)
Unstructured Service
(e.g. Independent B&B)
Middle Group
(Do not clearly fall in the other categories)
experience (Parasuraman et al. 1988, 1991). However, as Frei (2006) has pointed out,
service organizations do not necessarily have to trade–off the quality of the experience
with operational efficiency, but can reap the benefits of both by managing carefully
their service delivery and their personnel. Take for example, some companies that
have strategies wherein they engage their customers, while at the same time, they
maintain a scripted and highly efficient environment (e.g. Southwest Airlines and
Shouldice Hospital, see Heskett 1983, Heskett and Sasser Jr. 2010). Such companies
are able to combine highly scripted processes and interactions with a focus on the
customer, and the ability to seamlessly deviate from standard routines when the
situation requires it (i.e., to improvise a solution to unforeseen customer needs). There
is a paucity of empirical studies exploring the effects of improvisation in different
categories of services. Using insights from the work of Ashby (1956, 1958) on requisite
variety—first applied to service delivery design by (Menor et al. 2001)—and from the
99

literature on organizational improvisation (Weick 1998, e Cunha et al. 1999, John
et al. 2006), we attempt to fill the gap in the literature by analyzing how design
choices lead to different results depending on the typology of service. More specifically,
we examine the impact of improvisation in service delivery systems across different
categories of hotels.
We find that the the impact of improvisation on service outcomes differs across
service types and that this difference goes beyond the classical dichotomy between
highly standardized and highly personalized services. Indeed, we find that, in gen-
eral, Serv–IC has a positive effect on service outcomes in highly experiential services
regardless of the level of scripting in service delivery processes. Through the use
of Serv–IC, service companies can successfully break the trade–off between efficiency
and personalization, allowing companies to provide a high level of experiential content
within a highly scripted environment.
Our findings contribute to the literature on service design and on to manage-
ment literature in several way. First, we add to the literature on service design and on
service experience by providing support to the theoretical conclusions of service design
scholars on the one hand (Surprenant and Solomon 1987, Frei 2006), and by provid-
ing empirical evidence of the role of operations, and more specifically service delivery
process design and implementation, in choreographing service experience (Voss et al.
2008, Zomerdijk and Voss 2011). Second, we provide a service typology that puts in
relation the characteristics of service delivery processes with the degree to which the
service can be considered experiential. In addition, we contribute to research on or-
ganizational improvisation by adding to the sparse empirical literature that explores
its effects on organizational outcomes, and by providing a useful classification of the
contingencies that influence its appropriateness as an organizational practice. Finally,
we contribute to managerial practice by creating a contingency–based view of process
100

design and of the appropriateness of empowering employees to break off procedures
and rules.
The paper is structured as follows. Section 3.2 provides a literature review of
the theoretical basis for our model, as well as discussing our typology in more detail.
Section 3.3 formalizes the hypotheses to be tested and describes the model that will
be estimated in order to test the hypotheses. Section 3.4 and 3.5 provide a description
of the data collection process and of the data analysis, respectively. Finally section
3.6 provides a discussion of the results and conclusions.
3.2 Theoretical Background
and Research Framework
The typologies illustrated in Figure 3.1 are the result of the design choices that
shape the service delivery system, and ultimately, the value proposition offered to the
customers. One of the most important decisions in service design concerns the choice
of the strategy employed to handle customer–induced uncertainty. Customers vary
in their preference, their behaviors, and their expectations, and every service system
has to deal with the fundamental decision on whether to accommodate individual
differences, or trying to minimize them by selecting customers, of managing their
expectations (Frei 2006).
Figure 3.2 provides a depiction of the service operations strategies typically
employed by service providers. We frame the traditional strategies in the context
of the degree of scripting and the customer experience. This framing is analogous
to our typology of service systems. The goal of this section is to discuss the role of
customer–induced uncertainty and to illustrate how the service typologies presented
101

in Figure 3.1 are the result of the strategy chosen to address the resulting variability
in service operations. For example, the adoption of a variability reduction approach
will result in the provision of a standardized service (on the lower right in Figure 3.1).
Figure 3.2: Scripting and Experience in Service Operations
Classic Variability Reduction (e.g. Fast Food)
Classic Accommodation
(e.g. Personal Chef)
Degree of Scripting LOW HIGH
HIGH
LOW
High costs are sustainable only if the system is capable of adapting
to a wide variety of customer requests
The customer is willing to trade off personalized treatment in exchange for efficiency,
consistency, and low prices
Upscale Restaurant
Family Restaurant
Tavern
This section will proceed as follows. First, we describe in detail the typology
introduced in the previous section. Then, we discuss the role of Customer–Induced
Uncertainty, and the variability that it introduces in service operations. Finally, we
discuss the traditional approaches to variability management, and how they lead to
different service types.
3.2.1 A Typology of Service Delivery Systems
The design of services, especially high–contact services, has to accomplish a
difficult balance. On the one hand, consistency and predictability are pivotal in
102

matching customer’s expectations. On the other end, the server’s ability to adapt to
individual customer’s needs plays a fundamental role in eliciting feelings of empathy;
it creates a personal connection that can go a long way in forging lasting relationships.
Service operations play an important part in achieving a balance between con-
sistency and adaptability, by specifying the behavior of the service delivery system
as well as individual servers. Acknowledging the performative role of high–contact
service employees, which is similar to that of an actor in a play (Grove and Fisk 1992,
Voss et al. 2008), the service literature refers to the guidelines for employees’ behav-
iors as scripts (Tansik and Smith 1991). Scripts can be characterized by their level
of detail, including the number of subscripts (script complexity), and the latitude
allowed to the performer in deviating or reinterpreting the script (i.e., script intensity
or divergence) (Tansik and Smith 2000). Thus, one salient measure of standardiza-
tion of service offerings can be represented by the degree to which service delivery
operations are outlined in repeatable procedures or routines, that is, in service scripts.
The common wisdom suggests that service operations, wherein work is conducted in
a scripted, factory–like manner, and which are shielded from the disrupting influence
of the customers, will achieve higher levels of efficiency, and, in turn, will drive down
operating costs (Levitt 1976, Chase 1978, Chase and Tansik 1983, Tansik and Chase
1988, Heskett et al. 1994, Soteriou and Chase 1998, Stewart and Chase 1999, Frei
et al. 1999, Cook et al. 2002).
Conversely, a long–standing stream of service literature has stressed the impor-
tance of the development of a connection with the customer in face–to–face services,
of conveying a feeling of caring and authenticity or, in other words, a spirit of ser-
vice (Pine and Gilmore 1999, Liljander and Strandvik 1997, Gilmore and Pine 2007).
Victorino et al. (2008) and Victorino et al. (2012) showed that the adoption of rigid
scripts in the interaction with customers can hamper such feelings, and therefore,
103

be detrimental to customer satisfaction, depending on the nature of the service en-
counter. In this vein, researchers have stressed the importance of service personaliza-
tion conveyed through the employees’ initiative and judgment, rather than through
predefined scripts (Berry 1980, Churchill Jr and Surprenant 1982, Surprenant and
Solomon 1987, Price et al. 1995, Hartline and Ferrell 1996, Gustafsson et al. 2005,
Sun et al. 2007).With competitors battling for customers’ attention and loyalty, the
emotional element in service delivery is becoming increasingly important for the re-
tention of customers through the creation of meaningful experiences. Thus, a growing
body of literature is concerned with the design and outcomes of the creation of expe-
riential services (Pine and Gilmore 1999, Pullman and Gross 2004, Voss 2004, Voss
et al. 2008, Zomerdijk and Voss 2010). In order to avoid semantic confusion, we
refer to Pullman and Gross (2004, p. 553) definition of a customer experience as
the creation of “emotional connection through engaging, compelling, and consistent
context.”
By considering the interaction of these two elements of service delivery (i.e.
the Degree of Scripting and the Experiential Content of the service), we created the
typology of service offerings described in Figure 3.1. On the horizontal axis we indicate
the degree of scripting, while on the vertical axis we have the experiential content
of of the service offering. We identify four groups that are strongly characterized
by high and low values of experience and scripting. In addition, we identify a fifth
group, which we call “Middle group”, that does not exhibit the strongly delineated
characteristics of the others.
On the upper left in Figure 3.1, we have service systems that are personalized
through the absence of a rigid set of rules. This service type is characterized by
providers with a skilled workforce, and that can deliver a wide variety of services.
Upscale boutique hotels are a good example of personalized service, in that they
104

specialize on satisfying the unique needs of the guests. Examples in other industries
would be a personal chef for the food industry, or a charter jet for the transportation
industry. To the lower right of Figure 3.1, we find the opposite type—standardized
services. Standardized service types offer a low–cost, extremely efficient solution,
with few options that allow for customization. This approach to service operations
in metaphorically similar to manufacturing companies (Levitt 1972, 1976, Huete and
Roth 1988). Business–oriented hotel chains—like Fairfield Inn—are a good example
of hospitality services that offer a standardized, relatively low cost solution, in which
operations are geared towards efficiency and convenience. In the food industry, Mc-
Donald’s is a traditional example of this type, and in the transportation industry
low–cost airlines, such as Ryan Air, are illustrative of this type.
In the upper right of Figure 3.1, we find service firms that are relatively high
on both experience and degree of scripting. The companies that manage to position
themselves in this category are in the position of reaping the benefits of both a
standardized environment—in terms of consistency and possibly of cost savings—and
a high degree of experiential content. A classic example of this type in the hospitality
industry are hotels that allow their guests to choose a theme, and build their stay
around that experience (for example, Joie de Vivre Hotels). In the food industry,
Medieval Times is a good example of combining both high operational efficiency
and customer engagement, offering staged experiences with the theatrical element of
the medieval joust. Similarly Southwest Airlines would occupy this position. They
combine the efficiency of their back–office operations with the freedom to interact
with the customers, and therefore, provide an entertaining flight experience.
The services in the lower–left part of Figure 3.1 are low on both counts, and
can be represented by a small Bed & Breakfast Hotels such as those often found near
train stations in European cities. They provide travellers with a convenient place to
105

sleep, and often, represent a way for the owners to extract revenue from unused real
estate. Since they provide little more than a place to sleep, they are not expected to
be either especially efficient or to provide any kind of experience. Finally, the middle
group is comprised of hotels that fall in between the strongly characterized types in
the other types. A hotel in this category could be a property that extracts its value
through location or that is able to create an experience while being somewhat in
between tightly scripted and loosely scripted services.
3.2.2 Customer–Induced Variability in Service Operations
One of the main problems in any kind of service operations is the management
of variability introduced in service systems by the presence of the customer (Berry
1980, Chase and Tansik 1983). Consistency and conformance to customers’ spec-
ifications are often considered the minimum requirements for quality services and
products (Garvin 1984); however, these goals are especially difficult to achieve in
service environments, where the presence of customers as active participants in the
delivery process significantly increases the variability that the system has to face.
This variability poses considerable problems to the system designer (Shostack 1977),
as well as significantly impacting service outcomes (Bitner et al. 1990). The design
of stable processes, which are able to produce service outcomes of consistent quality,
is further complicated by the high rate of introduction of new services offers and
processes (Menor and Roth 2007, 2008a), as well as the dependence of performance
outcomes on customer perceptions (Pine and Gilmore 1999).
Frei (2006) discusses several different types of customer-induced variability in
services, namely: arrival variability, request variability, capability variability, effort
variability, and subjective preference variability. Each different kind of variability has
106
to be in some form managed by the service company. Even if the choice is to ignore
variability and focus on other aspects, such design choice has to be deliberate, rather
than left to chance. Moreover, a minimum amount of accommodation is expected by
customers, even if such accommodation is not a competitive priority. The variabil-
ity introduced in the service delivery system by the customers compounds with the
variability inherent in the operation of any system of connected processes.
Following Menor et al. (2001), we apply Ashby’s theory of requisite variety
to understand variability in services and the different ways to face it (Ashby 1956,
1958). We propose that Serv–IC offers a way for service firms to generate the internal
variety that is required to manage customer–induced variability. Requisite variety can
be conceptualized as shown in figure 3.3. The system experiences a set of disturbances
(D) to which it responds with a set of responses (R). When the system responds to
a disturbance di with a response rj, it generates an outcome zij. The goal of the
system designer is therefore the development of a set of responses R that maximize
the outcomes, given the set of disturbances D.
It can be inferred that in highly variable environments, where D is large,
the design of a maximizing response to any possible disturbance would result in an
extremely complex system, in other words, the system has to provide enough internal
variety to accommodate the variety of external disturbances. However, in order to
develop a system capable of providing an adequate set of responses (R), the system
designer has to consider the the variance in the outcomes zij, along with the size of the
set of disturbances (D). If the variance of the outcomes is low, than the performance
difference of responding to, say, a disturbance di with ri or to a different disturbance
di+1 with the same response ri can be negligible. On the other hand, if the variance
of the outcomes is large, than designing a system that provides adequate responses
107

Figure 3.3: Requisite Variety
Adapted from Ashby (1958)
to disturbances is crucial to the performance outcomes.
Hence, if D is large and the variance of the outcomes is high, the system has to
provide a set of responses at least close to the size of D. In order to create system that
can adequately respond to external variability, the designer can therefore act on each
of the three element at play: the variety of D, the variety of R, and the variance of the
outcomes. The traditional strategies employed to face customer–induced uncertainty
can be classified in two categories: (1) the ones that aim at reducing the variety of
D, or the variance of the outcomes, in order to be able to reduce the set of responses
R, and therefore achieve cost savings, or (2) the ones that attempt to increase the set
of responses R, in order to match the variety of disturbances, D (table 3.1). In the
words of Francis Frei, “[w]herever customer-introduced variability creates operational
issues for a company, managers face a choice: Do they want to accommodate that
variability or reduce it?” (Frei 2006, p.95). Table 3.1 provides a synthesis of the two
108

Table 3.1: Approaches to the Management of Customer–Induced Variability
approaches to management of variability in service systems.
3.2.3 Variability Reduction Approaches
The variability reduction approach has been the focus of much service opera-
tions literature, and can take different forms. Using the requisite variety framework
in figure 3.3, the goal of such strategies is to reduce the possible values in D, the
disturbances that perturb the reliability and consistency of service processes, and
therefore being able to rely on a stable and limited set of responses (R) that the
delivery system has to provide. This can be accomplished by reducing the variety in
customer requests, reducing the intrinsic variance in the service processes themselves,
or decoupling the front– and back–stage of the service system as much as possible.
Take for example, managing the back–office operations in a factory-like fashion, which
does not require constant adaptation to customer–induced variations.
It should be noted that these strategies are seldom employed in isolation, rather
some combination of them is likely to be present in any variance–reduction effort.
Furthermore, the realization of the benefits from one type of variability–reduction
effort can be mediated or contextual to some degree on the implementation of the
other ones. For example, the reduction in customer–induced variability can have little
109

Figure 3.4: The Service Encounter as the Locus of Variation
effect on efficiency if it is not accompanied by the development of stable processes.
However, we find it convenient to classify the literature according to these different
approaches because they are conceptually distinct and allow for a more systematic
analysis of the relevant scholarship.
The first method—the reduction of variety of customer requests—is commonly
employed in many settings (Fitzsimmons and Fitzsimmons 2008). The use of menus
in restaurants is an effective way of constraining customer request variability, by
limiting available choices (Levitt 1976, Frei 2006). Similarly, implementing a system of
reservations (e.g., doctor appointments) greatly reduces the variability in customers’
arrival times. Shouldice Hospital built a significant competitive advantage by taking
this approach to an extreme. It does not allow any choice for their customers. In
fact, they perform only one type of surgery on patients that are unlikely to have
complications (Heskett 1983). In the framework depicted in figure 3.4, this reduction
of customer variety corresponds to the management of the left arrow, representing
customers requests.
Another issue that concerns the left side of figure 3.4 is the amount of vari-
ability in customer satisfaction levels, given a change in the response to a specific
request (Frei 2006). In the terms of the requisite variety matrix, if the customer
110

presents disturbance d1, and the system responds with r2 instead that with the opti-
mal response r1, how different would the satisfaction level of the customers be, and
how much variation from the preferred outcome would they be willing to tolerate?
In other words, what is the variance in the outcomes zij? This issue is part of the
“subjective preference” category of customer–induced variability (Frei 2006) but is
particularly important for our conceptual typology 3.1 in that, if such variance is low,
there is no need to either reduce D or increase R. Service firms can reduce this type
of variability by actively managing customer expectations or by targeting customers
with high levels of tolerance (e.g., McDonald’s).
The reduction in the variety of disturbances can also be achieved by acting
on the supply side, represented by the right side of figure 3.4. Using the insights
gained from industrial operations (Huete and Roth 1988), the creation of detailed and
repeatable processes has played an important role in the reduction of the disruptive
effects of variability (Chase 1978, Chase and Tansik 1983, Frei et al. 1999). The use
of blueprints in the design of service systems has gained considerable popularity due
to the success of this approach in reducing process and outcome variability (Levitt
1976, Shostack 1984, 1987). Blueprints can provide a firm basis of operations and
allow consistent planning and execution activities, therefore reducing variation in
the system. By developing standardized processes, the service firm can both reduce
disturbances that originate within the system itself, as well as limiting customer’s
choices, and therefore reduce external disturbances.
A different approach aimed at reducing supply–side variability is offered by the
customer contact model, first developed by Chase (1981). This stream of literature
revolves around the idea that disturbances to service processes can be contained by
decoupling the contact activities from the back–office activities (Chase and Tansik
1983, Kellogg and Chase 1995). Instead of directly reducing the amount of distur-
111

bances that influence the system, this decoupling focuses on reducing the portion of
the system that is perturbed by the disturbances to the smallest possible subsystem.
By isolating the “technological core” from external variability, the repercussions of
external disturbances to the system are limited to the less standardized processes.
3.2.4 Accommodation of Variability Approaches
In contrast, the service supply side can be designed in order to accommodate
the variability, rather than reducing it or minimizing its effects: the creation of a
flexible system, capable of responding to a wide variety of disturbances can lead to a
substantial competitive advantage in service businesses (Voss et al. 2008). The con-
cepts of flexibility and agility have been borrowed from the studies of manufacturing
operations and refers to the ability of the production system to respond to variations
in the characteristics of demand, such as volume, location, or assortment (Sethi and
Sethi 1990, Upton 1997, Roth 1996). In services, flexibility still retains the same
meaning of adaptation to demand variation, but some of the dimensions can differ
(see for example Menor et al. 2001, for a detailed discussion of agility and flexibility
in service systems).
Volume and timing considerations are usually addressed in service operations
by introducing cross–training and flexible scheduling practices (e.g. Iravani et al. 2005,
Malhotra and Ritzman 1994). By being able to rearrange the activities and the sched-
ules of workers in a relatively small amount of time, service operations can effectively
increase their ability to respond to variations in quantity and quality of customers.
Similarly, technology has been proposed as an enabler of increased flexibility in the
service delivery system (Bitner et al. 2000). By providing richer information and the
ability to communicate and act on different parts of the system, the implementation
112

of technology can significantly increase the range of possible responses to customers‘
needs.
The service literature identifies two different classes of methods aimed at in-
creasing the set of responses available in service delivery. The first is to develop
procedures and routines that can be relied upon to manage variation in the service
encounter, commonly referred to as service customization. The second is to foster
employee empowerment and enable customer contact personnel to devise their own
way to respond to customer–induced variability. Service researchers have stressed the
similarities between high–contact service delivery and theatrical (or musical) perfor-
mances. They consider the difference between plays that are completely predeter-
mined by the script at hand, and plays that rely on minimal scripting and evolve
through the use of improvisation in order to engage the audience (Grove and Fisk
1983, 1992, Stuart and Tax 2004, Vera and Crossan 2004, McCarthy et al. 2011).
In this context, the design of service scripts is at the center of the development
of the service strategy, which ultimately determines how customer–induced variabil-
ity will be addressed. Broadly defined, “a script is a schema held in memory that
describes events and behaviors (or sequences of events or behaviors) appropriate for
a particular context” (Gioia and Poole 1984, p.450). More specifically, when refer-
ring to an organizational setting we will define a script as “a pattern of behaviour
or an operating routine that is triggered by some environmental stimulus” (Tansik
and Smith 1991, p.35). Tansik and Smith (1991, 2000) identify two roles of scripts in
service development: first, the definition of jobs and responsibilities, which constitute
the foundations for training and evaluations; and second, “serve as system design and
control tools” (Tansik and Smith 2000, p.242).
Furthermore, scripts can serve as templates to devise new action plans (i.e.
new scripts) when the old one fail. The design of scripts for customer contact ser-
113

vice workers allows management to increase control over the service encounter, and
therefore increase the efficiency as well as the consistency of the service offering, by
standardizing the behavior of service workers across different encounters. This kind
of standardization of service delivery has been advocated as a way to “industrial-
ize” services and therefore gaining the same kind of efficiencies that are found in
manufacturing environments (Levitt 1972).
However, the scripting of behaviors can decrease the feeling of authenticity that
is valued by customers in many service situations. Although some standardization
across service encounters is usually expected and desired by customers, an excessive
reliance on predefined routines can detract from the service experience, especially in
high–contact service situations (Victorino et al. 2008, 2012). Also, when customers
expect a substantial degree of personalization, the scripting of service encounters
can fail to provide the necessary flexibility. On the one hand, the contingencies
that the service system experiences may bee too many to plan for, and it could be
almost impossible to design a script for any possible occurrence (John et al. 2006). In
addition, the excessive reliance on scripts can give management the illusion of control,
while the reality of service encounters is characterized by constant deviations from
the planned behavior. This is analogous to the discrepancy highlighted by strategy
researchers between planned and realized strategy (Mintzberg 1978, 1994, Eisenhardt
and Tabrizi 1995, Weick 1998).
If the goal of the service firm is that of creating an engaging and memorable ex-
perience, the excessive reliance on scripts can be detrimental to customer engagement
and, ultimately, to customer satisfaction (Gilmore and Pine 2007). There seem to be
a trade–off between the degree to which a service company can successfully emotion-
ally engage customers, and the degree to which it can achieve efficient operations by
the careful design of scripts. Traditionally, highly standardized services (like the ones
114

in the lower right of Figures 3.1 and 3.2) rely on high levels of scripting as a way to
decrease their operating costs and provide a reliable and consistent offering, while sac-
rificing the development of a meaningful personal relationship with the customer. On
the other hand, personalized services exhibit low level of scripting—therefore sacrific-
ing operational efficiency—in order to provide a completely personalized experience,
and be able to charge a higher price.
As discussed earlier, the main diagonal in Figure 3.2 illustrates this trade–off
with different types of restaurants: in the lower right we find services that do not
offer high variety and rely on a low–cost, highly standardized service proposition,
such as fast food restaurants. Moving along the diagonal, we find services that offer a
limited menu, but do not necessarily script every aspect of the customer interaction,
such as taverns. Continuing on the diagonal, we move towards increasing levels of
personalization, through regular sit–down restaurants—which usually offer a larger
amount of choices compared to the previous examples—up to caterers who are able
to provide a customized meal, although usually not allowing for last minute changes.
Finally, on the extreme of high experience and low scripting, we find completely
personalized and unscripted services, as would be that provided by a personal chef.
However, this trade–off diagonal does not account for all the different types of
services that we find in many industries. In particular, it is possible to move above the
diagonal, and reap the benefits of both a highly scripted and a highly engaging ser-
vice experience. Drawing from the analogy between artistic performances and service
delivery, many authors have noted that actors and musicians often are able to freely
adapt to contingencies—introduced by the audience or by fellow performers—while
still retaining the structure of the performance and without loosing the advantages
provided by scripts or scores (Berliner 1994, Peplowski 1998). Similar to organiza-
tional processes and routines, scripts and scores provide a coordination mechanism
115

that helps make sense of the current turn of events (Vera and Crossan 2005, Crossan
and Hurst 2006, John et al. 2006, Akgun et al. 2007, e Cunha et al. 2009).
Drawing from the theoretical developments as we proposed in Essay 1 of this
dissertation, we argue that some firms possess a specific competence, which we term
Service Improvisation Competence, that allows them to successfully deviate from or-
ganizational processes and routines, in order to face customer–induced uncertainty.
Service Improvisation Competence (Serv–IC) is formally defined as the systemic abil-
ity of service firm’s employees to deviate from established organizational processes
or routines, in order to timely respond to unanticipated events using the available
resources.
3.3 Research Model and Hypotheses Development
The main goal of this paper is to assess the impact of Serv–IC on the per-
formance of service firms. We hypothesize that the impact of improvisation will be
contingent on the typology of the service as described by the degree of scripting em-
ployed and by the degree to which the service delivery system is designed to engage
the customer in an emotionally–charged experience. The service literature has consis-
tently shown that the creation of positive service experiences has a significant impact
on customer satisfaction, and a growing body of literature is devoted to the analysis
of the design elements that impact the creation of such experiences (Pullman and
Gross 2004, Voss et al. 2008, Zomerdijk and Voss 2010, 2011). Given the potential
importance of possessing an improvisation competence in creating memorable expe-
riences, it is worthwhile to examine how and when allowing improvisation is a good
strategy to deliver what customers want.
In this section, we advance a set of hypotheses on the effects of Serv–IC within
116

the different groups identified in the previous section. Further, we propose a theoret-
ically based set of hypotheses on the organizational and environmental determinants
of Serv–IC in service environments.
3.3.1 Effects of Serv–IC on Business Performance Outcomes
Building on the insights provided by the service typology depicted in Fig-
ure 3.1 and on the insights on variability management provided by Figure 3.2, we
divide the different services according to the way in which they deal with customer–
induced uncertainty, as well as the resulting service proposition: (1) on the upper left
quadrant—along the main diagonal—we find the classic accommodation strategy,
which is characterized by a high experiential content and a low degree of scripting,
and corresponds to Personalized Experiences in Figure 3.1; (2) on the other side of
the diagonal in Figure 3.2, we have the classic reduction, with low experiential con-
tent and a high degree of scripting, corresponding to the Standardized Service type
in Figure 3.1; (3) above the diagonal in Figure 3.2, we find services that manage to
achieve a high experiential content combined with a high degree of scripting, corre-
sponding to the Scripted Experiences type in figure 3.1; (4) below the main diagonal,
we have services that do not actively manage the experience and are loosely scripted,
i.e. Unstructured Services; (5) finally, there are service offerings that are in the middle
between all of the previous groups, which we will call Middle Group.
We expect the presence of Serv–IC to have different outcomes across the service
types, given the general organizational and operational characteristics of the service
system. Serv–IC can work in concert with other policies and procedures, or it can
produce a disruption of service delivery given the preferences of the customers. For
example, customers that walk into a fast food expect a predictable and reliable service
117
delivery.
From our previous discussion as well as from the literature on experiential ser-
vices, we can infer that service delivery employees that convey a sense of authenticity
and create a meaningful connection with the guests will markedly increase customer
satisfaction (Pugh 2001, Gilmore and Pine 2007, Voss et al. 2008). Victorino et al.
(2012) also found that interactions that follow tight scripts without allowing for vari-
ations often appear mechanical and insincere. We posit that, in general, service
delivery systems with a high experiential content will present a more favorable envi-
ronment for improvisational activities (John et al. 2006, Palmer 2010), and therefore
the presence of a Service Improvisation Competence (Serv–IC) will lead to favorable
service outcomes in the two subgroups with high experiential content.
Hypothesis 1. Serv–IC will have a positive influence on service perfor-
mance outcomes in the Personalized Experience and Scripted Experience
service types.
Additionally, we have noted that Serv–IC can be a valid mechanism to move
up from the diagonal in Figure 3.2, and position the service offering in the Scripted
Experience type. Hence, while Serv–IC is likely to be beneficial in both the high
experience groups, it is necessary in order to be able to prove a Scripted Experi-
ence to customers. Therefore, we argue that the positive impact of Serv–IC will be
particularly marked in the hotels that belong to the Scripted Experience type.
Hypothesis 2. Serv–IC will have a stronger impact on hotels in the Scripted
Experience type than in the other types.
As previously discussed, the use of improvisation in highly standardized service en-
vironments can lead to a disruption of service delivery systems that are built with
118

a focus on efficiency and reliability (Heskett et al. 1994, Soteriou and Zenios 1999,
Stewart and Chase 1999, Frei 2006). The failure to apply adequate processes to the
current situation, without the omission or modification of the steps of a routine, can
result in serious repercussions on the service delivery system and on the business
outcomes. Stewart and Chase (1999) discuss the potential consequences of this class
of errors—referred to as “skill–based errors” (Stewart and Chase 1999, p. 243)—on
service quality. These authors conclude that rule misapplication as well as interrup-
tions or omissions in the execution of a service delivery routine are major sources of
service failures.
This kind of process–based and reliability–oriented conception of the ser-
vice delivery is particularly fitting in the Standardized Service type, where the ser-
vice provider is adopting a variability reduction approach to contrast the effects of
customer–induced uncertainty. Therefore, we hypothesize that the use of improvisa-
tion in services built around the classic accommodation strategy (i.e. low experience
and high scripting) will negatively affect service performance.
Hypothesis 3. Serv–IC will have a negative influence on service perfor-
mance outcomes within the Standardized Service Type.
The services that are below the main diagonal are characterized by low emo-
tional involvement (low experience) and low scripting. They are usually simple ser-
vices that can be delivered with a minimal amount of planning and without being
particularly engaging. A small cafeteria is a good food service example. In this kind
of service, some improvisation is likely necessary but not required (or expected by
customers) as much as for the highly experiential services; therefore we hypothesize
that Serv–IC will have no effect on service outcomes in this type.
Hypothesis 4. Serv–IC will have no effect on service performance outcomes
119

within the Unstructured Service Type.
The services in the Middle Group are not characterized by the extreme features
that we can see in the other groups. They are widely diverse and exhibit values
around the average in at least one of the two characteristics that we are using in our
classification. Although it is plausible that improvisation could have a positive or
negative effect in some subgroup of this category, we posit that—on average—there
will be no effect of Serv–IC in this type.
Hypothesis 5. Serv–IC will have no effect on service performance outcomes
within the Middle Group.
The next subsection discusses the estimation of the the antecedents of Serv–IC
which will provide a more complete theoretical framework as well as replicating some
of the results from paper 2.
3.3.2 Antecedents of Service Improvisation Competence
Previous literature as well as the results presented in Paper 2 suggest that
the estimation of the outcomes of Serv–IC in terms of hotel performance is likely to
be subject to endogeneity problems, due to omitted factors that can influence both
an organization’s development of a Service Improvisation Competence (Serv–IC) and
its financial outcomes. We, therefore, propose two instruments that can be used in
order to remove the correlation between predictors and error from the estimation the
model necessary to test Hypotheses 1 to 5 (Angrist et al. 1996). In addition, the
instrumentation can be useful in removing measurement error from the regressors
(Greene and Zhang 2003), leading to more accurate estimates. There are two cate-
gories of variables that influence the expression of a service improvisation competence
in the delivery system: the first is constituted by internal factors (i.e., organizational
120

design choices), and the second is constituted by external factors (i.e., the amount
and type of disturbances introduced in service operations by the environment and,
more specifically, by the customers). Therefore, the instruments that we propose are
Employee Empowerment (EMP) and Customer Induced Uncertainty (CIU).
In order to be used to identify the coefficients in the equations that we want
to estimate, the instrumental variables (IVs) have to satisfy two basic conditions: (1)
they need to be uncorrelated with the error ε; and (2) they need to be correlated with
the instrumented variable (Stock and Yogo 2002, Angrist and Pischke 2009).
Customer Induced Uncertainty (CIU) satisfies both conditions. The definition
of Serv–IC itself includes the manifestation of improvisational behaviors as a response
to an external disturbance; therefore, the more the customers introduce variation into
the system, the higher the likelihood that customer–contact employees will improvise,
given that they possess the necessary competence (Tansik and Chase 1988). In addi-
tion, we argue that CIU does not have a significant direct effect on the performance
measures that we are investigating. Service marketing literature has repeatedly shown
that the key element in generating customer satisfaction and revenue, is the way in
which variation is handled rather than how much variation is present in the system
(Fornell and Wernerfelt 1987, Bitran and Lojo 1993, Tax et al. 1998, Schneider and
Bowen 1999, Froehle 2006). Customer induced uncertainty has no impact on revenue
and loyalty beyond that of providing the opportunity for firms to choose how to han-
dle it. As we argued earlier, minimization or accommodation of variability can both
be financially successful strategies.
Hypothesis 6. Higher levels of Customer Induced Uncertainty in service
delivery will be related to a higher relative degree of Serv–IC.
Similarly, Empowerment (EMP) satisfies both conditions to be a candidate as
121

a valid instrument. First, empowerment is a necessary condition for service employees
to engage in improvisation. If managers do not allow the necessary latitude to front
line employees, they will be less likely to deviate from standard routines. In addi-
tion, we showed in Essay 2 that psychological empowerment completely mediates the
relationship between the service strategy design choices and Serv–IC; and therefore,
no design choice is required to be introduced in predicting Serv–IC, if empowerment
is present. As for the second requirement, that the instrument be uncorrelated with
the error of second–stage equation, the literature has repeatedly shown that employee
empowerment has no direct effect on service outcomes (Hartline and Ferrell 1996).
Indeed the relationship between employee empowerment and service outcomes are
always mediated by the actual behavior of service employees, as in this case they are
mediated by Serv–IC.
Hypothesis 7. Higher levels of Empowerment of service delivery personnel
will be related to a higher relative degree of Serv–IC.
3.3.3 Model
In order to test the hypotheses proposed in the last section, we propose a two-
stage model in which the first stage will estimate the impact of Customer–Induced
Uncertainty (CIU) and Empowerment (EMP) on Service Improvisation Competence
(Serv–IC). The second stage will estimate the impact of Serv–IC on hotel performance,
within the previously identified groups.
The second stage in Equation 3.4 constitutes the focus of this research, and
122

provides the basis for testing hypotheses 1 through 5.
Ln(Performance) = β0 + β1Rooms+ β2Stars+ β3hehd+ β4held
+ β5lehd+ β6Mid+ α1Ln(Serv − IC)
+ α2Ln(Serv − IC) ∗ hehd+ α3Ln(Serv − IC) ∗ held
+ α4Ln(Serv − IC) ∗ lehd+ α5Ln(Serv − IC) ∗Mid
+ ε (3.4)
where hehd, held, lehd, and Mid are dummy variables for the Personalized Expe-
rience, Scripted Experience, Standardized Service, and Middle group, respectively.
Ln(Performance) is the logarithm of the performance measure used as outcome, and
Ln(Serv–IC) is the logarithm of the Service Improvisation Competence measure. The
coefficients of the interaction terms allow us to estimate the difference between each
of the groups and the reference group, constituted by the group that is low in both
experience and degree of scripting.
123
The specification of the model in Equation 3.4, in addition to allowing us to
assess the simple slopes (i.e. the effect of Serv–IC within each group) allows us to
evaluate the differences between groups by testing the linear combinations of α1 with
the coefficients of the interaction terms (Aiken et al. 1991). The variables of the
coefficients identified with α in Equation 3.4 are endogenous, and OLS estimation
would not produce unbiased estimates (Greene and Zhang 2003, Wooldridge 2009).
We therefore estimate the first stage regressions in Equations 3.5, 3.6, 3.7, 3.8, and
3.9, which will eliminate the endogeneity bias, and will allow us to test hypotheses
6 and 7. The model that we will estimate will include a first stage regression—in
addition to the second stage of equation 3.4—of the form:
Ln(Serv − IC) = γ0 + γ1Rooms+ γ2Stars+ γ3hehd+ γ4held
+ γ5lehd+ γ6Mid+ γ7Ln(CIU)
+ γ8Ln(CIU) ∗ hehd+ γ9Ln(CIU) ∗ held
+ γ10Ln(CIU) ∗ lehd+ γ11Ln(CIU) ∗Mid+ γ12Ln(EMP )
+ γ13Ln(EMP ) ∗ hehd+ γ14Ln(EMP ) ∗ held
+ γ15Ln(EMP ) ∗ lehd+ γ16Ln(EMP ) ∗Mid+ δ (3.5)
124

In addition to the instrumentation of the Serv–IC variable, given that the
interaction terms of the dummy variables with Serv–IC are endogenous as well, the
first stage will also estimate:
Ln(Serv − IC) ∗ hehd = γ0 + γ1Rooms+ γ2Stars+ γ3hehd+ γ4held
+ γ5lehd+ γ6Mid+ γ7Ln(CIU)
+ γ8Ln(CIU) ∗ hehd+ γ9Ln(CIU) ∗ held
+ γ10Ln(CIU) ∗ lehd+ γ11Ln(CIU) ∗Mid+ γ12Ln(EMP )
+ γ13Ln(EMP ) ∗ hehd+ γ14Ln(EMP ) ∗ held
+ γ15Ln(EMP ) ∗ lehd+ γ16Ln(EMP ) ∗Mid+ δ (3.6)
Ln(Serv − IC) ∗ held = γ0 + γ1Rooms+ γ2Stars+ γ3hehd+ γ4held
+ γ5lehd+ γ6Mid+ γ7Ln(CIU)
+ γ8Ln(CIU) ∗ hehd+ γ9Ln(CIU) ∗ held
+ γ10Ln(CIU) ∗ lehd+ γ11Ln(CIU) ∗Mid+ γ12Ln(EMP )
+ γ13Ln(EMP ) ∗ hehd+ γ14Ln(EMP ) ∗ held
+ γ15Ln(EMP ) ∗ lehd+ γ16Ln(EMP ) ∗Mid+ δ (3.7)
125

Ln(Serv − IC) ∗ lehd = γ0 + γ1Rooms+ γ2Stars+ γ3hehd+ γ4held
+ γ5lehd+ γ6Mid+ γ7Ln(CIU)
+ γ8Ln(CIU) ∗ hehd+ γ9Ln(CIU) ∗ held
+ γ10Ln(CIU) ∗ lehd+ γ11Ln(CIU) ∗Mid+ γ12Ln(EMP )
+ γ13Ln(EMP ) ∗ hehd+ γ14Ln(EMP ) ∗ held
+ γ15Ln(EMP ) ∗ lehd+ γ16Ln(EMP ) ∗Mid+ δ (3.8)
Ln(Serv − IC) ∗Mid = γ0 + γ1Rooms+ γ2Stars+ γ3hehd+ γ4held
+ γ5lehd+ γ6Mid+ γ7Ln(CIU)
+ γ8Ln(CIU) ∗ hehd+ γ9Ln(CIU) ∗ held
+ γ10Ln(CIU) ∗ lehd+ γ11Ln(CIU) ∗Mid+ γ12Ln(EMP )
+ γ13Ln(EMP ) ∗ hehd+ γ14Ln(EMP ) ∗ held
+ γ15Ln(EMP ) ∗ lehd+ γ16Ln(EMP ) ∗Mid+ δ (3.9)
where the dummy variables are coded in the same way as for Equation 3.4, and
CIU and EMP are measures of Customer-Induced Uncertainty and Empowerment,
respectively. The next section will describe in detail the data collection process and
the measures used to implement this model. Then, we will describe the results of the
model estimation and the implications for our research questions.
126

3.4 Data Collection and Measures
To test our hypotheses, we conducted a survey of hotel managers in charge
of employees that occupy positions in contact with customers. The data has been
collected through the Center for Hospitality Research (CHR) at Cornell University:
when singing up to get access to the resources offered by the CHR, subscribers are
invited to classify their jobs and are asked if they are willing to be contacted for par-
ticipation in future research studies. We sent 3,500 email invitations to subscribers
who indicated that they occupy management positions in the hospitality industry.
The unit of analysis of our study is the individual hotel property, and therefore we
excluded from the analysis managers in charge of multiple hotels or in corporate posi-
tions. The job titles of managers in our survey are typically those of Hotel Manager,
Front Desk Manager, Director of Rooms, Food & Beverage Director, and similar. Of
the 3500 invitations sent, we received 561 responses. We then deleted 310 responses
that were more than 90 percent incomplete and 4 responses of individuals who did
not fall into our sample frame (i.e. they were not working in hotels, or they indicated
that their direct subordinated did not have a significant amount of customer con-
tact). In addition two cases emerged as multivariate outliers, and were more closely
examined: one of them was constituted by identical responses to all questions (i.e. ,
the respondent answered “strongly agree” to everything), and the second presented
very odd operating and demographic characteristics (a CEO of a luxury hotel with
20 rooms and 3 years of experience in the hotel industry). After deleting these cases,
the survey resulted in 242 usable observations, corresponding to a 7 percent response
rate. Tables 3.2 and 3.3 summarize the composition of our sample according to hotel
classification and operating characteristics, and 3.4 provide information about the
survey respondents. As expected by the typical profile of managers that are inter-
127

ested in getting access to research results, the sample is skewed toward higher–tier
properties. In addition, Table 3.4 provides summary statistics and correlations for all
the variables used in the analysis.
Table 3.2: Hotel Rating and Categories
Variable PercentStar Rating
1–3 Stars 29.31%4 Stars 39.53%5 Stars 31.16%
Hotel ClassBudget and Economy 4.07%Midscale 22.17%Upscale 31.22%Luxury and Deluxe 39.82%Other 2.72%
Hotel CategoryFull–Service Hotel 51.34%Limited–Service Hotel 6.70%Resort Hotel 23.21%Other 18.75%
Table 3.3: Hotel Operating Characteristics
Variable Mean Std. Dev.Number of Rooms 356.6 596.3Occupancy .693 .154ADR 194.48 151.56
128

Table 3.4: Respondent Characteristics
Variable Median Group Modal GroupExperience in Hotel Industry 16–25 Years 16–25 YearsTenure with Current Employer 2–3 Years 4–6 YearsExperience as a Manager 7–10 Years 11–15 and 16–25 YearsEducation Some College Bachelor’s DegreeAge 45–54 Years 35–44 Years
129

Tab
le3.
5:C
orre
lati
ons
and
Des
crip
tive
Sta
tist
ics
Mea
nStd
.D
ev.
12
34
56
78
910
1112
1314
151.
Occ
upan
cy0.
695
0.15
21
2.A
DR
193.
428
151.
104
0.06
41
3.R
evP
AR
134.
586
112.
296
0.31
5***
0.94
3***
14.
Room
s35
8.09
159
7.21
10.
228*
**0.
098
0.18
5***
15.
Sta
r3.
995
0.83
1-0
.019
0.42
6***
0.38
0***
0.05
41
6.D
OS
4.06
41.
218
0.06
1-0
.141
**-0
.097
0.05
50.
066
17.
EX
P5.
940
0.86
90.
075
0.15
0**
0.12
4*0.
016
0.18
0***
0.17
8***
18.
EM
P5.
573
0.89
60.
146*
*0.
064
0.08
90.
166*
*0.
080
0.08
30.
209*
**1
9.C
IU4.
609
1.18
4-0
.038
0.08
00.
064
-0.1
29*
0.03
00.
012
0.00
30.
075
110
.Ser
v-I
C5.
200
0.90
10.
162*
*0.
159*
*0.
165*
*-0
.045
0.06
90.
001
0.44
5***
0.42
1***
0.26
9***
111
.Scr
ipte
dE
xp
erie
nce
0.19
40.
396
0.08
9-0
.060
-0.0
34-0
.010
0.07
00.
547*
**0.
468*
**0.
138*
*-0
.050
0.17
3**
112
.P
erso
nal
ized
Exp
erie
nce
0.15
10.
357
-0.0
730.
186*
**0.
116*
-0.0
660.
082
-0.3
96**
*0.
384*
**0.
068
0.04
40.
265*
**-0
.207
***
113
.Sta
ndar
diz
edSer
vic
e0.
095
0.29
4-0
.149
**-0
.071
-0.0
90-0
.004
-0.0
400.
305*
**-0
.328
***
0.00
10.
087
-0.2
15**
*-0
.159
**-0
.136
**1
14.
Unst
ruct
ure
dSer
vic
e0.
194
0.39
6-0
.060
-0.1
15*
-0.1
21*
-0.1
03-0
.115
*-0
.460
***
-0.4
90**
*-0
.150
**-0
.065
-0.2
32**
*-0
.241
***
-0.2
07**
*-0
.159
**1
15.
Mid
dle
0.36
60.
483
0.11
7*0.
046
0.09
60.
144*
*0.
000
0.03
7-0
.069
-0.0
410.
012
-0.0
24-0
.373
***
-0.3
21**
*-0
.246
***
-0.3
73**
*1
*p<.1
**p<.0
5**
*p<.0
1
130

In order to prepare the data for analysis, we proceeded with the classification
of hotel properties according to the typology that we proposed in sections 3.1 and
3.2. We needed to split the sample in groups that represent relatively extreme char-
acteristics, and therefore provide insights on the differences in service typologies. We
therefore split the sample by defining observations to be high on the variables of in-
terest (i.e. Experiential Content and Degree of Scripting) if the observation exhibited
a value higher that one fourth of a standard deviation away from the mean. Similarly,
values lower than the mean minus one fourth of a standard deviation were considered
low on the variable. Table 3.6 shows the characteristics of the groups with respect to
the variables used in the analysis as well as other variables that we collected through
our survey instrument.
We conducted a single factor ANOVA for each variable reported in table 3.6
and if the omnibus F value for the ANOVA was significant (p < .1), we performed
multiple comparisons using the Tukey method. Given the exploratory nature of the
analysis, aimed at identifying differences between the groups in our classification, we
considered significantly different types if they exhibited a p–value of .15 or less in the
multiple comparisons. Overall, the two High Experience types (1 & 2) exhibit a higher
amount of customer contact, a larger amount of time spent in meetings, and a higher
focus on employee empowerment than the Low Experience groups. The Scripted
Experience Type (1), in addition, is characterized by a higher emphasis on managing
employees, with higher values of Human Capital Management (i.e., importance of
hiring and training practices) and an emphasis of creating an Experimental Culture
in the service delivery environment (i.e., providing incentives oriented to customer
satisfaction rather than to adherence to procedures).
131

Tab
le3.
6:G
roup
Pro
file
s
1.Scr
ipte
dE
xp
erie
nce
2.P
erso
nal
ized
Exp
erie
nce
3.Sta
ndar
diz
edSer
vic
e4.
Unst
ruct
ure
dSer
vic
e5.
Hig
hE
xp
erie
nce
Hig
hE
xp
erie
nce
Low
Exp
erie
nce
Low
Exp
erie
nce
Var
iab
leN
ame
Hig
hS
crip
tin
gL
owScr
ipti
ng
Hig
hS
crip
tin
gL
owS
crip
tin
gM
idd
leN
4535
2246
85S
crip
tin
g5.
43(2
,3,4
,5)[
1]
2.93
(1,3
,5)[
4]
5.22
(1,2
,4,5
)[2]
2.89
(1,3
,5)[
5]
4.13
(1,2
,3,4
)[3]
Exp
erie
nce
6.77
(3,4
,5)[
1]
6.73
(3,4
,5)[
2]
5.06
(1,2
,5)[
4]
5.00
(1,2
,5)[
5]
5.86
(1,2
,3,4
)[3]
Ser
v–I
C5.
04(2
,3,4
,5)[
2]
5.28
(1,3
,4,5
)[1]
4.18
(1,2
,4,5
)[5]
4.39
(1,2
,3,5
)[4]
4.74
(1,2
,3,4
)[3]
Am
ount
ofC
ust
omer
Con
tact
4.67
(3,4
,5)[
1]
4.43
(3,4
,5)[
3]
4.32
(1,2
,4,5
)[4]
3.80
(1,2
,3,5
)[5]
4.65
(1,2
,3,4
)[2]
Mee
tin
gH
ours
/wee
k4.
07(3
,4,5
)[1]
3.86
(3,4
,5)[
2]
3.09
(1,2
,5)[
4]
3.07
(1,2
,5)[
5]
3.67
(1,2
,3,4
,5)[
3]
Em
pow
erm
ent
5.82
(3,4
,5)[
1]
5.71
(3,4
,5)[
2]
5.57
(1,2
,4)[
3]
5.31
(1,2
,3,5
)[5]
5.52
(1,2
,4)[
4]
Exp
erim
enta
lC
ult
ure
(In
centi
ves)
6.18
(2,3
,4,5
)[1]
5.73
(1,4
)[3]
5.64
(1,4
)[4]
5.22
(1,2
,3,5
)[5]
5.76
(1,4
)[2]
Hu
man
Cap
ital
Mgt
5.28
(2,3
,4,5
)[1]
4.61
(1,4
)[4]
4.74
(1,4
)[3]
3.92
(1,2
,3,5
)[5]
4.86
(1,4
)[2]
Cu
stom
izat
ion
5.79
(2,3
,4,5
)[1]
5.40
(1,3
,4,5
)[2]
4.30
(1,2
,5)[
5]
4.50
(1,2
,5)[
4]
5.04
(1,2
,3,4
)[3]
Sta
rR
atin
g4.
11[2
]4.
17[1
]3.
89[4
]3.
81[5
]4.
00[3
]C
ust
omer
–In
du
ced
Un
cert
ainty
4.48
[4]
4.72
[2]
4.93
[1]
4.46
[5]
4.62
[3]
Cu
stom
erS
atis
fact
ion
6.34
(3,4
,5)[
1]
6.33
(3,4
,5)[
2]
5.75
(1,2
,5)[
4]
5.64
(1,2
,5)[
5]
6.05
(1,2
,3,4
)[3]
Occ
up
ancy
(%)
0.72
(2,3
,4)[
1]
0.67
(1,3
,5)[
2]
0.62
(1,2
,4,5
)[3]
0.67
(1,3
,5)[
2]
0.72
(2,3
,4)[
1]
Ave
rage
Dai
lyR
ate
175.
20(2
,3,5
)[3]
260.
02(1
,3,4
,5)[
1]
160.
76(2
,3,5
)[5]
164.
89(1
,2,5
)[4]
203.
57(1
,2,3
,4)[
2]
Rev
enu
eP
erA
vail
able
Room
127.
05(2
,5)[
3]
165.
87(1
,3,4
,5)[
1]
103.
70(2
,5)[
5]
107.
47(2
,5)[
4]
149.
25(1
,2,3
,4)[
2]
Res
ult
sof
anA
NO
VA
test
follow
edby
Tuke
y’s
HSD
test
for
mult
iple
com
par
ison
s,w
ithα
=0.
15
The
form
atof
the
num
ber
sis
:M
EA
N(G
roups
that
are
sign
ifica
ntl
ydiff
eren
t)[R
ankofth
egro
up
relativeto
theoth
ergro
ups]
132

Finally, it is worth noting that there are no significant differences among groups
in Star Rating and Customer–Induced Uncertainty (CIU). This is consistent with the
theoretical foundations of our model. We posted that difference in star rating does
not adequately account for the difference in service offerings, which is an important
insight in hotel management. Operational characteristics in high–contact service
environments account for the way CIU is addressed, rather than for the amount of
uncertainty present in the market.
3.4.1 Nonresponse Bias
Research results are often conditioned by the possibility that there might be a
systematic selection mechanism which influences the willingness of research subjects
to participate in the study. If there are systematic characteristics of the population
that are associated with the nonrespondents, research results can be biased (Dillman
2007). The optimal way to test for the presence of nonresponse bias would be to collect
information about the nonrespondents directly and test for significant differences
between them and the survey respondents. However, given the nature of the collection
process, we do not have access to data on the nonrespondents, and therefore, this
strategy cannot be employed.
Armstrong and Overton (1977) proposed that the presence of nonresponse
bias can be tested by using the late respondents to the survey, that is the subjects
that took longer from the receipt of the invitation email to the survey completion.
The rationale behind this method is that late respondents are likely to have similar
characteristics to nonrespondents, a proxy for the presence of nonresponse bias. We
performed a series of t–test between the last twenty five percent of respondents and
the rest of the sample, on a large number of variables collected through the survey,
133

including the variables included in the study. We found that only two of the fifty
variables tested are significant (p < .05). We can conclude that there is no evidence
of the presence of a significant nonresponse bias in this study (Armstrong and Overton
1977).
3.4.2 Common Method Bias
Another concern that can arise in survey research when data is collected from a
single respondent, is that the respondent might exhibit a tendency to answer towards
the higher or lower end of the response scale, therefore generating spurious covari-
ance between the measures in the survey, commonly referred to as Common Method
Variance (CMV). Such variance can significantly bias the estimate of the coefficients,
and invalidate the results of the statistical analysis and the conclusions of the study
(Podsakoff et al. 2003, Malhotra et al. 2006, Siemsen et al. 2010). The most frequent
causes of common method variance are social desirability (i.e., the tendency of re-
spondents to provide answers that are socially acceptable), the tendency of research
subjects towards consistency, and the desire to provide responses that are consistent
with the perceived goals of the researchers (Podsakoff et al. 2003). We employed a set
of measures aimed at minimizing the presence of CMV on our results—by targeting
its possible sources—as well as limit its effect on the analysis, to the extent that it is
present.
First, we refined the wording of the survey items in order to improve their
clarity by using expert judgment and q–sort techniques. We started with a pool of
ten items for each construct and eliminated or changed the problematic ones until
the iterations resulted in acceptable values of inter–rater agreement on the meaning
of the survey items Churchill Jr (1979), Menor and Roth (2007). The details of the
134

measure development and validation are reported in Appendix A. Then, we strove to
keep items concrete by referencing actual behaviors, instead of beliefs and attitudes
Podsakoff and Organ (1986), Malhotra et al. (2006). Finally, we took steps to reassure
the respondents of confidentiality and to address any possible concern about privacy,
in order to reduce social desirability bias (Podsakoff et al. 2003). To address the
bias stemming from the subjects’ desire to comply with the perceived goals of the
researchers, we did not share our theoretical framework with the respondents.
In addition to the steps taken to minimize common method variance, we tested
for its presence using two different methods. First, we conducted a Harman’s single
factor test, which consists of running an exploratory factor analysis and assess weather
a single predominant factor appears. Table 3.7 shows the unrotated solution of the
EFA, with four factors satisfying the criterion of having an eigenvalue greater than
one(Fidell and Tabachnick 2006).
Table 3.7: Harman’s Test of Common Method VarianceFactor Eigenvalue Difference Proportion CumulativeFactor1 5.64182 3.58133 0.5147 0.5147Factor2 2.06049 0.70534 0.1880 0.7027Factor3 1.35516 0.31361 0.1236 0.8263Factor4 1.04154 0.04353 0.0950 0.9213Factor5 0.99802 0.39094 0.0910 1.0123Factor6 0.60708 0.10344 0.0554 1.0677Factor7 0.50364 0.34210 0.0459 1.1137Factor8 0.16155 0.07175 0.0147 1.1284
Given the difficulty of establishing a cutoff point for factors in EFA, we per-
formed a confirmatory factor analysis in which all items load onto a single con-
struct, which represents the method variance (Podsakoff et al. 2003). The fit in-
dices of the CFA indicate that a single method factor is not a god fit for the model
(χ2(209) = 1169.4, CFI=0.5, RMSEA=0.145) and the path loadings are not signifi-
135

cant.
Second, we included a marker variable in our survey. The marker variable is
one that should be not correlated with the other survey measures, on a theoretical
basis. The correlation that might emerge between the marker and the other variables
can be attributed to the method, whether the question formats or the tendency of the
respondent to gravitate towards a certain set of values (Lindell and Whitney 2001,
Siemsen et al. 2010). Moreover, by including the marker variable in the analysis, it is
possible to effectively control for the CMV, if it is present (Siemsen et al. 2010). We
find no strong evidence of correlation between the marker and the other variables,
and the results of our analysis show that it is not significant.
3.4.3 Measures
Table 3.8 shows the results of the confirmatory factor analysis on the measures
employed in the study. The result of the CFA provide evidence of the reliability
and unidimensionality of the construct, which generally supported the aggregation
of the items scores in a single averaged score. The CFI higher than 0.9 and the
RMSEA smaller than .08 suggest a good fit for our measurement model, and therefore
provide good evidence of the reliability of the measures (Fornell and Larcker 1981,
Bentler 1990, Hu and Bentler 1999). All of the items for the independent variables are
measured on a 7–point Likert scale, ranging from “Strongly Disagree” to “Strongly
Agree.”
3.4.3.1 Typology Variables
Degree of Scripting (DOS) is a new multi–item measurement scale which re-
flects the extent to which routines and procedures in service delivery are complex and
136

binding, according to the definitions of service scripting accepted in the literature
Tansik and Smith (1991, 2000). The measure exhibits good composite reliability and
AVE higher than 0.45 but lower than 0.5, which might suggest problems with the
unidimensionality of the construct.
Customer Experience (EXP) is a new multi–item measurement scale that re-
flects the degree to which the service delivery system is designed to emotionally engage
customers during their interaction with service personnel (Pullman and Gross 2004,
Voss et al. 2008). This scale subsumes the intended strategy of the service firm, that
is, it represents the intentions of the service designers that will likely be realized in
the service delivery processes Roth and van der Velde (1991a), Voss et al. (2008). The
scale exhibits very good composite reliability and a high AVE, indicating that it is
both reliable and unidimensional.
3.4.3.2 Dependent Variables
. The dependent variables in this study are commonly used performance met-
rics in the hospitality industry: Revenue Per Available Room (RevPar), Average
Daily Rate (ADR), and Occupancy. The measures are self reported, and we asked
to report averages for ADR and Occupancy in the past three months. The Average
Daily Rate (ADR) is the average amount charged by the hotel for one room for one
day, and it is therefore a measure of how much hotel managers were able to charge
(and therefore, indirectly, of customer’s willingness to pay). Occupancy indicates
the average percentage of rooms that is occupied in a given amount of time: it is
usually considered a reliable indication of customer loyalty and—in this era of online
reviews—of the hotel reputation. Finally, the Revenue per Available Room (RevPAR)
is the product of the two previous quantities, and provides an indication of revenue
adjusted for the size of the property.
137

Table 3.8: Confirmatory Factor Analysis of Constructs
Construct/Items (Composite reliability, AVE) Std. Loading t-‐value Customer Induced Uncertainty (CIU) (0.627, 0.349)
It is difficult to predict how much effort our guests are going to put in helping staff provide a saBsfactory service 0.340 a
It is difficult to predict how many guests will require service at any given Bme 0.450 4.90*** Guests vary widely in what they consider a saBsfactory service experience 0.853 6.07***
Degree of ScripDng (DOS) (0.719, 0.467) When they are in contact with guests… ...most of the acBons employees have to perform are outlined in formal processes 0.737 a ...employees are not allowed to deviate from a predefined rouBne 0.619 10.48*** ...employees have detailed instrucBons for handling most unusual situaBons 0.688 11.50***
Empowerment (EMP) (0.626, 0.326) I allow employees to do their work the way they think best 0.664 a I encourage iniBaBve in my employees 0.455 5.44*** I encourage employees to parBcipate in important decisions concerning service delivery 0.574 7.56***
Customer Experience (EXP) (0.800, 0.610) Customer experience is at the center of our offering 0.793 a We provide our guests with a feeling of genuine caring and authenBcity 0.809 22.52*** We make a deliberate aRempt emoBonally engage our guests 0.738 18.43***
Service ImprovisaDon Competence (Serv-‐IC) (0.842, 0.689) Spontaneity (SP) (0.750, 0.522) 0.779 a
During their contact with the hotel's guests... ...our employees oUen have to figure out acBons in the moment 0.590 a ...our employees are spontaneous in their interacBon with guests 0.730 18.34*** ...our employees oUen have to respond in the moment to unexpected problems 0.806 22.69*** ...our employees deal with unanBcipated events on the spot 0.747 19.45***
CreaDvity (CR) (0.762, 0.541) 0.916 20.68*** The employees in this hotel... ...oUen find new ways of working together to accommodate specific customers' requests 0.719 a ...oUen deviate from standard rouBnes to respond to customers` requests 0.722 17.35*** ...oUen try new approaches to solve guests' problems 0.765 17.33*** ...oUen have to be creaBve to saBsfy customers' needs (Dropped) -‐-‐ -‐-‐
Bricolage (BR) (0.821, 0.650) 0.788 18.23*** The employees in this hotel... ...oUen pull informaBon from many different sources to respond to customers' requests 0.868 a ...oUen make use of several other workers' experBse to saBsfy guests 0.799 25.15***
...oUen use extra discreBonary resources in order to saBsfy guests 0.747 20.43*** Chi2(186) = 341.79 (p=.000), CFI: 0.918, RMSEA: 0.062, 90% CI RMSEA: 0.052, 0.072 a: loading fixed at 1 for specificaBon *** p<0.001
3.4.3.3 Instrumental Variables
Customer Induced Uncertainty (CIU) taps into the amount of uncertainty
introduced by the guests into service operations. CIU is a newly developed multi–item
measurement scale based on the different types of variability in customer behaviors
138

that can introduce uncertainty in service operations, such as arrival times, preferences,
and type of service required (Frei 2006). In the development of our measures, we
specifically focus on types of variability that have a significant influence on high–
contact operations such as those that are characteristic of the hospitality industry.
More specifically, we focus on predictability of arrival times, predictability of the
extent to which hotel guests engage in co–production activities, and the variability in
preferences. The composite reliability of this construct suggests adequate reliability,
and the AVE indicates that the construct as measured is likely to be multidimensional
in nature. However, given that the proxy has been constructed as a multidimensional
scale, specifically to reflect different types of uncertainty in service operations, it is
not surprising that the AVE has a relatively small value, and this should not be taken
as evidence against the validity of the construct (Little et al. 1999).
Empowerment (EMP) is operationally defined in our research as as “the ex-
tent to which managers allow employees to use their own initiative and judgment in
performing their jobs” (Hartline and Ferrell 1996). We use a subset of the measure
adapted by Hartline and Ferrell (1996) to the a service management setting from the
work of Cook et al. (1981). The multi–item measurement scale captures the extent
to which management delegates decisional power and allows employee autonomy in
the performance of their duties, and refers to the conceptualization of empowerment
as pertaining to managerial choices and organizational design (Seibert et al. 2004,
Wallace et al. 2011). The scale exhibits adequate composite reliability but a low
average variance extracted, indicating that the construct might suffer from a lack of
unidimensionality Fornell and Larcker (1981).
139

3.4.3.4 Service Improvisation Competence
Service Improvisation Competence (Serv–IC) is conceptualized as a second–
order latent construct composed of the multi–item dimensions of Creativity, Spon-
taneity, and Bricolage. Creativity is operationalized as the frequency by which service
employees deviate from established procedures during the service encounter. Spon-
taneity is operationalized as the frequency by which customer–contact employees need
to provide a fast response to guest requests. Finally, Bricolage is operationalized as
the frequency by which employees need to assemble the informational and physical
resources at their disposal in new and unplanned–for ways. The details of the opera-
tionalization of this construct, as well as the literature base are described in Essays 1
and 2 of this dissertation, and it is built upon the stream of literature in organizational
behavior and strategy which describes the phenomenon of organizational improvisa-
tion Weick (1998), e Cunha et al. (1999), Miner et al. (2001), Kamoche et al. (2002,
2003). The measurement model indicates high reliability and unidimensionality both
at the first–order constructs level as well as the second–order level (Table 3.8).
3.5 Analysis and Results
The goal of our empirical strategy is to estimate equation 3.4 for each of
our performance measures, that is for Revenue per Available Room (RevPAR), as
well as on its individual constituents, Average Occupancy, and Average Daily Rate
(ADR). More specifically, we are interested in exploring the differential impact of
Serv–IC on different groups of hotels. We partition our sample according to the
Degree of Scripting (DOS) and the Customer Experience (EXP) variables, resulting
in the five types described in Figure 3.1. Each single hotel is defined as high or low
on a dimensions if its value is one fourth of a standard deviation above or below the
140

sample mean, respectively.
In order to verify that the endogeneity problem really is affecting the results
of the OLS regression, we can perform a formal test on the coefficients of the two
types of estimation. Hausman’s (1978) test provides an estimate of the variance of
the difference between the two coefficients, using the difference of the variances of the
two. However, this difference is not necessarily positive definite in finite samples as
in the sample that we are analyzing. In this case the Hausman test is undefined.
We feel nonetheless confident in using a 2SLS procedure, in that we have
strong theoretical reasons to suspect the presence of endogeneity in our model, with
the additional benefit that the instrumentation will reduce measurement error in
Serv–IC. Nonetheless, we compare our results with OLS results, in order to assess the
magnitude of the specification problems in OLS.
3.5.1 Instruments Validity
Even with the theoretical basis for our choice of instruments, we test em-
pirically if in this sample the instrumental variables that we chose are relevant. In
particular, we test for the instruments’ identification conditions and relevance (Bound
et al. 1995, Hall et al. 1996, Shea 1997). The vector of instruments is said to be suffi-
cient for identification if the optimality condition for the estimation of the parameters
leads to a unique solution. A necessary condition for identification is that there have
to be at least as many instrumental variables as endogenous regressors. Although
we satisfy this condition in our model, the model could still be empirically uniden-
tified. For example this would be the case if one or more instruments are so weakly
correlated with the endogenous variable that they are computationally irrelevant in
the calculation of the population moment condition. The first tests proposed in the
141

literature to test for instruments’ relevance rely on the analysis of the first stage
regression’sR2 obtained by partialling out the instruments; however, it can be shown
that this method only works wen there is only a single endogenous regressor (Bound
et al. 1995, Shea 1997). In addition, these tests are not very powerful in detecting
weak instruments, which are correlated with the endogenous variable, but not enough
to avoid identification problems.
For these reasons, we rely on the method developed by Angrist and Pischke
(2009), which proposed the test statistics reported in tables 3.9, 3.10, and 3.11. For
each endogenous regressor, the tests of underidentification are obtained by partialling
out the projections of all the other endogenous variables. The AP χ2 statistic tests
the NULL that the endogenous regressor is unidentified, and the AP F statistic is
the F form of the same test (this test is equal to the Cragg–McDonald F statistic in
the case of a single endogenous regressor). However, a distribution for the F form of
the AP test has not been derived, and we have to rely on the computational results
provided by Stock and Yogo (2002). The results reported in the tables highlight no
identification problems. The F statistic in the first column of tables 3.9, 3.10, and
3.11 is the test of the partial R–squared for each one of the equations predicting
endogenous regressors, with no adjustment for the presence of multiple endogenous
regressors. These tests, as well as the tests reported in the remainder of this section,
have been produced using the ivreg2 function developed by C.F. Baum and colleagues
(Baum 2006, Baum et al. 2007).
The Anderson statistic (Anderson 1984, Hall et al. 1996) reported in table
3.12 tests the canonical correlations of the matrices X and Z. Tests the NULL that
the smallest correlation is 0 and assumes multivariate normality of the regressors.
Failure to reject the NULL hypothesis implies that the identification status of the
equations is not certain. The results of the Anderson test does not raise any problem
142

Table 3.9: Underidentification and Weak IV Tests in Equations Predicting RevPAR
Underid. Weak ivVariable F(8,166) P-val AP* Chi-sq(5) P-val AP* F(5,166)Ln(Serv–IC) 10.58 0.000 30.21 0.000 4.54Ln(Serv–IC)*High EXP, High DOS 15.01 0.000 86.43 0.000 12.98Ln(Serv–IC)*High EXP, Low DOS 4.66 0.000 44.60 0.000 6.70Ln(Serv–IC)*Low EXP, High DOS 48.15 0.000 269.79 0.000 40.52Ln(Serv–IC)*Middle 4.57 0.000 27.98 0.000 4.20* Angrist and Pischke (2009)
Table 3.10: Underidentification and Weak IV Tests in Equations Predicting ADR
Underid. Weak ivVariable F(8,166) P-val AP* Chi-sq(5) P-val AP* F(5,166)Ln(Serv–IC) 10.65 0.000 30.37 0.000 4.56Ln(Serv–IC)*High EXP, High DOS 15.11 0.000 86.92 0.000 13.06Ln(Serv–IC)*High EXP, Low DOS 4.89 0.000 46.41 0.000 6.97Ln(Serv–IC)*Low EXP, High DOS 48.45 0.000 271.29 0.000 40.77Ln(Serv–IC)*Middle 4.60 0.000 28.13 0.000 4.23* Angrist and Pischke (2009)
Table 3.11: Underidentification and Weak IV Tests in Equations Predicting Occu-pancy
Underid. Weak ivVariable F(8,166) P-val AP* Chi-sq(5) P-val AP* F(5,166)Ln(Serv–IC) 11.28 0.000 29.44 0.000 4.45Ln(Serv–IC)*High EXP, High DOS 16.47 0.000 92.11 0.000 13.93Ln(Serv–IC)*High EXP, Low DOS 4.89 0.000 46.19 0.000 6.98Ln(Serv–IC)*Low EXP, High DOS 51.70 0.000 282.89 0.000 42.77Ln(Serv–IC)*Middle 5.99 0.000 31.23 0.000 4.72* Angrist and Pischke (2009)
143
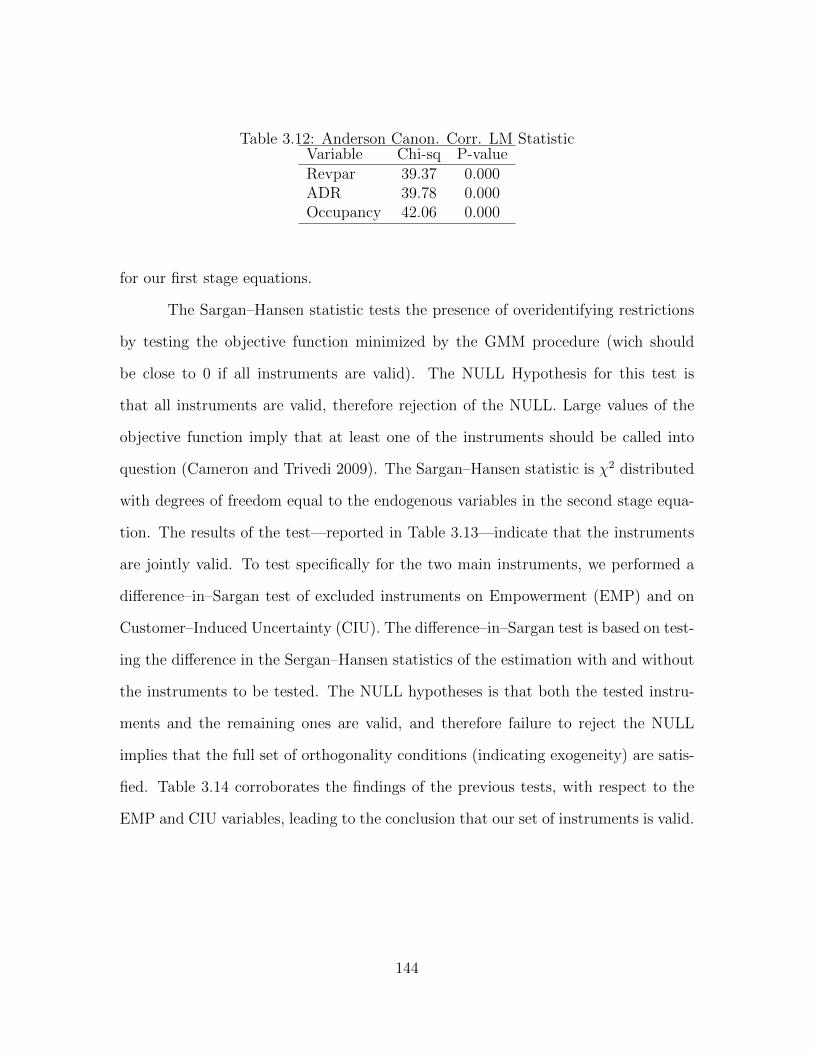
Table 3.12: Anderson Canon. Corr. LM StatisticVariable Chi-sq P-valueRevpar 39.37 0.000ADR 39.78 0.000Occupancy 42.06 0.000
for our first stage equations.
The Sargan–Hansen statistic tests the presence of overidentifying restrictions
by testing the objective function minimized by the GMM procedure (wich should
be close to 0 if all instruments are valid). The NULL Hypothesis for this test is
that all instruments are valid, therefore rejection of the NULL. Large values of the
objective function imply that at least one of the instruments should be called into
question (Cameron and Trivedi 2009). The Sargan–Hansen statistic is χ2 distributed
with degrees of freedom equal to the endogenous variables in the second stage equa-
tion. The results of the test—reported in Table 3.13—indicate that the instruments
are jointly valid. To test specifically for the two main instruments, we performed a
difference–in–Sargan test of excluded instruments on Empowerment (EMP) and on
Customer–Induced Uncertainty (CIU). The difference–in–Sargan test is based on test-
ing the difference in the Sergan–Hansen statistics of the estimation with and without
the instruments to be tested. The NULL hypotheses is that both the tested instru-
ments and the remaining ones are valid, and therefore failure to reject the NULL
implies that the full set of orthogonality conditions (indicating exogeneity) are satis-
fied. Table 3.14 corroborates the findings of the previous tests, with respect to the
EMP and CIU variables, leading to the conclusion that our set of instruments is valid.
144

Table 3.13: Sargan–Hansen Test of OveridentificationDV for 2nd Stage Sargan statistic P-valueRevpar 4.336 0.502ADR 5.390 0.370Occupancy 6.341 0.274
Table 3.14: Difference in Sargan Test of Exogeneity (For EMP and CIU)DV for 2nd Stage C statistic P-valueRevpar 1.883 0.390ADR 2.516 0.284Occupancy 0.374 0.829
3.5.2 Estimation Results
In this section, we report the reults of the OLS and Two–Stage Least Squares
estimation, which have been obtained using the ivreg2 and ivregress functions in Stata
12.1 (Baum 2006, StataCorp 2011). Tables 3.15 and 3.16 show the results of the OLS
and 2SLS procedures that estimate equation 3.4. We only provide the results of the
first stage for the Serv–IC variable (Table 3.15), because of its theoretical meaning,
but the other equations result in a similar fit. The first stage equations in all three
regressions show that the instrumental variables (Customer–Induced Uncertainty and
Empowerment) are significantly and positively related to Service Improvisation Com-
petence. We performed joint hypotheses tests of the terms containing CIU and EMP
to test whether they are jointly equal to zero. The test for CIU (in Equation 3.5, we
test H0 : γ7 = γ8 = γ9 = γ10 = γ11 = 0) resulted in an F value of 11.88 and p<.000.
The test for EMP (in Equation 3.5, H0 : γ12 = γ13 = γ14 = γ15γ16 = 0) resulted in
an F value of 13.04 and a p<.000. We can therefore conclude that Hypotheses 1 and
2 are confirmed. This result confirms the findings of Paper 2 and provides further
support for the relevance of these variables as instruments. It should be noted that
145
the instruments worked properly for all the other instrumented variables, i.e. the
Ln(CIU) ∗HighEXP,HighDOS and the Ln(EMP ) ∗HighEXP,HighDOS terms
were significant in predicting Ln(Serv− IC)∗HighEXP,HighDOS, and so on with
the other instrumented variables.
Table 3.16 reports the estimation results for the second stage. Both Serv–IC
and the dependent variables have been log–transformed (using the natural logarithm),
so that the estimates can be interpreted in terms of elasticities (occupancy has not
been transformed, since it is already in percentage form). The variables indicating
number of rooms and star rating have been included as controls for hotel size and
quality, which are known to influence business outcomes.
Both size and star rating influence RevPAR, each through one of its compo-
nents: room number influences occupancy rate (operations with higher number of
rooms are likely to focus on keeping the hotel busy), and star rating influences ADR
(higher–star hotels demand higher prices from their guests). The controls behave in
the same way in OLS and 2SLS regression.
We included a marker variable in each equation, in order to control for com-
mon method variance (Lindell and Whitney 2001, Siemsen et al. 2010). The marker
variable is never significant in the OLS as well as in the 2SLS regressions, therefore
confirming the previous finding that CMV is not a significant source of bias in our
estimates. The reference group in the equations is the Unstructured Service type
(Low EXP and Low DOS). A first look at the regression coefficients shows that there
is a significant positive difference in the impact of Serv–IC on occupancy between the
reference group and the groups with high levels of experience. There is no difference
in the impact of Serv–IC on revenue (RevPAR and ADR) between the reference group
and the high experience groups.
In addition to the difference between each group and the average, we are
146

Table 3.15: Results of First Stage Regressions Predicting Serv–IC2nd Stage Dependent Variable
ln(RevPAR) ln(ADR) OccupancyMarker 0.000 0.000 0.002
(0.008) (0.008) (0.007)Rooms 0.000 0.000 0.000**
(0.000) (0.000) (0.000)Star Rating -0.015 -0.015 -0.007
(0.014) (0.015) (0.014)High Exp, High Dos (hehd) 0.611 0.611 0.553
(0.389) (0.389) (0.381)High Exp, Low Dos (held) 0.999*** 0.998*** 0.929***
(0.319) (0.311) (0.306)Low Exp, High Dos (lehd) -0.212 -0.212 -0.245
(0.698) (0.698) (0.678)Middle (Mid) 0.399 0.399 0.393
(0.379) (0.379) (0.301)Ln(CIU) 0.211** 0.211** 0.190**
(0.089) (0.089) (0.088)Ln(CIU)*High Exp, High Dos 0.139 0.139 0.147
(0.143) (0.143) (0.143)Ln(CIU)*High Exp, Low Dos -0.215** -0.215** -0.200
(0.108) (0.108) (0.109)Ln(CIU)*Low Exp, High Dos 0.510*** 0.510*** 0.525***
(0.138) (0.138) (0.140)Ln(CIU)*Middle -0.126 -0.126 -0.098
(0.110) (0.110 (0.107)Ln(EMP) 0.607*** 0.607*** 0.585***
(0.115) (0.115) (0.110)Ln(EMP)*High Exp, High Dos -0.422** -0.422** -0.390**
(0.174) (0.173) (0.167)Ln(EMP)*High Exp, Low Dos -0.308** -0.308** -0.276
(0.148) (0.144) (0.143)Ln(EMP)*Low Exp, High Dos -0.435 -0.435 -0.421
(0.344) (0.343) (0.332)Ln(EMP)*Middle -0.098 -0.098 -0.114
(0.185) (0.185) (0.147)Constant 0.219 0.219 0.249
(0.244) (0.244) (0.226)N 182 183 194R2 0.484 0.487 0.489F 10.66*** 10.93*** 12.9****p < .1 **p < .05 ***p < .01The table shows unstandardized estimates
147
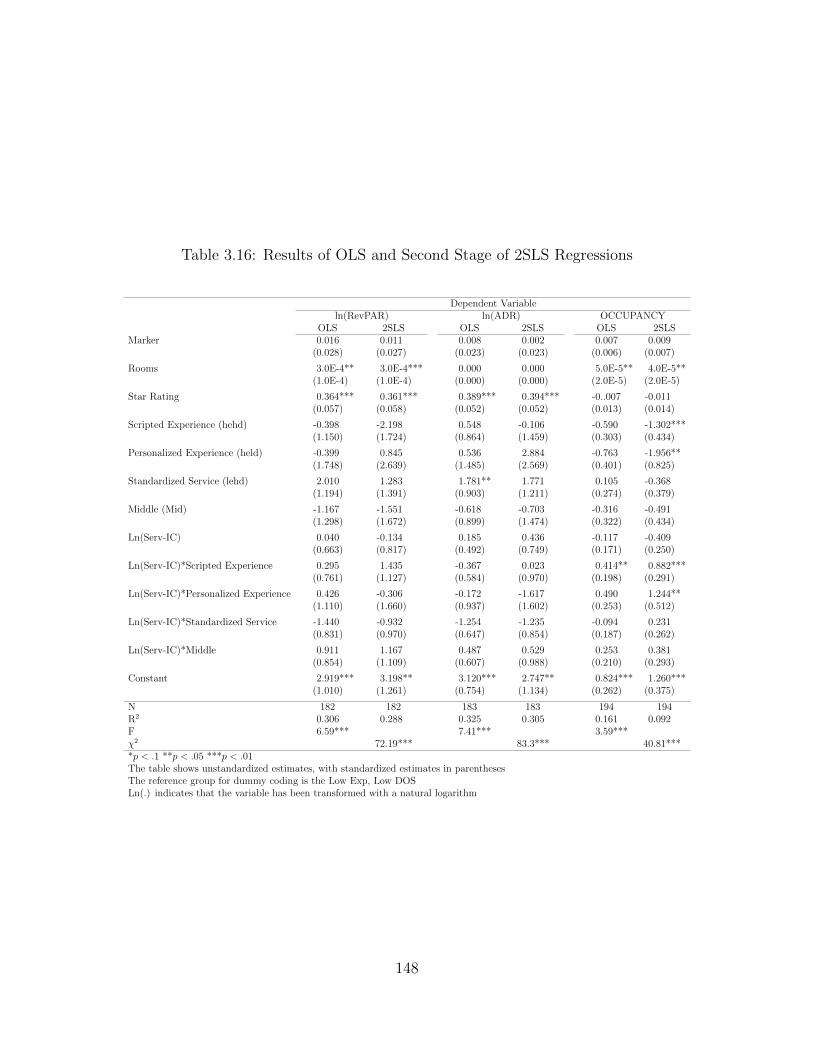
Table 3.16: Results of OLS and Second Stage of 2SLS Regressions
Dependent Variableln(RevPAR) ln(ADR) OCCUPANCY
OLS 2SLS OLS 2SLS OLS 2SLSMarker 0.016 0.011 0.008 0.002 0.007 0.009
(0.028) (0.027) (0.023) (0.023) (0.006) (0.007)
Rooms 3.0E-4** 3.0E-4*** 0.000 0.000 5.0E-5** 4.0E-5**(1.0E-4) (1.0E-4) (0.000) (0.000) (2.0E-5) (2.0E-5)
Star Rating 0.364*** 0.361*** 0.389*** 0.394*** -0..007 -0.011(0.057) (0.058) (0.052) (0.052) (0.013) (0.014)
Scripted Experience (hehd) -0.398 -2.198 0.548 -0.106 -0.590 -1.302***(1.150) (1.724) (0.864) (1.459) (0.303) (0.434)
Personalized Experience (held) -0.399 0.845 0.536 2.884 -0.763 -1.956**(1.748) (2.639) (1.485) (2.569) (0.401) (0.825)
Standardized Service (lehd) 2.010 1.283 1.781** 1.771 0.105 -0.368(1.194) (1.391) (0.903) (1.211) (0.274) (0.379)
Middle (Mid) -1.167 -1.551 -0.618 -0.703 -0.316 -0.491(1.298) (1.672) (0.899) (1.474) (0.322) (0.434)
Ln(Serv-IC) 0.040 -0.134 0.185 0.436 -0.117 -0.409(0.663) (0.817) (0.492) (0.749) (0.171) (0.250)
Ln(Serv-IC)*Scripted Experience 0.295 1.435 -0.367 0.023 0.414** 0.882***(0.761) (1.127) (0.584) (0.970) (0.198) (0.291)
Ln(Serv-IC)*Personalized Experience 0.426 -0.306 -0.172 -1.617 0.490 1.244**(1.110) (1.660) (0.937) (1.602) (0.253) (0.512)
Ln(Serv-IC)*Standardized Service -1.440 -0.932 -1.254 -1.235 -0.094 0.231(0.831) (0.970) (0.647) (0.854) (0.187) (0.262)
Ln(Serv-IC)*Middle 0.911 1.167 0.487 0.529 0.253 0.381(0.854) (1.109) (0.607) (0.988) (0.210) (0.293)
Constant 2.919*** 3.198** 3.120*** 2.747** 0.824*** 1.260***(1.010) (1.261) (0.754) (1.134) (0.262) (0.375)
N 182 182 183 183 194 194R2 0.306 0.288 0.325 0.305 0.161 0.092F 6.59*** 7.41*** 3.59***χ2 72.19*** 83.3*** 40.81****p < .1 **p < .05 ***p < .01The table shows unstandardized estimates, with standardized estimates in parenthesesThe reference group for dummy coding is the Low Exp, Low DOSLn(.) indicates that the variable has been transformed with a natural logarithm
148

interested in knowing the effect if Serv–IC within each group. Therefore, we performed
a set of tests of the simple slopes Aiken et al. (1991) in order to assess the impact of
improvisation on financial outcomes in different hotel groups within our classification
scheme. Table 3.17 reports the results of the tests. For the hotels in the Standardized
Service Type (low experience and high scripting), we observe a detrimental effect of
improvisation on revenue and occupancy rates. On the contrary, for the Scripted
Experience Type (high experience and high scripting), we observe a positive effect of
improvisation on occupancy, which translates in a significant positive effect on the
Revenue per Available Room. In addition, we find a marginally significant positive
effect of Serv–IC on occupancy, for the Personalized Experience Type (high experience
and low scripting). Overall, for the hotel industry, we seem to find confirmation that
Serv–IC leads to positive outcomes in the presence of high experience, and to negative
outcomes in the presence of low experience and high standardization. In addition,
we find that the negative effects manifest themselves as a drop in room revenue and
occupancy, while the positive effects have an impact mainly on occupancy rates—
possibly due to an increase in loyalty. Serv–IC has no effect on any of the business
outcome measures in the Unstructured Service Type (Low EXP, Low DOS), and in
the Middle Group.
Finally, we test for difference between groups by testing the difference in be-
tween the within–groups coefficients. The impact of Serv–IC on Occupancy rates is
significantly different (p < .01) between Scripted Experiences (High EXP, High DOS)
and both of the low experience groups (Unstructured Experiences and Standardized
Experiences). Similarly, there is a significant difference (p < .05) in the effect of Serv–
IC on Occupancy between the Personalized Experience and the two low experience
types (Unstructured Services and Standardized Services). The Scripted Experience
Type also exhibits a significant difference (p < .01) with the Standardized Services
149

Table 3.17: Influence of Serv–IC on Performance Within– and Between–Groups
Serv–IC Coefficients from 2nd StageTerms in RevPAR ADR OccupancyEq. 3.4 OLS 2SLS OLS 2SLS OLS 2SLS
Within–Groups1. Scripted Experience α1 + α2 0.335 1.301* -0.182 0.459 0.296*** 0.473***
(hehd) (0.375) (0.752) (0.311) (0.592) (0.099) (0.144)
2. Personalized Experience α1 + α3 0.466 -0.440 0.013 -1.180 0.373** 0.835*(held) (0.887) (1.442) (0.792) (1.417) (0.188) (0.443)
3. Standardized Service α1 + α4 -1.399*** -1.066** -1.069** -0.799** -0.211*** -0.177**(lehd) (0.505) (0.509) (0.419) (0.399) (0.077) (0.072)
4. Unstructured Service α1 0.040 -0.134 0.185 0.436 -0.117 -0.409(leld) (0.663) (0.817) (0.492) (0.749) (0.171) (0.250)
5. Middle α1 + α5 0.950* 1.033 0.672* 0.965 0.135 -0.028(Mid) (0.544) (0.752) (0.364) (0.655) (0.122) (0.152)
Between–Groups1 and 2 α2 − α3 -0.131 1.741 -0.196 1.640 -0.076 -0.362
(0.963) (1.623) (0.848) (1.533) (0.212) (0.466)
1 and 3 α2 − α4 1.734*** 2.367*** 0.887* 1.258* 0.507*** 0.651***(0.635) (0.907) (0.527) (0.714) (0.125) (0.159)
1 and 4 α2 0.295 1.435 -0.367 0.023 0.414** 0.882***(0.761) (1.127) (0.584) (0.971) (0.198) (0.291)
1 and 5 α2 − α5 -0.616 0.268 -0.854* -0.505 0.161 0.501**(0.664) (1.072) (0.480) (0.894) (0.157) (0.207)
2 and 3 α3 − α4 1.866* 0.626 1.082 -0.381 0.584*** 1.013**(1.027) (1.533) (0.889) (1.475) (0.203) (0.450)
2 and 4 α3 0.426 -0.306 -0.172 -1.617 0.490* 1.244**(1.110) (1.666) (0.937) (1.602) (0.253) (0.512)
2 and 5 α3 − α5 -0.485 -1.473 -0.658 -2.145 0.237 0.863*(1.043) (1.616) (0.877) (1.558) (0.225) (0.470)
*p < .1 **p < .05 ***p < .01
The table shows unstandardized estimates, with standard errors in parentheses
150

(Low EXP, High DOS) in Serv–IC influence on RevPAR and ADR. The effect of
Serv–IC on Occupancy is also significantly different (p < .1) between high experience
groups (Scripted and Personalized Experiences) and the Middle Group.
3.6 Discussion and Conclusions
Our results generally support the proposed model of the effects of Service Im-
provisation Competence on the performance outcomes of hotels, as well as the insights
provided by the literature on service experiences (Pullman and Gross 2004, Voss et al.
2008, Zomerdijk and Voss 2011). In general, the higher the experiential content of
services, the higher the positive influence of Serv–IC on business performance out-
comes. Table 3.18 provides a summary of results for each of the hypotheses that we
advanced in section 3.3.
Table 3.18: Summary of Tests of HypothesesHypothesis Statement Result
Hypothesis 1 Positive Effect in HighExperience Groups
Partially Supported
Hypothesis 2 Negative Effect inStandardized Services
Supported
Hypothesis 3 No Effect in UnstructuredServices
Supported
Hypothesis 4 No Effect in Middle Group SupportedHypothesis 5 Stronger Effect in Scripted
Experience than in othergroups
Not Supported
Hypothesis 6 CIU → Serv–IC SupportedHypothesis 7 EMP → Serv–IC Supported
151

3.6.1 Effect of Serv–IC in High–Experience Service Delivery
Systems
Service Improvisation Competence has a highly significant effect on Occupancy
in the Scripted Service group, but has no direct significant effect on the average daily
rate. The effect on RevPAR can be seen as a result of the effect on Occupancy, given
that the latter is a component in the calculation of the former. This interpretation
implies that Hotel guests within this type are more likely to be attracted to properties
that provide this kind of accommodation, but are not necessarily willing to pay a
higher price. Therefore, Hypothesis 1 is partially supported, in that Serv–IC has a
positive effect on business performance outcomes, but not on all of them. In order to
explain this effect, we examine the way in which hotel guests select the services. In the
past few years, there has been a proliferation of websites (e.g., Trip Advisor, Expedia,
Hotels.com, etc.) in which travelers can rate and comment on their experiences
staying at a specific property. Simultaneously, online booking systems are providing
an unprecedented price transparency and have made it extremely easy to compare
prices across different options. Lately, this trend started evolving even further with
platforms that allow travelers to post an offer that they received from one hotel
and allow other properties in the same neighborhood to bid offering discounts and
additional services in order to “steal” the customer from their competitors 2.
In this environment of price transparency, it is easy for travelers to find rea-
sonable accommodations at the desired price. Indeed most search engines present
price ranges as one of the primary options. When a guest arrives in a hotel of the
type the we characterized as Scripted Experience, s/he expects competent service in
a pleasant atmosphere. In this scenario, the use of improvisation—in case of a guests’
2See, for example, http://www.backbid.com/
152

special request—can add the touch that moves the customer from “satisfaction” to
“delight” (Schneider and Bowen 1999). Improvisation is likely to result in further
positive reviews and, in turn, increase the likelihood of the guest returning to the
same property as well as the likelihood of readers of the review booking a room in
the property.
In addition to the creation of customer loyalty, positive word–of–mouth reviews
are likely to draw more travelers to choose that property, compared to one in the same
price range that does not offer the same degree of experience. It is interesting to note
that the Scripted Experience hotel segment is the one that reports the higher amount
of employee selection efforts and training, and the highest emphasis on providing
customer–satisfaction–oriented incentives to their employees (Table 3.6). We argue
that this is necessary in order to be able to navigate the line between having a
highly scripted environment, with a great deal of consistency and reliability, while at
the same time recognizing the need to do something differentiating, and therefore,
they resort to improvisation in order to satisfy guests. Positioning themselves above
the diagonal in Figure 3.2 requires a substantial investment in hiring, developing,
and adequately managing human resources. Previous research suggests that these
practices lead to high customer retention rates (Hartline and Ferrell 1996, Goldstein
2003).
Similarly, the Personalized Experience type can benefit from the use of impro-
visation in service delivery, therefore confirming the partial support for Hypothesis
1. The effect is not present across each business outcome, and the significance of
the effect is rather weak (.05 < p < .1). This finding is in line with previous re-
search that shows that customers expect a high degree of experience in such services
(Surprenant and Solomon 1987, Frei 2006, Talbott 2006). Although this group ex-
hibits a significantly higher mean price per room than the others (Table 3.6), the
153

advantage of improvisation does not manifest itself in the ability to charge higher
prices per se. Rather, increases occupancy rates. The same considerations that we
made for Scripted Services also apply here. It should be noted that, even if the co-
efficient estimate is higher than that for the Scripted Services, the estimate has a
much larger confidence interval, indicating higher variability within this group on the
effects of improvisation. The literature on improvisation can provide insights in what
is happening within the Personalized Experience Type. When procedures are loosely
defined, it is much more difficult to identify behaviors that can be characterized as
improvisation, given that, by definition, the act of improvising requires a procedure
to deviate from (Peplowski 1998, Weick 1998, Crossan 1998, e Cunha et al. 1999,
Zack 2000, Kamoche and e Cunha 2001, Kamoche et al. 2003). Resorting to the jazz
metaphor, the player needs a melody (or a song structure) on which to improvise:
as the famous jazz bass player and composer Charles Mingus is quoted to have said,
“you can’t improvise on nothing; you’ve gotta improvise on something” (Kernfeld
1997, p. 119, cited in Weick 1998). We can conclude that, although larger than the
effect in the Scripted Experience group, the effect of Serv–IC on Occupancy in the
Personalized Experience group is much more uncertain in our sample.
In addition, we hypothesized a stronger effect of improvisation in Scripted Ex-
periences compared to the other groups. We argued that in order to maintain a tightly
scripted environment, while at the same time providing an engaging experience, Serv–
IC has to be used strategically in order to produce higher benefits—especially, given
the expectations of customers in a highly scripted environment. However, in general
we did not find a significant difference (p > .1) between the two groups falling into the
High Experience Types (Table 3.17). Although they are both significantly different
from the other groups, at least in terms of occupancy, they are not different from
each other. This finding can be attributed to the large confidence interval around the
154

coefficient in Personalized Services, as well as an actual lack of difference between the
two types. Further, it can be explained, in part, by our choice of business performance
measures. The choice of performance measures is one area for future research. The
benefits of combining a scripted environment to Serv–IC might be evident in profit
measures, rather than in revenue and occupancy measures. One of the main values
of scripting is increase in control and in efficiency, which in turn is likely to lead to a
drop in costs. However, for the purposes of this study, Hypothesis 2 is not supported
for our performance outcome measures.
3.6.2 Effect of Serv–IC in Low–Experience Service Delivery
Systems
The results in the Standardized Service Type that would occupy the lower
right of Figures 3.1 and 3.2 (i.e., low experiential content and high degree of script-
ing) clearly indicate that Service Improvisation has a negative effect on all the perfor-
mance measures examined. This comes at no surprise, in that customers that choose
services that are supposed to offer a standardized, highly efficient delivery are not
likely to welcome any deviation from the expected delivery processes. Hypothesis 3
is, therefore, strongly supported. Spending resources to develop a Serv–IC in this
groups is not generally a recommendable course of action.
Thus, when a company attempts to position itself within the Standardized
Service group, most deviations from processes will likely have negative consequences.
Stewart and Chase (1999) provided a detailed account of the ways in which stray-
ing from service delivery processes leads to operational problems and, ultimately, to
unsatisfied customers. Several elements are likely to play an important role in the
deleterious effects of Serv–IC in standardized environments. First, customer expec-
155

tations in such an environment are predictability and reliability, and therefore, it is
unlikely that guests will welcome deviations from routines that would likely increase
time in queue as well as outcome conformance to expectations (Cook et al. 2002). Sec-
ond, standardized environments lack the coordination mechanisms that allow highly
experiential ones to adapt the different parts of the service delivery process on–the–fly
to a modified course of action. Organization improvisational scholars often stress the
importance of routines and procedures in improvisation rich environments as coor-
dination mechanisms more than behavioral rulebooks (Orlikowski 1996, Brown and
Eisenhardt 1998, Weick 1998, Kamoche and e Cunha 2001, Kamoche et al. 2003).
In Contrast, the descriptive statistics in Table 3.6 strongly support the propo-
sition that hotels in the high experience types invest more in communication and
information diffusion that the other groups. Finally the skill level and attitudes of
the service delivery employees greatly influence their ability to successfully identify
when and how to engage in improvisation. Table 3.6 again shows profile properties
wherein the Scripted Experience Type places a stronger effort in selection and train-
ing of their workforce, as well as in setting up the right set of incentives to shape their
behavior. These considerations highlight how the transition between a standardized
service and a scripted experience is not a trivial one.
Hypotheses 4 and 5 are supported, in that no effect is found in the Unstruc-
tured Service Type—characterized by both a low degree of experiential content and
a low degree of scripting—, or in the Middle Group. Properties of the Unstructured
Service Type show they are likely to compete on price, and do not put a strong em-
phasis on customer delight or on efficiency. Therefore, some improvisation is likely to
be occurring, but it does not have a substantial effect on either revenue or occupancy
rates, in that customers tend to be interested in the low cost. On the other hand, the
Middle group is likely to be heterogeneous in nature, with the properties not clearly
156

falling in any of the proposed strategic groups. Therefore they may not be giving
strong signals about their experience and scripting characteristics to customers. It is
likely that Serv–IC would have positive effects for some of them, and negative effects
for others. On average, then, we find no effect, consistent with our expectations.
3.6.3 Antecedents of Service Improvisation Competence
The results provided by our first stage estimation strongly support Hypotheses
6 and 7, therefore replicating the results of Essay 2 in this dissertation. The expression
of a Service Improvisation Competence (Serv–IC) in service delivery is driven primar-
ily by external influences (mostly CIU), and by organizational design choices, which
result in empowered employees. We have seen in Essay 2 how the choices concerning
the service delivery physical environment, the hiring and training policies, and the
circulation of information all contribute to the generation of a service environment
conducive to empowered employees, and how that in turn enables the creation of a
service improvisation competence. The relationship between service delivery design
choices and Serv–IC is fully mediated by empowerment. The statistical evidence for
the relevance of empowerment as an instrument for Serv–IC provides further evidence
of its mediating role between other organizational factors and Serv–IC, while at the
same time confirming its importance in the adaptive behaviors of frontline employees.
In a similar fashion, the evidence produced for the relevance of Customer–
Induced Uncertainty (CIU) as an instrument, and its significance in influencing Serv–
IC in the first–stage equations provides a strong indication that CIU mediates the
relationship between a wide range of environmental factors and the expression of Serv–
IC in service delivery. We infer that the uncertainty present in the environment and
due to market characteristics influences the relative variability in service processes
157

through the actions and behaviors of customers during the service encounter, and
in turn, propagates system and process variation that elicits improvisational kind of
behaviors on the part of the employees.
3.6.4 Limitations and Future Research
Like any research effort, this study presents several limitations. First, our busi-
ness performance outcome variables do not include a cost element. It is commonly
accepted both in research and in practice that one of the main drivers of scripting
is the gains in efficiency, which result in cost savings. However, in the hotel sector,
managers typically use RevPAR and Occupancy rates to gauge their business per-
formance, and therefore have those numbers readily available in their mind. Asking
for more appropriate measures (such as the the Gross Operating Profit per Available
Room), would likely result in a significant drop in our response rate.
A second important limitation is that the sample size within the different cells
is barely sufficient for our estimation purposes, and the number of observations in the
Average category is significantly larger than in the other categories. We performed
tests with alternate specifications of the groups, including simply dividing the sample
in four, and we found that, generally, our main results concerning occupancy hold
across different group specifications.
Third, some of the measures exhibit lower psychometric properties than would
be desired (Roth et al. 2008), as shown in the factor analysis reported in Table
3.8. Some of the results (e.g. for Customer–Induced Uncertainty) can be due to a
misspecification of the scale as unidimensional, when it may be a second–order, meta–
scale. Or it may be better conceptualized as a formative construct (i.e. an index),
rather than a reflective one. The results for Empowerment are most likely due to the
158

nature of the sample and to the necessity of using an abbreviated form of the original
scale (Hartline and Ferrell 1996).
Finally, our research focuses on routine front–line operations; and therefore,
the inferences that we can make from this data provide only general guidance. A
different scenario is likely to emerge in the case of service recovery situations, whereby
some aspect of the service delivery has failed. In this subset of events, it is possible
that possessing some Service Improvisation Competence to respond to service failure
would be beneficial even in the low experience groups.
Such limitations also provide indications for future research. Including a cost
element in our estimation is the first element that we plan to explore. We know when
improvisation can be beneficial to revenue, but we also know that hiring and training
employees for improvisation, as well as providing the resources that are necessary to
do so successfully entails added costs. It is assumed that the costs will be mitigated
and net out due to the increased revenue. The effect of Serv–IC on costs and profits is
the next important avenue of research that allows us to push forward and generalize
further the findings of this research.
In addition, one important element that is not considered in this essay is the
coexistence of processes for which Serv–IC can be allowed and processes for which
it should not. For example, within the same hotel a customer might want a very
efficient and standardized check–in process, but a highly personal and improvised
concierge service. This paper does not go in the tactical details of different processes
within a single entity. Instead, we set to provide a higher–level strategic view of the
role of Serv–IC within our service delivery typology. The analysis of the outcomes of
Serv–IC within single encounters and within specific processes is a natural next step
in this line of research.
159

3.6.5 Conclusions
The results presented in this paper provide several contribution to the lit-
erature on service design and management. First, we examine the long–standing
theoretical division between standardized and personalized services, and we provide
a strong empirical link between the process design element of scripting in the context
of service strategy. We propose a new service delivery typology based on process de-
sign choices (i.e., scripting) and choices concerning the intended service concept (i.e.,
experiential content). This typology allows us to shed new light on the different ways
in which service operations address customer–induced uncertainty. Second, we pro-
vide empirical evidence that service firms can indeed sometimes break the trade–offs
between cost and service, as suggested by Frei (2006), by operating in a standardized
environment while at the same time providing highly engaging customer experiences
through a strategic use of their Serv–IC. But Serv–IC is not effective in some hotel
types. We also contribute to the central debate in operations and marketing litera-
ture on the different approaches to service design. Chase et al. (1984) argued that
separating the technical core of the organization from the customer–contact part can
be used to effectively manage customer–induced uncertainty by removing it wherever
possible. We showed that a different approach is also possible. Through the use
of improvisation it is feasible to make highly standardized processes and flexibility
coexist in the same high–contact service delivery system.
Our research also provides important insights to managers. The first and most
important is that, in order to provide a satisfactory experience, customer–contact
employee selection and training is central (Goldstein 2003, Hartline and Ferrell 1996,
Voss et al. 2008). More importantly, relying on employee judgment becomes really
important when the intended service strategy falls away from the classical accommo-
160

dation and reduction strategies. Our findings show that Serv–IC can be used to move
away from the scripting–experience trade–off (and to create a Scripted Experience),
but in order to reap the benefits of Serv–IC, it cannot be simply introduced into a
Standardized Service type. Employees’ skills, management systems, and, more impor-
tantly, customer expectations, have to be managed carefully to avoid the deleterious
effects of Serv–IC in standardized environments. Consistently with the expectation
disconfirmation paradigm of service quality, customer expectations play an important
role in the final assessment of the service received, and Serv–IC is not expected in
an efficiency–oriented kind of environment (Parasuraman et al. 1988, Carman 1990,
Parasuraman et al. 1991).
Our findings corroborate the literature on service experience, in suggesting
that the service strategy has to be the driver of the operational choices and that the
whole service system should be designed in such a way as to provide the right clues
both to customers and employees (Voss et al. 2008). At the same time, we provide
a new perspective on the design of service delivery processes in experiential services,
broadening the analogy between service delivery and performing arts to explicitly
include employee improvisation as a fundamental element of service operations design.
In conclusion, this study significantly contributes to our understanding of ser-
vice delivery systems design, it sets the foundations for future research and for a
deeper understanding of the dynamic interplay between process design and on–the–
spot—and systemic—decision making, namely Service Improvisation Competence.
161
Conclusions
This dissertation provides comprehensive theory of Service Improvisation Com-
petence (Serv–IC)—the ability of frontline service employees to deviate from estab-
lished processes or routines in order to timely accommodate unexpected events, using
available resources. This ability, displayed by many excellent service firms, to adapt to
Customer–Induced Uncertainty by empowering frontline workers, without disrupting
the reliability of the whole system, can be an important asset in high–contact service
settings. Given the importance of managing Customer–Induced Variability in service
operations, and considered the paucity of empirical work on the role of improvisation
in service delivery, developing and testing a theory of Serv–IC significantly contributes
to the Service Operations literature—and to the service management literature more
generally.
In developing our research programme, we set to answer a few central research
questions, which constitute the core of our effort to shed light on the role of Serv–IC
in service delivery, namely: i) How can we measure Serv–IC? ii) How does a service
firm develop a Serv–IC? iii) What are the effects of Serv–IC on performance?
We collected data from multiple sources in the Hospitality industry (hotel
employees and managers), and we empirically explored our research questions using a
variety of methodologies (namely, psychometric methods and path analysis in Essay
162
2, and econometric methods in Essay 3).
The following sections discuss the results of our research as it pertains to each
of our research questions.
4.1 How can we measure Serv–IC?
Only a handful of studies attempted to measure improvisation, and none of
them in the service environment (Moorman and Miner 1998a, Vera and Crossan 2005,
Magni et al. 2009). In our theoretical development (Essay 1), we highlighted how the
conceptualization of the Organizational Improvisation (OI) construct is not entirely
consistent across different studies, although it is possible to identify three underlying
concepts that recur throughout the OI literature. In an attempt to synthesize existing
conceptualizations as a basis for a rigorous measurement development, we identified
three dimensions that that are employed in OI studies as a foundation for construct
definition and theoretical development. The three dimensions of the improvisation
construct are Creativity (the degree of novelty in a behavior), Spontaneity (the im-
mediacy of the response to an event), and Bricolage (the degree to which a response
is crafted from available resources).
The creativity aspect of improvisation is the most commonly cited, and pos-
sibly the easiest element to identify in improvisational behaviors. Indeed, the most
striking aspect of improvisational behaviors—be it during an artistic performance or
a service encounter—is often the ability of the performers to surprise by offering a
solution that is completely new and suited for the situation at hand (e Cunha et al.
1999, Kamoche et al. 2002, e Cunha et al. 2009). Spontaneity is often recognized as an
essential element of improvisation, as the timeliness of the improvisational response
is usually directly linked with its outcomes (Brown and Eisenhardt 1997, Crossan
163

et al. 2005). The time element has also provided the basis for the first attempts to
measure Organizational Improvisation (Moorman and Miner 1998a, Crossan et al.
2005). Finally, Bricolage is often cited in the OI literature as an important element
in successfully providing an adequate response, but there have been no attempts at
measuring it in the contxt of improvisational behaviors (e Cunha et al. 1999, Ciborra
1999, Baker et al. 2003, Baker and Nelson 2005).
Paper 1 operationalizes these dimensions in a service settings by defining cre-
ativity as the deviation from standardized routines and processes, spontaneity as
the perceived immediacy of the response to a disruption introduced by a guest, and
bricolage as the use of resources that were not specifically designed for the actions
performed to respond to the disruption. We combine these dimensions and define
Serv–IC as second–order latent construct. In Paper 2, we develop a measurement
instrument based on these three dimensions and provide empirical evidence of its
reliability and validity.
The construct definition and measurement validation provided by this disserta-
tion contributes both to the literature on Organizational Improvisation—by providing
a measurement instrument that combines different theoretical perspectives—and to
the literature on service design—by introducing a novel approach for looking to ser-
vice delivery systems’ behaviors. Reliable and theoretically–based measurement is
the key to performing meaningful empirical research, and constitutes the basis of the
result provided in this research effort, as well a the basis for future research.
4.2 How does a service firm develop a Serv–IC?
Essay 1 proposes that the design of Serv–IC is the result of a complex interac-
tion of a set of service design choices that foster a climate of empowerment as well as
164

a customer–oriented attitude among employees. Essay 2 and 3 confirm the insights
of the theoretical development of the first essay by specifically testing design choices
(Voss et al. 2008) concerning the physical service environment (stageware), the HR
policies (orgware), the choices concerning the information diffusion (linkware), and
the design of the processes that inform the service encounter (customerware).
Essay 2 and Essay 3 jointly provide support for an holistic service design
strategy, and for the central role of empowerment as a mediator between service design
choices and the development of Service Improvisation Competence. In addition, the
two essays stress the importance of Customer–Induced Uncertainty as a trigger for
improvisational behaviors, as well as an important environmental pressure on the
organization to invest in Serv–IC in the first place.
We show that, in order for a service delivery system to possess the ability to im-
provise in the face of uncertainty, a wide array of service delivery design elements have
to work in concert towards the same end. Choices concerning the physical environ-
ment (Stageware), HR practices (Orgware), the diffusion of information (Linkware),
and the service encounter (Customerware), all directly influence the behaviors of
customer–contact employees. As a theater crew performing a play, service employees
and managers have to draw on the surrounding environment to deliver a meaningful
experience to their customers. Operations management has the important role of
choreographing the performance and ensure that all the actors perform in a way that
is consistent with the desired end (Voss et al. 2008).
Essay 2 provides additional insights on the effect of operational design choices
by exploring the relationship between scripting—i.e. the rigidity and complexity of
service delivery procedures—and improvisational behaviors of customer–contact em-
ployees. Traditionally, service research has posited that scripting the service encounter
is an effective way of increasing managerial control and consistency in the service
165

provided, stressing its possible negative outcomes due to customer expectations of a
spontaneous and authentic interaction (Tansik and Smith 1991, 2000, Victorino et al.
2008). Consistently with the findings of an important stream of strategy literature
(Mintzberg 1978, 1994), we find that the intended goals of managers—in this case,
increasing control and conformance—are do not always result in the desired employee
behaviors—in this case, a decrease in improvisation. More specifically, scripting is ef-
fective as a way to standardize employees’ behaviors only up to a certain point: when
service scripts become too constraining or too complex, they result in an increase in
improvisational activities, rather than in increased uniformity of service delivery.
The findings presented in this dissertation strongly indicate that Serv–IC is the
result of a significant investment both in physical and human capital. One important
element in the future development of the research programme started with the studies
presented in this manuscript, is the study of the cost elements of designing a service
delivery system that possesses Servi–IC. Future research should provide cost estimates
that will enable researchers and service businesses to estimate the net effect of the
service design choices conductive to the ability to improvise. Such estimation is
further complicated by the fact that cost–reduction efforts (such as increasing the
degree of scripting in service delivery), may backfire and result in an increase in
operating costs. We suspect that different service types—both within and across
industries—will present different scripting–improvisation characteristic curves, which
will reach their minimum point at different levels of scripting. The estimation of such
curves will be a necessary and insightful step in the future development of Serv–IC
research.
166

4.3 What are the effects of Serv–IC on perfor-
mance?
Essay 2 and 3 offer estimates of the effects of Serv-IC on several indicators
of service business performance, across several hotel categories and service delivery
system types. Essay 2 shows that lower–rating hotels are more likely to benefit from
Serv–IC than higher–rating ones. In light of the characteristics of the hospitality
industry, this result can be explained by the prominent role of “rituals” in high–end
hotels. Higher rated hotels are often built around a distinct personality that is con-
structed through carefully choreographing apparently minor aspects of the customer
experience—e.g. how the staff greets arriving guests, the arrangement of complimen-
tary goods in the room, the attire of employees, etc. In this context, it is conceivable
that deviating from established routines will be viewd as negative by guests that have
been trained to expect a consistent behavior.
However, the data from Essay 2 also indicated that star rating, although a
good first–approximation measure of hotel type—does not convey much information
about the design characteristics of the service delivery system, or about the intended
target market. For example, a small luxury Boutique hotel—which provides highly
personalized and engaging experience—can have a lower–star rating than that of
a large hotel situated in the downtown of a large city, which can more easily offer
additional amenities, such as a pool, a gym, etc. After examining the service literature
in search of a classification of service types applicable to our research question, we
gathered the insights provided by several scholars—in particular Huete and Roth
(1988) and Frei (2006)—and decided to develop a novel typology of service delivery
system based on service concept and service delivery process design variables.
The aspect of the service concept that is relevant to our research question
167

is the amount of emotional engagement that the service is supposed to elicit in the
customer, i.e. the experiential content of the service (Pine and Gilmore 1999, Pullman
and Gross 2004, Voss et al. 2008). In Essay 2, we showed that the service delivery
choices that result in Serv–IC are influenced by the intended experiential content
defined in the service concept, and therefore—if our theory of Serv-IC is correct—
improvisation should be more appropriate in highly experiential contexts. Similarly,
we build on the findings of Essay 2 by identifying in the Degree of Scripting the most
important variable which shapes the characteristics of the service encounter.
By dichotomizing each variable in High and Low values, we presented five
service types: i) Scripted Experiences (high in both variables), ii) Personalized Expe-
riences (high experience and low degree of scripting), iii) Standardized Services (low
experience and high degree of scripting), iv) Unstructured Services (low experience
and low degree of scripting), and v) an Middle group, which consists of services that
do not clearly fall in any of the other ‘pure’ types.
We tested the differential effect of Serv–IC within each service type, using
measures of business outcomes commonly employed in the hospitality industry—
Occupancy Rate, Average Daily Rate (ADR), and Revenue per Available Room
(RevPAR). As expected, we found that improvisation has a positive effect on busi-
ness outcomes in Personalized Experiences and Scripted Experiences, and a negative
effects in Standardized Services. Furthermore, we found reasonable support that the
effect of improvisation is particularly important in Scripted Experiences, as indicated
by the relatively small confidence interval of the estimate. This latter finding sug-
gests that Serv–IC is a necessary element of the implementation of service systems
that are both highly experiential and highly choreographed, while it has a more un-
certain effect on the performance of Personalized Experiences—as indicated by the
larger confidence interval of the slope of business performance outcomes regressed on
168

Serv–IC in that group.
The effects of improvisation on business performance are not uniform across
performance measures. More specifically, the negative effects of Serv–IC manifest
themselves as a negative influence across all the measures considered (Occupancy,
ADR, and RevPAR), while the positive effects have an influence mainly on Occupancy.
This means that Serv–IC leads to increased performance by leveraging customer loy-
alty and former guests reviews. The hospitality industry is strongly influenced by
online reviews of services and experiences, and providing an engaging customer expe-
rience through proactively bending organizational routines to satisfy guests can lead
to positive feedback on review websites—as well as through word–of–mouth—which,
in turn, have a positive impact on occupancy rate. However, this also means that
Serv–IC does not usually result in increase in revenue through pricing policy: it could
be argued that improvisation is not seen by guests as something that they should pay
a higher price for, but it is something that would increase their likelihood to use the
same service repeatedly. On the contrary, the negative effects of Serv–IC influence
both Occupancy and ADR, indicating that an inappropriate use of improvisation—i.e.
using improvisation in standardized services—leads to lower revenue by influencing
both Occupancy rate and the ability to charge higher prices (ADR).
4.4 Contributions
The research presented in this dissertation contributes to the service operations
literature in several ways. First, we introduce a new construct—Service Improvisation
Competence—in the analysis of customer–contact operations, as a way to manage
Customer–Induced Uncertainty. Serv–IC is a construct that, although never explicitly
studied in the service operations literature before, plays an important mediating role
169

in the relationship between design choices and business performance. It provides
a way to explicitly consider the effects on performance of how design choices are
implemented in the day–to–day reality of service encounters.
We develop a theory of service improvisation that highlights the non–linear re-
lationship of some design choices (i.e. scripting) with the actual behavior of customer–
contact employees. Moreover, we define the service types in which Serv–IC can be
a potentially useful service management strategy. Taken together, our findings on
antecedents and outcomes of Serv–IC provide a nuanced picture of the potential ad-
vantages and pitfalls of the development of a Service Improvisation Competence as a
way to address Cusotmer–Induced variability.
We also contribute to the development of the Organizational Improvisation
literature—from which our research stemmed from—in several ways. First, we offer
a new, multidimensional, measurement instrument that synthesizes the multifaceted
characterizations of improvisation in the literature. Second, we offered a theory of the
design choices that lead to a firms’ ability to improvise, while previous research almost
entirely focused on the effects of improvisation. Finally, we confirmed some previous
findings—such as the importance of incentives and information sharing (Moorman and
Miner 1998a, Vera and Crossan 2005)—and we tested the, often theorized, dependence
of improvisation outcomes on the characteristics of the organization and its target
market (e Cunha et al. 1999).
Our findings on the effectiveness of Serv–IC and of the important elements
in its design also provide important insights for practice. First, that it is important
to realize that managerial choices concerning routine standardization do not always
result in the intended outcomes, but can indeed lead to the opposite result of what
they were implemented for. Second, we provide a way to conceptualize service types
according to design choices in a way that makes it easier to assess the potential effects
170
of Serv–IC.
As any research effort, this research presents several limitations, which point
to future developments of our research programme. First, all of our studies rely on
a single respondent. Although we ascertained that common method bias was not
an issue in our sample, multiple sources would undoubtedly provide us with richer
insights. Second, we have to consider the possible generalizability of our findings
across industries and across cultures. It is possible that Serv–IC could have different
effects in different industries and especially across different cultures, given the variety
of customer expectations. Finally, our research only considered revenue outcomes.
Considering the substantial investments that developing a Serv–IC likely entails, its
net impact on a firm’s performance can be property evaluated only by considering
profit measures, instead of revenue. Our future research will explore differences across
multiple environments as well as Serv–IC effects on measures of cost and profit.
171

Appendices
172

Appendix A Measurement Development and
Pilot Study
The measures used in this paper have been developed following the rigorous
process and the recommendations offered by (Menor and Roth 2007) and Churchill Jr
(1979). Figure A.1 summarizes the steps that we took in order to obtain measures
with acceptable psychometrics properties. First, we started by building a conceptual
framework of the construct domanis, which led to the identification of the relevant lit-
erature streams. Then we conducted an extensive review of the literature that led to
the narrowing of the theoretical domain of our constructs and suggested a strategy for
the measures development. For example, for the Service Improvisation Competence
(Serv–IC) construct, we reviewed the existent literature on Organizational Improvi-
sation, as well as research on service delivery, which presents several constructs that
are related to the Serv–IC construct (e.g., employee adaptability, empowerment, and
flexibility).
The literature review resulted in the collection of instruments previously used
to measure the constructs of interest. Some of the constructs, like empowerment,
are widely researched. For these, we found a considerable number of scales already
developed, which we adapted and complemented. For other constructs, such as Brico-
lage and Degree of Scripting, existent measures were not available and we developed
the scales anew. When some scales were available, but we did not feel confident
they tapped into the aspects of the construct that are of interest to our research, we
supplemented the existent scales with new items. After we selected and created a
sufficiently large pool of items, we started preliminary validity and reliability testing
using Q–Sort procedures.
Q–sorting procedures consist of providing a panel of experts, or a group that
173

Figure A.1: Instrument Development Process (from Menor and Roth (2007))
measurement items and construct definitions throughfour rounds of item-sorting exercises. Each item-sortingiteration was administered to an independent sample ofjudges. In the last two rounds, we used expert judges withthe appropriate knowledge, skill, experience, andmotivation to evaluate NSD competence in practice.Since our target population was financial services, weselected retail-banking professionals who were the mostknowledgeable about their organization’s NSD efforts tobe expert judges. The instrument used for item sortingconsisted of a definition of each thefiveNSDcompetencedimensions, a related NSD performance dimension, anda randomized listing of all measurement items (seeHinkin, 1998). Our approach is a modified version of Q-sorting (McKeown and Thomas, 1988), in whichrespondents are asked to classify items based on theirsimilarity with definitions and descriptions of underlyingconstruct categories. For each item-sorting round, judgeswere directed to carefully read the descriptions of each ofthe five construct dimensions and to match each item tothe one dimension that they felt was the best fit. Item-sorting analysis, which has not been commonlyemployed or reported in the OM literature (Hensley,1999), has long been advocated as an important approach
for assessing face validity when developing newmeasurement items and scales. However, its under-utilization even in more empirically mature disciplineslike marketing continues to be a source of concernregarding measurement quality assessment (Hardestyand Bearden, 2004).
Each round of item sorting produced independentsamples of judgment-based, nominal-scaled data, in theform of item-to-construct definition classifications. Theresulting judgment-based, nominal-scaled data werethen used to assess interrater reliability, substantivevalidity and construct validity of measurement items.Following Hinkin’s (1998) prescriptions, this analysisfocused on careful attention to the manner in whichitems were created and scrutinized prior to theirutilization in a back-end stage survey instrument.Fig. 3 further illustrates the front-end framework andspecifies the wide array of statistical approaches thatcan be employed in evaluating judgment-based data (cf.Nahm et al., 2002). The statistical results of the front-end stage are reported in Section 3.1.1. Due to thedesign of this item-sorting analysis, which called for thesimultaneous scrutiny of measurement items tappingNSD competence dimensions and NSD performance,we also included – solely for this stage of itempurification – an assessment of the tentative reliabilityand validity of the measurement items corresponding toa construct labeled NSD performance. However, we doexamine NSD performance factors based on these itemsin our examination of nomological validity in Section3.2.3. This allowed us to further distinguish our NSD
L.J. Menor, A.V. Roth / Journal of Operations Management 25 (2007) 825–846 831
Fig. 2. Two-stage approach for new measurement development.
Fig. 3. Front-end stage: measurement item sorting analyses.
is similar to the population of interest, with the definition of the constructs and with
the items, and asking them to classify which items are intended to measure which
construct (Menor and Roth 2007, 2008a, Roth et al. 2008, Siemsen et al. 2009).
In addition the respondents have been allowed to provide open ended comments
on wording and clarity issues, resulting in a rich feedback that has been used to
improve the questionnaire. Based on the analysis of inter–rater agreement on the
classification of the constructs, we evaluated changes in the items, changes in the
174

construct definitions, and we iterated the procedure until we reached satisfactory
results. We performed nine rounds of q–sorting before moving forward to test the
measures in a pilot study.
A.1 Pilot Study
In the pilot study, we collected a sample of 253 front–desk employees through
an online survey company, and asked them about three processes that they habitually
perform:
The check-in process: this refers to the regular check-in operations, including
the guest arrival and registration, and excluding the situations in which the guest has
a reservation but has been overbooked. This process should be fairly standardized
and probably exhibit a low level of improvisation, and behave like an order qualifier
(it has to have a specific set of characteristics, but it is not what wins guests’ loyalty).
The solution of guest satisfaction issues : this is the process of making accom-
modations for special requests or problems. In many situations it is quite difficult to
differentiate between solving a problem and responding to a special request, therefore
I considered them as a single phenomenon. Moreover, the same procedures usually
regulate both aspects (Hayes and Ninemeier 2007). In this kind of process, the ability
to improvise can almost be considered a necessary tool of the trade. We expected
to see the largest amount of improvisation as well as the largest impact on customer
satisfaction and on the generation of service innovations. Satisfying customers in
their special requests can be the order winner of the hotel offering.
Walking a guest : this is the process of finding an alternative accommodation
for a guest that has a reservation, but finds all rooms unavailable due to overbooking
or other issues. This is an interesting process for this research: in order to perform
175
it, there must be solid and reliable processes in place (hotels to contact, gifts to
inconvenienced guests, etc.), but the customer is likely to be extremely upset by
the room unavailability, and the ability of the hotel employees to find a more than
satisfactory accommodation can make a big difference in outcome. It can be reasoned
that the ability to improvise within clearly defined guidelines is the key to achieving
successful outcomes in this situation. The analysis of this process can highlight the
interplay between process design and improvisation, and therefore give us insights
that the other, more clear-cut, situations can’t provide.
Figure A.1 summarizes the results of the Confirmatory Factor Analysis for
the measurement model. All except two Chronbach’s alpha are above 0.8, indicating
good reliability, and all the AVE are above 0.5, suggesting that the measurement scales
possess unidimensionality, and therefore the items are correctly specified as reflective
of the construct of interest (Fornell and Larcker 1981, Gerbing and Anderson 1988,
Little et al. 1999). The model also exhibited good fit, with a CFI of 0.931, NFI of
0.748 and RMSEA of 0.033 (90% Confidence Interval: 0.029, 0.037).
Furthermore, the pilot study provided preliminary evidence in support of the
hypotheses advanced in this dissertation. One important element that emerged from
the pilot study is that the different processes were not statistically different in terms
of the amount of improvisation. This suggested that the employees’ perceptions of
Serv–IC are more systemic than linked to one particular service delivery process;
therefore, we dropped the reference to the processes, which would have required a
larger sample size.
176

Table A.1: Pilot Study CFA
Construct CR* AVE**Creativity 0.796 0.603Spontaneity 0.865 0.734Bricolage 0.830 0.667Ability to Evaluate System State 0.879 0.761Availability of Resources 0.870 0.742Empowerment 0.846 0.728Human Capital Management 0.813 0.635Experimental Culture 0.895 0.791Information Exchange Activities 0.880 0.762Use of Information Systems 0.907 0.815Degree of Scripting 0.816 0.641Customer Induced Uncertainty 0.759 0.546Customer Satisfaction 0.905 0.811Service Innovation 0.906 0.812Innovation Capture 0.830 0.691Customization 0.758 0.535Experiential Content 0.890 0.782*Composite Reliability**Average Variance Extracted
177

Welcome!!
Thank you for taking the time to complete our survey. You are invited to take part in a research study conducted by Dr. Aleda Roth and Enrico Secchi of Clemson University, in collaboration to with Dr. Rohit Verma and the Center for Hospitality Research at Cornell University. The purpose of this research is to understand the implications of the ability of hotels' front-‐line employees to create engaging customer experiences. If you agree to participate in this study, we ask that you proceed and complete this online survey, which should take about 10 minutes. The survey will ask questions about your work environment and your behaviors in serving the hotel guests. We do not know of any risks or discomforts associated with participation in this research study. By participating in this study, you will be contributing to the understanding of hotel employees interactions with guests and with their employers, as well as better understanding your own decisions and behaviors in your everyday work life. By participating in this study, you will also be entered in a raffle to win one of an Apple iPad2 and two Amazon Kindle. You will be asked to enter your email address in a form at the end of the survey, if you wish to participate in the raffle.
Protection of Privacy and Confidentiality
We will take all the necessary steps to ensure your privacy and the confidentiality of your answers. Your identity will not be disclosed in any publication or communication resulting from this study. The research team will not be able to associate your identity with your responses and the analysis will be conducted aggregate form. Individual answers will not be published and the data will be destroyed after three years following the conclusion of the study. We wish to remind you that the participation in this study is voluntary and you may choose to stop at any time. You will not suffer any consequence if you decide not to be in the study or to stop taking part in the study. You may choose to stop taking part in this study after today. If you do, we will remove your information from the study. However, if we have already completed our research analysis, we will not be able to remove your information from the study
Contact Information
If you have any questions or concerns about this study or if any problems arise, please contact Enrico Secchi ([email protected], Ph.D. Candidate) or Aleda Roth ([email protected], Burlinghton Industries Distinguished Professor of Supply Chain Management) at Clemson University. If you have any questions or concerns about your rights in this research study, please contact the Clemson University Office of Research Compliance (ORC) at 864-‐656-‐6460 or [email protected]. If you are outside of the Upstate South Carolina area, please use the ORC's toll-‐free number, 866-‐297-‐3071.
Appendix B Employee Survey
178

Please enter your job title:
What percentage of your work-‐time do you spend in contact with guests?
______ Please slide the bar to the desired percentage level (1)
If Please slide the bar to the... Is Less Than or Equal to 0, Then Skip To We thank you for your interest in our...
What percentage of your interaction with guests follows standardized procedures?
______ Please slide the bar to the desired percentage level (1)
When interacting with guests…
Strongly Disagree
(1)
Disagree (2)
Somewhat Disagree
(3)
Neither Agree nor
Disagree (4)
Somewhat Agree (5)
Agree (6)
Strongly Agree (7)
...most of the actions I have to perform are outlined in formal processes (1)
m m m m m m m
...I am not allowed to deviate from a predefined routine (2) m m m m m m m
...I have detailed instructions for handling most unusual situations (3) m m m m m m m
179

Please indicate how much you agree with the following statements concerning your interactions with guests
Strongly Disagree
(1)
Disagree (2)
Somewhat Disagree (3)
Neither Agree nor
Disagree (4)
Somewhat Agree (5)
Agree (6)
Strongly Agree (7)
I often deviate from standard routines to respond to guests`
requests (1) m m m m m m m
I often try new approaches to solve guests' problems (2)
m m m m m m m
I often have to be creative to satisfy customers' needs (3)
m m m m m m m
I often have to figure out actions in the moment (4) m m m m m m m
I often have to respond in the moment to unexpected problems (5) m m m m m m m
I almost always deal with unanticipated events on the spot (6)
m m m m m m m
I am able to make use of all the resources provided by my employer to respond to guests' requests (7)
m m m m m m m
I often pull information from many different sources to respond to
guests' requests (8) m m m m m m m
I often make use of several other workers' expertise to satisfy guests
(9) m m m m m m m
Please indicate how much you agree with the following statements concerning your interactions with guests
Strongly Disagree
(1)
Disagree (2)
Somewhat Disagree
(3)
Neither Agree nor
Disagree (4)
Somewhat Agree (5)
Agree (6)
Strongly Agree (7)
I am allowed to do my work the way I think best (1) m m m m m m m
I am encouraged to show initiative (2) m m m m m m m
I am trusted to exercise good judgment (3) m m m m m m m
I am allowed a high degree of initiative (4) m m m m m m m
180

Please indicate how much you agree with the following statements concerning your work environment
Strongly Disagree
(1)
Disagree (2)
Somewhat Disagree
(3)
Neither Agree nor
Disagree (4)
Somewhat Agree (5)
Agree (6)
Strongly Agree (7)
I am immediately aware of any guest's problem (1)
m m m m m m m
I can easily assess how many guests are being currently served (2) m m m m m m m
I can easily assess how many guests are waiting for the service I provide (3) m m m m m m m
My employer provides me with a wide array of resources to do my job (4) m m m m m m m
My employer provides extra funds to be used for emergencies (5)
m m m m m m m
I can easily access all I need to do my job (6) m m m m m m m
Please indicate how much you agree with the following statements referring to your employer hiring and training practicesCompared to competition...
Strongly Disagree
(1)
Disagree (2)
Somewhat Disagree
(3)
Neither Agree nor
Disagree (4)
Somewhat Agree (5)
Agree (6)
Strongly Agree (7)
...our hotel hires employees with high levels of prior experience (1) m m m m m m m
...our hotel hires employees with high levels of education (2)
m m m m m m m
...our hotel spends more money per employee on training (3) m m m m m m m
...our hotel focuses on hiring employees with customer oriented attitudes (4) m m m m m m m
181

Please indicate how much you agree with the following statements concerning your superiors' behaviors
Strongly Disagree
(1)
Disagree (2)
Somewhat Disagree
(3)
Neither Agree nor
Disagree (4)
Somewhat Agree (5)
Agree (6)
Strongly Agree (7)
Management encourages employees to participate in important decisions concerning service delivery (1)
m m m m m m m
Management rewards proactive behaviors in the interactions with guests (2)
m m m m m m m
My managers reward personal initiative in the solution of guests’ problems (3)
m m m m m m m
On average, about how many hours do you spend discussing service issues with your coworkers or managers in a typical week?
______ Please slide the bar to the desired number (1)
Please indicate how much you agree with the following statements concerning the diffusion of information in your workplace
Strongly Disagree
(1)
Disagree (2)
Somewhat Disagree
(3)
Neither Agree nor
Disagree (4)
Somewhat Agree (5)
Agree (6)
Strongly Agree (7)
I regularly receive information about other department's customer-‐related
activities (1) m m m m m m m
Information about what is going on within the organization is readily shared at all
levels (2) m m m m m m m
I often have to use information technology systems to respond to
customers' requests (3) m m m m m m m
The amount of information that I receive regarding other department's activities is sufficient for me to do a good job (4)
m m m m m m m
Status of important success measures is shared routinely at all levels (5) m m m m m m m
182

Please indicate how much you agree with the following statements concerning your service offering
Strongly Disagree
(1)
Disagree (2)
Somewhat Disagree
(3)
Neither Agree nor
Disagree (4)
Somewhat Agree (5)
Agree (6)
Strongly Agree (7)
Compared to our primary competitors, we have a higher percentage of new services in
our offering (1) m m m m m m m
We are fast in introducing new services (2) m m m m m m m
Compared to our primary competitors, we introduce a higher number of service
innovations (3) m m m m m m m
We have formal internal processes to develop new service offerings (4) m m m m m m m
We have formal internal procedures to document process improvements (5) m m m m m m m
We routinely document ad hoc customer suggestions and complaints (6)
m m m m m m m
We offer a personalized treatment to each guest (7) m m m m m m m
We change how our service is offered for each guest (8) m m m m m m m
We provide a wide variety of acommodation options to our guests (9)
m m m m m m m
We make a deliberate attempt emotionally engage our guests (10) m m m m m m m
Customer experience is at the center of our service offering (11) m m m m m m m
We provide our guests with a feeling of genuine caring and authenticity (12)
m m m m m m m
183

Please indicate how much you agree with the following statements concerning your guests' behavior
Strongly Disagree
(1)
Disagree (2)
Somewhat Disagree
(3)
Neither Agree nor
Disagree (4)
Somewhat Agree (5)
Agree (6)
Strongly Agree (7)
It is difficult to predict about how much effort our guests will put in helping me
provide a satisfactory service (1) m m m m m m m
It is difficult to predict how many guests will require my services at any
given time (2) m m m m m m m
Guests vary widely in what they consider a satisfactory service
experience (3) m m m m m m m
Please indicate how much you agree with the following statements concerning your guests’ satisfaction
Strongly Disagree
(1)
Disagree (2)
Somewhat Disagree
(3)
Neither Agree nor Disagree
(4)
Somewhat Agree (5)
Agree (6)
Strongly Agree (7)
Overall, guests are satisfied with our services (1) m m m m m m m
Our guests seem happy with our responsiveness to their problems (2) m m m m m m m
Guests are likely to return to our establishment (3)
m m m m m m m
Our hotel is profitable relative to our primary competitors, despite the
economic conditions (4) m m m m m m m
184

Please provide a few more information to complete the survey. This information will only be used for statistical purposes.
What is your age group?
m Under 18 (1) m 18-‐24 (2) m 25-‐29 (3) m 30-‐34 (4) m 35-‐39 (5) m 40-‐44 (6) m 45-‐49 (7) m 50-‐55 (8) m 56-‐60 (9) m 61 or older (10)
What is the highest level of education you have completed?
m Some high school (1) m High school/GED (2) m Some college (3) m Associate's degree (4) m Trade or other technical school degree (5) m Bachelor's degree (6) m Master's degree (7) m Other (please specify) (8) ____________________
How long have you been working in the hotel industry?
m 0-‐3 years (1) m 4-‐7 years (2) m 8-‐11 years (3) m 12-‐15 years (4) m More than 15 years (5)
How long have you been working for your current employer?
m 0-‐3 years (1) m 4-‐7 years (2) m 8-‐11 years (3) m 12-‐15 years (4) m More than 15 years (5)
185

How would you classify the property where you work?
m Conference Center (1) m Resort Hotel (2) m Full-‐Service Hotel (3) m Limited-‐Service Hotel (4) m Suite Hotel (5) m Convention Hotel (6) m Extended Stay Hotel (7) m All-‐Inclusive (8) m NA / Don't Know (9)
What one location type better describes the property where you work?
m Airport (1) m City Center (2) m Resort (3) m Suburban (4) m Highway (5) m Rural/Non-‐Resort (6) m Other (please specify) (7) ____________________
What one category best describes the nature of the property where you work?
m Deluxe (1) m Luxury (2) m Upscale (3) m Midscale with Food & Beverages Services (4) m Midscale without Food & Beverages Services (5) m Economy (6) m Budget (7) m Upper-‐Tier Extended Stay (8) m Lower-‐Tier Extended Stay (9) m NA / Don’t Know (10) m Other (please specify) (11) ____________________
How Many guest rooms are available in the property where you work?
About what was the average percent occupancy rate last september?
______ Please slide the bar to the desired percentage level (1)
What is the star rating of the property you work for?
1 Star (1) 2 Stars (2) 3 Stars (3) 4 Stars (4) 5 Stars (5) Star Rating (1) m m m m m
186

Please insert your email here if you wish to participate in the Raffle to win one of two Amazon Kindle or an Apple iPad2.
Thank You! Thank you for participating in our research. For any concern, problem or issue with any aspect of the research please do not hesitate to contact Enrico Secchi ([email protected].)The results of this study will be published in the Cornell Hospitality Reports and will be available on the Center for Hospitality Research website.Have a great day!
If Thank You! Thank you for ... Is Displayed, Then Skip To End of Survey
We thank you for your interest in our study.At this moment we are looking for hospitality workers that have a significant amount of contact with guests.We appreciate your interest and we hope that you will be able to participate in future research endeavors.Thank you.
187

Question Variable Name Median Mean Stdev Min Max NA's Kurtosis Skewness N
ResponseID ID 152Please enter your job title: jobtitle-‐-‐-‐-‐-‐-‐-‐ frontline 0.000 0.492 0.504 0.000 1.000 89.000 1.001 0.032 63What percentage of your work-‐time do you spend in contact with guests? (Contact) contact 60.500 55.160 30.109 1.000 100.000 0.000 1.713 -‐0.180 152What percentage of your interaction with guests follows standardized procedures? scripting 60.000 56.240 28.496 0.000 100.000 9.000 2.021 -‐0.359 143Degree of Scripting DOS 3.333 3.500 1.425 1.000 7.000 4.000 2.411 0.194 148When interacting with guests......most of the actions I have to perform are outlined in formal processes dos1 5.000 4.533 1.767 1.000 7.000 2.000 2.151 -‐0.560 150...I am not allowed to deviate from a predefined routine dos2 2.000 2.647 1.719 1.000 7.000 2.000 2.812 0.971 150...I have detailed instructions for handling most unusual situations dos3 3.000 3.318 1.913 1.000 7.000 4.000 1.919 0.442 148Please indicate how much you agree with the following statements concerning your interactions with guests:Service Improvisation Competence Serv-‐IC 5.556 5.553 0.847 2.889 7.000 19.000 3.643 -‐0.560 133Creativity CR 5.333 5.358 1.127 2.000 7.000 15.000 3.425 -‐0.664 137I often deviate from standard routines to respond to guests` requests cr1 5.000 4.679 1.710 1.000 7.000 15.000 2.187 -‐0.484 137I often try new approaches to solve guests' problems cr2 6.000 5.504 1.307 1.000 7.000 15.000 5.195 -‐1.327 137I often have to be creative to satisfy customers' needs cr3 6.000 5.891 1.174 2.000 7.000 15.000 5.244 -‐1.457 137Spontaneity SP 6.000 5.664 1.090 2.000 7.000 18.000 4.600 -‐1.248 134I often have to figure out actions in the moment sp1 6.000 5.934 1.181 1.000 7.000 16.000 6.613 -‐1.739 136I often have to respond in the moment to unexpected problems sp2 6.000 5.891 1.217 2.000 7.000 15.000 5.602 -‐1.633 137I almost always deal with unanticipated events on the spot sp3 5.000 5.109 1.518 2.000 7.000 15.000 2.443 -‐0.667 137Bricolage BR 5.667 5.620 0.980 2.000 7.000 16.000 4.505 -‐0.871 136I am able to make use of all the resources provided by my employer to respond to guests' requests br1 6.000 5.667 1.281 2.000 7.000 14.000 3.537 -‐0.991 138
I often pull information from many different sources to respond to guests' requests br2 6.000 5.768 1.161 2.000 7.000 14.000 4.800 -‐1.227 138I often make use of several other workers' expertise to satisfy guests br3 6.000 5.412 1.493 1.000 7.000 16.000 4.135 -‐1.209 136
Appendix C Employee Survey Descriptives
188
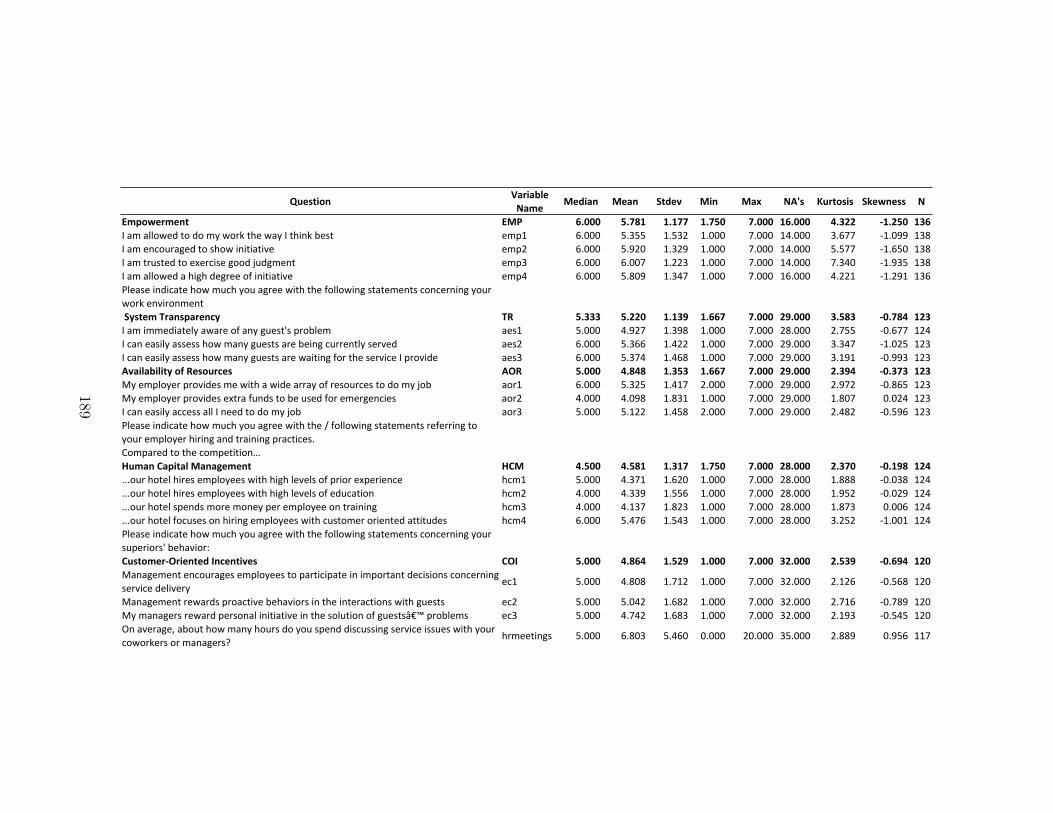
Question Variable Name Median Mean Stdev Min Max NA's Kurtosis Skewness N
Empowerment EMP 6.000 5.781 1.177 1.750 7.000 16.000 4.322 -‐1.250 136I am allowed to do my work the way I think best emp1 6.000 5.355 1.532 1.000 7.000 14.000 3.677 -‐1.099 138I am encouraged to show initiative emp2 6.000 5.920 1.329 1.000 7.000 14.000 5.577 -‐1.650 138I am trusted to exercise good judgment emp3 6.000 6.007 1.223 1.000 7.000 14.000 7.340 -‐1.935 138I am allowed a high degree of initiative emp4 6.000 5.809 1.347 1.000 7.000 16.000 4.221 -‐1.291 136Please indicate how much you agree with the following statements concerning your work environment System Transparency TR 5.333 5.220 1.139 1.667 7.000 29.000 3.583 -‐0.784 123I am immediately aware of any guest's problem aes1 5.000 4.927 1.398 1.000 7.000 28.000 2.755 -‐0.677 124I can easily assess how many guests are being currently served aes2 6.000 5.366 1.422 1.000 7.000 29.000 3.347 -‐1.025 123I can easily assess how many guests are waiting for the service I provide aes3 6.000 5.374 1.468 1.000 7.000 29.000 3.191 -‐0.993 123Availability of Resources AOR 5.000 4.848 1.353 1.667 7.000 29.000 2.394 -‐0.373 123My employer provides me with a wide array of resources to do my job aor1 6.000 5.325 1.417 2.000 7.000 29.000 2.972 -‐0.865 123My employer provides extra funds to be used for emergencies aor2 4.000 4.098 1.831 1.000 7.000 29.000 1.807 0.024 123I can easily access all I need to do my job aor3 5.000 5.122 1.458 2.000 7.000 29.000 2.482 -‐0.596 123Please indicate how much you agree with the / following statements referring to your employer hiring and training practices.Compared to the competition…Human Capital Management HCM 4.500 4.581 1.317 1.750 7.000 28.000 2.370 -‐0.198 124...our hotel hires employees with high levels of prior experience hcm1 5.000 4.371 1.620 1.000 7.000 28.000 1.888 -‐0.038 124...our hotel hires employees with high levels of education hcm2 4.000 4.339 1.556 1.000 7.000 28.000 1.952 -‐0.029 124...our hotel spends more money per employee on training hcm3 4.000 4.137 1.823 1.000 7.000 28.000 1.873 0.006 124...our hotel focuses on hiring employees with customer oriented attitudes hcm4 6.000 5.476 1.543 1.000 7.000 28.000 3.252 -‐1.001 124Please indicate how much you agree with the following statements concerning your superiors' behavior:Customer-‐Oriented Incentives COI 5.000 4.864 1.529 1.000 7.000 32.000 2.539 -‐0.694 120Management encourages employees to participate in important decisions concerning service delivery ec1 5.000 4.808 1.712 1.000 7.000 32.000 2.126 -‐0.568 120
Management rewards proactive behaviors in the interactions with guests ec2 5.000 5.042 1.682 1.000 7.000 32.000 2.716 -‐0.789 120My managers reward personal initiative in the solution of guests’ problems ec3 5.000 4.742 1.683 1.000 7.000 32.000 2.193 -‐0.545 120On average, about how many hours do you spend discussing service issues with your coworkers or managers? hrmeetings 5.000 6.803 5.460 0.000 20.000 35.000 2.889 0.956 117
189

Question Variable Name Median Mean Stdev Min Max NA's Kurtosis Skewness N
Information Exchange Activities IEA 4.750 4.750 1.431 1.500 7.000 32.000 2.283 -‐0.415 120Please indicate how much you agree with the / following statements concerning the diffusion of information in your workplaceI regularly receive information about other department's customer-‐related activities iea1 5.000 4.742 1.770 1.000 7.000 32.000 2.240 -‐0.562 120Information about what is going on within the organization is readily shared at all levels iea2 5.000 4.492 1.901 1.000 7.000 32.000 1.878 -‐0.341 120
The amount of information that I receive regarding other department's activities is sufficient for me to do a good job iea3 5.000 4.883 1.535 1.000 7.000 32.000 2.457 -‐0.629 120
Status of important success measures is shared routinely at all levels iea4 6.000 4.883 1.731 1.000 7.000 32.000 2.104 -‐0.581 120I often have to use information technology systems to respond to customers' requests is1 6.000 5.286 1.595 1.000 7.000 33.000 3.354 -‐1.040 119
Please indicate how much you agree with the following statements concerning your service offeringService Innovation SINN 4.667 4.529 1.473 1.000 7.000 38.000 2.267 -‐0.250 114Compared to our primary competitors, we have a higher percentage of new services in our offering sinn1 5.000 4.596 1.649 1.000 7.000 38.000 2.182 -‐0.326 114
We are fast in introducing new services sinn2 5.000 4.435 1.655 1.000 7.000 37.000 2.079 -‐0.200 115Compared to our primary competitors, we introduce a higher number of service innovations sinn3 5.000 4.530 1.597 1.000 7.000 37.000 2.124 -‐0.205 115
Innovation Capture ICAP 4.667 4.758 1.345 1.000 7.000 39.000 2.541 -‐0.361 113We have formal internal processes to develop new service offerings icap1 4.000 4.239 1.644 1.000 7.000 39.000 2.026 -‐0.144 113We have formal internal procedures to document process improvements icap2 5.000 4.553 1.667 1.000 7.000 38.000 2.064 -‐0.351 114We routinely document ad hoc customer suggestions and complaints icap3 6.000 5.474 1.434 1.000 7.000 38.000 3.298 -‐0.959 114Customization CUST 5.333 5.204 1.176 2.000 7.000 39.000 3.051 -‐0.611 113We offer a personalized treatment to each guest cust1 6.000 5.456 1.434 1.000 7.000 38.000 4.289 -‐1.178 114We change how our service is offered for each guest cust2 5.000 4.763 1.593 1.000 7.000 38.000 2.535 -‐0.506 114We provide a wide variety of acommodation options to our guests cust3 6.000 5.363 1.427 2.000 7.000 39.000 2.477 -‐0.638 113Experiential Service Concept ESC 6.000 5.734 1.189 1.000 7.000 38.000 5.189 -‐1.304 114We make a deliberate attempt emotionally engage our guests exp1 6.000 5.474 1.332 1.000 7.000 38.000 3.817 -‐0.982 114Customer experience is at the center of our service offering exp2 6.000 5.895 1.272 1.000 7.000 38.000 5.851 -‐1.539 114We provide our guests with a feeling of genuine caring and authenticity exp3 6.000 5.833 1.369 1.000 7.000 38.000 5.340 -‐1.546 114Please indicate how much you agree with the following statements concerning your guests' behavior
190

Question Variable Name Median Mean Stdev Min Max NA's Kurtosis Skewness N
Customer-‐Induced Uncertainty CIU 4.667 4.688 1.214 1.333 7.000 43.000 2.894 -‐0.279 109It is difficult to predict about how much effort our guests will put in helping me provide a satisfactory service ciu1 5.000 4.279 1.544 1.000 7.000 41.000 2.220 -‐0.251 111
It is difficult to predict how many guests will require my services at any given time ciu2 5.000 4.196 1.670 1.000 7.000 40.000 1.837 -‐0.115 112Guests vary widely in what they consider a satisfactory service experience ciu3 6.000 5.545 1.457 1.000 7.000 42.000 3.817 -‐1.146 110Customer Satisfaction CSAT 6.000 5.932 0.879 2.000 7.000 40.000 6.059 112Please indicate how much you agree with the following statements concerning your guests' satisfactionOverall, guests are satisfied with our services csat1 6.000 5.902 0.949 2.000 7.000 40.000 5.847 -‐1.456 112Our guests seem happy with our responsiveness to their problems csat2 6.000 5.812 1.044 1.000 7.000 40.000 6.512 -‐1.431 112Guests are likely to return to our establishment csat3 6.000 6.080 0.922 3.000 7.000 40.000 3.440 -‐0.922 112Our hotel is profitable relative to our primary competitors, despite the economic conditions profit 6.000 5.500 1.495 1.000 7.000 40.000 3.243 -‐0.943 112
Demographics:What is your age group? age 4.000 4.820 2.023 2.000 9.000 41.000 2.408 0.591 111What is the highest level of education you have / completed? educ 6.000 5.631 1.477 2.000 8.000 41.000 2.998 -‐1.065 111How long have you been working in the hotel / industry? exper 3.000 2.908 1.411 1.000 5.000 43.000 1.768 0.262 109How long have you / been working for your current employer? tenure 1.000 1.755 1.110 1.000 5.000 42.000 4.930 1.627 110How Many guest rooms are available in the property where you work? rooms 216.000 289.500 323.017 3.000 2467.000 48.000 24.108 3.951 104About what was the average percent occupancy rate last month?-‐Please slide the bar to the desired percentage level occupancy 71.000 68.470 19.510 20.000 100.000 47.000 2.578 -‐0.549 105
What is the star rating of the property you work / for?-‐Star Rating star 4.000 4.159 0.953 1.000 5.000 45.000 5.398 -‐1.438 107
191

Question VariableName N NA's N
How would you classify the property where you work? class 46 106
8
6
6
1
50
6
22
7
What one location type better describes the property where you work? location 43 109
3
52
4
29
7
14
What one category best describes the nature of the property where you work? cat 42 110
1
6
19
1
30
42
11
Please insert your email here / if you wish to participate in the Raffle to win one of two Amazon Kind... email 44 108
City Center
Class
All-‐Inclusive:
Conference Center:
Convention Hotel
Extended Stay Hotel
Full-‐Service Hotel
Limited-‐Service Hotel
Resort Hotel
Suite Hotel
Location
Airport
Deluxe
Highway
Resort
Rural/Non Resort
Suburban
Category
Budget
Economy
Midscale with food
Midscale w/o food
Upscale
Luxury
192

Welcome!!
Thank you for taking the time to complete our survey. You are invited to take part in a research study conducted by Dr. Aleda Roth and Enrico Secchi of Clemson University, in collaboration with Dr. Rohit Verma and the Center for Hospitality Research at Cornell University. The purpose of this research is to understand the implications of the ability of hotels' front-‐line employees to adapt to guests' needs in order to create engaging customer experiences. If you agree to participate in this study, we ask that you proceed and complete this online survey, which should take about 5 minutes. The survey will ask questions about the management of customer-‐contact employees and your service offering. We do not know of any risks or discomforts associated with participation in this research study. By participating in this study, you will be contributing to the understanding of hotel employees interactions with guests and with their employers, as well as better understanding your own decisions and behaviors in your everyday work life. By participating in this study, you will also be entered in a raffle to win one of an Apple iPad2 or one of two Amazon Kindle. You will be asked to enter your email address in a form at the end of the survey, if you wish to participate in the raffle.
Protection of Privacy and Confidentiality
We will take all the necessary steps to ensure your privacy and the confidentiality of your answers. Your identity will not be disclosed in any publication or communication resulting from this study. The research team will not be able to associate your identity with your responses and the analysis will be conducted aggregate form. Individual answers will not be published and the data will be destroyed after three years following the conclusion of the study. We wish to remind you that the participation in this study is voluntary and you may choose to stop at any time. You will not suffer any consequence if you decide not to be in the study or to stop taking part in the study.
Contact Information
If you have any questions or concerns about this study or if any problems arise, please contact Enrico Secchi ([email protected], Ph.D. Candidate) or Aleda Roth ([email protected], Burlinghton Industries Distinguished Professor of Supply Chain Management) at Clemson University. If you have any questions or concerns about your rights in this research study, please contact the Clemson University Office of Research Compliance (ORC) at 864-‐656-‐6460 or [email protected]. If you are outside of the Upstate South Carolina area, please use the ORC's toll-‐free number, 866-‐297-‐3071.
Appendix D Manager Survey
193

What is your job title?
What percentage of their time do your employees spend in contact with guests?
m 0% (1) m Between 1% and 20% (2) m Between 21% and 40% (3) m Between 41% and 60% (4) m Between 61% and 80% (5) m Between 81% and 100% (6)
If 0% Is Selected, Then Skip To Thank you for your willingness to par...
How much of your employees' interaction with guests follows standardized procedures?
m 0% (1) m Between 1% and 20% (2) m Between21% and 40% (3) m Between41% and 60% (4) m Between61% and 80% (5) m Between81% and 100% (6)
What was the average occupancy rate for the past 3 months in your property?
What was the average daily room rate for the past 3 months in your property?
194

When they are in contact with guests…
Strongly Disagree
(1)
Disagree (2)
Somewhat Disagree
(3)
Neither Agree nor
Disagree (4)
Somewhat Agree (5)
Agree (6)
Strongly Agree (7)
...most of the actions employees have to perform are outlined in formal
processes (1) m m m m m m m
...employees are not allowed to deviate from a predefined routine (2) m m m m m m m
...employees have detailed instructions for handling most
unusual situations (3) m m m m m m m
...employees often improvise in their interaction with guests (4) m m m m m m m
...employees frequently improvise responses to guests' needs (5)
m m m m m m m
Please indicate how much you agree with the following statements concerning the way you manage your employees
Strongly Disagree
(1)
Disagree (2)
Somewhat Disagree (3)
Neither Agree nor Disagree
(4)
Somewhat Agree (5)
Agree (6)
Strongly Agree (7)
I allow employees to do their work the way they
think best (1) m m m m m m m
I encourage initiative in my employees (2) m m m m m m m
I encourage employees to participate in important decisions concerning service delivery (3)
m m m m m m m
I reward personal initiative in the solution of guests’
problems (4) m m m m m m m
We assess employee performance based on
customer satisfaction data (5)
m m m m m m m
195

Please indicate how much you agree with the following statements referring to your hiring and training practicesCompared to competition...
Strongly Disagree (1)
Disagree (2)
Somewhat Disagree (3)
Neither Agree nor
Disagree (4)
Somewhat Agree (5)
Agree (6)
Strongly Agree (7)
...our hotel focuses on hiring employees with customer oriented
attitudes (1) m m m m m m m
...our hotel hires employees with high levels of prior experience (2) m m m m m m m
...our hotel hires employees with high levels of education (3)
m m m m m m m
...our hotel spends more money per employee on training (4) m m m m m m m
How much do you agree with the following statement concerning the world economy?
Strongly Disagree (1)
Disagree (2)
Somewhat Disagree (3)
Neither Agree nor Disagree
(4)
Somewhat Agree (5)
Agree (6)
Strongly Agree (7)
The current economic crisis will be over by the
end of 2012 (1) m m m m m m m
On average, about how many hours do you spend discussing service issues with your employees in a typical week?
m 0 hours (1) m 1 to 3 hours (2) m 4 to 6 hours (3) m 7 to 10 hours (4) m 11 to 13 hours (5) m 14 to 17 hours (6) m 18 to 20 hours (7) m More than 21 hours (8)
196

Please indicate how much you agree with the following statements concerning your service offering:
Strongly Disagree
(1)
Disagree (2)
Somewhat Disagree (3)
Neither Agree nor
Disagree (4)
Somewhat Agree (5)
Agree (6)
Strongly Agree (7)
We offer a personalized treatment to each guest (1) m m m m m m m
We provide a wide variety of accommodation options to our guests (2)
m m m m m m m
We change how our service is offered for each guest (3) m m m m m m m
Customer experience is at the center of our offering (4) m m m m m m m
We provide our guests with a feeling of genuine caring and authenticity (5)
m m m m m m m
We make a deliberate attempt emotionally engage our guests (6) m m m m m m m
Please indicate how much you agree with the following statements concerning your guests' behavior
Strongly Disagree
(1)
Disagree (2)
Somewhat Disagree
(3)
Neither Agree nor
Disagree (4)
Somewhat Agree (5)
Agree (6)
Strongly Agree (7)
It is difficult to predict how much effort our guests are going to put in helping staff
provide a satisfactory service (1) m m m m m m m
It is difficult to predict how many guests will require service at any given time (2) m m m m m m m
Guests vary widely in what they consider a satisfactory service experience (3) m m m m m m m
197

Please indicate how much you agree with the following statements concerning your guests’ satisfaction
Strongly Disagree
(1)
Disagree (2)
Somewhat Disagree
(3)
Neither Agree nor
Disagree (4)
Somewhat Agree (5)
Agree (6)
Strongly Agree (7)
Overall, guests are satisfied with our services (1) m m m m m m m
Our guests seem happy with our responsiveness to their problems (2)
m m m m m m m
Guests are likely to return to our establishment (3) m m m m m m m
Our hotel is profitable relative to our primary competitors, despite the economic
conditions (4) m m m m m m m
During their contact with the hotel's guests...
Strongly Disagree
(1)
Disagree (2)
Somewhat Disagree
(3)
Neither Agree nor
Disagree (4)
Somewhat Agree (5)
Agree (6)
Strongly Agree (7)
...our employees often have to figure out actions in the moment (1) m m m m m m m
...our employees are spontaneous in their interaction with guests (2) m m m m m m m
...our employees often have to respond in the moment to unexpected problems (3) m m m m m m m
...our employees deal with unanticipated events on the spot (4)
m m m m m m m
198

The employees in this hotel...
Strongly Disagree
(1)
Disagree (2)
Somewhat Disagree
(3)
Neither Agree nor
Disagree (4)
Somewhat Agree (5)
Agree (6)
Strongly Agree (7)
...often find new ways of working together to accommodate specific customers'
requests (1) m m m m m m m
...often deviate from standard routines to respond to customers` requests (2) m m m m m m m
...often try new approaches to solve guests' problems (3) m m m m m m m
...often have to be creative to satisfy customers' needs (4)
m m m m m m m
...often pull information from many different sources to respond to customers'
requests (5) m m m m m m m
...often make use of several other workers' expertise to satisfy guests (6) m m m m m m m
...often use extra discretionary resources in order to satisfy guests (7) m m m m m m m
If ...often find new ways of w... Is Displayed, Then Skip To Please provide a few more information...
199

Thank you for your willingness to participate in our study.At this point, we are looking for managers that are in charge of employees that have a significant amount of customer contact.We thank you for your willingness to complete our survey and we hope that you will be able to take part in our future research endeavors. However, we still ask you to answer a few questions for statistical purposes.
If Thank you for your willingn... Is Displayed, Then Skip To What is your age group?
Please provide a few more information to complete the survey. This information will only be used for statistical purposes.
What is your age group?
m Under 18 (1) m 18-‐24 (2) m 25-‐34 (3) m 35-‐44 (4) m 45-‐54 (5) m 50-‐55 (6) m 56-‐64 (7) m 65 or older (8)
What is the highest level of education you have completed?
m Some high school (1) m High school/GED (2) m Some college (3) m Associate's degree (4) m Trade or other technical school degree (5) m Bachelor's degree (6) m Master's degree (7) m Doctoral Degree (8)
200
How long have you been working in the hotel industry?
m Less than 1 year (1) m 2-‐3 years (2) m 4-‐6 years (3) m 7-‐10 years (4) m 11-‐15 years (5) m 16-‐25 years (6) m More than 25 years (7)
How long have you been working for your current employer?
m Less than 1 year (1) m 2-‐3 years (2) m 4-‐6 years (3) m 7-‐10 years (4) m 11-‐15 years (5) m 16-‐25 years (6) m More than 25 years (7)
How long have you been working as a manager?
m Less than 1 year (1) m 2-‐3 years (2) m 4-‐6 years (3) m 7-‐10 years (4) m 11-‐15 years (5) m 16-‐25 years (6) m More than 25 years (7)
201

How would you best classify the property where you work?
m Conference Center (1) m Resort Hotel (2) m Full-‐Service Hotel (3) m Limited-‐Service Hotel (4) m Suite Hotel (5) m Convention Hotel (6) m Extended Stay Hotel (7) m All-‐Inclusive (8) m NA / Don't Know (9)
What one location best describes the property where you work?
m Airport (1) m City Center (2) m Resort (3) m Suburban (4) m Highway (5) m Rural/Non-‐Resort (6) m Other (please specify) (7) ____________________
What one category best describes the nature of the property where you work?
m Deluxe (1) m Luxury (2) m Upscale (3) m Midscale with Food & Beverages Services (4) m Midscale without Food & Beverages Services (5) m Economy (6) m Budget (7) m Upper-‐Tier Extended Stay (8) m Lower-‐Tier Extended Stay (9) m Other (please specify) (10) ____________________ m NA / Don’t Know (11)
202
How Many guest rooms are available in the property you work in?
What is the star rating of the property where you work?
m 1 Star (1) m 2 Stars (2) m 3 Stars (3) m 4 Stars (4) m 5 Stars (5)
Answer If What percentage of their time do your employees spend in ... 0% Is Not Selected
Please insert your email here if you wish to participate in the Raffle to win one of two Amazon Kindle or an Apple iPad2.
Thank you for participating in our research. For any concern, problem or issue with any aspect of the research please do not hesitate to contact Enrico Secchi ([email protected].). The results of this study will be published in the Cornell Hospitality Reports and will be available on the Center for Hospitality Research website.Have a great day!
If Thank You! Thank you for ... Is Displayed, Then Skip To End of Survey
203

QuestionVariable Name N Median Mean StDev Min Max NA Kurtosis Skewness
ResponseID ID TextWhat is your job title? job TextWhat percentage of their time do your employees spend in contact with guests? contact 240 5 4.41 1.35 2 6 2 1.89 -‐0.36How much of your employees' interaction with guests follows standardized procedures? scripting 235 4 4.24 1.23 1 6 7 2.45 -‐0.37What was the average occupancy rate for the past 3 months in your property? noccupancy 234 0.7 0.69 0.15 0.16 1 8 3.40 -‐0.57What was the average daily room rate for the past 3 months in your property? nadr 220 149.44 194.48 151.56 34 952.9 22 12.11 2.7Calculated: Occupancy * ADR (converted to USD) revpar 219 105 134.46 112.05 12 809.96 23 14.73 2.93
Degree of Scripting DOS 241 4 4.05 1.23 1 6.67 1 2.66 -‐0.15When they are in contact with guests…
...most of the actions employees have to perform are outlined in formal processes dos1 242 5 4.94 1.48 1 7 0 3.01 -‐0.91
...employees are not allowed to deviate from a predefined routine dos2 241 3 3.05 1.53 1 7 1 2.54 0.69
...employees have detailed instructions for handling most unusual situations dos3 242 5 4.17 1.56 1 7 0 2.02 -‐0.21Improvisation (Direct Measures) IMPRO 241 5 5.08 1.25 2 7 1 2.89 -‐0.67
...employees often improvise in their interaction with guests impro1 242 5 5.18 1.30 2 7 0 3.30 -‐0.93
...employees frequently improvise responses to guests' needs impro2 241 5 4.98 1.43 1 7 1 2.59 -‐0.67Empowerment EMP 235 5.67 5.57 0.90 2 7 7 4.20 -‐0.83
I allow employees to do their work the way they think best emp1 235 5 4.67 1.55 1 7 7 2.39 -‐0.54I encourage initiative in my employees emp2 235 6 6.22 0.77 3 7 7 4.83 -‐1.06I encourage employees to participate in important decisions concerning service delivery emp3 235 6 5.84 1.07 1 7 7 6.73 -‐1.56
Experimental Culture (Incentive System) EC 234 6 5.72 0.95 1.5 7 8 4.75 -‐1.03I reward personal initiative in the solution of guests' problems ec1 234 6 6.00 0.95 2 7 8 5.36 -‐1.24We assess employee performance based on customer satisfaction data ec2 235 6 5.43 1.29 1 7 7 3.50 -‐0.83
Human Capital Management HCM 235 4.75 4.71 0.97 1.25 7 7 3.31 -‐0.51Compared to Competition…
...our hotel focuses on hiring employees with customer oriented attitudes hcm1 235 6 5.43 1.29 1 7 7 5.95 -‐1.53
...our hotel hires employees with high levels of prior experience hcm2 235 5 4.44 1.38 1 7 7 2.72 -‐0.43
...our hotel hires employees with high levels of education hcm3 235 4 3.94 1.37 1 7 7 4.49 -‐0.1
...our hotel spends more money per employee on training hcm4 235 4 4.48 1.65 1 7 7 2.08 -‐0.22
On average, about how many hours do you spend discussing service issues with your employees in a typical week? hmeetings 234 3 3.59 1.67 2 8 8 3.53 1.18
Appendix E Manager Survey Descriptives
204
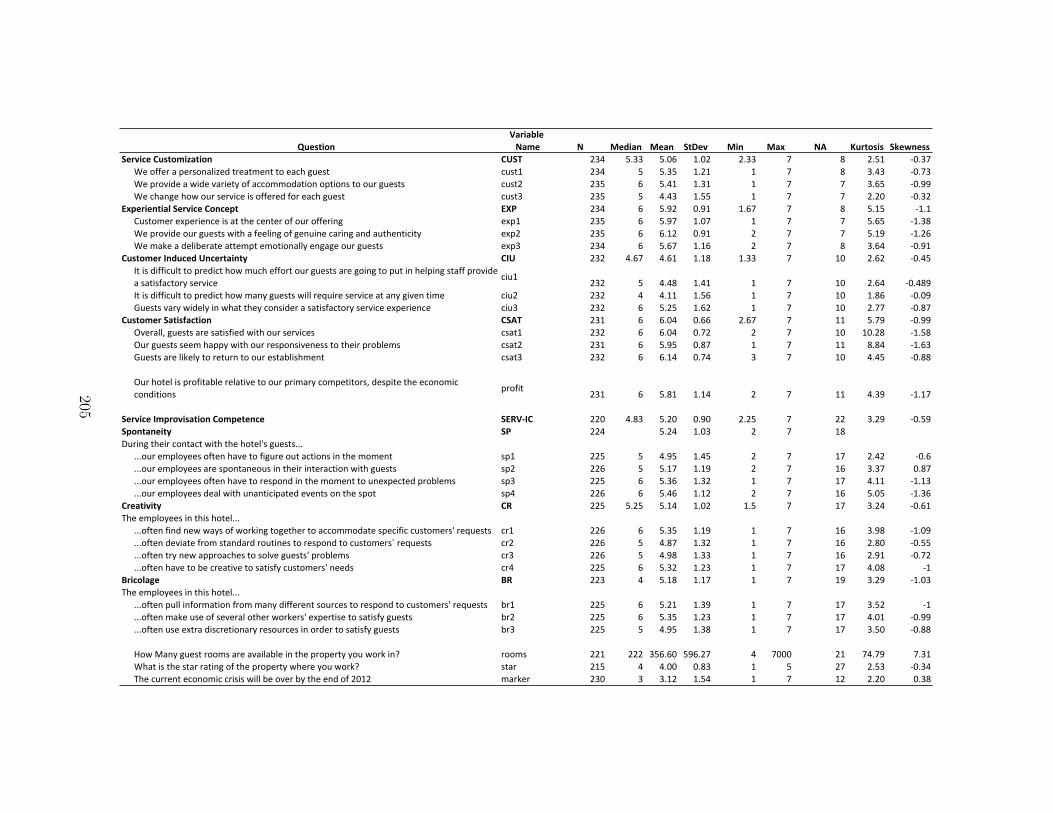
QuestionVariable Name N Median Mean StDev Min Max NA Kurtosis Skewness
Service Customization CUST 234 5.33 5.06 1.02 2.33 7 8 2.51 -‐0.37We offer a personalized treatment to each guest cust1 234 5 5.35 1.21 1 7 8 3.43 -‐0.73We provide a wide variety of accommodation options to our guests cust2 235 6 5.41 1.31 1 7 7 3.65 -‐0.99We change how our service is offered for each guest cust3 235 5 4.43 1.55 1 7 7 2.20 -‐0.32
Experiential Service Concept EXP 234 6 5.92 0.91 1.67 7 8 5.15 -‐1.1Customer experience is at the center of our offering exp1 235 6 5.97 1.07 1 7 7 5.65 -‐1.38We provide our guests with a feeling of genuine caring and authenticity exp2 235 6 6.12 0.91 2 7 7 5.19 -‐1.26We make a deliberate attempt emotionally engage our guests exp3 234 6 5.67 1.16 2 7 8 3.64 -‐0.91
Customer Induced Uncertainty CIU 232 4.67 4.61 1.18 1.33 7 10 2.62 -‐0.45It is difficult to predict how much effort our guests are going to put in helping staff provide a satisfactory service ciu1 232 5 4.48 1.41 1 7 10 2.64 -‐0.489It is difficult to predict how many guests will require service at any given time ciu2 232 4 4.11 1.56 1 7 10 1.86 -‐0.09Guests vary widely in what they consider a satisfactory service experience ciu3 232 6 5.25 1.62 1 7 10 2.77 -‐0.87
Customer Satisfaction CSAT 231 6 6.04 0.66 2.67 7 11 5.79 -‐0.99Overall, guests are satisfied with our services csat1 232 6 6.04 0.72 2 7 10 10.28 -‐1.58Our guests seem happy with our responsiveness to their problems csat2 231 6 5.95 0.87 1 7 11 8.84 -‐1.63Guests are likely to return to our establishment csat3 232 6 6.14 0.74 3 7 10 4.45 -‐0.88
Our hotel is profitable relative to our primary competitors, despite the economic conditions profit 231 6 5.81 1.14 2 7 11 4.39 -‐1.17
Service Improvisation Competence SERV-‐IC 220 4.83 5.20 0.90 2.25 7 22 3.29 -‐0.59Spontaneity SP 224 5.24 1.03 2 7 18During their contact with the hotel's guests...
...our employees often have to figure out actions in the moment sp1 225 5 4.95 1.45 2 7 17 2.42 -‐0.6
...our employees are spontaneous in their interaction with guests sp2 226 5 5.17 1.19 2 7 16 3.37 0.87
...our employees often have to respond in the moment to unexpected problems sp3 225 6 5.36 1.32 1 7 17 4.11 -‐1.13
...our employees deal with unanticipated events on the spot sp4 226 6 5.46 1.12 2 7 16 5.05 -‐1.36Creativity CR 225 5.25 5.14 1.02 1.5 7 17 3.24 -‐0.61The employees in this hotel...
...often find new ways of working together to accommodate specific customers' requests cr1 226 6 5.35 1.19 1 7 16 3.98 -‐1.09
...often deviate from standard routines to respond to customers` requests cr2 226 5 4.87 1.32 1 7 16 2.80 -‐0.55
...often try new approaches to solve guests' problems cr3 226 5 4.98 1.33 1 7 16 2.91 -‐0.72
...often have to be creative to satisfy customers' needs cr4 225 6 5.32 1.23 1 7 17 4.08 -‐1Bricolage BR 223 4 5.18 1.17 1 7 19 3.29 -‐1.03The employees in this hotel...
...often pull information from many different sources to respond to customers' requests br1 225 6 5.21 1.39 1 7 17 3.52 -‐1
...often make use of several other workers' expertise to satisfy guests br2 225 6 5.35 1.23 1 7 17 4.01 -‐0.99
...often use extra discretionary resources in order to satisfy guests br3 225 5 4.95 1.38 1 7 17 3.50 -‐0.88
How Many guest rooms are available in the property you work in? rooms 221 222 356.60 596.27 4 7000 21 74.79 7.31What is the star rating of the property where you work? star 215 4 4.00 0.83 1 5 27 2.53 -‐0.34The current economic crisis will be over by the end of 2012 marker 230 3 3.12 1.54 1 7 12 2.20 0.38
205

QuestionVariable Name
What is your age group? fage
What is the highest level of education you have / completed? feduc
How long have you been working in the hotel / industry? fexperind
How long have you / been working for your current employer? ftenure
How long have you / been working as a manager? fexpermgt
How would you best classify the property where you work? fclass
What one location best describes the property where you work? flocation
What one category best describes the nature of the property where you work? fcategory
21 Missing 2 "Budget"29 "Deluxe" 6 "Economy" 1 "Lower-‐Tier Extended Stay"59 "Luxury" 5 "Midscale w/o F&B"44 "Midscale with F&B" 6 "Other"
Frequencies
13 "Associate's Degree"94 "Bachelor's Degree" 5 "Doctoral Degree" 3 "High School/GED"67 "Master's Degree"19 "Some College" 2 "Some High School"21 "Trade or Technical School Degree"
17 Missing 5 "18-‐24"39 "25-‐34"72 "35-‐44"45 "45-‐54"35 "50-‐55"24 "56-‐65" 5 "65 or Older"
19 Missing38 "11-‐15 Years"69 "16-‐25 Years" 9 "2-‐3 Years"17 "4-‐6 Years"33 "7-‐10 Years" 4 "Less than 1 year"53 "More than 25 Years"
19 Missing32 "11-‐15 Years"14 "16-‐25 Years"47 "2-‐3 Years"60 "4-‐6 Years"27 "7-‐10 Years"31 "Less than 1 year"12 "More than 25 Years"17 Missing47 "11-‐15 Years"47 "16-‐25 Years"14 "2-‐3 Years"29 "4-‐6 Years"44 "7-‐10 Years" 7 "Less than 1 year"37 "More than 25 Years"
18 Missing 7 "/Don't Know" 8 "All-‐Inclusive" 8 "Conference Center" 9 "Convention Hotel" 2 "Extended Stay Hotel"115 "Full-‐Service Hotel" 15 "Limiter-‐Service Hotel" 52 "Resort Hotel"
18 Missing 8 "Airport"102 "City Center" 8 "Highway" 20 "Other" 56 "Resort" 9 "Rural/Non-‐Resort"21 "Suburban"
206
Bibliography
Ahearne, M., J. Mathieu, A. Rapp. 2005. To empower or not to empower yoursales force? An empirical examination of the influence of leadership empowermentbehavior on customer satisfaction and performance. Journal of Applied Psychology90(5) 945–955.
Aiken, L. S., S. G. West, R. R. Reno. 1991. Multiple regression: Testing and inter-preting interactions . Sage Publications, Inc.
Akgun, A. E., J. C. Byrne, G. S. Lynn, H. Keskin. 2007. New product development inturbulent environments: Impact of improvisation and unlearning on new productperformance. Journal of Engineering and Technology Management 24(3) 203–230.
Allison, P. D. 2003. Missing data techniques for structural equation modeling. Journalof Abnormal Psychology 112(4) 545–557.
Amabile, T. M. 1983. The social psychology of creativity: A componential conceptu-alization. Journal of Personality and Social Psychology 45(2) 357–376.
Anderson, J. C., D. W. Gerbing. 1988. Structural equation modeling in practice: Areview and recommended two-step approach. Psychological Bulletin 103(3) 411–423.
Anderson, J. C., M. Rungtusanatham, R. G. Schroeder, S. Devaraj. 1995. A path ana-lytic model of a theory of quality management underlying the deming managementmethod: Preliminary empirical findings. Decision Sciences 26(5) 637–658.
Anderson, T. W. 1984. An introduction to multivariate statistical analysis . WileyNew York.
Angrist, J. D., G. W. Imbens, D. B. Rubin. 1996. Identification of causal effects usinginstrumental variables. Journal of the American Statistical Association 91(434)444–455.
Angrist, J. D., J. S. Pischke. 2009. Mostly harmless econometrics: An empiricist’scompanion. Princeton Univ Press.
207

Apte, A., U. M. Apte, N. Venugopal. 2007. Focusing on customer time in field service:A normative approach. Production and Operations Management 16(2) 189–202.
Argote, L. 1982. Input uncertainty and organizational coordination in hospital emer-gency units. Administrative Science Quarterly 27(3) 420–434.
Armstrong, J. S., T. S. Overton. 1977. Estimating nonresponse bias in mail surveys.Journal of Marketing Research 14(3) 396–402.
Arora, V., K. Ward, S. Petter. 2010. The role of information systems to supportimprovisation during emergencies. MWAIS 2010 Proceedings Paper 11.
Ashby, W. R. 1956. An introduction to cybernetics . Chapman & Hall London.
Ashby, W. R. 1958. Requisite variety and its implications for the control of complexsystems. Cybernetica 1(2) 1–17.
Ashforth, B. E., R. H. Humphrey. 1993. Emotional labor in service roles: The influ-ence of identity. Academy of Management Review 18(1) 88–115.
Bacon, T. R., D. G. Pugh. 2004. Ritz-Carlton and EMC: The gold standards inoperational behavioral differentiation. Journal of Organizational Excellence 23(2)61–76.
Bagozzi, R. P. 2007. On the meaning of formative measurement and how it differsfrom reflective measurement: Comment on Howell, Breivik, and Wilcox (2007).Psychological Methods 12(2) 229–237.
Baker, T., A. S. Miner, D. T. Eesley. 2003. Improvising firms: Bricolage, accountgiving and improvisational competencies in the founding process. Research Policy32(2) 255–276.
Baker, T., R. E. Nelson. 2005. Creating something from nothing: Resource construc-tion through entrepreneurial bricolage. Administrative Science Quarterly 50(3)329–366.
Bansler, J., E. Havn. 2003. Improvisation in action: Making sense of IS developmentin organizations. Proceedings of the International Workshop on Action in Language,Organisations and Information Systems (ALOIS 2003). 51–63.
Barney, J. 1991. Firm resources and sustained competitive advantage. Journal ofManagement 17(1) 99–120.
Baron, R. M., D. A. Kenny. 1986. The moderator–mediator variable distinction insocial psychological research: Conceptual, strategic, and statistical considerations.Journal of Personality and Social Psychology 51(6) 1173–1182.
208

Barrett, F. J. 1998. Coda: Creativity and improvisation in jazz and organizations:Implications for organizational learning. Organization Science 9(5) 605–622.
Barrett, F. J., K. Peplowski. 1998. Minimal structures within a song: An analysis of“all of me”. Organization Science 9(5) 558–560.
Batt, R. 2002. Managing customer services: Human resource practices, quit rates,and sales growth. Academy of Management Journal 45(3) 587–597.
Baum, C. F. 2006. An introduction to modern econometrics using Stata. Stata Corp.
Baum, C. F., M. E. Schaffer, S. Stillman. 2007. Enhanced routines for instrumentalvariables/gmm estimation and testing. Boston College Economics Working PaperNo. 667 .
Bentler, P. M. 1990. Comparative fit indexes in structural models. Psychologicalbulletin 107(2) 238–246.
Berliner, P. F. 1994. Thinking in jazz: The infinite art of improvisation. ChicagoStudies in Ethnomusicology, University of Chicago Press.
Berry, L. L. 1980. Services marketing is different. Business week 30(3) 24–39.
Bitner, M. J. 1990. Evaluating service encounters: The effects of physical surroundingsand employee responses. The Journal of Marketing 54(2) 69–82.
Bitner, M. J. 1992. Servicescapes: The impact of physical surroundings on customersand employees. The Journal of Marketing 56(2) 57–71.
Bitner, M. J., B. H. Booms, M. S. Tetreault. 1990. The service encounter: Diagnosingfavorable and unfavorable incidents. The Journal of Marketing 54(1) 71–84.
Bitner, M. J., S. W. Brown, M. L. Meuter. 2000. Technology infusion in serviceencounters. Journal of the Academy of Marketing Science 28(1) 138–149.
Bitner, M. J., W. T. Faranda, A. R. Hubbert, V. A. Zeithaml. 1997. Customercontributions and roles in service delivery. International Journal of Service IndustryManagement 8(3) 193–205.
Bitran, G., M. Lojo. 1993. A framework for analyzing the quality of the customerinterface. European Management Journal 11(4) 385–385.
Block, J. 1961. The Q-sort method in personality assessment and psychiatric research.Thomas Springfield, IL.
209

Bound, J., D. A. Jaeger, R. M. Baker. 1995. Problems with instrumental variablesestimation when the correlation between the instruments and the endogeneous ex-planatory variable is weak. Journal of the American Statistical Association 90(430)443–450.
Bowen, D. E., E. E. Lawler. 1992. The empowerment of service workers: What, why,how, and when. Sloan Management Review 33(3) 31–39.
Boyer, K. K. 1998. Longitudinal linkages between intended and realized operationsstrategies. International Journal of Operations and Production Management 18(4)356–373.
Brown, J. S., P. Duguid. 1991. Organizational learning and communities-of-practice:Toward a unified view of working, learning and innovation. Organization Science2(1) 40–57.
Brown, J. S., P. Duguid. 2001. Knowledge and organization: A social-practice per-spective. Organization Science 12(2) 198–213.
Brown, S. L., K. M. Eisenhardt. 1997. The art of continuous change: Linking com-plexity theory and time-paced evolution in relentlessly shifting organizations. Ad-ministrative Science Quarterly 42(1) 1–34.
Brown, S. L., K. M. Eisenhardt. 1998. Competing on the edge: Strategy as structuredchaos . Harvard Business Press.
Cameron, A. C., P. K. Trivedi. 2009. Microeconometrics using stata. Stata Press,Texas.
Carman, J. M. 1990. Consumer perceptions of service quality: An assessment of theservqual dimensions. Journal of Retailing 66(1) 33–55.
Chase, R. B. 1978. Where does the customer fit in a service operation? HarvardBusiness Review 56(6) 137–142.
Chase, R. B. 1981. The customer contact approach to services: Theoretical bases andpractical extensions. Operations research 29(4) 698–706.
Chase, R. B., S. Dasu. 2001. Want to perfect your company’s service? Use behavioralscience. Harvard Business Review 79(6) 78–84.
Chase, R. B., G. B. Northcraft, G. Wolf. 1984. Designing high-contact service systems:Application to branches of a savings and loan. Decision Sciences 15(4) 542–556.
Chase, R. B., D. A. Tansik. 1983. The customer contact model for organizationdesign. Management Science 29(9) 1037–1050.
210

Churchill Jr, G. A. 1979. A paradigm for developing better measures of marketingconstructs. Journal of Marketing Research 16(1) 64–73.
Churchill Jr, G. A., C. Surprenant. 1982. An investigation into the determinants ofcustomer satisfaction. Journal of Marketing Research 19(4) 491–504.
Ciborra, C. U. 1999. Notes on improvisation and time in organizations. Accounting,Management and Information Technologies 9(2) 77–94.
Cohen, J., P. Cohen, S. G. West, L. S. Aiken. 2003. Applied multiple regres-sion/correlation analysis for the behavioral sciences.. Third edition ed. LawrenceErlbaum Associates.
Cohen, M. D., J. G. March, J. P. Olsen. 1972. A garbage can model of organizationalchoice. Administrative Science Quarterly 17(1) 1–25.
Cohen, W. M., D. A. Levinthal. 1990. Absorptive capacity: A new perspective onlearning and innovation. Administrative Science Quarterly 35(1) 128–152.
Conger, J. A., R. N. Kanungo. 1988. The empowerment process: Integrating theoryand practice. Academy of Management Review 13(3) 471–482.
Cook, J. D., S. J. Hepworth, T. D. Wall, P. B. Warr. 1981. The experience of work .Academic Press.
Cook, L. S., D. E. Bowen, R. B. Chase, S. Dasu, D. M. Stewart, D. A. Tansik. 2002.Human issues in service design. Journal of Operations Management 20(2) 159–174.
Crossan, M. M. 1998. Improvisation in action. Organization Science 9(5) 593–599.
Crossan, M. M., M. P. e Cunha, D. Vera, J. Cunha. 2005. Time and organizationalimprovisation. Academy of Management Review 30(1) 129–145.
Crossan, M. M., D. K. Hurst. 2006. Strategic renewal as improvisation: Reconcilingthe tension between exploration and exploitation. Advances in Strategic Manage-ment 23, 273–298.
Crossan, M. M., H. W. Lane, R.E . White, L. Klus. 1996. The improvising organiza-tion: Where planning meets opportunity. Organizational Dynamics 24(4) 20–35.
Crossan, M. M., M. Sorrenti. 2002. Making sense of improvisation. K. N. Kamoche,M. P. Cunha, J. V. Cunha, eds., Organizational Improvisation. London: Routledge,29–51.
Cunha, J. V., K. N. Kamoche, M. P. e Cunha. 2002. Once again: What, when, howand why: A prospectus for research in organizational improvisation. K. Kamoche,M. P. Cunha, J. V. Cunha, eds., Organizational Improvisation. Routledge, 296–308.
211
Daly, A., S. J. Grove, M. J. Dorsch, R. P. Fisk. 2009. The impact of improvisationtraining on service employees in a european airline: A case study. European Journalof Marketing 43(3/4) 459–472.
Dempster, A. P., N. M. Laird, D. B. Rubin. 1977. Maximum likelihood from incom-plete data via the em algorithm. Journal of the Royal Statistical Society. Series B(Methodological) 39(1) 1–38.
Diamantopoulos, A., J. A. Siguaw. 2006. Formative versus reflective indicators inorganizational measure development: A comparison and empirical illustration.British Journal of Management 17(4) 263–282.
Dickson, D., R. C. Ford, B. Laval. 2005. Managing real and virtual waits in hospitalityand service organizations. Cornell Hotel and Restaurant Administration Quarterly46(1) 52–68.
Dillman, D. A. 2007. Mail and Internet surveys: The tailored design method. 2007update. Hoboken. NJ: John Wiley & Sons.
Doty, D. H., W. H. Glick. 1998. Common methods bias: Does common methodsvariance really bias results. Organizational Research Methods 1(4) 374–406.
Dwyer, D. J., D. C. Ganster. 1991. The effects of job demands and control on employeeattendance and satisfaction. Journal of Organizational Behavior 12(7) 595–608.
e Cunha, M. P., J. V. Cunha, K. N. Kamoche. 1999. Organizational improvisation:What, when, how and why. International Journal of Management Reviews 1(3)299–341.
e Cunha, M. P., A. Rego, K. N. Kamoche. 2009. Improvisation in service recovery.Managing Service Quality 19(6) 657–669.
Edvardsson, B., L. Haglund, J. Mattsson. 1995. Analysis, planning, improvisationand control in the development of new services. International Journal of ServiceIndustry Management 6(2) 24–35.
Edwards, J. R., R. P. Bagozzi. 2000. On the nature and direction of relationshipsbetween constructs and measures. Psychological Methods 5(2) 155–174.
Efron, B., R. Tibshirani. 1993. An introduction to the bootstrap. Chapman &Hall/CRC.
Eisenberg, E. M. 1990. Jamming: Trascendence through organizing. CommunicationResearch 17(2) 139–164.
212

Eisenhardt, K., B. N. Tabrizi. 1995. Accelerating adaptive processes: Product in-novation in the global computer industry. Administrative Science Quarterly 40(1)84–110.
Fidell, L. S., B. G. Tabachnick. 2006. Using multivariate statistics . 5th ed. Allyn &Bacon.
Fitzsimmons, J. A., M. J. Fitzsimmons. 2008. Service management: Operations,Strategy, Information Technology . McGraw-Hill.
Fornell, C., F. L. Bookstein. 1982. Two structural equation models: Lisrel and plsapplied to consumer exit-voice theory. Journal of Marketing research 19(4) 440–452.
Fornell, C., D. F. Larcker. 1981. Evaluating structural equation models with unob-servable variables and measurement error. Journal of Marketing Research 18(1)39–50.
Fornell, C., B. Wernerfelt. 1987. Defensive marketing strategy by customer complaintmanagement: a theoretical analysis. Journal of Marketing Research 24(4) 337–346.
Fredendall, L. D., D. Ojha, J. Wayne Patterson. 2010. Concerning the theory ofworkload control. European Journal of Operational Research 201(1) 99–111.
Frei, F. X. 2006. Breaking the trade–off between efficiency and service. HarvardBusiness Review 84(11) 92–101.
Frei, F. X., R. Kalakota, A. J. Leone, L. M. Marx. 1999. Process variation as a deter-minant of bank performance: Evidence from the retail banking study. ManagementScience 45(9) 1210–1220.
Froehle, C. M. 2006. Service personnel, technology, and their interaction in influencingcustomer satisfaction. Decision Sciences 37(1) 5–38.
Froehle, C. M., A. V. Roth. 2004. New measurement scales for evaluating perceptionsof the technology-mediated customer service experience. Journal of OperationsManagement 22(1) 1–21.
Garvin, D. A. 1984. What does product quality really mean. Sloan ManagementReview 26(1) 25–43.
George, J. M., A. P. Brief. 1992. Feeling good–doing good: A conceptual analysis ofthe mood at work-organizational spontaneity relationship. Psychological Bulletin112(2) 310–329.
213

Gerbing, D. W., J. C. Anderson. 1988. An updated paradigm for scale developmentincorporating unidimensionality and its assessment. Journal of Marketing Research25(2) 186–192.
Gilmore, J. H., B. J. Pine. 2007. Authenticity: What consumers really want . HarvardBusiness School Press, Boston, MA.
Gioia, D. A., P. P. Poole. 1984. Scripts in organizational behavior. Academy ofManagement Review 9(3) 449–459.
Goldstein, S. M. 2003. Employee development: An examination of service strategy ina high-contact service environment. Production and Operations Management 12(2)186–203.
Goldstein, S. M., R. Johnston, J. A. Duffy, J. Rao. 2002. The service concept: Themissing link in service design research? Journal of Operations Management 20(2)121–134.
Greene, W. H., C. Zhang. 2003. Econometric analysis . 5th ed. Prentice hall UpperSaddle River, NJ.
Grove, S. J., R. P. Fisk. 1983. The dramaturgy of services exchange: An analyticalframework for services marketing. Emerging perspectives in services marketing 45–49.
Grove, S. J., R. P. Fisk. 1992. The service experience as theater. Advances inConsumer Research 19(1) 455–461.
Gustafsson, A., M. D. Johnson, I. Roos. 2005. The effects of customer satisfaction,relationship commitment dimensions, and triggers on customer retention. Journalof Marketing 69(4) 210–218.
Hall, A. R., G. D. Rudebusch, D. W. Wilcox. 1996. Judging instrument relevance ininstrumental variables estimation. International Economic Review 37(2) 283–298.
Harris, R., K. Harris, S. Baron. 2003. Theatrical service experiences: Dramatic scriptdevelopment with employees. International Journal of Service Industry Manage-ment 14(2) 184–199.
Hartline, M. D., O. C. Ferrell. 1996. The management of customer-contact serviceemployees: An empirical investigation. The Journal of Marketing 60(4) 52–70.
Harvey, J., L. A. Lefebvre, E. Lefebvre. 1997. Flexibility and technology in services: Aconceptual model. International Journal of Operations & Production Management17(1) 29–45.
214

Hatch, M. J. 1997. Commentary: Jazzing up the theory of organizational improvisa-tion. Advances in strategic management 14, 181–192.
Hausman, J. A. 1978. Specification tests in econometrics. Econometrica: Journal ofthe Econometric Society 46(6) 1251–1271.
Hayes, A. F. 2009. Beyond Baron and Kenny: Statistical mediation analysis in thenew millennium. Communication Monographs 76(4) 408–420.
Hayes, D. K., J. D. Ninemeier. 2007. Hotel operations management . Pearson/PrenticeHall.
Hemp, P. 2002. My week at the ritz as a room-service waiter. Harvard BusinessReview 80(6) 50–59.
Heskett, J. L. 1983. Shouldice Hospital Limited. Harvard Business School Case 9–683.
Heskett, J. L. 2003. Southwest Airlines 2002: An industry under siege. HarvardBusines School Case 9–803–133.
Heskett, J. L., T. O. Jones, G. W. Loveman, W. E. Sasser, L. A. Schlesinger. 1994.Putting the service-profit chain to work. Harvard Business Review 72(2) 164–174.
Heskett, J. L., W. E. Sasser Jr. 2010. Southwest Airlines: In a different world. HarvardBusiness School Case 9–910–419.
Hill, A. V., D. A. Collier, C. M. Froehle, J. C. Goodale, R. D. Metters, R. Verma.2002. Research opportunities in service process design. Journal of OperationsManagement 20(2) 189–202.
Honaker, J., G. King. 2010. What to do about missing values in time-series cross-section data. American Journal of Political Science 54(2) 561–581.
Honaker, J., G. King, M. Blackwell. 2011. Amelia II: A program for missing data.Journal of Statistical Software 45(7) 1–47.
Hu, H., C. R. Jasper. 2006. Social cues in the store environment and their impacton store image. International Journal of Retail & Distribution Management 34(1)25–48.
Hu, L., P. M. Bentler. 1998. Fit indices in covariance structure modeling: Sensitivityto underparameterized model misspecification. Psychological Methods 3(4) 424–453.
Hu, L., P. M. Bentler. 1999. Cutoff criteria for fit indexes in covariance structure anal-ysis: Conventional criteria versus new alternatives. Structural Equation Modeling:A Multidisciplinary Journal 6(1) 1–55.
215

Huete, L. M., A. V. Roth. 1988. The industrialization and span of retail banks’delivery systems. International Journal of Operations and Production Management8(3) 46–66.
Iravani, S. M., M. P. Van Oyen, K. T. Sims. 2005. Structural flexibility: A newperspective on the design of manufacturing and service operations. ManagementScience 51(2) 151–166.
Jaccard, J., R. Turrisi. 2003. Interaction effects in multiple regression. 2nd ed. No.07-072 in Sage University Papers Series on Quantitative Applications in the SocialSciences, Thousand Oaks, CA: Sage.
John, J., S. J. Grove, R. P. Fisk. 2006. Improvisation in service performances: Lessonsfrom jazz. Managing Service Quality 16(3) 247–268.
Kamoche, K. N., M. P. e Cunha. 2001. Minimal structures: From jazz improvisationto product innovation. Organization Studies 22(5) 733–764.
Kamoche, K. N., M. P. e Cunha, J. V. Cunha. 2003. Towards a theory of organiza-tional improvisation: Looking beyond the jazz metaphor. Journal of ManagementStudies 40(8) 2023–2051.
Kamoche, K. N., M. P. e Cunha, J. V. Da Cunha, eds. 2002. Organizational Impro-visation. Routledge.
Karasek Jr, R. A. 1979. Job demands, job decision latitude, and mental strain:Implications for job redesign. Administrative Science Quarterly 24(2) 285–308.
Kellogg, D. L., R. B. Chase. 1995. Constructing an empirically derived measure forcustomer contact. Management Science 41(11) 1734–1749.
Kernfeld, B. 1997. What to Listen for in Jazz . Yale Univ Pr.
King, G., J. Honaker, A. Joseph, K. Scheve. 2001. Analyzing incomplete politicalscience data: An alternative algorithm for multiple imputation. American PoliticalScience Review 95(1) 49–70.
Lado, A. A., M. C. Wilson. 1994. Human resource systems and sustained competitiveadvantage: A competency-based perspective. Academy of Management Review19(4) 699–727.
Lages, C. R., N. F. Piercy. 2012. Key drivers of frontline employee generation of ideasfor customer service improvement. Journal of Service Research 15(2) 215–230.
Levi-Strauss, C. 1968. The savage mind . University of Chicago Press.
216

Levitt, T. 1972. Production-line approach to service. Harvard Business Review 50(5)41–52.
Levitt, T. 1976. The industrialization of service. Harvard Business Review 54(5)63–74.
Lewin, A. Y. 1998. Jazz improvisation as a metaphor for organization theory. Orga-nization Science 9(5) 539–539.
Leybourne, S. A. 2009. Culture and organizational improvisation in uk financialservices. Journal of Service Science and Management 2(9) 237–254.
Liljander, V., T. Strandvik. 1997. Emotions in service satisfaction. InternationalJournal of Service Industry Management 8(2) 148–169.
Lindell, M. K., D. J. Whitney. 2001. Accounting for common method variance incross-sectional research designs. Journal of Applied Psychology 86(1) 114–121.
Little, T. D., U. Lindenberger, J. R. Nesselroade. 1999. On selecting indicatorsfor multivariate measurement and modeling with latent variables: When “good”indicators are bad and “bad” indicators are good. Psychological Methods 4(2)192–211.
Magni, M., L. Proserpio, M. Hoegl, B. Provera. 2009. The role of team behavioralintegration and cohesion in shaping individual improvisation. Research Policy 38(6)1044–1053.
Malhotra, M. K., V. Grover. 1998. An assessment of survey research in POM: Fromconstructs to theory. Journal of Operations Management 16(4) 407–425.
Malhotra, M. K., L. P. Ritzman. 1994. Scheduling flexibility in the service sector: Apostal case study. Production and Operations Management 3(2) 100–117.
Malhotra, N. K., S. S. Kim, A. Patil. 2006. Common method variance in is research: Acomparison of alternative approaches and a reanalysis of past research. ManagementScience 52(12) 1865–1883.
March, J. G. 1991. Exploration and exploitation in organizational learning. Organi-zation Science 2(1) 71–87.
March, J. G., H. A. Simon. 1958. Organizations . John Wiley & Sons Inc.
Marsh, H. W., Z. Wen, K. T. Hau. 2004. Structural equation models of latent inter-actions: Evaluation of alternative estimation strategies and indicator construction.Psychological Methods 9(3) 275–300.
217

McCarthy, I. P., L. Pitt, P. Berthon. 2011. Service customization through dramaturgy.F. S. Fogliatto, G. J. C. da Silveira, eds., Mass Customization: Engineering andManaging Global Operations . Springer, 45–65.
Menor, L. J., A. V. Roth. 2007. New service development competence in retail bank-ing: Construct development and measurement validation. Journal of OperationsManagement 25(4) 825–846.
Menor, L. J., A. V. Roth. 2008a. New service development competence and perfor-mance: An empirical investigation in retail banking. Production and OperationsManagement 17(3) 267–284.
Menor, L. J., A. V. Roth. 2008b. What is a good measurement scale? Tutorial onnew item and scale development in om research. Ivey Business School - Universityof Western Ontario and College of Business and Behavioral Science - ClemsonUniversity Working Paper .
Menor, L. J., A. V. Roth, C. H. Mason. 2001. Agility in retail banking: A numer-ical taxonomy of strategic service groups. Manufacturing & Service OperationsManagement 3(4) 273–292.
Miller, J. L., C. W. Craighead, K. R. Karwan. 2000. Service recovery: A frameworkand empirical investigation. Journal of Operations Management 18(4) 387–400.
Miner, A. S., P. Bassoff, C. Moorman. 2001. Organizational improvisation and learn-ing: A field study. Administrative Science Quarterly 46(2) 304–337.
Mintzberg, H. 1978. Patterns in strategy formation. Management Science 24(9)934–948.
Mintzberg, H. 1994. The fall and rise of strategic planning. Harvard Business Review72(1) 107–107.
Moorman, C., A. S. Miner. 1998a. The convergence of planning and execution: Im-provisation in new product development. The Journal of Marketing 62(3) 1–20.
Moorman, C., A. S. Miner. 1998b. Organizational improvisation and organizationalmemory. Academy of Management Review 23(4) 698–723.
Morgan, M., P. Watson, N. Hemmington. 2008. Drama in the dining room: Theatricalperspectives on the foodservice encounter. Journal of Foodservice 19(2) 111–118.
Nunnally, J. C., I. H. Bernstein. 1994. Psychometric Theory . McGraw-Hill, NewYork.
Oldham, G. R., A. Cummings. 1996. Employee creativity: Personal and contextualfactors at work. Academy of Management Journal 39(3) 607–634.
218

Orlikowski, W. J. 1996. Improvising organizational transformation over time: Asituated change perspective. Information systems research 7(1) 63–92.
Orlikowski, W. J., J. D. Hofman. 1997. An improvisational model for change man-agement: the case of groupware technologies. Sloan Management Review 38(1)11–22.
Palmer, A. 2010. Customer experience management: A critical review of an emergingidea. Journal of Services Marketing 24(3) 196–208.
Parasuraman, A., L. L. Berry, V. Zeithaml. 1991. Refinement and assessment of theservqual scale. Journal of Retailing 67(4) 420–49.
Parasuraman, A., V. A. Zeithaml, L. L. Berry. 1988. Servqual: A multiple-item scalefor measuring consumer perceptions of service quality. Journal of Retailing 64(1)12–40.
Parker, C., P. Ward. 2000. An analysis of role adoptions and scripts during customer-to-customer encounters. European Journal of Marketing 34(3/4) 341–359.
Peplowski, K. 1998. The process of improvisation. Organization Science 9(5) 560–561.
Pine, B. J., J. H. Gilmore. 1999. The Experience Economy: Work is Theatre & EveryBusiness a Stage. Harvard Business School Press.
Podsakoff, P. M., S. B. MacKenzie, J. Y. Lee, N. P. Podsakoff. 2003. Common methodbiases in behavioral research: A critical review of the literature and recommendedremedies. Journal of Applied Psychology 88(5) 879–903.
Podsakoff, P. M., D. W. Organ. 1986. Self–reports in organizational research: Prob-lems and prospects. Journal of Management 12(4) 531–544.
Preacher, K. J., D. D. Rucker, A. F. Hayes. 2007. Addressing moderated mediationhypotheses: Theory, methods, and prescriptions. Multivariate Behavioral Research42(1) 185–227.
Price, L. L., E. J. Arnould, S. L. Deibler. 1995. Consumers’ emotional responses toservice encounters: the influence of the service provider. International Journal ofService Industry Management 6(3) 34–63.
Pugh, S. D. 2001. Service with a smile: Emotional contagion in the service encounter.Academy of Management Journal 44(5) 1018–1027.
Pullman, M. E., M. A. Gross. 2004. Ability of experience design elements to elicitemotions and loyalty behaviors. Decision Sciences 35(3) 551–578.
219

Randolph, W. A. 1995. Navigating the journey to empowerment. Organizationaldynamics 23(4) 19–32.
Rosenzweig, E. D., A. V. Roth. 2007. B2b seller competence: Construct develop-ment and measurement using a supply chain strategy lens. Journal of OperationsManagement 25(6) 1311–1331.
Roth, A. V. 1993. Performance dimensions in services: An empirical investigation ofstrategic performance. Advances in Services Marketing and Management 2, 1–47.
Roth, A. V. 1996. Achieving strategic agility through economies of knowledge. Strat-egy and Leadership 24(2) 30–37.
Roth, A. V., R. B. Chase, C. Voss. 1997. Service in the US . Severn Trend Plc,London, UK.
Roth, A. V., W. E. Jackson III. 1995. Strategic determinants of service quality andperformance: Evidence from the banking industry. Management Science 41(11)1720–1733.
Roth, A. V., S. P. Johnson, N. M. Short. 1996. Managing technology in health care.E. Geisler, O. Heller, eds., Strategic deployment of technology in hospitals: evidenceof reengineering . Kluwer Academic Pub, 189–214.
Roth, A. V., A. S. Marucheck. 1994. Innovations that work for learning organizations.Planning Review 22(3) 33.
Roth, A. V., L. J. Menor. 2003a. Designing and managing service operations: In-troduction to the special issue. Production and Operations Management 12(2)141–144.
Roth, A. V., L. J. Menor. 2003b. Insights into service operations management: Aresearch agenda. Production and Operations Management 12(2) 145–164.
Roth, A. V., R. G. Schroeder, X. Huang, M. Kristal. 2008. Handbook of Metrics forResearch in Operations Management: Multi-item Measurement Scales and Objec-tive Items . Sage Publications Inc.
Roth, A. V., M. van der Velde. 1989. Investing in retail delivery system technology.Journal of Retail Banking 11(2) 23–34.
Roth, A. V., M. van der Velde. 1991a. Operations as marketing: A competitive servicestrategy. Journal of Operations Management 10(3) 303–328.
Roth, A. V., M. van der Velde. 1991b. The retail technology advantage. BankManagement 14–19.
220

Rucker, D. D., K. J. Preacher, Z. L. Tormala, R. E. Petty. 2011. Mediation analysisin social psychology: Current practices and new recommendations. Social andPersonality Psychology Compass 5(6) 359–371.
Rungtusanatham, M., C. Forza, B. R. Koka, F. Salvador, W. Nie. 2005. TQM acrossmultiple countries: convergence hypothesis versus national specificity arguments.Journal of Operations Management 23(1) 43–63.
Sakakibara, S., B. B. Flynn, R. G. Schroeder. 1993. A framework and measurementinstrument for just-in-time manufacturing. Production and Operations Manage-ment 2(3) 177–194.
Schafer, J. L., J. W. Graham. 2002. Missing data: Our view of the state of the art.Psychological Methods 7(2) 147–177.
Schau, H. J., S. Dellande, M. C. Gilly. 2007. The impact of code switching on serviceencounters. Journal of Retailing 83(1) 65–78.
Schlesinger, L. A., J. Zornitsky. 1991. Job satisfaction, service capability, and cus-tomer satisfaction: An examination of linkages and management implications. Hu-man Resource Planning 14(2) 141–149.
Schmenner, R. W. 1986. How can service businesses survive and prosper? SloanManagement Review 27(3) 21–32.
Schneider, B., D. E. Bowen. 1993. The service organization: Human resources man-agement is crucial. Organizational Dynamics 21(4) 39–52.
Schneider, B., D. E. Bowen. 1999. Understanding customer delight and outrage. SloanManagement Review 41(1) 35–45.
Schultz, T. W. 1960. Capital formation by education. The journal of political economy68(6) 571–583.
Schultz, T. W. 1961. Investment in human capital. The American Economic Review51(1) 1–17.
Seibert, S. E., S. R. Silver, W. A. Randolph. 2004. Taking empowerment to thenext level: A multiple-level model of empowerment, performance, and satisfaction.Academy of Management Journal 47(3) 332–349.
Sethi, A. K., S. P. Sethi. 1990. Flexibility in manufacturing: A survey. InternationalJournal of Flexible Manufacturing Systems 2(4) 289–328.
Shea, J. 1997. Instrument relevance in multivariate linear models: A simple measure.Review of Economics and Statistics 79(2) 348–352.
221

Shostack, G. L. 1977. Breaking free from product marketing. The Journal of Mar-keting 41(2) 73–80.
Shostack, G. L. 1982. How to design a service. European Journal of Marketing 16(1)49–63.
Shostack, G. L. 1984. Designing services that deliver. Harvard Business Review 62(1)133–139.
Shostack, G. L. 1987. Service positioning through structural change. The Journal ofMarketing 51(1) 34–43.
Siemsen, E., S. Balasubramanian, A. V. Roth. 2007. Incentives that induce task–related effort, helping, and knowledge sharing in workgroups. Management Science53(10) 1533–1550.
Siemsen, E., A. V. Roth, S. Balasubramanian, G. Anand. 2009. The influence ofpsychological safety and confidence in knowledge on employee knowledge sharing.Manufacturing & Service Operations Management 11(3) 429–447.
Siemsen, E., A. V. Roth, P. Oliveira. 2010. Common method bias in regression modelswith linear, quadratic, and interaction effects. Organizational Research Methods13(3) 456–476.
Skaggs, B. C., M. Youndt. 2004. Strategic positioning, human capital, and perfor-mance in service organizations: A customer interaction approach. Strategic Man-agement Journal 25(1) 85–99.
Sobel, M. E. 1982. Asymptotic confidence intervals for indirect effects in structuralequation models. Sociological methodology 13(1982) 290–312.
Soteriou, A., S. A. Zenios. 1999. Operations, quality, and profitability in the provisionof banking services. Management Science 45(9) 1221–1238.
Soteriou, A. C., R. B. Chase. 1998. Linking the customer contact model to servicequality. Journal of Operations Management 16(4) 495–508.
Spreitzer, G. M. 1995. Psychological empowerment in the workplace: Dimensions,measurement, and validation. Academy of Management Journal 38(5) 1442–1465.
StataCorp. 2011. Stata Statistical Software: Release 12 . StataCorp LP, CollegeStation, TX.
Stewart, D. M., R. B. Chase. 1999. The impact of human error on delivering servicequality. Production and Operations Management 8(3) 240–263.
222

Stiles, P., S. Kulvisaechana. 2003. Human capital and performance: A literaturereview. Judge Institute of Management, University of Cambridge .
Stock, J. H., M. Yogo. 2002. Testing for weak instruments in linear iv regression.NBER Technical Working Paper No. 284 .
Stuart, F. I., S. S. Tax. 2004. Toward an integrative approach to designing serviceexperiences: Lessons learned from the theatre. Journal of Operations Management22(6) 609–627.
Sun, L. Y., S. Aryee, K. S. Law. 2007. High-performance human resource practices,citizenship behavior, and organizational performance: A relational perspective.Academy of Management Journal 50(3) 558–577.
Surprenant, C. F., M. R. Solomon. 1987. Predictability and personalization in theservice encounter. The Journal of Marketing 51(2) 86–96.
Talbott, B. M. 2006. The power of personal service: Why it matters, what makesit possible, how it creates competitive advantage. Cornell Hospitality IndustryPerspectives 1.
Tansik, D. A. 1990. Balance in service systems design. Journal of business research20(1) 55–61.
Tansik, D. A., R. B. Chase. 1988. The effects of customer induced uncertainty onthe design of service systems. Annual meeting of the Academy of Management,Anaheim, CA.
Tansik, D. A., W. L. Smith. 1991. Dimensions of job scripting in services organisa-tions. International Journal of Service Industry Management 2(1) 35–49.
Tansik, D. A., W. L. Smith. 2000. Scripting the service encounter. J. A. Fitzsim-mons, M. J. Fitzsimmons, eds., New Service Development: creating memorableexperiences . Sage Publications, Inc, 239–263.
Tax, S. S., S. W. Brown, M. Chandrashekaran. 1998. Customer evaluations of servicecomplaint experiences: implications for relationship marketing. The Journal ofMarketing 62(2) 60–76.
Upton, D. M. 1997. Process range in manufacturing: An empirical study of flexibility.Management Science 43(8) 1079–1092.
Vendelø, M. T. 2009. Improvisation and learning in organizations—an opportunityfor future empirical research. Management Learning 40(4) 449–456.
Vera, D., M. M. Crossan. 2004. Theatrical improvisation: Lessons for organizations.Organization Studies 25(5) 727–749.
223

Vera, D., M. M. Crossan. 2005. Improvisation and innovative performance in teams.Organization Science 16(3) 203–224.
Verma, R., G. M. Thompson, W. L. Moore, J. J. Louviere. 2001. Effective design ofproducts/services: An approach based on integration of marketing and operationsmanagement decisions*. Decision Sciences 32(1) 165–194.
Victorino, L. 2008. Scripting the service encounter: An empirical analysis. Ph.D.thesis, The University of Utah.
Victorino, L., A. R. Bolinger. 2012. Scripting employees: An exploratory analysis ofcustomer perceptions. Cornell Hospitality Quarterly 53(3) 196–206.
Victorino, L., R. Verma, B. L. Bonner, D. G. Wardell. 2012. Can customers detectscript usage in service encounters? An experimental video analysis. Journal ofService Research Published Online 25 May 2012.
Victorino, L., R. Verma, D. G. Wardell. 2008. Service scripting: A customer’s per-spective of quality and performance. Cornell Hospitality Report 8(20) 4–13.
Voss, C. 2004. Trends in the experience and service economy: The experience profitcycle. London Business School .
Voss, C., A. V. Roth, R. B. Chase. 2008. Experience, service operations strategy, andservices as destinations: Foundations and exploratory investigation. Productionand Operations Management 17(3) 247–266.
Wallace, J. C., P. D. Johnson, K. Mathe, J. Paul. 2011. Structural and psycholog-ical empowerment climates, performance, and the moderating role of shared feltaccountability: A managerial perspective. Journal of Applied Psychology 96(4)840–850.
Weick, K. E. 1990. The vulnerable system: An analysis of the tenerife air disaster.Journal of Management 16(3) 571–593.
Weick, K. E. 1993. The collapse of sensemaking in organizations: The Mann Gulchdisaster. Administrative Science Quarterly 38(4) 628–652.
Weick, K. E. 1995. Sensemaking in organizations . Sage.
Weick, K. E. 1998. Introductory essay: Improvisation as a mindset for organizationalanalysis. Organization Science 9(5) 543–555.
Wemmerlov, U. 1989. A taxonomy for service processes and its implications for systemdesign. International Journal of Services Industry Management 1(3) 13–27.
224

Wooldridge, J. M. 2009. Introductory econometrics: A modern approach. SouthWestern Cengage Learning.
Xue, M., P. T. Harker. 2002. Customer efficiency: concept and its impact on e-business management. Journal of Service Research 4(4) 253.
Zack, M. H. 2000. Jazz improvisation and organizing: Once more from the top.Organization Science 11(2) 227–234.
Zeithaml, V. A., L. L. Berry, A. Parasuraman. 1988. Communication and controlprocesses in the delivery of service quality. The Journal of Marketing 52(2) 35–48.
Zhao, X., J. G. Lynch, Q. Chen. 2010. Reconsidering Baron and Kenny: Myths andtruths about mediation analysis. Journal of Consumer Research 37(2) 197–206.
Zheng, Y., W. Venters, T. Cornford. 2011. Collective agility, paradox and organi-zational improvisation: The development of a particle physics grid. InformationSystems Journal 21(4) 303–333.
Zomerdijk, L. G., C. Voss. 2010. Service design for experience-centric services. Journalof Service Research 13(1) 67–82.
Zomerdijk, L. G., C. Voss. 2011. Nsd processes and practices in experiential services.Journal of Product Innovation Management 28(1) 63–80.
225
Related Documents