1 Essays on healthcare priority setting for population health Mara Airoldi Department of Management, London School of Economics and Political Science May 2014 Dissertation submitted to the Department of Management of the London School of Economics and Political Science in fulfilment of the requirements for the award of the degree of Doctor of Philosophy

Welcome message from author
This document is posted to help you gain knowledge. Please leave a comment to let me know what you think about it! Share it to your friends and learn new things together.
Transcript
1
Essays on
healthcare priority setting
for population health
Mara Airoldi
Department of Management, London School of Economics and Political Science
May 2014
Dissertation submitted to the Department of Management of the London School of
Economics and Political Science in fulfilment of the requirements for the award of the
degree of Doctor of Philosophy

2
Declaration
I certify that the thesis I have presented for examination for the MPhil/PhD degree
of the London School of Economics and Political Science is solely my own work other
than where I have clearly indicated that it is the work of others (in which case the extent
of any work carried out in jointly by me and any other person is clearly identified in it).
The copyright of this thesis rests with the author. Quotation from it is permitted,
provided that full acknowledgement is made. This thesis may not be reproduced without
my prior written consent.
I warrant that this authorisation does not, to the best of my belief, infringe the rights
of any third party.
I declare that my thesis consists of 60,408 words.
Statement of joint work
Chapter 3 is a joint work with Prof Alec Morton, who is one of my supervisors. I built
on a preliminary conference paper prepared by Prof Morton. In this paper, Prof Morton
argued for the axiomatic equivalence of two particular metrics that measure health. I
contributed the work on the identification of the fundamental flaw in one of the two
measures and I suggested a methodological correction to restore its normative validity
(see my single-authored working paper, Airoldi 2007). I confirm that my contribution to
this chapter is 50%.
Chapter 5 is also joint work with Prof Alec Morton. I led the field work, conducted
the analysis and drafted the paper. I confirm that my contribution to this chapter is 90%.
Chapter 4 and 6 are joint work with the QQuIP/SyMPOSE research team of the LSE. I
have been a key member of this research team since 2005 and significantly contributed
to the development of the analytical framework used in these papers. For both
chapters, I led the work, conducted the analysis of results and wrote the paper. The
QQuIP/SyMPOSE team commented on the developing work and commented on draft
version of the paper. I confirm that my contribution to these chapters is 90% each.
I confirm that I am the sole author of Chapter 1, 2, 7 and 8.

3
To my family

4
Acknowledgments
I am indebted to very many people for embarking on and finishing this thesis.
I will be forever grateful to my supervisors, Professor Gwyn Bevan and Professor
Alec Morton for encouraging me and for their patient guidance in this journey. I would
also like to offer my special thanks to Professor Larry Phillips and Professor Carlos Bana e
Costa, who taught me about decision analysis and facilitation.
I wish to thank Dr Adam Oliver and Professor Rudolf Klein for several inspiring
discussions on health policy and the process of writing, as well as their helpful
comments on my written work.
Much of the work presented here would not have been possible without discussions
with, and the help of, my colleagues of the SyMPOSE research programme: Dr Jenifer
Smith, Chiara De Poli, Dr Nikos Argyris, Dr Monica Oliveira, Laura Schang and Samantha
Roberts, and with Professor Gwyn Bevan and Professor Alec Morton. I also wish to thank
the Health Foundation for the financial support received for this programme and in
particular Helen Crisp.
I am indebted to many colleagues who reviewed my papers, especially Professor Ali
McGuire, Dr Gilberto Montibeller and to my Viva examiners professor Julian Le Grand
and Dr Angela Bate for a lively discussion and constructive feedback.
Thanks are also due to all family and friends who inspired me and supported me in
my work. I would particularly like to mention Barbara Fasolo, Silvia Filip, Barbara Dotti,
Marieke Huysentruyt and Grainne Schmid. I am also indebted to Federica Muzzi and
Hosea Jan Frank.
Finally, I owe my deepest gratitude to Ludovico Filotto.
5
Essays on healthcare priority
setting for population health
Abstract
Healthcare priority setting is a major concern in most countries because healthcare
represents a large and increasing public expenditure. Yet, there is not well established
procedure that is consistently used to support those responsible for priority setting
decisions.
This dissertation consists of a review of the literature and five independent essays
on healthcare priority setting, focusing on the value of formal analysis to support local
healthcare planners in allocating a fixed budget.
This dissertation makes both an intellectual and a practical contribution. The
intellectual contribution is a synthesis of both economics and decision analysis insights.
The review of the literature shows that tools grounded in health economics currently fail
to contribute to local healthcare priority setting decisions because they are not practical.
At the same time, tools grounded in (multi-criteria) decision analysis fail to incorporate
the methodological advances of health economics and are hence theoretically weak. My
thesis contributes to closing this gap.
The practical contribution is that I design, and test the value of, a process and of
particular value functions that can be used by local healthcare planners within their
limited resources.

6
Contents
1 Introduction......................................................................................................... 15
1.1 Overview of chapters .................................................................................... 17
2 Current approaches to priority setting in healthcare.......................................... 20
2.1 The normative benchmark of Welfare economics ....................................... 22
2.1.1 Basic idea .............................................................................................. 22
2.1.2 Attempts to overcome the issue of interpersonal comparison of utilities
23
2.2 Prescriptive approaches grounded in Welfare economics ........................... 25
2.2.1 Cost Benefit Analysis to priority setting in healthcare.......................... 25
2.2.2 Limitations of Cost Benefit Analysis to priority setting in healthcare .. 26
2.2.3 Cost-effectiveness analysis for priority setting in healthcare............... 27
2.2.4 Limitations of CEA ................................................................................. 32
2.2.5 Generalised Cost-Effectiveness Analysis............................................... 35
2.2.6 Limitations of GCEA............................................................................... 36
2.3 The normative framework of Multi-Criteria Decision Analysis..................... 37
2.3.1 Basic idea .............................................................................................. 37
2.3.2 Additive and multiplicative utility and value models............................ 38
2.4 Prescriptive frameworks drawing on MCDA................................................. 39
2.4.1 Programme Budgeting and marginal Analysis (PBMA)......................... 40
2.4.2 Limitations of PBMA.............................................................................. 41
2.5 Summary ....................................................................................................... 45
2.6 My contribution: closing the gap .................................................................. 46
3 Adjusting life for quality or disability: stylistic difference or substantial dispute?
47
3.1 Introduction .................................................................................................. 48
3.2 Health versus Disability................................................................................. 50
7
3.2.1 Formal framework ................................................................................ 51
3.2.2 Health gain versus reduction in disability ............................................. 53
3.3 Discussion...................................................................................................... 58
3.4 Appendix ....................................................................................................... 60
4 Requisite models for strategic commissioning: the example of type 1 diabetes63
4.1 Introduction .................................................................................................. 63
4.2 Framework of analysis .................................................................................. 64
4.3 Modelling type 1 diabetes ............................................................................ 67
4.3.1 The Disease and Interventions.............................................................. 67
4.3.2 Modelling requirements of our framework.......................................... 68
4.3.3 Results................................................................................................... 88
4.3.4 Discussion............................................................................................ 104
4.4 Appendix: Model parameters ..................................................................... 107
5 Portfolio decision analysis for population health.............................................. 111
5.1 Background ................................................................................................. 112
5.2 Existing techniques ..................................................................................... 114
5.3 Case Study................................................................................................... 116
5.3.1 Framing the problem .......................................................................... 117
5.3.2 Planning the workshops...................................................................... 119
5.3.3 The strategic decision frame: objectives and alternatives ................. 120
5.3.4 Scoring................................................................................................. 125
5.3.5 Weighting the criteria ......................................................................... 126
5.3.6 Results................................................................................................. 131
5.4 Discussion.................................................................................................... 133
5.4.1 Use of evidence and disease modeling............................................... 134
5.4.2 Health inequalities .............................................................................. 135
5.4.3 Unrelated future costs ........................................................................ 136

8
5.4.4 Acute versus preventive...................................................................... 137
5.4.5 The good death ................................................................................... 138
5.5 Conclusion................................................................................................... 139
5.6 Appendix ..................................................................................................... 141
6 Deliberative Cost Effectiveness Analysis to allocate a fixed budget ................. 148
6.1 Introduction ................................................................................................ 148
6.2 Methods...................................................................................................... 150
6.3 Case study ................................................................................................... 152
6.3.1 Organisational context and term of reference ................................... 152
6.3.2 Deliberative CEA.................................................................................. 152
6.3.3 Results................................................................................................. 160
6.4 Discussion.................................................................................................... 163
6.4.1 Accessibility......................................................................................... 163
6.4.2 Acceptability........................................................................................ 164
6.5 Conclusions ................................................................................................. 166
7 Disinvestments in practice: overcoming resistance to change through a socio-
technical approach with local stakeholders ................................................................... 168
7.1 Introduction ................................................................................................ 168
7.2 Methods...................................................................................................... 171
7.3 Case study ................................................................................................... 172
7.3.1 Background and term of reference..................................................... 172
7.3.2 Participants ......................................................................................... 173
7.3.3 The socio-technical process ................................................................ 175
7.3.4 Results................................................................................................. 182
7.3.5 Impact ................................................................................................. 186
7.4 Discussion.................................................................................................... 187

9
7.4.1 ‘Live’ model building with stakeholders increases buy-in of
recommendations................................................................................................... 187
7.4.2 Shifting negotiating powers by assessing all services simultaneously 189
7.4.3 Role of the “CEA” to generate a credible rationale for difficult decisions
190
7.5 Conclusion................................................................................................... 192
8 Critical discussion and conclusion ..................................................................... 194
8.1 Critical discussion........................................................................................ 194
8.1.1 The ‘technical’ dimension: the value function.................................... 196
8.1.2 The social dimension: stakeholder engagement, power and trust .... 199
8.1.3 Requisite models................................................................................. 201
8.2 Improving PBMA and CEA........................................................................... 202
8.3 Main limitations and further research........................................................ 203
8.4 Reflections on the direction of the field ..................................................... 205
9 References ......................................................................................................... 207
List of figures
Figure 1 Health H() and disability measurement D() on a life profile ...................... 53
Figure 2 Gain in health H()and reduction in disability D()from health improving
intervention replacing health profile (bold line) with health profile (dashed line
between t1 and t2, bold line elsewhere). .......................................................................... 55
Figure 3 Gain in health and reduction in disability from life extending intervention
replacing health profile (bold line) with health profile (dashed line between and ’,
bold line elsewhere).......................................................................................................... 55
Figure 4 Ratio of reduction in disability to gain in health () – empirical estimates
using recent, English life tables. The x-axis reports the age at which death is prevented
(). values are reported for intervention extending life by k years, where k is varied
from 1 to 99. The graphs for k=1 and k=30 are indicated to guide the reader. ............... 57

10
Figure 5 Ratio of reduction in disability to gain in health () – empirical estimates
using recent, English life tables. The x-axis reports the age at which death is prevented
(). values are reported for intervention extending life by1 year in the left-hand side
graph and by 30 years in the right-hand side graph with a quality of life h*. The curves
for h*=1 and h=0.1 are indicated to guide the reader...................................................... 58
Figure 6 Proportion of type 1 diabetes population with glucose levels within the
recommended level, by age group (National Clinical Audit Support Programme 2005;
data breakdown provided upon request by NHS – Health and Social Care Information
Centre) .............................................................................................................................. 68
Figure 7 Base structure of the model for diabetic nephropathy (left) and diabetic
retinopathy & diabetic foot (right). **Deaths in the diabetic population are caused by
‘normal’ mortality, i.e. mortality rate as in the non-diabetic population, and ‘excess’
mortality due to diabetes. Only ‘excess’ mortality generates Years of Life Lost (YLLs) for
the Burden of diabetes estimate. ..................................................................................... 72
Figure 8 Estimates of BoD (undiscounted DALYs) from type 1 diabetes and
reductions in the first five years and steady state from intensive glucose control.......... 90
Figure 9 ‘Avoidable’ deaths through intensive glucose control in the first five years
and in the steady state by age at the beginning of the intervention ............................... 90
Figure 10 ‘Avoidable’ cases of overt proteinuria and end-stage renal disease through
intensive glucose control in the first five years and in the steady state by age at the
beginning of the intervention ........................................................................................... 91
Figure 11 ‘Avoidable’ cases of severe visual disorders through intensive glucose
control in the first five years and in the steady state by age at the beginning of the
intervention ...................................................................................................................... 92
Figure 12 Avoidable’ cases of amputation through intensive glucose control in the
first five years and in the steady state by age at the beginning of the intervention ........ 92
Figure 13 Estimates of annual BoD in undiscounted DALYs from type 1 diabetes in
the steady state from 0 to 100% proportion of population complying with intensive
glucose control................................................................................................................ 102
Figure 14 The final model showing the interventions in each of the six areas ........ 122
Figure 15 Within criteria weighting.......................................................................... 129
Figure 16 The partial efficient frontier for the ‘Smoking’ area ................................ 132

11
Figure 17 The efficient frontier, showing the 14 interventions in Value-for-Money
order ............................................................................................................................... 133
Figure 18 The rectangles of health benefit to the population for the three proposed
initiatives in Cancer. Similar rectangles were drawn for each of the five areas and their
interventions................................................................................................................... 158
Figure 19 The structure of a value-for-money triangle ............................................ 160
Figure 20 The efficient frontier of triangles ranked by value-for-money (solid
triangles) and the frontier with the ranking by overall benefit score (dashed triangles)
........................................................................................................................................ 162
Figure 21 Timeline of the case study........................................................................ 176
Figure 22 Assessing the quality of life weight of ‘mild eating disorders’ ................. 179
Figure 23 Assessing health gains. The solid line represents the simplified health
profile of the average patient engaging with Specialist Eating Disorder services for one
year (from a quality of life of 0.12 to 0.476); the dashed line the counterfactual (from a
quality of life of 0.12 to 0.239); the shaded area is the health gain, i.e. (0.476-0.239)/2 =
0.118. .............................................................................................................................. 181
Figure 24 Assessed population health benefit represented by the area of the
‘rectangles’ (i.e. numbers who benefit times benefit per person)................................. 181
Figure 25 Value-for-Money triangle ......................................................................... 182
Figure 26 Production function: health benefits to the population with eating
disorders at different level of expenditure. The seven ‘triangles’ correspond to the seven
assessed services in order of their value-for-money, i.e. (starting from the origin of the
graph) 1) University eating disorder primary care clinics; 2) voluntary sector; 3) Sheffield
Eating Disorder Services (SEDS); 4) private day-services; 5) emergency medical
admissions; 6) inpatient admission to specialist hospital; 7) admission to acute
psychiatric wards ............................................................................................................ 184
Figure 27 Estimated production function following the potential resource re-
allocation detailed in Table 26........................................................................................ 186
12
List of boxes
Box 1 Definitions: Priority setting versus resource allocation.................................... 21
Box 2 Research paradigms in decision-making research ........................................... 21
Box 3 Welfarism, extra-welfarism .............................................................................. 29
List of tables
Table 1 Examples of criteria and value functions published in the PBMA literature. 43
Table 2 Four pragmatic approaches assessed with respect to theoretical robustness
and pragmatic value.......................................................................................................... 46
Table 3 Key modelling assumptions ........................................................................... 73
Table 4 Data sources and assumptions on missing data............................................ 80
Table 5 Cost of monitoring glucose levels and prescribing insulin............................ 85
Table 6 Cost of treating microvascular complications ............................................... 87
Table 7 Burden of Disease and its reduction through intensive glucose control in the
first five years and in the steady-state.............................................................................. 89
Table 8 Annual costs and savings (negative figures) from intensive glucose control in
the first five years and the steady state ........................................................................... 94
Table 9 Net gain in output in the first five years and in the steady state ................. 95
Table 10 Prevalence rates of renal complications...................................................... 96
Table 11 Prevalence rates of eye complications ........................................................ 97
Table 12 4-year incidence rates of sores/ulcers and foot/toe amputations.............. 99
Table 13 Estimates of the risk reduction in 9-year incidence from microvascular
complications .................................................................................................................. 100
Table 14 Parameters shared by the renal and eye disease model: mortality rate of
the non-diabetic population and incidence rate of diabetes ......................................... 107
Table 15 Incidence rates of sores/ulcers and amputation....................................... 107
Table 16 Transition probabilities in the renal disease complication model............. 108
Table 17 Transition probabilities in the eye disease complication model ............... 109
Table 18 Disability weights ....................................................................................... 110
Table 19 Description of interventions (i) by group (g) ............................................. 123
13
Table 20 Normalizing scores on Reduction in premature mortality for the area
“Physical activity”............................................................................................................ 128
Table 21 Within- and Across-criterion weights ........................................................ 130
Table 22 Example of template and scores: options for cancer (a similar template was
used for each of the other four priority areas and their eighteen interventions).......... 157
Table 23 Priority order according to Value-for-money (‘league table’) for k=0.5.... 161
Table 24 Health benefit (compared to counterfactual) generated by Specialist Eating
Disorder Services (SEDS) ................................................................................................. 180
Table 25 Interventions ranked by cost-effectiveness or ‘Value-for-Money’ ........... 183
Table 26 One of the explored scenario for resource re-allocation: assessed costs and
benefits of interventions post-reallocation ranked by Value-for-Money ...................... 185
Table 27 Deliberative CEA in the context of existing prescriptive approaches for
healthcare priority setting .............................................................................................. 205
List of equations
Equation 1................................................................................................................... 27
Equation 2................................................................................................................... 38
Equation 3................................................................................................................... 38
Equation 4................................................................................................................... 73
Equation 5................................................................................................................... 74
Equation 6................................................................................................................... 75
Equation 7................................................................................................................... 78
Equation 8................................................................................................................. 119
Equation 9................................................................................................................. 159
Equation 10............................................................................................................... 197

14
List of abbreviations
ASL Azienda Sanitaria Locale (Local Healthcare Agency)
BoD Burden of Disease
B-S SWF Bergson-Samuelson Social Welfare Function
CCG Clinical Commissioning Group
CEA Cost Effectiveness Analysis
DALY Disability Adjusted Life Year
DCCT Diabetes Control and Complication Trial
GBoD Global Burden of Disease
GCEA Generalised Cost Effectiveness Analysis
GDP Gross Domestic Product
LHIN Local Health Integration Network
MAUT Multi Attribute Utility Theory
MAVT Multi Attribute Value Theory
MCDA Multi Criteria Decision Analysis
NICE National Institute for Health and Clinical Excellence
NHS National Health System
OECD Organisation for Economic Co-operation and Development
PBMA Program Budgeting and Marginal Analysis
PCT Primary Care Trust
QALY Quality Adjusted Life Year
RCT Randomised Controlled Trial
SWF Social Welfare Function
YLDs Years Lived with Disability
YLL Years of Life Lost
WESDR Wisconsin Epidemiologic Study of Diabetic Retinopathy
WHO World Health Organization

15
1 Introduction
In 2010 OECD countries spent on average 9.5% of GDP on healthcare. Public
expenditure in healthcare for these countries has continued to grow since the institution
of national health services or health insurance schemes, with an annual growth rate of
4.5% in real terms in the decade 2000-2010 (OECD 2012). The financial crisis that has
affected most of the OECD economies since 2008 is putting further pressures on public
expenditures. Healthcare priority setting is hence a current and pressing concern for
most countries.
In this dissertation I take the view that decisions around healthcare priority setting
are complex (Calabresi and Bobbitt 1978, Fuchs 2011) and that hence formal analysis
should play a central role in supporting such decisions (Rosenhead and Mingers 2001,
Pidd 2003). In this dissertation I focus on a particular type of formal analysis, i.e.
quantitative models to assess the value of alternative healthcare interventions to
improve population health or models of option appraisal. These evaluations are of
course just one element of a decision making process. A useful framework to locate my
contribution is Mark Moore’s distinction of three key questions that public managers
should address (Moore 1995): (i) does this decision lead to adding public value; (ii) is
there sufficient support and legitimacy for the decision? And (iii) is it operationally
feasible within the organisational structure? With respect to Moore’s framework, I focus
on the first question, i.e. on the ‘substantive value’, as assessed by formal models of
option appraisal and offer insights and suggestions on the other two questions when our
research dovetails naturally in these domains.
The literature on the definition and measurement of substantive value for decisions
in the public sector is extensive and usually referred to as ‘policy analysis’ or
16
‘programme evaluation’ (House 1982, Boardman, Greenberg et al. 1996, Weimer and
Vining 2011). The most prominent theoretical framework for conducting these
evaluations is economic theory and in particular welfare economics.
As I discuss in chapter 2, in the context of healthcare priority setting, cost-
effectiveness analysis (CEA) is the recommended approach to operationalise welfare
economics. The use of CEA, however, is problematic because it makes overwhelming
information demands. These demands are evident in two aspects. First, CEA assumes
that it is possible to describe and asses all alternative allocation of resources - so that
they can be ranked according to their cost-effectiveness and they could be funded in this
order until resources allow. Second, CEA should rely on good evidence to assess the
health impact of particular interventions and the golden standard of good evidence is
the randomised controlled trial. Evidence-based medicine plays a prominent role in the
provision of the knowledge base, yet it requires interpretation to extrapolate results
from laboratory settings to the general population (Morris 1997, Kelly, Morgan et al.
2010, Cartwright and Hardie 2012). Furthermore, there is an ever changing knowledge
base on the benefit of particular healthcare interventions, which requires frequent
revisions of past decisions.
In practice, in the face of these difficulties, CEA is generally applied to a limited
subset of all possible interventions using a threshold value to identify interventions that
are deemed cost-effective, as I describe in Chapter 2. This practice is exemplified by the
work of the National Institute for Health and Clinical Excellence (NICE,
http://www.nice.org.uk/).
The availability of CEA reports is certainly helpful in informing priority setting
decisions in any healthcare system. Decisions on priorities, however, need to be made
(and are routinely made) by insurers or local healthcare planners in the absence of
Randomised Controlled Trials (RCTs), systematic literature reviews or CEA reports. In this
dissertation I focus in particular on local planners, i.e. agencies responsible for setting
priorities and allocating a fixed annual budget to meet the healthcare need of a
particular populations. Examples of these agencies are Primary Care Trusts (PCTs) now
replaced by Clinical Commissioning Groups (CCGs) in the English National Health Service
(NHS), or Health boards in Wales, Aziende Sanitarie Locali (ASL) in Italy, Local Health

17
Integration Networks (LHINs) in Ontario, Canada, or Health Boards in New Zealand. They
make the fundamental decisions that operationalize high level policy aims through
contracts for healthcare provision.
Local healthcare planners do not have the financial resources or time to commission
ad-hoc cost-effectiveness analysis studies, which in the UK per intervention cost around
£150,000 and take between three and six months (Department of Health 2009). They
also have limited ability to interpret available CEA reports, evidence from randomised
controlled trials and to adapt them to the local context (Bryan, Williams et al. 2007,
Williams and Bryan 2007, Eddama and Coast 2008). There is currently little evidence on
how these local bodies arrive at their recommendations (Robinson, Dickinson et al.
2011).
In this dissertation I focus in particular on the problem of the local healthcare
planners, who have to allocate a budget despite limited financial and analytical
resources to conduct rigorous economic analyses and lacking good evidence.
1.1 Overview of chaptersChapter 2 reviews the literature on policy analysis or programme evaluation in the
specific case of healthcare priority setting, starting with the normative framework of
welfare economics and its limitations. I focus in particular on the theoretical difficulty of
aggregating benefits over people, i.e. in making interpersonal comparison of utilities and
on the rejection of cost-benefit analysis in healthcare. I review two programme
evaluation techniques which draw on welfare economics and which are prominent in
the health economic literature: cost-effectiveness analysis (Gold, Siegel et al. 1996,
Drummond, Sculpher et al. 2005) and generalised cost-effectiveness analysis (GCEA;
Hutubessy, Baltussen et al. 2002, Tan-Torres Edejer, Baltussen et al. 2003). I then
introduce multi-criteria decision analysis as an alternative normative framework and I
present the technique of programme budgeting and marginal analysis (PBMA; Mitton
and Donaldson 2001, Mitton and Donaldson 2004, Mitton and Donaldson 2004). I will
argue that these techniques are either theoretically robust and impracticable, or
practicable but theoretically wanting, providing a motivation for my research.

18
This dissertation contributes to this literature through five independent essays. In
the first essay (Chapter 3) I explore how measures of health available in the literature
could be used to aggregate benefits over people. In particular, I focus on the difference
between taking a health or a disability perspective in assessing the impact on healthcare
interventions, i.e. by assessing the value of an intervention in terms of its impact in
increasing health, versus reducing ill-health or disability. I find that the method currently
recommended to measure reductions in ill-health (Hutubessy, Baltussen et al. 2003) is
problematic. I also prove how the problem could be overcome, turning the choice of a
health or disability perspective into a stylistic rather than substantive choice.
In the second essay (Chapter 4) I argue that the standard practice of discounting
costs and benefits over time in CEA reports may exacerbate myopic decision making
practices. This practice assumes that current costs could be offset by future benefits or
savings. Healthcare planners, however, need to demonstrate financial balance in the
short term and they hence have few incentives to invest in interventions with delayed
benefits. To overcome this bias, I suggest reporting information on the costs and
benefits of interventions in the long run using a ‘steady state’ model that assumes away
the delay. I illustrate the value of this procedure with the practical example of glycaemic
control in patients with diabetes type 1 in England and Wales.
The last three essays (chapter 5, 6 and 7) contribute to the development of a
theoretically robust, pragmatic approach to healthcare priority setting at the local level
through action research with local healthcare planners of the English NHS. In these
chapters I propose a socio-technical approach, which on the technical dimension
employs a value function that is drawn from health economics and decision analysis, and
on the social dimension relies on the practice of decision conferencing to engage local
stakeholders in defining alternatives for resource allocation and assessing them with the
proposed value function. Taken together, these three papers add to the literature in two
ways. First, I discuss the theoretical robustness of value functions used in PBMA
exercises, drawing from CEA, generalised CEA and Multi-Criteria Decision Analysis
(MCDA). Second, I engage local stakeholders in a decision making process to test the
pragmatic value of the approach. Over the three papers I have worked in an increasingly
complex context, moving from allocating additional resources within a specific budget
category (i.e. reducing risk of cardiovascular diseases), to allocating additional resources
19
across budget categories (i.e. mental health, cardiovascular diseases, respiratory
diseases, children’s health and cancer), to disinvestments within a disease area (i.e.
eating disorders).
Each of the last three papers also makes a distinctive methodological contribution
on its own. In Chapter 5 I explore the systematic use of a portfolio approach drawing
from GCEA in building a simple, multi-criteria model in collaboration with stakeholders.
In Chapter 6 I focus on the accessibility and acceptability of GCEA or CEA models. These
models are difficult to understand and use for people who do not have health economic
training. I test whether these obstacles could be overcome by building a formal model
through a participatory approach. In Chapter 6 I consider the difficult case of generating
agreement around disinvestments and test if the participatory approach I developed
could support such decisions.
In the conclusion I summarise the contribution of my research to the literature.
20
2 Current approaches to priority setting in healthcare
In this chapter, I review the normative and prescriptive approaches for priority
setting and resource allocation in the specific case of healthcare. I identify welfare
economics and decision analysis as two principal normative frameworks. The normative
framework of welfare economics is the reference for the prescriptive approach of social
cost benefit analysis, cost effectiveness analysis, and generalised cost effectiveness
analysis. Decision analysis, and in particular, Multi-Criteria Decision Analysis (MCDA) is
the reference framework for Programme Budgeting and Marginal Analysis (PBMA).
I argue that the prescriptive approaches that draw from welfare economics make a
careful and systematic use of welfare economic principles, as demonstrated by the lively
debates in the health economic literature. I hence consider these approaches
theoretically robust. However, as I will discuss below, they are impractical and those
responsible for allocating healthcare resources do not use them systematically. This is
disconcerting as the evaluation of prescriptive approach revolves around their pragmatic
value. On the other hand, PBMA is a pragmatic tool that appears accessible to
healthcare planners, yet the application of MCDA principles is erratic, as I will
demonstrate. I hence consider PBMA, as currently practiced, a pragmatic but
theoretically weak approach.
For clarity in Box 1 I provide the definition of ‘priority setting’, ‘resource allocation’
and ‘rationing’ that I use in this dissertation. Box 2 summarises the distinction of
normative, prescriptive and descriptive research paradigm in decision-making research.
21
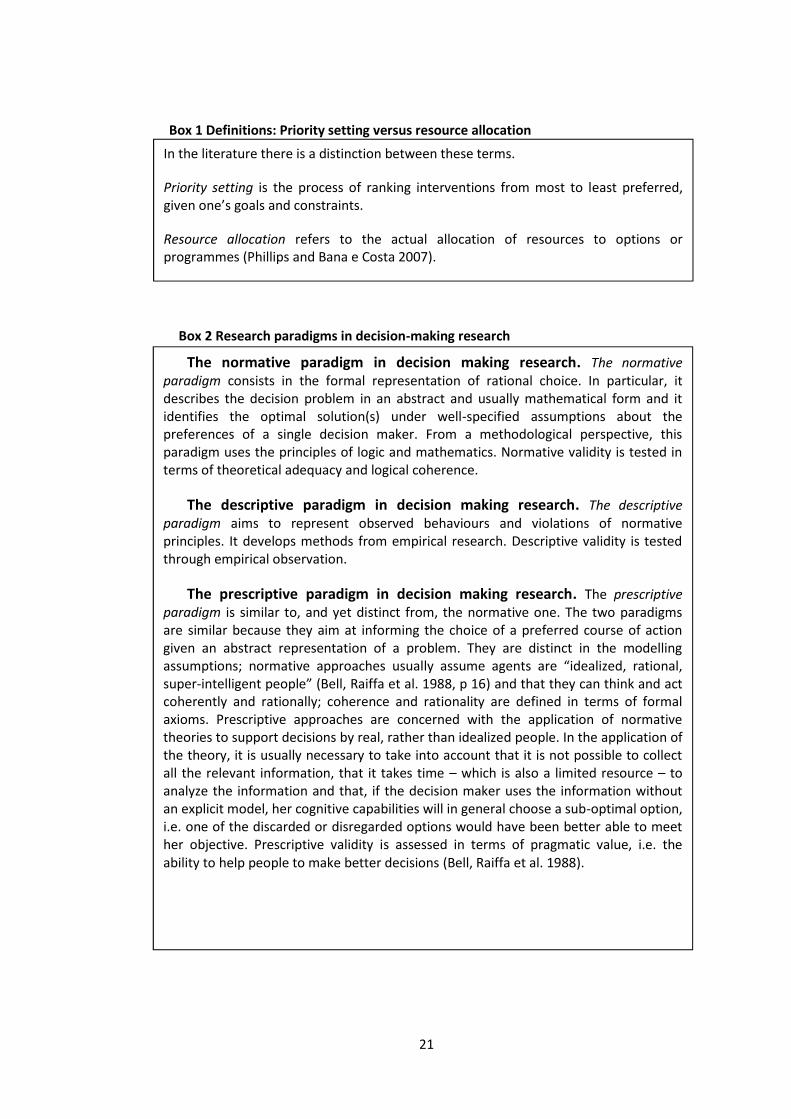
Box 1 Definitions: Priority setting versus resource allocation
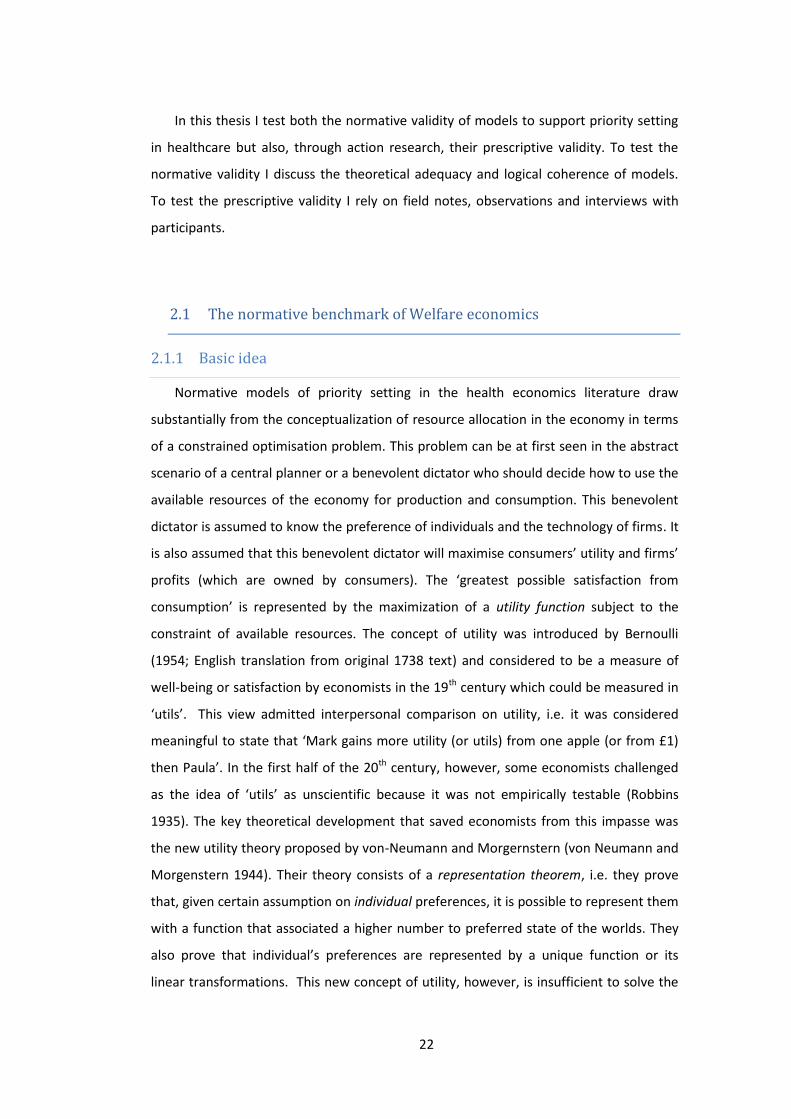
Box 2 Research paradigms in decision-making research
The normative paradigm in decision making research. The normativeparadigm consists in the formal representation of rational choice. In particular, itdescribes the decision problem in an abstract and usually mathematical form and itidentifies the optimal solution(s) under well-specified assumptions about thepreferences of a single decision maker. From a methodological perspective, thisparadigm uses the principles of logic and mathematics. Normative validity is tested interms of theoretical adequacy and logical coherence.
The descriptive paradigm in decision making research. The descriptiveparadigm aims to represent observed behaviours and violations of normativeprinciples. It develops methods from empirical research. Descriptive validity is testedthrough empirical observation.
The prescriptive paradigm in decision making research. The prescriptiveparadigm is similar to, and yet distinct from, the normative one. The two paradigmsare similar because they aim at informing the choice of a preferred course of actiongiven an abstract representation of a problem. They are distinct in the modellingassumptions; normative approaches usually assume agents are “idealized, rational,super-intelligent people” (Bell, Raiffa et al. 1988, p 16) and that they can think and actcoherently and rationally; coherence and rationality are defined in terms of formalaxioms. Prescriptive approaches are concerned with the application of normativetheories to support decisions by real, rather than idealized people. In the application ofthe theory, it is usually necessary to take into account that it is not possible to collectall the relevant information, that it takes time – which is also a limited resource – toanalyze the information and that, if the decision maker uses the information withoutan explicit model, her cognitive capabilities will in general choose a sub-optimal option,i.e. one of the discarded or disregarded options would have been better able to meether objective. Prescriptive validity is assessed in terms of pragmatic value, i.e. theability to help people to make better decisions (Bell, Raiffa et al. 1988).
In the literature there is a distinction between these terms.
Priority setting is the process of ranking interventions from most to least preferred,given one’s goals and constraints.
Resource allocation refers to the actual allocation of resources to options orprogrammes (Phillips and Bana e Costa 2007).
22
In this thesis I test both the normative validity of models to support priority setting
in healthcare but also, through action research, their prescriptive validity. To test the
normative validity I discuss the theoretical adequacy and logical coherence of models.
To test the prescriptive validity I rely on field notes, observations and interviews with
participants.
2.1 The normative benchmark of Welfare economics2.1.1 Basic ideaNormative models of priority setting in the health economics literature draw
substantially from the conceptualization of resource allocation in the economy in terms
of a constrained optimisation problem. This problem can be at first seen in the abstract
scenario of a central planner or a benevolent dictator who should decide how to use the
available resources of the economy for production and consumption. This benevolent
dictator is assumed to know the preference of individuals and the technology of firms. It
is also assumed that this benevolent dictator will maximise consumers’ utility and firms’
profits (which are owned by consumers). The ‘greatest possible satisfaction from
consumption’ is represented by the maximization of a utility function subject to the
constraint of available resources. The concept of utility was introduced by Bernoulli
(1954; English translation from original 1738 text) and considered to be a measure of
well-being or satisfaction by economists in the 19th century which could be measured in
‘utils’. This view admitted interpersonal comparison on utility, i.e. it was considered
meaningful to state that ‘Mark gains more utility (or utils) from one apple (or from £1)
then Paula’. In the first half of the 20th century, however, some economists challenged
as the idea of ‘utils’ as unscientific because it was not empirically testable (Robbins
1935). The key theoretical development that saved economists from this impasse was
the new utility theory proposed by von-Neumann and Morgernstern (von Neumann and
Morgenstern 1944). Their theory consists of a representation theorem, i.e. they prove
that, given certain assumption on individual preferences, it is possible to represent them
with a function that associated a higher number to preferred state of the worlds. They
also prove that individual’s preferences are represented by a unique function or its
linear transformations. This new concept of utility, however, is insufficient to solve the

23
problem of the benevolent dictator, because it does not allow for aggregating utilities
across different individuals.2.1.2 Attempts to overcome the issue of interpersonal comparison ofutilitiesThe incomparability of individual utilities may not be problematic if their
aggregation is not necessary. In particular, quantity consumed and produced are usually
not decided by a benevolent planner but they emerge in the market as the result of
individual choices (Smith 1776). Indeed, under the institutional arrangement of perfect
competition, and given some assumptions on consumers and producers behaviour,
there exists an equilibrium that maximises the individual objective function of producers
and consumers (Arrow and Debreu 1954). Perfect competition is an institutional
arrangement to organize consumption and production which is characterized by many
producers and many consumers (no individual consumer or producer can individually
affect the price on the market), property rights to various assets (including labour),
freedom to trade assets for other assets or goods at publicly known prices (e.g. Mas-
Colell, Whinston et al. 1995). If the consumer behaves in order to maximize the
satisfaction of their preferences; their preferences are well-behaved (complete,
transitive, continuous and reflexive) and if producers behave in order to maximize profit
under known technologies, the market can achieve an equilibrium in which quantity
produced are equal to quantity consumed and producers and consumers both maximize
their respective objective function. This outcome is Pareto optimal, which is a state of
the world in which it is not possible to make at least one person better off without
making at least another person worse off (Pareto 1906). The proof of the Pareto
optimality of the competitive equilibrium is embodied in the two Fundamental theorems
of Welfare Economics (Arrow 1951, Debreu 1951): a competitive equilibrium is a Pareto
optimum; and any Pareto optimum solution could be achieved through a competitive
mechanism by changing the initial allocation of resources.
The attractition of Pareto optimality is that this does not require interpersonal
comparisons of utility. Let us call A and B two different ways to allocate a given quantity
of consumption goods to different individuals. If allocation A is as least as preferred as B

24
by all individuals and at least one person prefers A to B, A is ‘Pareto efficient’. The
problem with Pareto optimality is that it is substantially conservative in the sense that
departures from the status-quo are rarely Pareto efficient. For instance, if all the
resources of a given community are owned by a single misanthropic individual and the
rest of the community is doomed to starvation, most observers would argue for a
redistribution of resources, but the redistribution would not be Pareto efficient because
the rich person would be ‘worse off’. Pareto optimality, hence, seems excessively
limited. Two different techniques have been proposed to compare two allocations
which are both Pareto optima. One is the compensation principle proposed by Kaldor,
Hicks and Scitovsky and the other is the use of a social welfare function proposed by
Bergson and Samuelson.
Kaldor, Hicks and Scitovsky proposal is an extension of the Pareto criterion (Kaldor
1939, Hicks 1940, Scitovsky 1941). Let us assume that A (status quo) and B are two
Pareto optimal states. The move from state A to state B will leave some people better
off (the gainers) and others worse off (the losers). B is preferred to A if the gainers could
compensate the losers and still be better off and the losers would not be able to bribe
the gainers not to undertake the change. It is controversial, however, to recommend an
option based on a compensation that is only potential and may not be in fact be paid.
The compensation is in fact measured in monetary terms, i.e. money that gainers are
willing to pay to losers. Because of decreasing marginal utility of wealth, wealthier
individuals will be willing to transfer relative more resources for the same change in
utility compared to what they would do, would they be poorer. As a result, their
preferred options are more likely to be favoured through CBA. This is not problematic if
a monetary transfer actually takes place to compensate the losers. In fact, if the
compensation takes place, the outcome is Pareto optimal and it would not be necessary
to invoke the Kaldor, Hicks and Scitovsky principle. The value of their compensation
principle lies precisely in the hypothetical nature of the compensation. It seems socially
unfair, however, to judge a state of the world superior to another on the basis of
hypothetical compensations.
The alternative solution of a social welfare function (B-S SWF) proposed by Bergson
and Samuelson (Burk 1938, Samuelson 1947, chapter 8, Bergson 1954) consists in
defining an explicit preference ordering for different distribution of utility among
25
individuals, with the individual utility representing individual’s preferences over
alternative allocations of resources. Several authors maintain that the approach requires
an ethical observer to engage in interpersonal comparison of cardinal utilities (Kemp
and Ng 1976, Parks 1976, Mueller 2003). This view is however debated by Samuelson,
who confirms the need for an ethical observer to engage in interpersonal comparisons,
but he proves that ordinal preferences are sufficient and that there is no need to invoke
cardinal intensities (Samuelson 1977). A B-S SWF transfers the concept of utility and
indifference curves from the individual preferences over goods to society’s preferences
over distribution of utility. The shape of the SWF ‘indifference curves’ requires
preferences derived from ethical judgments on distribution to be explicit (Bergson
1954). The concept is powerful and attractive in the normative domain, but it is unclear
how the analyst should specify such a function in supporting decisions on behalf of
society (i.e. in a prescriptive approach).
2.2 Prescriptive approaches grounded in Welfare economicsIn this section I review three approaches that operationalize Welfare economic
principles in assessing policy options: Cost-Benefit Analysis (CBA; or Social Cost Benefit
analysis, SCBA), Cost Effectiveness Analysis (CEA) and Generalised Cost Effectiveness
Analysis (GCEA). I will focus in particular on the application of these prescriptive
approaches in the context of healthcare priority setting.2.2.1 Cost Benefit Analysis to priority setting in healthcareGiven the difficulties in making a B-S SWF operational, the dominant economic
approach to inform resource allocations relies on the normative model of the Kaldor-
Hicks-Scitovsky potential compensation principle. The operational technique to apply
this model in practice (i.e. prescriptively) is Cost Benefit Analysis (or CBA; e.g. Layard and
Gleister 1994), which is currently the recommended approach to resource allocation in
the British Government (HM Treasury 2003). In CBA options are appraised by summing
the monetary value of gains to gainers and losses to losers and the option with the
highest value is recommended. As discussed in the previous section, the model does
not require the compensation to take place. Although this has been criticised, one may
argue that the role of the economist is to indicate the superiority of an option to its

26
alternatives (i.e. if the compensation would be implemented, the chosen option would
be Pareto efficient) and let politicians decide if the compensation should be imposed
(Scitovsky 1951).
The allocation of scarce resources to healthcare for a defined population inevitably
determines some ‘winners’ and some ‘losers’: if the same resources are invested in
portfolio of investments A compared to an alternative portfolio B, some people will be
better off in A rather than B and some will be worse off. CBA is an approach to assess if
the net benefit of choosing A over B is positive, by estimating if the gain to the ‘winners’
would be sufficiently great to compensate the ‘losers’.
2.2.2 Limitations of Cost Benefit Analysis to priority setting in healthcareDespite the existence of a clear normative framework, its operationalization through
CBA has some limitations. In particular, the use of ‘willingness-to-pay’ to attribute a
monetary value to policy outcomes is normatively weak because it can lead to
intransitive preferences, it depends on the current distribution of wealth (hence raising
equity concerns) and it is not clear whose preferences should be included or excluded
(Boardman, Greenberg et al. 2011).
In the case of evaluating alternative healthcare interventions or policies,
furthermore, it is necessary to attribute a monetary value to lives saved or health gain.
Techniques to elicit the maximum willingness to pay to reduce the risk of death or
injuries are available (for a theoretical discussion, see Schelling 1968, Jones-Lee 1976,
for its application in Central Government appraisals and evaluations see HM Treasury
2003, p 61-62), although there is no agreement of what that value should be and
different monetary values are used in different contexts (Tengs, Adams et al. 1995). In
the case of healthcare interventions which may benefit a named individual, however,
the monetisation of the benefits is morally objectionable because of the ‘rule of rescue’,
i.e. the moral imperative which demands that everything possible should be attempted
to rescue a life regardless of the costs (Hadorn 1991, Mooney and Wiseman 2000).
Although it is possible to derive a mathematical equivalence between saving a life and
reducing the risk of a fatality (Mason, Jones-Lee et al. 2009), the ‘rule of rescue’ claims

27
that the two contexts are substantially different and no monetary value can compensate
‘losers’, when the substance of their loss is their death.
The potential compensation of ‘losers’ may be particularly repulsive or plainly
impossible in healthcare as ‘losing’ might lead to death. For instance, let us suppose that
two people, one wealthy and one poor individual, have the same age and disease. One
pill exists which can extend the life of people with this disease by two months on
average, but there is only one dose available. The wealthy individual may provide a
higher ‘willingness to pay’ for extending his life by two months than a poor individual.
According to the Pareto principle, the wealthy individual should compensate the poor
for dying so that they will be both better-off. Most people find this conclusion repulsive
(Sandel 2012).
In the absence of an agreed monetary value of life and of health, the recommended
prescriptive approach formulated by health economists is Cost Effectiveness Analysis (or
CEA; e.g. Gold, Siegel et al. 1996), which I discuss in the next section.2.2.3 Cost-effectiveness analysis for priority setting in healthcareIn CEA the problem of those responsible for allocating resources could be
represented as follows (adapted from Torrance, Thomas et al. 1972):
Equation 1
pjx
nix
Bxcts
xexF
xF
jIii
i
n
iii
n
iiii
i
,...,2,1;1
,...,2,1;10
;..
;)(
)(max
1
1
X
where xi is the quantity of intervention i provided and could range from 0 (not
provided) to 1 (provided to the whole population who might benefit), ei is the
effectiveness or benefit of the intervention. The benefit is usually assumed to be the

28
individual’s health or the utility derived from being in a particular health state, measured
in terms of longer life expectancy adjusted for quality of life using metrics such as the
Quality Adjusted Life Year or QALY (Williams 1985). The QALY metric results from the
product of life duration expressed in years and quality of life represented on an interval
scale ranging from 0 to 1, where 0 correspond to the quality of life equivalent to being
dead and 1 to that of ‘full health’. One QALY represents the equivalent of a year spent in
full health. B represents the available resources and ci the cost of providing the
intervention if provided to the whole population who might benefit. To maximise F, the
decision maker selects a portfolio of interventions X, which is a vector representing the
different quantities x for each intervention i.
The interpretation of QALYs in terms of health or in terms of utility derived from
being in a particular health state is fundamental from a theoretical standpoint. In the
work that led to the original development of CEA, the objective function represented
the objective of those responsible for allocating resources (e.g. a healthcare planning
agency). Pioneers in the technique came from the operational research and engineering
community. They argued that the objective of these agencies should be the
maximisation of health and they proposed metrics to measure it (e.g. Fanshel and Bush
1970, Quade 1971). Later, economists provided a normative framework to CEA, arguing
that the objective function should represent social welfare (usually called a Health-
Related Social Welfare Function, e.g. Garber and Phelps 1997, Dolan 1998) and that
welfare economics provides the ethical framework for ordering alternative states of the
world. This fundamental theoretical distinction is currently referred to as ‘welfarism’ or
‘non welfarism’ as I summarise in Box 3.
29
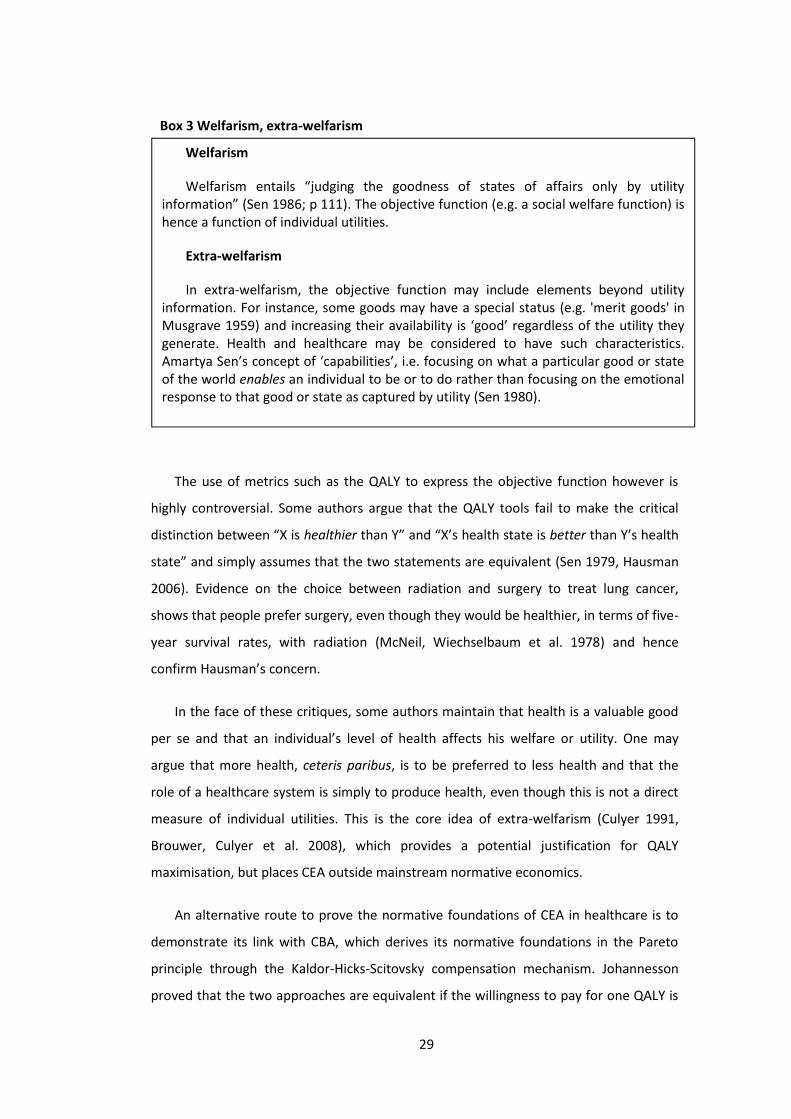
The use of metrics such as the QALY to express the objective function however is
highly controversial. Some authors argue that the QALY tools fail to make the critical
distinction between “X is healthier than Y” and “X’s health state is better than Y’s health
state” and simply assumes that the two statements are equivalent (Sen 1979, Hausman
2006). Evidence on the choice between radiation and surgery to treat lung cancer,
shows that people prefer surgery, even though they would be healthier, in terms of five-
year survival rates, with radiation (McNeil, Wiechselbaum et al. 1978) and hence
confirm Hausman’s concern.
In the face of these critiques, some authors maintain that health is a valuable good
per se and that an individual’s level of health affects his welfare or utility. One may
argue that more health, ceteris paribus, is to be preferred to less health and that the
role of a healthcare system is simply to produce health, even though this is not a direct
measure of individual utilities. This is the core idea of extra-welfarism (Culyer 1991,
Brouwer, Culyer et al. 2008), which provides a potential justification for QALY
maximisation, but places CEA outside mainstream normative economics.
An alternative route to prove the normative foundations of CEA in healthcare is to
demonstrate its link with CBA, which derives its normative foundations in the Pareto
principle through the Kaldor-Hicks-Scitovsky compensation mechanism. Johannesson
proved that the two approaches are equivalent if the willingness to pay for one QALY is
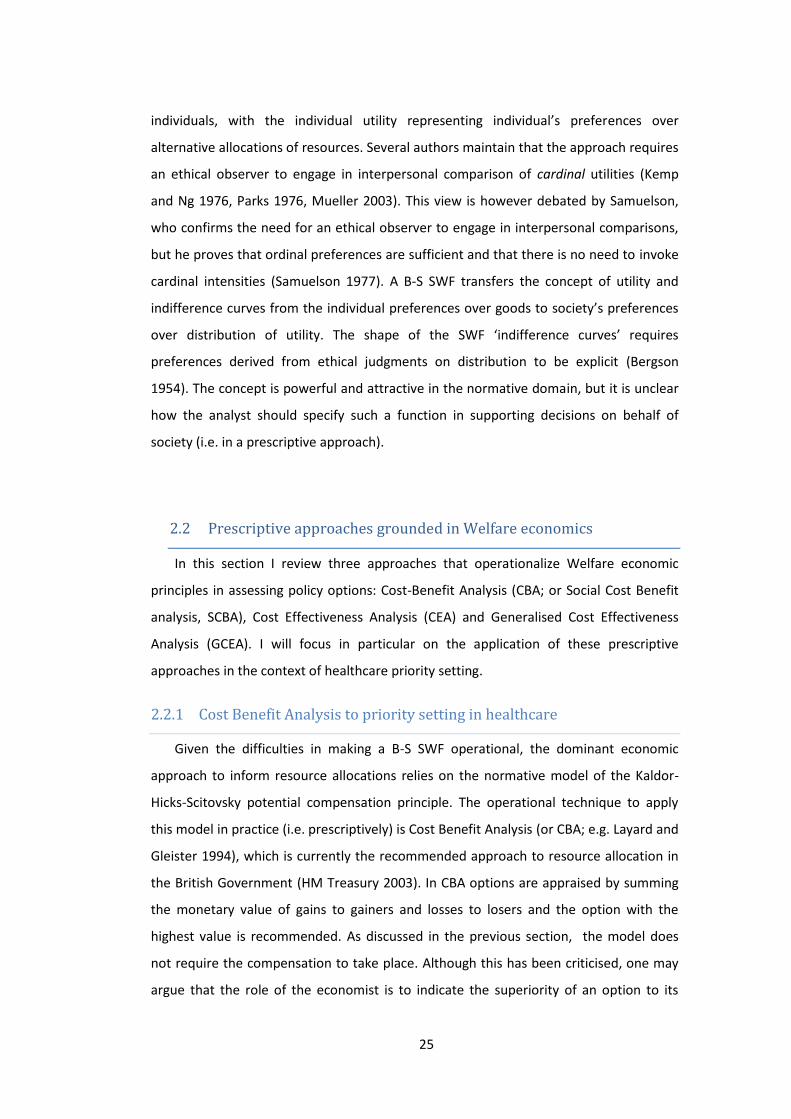
Box 3 Welfarism, extra-welfarism
Welfarism
Welfarism entails “judging the goodness of states of affairs only by utilityinformation” (Sen 1986; p 111). The objective function (e.g. a social welfare function) ishence a function of individual utilities.
Extra-welfarism
In extra-welfarism, the objective function may include elements beyond utilityinformation. For instance, some goods may have a special status (e.g. 'merit goods' inMusgrave 1959) and increasing their availability is ‘good’ regardless of the utility theygenerate. Health and healthcare may be considered to have such characteristics.Amartya Sen’s concept of ‘capabilities’, i.e. focusing on what a particular good or stateof the world enables an individual to be or to do rather than focusing on the emotionalresponse to that good or state as captured by utility (Sen 1980).
30
constant for all individuals in society (Johannesson 1995). This assumption has been
however challenged by Dolan and Edlin, who proved the impossibility of a link between
Cost Effectiveness and CBA if we assume (i) expected utility theory; (ii) QALYs as a
measure of individual utilities; (iii) illness affects the ability to enjoy consumption (Dolan
and Edlin 2002). In response to the argument of Dolan and Edlin, Hansen and her
colleagues claimed that the core issue is the aggregation of the benefit derived from
healthcare programmes (Hansen, Hougaard et al. 2004). They argue that CEA is a
constrained optimisation framework and its normative validity resides in how the
benefits are expressed and aggregated in the objective function. Given the impossibility
of making interpersonal comparison of utility directly, they advocate the use of CEA
within a Decision Making Approach: the analysis should “assist the decision-maker in
making choices that are consistent with his (that is, the decision-maker’s)
objective”(Sugden and Williams 1978; p235).
The Decision Making Approach can be attributed to Alan William’s reflections on the
essential core of microeconomics for supporting public decision making (Williams 1972,
Sugden 2007). In William’s view, this core is ‘constrained maximisation’, which requires
clarity on what should be maximised and on the constraints in operation. In this view,
the approach is value-free, in the sense that ethical judgments should not be assumed
by it. The technique is simply a tool to show the logical implications of particular
decisions given particular, stated objectives. In the Decision Making Approach the
ethical judgments are still necessary, but they are those of people responsible of making
a decision on the basis of the analysis (Williams 1972).
Reducing microeconomics (and hence welfare economics) to the essential core of
constrained maximisation as Williams’ did may be criticised as naïve, because the theory
of production is simplistic, especially in its application to the production of health
(Jacobs, Smith et al. 2006). Already in 1963, Kenneth Arrow pointed out that in
healthcare a market is unlikely to be efficient, in particular, for the information
asymmetry between patients, physicians and payers (Arrow 1963).
In William’s reflections, as well as those of other CEA proponents, the model should aid
and inform rather than prescribe a particular course of action (Culyer 1991, Williams
1991, Johannesson and Weinstein 1993, Gold, Siegel et al. 1996, Drummond, Sculpher et

31
al. 2005) and the failed experiment of the Oregon Health Plan in the 1990s is often
quoted to prove that a mechanistic use of CEA will face harsh rejection and lead to
counterintuitive results (Hadorn 1991). The constrained maximisation framework can be
an acceptable approximation. From a technical perspective it has been recognised that
the provision of healthcare is characterized by (partial) decomposability, i.e. most inputs
are predominantly used for a specific disease and type of patients, and it is hence
possible to envisage separate ‘product lines’ (Harris 1977). It is hence maintained that
the model could still offer useful insights to inform those responsible for allocating
resources and that the use of the normative model of welfare economics, although
imperfect, is a valuable guide to interpret results of CEA and to develop the tool further
(Garber, Weinstein et al. 1996). Within the Decision Making Approach, hence, the role of
the ‘decision makers’ is not simply that of defining the objectives and the constraints,
but also to interpret the results of a model to arrive at recommendations for policies.

32
2.2.4 Limitations of CEA2.2.4.1 The threshold problem
The formulation in Equation 1 is a conceptual framework which is used to structure
rather than conduct the analysis at the level of the system as a whole, because it would
be impracticable to specify all its parameters. In practice the analysis is conducted ‘at
the margin’, i.e. by assuming that the current allocation of resources is efficient and by
assessing the value of departing from the current allocation using ‘incremental cost-
effectiveness ratios’ (ICER). The ICER is calculated by comparing a new candidate
programme (e.g. a new pharmacological treatment or surgical procedure) with its
alternatives through pair-wise comparisons. Alternatives which are dominated (i.e. cost
more and produce less benefits compared to other options or their combination) are
excluded from the analysis. Non dominated alternatives are ranked according to
increasing costs (or, equivalently, benefits), and each alternative is evaluated compared
to the next in the rank order. The evaluation consists of taking the ratio of the difference
in costs and the difference in benefits of the two options. When benefits are measured
in QALYs, the ratio is simply referred to as “cost per QALY” (or “cost/QALY”). A ‘low’
ratio indicates that each additional £1 invested to provide the more expensive
interventions, provides a relatively ‘high’ additional benefit and it is hence ‘good value
for money’. In this approach, it is clearly necessary to specify a critical value under which
the ICER signals good value for money.
The critical value of the ICER, in terms of problem represented in Equation 1, is the
Lagrangean multiplier associated with the budget constraint, i.e. programmes could be
ranked according to their ICER, from lowest to highest, and funded according to this
order. The ICER of the last affordable project would hence be the critical value of the
ICER or, simply, the ‘critical ratio’ (Johannesson and Weinstein 1993, Stinnett and Paltiel
1996).
It is not feasible, however, to specify Equation 1 fully in practice, because it is
beyond the capacities of analysts to identify all current and possible interventions (or
portfolios of interventions), their costs and health consequences. The representation of
the problem as in Equation 1 is indeed an instance of the rationalistic approach of

33
‘rational comprehensive planning’, which cannot be implemented in decision-making
(Lindblom 1959, Etzioni 1967, Ackoff 1979).
The inability to specify Equation 1 exhaustively implies that the critical ratio cannot
be derived mathematically. This is particularly problematic for bodies such as the
National Institute for Health and Clinical Excellence (NICE) in England, which routinely
uses the tool of CEA and cost/QALY estimates to issue national recommendations
prescribing the provision of new intervention. NICE tends to recommend the provision
of most interventions below a critical ratio of about £30,000 (Devlin and Parkin 2004),
but the rationale of this ratio is unclear.
It is argued that the ratio could represent the willingness to pay of the English public
for a QALY, but this has not been proved (although recent attempts to assess its value
made progress in this direction and produced preliminary estimates between £20,000
and £70,000 pounds; Mason, Jones-Lee et al. 2009). Furthermore, it is not clear if the
current funding of the National Health Service is adequate to finance all interventions
recommended by NICE or if its recommendations are crowding out more cost-effective
interventions currently funded (Iqbal, Price et al. 2006, Martin, Rice et al. 2008, Appleby,
Devlin et al. 2009).
2.2.4.2 Accessibility and acceptability concerns
The National Institute for Health and Clinical Excellence (NICE) in England is a
notable example of the success of CEA to inform resource allocation in practice. NICE
was set up in 1999 to ensure homogeneity of healthcare provision for equal need across
the country. Bryan and colleagues recently investigated the ability of NICE to inform and
influence policy and found that CEA is used systematically to support the Institute’s
recommendation and that, over time, members of the appraisal committee have
developed technical skills to interpret the analysis with more confidence (Bryan,
Williams et al. 2007). The QALY metric is praised for offering a common unit of
measurement across different interventions and for combining both length and quality
of life.
At the same time, however, members of the committee highlighted issues with the
accessibility and the acceptability of CEA (Bryan, Williams et al. 2007, Williams and Bryan
34
2007). In terms of accessibility, the details of CEA models are difficult to understand
even for NICE committee members who are national clinical experts. Committee
members lament that results are presented in a very technical format, making the
interpretation difficult. In terms of acceptability, the QALY metric, although valuable,
fails to capture some relevant criteria in practical applications (e.g. the irreversibility of a
condition). Also, perceived problems with CEA are its failure to consider the opportunity
cost explicitly (i.e. the health benefits which are forgone by funding the intervention
under investigation rather than an alternative intervention and could hence be crowding
out more cost effective, yet not assessed, interventions), and that other criteria, such as
equity, are taken into account informally and hence it is not clear if this is done in a
consistent way for all recommendations. Based on the analysis, Bryan and colleagues
recommend to CEA analysts to provide information which (i) is seen as relevant by end-
users; (ii) is appropriate for the decision at hand, taking into account contextual factors;
(iii) can inform implementation in a complex decision making environment.
The problem of ignoring opportunity cost and of crowding out has also been
highlighted with respect to the work of NICE by health economists (Birch and Gafni
1992, Donaldson, Currie et al. 2002, Gafni and Birch 2006, Birch and Gafni 2007). By
using a critical value of £30,000 per QALY (although it is acknowledged that this is not
done mechanistically), NICE is in fact assuming that the NHS will finance the mandatory
recommendations by disinvesting from interventions with a higher cost/QALY. This
assumption has however no empirical validation (Iqbal, Price et al. 2006, Martin, Rice et
al. 2008, Appleby, Devlin et al. 2009) and it is hence not clear if NICE is forcing the NHS
to disinvest from interventions which are in fact more cost effective.
The analysis of the use of CEA to inform resource allocation at local level shows an
even more disappointing picture (Ross 1995, Drummond, Cooke et al. 1997, Sloan,
Whetten-Goldstein et al. 1997, Bryan and Brown 1998, Duthie, Trueman et al. 1999,
Drummond and Weatherly 2000, Kernick 2000, von der Schulenburg 2000, Eddama and
Coast 2008). This evidence indicates that CEA is not used locally because efficiency is not
the only relevant criterion, there is a lack of expertise to interpret and understand the
results, that analyses are based on poor data and are not timely, the conclusions from
the analysis are often not actionable because models take a long term perspective but

35
the organisations tasked to implement CEA recommendations have short term financial
constraints and are not able to free up the necessary financial or managerial resources.2.2.5 Generalised Cost-Effectiveness AnalysisGeneralised Cost Effectiveness Analysis (GCEA) is an approach proposed by the
World Health Organisation (WHO; Hutubessy, Chisholm et al. 2003, Hutubessy,
Baltussen et al. 2003). The approach aims to overcome economic criticism to the WHO
and World Bank work on the Global Burden of Disease (GBoD). GBoD reports assess the
extent of ill health for world regions (World Health Organization 1990, Murray, Vos et al.
2012) measured in Disability Adjusted Life Years (DALYs). DALYs and the Burden of
Disease work attracted much criticism in the past because they neither consider the
impact of intervention on reducing the Burden of Disease, nor the costs of these
interventions (Anand and Hanson 1997, Williams 1999, Bevan and Hollinghurst 2003). In
order to set priorities for resource allocation, however, it is necessary to focus on
interventions, their benefits and their costs. The fact that there is a massive Burden of
Disease associated with a particular condition does not justify, per se, investing large
amounts of resources in tackling the burden because there might not exist effective
interventions or, if they exist, they may be too costly (Hollinghurst, Bevan et al. 2000).
GCEA assesses both the costs and benefits from interventions (in ‘averted DALYs) and
hence tackles these criticisms as I explain in detail below.
GCEA is based on the general constrained optimisation problem outlined in Equation
1. In contrast to CEA, however, its proponents emphasise the need to show the scale of
benefits and costs from implementing specific interventions. In GCEA the objective
function and the budget constraint are modelled explicitly in order to confront those
responsible for allocating resource with the opportunity cost of their recommendations
(Hutubessy, Chisholm et al. 2003, Tan-Torres Edejer, Baltussen et al. 2003). In practice,
GCEA is not conducted for the overall healthcare budget and the set of all possible
interventions which the healthcare planner may consider. The base of the analyses
conducted to date is the disease (results are available online at
http://www.who.int/choice/interventions/en/ for nineteen different diseases and
fourteen country areas): a disease model to simulate a prevalent and incident
population produces estimates of the current Burden of Disease (BoD) measured in
Disability Adjusted Life Years or DALY (World Bank 1993, Murray 1996, Murray, Vos et al.
36
2012), interventions to prevent or treat the disease are then modelled in isolation and in
combination to estimate the avoidable DALY and the costs of providing the intervention
at the population level (e.g. a country or a region). GCEA ranks interventions according
to their ICER (the cost per DALY averted).
GCEA proponents highlight that the key difference of their approach compared to
the standard cost per QALY is not the use of the DALY metric and indeed they admit
QALY as a valid substitute (Tan-Torres Edejer, Baltussen et al. 2003, p 65). The value of
the GCEA is that results are explicitly presented in terms of the benefits and costs at the
population level as well as in terms of ICER and hence facilitate those responsible for
allocating resources to integrate the analysis with other concerns. In particular, health
planners will be interested in achieving other goals such as health equity and system
responsiveness (Hutubessy, Chisholm et al. 2003), or may need to take into account
other constraints, such as managerial and ministerial attention (Murray and Lopez
2000).
There seem to be opportunities for the GCEA model to contribute to the further
development of the cost per QALY framework because of the recognised limitation in
the normative foundation of CEA and the emphasis in the role of the analysis to provide
a systematic framework and a language for an informed discussion. To facilitate the
discussion, the analysis should be complemented with transparent information about
the costs and consequences of alternative policies (Mauskopf, Paul et al. 1998, Kernick
2000, Cooper, Brailsford et al. 2006, Williams and Bryan 2007). An example of the
readiness of CEA proponents to size up benefits and costs at the population level is the
latest guidance to CEA for technology appraisals issued by NICE, which states that “an
estimate of the resulting health impact (for example, QALYs or life-years gained) in a
given population should ideally be attempted” (National Institute for Health and Clinical
Excellence 2008, p 50) and the costing tools which routinely accompany all new NICE
recommendation to estimate their costing implications for different geographical
locations.2.2.6 Limitations of GCEAThe limitations I identified for CEA also apply to GCEA. Contrary to CEA, the
generalised approach admits openly that health benefits could be aggregated across
37
individuals. The results of the analysis are hence presented at the population level. This
is done implicitly in CEA through the ‘a QALY is a QALY is a QALY’, that is the principle
that a unit of benefit (one QALY) is worth the same regardless of who receives it, and
the implicit assumption of constant returns of scale in health technologies. These two
principles allow CEA analysts to present estimates for the ‘average’ patient and yet
make recommendations for allocating budgets over a population because the benefit to
the ‘average’ patient can hence be multiplied by the number of patients.
2.3 The normative framework of Multi-Criteria Decision Analysis2.3.1 Basic ideaMulti criteria Decision Analysis (MCDA) has been an active area of study among
operational researchers since the 1960s. MCDA considers the problem of assessing
alternative states of the world (e.g. the consequences of alternative courses of action) in
terms of conflicting objectives or criteria.
The term covers an umbrella of techniques such as data envelopment analysis
(DEA), outranking, goal programming, multi attribute utility theory (MAUT) and multi
attribute value theory (MAVT). In this section I will focus in particular on MAUT and
MAVT, which are reference frameworks for Programme Budgeting and Marginal
Analysis, a widely used prescriptive approach to support healthcare priority setting.
The fundamental text which defined the standards of MAUT and MAVT is Keeney
and Raiffa’s book on ‘Decisions with Multiple Objectives’ (Keeney and Raiffa 1976).
These standards consist of logically coherent procedures for representing preferences
and value trade-offs over conflicting objectives under conditions of certainty (in the
case of MAVT) or uncertainty (in the case of MAUT).
The theoretical basis of MAVT and MAUT is that of measurement theories of value
(Suppes and Zinnes 1963, Krantz, Luce et al. 1971) and utility (von Neumann and

38
Morgenstern 1944, Savage 1954). A particular contribution to the normative
foundations of MAVT is Dyer and Sarin’s theory of measurable multi-attribute value
function (Dyer and Sarin 1979), which provides the conditions for ordering the
differences in strength of preferences among pairs of alternatives.
Decision analysis is ‘value-free’ in the sense that the objectives and constraints
represented in a model should reflect the objectives and constraints of a ‘decision
maker’. The underpinning philosophy of decision analysis is very similar to that of the
Decision Making Approach in health economics.2.3.2 Additive and multiplicative utility and value modelsMAUT and MAVT models represent the preferences and value judgments of
decision-makers through two primary components: preferences in terms of each
individual criterion and an aggregation model. The most used aggregation models are
additive or multiplicative. Their typical formulation for MAUT is provided in Equation 2
and Equation 3 below, respectively. The formulation for MAVT is similar, but
preferences are represented by utility functions v in place of value functions u.
Equation 2
m
iii auwau
1
)()(
Equation 3
m
i
wi
iauau1
)]([)(
In these equations, a is an alternative and u(a) a number that represents the ‘utility’
of such alternative, such that u(a)>u(b) if and only if a is preferred to b - and u(a)=u(b) if
and only if there is indifference between a and b; preferences are expressed in terms of
m criteria indexed by i[1,m]; ui(a) is the partial utility function that represents
preferences between alternatives in terms of criterion i; and wi is the weight that
captures the relative importance of criterion i and hence the value trade-off.
39
The choice between an additive and a multiplicative model depends on the
characteristics of the multiple attributes. For the purpose of this dissertation, I
emphasise the need for assuming preferential (or utility) independence of the criteria. In
MAUT this assumption requires indifference between acts with identical marginal
(single-attribute) probability distributions (Keeney and Raiffa 1976, von Winterfeldt and
Edwards 1986). Keeney and Raiffa (p 226) propose a simple test to verify preferential
independence in the case of two attributes Y and Z. Let us denote a point in the bi-
attribute space as (y,z), where y0yy* and z0zz. Let us now fix z to z0 and consider
a 50-50 gamble between (y1, z0) and (y2,z0). Let us suppose that the certain equivalent
for that gamble is ŷ. Will the certain equivalent change, if we fix z to a different level, say
z’? If not, and if this condition holds for any fixed y1 and y2, then the attribute Y is utility
independent of attribute Z.
Utility independence is a necessary assumption for representing preferences with an
additive multi-attribute utility function (Fishburn 1965). Similarly, preferential
independence is a necessary condition for representing preferences with an additive
value function (Dyer and Sarin 1979). If utility or preferential independence does not
hold, it is necessary to use a different functional form to aggregate utilities or values
over attributes, for instance a multiplicative function (or more complex functions).
2.4 Prescriptive frameworks drawing on MCDAThere are several ad-hoc priority setting decision-aids which appear to draw on
MCDA, and in particular MAUT or MAVT. The most notable example is Programme
Budgeting and Marginal Analysis (PBMA), which I will discuss in more detail below. Many
of these tools have been developed by consulting firms. An unpublished review
conducted by Nigel Edwards in 2011 for the Health Foundation identified several ‘multi-
criteria’ tools in use in England, such as the HELP tool by Matrix knowledge
(http://help.matrixknowledge.com), Prioritise with Care by PriceWaterhouseCoopers, as
well as other proprietary tools developed by McKinsey & Co and United Healthcare
(Nigel Edwards, personal communication). Edwards’ review points out that most of
these tools are very limited in uptake, with the exception of PBMA.
40
2.4.1 Programme Budgeting and marginal Analysis (PBMA)PBMA is a pragmatic approach to aid local decision makers (Mitton and Donaldson
2004). PBMA has been used over the past thirty years (Mitton and Donaldson 2001). In
practice PBMA covers a variety of different practices, with a similar process but different
formulae to evaluate alternatives quantitatively.
PBMA follows the Decision Making Approach philosophy in the sense that the
process is deliberative and engages local key stakeholders in a systematic process to
formulate their objectives, their options and to explore the value of alternative policies.
This is accomplished through several steps: to determine the aim and scope of the
analysis, to identify where resources are currently spent, to form a panel of decision
makers including local stakeholders, to determine locally relevant criteria for decision-
making, to identify options for investment and disinvestment, to assess options against
the set criteria, to validate results and recommend resource re-allocation (Mitton,
Patten et al. 2003).
The concepts of ‘marginal analysis’ and ‘opportunity cost’ are central to PBMA.
‘Marginal analysis’ consists in focusing on decisions ‘at the margin’, i.e. in considering
initiatives for funding additional interventions, it is necessary to identify disinvestments
from current activities in order to release the necessary financial resources. It is hence
an ‘incremental’ approach, rather than a ‘rational comprehensive approach’. The
concept of ‘opportunity cost’ is related to that of ‘marginal analysis’ in that participants
in a PBMA exercise compare the costs and benefits of introducing a new interventions
from a ‘wish list’ to the forgone costs and benefits of discontinuing interventions from a
‘disinvestment list’ (Kemp, Fordham et al. 2008). This is in stark contrast to the
mainstream approach of CEA, in which, as we discussed above, the opportunity cost is
not explicitly considered (Donaldson, Currie et al. 2002).
The quantitative assessment of the benefits of the proposed options consists in
generating a multi-attribute benefit score. Those responsible for allocating resources
generate a list of criteria that are locally relevant. To combine the different criteria in an
overall benefit score, PBMA proponents recommend to use multi-attribute utility
functions (Peacock, Richardson et al. 2007, Peacock, Mitton et al. 2010).
41
The deliberative nature of the approach and the systematic consideration of
additional criteria have potential for tackling the acceptability challenges of CEA. A
recent systematic assessment of PBMA in England confirms this (Kemp, Fordham et al.
2008). The evaluation by Kemp and colleagues highlights that participants appreciated
the ability to incorporate multidisciplinary inputs in a transparent, objective and
systematic process; it enabled them to focus on health gain, and it was possible to use
available information, although imperfect, to generate an overall benefit score which
participants could use as a basis for the discussion.2.4.2 Limitations of PBMAThe PBMA literature provides a clear description of the process in terms of
facilitating a structured discussion and in terms of particular steps that should be
accomplished. Contrary to CEA, however, there is relatively little guidance and
discussion on choosing a particular form for the quantitative multi-attribute utility or
value function (Wilson, Rees et al. 2006, Peacock, Richardson et al. 2007).
Many papers reporting applications of PBMA do not provide details of the
quantitative assessment. In part this is justifiable because these value functions are
defined ad-hoc by local stakeholders and they are hence not generalisable. By reviewing
the literature, I identified eight papers or reports which indicate the set of criteria used
and provide some details on the form of the value function. These are summarised in
Table 1. As expected, the set of criteria and value function vary in each case.
The ad-hoc definition of the set of criteria and the value function poses a challenge
to the application of PBMA, because the normative validity of the chosen value function
ought to be verified every time.
In reviewing the criteria and value function reported in Table 1, it is possible to
identify violation of normative principles of (multi-criteria) decision analysis. For
instance, Mitton, Patten et al. (2003) and Tony, Wagner et al (2011) suggest scoring
proposed interventions against multiple criteria, taking a weighted sum of the scores
(with higher weights for more important criteria), and ranking interventions from the
highest to the lowest overall score to determine priorities for funding. There are two
violations of recommended MCDA practice. First, the weighting procedure of asking

42
direct importance weights has been discredited in favour of ‘swing weights’(Edwards
and Barron 1994). Questions of direct importance weights are poorly defined and open
to different interpretation. On the contrary, ‘swing weights’ are scaling factors to
discriminate the extent to which scores assigned to a particular criterion discriminate
between alternatives (Belton and Stewart 2002). Second, in the context of resource
allocation the MCDA literature clearly recommends ranking alternatives according to
their cost-effectiveness, defined as the ratio between a (multi-criteria) benefit score and
costs (Goodwin and Wright 2004, Kleinmuntz 2007). Instead, Mitton, Patten et al.
(2003) and Tony, Wagner et al (2011) include cost-effectiveness as one of the five
criteria of an additive value function.
Peacock, Richardson et al (2007) and Wilson, Peacock et al. (2008) challenge the
PBMA community to be more open in discussing the choice of particular value function
in order to build academic and professional consensus on issues of normative validity on
one hand, and to offer clearer practical tools to practitioners. I did a bibliographic search
of all the publications which cited Peacock, Richardson et al (2007) and Wilson, Peacock
et al (2008). Out of the 15 referencing papers I found and reviewed, only one discusses
the normative validity of multiattribute value functions in models to support healthcare
priority setting decisions (Thokala and Duenas 2012). This paper concludes that the
technique is insufficiently developed to grant its wider adoption. Other authors have
attacked PBMA-like approaches contending that the apparent simplicity of a scoring and
weighting procedure gives an illusion of transparency, but in facts obfuscates the
decision at hand (Mullen 2004).
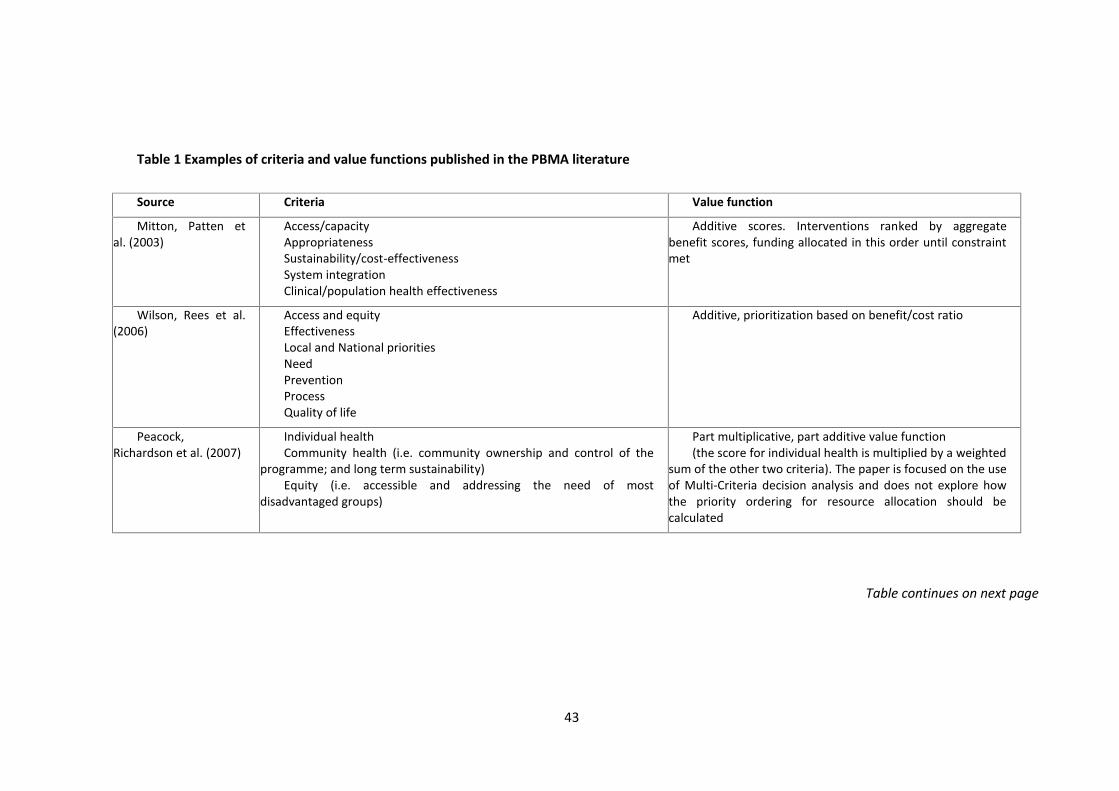
43
Table 1 Examples of criteria and value functions published in the PBMA literature
Source Criteria Value function
Mitton, Patten etal. (2003)
Access/capacityAppropriatenessSustainability/cost-effectivenessSystem integrationClinical/population health effectiveness
Additive scores. Interventions ranked by aggregatebenefit scores, funding allocated in this order until constraintmet
Wilson, Rees et al.(2006)
Access and equityEffectivenessLocal and National prioritiesNeedPreventionProcessQuality of life
Additive, prioritization based on benefit/cost ratio
Peacock,Richardson et al. (2007)
Individual healthCommunity health (i.e. community ownership and control of the
programme; and long term sustainability)Equity (i.e. accessible and addressing the need of most
disadvantaged groups)
Part multiplicative, part additive value function(the score for individual health is multiplied by a weighted
sum of the other two criteria). The paper is focused on the useof Multi-Criteria decision analysis and does not explore howthe priority ordering for resource allocation should becalculated
Table continues on next page
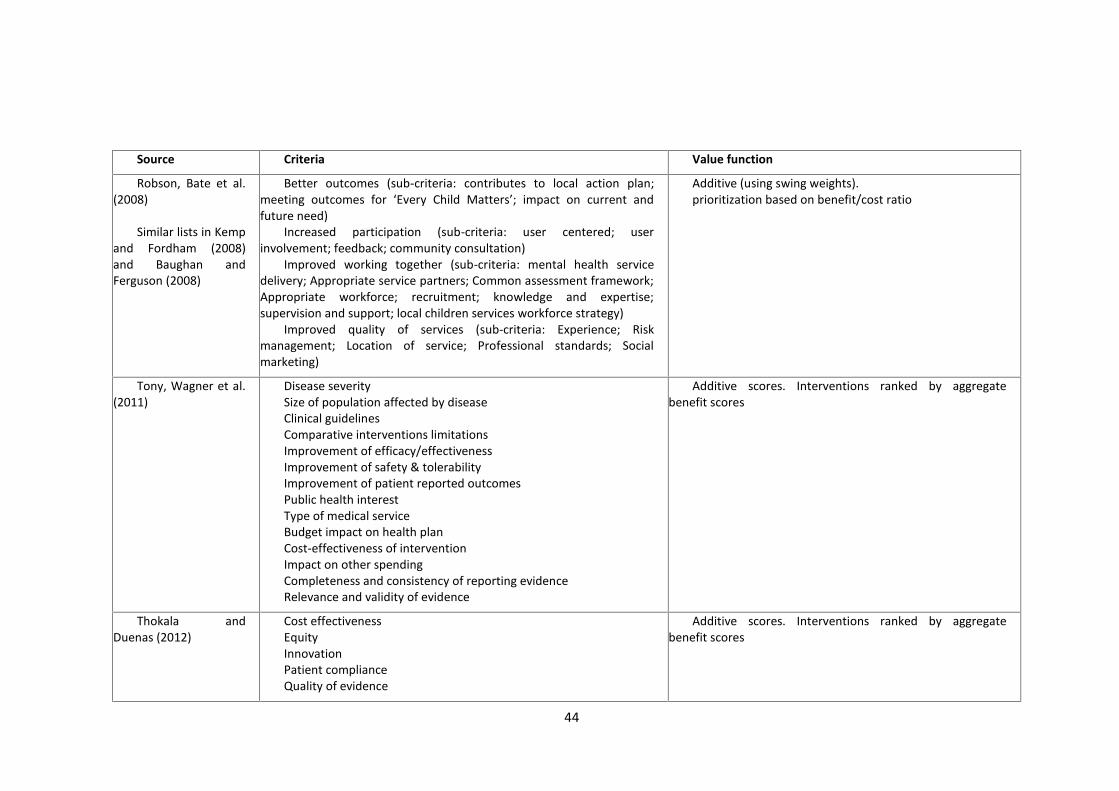
44
Source Criteria Value function
Robson, Bate et al.(2008)
Similar lists in Kempand Fordham (2008)and Baughan andFerguson (2008)
Better outcomes (sub-criteria: contributes to local action plan;meeting outcomes for ‘Every Child Matters’; impact on current andfuture need)
Increased participation (sub-criteria: user centered; userinvolvement; feedback; community consultation)
Improved working together (sub-criteria: mental health servicedelivery; Appropriate service partners; Common assessment framework;Appropriate workforce; recruitment; knowledge and expertise;supervision and support; local children services workforce strategy)
Improved quality of services (sub-criteria: Experience; Riskmanagement; Location of service; Professional standards; Socialmarketing)
Additive (using swing weights).prioritization based on benefit/cost ratio
Tony, Wagner et al.(2011)
Disease severitySize of population affected by diseaseClinical guidelinesComparative interventions limitationsImprovement of efficacy/effectivenessImprovement of safety & tolerabilityImprovement of patient reported outcomesPublic health interestType of medical serviceBudget impact on health planCost-effectiveness of interventionImpact on other spendingCompleteness and consistency of reporting evidenceRelevance and validity of evidence
Additive scores. Interventions ranked by aggregatebenefit scores
Thokala andDuenas (2012)
Cost effectivenessEquityInnovationPatient complianceQuality of evidence
Additive scores. Interventions ranked by aggregatebenefit scores
45
2.5 SummaryIn this dissertation I adopt the distinction between normative, prescriptive and
descriptive approaches in decision making research. I identify two normative
approaches for informing healthcare priority setting decisions, which are welfare
economics and multi-criteria decision analysis.
Welfare economics is the dominant framework for health economists. The
prescriptive approaches which attempt to operationalise the welfare economic
framework in healthcare priority setting are cost benefit analysis (CBA), cost
effectiveness analysis (CEA), generalised cost effectiveness analysis (GCEA).
Among the techniques which draw from welfare economics, CEA has been
particularly influential through the work of the National Institute for Health and Clinical
Excellence (NICE). NICE’s work has stimulated a rich academic literature to develop CEA
techniques which adhere as much as possible to the underlying theoretical framework
of welfare economics. To maintain the theoretical robustness, it is however necessary to
use a threshold value of cost-effectiveness, over which there is no consensus and no
sound basis for choosing. CEA is also of little practical value for local planners who do
not have the necessary resources. Furthermore, even available reports also have limited
use because they are difficult to understand for non health-economists.
Some health economists have proposed a more pragmatic approach which uses the
economic principles of marginal analysis and opportunity cost, i.e. Programme
Budgeting and Marginal Analysis (PBMA). PBMA helps to assess the value of alternative
uses of resources against multiple criteria by engaging some of the local stakeholders.
Multi-criteria decision analysis is the normative reference framework for PBMA.
A particular advantage of PBMA is that its use encourages those responsible for
allocating healthcare resources to discuss openly the opportunity cost of their
recommendations. The assessment is also based on locally relevant criteria through
MCDA. The application of normative MCDA principles is however under-developed.
Practitioners use ad-hoc evaluation procedures that are not consistent with theory and
there has been little discussion of the theoretical validity of alternative value functions.
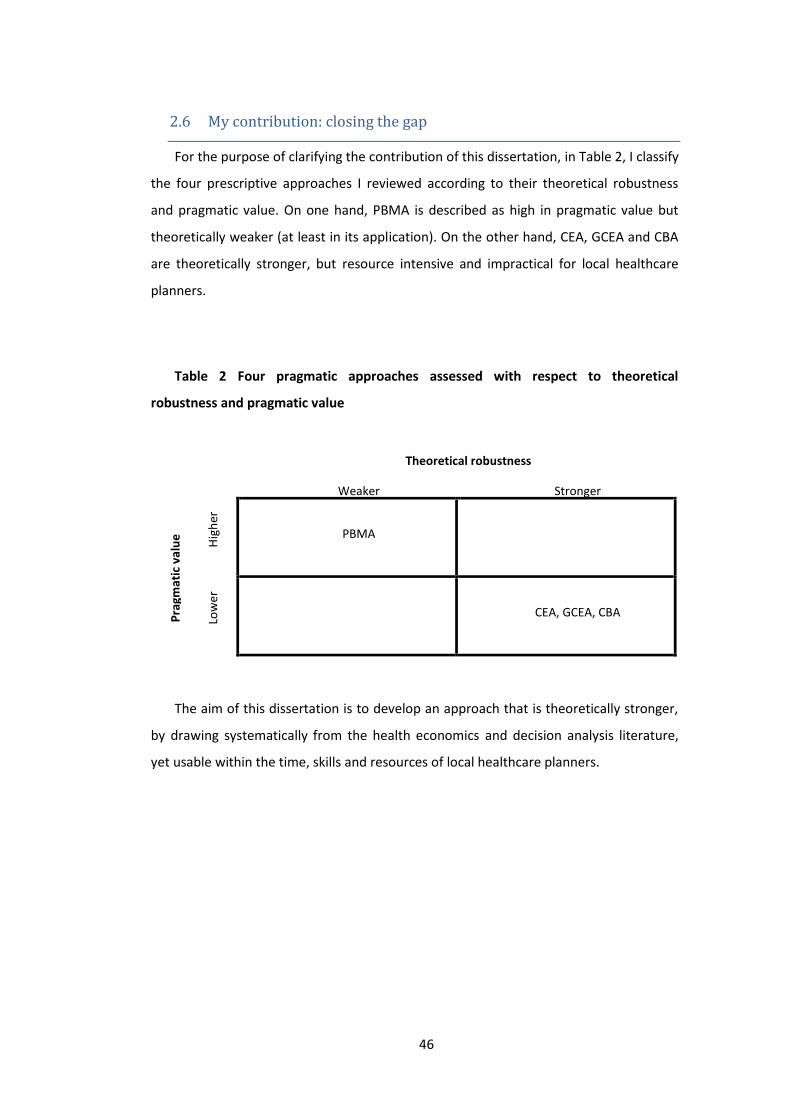
46
2.6 My contribution: closing the gapFor the purpose of clarifying the contribution of this dissertation, in Table 2, I classify
the four prescriptive approaches I reviewed according to their theoretical robustness
and pragmatic value. On one hand, PBMA is described as high in pragmatic value but
theoretically weaker (at least in its application). On the other hand, CEA, GCEA and CBA
are theoretically stronger, but resource intensive and impractical for local healthcare
planners.
Table 2 Four pragmatic approaches assessed with respect to theoretical
robustness and pragmatic value
Theoretical robustness
Weaker Stronger
Prag
mat
ic v
alue Hi
gher
PBMA
Low
er
CEA, GCEA, CBA
The aim of this dissertation is to develop an approach that is theoretically stronger,
by drawing systematically from the health economics and decision analysis literature,
yet usable within the time, skills and resources of local healthcare planners.

47
3 Adjusting life for quality or disability: stylistic difference or
substantial dispute?1
This chapter has been published as: M Airoldi and A Morton (2009) Adjusting life for
quality or disability: stylistic difference or substantial dispute? Health Economics, 18(11):
1237-1247. The International Society for Pharmacoeconomics and Outcome research
(ISPOR) awarded this paper for excellence in methodology in 2010.
Abstract
This paper focuses on the contrast between describing health benefits
from the point of view of health gains (QALY-type ideas) and disability
reduction (DALY-type ideas). The background is an apparent convergence
in practice of the work conducted under both traditions: DALY-based
approaches have evolved by focussing on cost-effectiveness of
interventions and by considering age weighting a discretionary feature; at
the same time, recent developments have seen mainstream economic
approaches increasingly used in conjunction with population-based models
of disease. In the light of these methodological developments, we contrast
a health planner who wants to maximize health and one who wants to
minimize disability. Assuming consistent health and disability weights we
find that interventions will be ranked in a systematically different way. The
difference, however, is not determined by the use of a health or a disability
perspective but by the use of life expectancy tables to determine years of
life lost. We show that this feature of the DALY method is problematic and
1 The authors wish to thank the attendees at a presentation of two predecessor ofthis paper at the Health Economists’ Study Group in Birmingham and Brunel Universityin 2007. Particular thanks go to Aki Tsuchiya, whose discussion provoked a fundamentalreconsideration of the core argument and to Penny Mullen for drawing our attention onthe original work of Fanshel and Bush. We are also grateful to John Howard for helpingus with the analysis in the Appendix, Gwyn Bevan, Julia Fox-Rushby and QQUIP VFMteam for helpful discussions and to the Health Foundation for financial support (grant1710/4226)

48
we suggest its dismissal in favour of a fixed reference age rendering the use
of a health or a disability perspective merely stylistic.
3.1 IntroductionOne of the most obtrusive and least discussed differences between the QALY
(Weinstein and Stason, 1977, Williams, 1985, Drummond et al., 2005) and the DALY
approach (World Bank, 1993, Tan-Torres Edejer et al., 2003) is the description of health
status using years of life lived adjusted for ‘health’ versus years of life lost adjusted for
‘disability’. It is not clear whether this difference is essentially presentational or whether
it reflects some fundamental dispute about what is at stake.
In their early development the difference was presentational. Fanshel and Bush
(1970), in particular, proposed an operational definition for health to measure changes
in the population health status over time that could capture both mortality and
morbidity to inform health planners. They define being ‘healthy’ as being in a functional
state or, equivalently, in a dysfunction-free one and they proposed the amount of time
spent in that state to measure health.
Within the health economics community, the health perspective has been the major
focus of attention, with much applied work based on Cost-Utility analysis using the QALY
concept and approaches to prioritisation such as cost-per-QALY league tables.
On the contrary, a disability perspective has been favoured in the Global Burden of
Disease approach (World Bank 1993) and its successor, Generalised Cost-Effectiveness
(GCEA) promulgated by the World Health Organisation (Tan-Torres Edejer, Baltussen et
al. 2003). The original Global Burden of Disease (GBoD) project attempted to map out
the extent of disability attributable to disease throughout the world using DALY. These
studies attracted critical commentary in the health economic literature (Anand and
Hanson 1997, Williams 1999, Mooney and Wiseman 2000, Bevan and Hollinghurst 2003)
which has in turn drawn robust responses from the framers of the Global Burden of
Disease studies (Murray and Acharya 1997, Murray and Lopez 2000).

49
One of the primary criticisms of the Global Burden of Disease (GBoD) project from
an economic point of view was that it encouraged decision makers to focus on diseases
rather than interventions, and to decide on priorities without reference to cost. This
interpretation has been disputed by Murray and Lopez (1997). However, the most
recent incarnation of the WHO approach, GCEA (Tan-Torres Edejer, Baltussen et al.
2003), does address both these points, recommending an approach to prioritisation
based on cost-effectiveness league tables, where costs are financial inputs, and benefits
are reductions in disability, measured in DALYs. Age-weighting, another controversial
feature of the method, has been soft-pedalled in subsequent implementations, and is
currently presented as a discretionary, rather than a core, feature.
At the same time, a central motivation for the GBoD programme was a perceived
lack of interest within the economic paradigm in the assessment of population need and
epidemiological modelling generally (Hollinghurst, Bevan et al. 2000). How far this was
ever true is contestable, but it certainly seems to be less true now than ever. For
example, a high profile policy document, the Depression Report (Centre for Economic
Performance's Mental Health Policy Group 2006), has recently argued for a large and
innovative expansion in the provision of mental health services based on a combination
of economic modelling and epidemiological evidence (including the GBoD studies); and
renewed emphasis on the finiteness of the NHS budget (Maynard, Bloor et al. 2004) has
led NICE to develop population-based costing tools to support NHS organisations to
quantify the impact of NICE guidelines on their finances (National Institute for Health
and Clinical Excellence 2006). Moreover, current policy developments such as the
increasing focus on NHS productivity (Dawson, Gravelle et al. 2005, Department of
Health 2005) suggest sizing up gains in health at the population level will become more,
rather than less necessary in years to come.
There may, then, be greater commonality between what may be summarily referred
to as the DALY and QALY approaches than may have been the case in previous years.
This is not to say that either approach is uncontroversial. Philosophically, both
approaches are open to objections on the grounds that they are not consistent with
ethical intuitions such as the rule of rescue (Mooney and Wiseman 2000). Nor are such
approaches in general compatible with conventional welfare economics (Garber,
Weinstein et al. 1996). This is not so much a weakness of the approaches, but simply a
50
reminder of the difficulty of achieving a consensus on the principles which should guide
policy when life and death are at stake.
Such controversies notwithstanding, it is now clear that the approaches of the WHO
have fallen on fertile ground, both in Ministries of Health around the world, and in the
global health community (e.g. Melse, Essink-Bot et al. 2000, Fox-Rushby 2002,
Hutubessy, Chisholm et al. 2003, Andrews, Issakidis et al. 2004, Chisholm 2005). At the
same time, utilisation of the more familiar (in the health economics context) tools of
QALY-based cost-effectiveness analysis (Gold, Siegel et al. 1996, Drummond, Sculpher et
al. 2005) has also grown apace, particularly in Health Technology Assessment centres,
like NICE in the UK. This leaves government planners in an awkward situation, with
similar-yet-different approaches being applied to similar-yet-different problems in
different countries (and sometimes in the same country).
Gold, Stephenson and Fryback (2002) and Bevan and Hollinghurst (2003), among
others, have surveyed the differences between the QALY and DALY approaches, and the
reader is referred to their papers for alternative discussions of the differences between
these two traditions. As discussed above, however, as of 2007, many of these
distinctions do not seem as sharp as they may have done a few years ago. In this paper
we discuss whether in the light of these developments the use of a health or a disability
perspective to inform healthcare planners is merely of a stylistic nature.
3.2 Health versus DisabilityDisability is defined against a normative benchmark, typically a life of a given
duration in full health, although conceptually more complex benchmarks could be
envisaged (e.g. a lifecourse which involves a particular pattern of progressive
degradation in health over time).
This notion of disability seems to have considerable appeal for those trained in
public health and epidemiology, disciplines for which the natural unit of analysis is the
disease. As propounded by the WHO, the DALY concept originates in an attempt to
supplement a commonly used measure of this health deficit attributable to diseases,
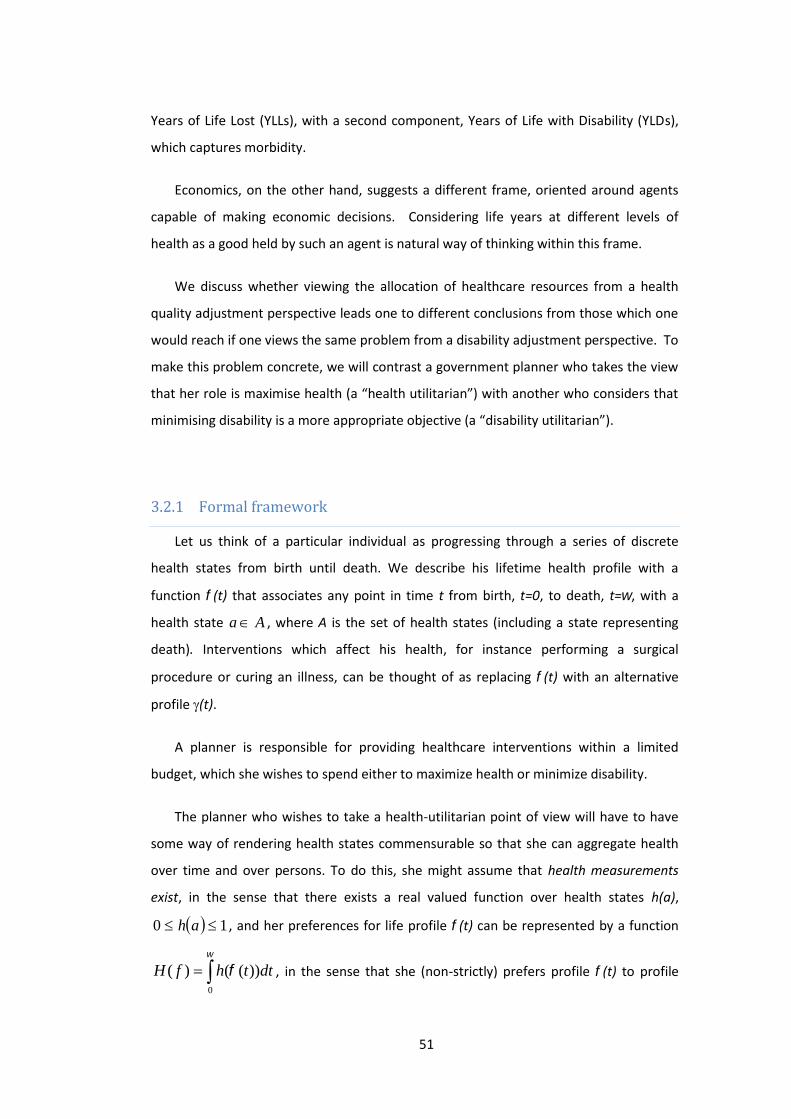
51
Years of Life Lost (YLLs), with a second component, Years of Life with Disability (YLDs),
which captures morbidity.
Economics, on the other hand, suggests a different frame, oriented around agents
capable of making economic decisions. Considering life years at different levels of
health as a good held by such an agent is natural way of thinking within this frame.
We discuss whether viewing the allocation of healthcare resources from a health
quality adjustment perspective leads one to different conclusions from those which one
would reach if one views the same problem from a disability adjustment perspective. To
make this problem concrete, we will contrast a government planner who takes the view
that her role is maximise health (a “health utilitarian”) with another who considers that
minimising disability is a more appropriate objective (a “disability utilitarian”).
3.2.1 Formal frameworkLet us think of a particular individual as progressing through a series of discrete
health states from birth until death. We describe his lifetime health profile with a
function (t) that associates any point in time t from birth, t=0, to death, t=, with a
health state Aa , where A is the set of health states (including a state representing
death). Interventions which affect his health, for instance performing a surgical
procedure or curing an illness, can be thought of as replacing (t) with an alternative
profile (t).
A planner is responsible for providing healthcare interventions within a limited
budget, which she wishes to spend either to maximize health or minimize disability.
The planner who wishes to take a health-utilitarian point of view will have to have
some way of rendering health states commensurable so that she can aggregate health
over time and over persons. To do this, she might assume that health measurements
exist, in the sense that there exists a real valued function over health states h(a),
10 ah , and her preferences for life profile (t) can be represented by a function
0
))(()( dtthfH , in the sense that she (non-strictly) prefers profile (t) to profile
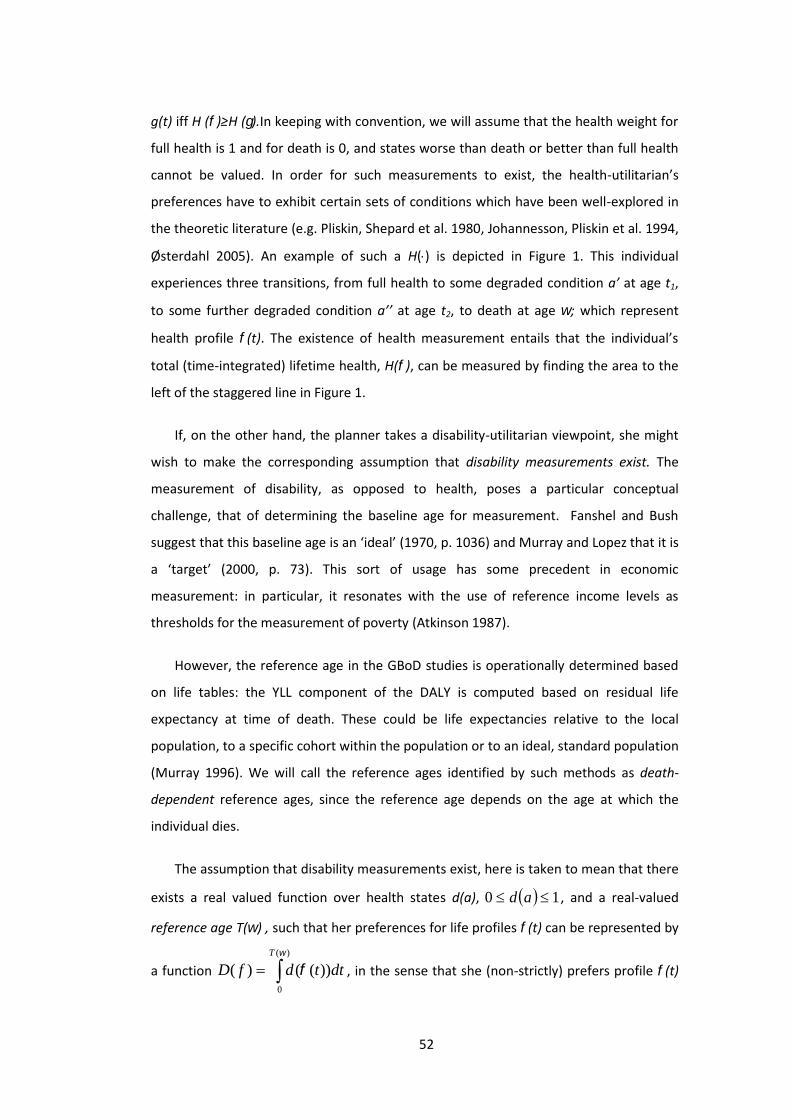
52
g(t) iff H ()≥H ().In keeping with convention, we will assume that the health weight for
full health is 1 and for death is 0, and states worse than death or better than full health
cannot be valued. In order for such measurements to exist, the health-utilitarian’s
preferences have to exhibit certain sets of conditions which have been well-explored in
the theoretic literature (e.g. Pliskin, Shepard et al. 1980, Johannesson, Pliskin et al. 1994,
Østerdahl 2005). An example of such a H() is depicted in Figure 1. This individual
experiences three transitions, from full health to some degraded condition a’ at age t1,
to some further degraded condition a’’ at age t2, to death at age ; which represent
health profile (t). The existence of health measurement entails that the individual’s
total (time-integrated) lifetime health, H(), can be measured by finding the area to the
left of the staggered line in Figure 1.
If, on the other hand, the planner takes a disability-utilitarian viewpoint, she might
wish to make the corresponding assumption that disability measurements exist. The
measurement of disability, as opposed to health, poses a particular conceptual
challenge, that of determining the baseline age for measurement. Fanshel and Bush
suggest that this baseline age is an ‘ideal’ (1970, p. 1036) and Murray and Lopez that it is
a ‘target’ (2000, p. 73). This sort of usage has some precedent in economic
measurement: in particular, it resonates with the use of reference income levels as
thresholds for the measurement of poverty (Atkinson 1987).
However, the reference age in the GBoD studies is operationally determined based
on life tables: the YLL component of the DALY is computed based on residual life
expectancy at time of death. These could be life expectancies relative to the local
population, to a specific cohort within the population or to an ideal, standard population
(Murray 1996). We will call the reference ages identified by such methods as death-
dependent reference ages, since the reference age depends on the age at which the
individual dies.
The assumption that disability measurements exist, here is taken to mean that there
exists a real valued function over health states d(a), 10 ad , and a real-valued
reference age T() , such that her preferences for life profiles (t) can be represented by
a function )(
0
))(()(
T
dttdfD , in the sense that she (non-strictly) prefers profile (t)

53
to profile (t) iff D()≤D().Again, in keeping with convention, we will assume that the
disability weight for full health is 0 and for death is 1, and states worse than death or
better than full health cannot be valued. An example of such D() is depicted in Figure 1.
The total (time-integrated) lifetime disability, D(), can be found by finding the total
area to the right of the staggered line, with the vertical dimension measured by the
scale on the right axis.
Figure 1 Health H() and disability measurement D() on a life profile
The reader will note that in the DALY literature, the underlying model which is
typically presented as a basis for disability measurement is a model of a population,
rather than a model of the individual: we take the view, however, that any model of a
population must implicitly contain a model of the individual as a special case.
3.2.2 Health gain versus reduction in disabilityConsider an intervention whereby a life profile (t) is replaced by another (t). A key
question is how the resulting gain in health, ΔH(,)=H() - H(), relates to the
corresponding change in disability, ΔD(,)=D() - D().
Demographers pointed out that an intervention which saves a life at age , does not
usually add T()- years of life and that a full demographic model of the population
with and without the intervention is the best tool to inform health planners (Preston
1993). In response, DALY proponents discussed a population based model comparing
the difference between YLLs averted and healthy life years gained by a life saving
intervention (Murray 1996) and recommended the use of local period life expectancy
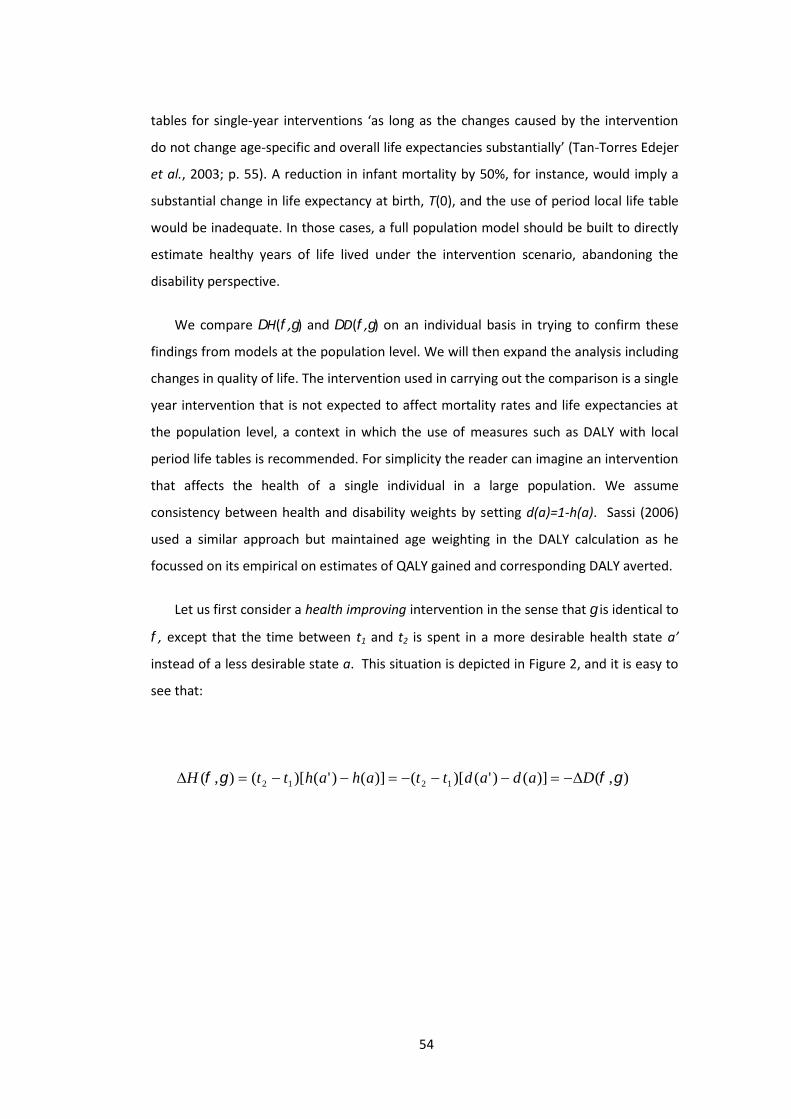
54
tables for single-year interventions ‘as long as the changes caused by the intervention
do not change age-specific and overall life expectancies substantially’ (Tan-Torres Edejer
et al., 2003; p. 55). A reduction in infant mortality by 50%, for instance, would imply a
substantial change in life expectancy at birth, T(0), and the use of period local life table
would be inadequate. In those cases, a full population model should be built to directly
estimate healthy years of life lived under the intervention scenario, abandoning the
disability perspective.
We compare H(,) and D(,) on an individual basis in trying to confirm these
findings from models at the population level. We will then expand the analysis including
changes in quality of life. The intervention used in carrying out the comparison is a single
year intervention that is not expected to affect mortality rates and life expectancies at
the population level, a context in which the use of measures such as DALY with local
period life tables is recommended. For simplicity the reader can imagine an intervention
that affects the health of a single individual in a large population. We assume
consistency between health and disability weights by setting d(a)=1-h(a). Sassi (2006)
used a similar approach but maintained age weighting in the DALY calculation as he
focussed on its empirical on estimates of QALY gained and corresponding DALY averted.
Let us first consider a health improving intervention in the sense that is identical to
, except that the time between t1 and t2 is spent in a more desirable health state a’
instead of a less desirable state a. This situation is depicted in Figure 2, and it is easy to
see that:
),()]()'()[()]()'()[(),( 1212 DadadttahahttH
55
Figure 2 Gain in health H()and reduction in disability D()from health improving
intervention replacing health profile (bold line) with health profile (dashed line
between t1 and t2, bold line elsewhere).
On the other hand, consider a life extending intervention. For simplicity, let us
imagine the health profile of an individual living from birth to death at age in health
state a and assume that there exists an intervention capable of extending her life by k
years, until age ’=+k, in health state a’ as in Figure 3. We estimate H() and D()
varying parameters , k and h(a’) assuming consistent quality weights and, for
illustrative purposes, death-dependent reference age T() based on recent, English life
tables (GAD 2006).
Figure 3 Gain in health and reduction in disability from life extending intervention
replacing health profile (bold line) with health profile (dashed line between and
’, bold line elsewhere).
56
We present our results in the form of a ratio of the reduction in disability relative
to the gain in health, denoting h(a’) by h* for notational simplicity. Clearly, the more
comparable are the QALY and DALY measures, the closer this ratio is to 1.
)()(
)()(
),(
),(*),,(
HH
DD
H
Dhk
*
)()(1
*
*)()(
kh
TkT
kh
hkkTT
The denominator is the health gain, which is simply k years adjusted for their
quality, kh*; the numerator is the reduction in disability and is affected by the change in
reference age from T() to T(’) because a death at age carries T()- YLLs, whereas
a death at age ’, T(+k) – -k YLLs. The total reduction in DALY is therefore
D(,)=[T(’)-’+(1-h*)k+C]- [T()-+C]=T(+k)- kh*- T(), where C denotes YLDs not
affected by the intervention (e.g. years lived with disability before age in Figure 3).
We begin by holding h* at 1, that is by comparing years of life gained to the
corresponding reduction in years of life lost, without adjusting for quality. In this case,
H(,) reduces to k, and the difference in years of life lost to T(+k)- T()-k. As we
discuss in the Appendix, typically 0 T(+k)-T() k which implies that -
D(,)k=H(,) and that the α ratio of DALY averted over QALY gained is between 0
and 1. We show in Figure 4 the behaviour of varying and k. As expected 0 ≤ ≤ 1
and α decreases both with and k for most values of. For the very young, however, α
is briefly increasingly, reflecting that fact that life expectancy itself can increase with
age, after one has survived the dangerous days and months immediately following birth.
The DALY calculations can be then very different from QALY calculations, particularly for
the very old: for such people, an increase in life from to’ but is also likely to have a
significant effect on residual life expectancy as measured by T(’)- T(). The DALY
averted from an intervention which extends their life will be negligible because the
benefits of a longer life are for the most part offset by a higher normative benchmark
T(’).

57
Figure 4 Ratio of reduction in disability to gain in health () – empirical estimates
using recent, English life tables. The x-axis reports the age at which death is prevented
(). values are reported for intervention extending life by k years, where k is varied
from 1 to 99. The graphs for k=1 and k=30 are indicated to guide the reader.
The results are consistent with previous findings with models at the population
level, but offer new insights on their nature. In particular, Murray find a similar
relationship between gains in healthy life years and reduction in YLLs from an
intervention which saves a life at any age, using different life expectancy tables to define
YLLs (Murray, 1996) and interprets them as ‘meaningful implied equity weights’ which
assign less value to the benefits of older individual compared to younger ones (Murray
and Lopez, 2000; p. 78). Our analysis, by comparing QALY gained and DALY averted at
the individual level, shows that the shift in reference age from T() to T(’), which is
particularly marked at older ages, determines the lower value of YLLs gained in elderly
beneficiaries of health interventions. This is also easy to see from Figure 4, in which the
curve associated with a health gain of k=1 years of life represents the difference
between T() and T(+1).
If we now allow h* to assume values smaller than 1, we can explore the relationship
between years of life lived adjusted for health and years of life lost adjusted for
disability. We estimated the ratio α of -D()/H() using once again recent English life
tables but varying h* over the interval [0,1].

58
We find that a health extending intervention might produce more rather than less
DALY. This happens when the years of life added adjusted for their quality, kh*, are
more than compensated by the shift in reference age from T() to T(+k). Figure 5
reports results for k=1 and k=30. Note that these graphs are different from the previous
ones and each curve now corresponds to different values of h*.
Figure 5 Ratio of reduction in disability to gain in health () – empirical estimates
using recent, English life tables. The x-axis reports the age at which death is prevented
(). values are reported for intervention extending life by1 year in the left-hand side
graph and by 30 years in the right-hand side graph with a quality of life h*. The curves
for h*=1 and h=0.1 are indicated to guide the reader.
3.3 DiscussionA health-utilitarian and a disability utilitarian health planner would rank
interventions in a systematically different way, even if both made the same assumptions
about costs and effectiveness, and assumed consistent health and disability weights, so
long as the form of the DALY used embodies a death-dependent concept of the
reference age.
Consider for example a decision maker who can fund treatment for one and only
one of the following people: (i) a 65 year old man who, untreated, will die today; (ii) a 45

59
year old man who, untreated, will die today. The person receiving the treatment will live
for one other year, with quality of life valued at 0.1 on a 0 to 1 scale where, as usual, the
quality of life associated with being dead is 0 and that associated with perfect health is
1. Let us assume that the decision maker wants to maximise the health benefit,
measured as gains in QALYs or reduction in DALYs.
If the decision maker measures the health benefit with a QALY metric, funding any
of the two interventions would lead to a gain of 0.1 QALY. This endorses an egalitarian
judgment that QALY are equal, no matter who receives them and the decision maker
might set up a lottery to determine who will receive the intervention or invoke further
decision criteria, e.g. to favour younger over older patients on a fair-innings argument
(Williams 1997).
On the other hand, if the decision maker measures the health benefit using a DALY
metric, funding the first intervention would lead to an increase in the burden of disease
of 0.16 DALYs, but funding the second intervention would lead to a slight reduction in
the burden of disease of 0.02 DALYs, and would then offer the treatment to the 45 year
old man. In fact, she would not provide the intervention to the 65 year old man even if
resources were available to fund it, because his death today is associated with a lower
burden of disease than his death in a year’s time, which is at variance with the original
assumption that a quality of life of 0.1 is better than death.
We find the DALY valuation of a health benefit quite problematic when computed in
this way and that it is difficult to see how an intervention which increases an old
person’s life (even at a level of health only marginally better than being dead) can
represent an increase in the burden of disease.
This difference between QALY- and DALY-based rankings of interventions, however,
is not determined by the use of a disability perspective per se. In particular, if the
government planner’s preferences meet the condition for health measurements to exist,
and there is an upper bound on all possible lifetimes, then disability measurements also
exist, as D(∙) can be found by using a consistent set of health and disability weight, d(a) =
1- h(a), and setting the reference age to a constant value of T≥. Under these
conditions, H()+ D(), is equal to T. However, since H()+ D()=H()+ D()=T, by simple

60
algebra, any increase in health must be matched with an identical decrease in disability,
i.e. ΔH(,)= - ΔD(,).
To extend this result to measures of DALY averted at the population level, the
selected constant reference age T should be identical for all individuals. For the
equivalence of the two approaches to hold, operationally, the reference age simply
needs to be higher than any admissible age for a human life.
We think that the language of disability measurement is a useful one, particularly
when introducing health measurement concepts to professionals trained in public
health or epidemiology, to whom years of life lost represent a natural intellectual
starting point.
We are not suggesting the use of a constant reference age for the DALY approach in
general. If one is interested in describing the health status of a population in terms of
the current, total burden of disease, the use of life expectancy from a standard, ideal or
local population should be used as recommended in the DALY framework (Murray 1996,
Murray and Acharya 1997). If one is interested in the benefits from an intervention,
however, one should use a health perspective with a QALY-type measure or a disability
perspective with a constant reference age. This is however simply an algebraic fix to
avoid erroneous estimates and misleading recommendations of using DALY-type
measures to assess benefits from health interventions.3.4 AppendixIn this appendix we discuss when 0 ≤ T(+k)-T() ≤ k. We do this in two steps. First,
we define and discuss the shape of the residual life expectancy function L(x), identifying
the conditions under which its first derivative lies between -1 and 0. Then, we show that
T(+k)-T() is always positive and discuss when T(+k)-T()≤ k.
Let us define the following three functions (Keyfitz 1968, Lindsey 2004):
(1) the survivor function, S(x), that is the probability of living until age x:
(1)
x
dttfxFxTxS )()(1]Pr[)( ;

61
where F(x) is the cumulative distribution and f(x) is the corresponding
density function;
(2) the mortality rate, (x), that is the instantaneous probability that death will
occur at age x:
(2))(
)()(
xS
xfx ;
(3) the residual life expectancy, L(x), that is the average prospective lifetime of an
individual aged x:
(3))(
)(
)(xS
dttS
xL x
;
Differentiating L(x) with respect to x:
(4) )()(1
)())((
2
2
xLxS
dttSxfS
dx
dL x
;
It can be easily seen that dL/dx≥-1 always, because both (x) and L(x) are non
negative; and dL/dx≤0 if and only if (x)∙L(x)≤1, that is residual life expectancy is a
decreasing function in correspondence of ages x where)(
1)(
xxL
.
Empirical analysis of life tables shows that L(x) may increase during early years of
life, when there is a high risk of infant mortality. In developed countries, where the life
expectancy at birth is above 70 years, this usually happens only for the first year of life
or even just for the first few months, and L(x) is a decreasing function of age x thereafter
(Coale and Demeny 1983, Goldman and Lord 1986, Shrestha 2005).
Let us now discuss when 0 ≤ T(+k)-T()≤ k. First note that T()=+L().
We can re-write T(+k)-T()=k+L(+k)-L() as
T(+k)-T() =
k
LkLk
)()(1
=

62
=
k
LL
k
kLkL
k
kLkLk
)()1(...
)2()1()1()(1
.
The years gained with the intervention, k, are non-negative. As we discussed above,
the first derivative of L(x) is greater than -1 for any x, hence the term in square brackets
is non negative, that is T(+k)-T()≥ 0 always. Similarly, for values of x where the first
derivative dL/dx ≤ 0, that is when ()∙L()≤1, the term in square brackets is less than
one, hence T(+k)-T()≤ k.

63
4 Requisite models for strategic commissioning: the example of type
1 diabetes
This chapter has been published as: M Airoldi, G Bevan, A Morton, M Oliveira, J
Smith (2008) Requisite models for strategic commissioning: the example of type 1
diabetes, Health Care Management Science, 11: 89-110
Abstract
A developing emphasis of health care reforms has been creating
organisations with responsibilities for strategic commissioning of services
for defined populations. Such organisations must set priorities in aiming to
meet their populations’ needs subject to a budget constraint. This requires
estimates of the health benefits and costs of different interventions for
their populations. This paper outlines a framework that does this and shows
how this requires modelling to produce estimates in a way that is
transparent to commissioners, of requisite complexity to produce sound
estimates for priority setting using routinely available data. The example
illustrated in this paper is an intervention that would improve glucose
control in the English population with type 1 diabetes. It takes many years
for a change in glucose management to deliver maximum benefits; hence
the intervention is not good value-for-money in the short run. We aim to
give a more strategic view of the costs and benefits modelling costs and
benefits in a steady-state model which suggests that the intervention is
good value-for-money in the long run.
4.1 IntroductionCost-effectiveness analysis (CEA) and disease modelling have grown apace in the
hope of informing policy formation, however many authors have questioned their actual
contribution to the development and implementation of policies (Ross 1995,
Drummond, Cooke et al. 1997, Duthie, Trueman et al. 1999, Drummond and Weatherly
2000, Bryan, Williams et al. 2007). This paper develops a framework for CEA and cost-

64
effectiveness analysis to provide information for organisations responsible for strategic
commissioning of health services for defined populations and illustrates its use by
modelling intensive glucose control in type 1 diabetes in England. Strategic
commissioners (or purchasers) have emerged in reforms of health care, which are
required to assess needs of populations, determine the optimal way of meeting these
needs, and accordingly contract with providers of different services. This is currently the
task of Primary Care Trusts (PCTs) in the National Health Service (NHS) in England
(Department of Health 2006) and Local Health Integration Networks (LHINs) in Ontario
(Ontario 2006). The second section of this paper outlines the framework we have
developed to help strategic commissioners set priorities. The third section illustrates
how this framework was used in modelling type 1 diabetes. The final section discusses
the results and implications of our framework for disease modelling.4.2 Framework of analysisThe mainstream evaluation framework in economic evaluation for priority setting is
that of Quality-Adjusted Life Years ((Weinstein and Stason 1977, Williams 1985); see
(Gold, Siegel et al. 1996, Drummond, Sculpher et al. 2005) for a review of proposed,
albeit less widespread alternatives). A Quality-Adjusted Life Year (QALY) is a year
weighted for quality of life, with a weight of one for perfect health and zero for death.
QALYs are used to compare alternative interventions and to prioritize cost-effective
interventions for funding. The cost-effectiveness of an intervention is measured by the
ratio between its added value in terms of health benefits and its incremental cost
compared to an alternative, the “incremental cost-effectiveness ratio” or simply
“cost/QALY”. Interventions with a lower cost/QALY represent better value for money
because a smaller investment is needed to produce a unit of benefit or, alternatively,
more QALYs can be achieved per unit spent. A different measurement tool that raised a
heated debate is the concept of Disability-Adjusted Life Years (DALYs) to estimate the
Burden of Disease (BoD) in a population (Anand and Hanson 1997, Murray and Acharya
1997, Williams 1999, Mooney and Wiseman 2000, Murray and Lopez 2000, Bevan and
Hollinghurst 2003). DALYs are a form of summary measures of population health and
combine information on mortality and morbidity (for a review of alternative measures
see Lopez (2002)) and consist of the sum of Years of Life Lost (YLLs) from premature
mortality and Years Lived with a Disability (YLDs), in which each year of life is weighted
65
for disability with a weight of zero for perfect health and one for death. These
different approaches have subsequently been developed to converge to produce
information on costs and benefits of interventions in the population in terms of
reductions in BoD measured in DALYs (Hutubessy, Chisholm et al. 2003, Andrews,
Issakidis et al. 2004, Evans, Edejer et al. 2005), or gains in health, measured in QALYs
(Dawson, Gravelle et al. 2005, Department of Health 2005, Martin and Smith 2006, UK
Centre for the Measurement of Government Activity 2006).
Beside common serious methodological, ethical and empirical problems (Gold,
Siegel et al. 1996, Lopez, Mathers et al. 2002), each approach, as originally developed,
was subject to different limitations as bases for setting priorities. The methodology of
Cost/QALY was designed for marginal analysis: it does not distinguish interventions of
low cost and low benefit from those of high cost and high benefit; does not tell us
whether the bulk of resources are being currently used effectively (Hutubessy,
Chrisholm et al. 2003, Evans, Adam et al. 2005); nor the number of people affected by
an intervention. The value of reporting on the scale of the intervention has been
highlighted by Murray and Lopez (Murray and Lopez 2000): “If there are fixed assets,
other than disposable dollars, limiting the feasible combinations of interventions that
can be delivered – real-world examples include the attention of senior Ministry of
Health decision-makers or the political commitment of government leaders –, then
these should be devoted not just to the most cost-effective interventions but to those
cost-effective interventions with the potential to effect substantial improvements in
population health status’. The standard approach to estimating BoD in DALYs, however,
gives estimates of that which exists given the current delivery of health care, and hence
is best described as the ‘current’ BoD. Estimates of the current BoD in DALYs are of no
value in themselves, nor a good guide on the potential benefit from an intervention.
Hollinghurst et al. (2000) estimate the current BoD and the potential benefits from
interventions in the South West of England. Estimates varied greatly across different
diseases and showed that, although the current BoD of heart diseases was higher than
that of depression, the DALYs that are potentially avoidable by improving treatment of
depression were much more than those of improving treatment of heart diseases. To
set priorities using DALYs, we require information on benefits and costs, but to interpret
the relationship between DALYs and costs, we need to distinguish between estimates of
three different components of BoD (Bevan, Hollinghurst et al. 1998, Hollinghurst, Bevan

66
et al. 2000, Hollinghurst and Bevan 2003): (i) DALYs ‘avoided’ from the current delivery
of health care which with their costs indicate cost-effectiveness of current practice; (ii)
DALYs ‘avoidable’ through improving treatment (coverage, appropriateness or
compliance) which need to be put alongside estimates of their costs to indicate
potential cost-effectiveness of changing practices; and (iii) DALYs that are ‘unavoidable’
and cannot be reduced given current evidence, and are hence irrelevant to assessments
of setting priorities among available interventions.
To set priorities for populations we require methods that draw on both cost/QALY
and DALYs by applying the framework of cost-effectiveness to populations in order to
estimate the ‘avoidable’ burden of disease (Hollinghurst and Bevan 2003). The concept
of ‘avoidable’ burden of disease builds on the idea of using ‘avoidable mortality’ to
assess the use of resources among different health care services (Rutstein, Berengerg et
al. 1976, Charlton, Hartley et al. 1983, Holland 1991) and combines it with DALYs to
estimate both mortality and morbidity avoidable through an intervention. This has been
the common basis for three different recent sets of studies: cost-effectiveness of
treating mental illness in Australia (Andrews, Issakidis et al. 2004); WHO’s project for
Choosing Interventions that are Cost Effective (Hutubessy, Chrisholm et al. 2003, Tan-
Torres Edejer, Baltussen et al. 2003, Evans, Edejer et al. 2005); and estimates of NHS
productivity that sought to estimate gains in QALYs for the population of England
(Dawson, Gravelle et al. 2005, Department of Health 2005, Martin and Smith 2006, UK
Centre for the Measurement of Government Activity 2006).
To deal with costs and health benefits occurring at different points in time, manuals
of cost-effectiveness recommend the use of a common discount rate, but acknowledge
that theory and empirical evidence on the relationship between interest rates and rates
of time preference is unsettled. For strategic commissioners, the cost-effectiveness of a
health intervention based on its derived present value is difficult to interpret and use:
they are allocated annual budgets and cannot easily translate results from economic
evaluations to the financial impacts in the short and in the long term. This is nicely
illustrated by intensive glucose control for type 1 diabetes. This is because, although
some evidence suggests that over the patient’s lifetime this is more cost-effective than
conventional care (Diabetes Control and Complication Trial 1996, Herman, Dasbach et
al. 1997, Tomar, Lee et al. 1998, Palmer, Weiss et al. 2000), its funding will cause an

67
immediate increase in costs and delayed benefits. This paper proposes a different
approach by measuring impacts on population health and on the commissioner’s budget
in the short- and long-run.4.3 Modelling type 1 diabetes4.3.1 The Disease and InterventionsDiabetes mellitus is one of the most common chronic diseases and the diabetic
population in England is estimated to be about 2.2 million (Forouhi, Merrick et al. 2006).
Of these, 2 million have type 2 diabetes, which is characterised by insulin resistance and
usually diagnosed in the middle aged or elderly; and about 170,000 have type 1
diabetes, which is characterised by an absolute deficiency of insulin and is usually of
rapid onset.
The evidence is that only a minority of people with type 1 diabetes have blood-
glucose concentrations below the recommended levels (Figure 1) (National Clinical Audit
Support Programme 2005); there is a well-known association between poor glucose
control and the development of microvascular complications, i.e. eye, kidney and nerve
damages that could lead to blindness, dialysis and amputation (Diabetes Control and
Complication Trial 1990, Diabetes Control and Complication Trial 1993, Diabetes Control
and Complication Trial 1996) hence, these people are expected to develop
complications. A large longitudinal study has shown, however, that it is possible to
reduce the levels of glucose concentration by providing intensive and personalized
advice on insulin doses, diet and exercise and that, over time, this leads to a significant
reduction in microvascular complications (Diabetes Control and Complication Trial 1990,
Diabetes Control and Complication Trial 1993, Diabetes Control and Complication Trial
1996). There is also some evidence that the intervention is cost-effective according to
standard economic evaluation both in type 1 (Diabetes Control and Complication Trial
1996, Herman, Dasbach et al. 1997, Tomar, Lee et al. 1998, Palmer, Weiss et al. 2000)
and in type 2 diabetes (e.g. Eastman, Javitt et al. 1997, Gray, Raikou et al. 2000).
However, microvascular complications are progressive, appear after several years after
the onset of diabetes and tend to degenerate over time. The typically degenerative
nature of these complications poses a particular challenge in designing policies for these
patients: those who already have moderate complications will have limited benefits
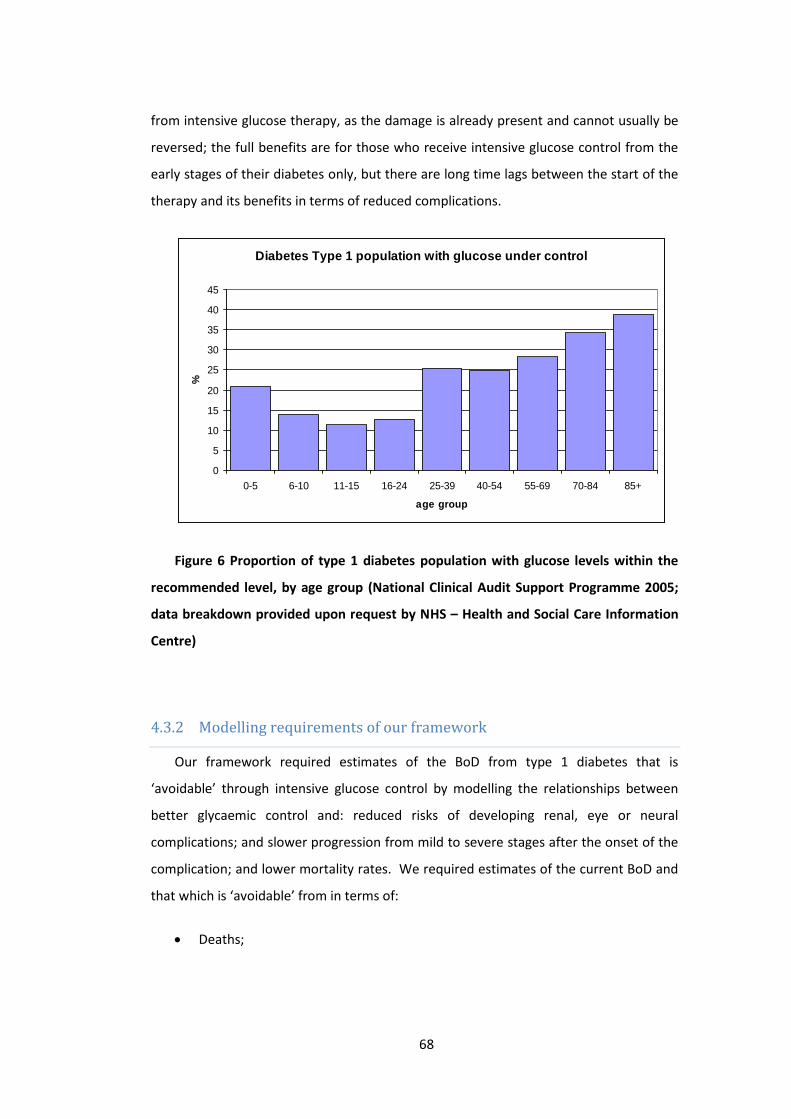
68
from intensive glucose therapy, as the damage is already present and cannot usually be
reversed; the full benefits are for those who receive intensive glucose control from the
early stages of their diabetes only, but there are long time lags between the start of the
therapy and its benefits in terms of reduced complications.
Figure 6 Proportion of type 1 diabetes population with glucose levels within the
recommended level, by age group (National Clinical Audit Support Programme 2005;
data breakdown provided upon request by NHS – Health and Social Care Information
Centre)
4.3.2 Modelling requirements of our frameworkOur framework required estimates of the BoD from type 1 diabetes that is
‘avoidable’ through intensive glucose control by modelling the relationships between
better glycaemic control and: reduced risks of developing renal, eye or neural
complications; and slower progression from mild to severe stages after the onset of the
complication; and lower mortality rates. We required estimates of the current BoD and
that which is ‘avoidable’ from in terms of:
Deaths;
Diabetes Type 1 population with glucose under control
0
5
10
15
20
25
30
35
40
45
0-5 6-10 11-15 16-24 25-39 40-54 55-69 70-84 85+
age group
%
69
Years of Life Lost (YLLs) – the residual life expectancy at the age of the
‘avoidable’ death according to local life tables; and
Years Lived with a Disability (YLDs) using disability weights developed by the
Dutch Disability Weight study (Stouthard, Essink-Bot et al. 1997);
DALYs (the sum of YLLs and YLDs), with and without discounting, using a 3.5%
discount rate (National Institute for Health and Clinical Excellence 2007).
We also required estimates of average annual net costs of:
expenditure each year, for the whole of the diabetic population, drugs,
equipment; monthly specialist visits and measurement of HbA1c , less
savings due to intensive glucose control from reductions in the costs of treating
the sequelae of diabetes, renal disease (including dialysis), eye disease, and
diabetic foot (including amputation).
We also required estimates of the short- and long-run impacts of intensive glucose
control:
over the next five years, assuming a policy in which intensive glucose control
was introduced for all patients regardless of the stage of their disease, in which
we modelled changes in the current population from aging and death, but
omitted births (this is known as a ‘closed population model’); and
in the long run, in a future ‘steady state’, in which all patients would have
intensive glucose control at the onset of the disease, in which we modelled a
population cohort of new cases of different ages and simulated changes over
time by assuming that the total size and age distribution of the population was
stable.
Although five years was an arbitrary choice, it reflects a period between the
immediate and long run and corresponds to the time horizon recommended for
strategic planning in the English NHS (supplemented by yearly reviews) and is similar to
the Ontarian 4-year typical time horizon with yearly reviews. The steady state scenario
gives indications of the expected annual health benefits and costs for a stable

70
intervention and has been used in the past to evaluate services with long time lags as
diabetes (Wood, Mallick et al. 1987, Bagust, Hopkinson et al. 2002).
To compare the health benefits with the net cost of the intervention, we attached a
monetary value to life. We assumed a theoretical equivalence between a year of life in
full health and a year of life free of disability (Fanshel and Bush 1970) and used the
putative threshold of the National Institute for health and Clinical Excellence, which on
average judges cost-effective a health intervention that costs less than £30k per QALY.
We ran a sensitivity analysis on the value of health benefits.
In this paper we investigate the adequacy of a simple disease model within our
framework of analysis. To be useful for informing strategic commissioning, we required
a transparent, simple model, using routinely-available data, that would produce
approximate estimates that would indicate orders of magnitude for comparison with
other interventions within and across different diseases at the population level. Most of
the diabetes models that have been developed understandably focus on type 2 diabetes
(based on the pioneering work by Eastman and colleagues (Eastman, Javitt et al. 1997,
Eastman, Javitt et al. 1997)), but some like the Archimedes, the CORE or the EAGLE
model are designed for both type 1 and 2 (Eddy and Schlessinger 2003, Palmer, Roze et
al. 2004, Mueller, Maxion-Bergemann et al. 2006). We tested the adequacy of our model
through validation, sensitivity analysis and comparing results with those from more
sophisticated models. The model we developed is requisite for our purpose and
parsimonious (Phillips 1984, Pidd 2003).
We modelled diabetes as a Markov chain, which makes the simplifying assumption
that the probability of transition from disease state A to disease state B does not depend
on the patient’s history before arriving in state A. However, the incidence of
microvascular complications correlates significantly with diabetes duration (Morgan,
Currie et al. 2000); we divided the population in 5-year age groups to allow the use of a
different set of transition probabilities for each one. The probability of death is
dependent both on age and degree of severity of complication. The incidence of
complications and their progression rates vary with age, but as there are no routinely
available data on these, we assumed no incidence of microvascular complications before
the age of 15 and lower incidence rates in young adults compared to older ones. The

71
specifications for the two models are outlined in Figure 7. A description of the key
assumptions and an evaluation of the data are given in Table 3 and Table 4. We
estimated the BoD: from higher mortality (deaths and YLLs) from all causes; and
disability (YLDs) associated with microvascular complications, diabetic nephropathy,
retinopathy and diabetic foot; but not from acute diabetic events (ketoacidosis), non-
fatal myocardial infarctions, non-fatal strokes and coronary revascularisations. Although
we did not model patients with cerebrovascular complications explicitly, deaths caused
by these complications are accounted in the YLLs from all causes.
The model can be run for any local population and we have used it for England, ten
different PCTs in the South-East of England and two PCTs in central London. However,
the demographic differences across these PCTs did not have a significant impact on the
relative magnitude of results. In this paper we discuss estimates for the population of
England.
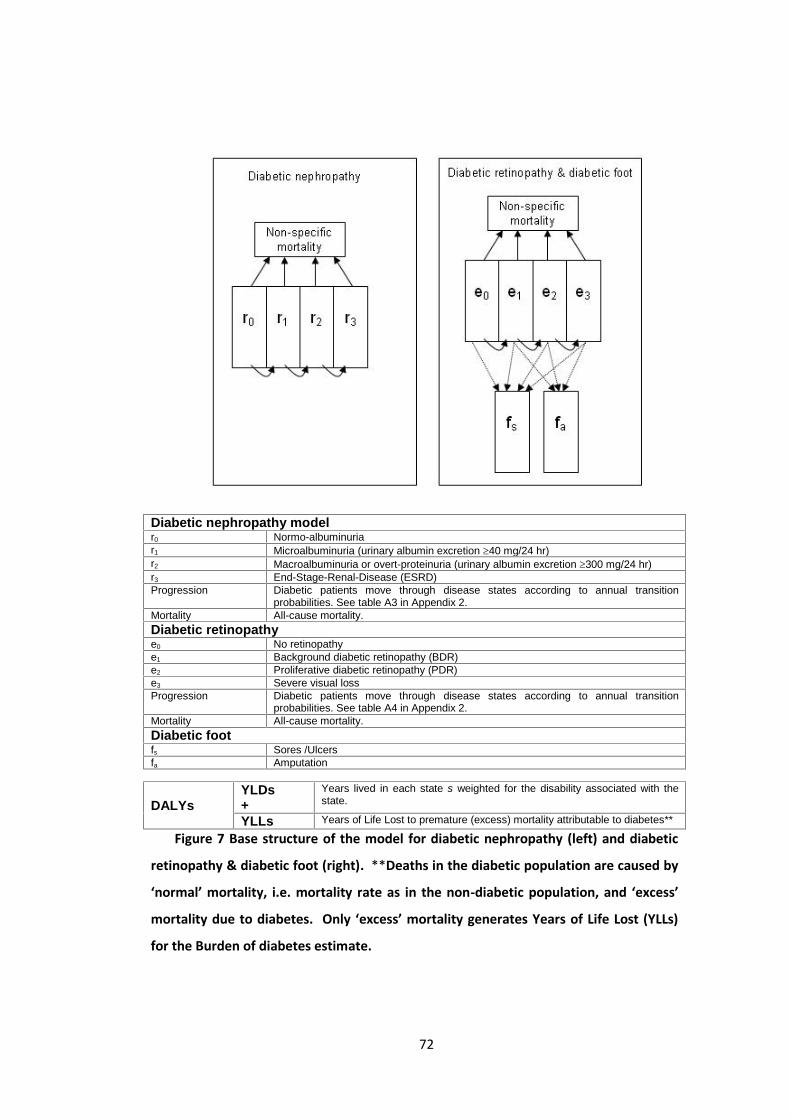
72
Diabetic nephropathy modelr0 Normo-albuminuriar1 Microalbuminuria (urinary albumin excretion 40 mg/24 hr)r2 Macroalbuminuria or overt-proteinuria (urinary albumin excretion 300 mg/24 hr)r3 End-Stage-Renal-Disease (ESRD)Progression Diabetic patients move through disease states according to annual transition
probabilities. See table A3 in Appendix 2.Mortality All-cause mortality.Diabetic retinopathye0 No retinopathye1 Background diabetic retinopathy (BDR)e2 Proliferative diabetic retinopathy (PDR)e3 Severe visual lossProgression Diabetic patients move through disease states according to annual transition
probabilities. See table A4 in Appendix 2.Mortality All-cause mortality.Diabetic footfs Sores /Ulcersfa Amputation
DALYsYLDs+
Years lived in each state s weighted for the disability associated with thestate.
YLLs Years of Life Lost to premature (excess) mortality attributable to diabetes**
Figure 7 Base structure of the model for diabetic nephropathy (left) and diabetic
retinopathy & diabetic foot (right). **Deaths in the diabetic population are caused by
‘normal’ mortality, i.e. mortality rate as in the non-diabetic population, and ‘excess’
mortality due to diabetes. Only ‘excess’ mortality generates Years of Life Lost (YLLs)
for the Burden of diabetes estimate.

73
Table 3 Key modelling assumptions
Assumption Justification
The transition probabilities from state idepend only on being in state i and not on thehistory before arriving in state i.
This is the standard simplifying assumption inmodelling stochastic processes and is the basisof Markov chain models that are widely usedin modelling progression of disease and iscommon practice for modelling diabetes. Torelax this assumption we divide the populationin 5-year age groups and use a different set oftransition probabilities for each one if datawas available.
Same rates apply to men and women. With the exception of myocardial infarctioncomplication rates are similar in men andwomen (National Clinical Audit SupportProgramme 2005).
Under the intervention scenario, all thediabetic population is subject to intensivetreatment.
This reflects NICE recommendations tomaintain HbA1c7.5% in all diabetic patients,but will overstate the benefit of theintervention. We used sensitivity analysis oncompliance rates to test this assumption.
4.3.2.1 First five years
The model of the first five years tracked 100 birth cohorts, i.e. the population from
ages 0 to 99 over five consecutive years. The distribution by age of the initial population
was that in England in 2003. Estimates of BoD in DALYs were calculated by Equation 4:
Equation 4
YLDsYLLsDALYs
99
0 0
)1(
1
5
1
),('*),,(j
k
s
jiLrt
i
ri dtesjisjiAe
99
0 0
5
1
*)(*),,(j
k
s
r
i
ri eswsjiAe
where:
i is the index for the years over which the model is run;
j is the index for the cohorts (j is the initial cohort age);

74
s is the index for the degree of severity of the condition;
r is a discount rate. The model was run with r=0 (which corresponds to no
discounting) and with r=3.5% (giving discounted values);
),,( sjiA is the number of the population with diabetes at stage s in year i of
cohort j;
’( i+j, s) is the excess mortality rate from type 1 diabetes with degree of
severity s for the jth cohort in year i (by which time the members of this cohort
will be [i+j] years old);
L ( i+j ) is the residual life expectancy of the jth cohort in year i. As discussed in
Chapter 3 (Airoldi and Morton 2009) we use a constant reference age of 100
years to assess residual life expectancy;
w(s) is the disability weight associated with degree of severity s.
At the core of the model, was the system of difference equations that model the
evolution of two populations, A and N. A(i, j, s) was the population with type 1 diabetes
in degree of severity s, N(i, j) was the population without type 1 diabetes (both
constituted the jth cohort in the ith year of modelling).
The population with type 1 diabetes in the jth cohort in the (i+1)th year of modelling
[A(i+1, j, s)] was derived from populations with type 1 diabetes [A(i, j, s) and A(i, j, s-1)]
and without type 1 diabetes [ N(i, j)], in the jth cohort in the ith year of modelling, and
estimated by Equation 5:
Equation 5
sjisjisjiAsjiA s ,)1,(1),,(,,1
sjijiNsjisjiA s ,),()1,()1,,(
for all j (0 to 99) and for all i (1 to 5) where:
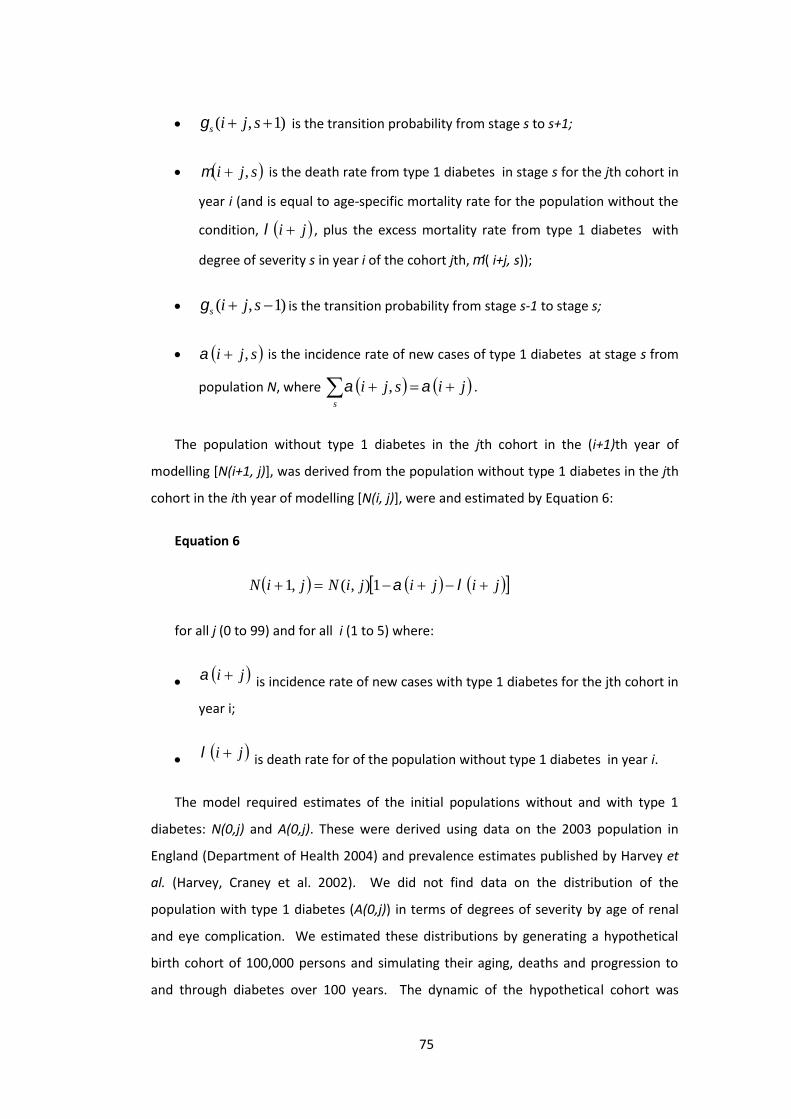
75
)1,( sjis is the transition probability from stage s to s+1;
sji , is the death rate from type 1 diabetes in stage s for the jth cohort in
year i (and is equal to age-specific mortality rate for the population without the
condition, ji , plus the excess mortality rate from type 1 diabetes with
degree of severity s in year i of the cohort jth, ’( i+j, s));
)1,( sjis is the transition probability from stage s-1 to stage s;
sji , is the incidence rate of new cases of type 1 diabetes at stage s from
population N, where jisjis
, .
The population without type 1 diabetes in the jth cohort in the (i+1)th year of
modelling [N(i+1, j)], was derived from the population without type 1 diabetes in the jth
cohort in the ith year of modelling [N(i, j)], were and estimated by Equation 6:
Equation 6
jijijiNjiN 1),(,1
for all j (0 to 99) and for all i (1 to 5) where:
ji is incidence rate of new cases with type 1 diabetes for the jth cohort in
year i;
ji is death rate for of the population without type 1 diabetes in year i.
The model required estimates of the initial populations without and with type 1
diabetes: N(0,j) and A(0,j). These were derived using data on the 2003 population in
England (Department of Health 2004) and prevalence estimates published by Harvey et
al. (Harvey, Craney et al. 2002). We did not find data on the distribution of the
population with type 1 diabetes (A(0,j)) in terms of degrees of severity by age of renal
and eye complication. We estimated these distributions by generating a hypothetical
birth cohort of 100,000 persons and simulating their aging, deaths and progression to
and through diabetes over 100 years. The dynamic of the hypothetical cohort was

76
modelled with a Markov-chain model that used the same transition probabilities of the
main model presented in this paper. We assumed that the proportion of diabetic
patients with degree of severity s at period t of the hypothetical cohort simulation was
representative of the proportion of diabetic patients aged t in the current English
diabetic population. We subject the resulting initial condition to validation.
Figure 2 outlines the progression of type 1 diabetes in the stages of nephropathy
(left panel) and retinopathy (right panel). The stages of nephropathy are:
microalbuminuria, i.e. an increased concentration of the protein ‘albumina’ in
the urine;
macroalbuminuria, i.e. overt proteinuria or ‘clinical nephropathy’, and
end stage renal disease (ESRD).
Each of these stages is also associated with increased mortality rates, mainly due to
cardiovascular disease (Laing, Swerdlow et al. 1999, Laing, Swerdlow et al. 1999,
Soedamah-Muthu, Fuller et al. 2006, Soedamah-Muthu, Fuller et al. 2006); and these
are particularly high for macroalbuminuria (Borch-Johnsen, Andersen et al. 1985,
Rossing, Hougaard et al. 1996). The progression of retinopathy to blindness is also
associated with a higher mortality rate compared to the non-diabetic population. The
effect of glycaemic control was modelled through transition probabilities , which are
lower for diabetic patients under intensive glucose control compared to conventional
care, which means there is a slower progression of the disease to and through
microvascular complications (see Appendix).
The retinopathy model also estimated the BoD from ulcers, sores and amputation
using the incidence rates of these complications associated with different degrees of
retinopathy (Moss, Klein et al. 1992) (see Appendix). The Diabetes Control and
Complications Trial (DCCT study) does not report the reduction in lower extremity
amputation rates. We built on the association between degrees of severity in
retinopathy and lower extremity amputation (Moss, Klein et al. 1992). We made two
assumptions: first, poor glucose control is an underlying cause of both diabetic
retinopathy and diabetic foot; second, the association between degree of severity of
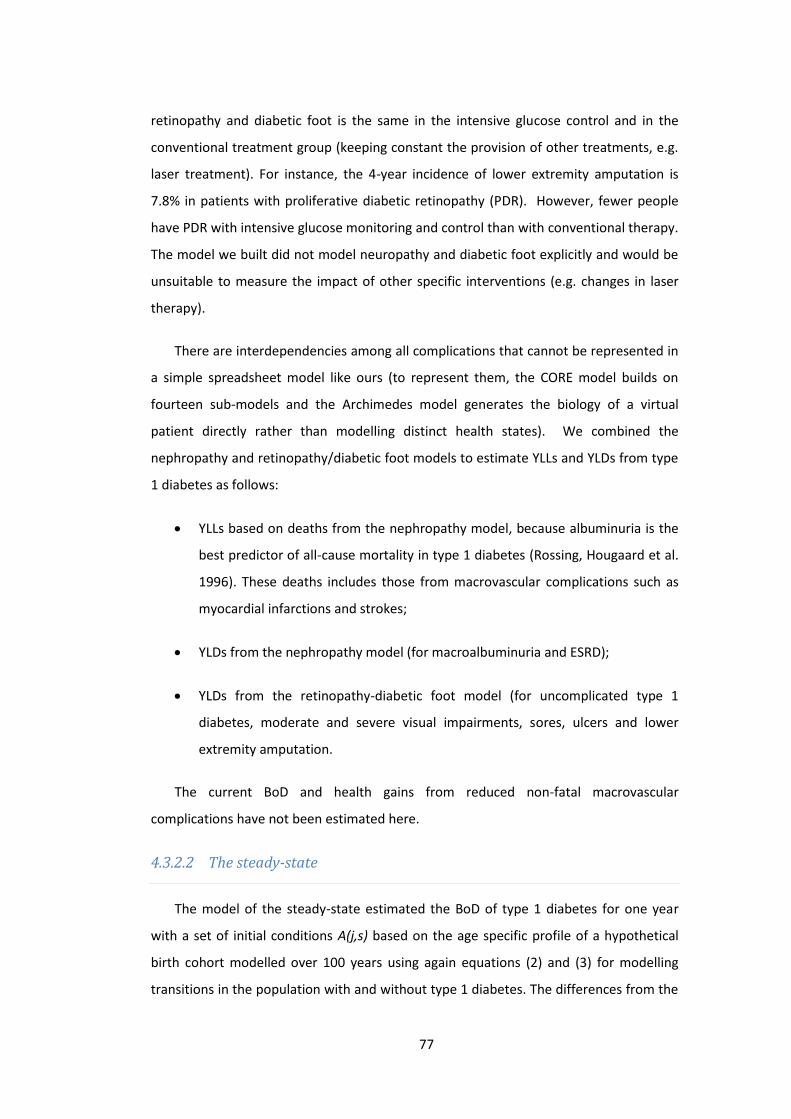
77
retinopathy and diabetic foot is the same in the intensive glucose control and in the
conventional treatment group (keeping constant the provision of other treatments, e.g.
laser treatment). For instance, the 4-year incidence of lower extremity amputation is
7.8% in patients with proliferative diabetic retinopathy (PDR). However, fewer people
have PDR with intensive glucose monitoring and control than with conventional therapy.
The model we built did not model neuropathy and diabetic foot explicitly and would be
unsuitable to measure the impact of other specific interventions (e.g. changes in laser
therapy).
There are interdependencies among all complications that cannot be represented in
a simple spreadsheet model like ours (to represent them, the CORE model builds on
fourteen sub-models and the Archimedes model generates the biology of a virtual
patient directly rather than modelling distinct health states). We combined the
nephropathy and retinopathy/diabetic foot models to estimate YLLs and YLDs from type
1 diabetes as follows:
YLLs based on deaths from the nephropathy model, because albuminuria is the
best predictor of all-cause mortality in type 1 diabetes (Rossing, Hougaard et al.
1996). These deaths includes those from macrovascular complications such as
myocardial infarctions and strokes;
YLDs from the nephropathy model (for macroalbuminuria and ESRD);
YLDs from the retinopathy-diabetic foot model (for uncomplicated type 1
diabetes, moderate and severe visual impairments, sores, ulcers and lower
extremity amputation.
The current BoD and health gains from reduced non-fatal macrovascular
complications have not been estimated here.
4.3.2.2 The steady-state
The model of the steady-state estimated the BoD of type 1 diabetes for one year
with a set of initial conditions A(j,s) based on the age specific profile of a hypothetical
birth cohort modelled over 100 years using again equations (2) and (3) for modelling
transitions in the population with and without type 1 diabetes. The differences from the
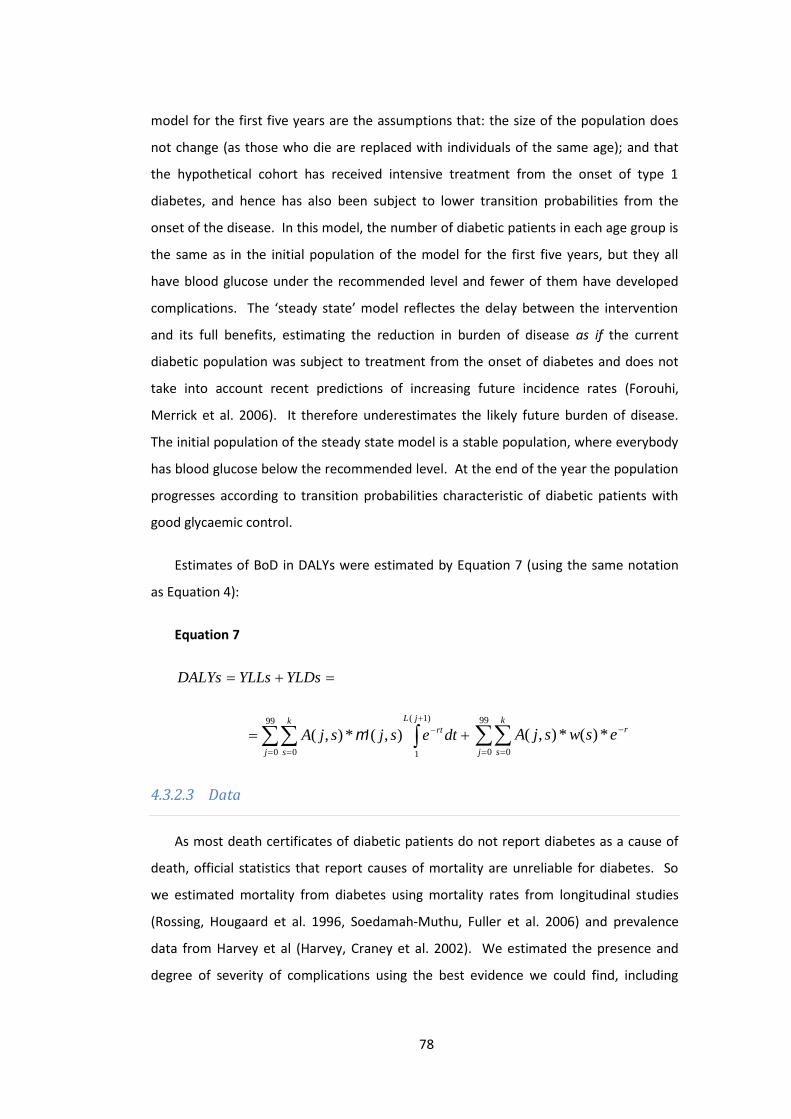
78
model for the first five years are the assumptions that: the size of the population does
not change (as those who die are replaced with individuals of the same age); and that
the hypothetical cohort has received intensive treatment from the onset of type 1
diabetes, and hence has also been subject to lower transition probabilities from the
onset of the disease. In this model, the number of diabetic patients in each age group is
the same as in the initial population of the model for the first five years, but they all
have blood glucose under the recommended level and fewer of them have developed
complications. The ‘steady state’ model reflectes the delay between the intervention
and its full benefits, estimating the reduction in burden of disease as if the current
diabetic population was subject to treatment from the onset of diabetes and does not
take into account recent predictions of increasing future incidence rates (Forouhi,
Merrick et al. 2006). It therefore underestimates the likely future burden of disease.
The initial population of the steady state model is a stable population, where everybody
has blood glucose below the recommended level. At the end of the year the population
progresses according to transition probabilities characteristic of diabetic patients with
good glycaemic control.
Estimates of BoD in DALYs were estimated by Equation 7 (using the same notation
as Equation 4):
Equation 7
YLDsYLLsDALYs
99
0 0
)1(
1
),('*),(j
k
s
jLrt dtesjsjA
99
0 0
*)(*),(j
k
s
reswsjA
4.3.2.3 Data
As most death certificates of diabetic patients do not report diabetes as a cause of
death, official statistics that report causes of mortality are unreliable for diabetes. So
we estimated mortality from diabetes using mortality rates from longitudinal studies
(Rossing, Hougaard et al. 1996, Soedamah-Muthu, Fuller et al. 2006) and prevalence
data from Harvey et al (Harvey, Craney et al. 2002). We estimated the presence and
degree of severity of complications using the best evidence we could find, including

79
studies conducted in the US or the Netherlands. A systematic review of the evidence,
although needed and valuable, was beyond the scope of this paper. Details on the
assumptions needed to deal with missing data are given in the last column of Table 4.

80
Table 4 Data sources and assumptions on missing data
Information Source Description/Evaluation Assumptions on missing data
Incidence
National Clinical audit Support Programme(2005)
This is an overview of diabetes and diabetes carein England. Coverage is partial: about 22% ofeligible PCTs, GP practices and Hospitalsregistered; about 34% of paediatric units.
It gives data for 0-16 years old. Weassumed diabetes onset is before age 35using the incidence rate for 0-16 also forpeople 17-35 years old. This assumptionimplies a slight overestimate of the burdenof diabetes in the model for the first fiveyears.
We made the standard assumption that allType 1diabetic patients are diagnosed.

81
Information Source Description/Evaluation Assumptions on missing data
Currentpopulation withType 1 Diabetesby age groupA(0,j)
Harvey, Craney et al. (2002); Diabetes UK (2004);Diabetes UK (2004); Health and Social CareInformation Centre (2004).
Details for Health and Social Care InformationCentre (2004) were provided upon request byNHS Health and Social Care Information Centre
Diabetes UK (2004) gives estimates for the 17,000children with Type 1 Diabetes which are based onaudited data of about 10,000 children.
Diabetes UK (2004) estimates the diabeticpopulation but in wide age bands.
Health and Social Care Information Centre (2004)is the QOF data at GP level (carefully audited asthe basis for the new GMS contract) and reportsthe total number of diabetic patients in thesurgery (but lacks details on type of diabetes andage).
Harvey, Craney et al. (2002) reports age-specificprevalence estimates of Type 1 Diabetes for theCounty of Clwyd in North Wales.
There is no single definitive source ofaudited prevalence data of Type 1Diabetes for all age groups.
We used Harvey, Craney et al. (2002). Thisassumes that the estimates arerepresentative for England.

82
Information Source Description/Evaluation Assumptions on missing data
Number of peopleby degree ofseverity s
Various authors (Klein, Klein et al. 1989, Klein,Klein et al. 1989, Klein, Moss et al. 1989,Diabetes Control and Complication Trial 1990,Diabetes Control and Complication Trial 1993,Klein, Klein et al. 1994, Diabetes Control andComplication Trial 1996, Rossing, Hougaard et al.1996, Brailsford, Davies et al. 1998, Klein, Kleinet al. 1998, Davies, Roderick et al. 2001, Niessen2002, Soedamah-Muthu, Fuller et al. 2006)
These data do not refer to the English populationand some are ten years old. Most of thesesources report transition probabilities based onlongitudinal studies but the original dataset of thestudy is not available. Data are usually reportedfor the whole population in the study or for wideage groups.
We needed to make some heroicassumptions to generate the initialdistribution of diabetic population acrossdegrees of severity of renal and eyedisease complications.
We used our model to generate a samplepopulation of 100,000 susceptible andprojected it over 100 years. We assumedthat the proportion of people in eachdegree of severity for each age wasrepresentative of the current population ofthat age. We applied these proportions tothe A(0,j) as estimated above.
Transitionprobabilities innephropathy(excludingmortality rates)
Diabetes Control and Complication Trial (1990,1993, 1996); Niessen (2002)
Niessen (2002) developed Markov chain modelsof diabetes complications, also on the DCCT study. The DCCT study was a major, multi-centre studyof 1,441 diabetic patients in the US, lasted nineyears. The study quantifies the effect of intensetreatment on progression in microvascularsequelae.These data do not refer to the English populationand some are ten years old. They reporttransition probabilities based on longitudinalstudies but the original dataset of the study is notavailable. Data are usually reported for the wholepopulation in the study or for wide age groups.
We assumed that the transitionprobabilities apply to the current diabeticpopulation in England.
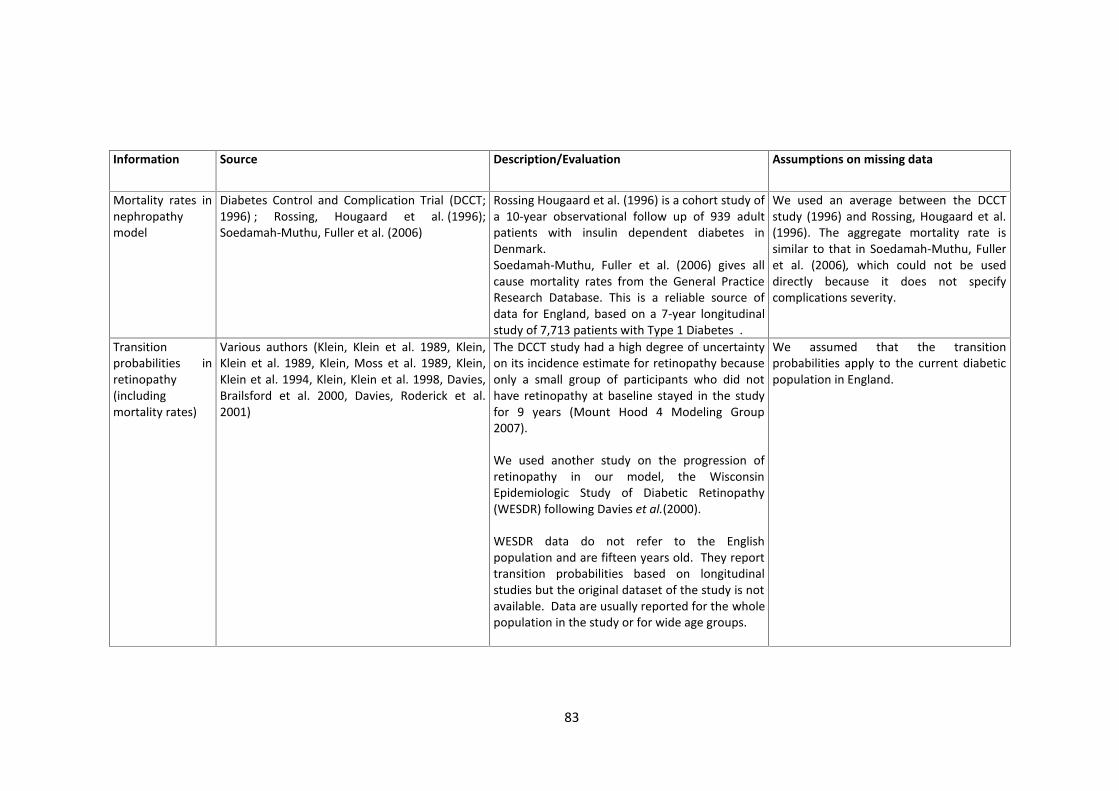
83
Information Source Description/Evaluation Assumptions on missing data
Mortality rates innephropathymodel
Diabetes Control and Complication Trial (DCCT;1996) ; Rossing, Hougaard et al. (1996);Soedamah-Muthu, Fuller et al. (2006)
Rossing Hougaard et al. (1996) is a cohort study ofa 10-year observational follow up of 939 adultpatients with insulin dependent diabetes inDenmark.Soedamah-Muthu, Fuller et al. (2006) gives allcause mortality rates from the General PracticeResearch Database. This is a reliable source ofdata for England, based on a 7-year longitudinalstudy of 7,713 patients with Type 1 Diabetes .
We used an average between the DCCTstudy (1996) and Rossing, Hougaard et al.(1996). The aggregate mortality rate issimilar to that in Soedamah-Muthu, Fulleret al. (2006), which could not be useddirectly because it does not specifycomplications severity.
Transitionprobabilities inretinopathy(includingmortality rates)
Various authors (Klein, Klein et al. 1989, Klein,Klein et al. 1989, Klein, Moss et al. 1989, Klein,Klein et al. 1994, Klein, Klein et al. 1998, Davies,Brailsford et al. 2000, Davies, Roderick et al.2001)
The DCCT study had a high degree of uncertaintyon its incidence estimate for retinopathy becauseonly a small group of participants who did nothave retinopathy at baseline stayed in the studyfor 9 years (Mount Hood 4 Modeling Group2007).
We used another study on the progression ofretinopathy in our model, the WisconsinEpidemiologic Study of Diabetic Retinopathy(WESDR) following Davies et al.(2000).
WESDR data do not refer to the Englishpopulation and are fifteen years old. They reporttransition probabilities based on longitudinalstudies but the original dataset of the study is notavailable. Data are usually reported for the wholepopulation in the study or for wide age groups.
We assumed that the transitionprobabilities apply to the current diabeticpopulation in England.
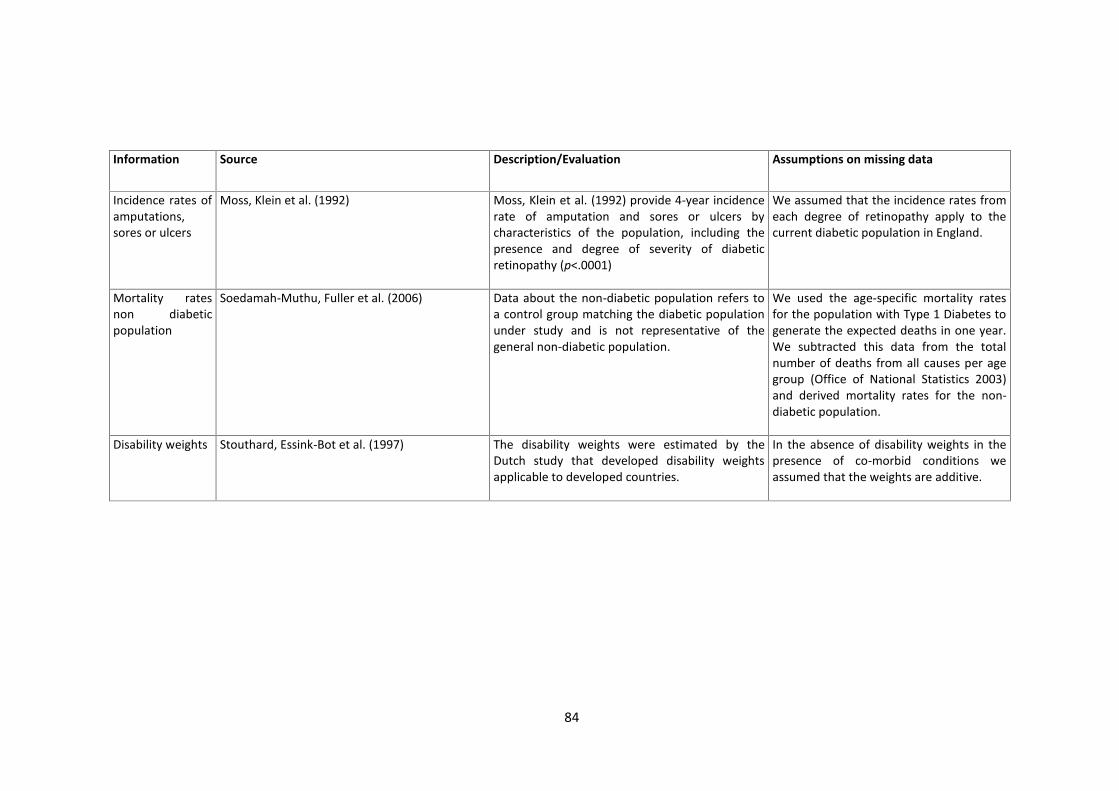
84
Information Source Description/Evaluation Assumptions on missing data
Incidence rates ofamputations,sores or ulcers
Moss, Klein et al. (1992) Moss, Klein et al. (1992) provide 4-year incidencerate of amputation and sores or ulcers bycharacteristics of the population, including thepresence and degree of severity of diabeticretinopathy (p<.0001)
We assumed that the incidence rates fromeach degree of retinopathy apply to thecurrent diabetic population in England.
Mortality ratesnon diabeticpopulation
Soedamah-Muthu, Fuller et al. (2006) Data about the non-diabetic population refers toa control group matching the diabetic populationunder study and is not representative of thegeneral non-diabetic population.
We used the age-specific mortality ratesfor the population with Type 1 Diabetes togenerate the expected deaths in one year.We subtracted this data from the totalnumber of deaths from all causes per agegroup (Office of National Statistics 2003)and derived mortality rates for the non-diabetic population.
Disability weights Stouthard, Essink-Bot et al. (1997) The disability weights were estimated by theDutch study that developed disability weightsapplicable to developed countries.
In the absence of disability weights in thepresence of co-morbid conditions weassumed that the weights are additive.

85
The benefits of intensive glucose control are the difference between estimates of
BoD with and without the intervention. In the absence of evidence on the level of
disability from co-morbid conditions (e.g. retinopathy and nephropathy affecting the
same person), we assumed that the disability from renal complications could be
meaningfully added to the disability from eye and foot complications, that is, for
instance, the disability of a patient with both nephropathy and severe retinopathy
contributes 0.29+0.43 YLDs (0.72 YLDs). The Dutch study for disability weights provided
weights for these separate complications (Stouthard, Essink-Bot et al. 1997). For
comparison, this means that a year spent with diabetic nephropathy and severe visual
impairments would have the same disability weight as, e.g., schizophrenia with several
psychotic episodes and some permanent impairments, or a year of a child/adolescent in
permanent stage with complex not curatively operable congenital heart disease.
Patients with all three complications at the highest degree of severity would contribute
0.91 YLDs (0.29+0.43+0.19).
Our estimates of the potential net gain in output from intensive glucose control are
based on estimated unit costs as outlined in Table 5 and Table 6.
Table 5 Cost of monitoring glucose levels and prescribing insulin
Item unitary cost
Conventional treatment Intensive treatment*
items peryear
annual costper diabetic
patient
items peryear
annual costper diabetic
patientlancets £0.07 730 £51 1,278 £89glucose teststripes £0.87 730 £633 1,278 £1,107
glucometer £40.00 0 £11 0 £11insulin £0.26 730 £190 1,278 £332insulinsyringes £0.15 730 £110 1,278 £192
insulin pen £15.00 0 £4 0 £4diabetesclinic visits £106.00 1 £106 12 £1,272
nursing staff £34.00 - £- 9 £295total £1,105 £3,303
*When we run the model replacing monthly visit with specialist nurses on thephone, we change the intensive treatment assuming one annual visit at the clinicand three telephone conversations per week of 10 minutes each with the specialistnurse, for a total cost of intensive treatment of £2,726 per patient per year; whenwe tested the cost implications of using insulin pumps, we used the average annualcost of the pump and consumables (including savings from reduced use of insulin)from a recent Health Technology Assessment study (Colquitt, Green et al. 2004)

86
assuming monitoring was provided through telephone conversation with aspecialist nurse, for a total annual cost of £4,333 per patient per year.
These costs assume the definition of intensive glucose control as it occurred in the
original longitudinal studies (Rossing, Hougaard et al. 1996, Soedamah-Muthu, Fuller et
al. 2006) and consisted of administration of insulin at least three times a day (or with an
insulin pump); insulin dosage, dietary intake and exercise adjustment according to
results of self-monitoring of blood glucose; self-monitoring of blood glucose at least four
times per day; monthly measurement of HbA1c; monthly visit at the diabetic centre; and
specialist calls during the month to review regimens. We ran three sensitivity analyses of
our estimates of costs. First, we replaced monthly clinic visits with telephone calls from
a specialist nurse, which is a more realistic assumption of what might happen outside
research conditions and does not appear to reduce health benefits (Thompson, Kozak et
al. 1999). Second, we assumed the use of insulin pumps rather than multiple daily
injections (although there is some evidence that insulin pumps are clinically more
effective than multiple daily injections, most of the benefit is in terms of hypoglycaemic
events or practical convenience and would not significantly affect microvascular
complications). Third, we allowed for the cost of treating a diabetic patient to be about
30% higher than a non-diabetic one and about 27% above the average cost for the
general population (Currie, Kraus et al. 1997).
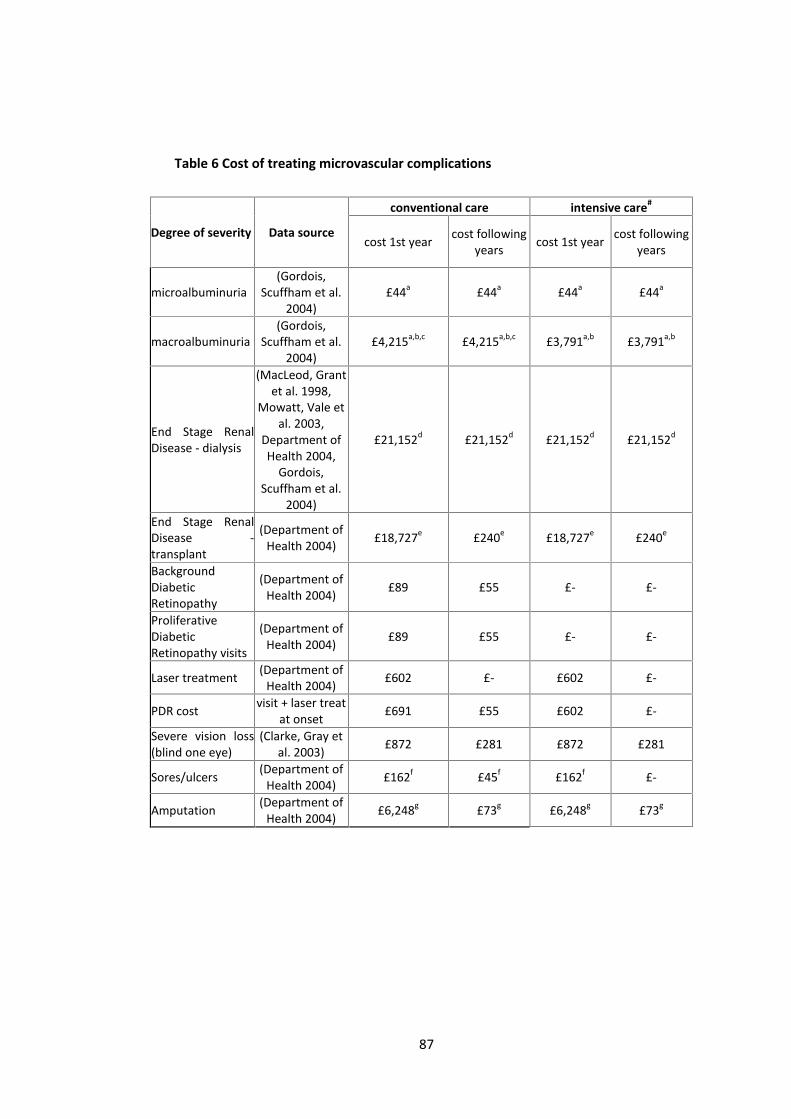
87
Table 6 Cost of treating microvascular complications
Degree of severity Data source
conventional care intensive care#
cost 1st year cost followingyears cost 1st year cost following
years
microalbuminuria(Gordois,
Scuffham et al.2004)
£44a £44a £44a £44a
macroalbuminuria(Gordois,
Scuffham et al.2004)
£4,215a,b,c £4,215a,b,c £3,791a,b £3,791a,b
End Stage RenalDisease - dialysis
(MacLeod, Grantet al. 1998,
Mowatt, Vale etal. 2003,
Department ofHealth 2004,
Gordois,Scuffham et al.
2004)
£21,152d £21,152d £21,152d £21,152d
End Stage RenalDisease -transplant
(Department ofHealth 2004) £18,727e £240e £18,727e £240e
BackgroundDiabeticRetinopathy
(Department ofHealth 2004) £89 £55 £- £-
ProliferativeDiabeticRetinopathy visits
(Department ofHealth 2004) £89 £55 £- £-
Laser treatment (Department ofHealth 2004) £602 £- £602 £-
PDR cost visit + laser treatat onset £691 £55 £602 £-
Severe vision loss(blind one eye)
(Clarke, Gray etal. 2003) £872 £281 £872 £281
Sores/ulcers (Department ofHealth 2004) £162f £45f £162f £-
Amputation (Department ofHealth 2004) £6,248g £73g £6,248g £73g
88
4.3.3 Results4.3.3.1 Health gains
Table 7 and the following Figures report annualised estimates for various measures
of reductions in BoD and gains in DALYs.
The yearly estimates of the current BoD from type 1 diabetes in England was about
2,000 deaths; 66,000 YLLs and 34,000 YLDs; 100,000 undiscounted and 63,000
discounted DALYs. In the first five years and the steady state the estimated benefits
from intensive glucose control are reductions in the BoD of about: 10 and 400 deaths;
300 and 11,000 YLLs; 1,200 and 11,000 YLDs; and 1,500 and 24,000 undiscounted DALYs;
and 1,200 and 18,000 discounted DALYs. These are underestimates of the benefits as
they do not include reductions in BoD from acute diabetes events (ketoacidosis), non-
fatal myocardial infarctions, non-fatal strokes and coronary revascularisations, and this
qualification also applies to our estimates of the monetary valuation of these benefits.
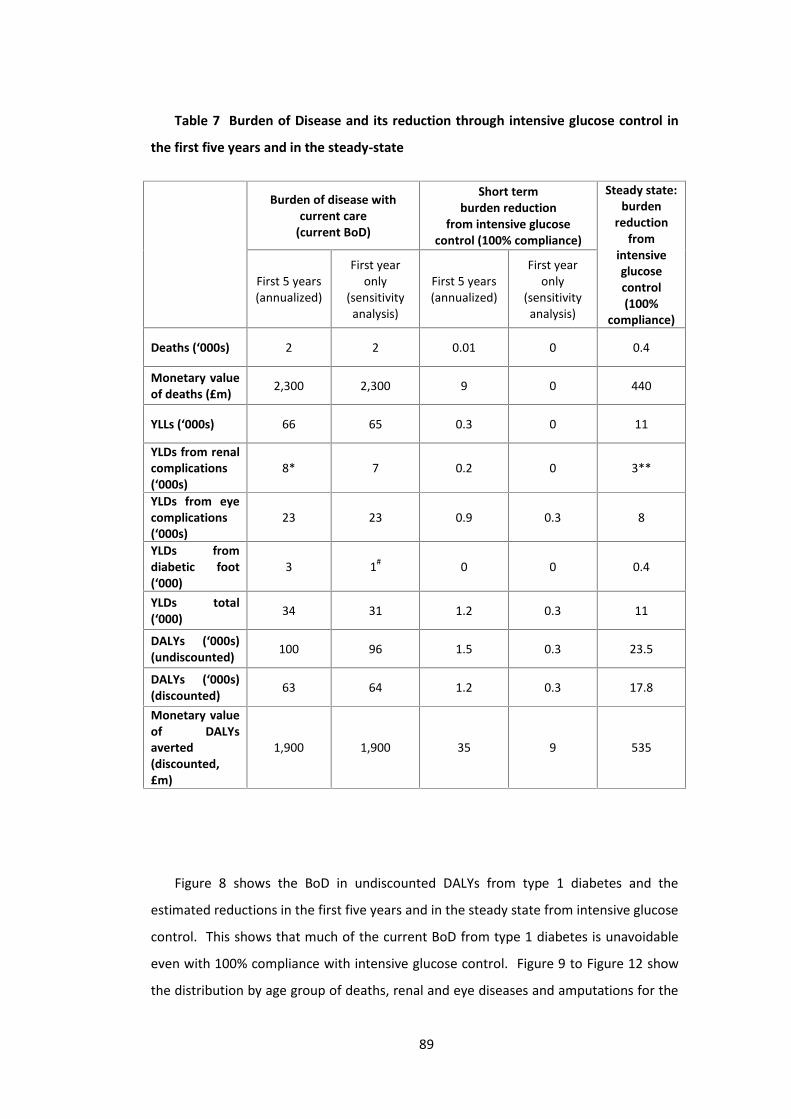
89
Table 7 Burden of Disease and its reduction through intensive glucose control in
the first five years and in the steady-state
Burden of disease withcurrent care
(current BoD)
Short termburden reduction
from intensive glucosecontrol (100% compliance)
Steady state:burden
reductionfrom
intensiveglucosecontrol(100%
compliance)
First 5 years(annualized)
First yearonly
(sensitivityanalysis)
First 5 years(annualized)
First yearonly
(sensitivityanalysis)
Deaths (‘000s) 2 2 0.01 0 0.4
Monetary valueof deaths (£m) 2,300 2,300 9 0 440
YLLs (‘000s) 66 65 0.3 0 11
YLDs from renalcomplications(‘000s)
8* 7 0.2 0 3**
YLDs from eyecomplications(‘000s)
23 23 0.9 0.3 8
YLDs fromdiabetic foot(‘000)
3 1# 0 0 0.4
YLDs total(‘000) 34 31 1.2 0.3 11
DALYs (‘000s)(undiscounted) 100 96 1.5 0.3 23.5
DALYs (‘000s)(discounted) 63 64 1.2 0.3 17.8
Monetary valueof DALYsaverted(discounted,£m)
1,900 1,900 35 9 535
Figure 8 shows the BoD in undiscounted DALYs from type 1 diabetes and the
estimated reductions in the first five years and in the steady state from intensive glucose
control. This shows that much of the current BoD from type 1 diabetes is unavoidable
even with 100% compliance with intensive glucose control. Figure 9 to Figure 12 show
the distribution by age group of deaths, renal and eye diseases and amputations for the

90
first five years and in the steady state. All these Figures bring out the common message
that the benefits of intensive control appear to be much greater in the long run than the
short run.
Figure 8 Estimates of BoD (undiscounted DALYs) from type 1 diabetes and
reductions in the first five years and steady state from intensive glucose control
Figure 9 ‘Avoidable’ deaths through intensive glucose control in the first five years
and in the steady state by age at the beginning of the intervention
Undiscounted BoD and reduction from intervention
-
20,000
40,000
60,000
80,000
100,000
120,000
Current BoD Avoidable BoD from intervention infirst 5 years
Avoidable BoD from intervention insteady state
DALY
s pe
r yea
r
Deaths - annual reduction from intervention
-20
0
20
40
60
80
100
120
140
0-9 10-19 20-29 30-39 40-49 50-59 60-69 70-79 80+
age group
case
s pe
r yea
r
first 5 yearssteady state
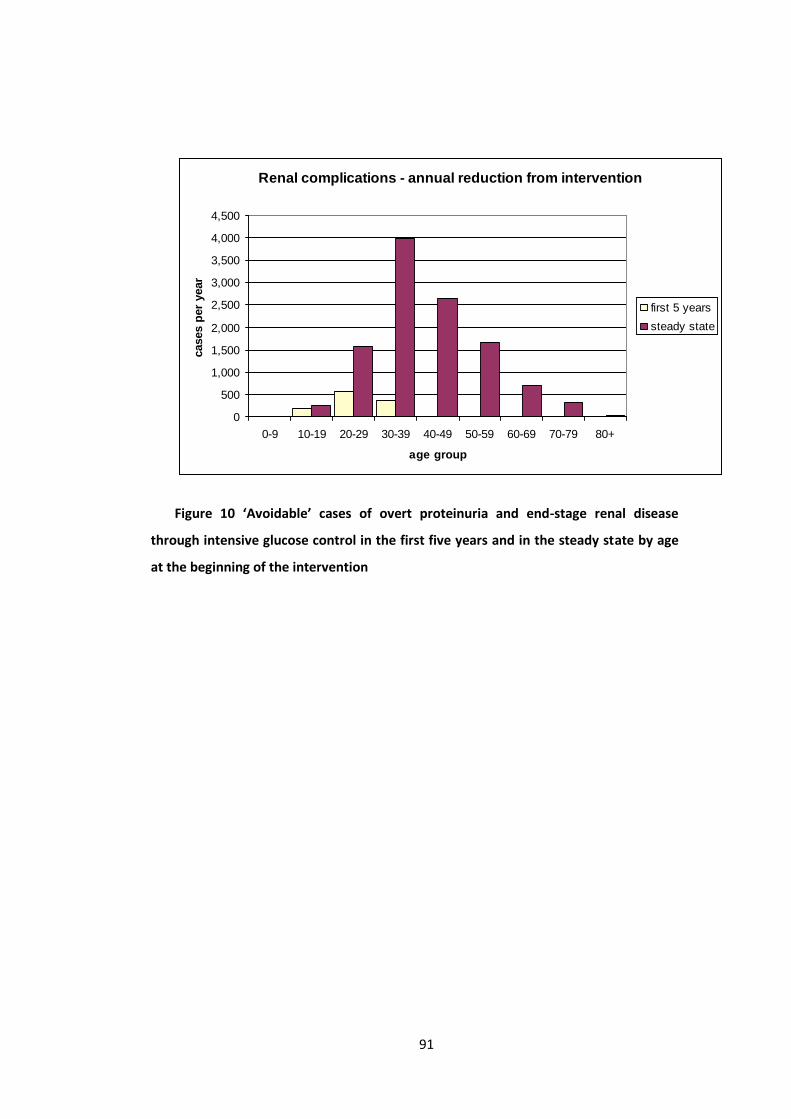
91
Figure 10 ‘Avoidable’ cases of overt proteinuria and end-stage renal disease
through intensive glucose control in the first five years and in the steady state by age
at the beginning of the intervention
Renal complications - annual reduction from intervention
0
500
1,000
1,500
2,000
2,500
3,000
3,500
4,000
4,500
0-9 10-19 20-29 30-39 40-49 50-59 60-69 70-79 80+
age group
case
s pe
r yea
r
first 5 yearssteady state

92
Figure 11 ‘Avoidable’ cases of severe visual disorders through intensive glucose
control in the first five years and in the steady state by age at the beginning of the
intervention
Figure 12 Avoidable’ cases of amputation through intensive glucose control in the
first five years and in the steady state by age at the beginning of the intervention
Eye complications - annual reduction from intervention
0
500
1,000
1,500
2,000
2,500
3,000
3,500
4,000
4,500
5,000
0-9 10-19 20-29 30-39 40-49 50-59 60-69 70-79 80+
age group
case
s pe
r yea
r
first 5 yearssteady state
Amputations of toe or foot - annual reduction from intervention
0
50
100
150
200
250
0-9 10-19 20-29 30-39 40-49 50-59 60-69 70-79 80+
age group
case
s pe
r yea
r
first 5 yearssteady state
93
4.3.3.2 Net costs and net gains in output
We estimated that:
the annual cost to prescribe, monitor and treat microvascular complications of
diabetes type 1 in England is currently about £380m (most of which is spent on
monitoring the disease, prescribing insulin and treating renal complications as
summarised in Table 8);
the introduction of intensive monitoring increases the cost of insulin prescribing
and monitoring by £350m and reduces the annual costs of complications by
£20m in the first five years; and by £370m and £100m respectively in the steady
state;
reductions in costs for eye diseases are mainly realized in the short run (£8m
compared with long-run savings of £12m);
reductions in costs for renal complications are mainly realized in the long run
(£84m compared with short-run savings of £13m).

94
Table 8 Annual costs and savings (negative figures) from intensive glucose control
in the first five years and the steady state
Conventional care(current spend)
in £ m
Intensive glucose controlassuming monthly visit at
diabetic clinic as in originalDCCT study
Intensive glucose controlreplacing monthly visits
with more frequenttelephone supervision by
specialist nurse
Infirstyear
In first fiveyears
(annualized)
First fiveyears:
change inexpenditure(annualized)
in £ m
Steadystate:
change inexpenditure
in £ m
First fiveyears:
change inexpenditure(annualized)
in £ m
Steadystate:
change inexpenditure
in £ m
Insulinprescriptionand glucosemonitoring
187 175 + 349 + 373 +257 +275
Treatmentofnephropathy
175 169 - 13 - 84 -6 -79
Treatmentofretinopathy
14 14 - 8 - 12 -2 -9
Treatmentof diabeticfoot
8 8 - 0.5 - 4 -0.5 -4
Expenditure 383 366 + 328 + 272 +249 +182
The estimates of costs and savings of intensive glucose control in the long run are of
what these would be in a year: i.e. we have not examined these using discounting. If the
savings were discounted, these would be negligible because of the long time lags
between the start of incurring the costs of intensive glucose control and making these
savings from reduced use of health services. In our estimates, the expected savings
from reduced complication do not offset the increased cost for monitoring and
prescribing. There is, however, evidence that these costs can be reduced. It is not
necessary to have monthly visits to the diabetic clinic: a telephone discussion with a
specialist nurse three times a week to adjust insulin dose and diet to the observed
glucose levels was successful in reducing HbA1c below the recommended level at six
months (Thompson, Kozak et al. 1999). This practice would reduce the extra costs to
about £270m and hence extra net costs to about £180m in the steady state.

95
We used these costs in Table 9, which gives results from comparing costs and
benefits in the short and in the long run. This shows that the net cost of intensive
glucose control in the short run are about six times larger than the monetary value of
the health benefits. If the intervention were to be introduced and sustained over its
run-in period, however, the monetary value of health benefits would be three times the
net cost of the intervention.
Table 9 Net gain in output in the first five years and in the steady state
Intervention infirst five years
in £m
Intervention in thesteady state
in £m
Monetary value of DALYsaverted (at £30k per DALY,discounting YLLs)
30 530
Extra costs 250 180
Gain (loss) in output (220) 350
4.3.3.3 Model validity
Assessing the validity of our model is difficult, because routinely available data
usually refers to type 1 and type 2 diabetes combined (even when these labels are used,
most patients belong to an ‘unspecified’ type of diabetes). The available combined
figures are likely to be a reflection of prevalence and incidence rates of diabetes type 2,
which is about 90% of the diabetic population and is not representative of the
population with type 1. In fact, type 1 typically has a much younger onset compared to
diabetes type 2 and the duration of diabetes is one of the main risk factors of
complications. Where data on type 1 diabetes exist, usually either there is no
breakdown by age, or data are not for England, or they are not routinely available and
hence could not be used as input for our initial condition. We now discuss how we
compared the prevalence of complications resulting from our initial condition with data
from the literature.
Diabetic nephropathy

96
Table 10 compares prevalence rates of renal complications by degree of severity in
our model and in the literature. Our estimates are generally consistent with data from
empirical analysis, although we might overestimate the prevalence of end stage renal
disease. The Renal Registry in England estimates that 30,000 people are receiving renal
replacement therapy (including those who received a kidney transplant) and 5,000
started renal replacement therapy in 2002 (Ansell, Feest et al. 2003). Our model
estimates that there are about 6,000 people with End Stage Renal disease and 1,000
new cases per year among patients with type 1 diabetes which would correspond to
about 16% and 20% respectively of all patients receiving renal replacement therapy. This
might be an overestimate and we will indicate the health benefits and cost component
separately for ESRD in the result section for transparency.
Table 10 Prevalence rates of renal complications
Normo-albuminuriaprevalence
Micro-albuminuriaprevalence
Macro-albuminuriaprevalence
End Stage RenalDisease
prevalence
Model estimates(conventional care) 57% 28% 11% 4%
Harvey, Rizvi et al.(2001)
N=1,297; Wales,UK
61.4%
At 15-29 yearsduration: 27.2%;
Below 5 yearsduration: 14%
11% 1.8%
DARTS (2001) n/a n/a n/a 1%
Finne et al. (2005)
n=20,005; Finlandn/a n/a n/a
Cumulativeincidence at 20
years from onset= 2.2%; at 30
years from onset= 7.8%
Diabetic retinopathy
Estimates of diabetic retinopathy for the population with type 1 diabetes vary
greatly. A recent literature review on prevalence reports rates between 0 and 84% for
diabetic retinopathy in general; and between 1.1% and 25% for Proliferative Diabetic

97
Retinopathy (Williams, Airey et al. 2004). We report in Table 9 the prevalence of diabetic
retinopathy in the WESDR study (which we used as a basis of our model) and the
estimated prevalence based on the model by Davies et al. (2000) who used the same
dataset. Table 11 shows that our estimates are reasonable, once we assume the WESDR
data can be used for England. Furthermore, the 9-year cumulative incidence of
background diabetic retinopathy in our model is 81%, which is similar to estimates from
the EAGLE model (77%), which also uses the WESDR study (Mount Hood 4 Modeling
Group 2007).
Table 11 Prevalence rates of eye complications
No retinopathy
BackgroundDiabeticRetinopathy
ProliferativeDiabeticRetinopathy
Severe visualloss(includingblindness)
Model estimates(conventionalcare)
26% 40% 23% 8%
Klein et al.(1984; US) 30%
46%(of which 17%
severe non-proliferative
diabeticretinopathy)
14% 9%
(Davies, Rodericket al. 2001) 20% 49%
30%(25% PDR and 5%
untreatable)
Diabetic foot
Health Episode Statistics (HES) report a total of 10,700 finished consultant episodes
(FCEs) of amputation, including traumatic amputations and procedures associated with
diabetic foot such as amputation of stumps. Our model predicts about 1,300 cases of
amputation a year in the population with type 1 diabetes (toe and foot amputation)
which would correspond to about 12% of all amputation procedures conducted in
England (including diabetes type 2 and non-diabetic patients). From the publicly
available HES data we could not identify what proportion of the total FCEs referred to

98
people with type 1 diabetes. Results for diabetic foot are reported separately from those
of renal and eye complications for transparency.
We compared our results with 4-year incidence rates of amputation and
sores/ulcers in Moss et al. (1992) and show results in Table 10. Our prevalence
estimates are based on the work by Moss and, as one should expect, the incidence rates
correspond. It is reassuring, however, to observe consistency in the overall incidence
rate (last column in Table 12), which is an output of our model and our assumptions on
those with different severities of retinopathy.
We did not find data on prevalence or incidence of diabetic foot for the population
with type 1 diabetes in England to validate the diabetic foot model externally. Our
model, however, estimates an annual incidence of 2.8% for sores/ulcers and 0.7% for
amputation, which is similar to 2.1% and 0.6% mean national incidence rates for type 1
diabetes in the Netherlands (Ortegon, Redekop et al. 2004).
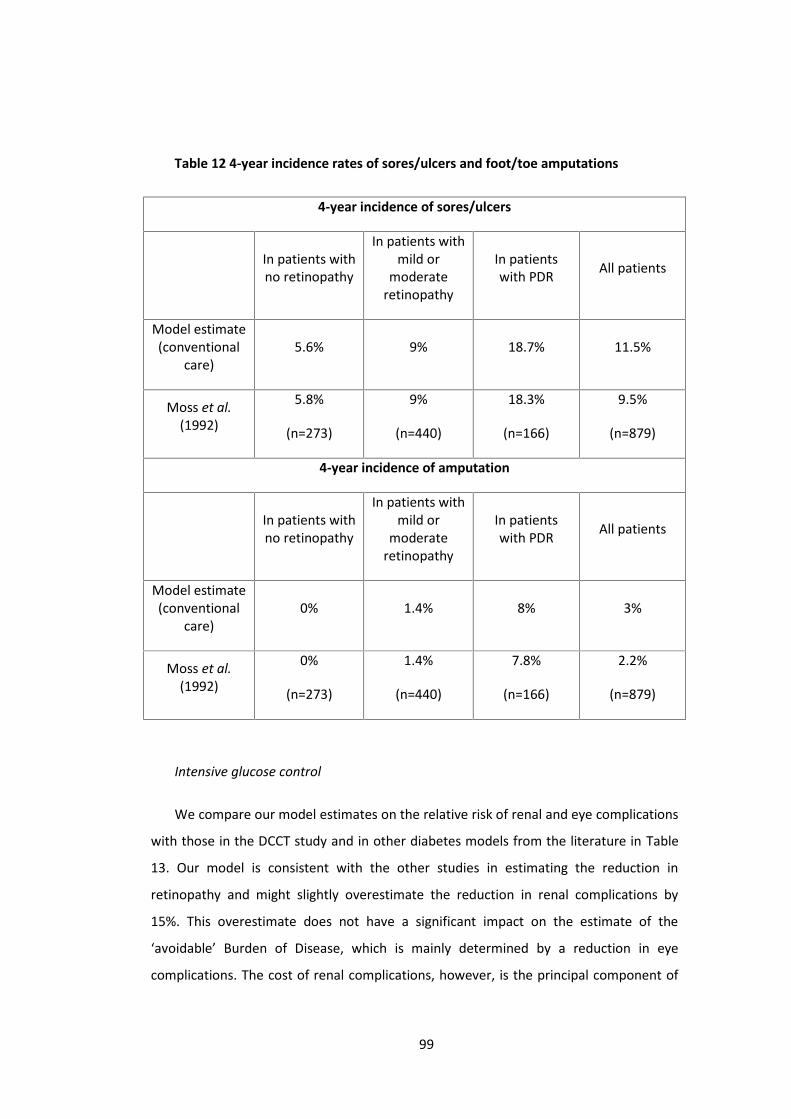
99
Table 12 4-year incidence rates of sores/ulcers and foot/toe amputations
4-year incidence of sores/ulcers
In patients withno retinopathy
In patients withmild or
moderateretinopathy
In patientswith PDR All patients
Model estimate(conventional
care)5.6% 9% 18.7% 11.5%
Moss et al.(1992)
5.8%
(n=273)
9%
(n=440)
18.3%
(n=166)
9.5%
(n=879)
4-year incidence of amputation
In patients withno retinopathy
In patients withmild or
moderateretinopathy
In patientswith PDR All patients
Model estimate(conventional
care)0% 1.4% 8% 3%
Moss et al.(1992)
0%
(n=273)
1.4%
(n=440)
7.8%
(n=166)
2.2%
(n=879)
Intensive glucose control
We compare our model estimates on the relative risk of renal and eye complications
with those in the DCCT study and in other diabetes models from the literature in Table
13. Our model is consistent with the other studies in estimating the reduction in
retinopathy and might slightly overestimate the reduction in renal complications by
15%. This overestimate does not have a significant impact on the estimate of the
‘avoidable’ Burden of Disease, which is mainly determined by a reduction in eye
complications. The cost of renal complications, however, is the principal component of

100
the savings in treating complications in the intensive care scenario in the steady state.
Assuming a 15% lower savings from fewer renal complications, however, would not
have an impact on the order of magnitude of our results: the net loss in the first five
years would be unaffected and the net gain in the steady state would reduce from
£350m to £330m.
Table 13 also reports estimates in the reduction of neuropathy, but our model does
not model these complications explicitly. The relative risk in 9-year incidence of
sores/ulcers and amputation in the intensive glucose control scenario is 0.95 and 0.91
which is much lower than the 0.47 relative risk of neuropathy at clinical examination in
the DCCT study. A reduction in neuropathy does not imply an equivalent reduction in
diabetic foot, however, the relatively small reduction in diabetic foot estimated in our
model compared to the relatively high reduction in neuropathy indicates that we might
have underestimated the ‘avoidable’ burden of disease.
Table 13 Estimates of the risk reduction in 9-year incidence from microvascular
complications
DCCTstudy Our model EAGLE
modelCOREmodel
Archimedesmodel
Microalbuminuria 0.59 0.68 0.61 0.54 0.53
BDR 0.27 0.33 0.90 0.37 0.32
Neuropathy 0.47 n/a 0.29 0.39 n/a
Costing
The estimate of the current, annual cost of monitoring, prescribing and treating
microvascular complications amounts to about £2,300 per patient. This is broadly
consistent with a recent estimate of the total healthcare cost of treating people with
type 1 diabetes in the UK by Currie et al. (2007). The annual healthcare cost of
participants in their survey spent about £3,200 a year, including treatment and
prevention of macrovascular complications such as stroke and myocardial infarction.
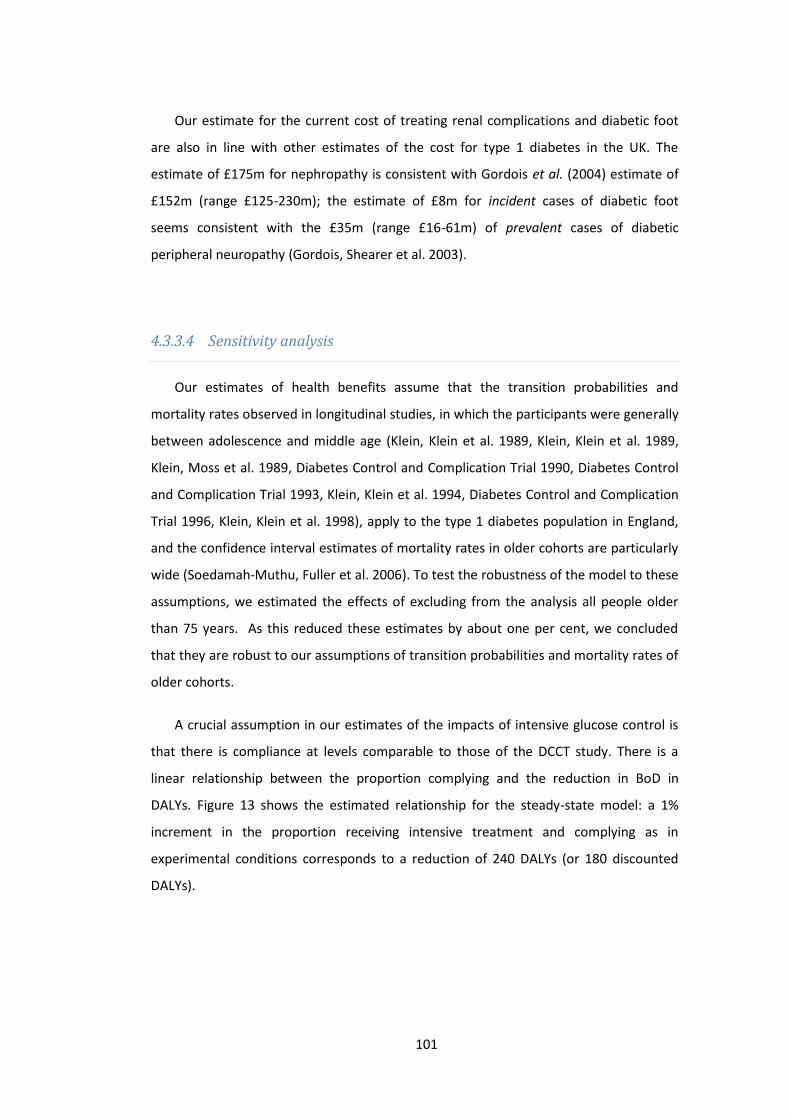
101
Our estimate for the current cost of treating renal complications and diabetic foot
are also in line with other estimates of the cost for type 1 diabetes in the UK. The
estimate of £175m for nephropathy is consistent with Gordois et al. (2004) estimate of
£152m (range £125-230m); the estimate of £8m for incident cases of diabetic foot
seems consistent with the £35m (range £16-61m) of prevalent cases of diabetic
peripheral neuropathy (Gordois, Shearer et al. 2003).
4.3.3.4 Sensitivity analysis
Our estimates of health benefits assume that the transition probabilities and
mortality rates observed in longitudinal studies, in which the participants were generally
between adolescence and middle age (Klein, Klein et al. 1989, Klein, Klein et al. 1989,
Klein, Moss et al. 1989, Diabetes Control and Complication Trial 1990, Diabetes Control
and Complication Trial 1993, Klein, Klein et al. 1994, Diabetes Control and Complication
Trial 1996, Klein, Klein et al. 1998), apply to the type 1 diabetes population in England,
and the confidence interval estimates of mortality rates in older cohorts are particularly
wide (Soedamah-Muthu, Fuller et al. 2006). To test the robustness of the model to these
assumptions, we estimated the effects of excluding from the analysis all people older
than 75 years. As this reduced these estimates by about one per cent, we concluded
that they are robust to our assumptions of transition probabilities and mortality rates of
older cohorts.
A crucial assumption in our estimates of the impacts of intensive glucose control is
that there is compliance at levels comparable to those of the DCCT study. There is a
linear relationship between the proportion complying and the reduction in BoD in
DALYs. Figure 13 shows the estimated relationship for the steady-state model: a 1%
increment in the proportion receiving intensive treatment and complying as in
experimental conditions corresponds to a reduction of 240 DALYs (or 180 discounted
DALYs).
102
Figure 13 Estimates of annual BoD in undiscounted DALYs from type 1 diabetes in
the steady state from 0 to 100% proportion of population complying with intensive
glucose control
Another assumption worth testing is that of offering intensive glucose monitoring to
all patients, including children and adolescents. On one hand, DCCT researchers were
cautious about the use of intensive glucose monitoring in children because of the
increased risk of hypoglycaemic events. On the other, the low proportion of adolescents
with glucose concentration below the recommended level might signal the rebellion
against parental or medical authority suggesting the possibility of very low compliance
rates with intensive treatment. Our model, however, assumes that most microvascular
complications arise after the age of 15 (with the exception of ulcers which we assume
Sensitivity analysis on compliance
-
20
40
60
80
100
120
- 10 20 30 40 50 60 70 80 90 100
% compliance
Bur
den
of d
isea
se ('
000)
Avoidable BoD withintensive glucose control
Unavoidable BoD

103
occurs at any age and amputation which we assume occurs only in people older than 30)
and excluding these age groups from the analysis would not significantly impact on the
estimates of health benefits: the estimate of the ‘avoidable’ burden of disease offering
intensive glucose control only to people aged 20 or older is just 0.1% lower both in the
short run and in the steady state. This result should be interpreted with caution because
our Markov chain assumes that the incidence of microvascular complications from the
age of 15 (or 30 for amputation) is independent from glucose concentrations maintained
in childhood and we did not find evidence to support or dismiss this assumption.
Clearly, however, the exclusion of children and adolescents from intensive glucose
monitoring would have an impact on costs. The sensitivity analysis shows that the
reduction in costs by providing intensive treatment only to patients who are 20 years old
or older is 50m in the short run and 60m in the steady state which would imply a lower
loss in net output in the first five years (£170m compared to £220 in the base case) and
a higher net gain in output in the steady state (£410m compared to £350 in the base
case).
To test the robustness of our cost estimates, we also assumed the use of insulin
pumps to replace the base case assumption of multiple daily injections. There is growing
interest in the use of insulin pumps as an alternative treatment to manage diabetes. In
comparison with multiple daily injections, insulin pumps improve quality of life in terms
of their higher efficacy on controlling glucose concentration, of reducing incidence of
adverse events (i.e. hypoglycaemic events) and their flexibility of lifestyle. However,
they are not currently considered cost-effective because of their higher cost (Colquitt,
Green et al. 2004). If all patients use insulin pumps (using the average annual cost from
Colquitt et al. (Colquitt, Green et al. 2004)), the incremental cost of insulin prescribing
and monitoring would be £515m in the short run (annualized figure over first 5 years)
and £547m in the steady state. This would consistently lower the net gains from Table
7; however, although this is an extreme and unrealistic assumption, the results would
still be a loss in the short run (£470m net loss in output) and a gain in the steady state
(£75 net gain in output).
We also assumed a cost of acute care (inpatient and outpatient) 27% higher than
the national average cost (Currie, Kraus et al. 1997). Under this scenario, the estimate of
the total current cost of insulin and microvascular complication increases from £370m to

104
£515m per year; the increase in spending from intensive glucose monitoring reduces
from £250m to £210m and from £180m to £105m in the first five year model and in the
steady state respectively assuming telephone discussion with a specialist nurse rather
than monthly visits to the diabetes clinic; from £330m to £285m and from £270m to
£190m in the first five years and in the steady state model assuming monthly visit as in
the original DCCT study. This is as expected because the higher cost of acute care
increases the savings from treating microvascular complications, and this determines a
lower net loss in the short run (£170m compared to £220m in the base case assuming
monitoring with nurse on the phone) and a higher gain in net output in the steady state
(£430m compared to £350m in the base case).
We ran a sensitivity analysis on the cost of peritoneal haemodialysis, assuming the
use of continuous ambulatory peritoneal dialysis (CAPD) instead of continuous cyclic
peritoneal dialysis (CCPD) which is cheaper although currently not considered cost-
effective (MacLeod, Grant et al. 1998). The resulting reduction in cost does not
significantly affect results (£169m current cost vs. £162 in base case; same reduction in
short run; 76m reduction nephropathy cost in steady state vs. £79 base case cheap or
£84 base case DCCT).
Finally we tested the monetary value of health benefits with two sensitivity
analyses. First, we use a lower figure of £20,000 as advocated by part of the literature
(e.g. Williams 2004). Second, we used the health benefits using the value of a statistical
life (HM Treasury, 2003). Both sensitivity analyses confirm a net loss of more than
£200m (£230 and £240 respectively) in the short run and a net gain above £180m in the
steady-state (£180 and £260 respectively).
4.3.4 DiscussionThis paper aimed to explore how disease models could be used in setting priorities
for strategic commissioning for populations. To set priorities using evidence, it is
essential to estimate impacts of interventions at the level of populations, but this can
only be done by disease modelling. An obstacle to the use of such models is that they
are often highly complex, demand rich sources of data, and take a long time to develop.
105
We have described the development of a parsimonious transparent model of the size
and timing of costs and benefits of intensive glucose control in the type 1 diabetes
population, which has produced approximate estimates that are adequate for priority
setting as shown by validation and sensitivity analysis. This paper has shown, that:
The current BoD from type 1 diabetes disease from microvascular complications
and premature mortality is about 100,000 DALYs of which one third is
attributable to low quality of life and two thirds to premature death. This is an
underestimate of the current burden of disease from diabetes type 1, because it
does not include disability due to acute diabetic events (ketoacidosis), non-fatal
myocardial infarctions, non-fatal strokes and coronary revascularisations.
Introducing intensive glucose control, in the short run, will almost double the
spend for monitoring glucose, prescribing insulin and treating microvascular
complications but have small effect in reducing the burden of disease (a 1-2%
reduction).
Introducing intensive glucose control, in the long run, reduced the BoD by about
30%: with this being approximately equally divided into benefits from lower
mortality and lower morbidity. The lower cost of treating complications in the
long run will still not offset the increased cost of monitoring and insulin
prescribing (50% higher than conventional care); however, the value of the
health benefits more than compensates the increase in costs.
The study also highlighted inadequacies in the data that are routinely collected in
England: chronic diseases, such as diabetes, are frequently not reported on death
certificates thereby masking the impact of long term consequences; there are significant
gaps in data on the type of diabetes, age of the patient, duration of diabetes, presence
of complication with degree and duration, sex and current treatment regime. In England
many of these data are in principle available for purchase from the General Practice
Research Database that offers a sample of about 7,500-8,000 type 1 diabetes patients,
that is about 4.5% of the total type 1 diabetes population (Soedamah-Muthu, Fuller et
al. 2006, Soedamah-Muthu, Fuller et al. 2006). These data ought to be collected in
disease registers to support evidence-based policy making. An initiative that has the
106
potential to provide this information in England is the current national Programme for IT
in the NHS, Connecting for Health.
The final point concerns the approach to modelling illustrated by this paper. In
setting priorities, information on costs and benefits in the short and long run for options
for type 1 diabetes is obviously insufficient. We have applied our approach to a number
of different interventions: suicide prevention, treatment of depression, prescribing of
statins to reduce cholesterol, and various options for the prevention and treatment of
strokes [86]. In all this work, it seems to us that relatively simple models, similar to that
in this paper described for type 1 diabetes have been adequate in making comparisons
for setting priorities for strategic commissioning. Indeed we see the key next step as not
the development of more complex models for each of these but developing a simple
method to generate adequate estimates for the wide range of interventions that must
be considered by strategic commissioners.
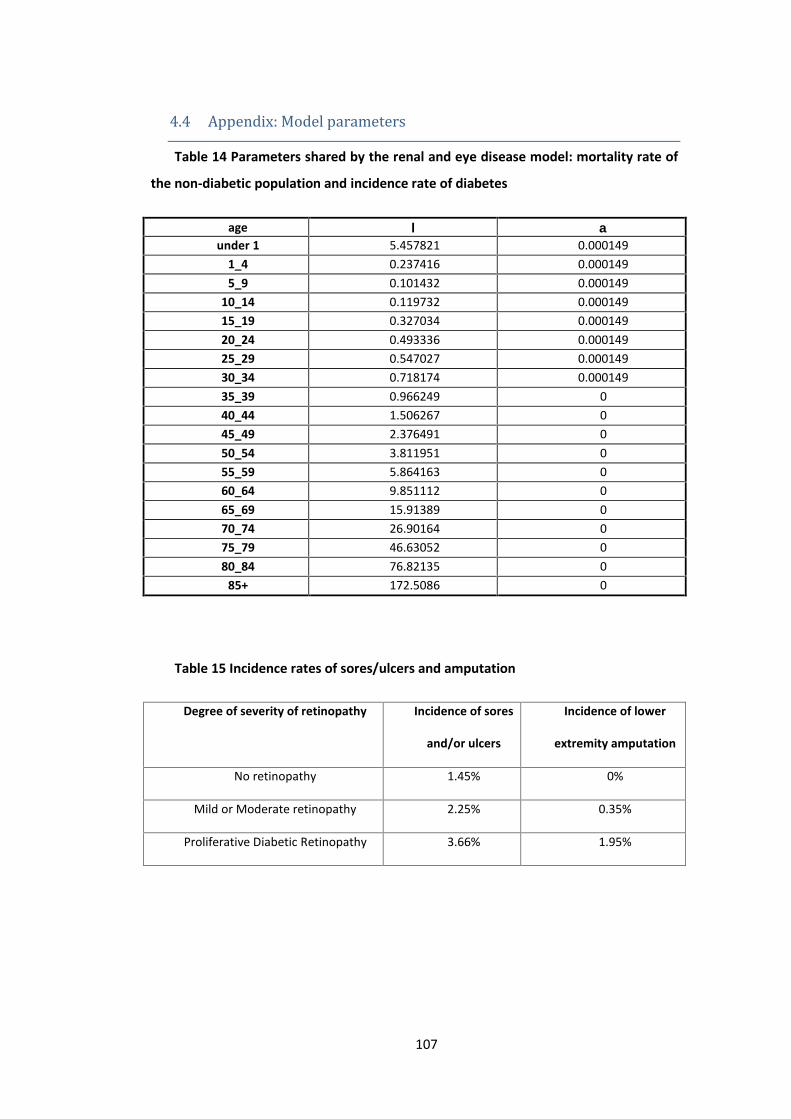
107
4.4 Appendix: Model parametersTable 14 Parameters shared by the renal and eye disease model: mortality rate of
the non-diabetic population and incidence rate of diabetes
age under 1 5.457821 0.000149
1_4 0.237416 0.0001495_9 0.101432 0.000149
10_14 0.119732 0.00014915_19 0.327034 0.00014920_24 0.493336 0.00014925_29 0.547027 0.00014930_34 0.718174 0.00014935_39 0.966249 040_44 1.506267 045_49 2.376491 050_54 3.811951 055_59 5.864163 060_64 9.851112 065_69 15.91389 070_74 26.90164 075_79 46.63052 080_84 76.82135 0
85+ 172.5086 0
Table 15 Incidence rates of sores/ulcers and amputation
Degree of severity of retinopathy Incidence of sores
and/or ulcers
Incidence of lower
extremity amputation
No retinopathy 1.45% 0%
Mild or Moderate retinopathy 2.25% 0.35%
Proliferative Diabetic Retinopathy 3.66% 1.95%

108
Table 16 Transition probabilities in the renal disease complication model
ageExcess mortality Transition probabilities
Intensive glucose control Conventional care’(s0) ’(s1) ’(s2) ’(s3) 0->1 1->2 2->3 0->1 1->2 2->3
under 1 0.006092 0.008683 0.011820 0.000000 0 0 0 0 0 01_4 0.005047 0.006595 0.008166 0.000000 0 0 0 0 0 05_9 0.005020 0.006541 0.008071 0.000000 0 0 0 0 0 0
10_14 0.005024 0.006548 0.008084 0.000000 0 0 0 0 0 015_19 0.005065 0.006631 0.008229 0.000000 0.022 0.02 0.05 0.034 0.06 0.0520_24 0.005099 0.006697 0.008345 0.030809 0.022 0.02 0.05 0.034 0.06 0.0525_29 0.005109 0.006719 0.008383 0.030755 0.022 0.02 0.05 0.034 0.06 0.0530_34 0.005144 0.006787 0.008503 0.030584 0.022 0.02 0.05 0.034 0.06 0.0535_39 0.005193 0.006886 0.008676 0.107831 0.022 0.02 0.05 0.034 0.06 0.0540_44 0.005301 0.007103 0.009054 0.107291 0.022 0.02 0.05 0.034 0.06 0.0545_49 0.005475 0.007451 0.009664 0.106420 0.036 0.03 0.05 0.057 0.03 0.0550_54 0.005762 0.008025 0.010668 0.145978 0.036 0.03 0.05 0.057 0.03 0.0555_59 0.006173 0.008846 0.012105 0.143926 0.036 0.03 0.05 0.057 0.03 0.0560_64 0.006970 0.010440 0.014896 0.176940 0.036 0.03 0.05 0.057 0.03 0.0565_69 0.008183 0.012866 0.019140 0.195137 0.036 0.03 0.05 0.057 0.03 0.0570_74 0.010380 0.017261 0.026831 0.184149 0.036 0.03 0.05 0.057 0.03 0.0575_79 0.014326 0.025152 0.040641 0.164420 0.036 0.03 0.05 0.057 0.03 0.0580_84 0.020364 0.037229 0.061775 0.134229 0.036 0.03 0.05 0.057 0.03 0.05
85+ 0.039502 0.075503 0.128756 0.128756 0.036 0.03 0.05 0.057 0.03 0.05

109
Table 17 Transition probabilities in the eye disease complication model
ageExcess mortality Intensive glucose control Conventional care
’(s0) ’(s1) ’(s2) ’(s3) 0->1 1->2 2->3 0->1 1->2 2->3
under 1 0.0015 0.005 0.033186732 0.0331867 0 0 0 0 0 01_4 0.0015 0.005 0.025356124 0.0253561 0 0 0 0 0 05_9 0.0015 0.005 0.025152148 0.0251521 0 0 0 0 0 0
10_14 0.0015 0.005 0.025179598 0.0251796 0 0 0 0 0 015_19 0.0015 0.005 0.025490551 0.0254906 0.039 0.02544 0.01855 0.13 0.048 0.03520_24 0.0015 0.005 0.025740004 0.02574 0.039 0.02544 0.01855 0.13 0.048 0.03525_29 0.0015 0.005 0.025820541 0.0258205 0.039 0.02544 0.01855 0.13 0.048 0.03530_34 0.0015 0.005 0.026077261 0.0260773 0.039 0.02544 0.01855 0.13 0.048 0.03535_39 0.0015 0.005 0.026449374 0.0264494 0.039 0.02544 0.01855 0.13 0.048 0.03540_44 0.0015 0.005 0.027259401 0.0272594 0.039 0.02544 0.01855 0.13 0.048 0.03545_49 0.0015 0.005 0.028564737 0.0285647 0.039 0.02544 0.01855 0.13 0.048 0.03550_54 0.0015 0.005 0.030717927 0.0307179 0.039 0.02544 0.01855 0.13 0.048 0.03555_59 0.0015 0.005 0.033796245 0.0337962 0.039 0.02544 0.01855 0.13 0.048 0.03560_64 0.0015 0.005 0.039776668 0.0397767 0.039 0.02544 0.01855 0.13 0.048 0.03565_69 0.0015 0.005 0.048870835 0.0488708 0.039 0.02544 0.01855 0.13 0.048 0.03570_74 0.0015 0.005 0.06535246 0.0653525 0.039 0.02544 0.01855 0.13 0.048 0.03575_79 0.0015 0.005 0.09494578 0.0949458 0.039 0.02544 0.01855 0.13 0.048 0.03580_84 0.0015 0.005 0.140232025 0.140232 0.039 0.02544 0.01855 0.13 0.048 0.035
85+ 0.0015 0.005 0.2837629 0.2837629 0.039 0.02544 0.01855 0.13 0.048 0.035

110
Table 18 Disability weights
Health stateDisabilityweight(95% C.I)
Health state description in disability weight source Corresponding EQ 5D+classification Source
No complications 0.07 (0.047-0.094) “Uncomplicated diabetes mellitus” 111111 (90%), 112221
(10%)Stouthard et al.1997, p.73
Macroalbuminuria and ESRD 0.29 (0.201-0.380) “Diabetes mellitus with nephropathy” 112121 (80%), 113231
(20%)Stouthard et al.1997, p.73
Moderate retinopathy (BDR,non severe PDR)
0.17 (0.073-.278)
“[Diabetes mellitus with] moderate [vision disorders] (i.e., greatdifficulty reading small newspaper print, some difficulty recognizingfaces at 4m. distance”
112121 Stouthard et al.1997, p.75
Severe retinopathy 0.43 (0.339-0.521)
“[Diabetes mellitus with] severe [vision disorders] (i.e. unable to readsmall newspaper print, great difficulty or unable to recognize faces at4m. distance)”
123121 Stouthard et al.1997, p.75
Sores, ulcers and
Lower extremity amputation
0.19 (0.128-0.255)* “[Diabetes mellitus] with neuropathy” 111111 (75%), 222221
(20%), 222331 (5%)Stouthard et al.1997, p.73
*the global burden of disease study uses 0.3 for foot amputation and 0.102 for toe amputation (Murray and Lopez, 1996); there is no disability weight foramputation in the paper by Stouthard et al. (1997) which we used as the main source for weights in our study. The 0.19 weight for neuropathy in the Stouthard et al.paper is an average across different degree of severity and we use it both for sores/ulcers and amputations.
111
5 Portfolio decision analysis for population health
This chapter has been published as: M Airoldi and A Morton (2011) Portfolio Decision
Analysis for Population Health, in Salo, A. and Keisler, J. and Morton, Alec, (eds.) Portfolio
decision analysis: improved methods for resource allocation. Springer, Berlin. This book
has received the award for top decision analysis publication of 2011 by the Decision
Analysis Society.
Abstract
In this chapter we discuss the application of Multi-Criteria Portfolio
Decision Analysis in healthcare. The problem which we consider is that of
allocating a limited budget to healthcare for a defined population. In this
context, the healthcare planner needs to take into account the state of ill-
health of the population, on one hand, and the costs and benefits of
providing different healthcare interventions, on the other. To date, two
techniques have been applied widely to combine these two perspectives.
One of these techniques, Generalized Cost Effectiveness Analysis, relies on
simulating the impact of a portfolio of interventions on the costs and health
benefits for a given population. The other technique, Program Budgeting
and Marginal Analysis, emphasises the need to include more than the
‘health benefit’ criterion to capture the objective function of the health
planner and to engage local stakeholders to articulate their values and
assessing interventions. We present a case study to illustrate how a simple,
formal Multi-Criteria Portfolio Decision Analysis model can structure the
engagement of local stakeholders in exploring the resource allocation
problem explicitly. The case study also highlights current challenges for the
research community around the use of disease models, capturing
preferences relating to health inequalities, and handling unrelated future
costs.
112
5.1 BackgroundMany public sector planners have responsibility for defined populations, and work in
environments where key dimensions of performance are hard to measure, values are
contested, and decisions have to be negotiated between stakeholders within and
beyond the organization, and with the general population. This is particularly true of
healthcare. Despite the existence of a vast medical evidence base, interpreting that
evidence in the context of a particular population is not straightforward; tradeoffs
between different sorts of treatments for different sorts of patients inevitably arise; and
the professional status of healthcare workers and the intense public interest mean that
making decisions unilaterally behind closed doors is not regarded as acceptable.
In this chapter we outline the challenges of applying Portfolio Decision Analysis to
maintain and improve population health. In some healthcare systems, the scope of such
planning will be limited to public health interventions, as primary and acute care will be
delivered by organizations (such as insurers) which do not have responsibility for a
defined population, but which compete for business in a market. In other systems, such
as the English National Health Service, with which we are particularly familiar, almost all
healthcare is commissioned (at time of writing) by geographically defined health
authorities called “Primary Care Trusts”.
To understand the background, healthcare planning is dominated by two
communities of analytic professionals which represent two different perspectives on the
meaning of ‘healthcare need’ which have been labeled ‘humanitarian’ and ‘realist’
(Acheson 1978). A difficulty in healthcare planning is integrating these two perspectives.
On one hand, public health analysts tend to take a ‘humanitarian’ perspective. In
this perspective, the focus of analysis is the identification and measurement of existing
suffering. The analysis usually takes the form of ‘needs assessment’, which is a snapshot
of the health status of the population under investigation in terms of disease prevalence
and mortality rates. Needs assessments is often very revealing: psychiatric morbidity
surveys reveal very substantial untreated mental illness; and rising rates of obesity in the
UK herald higher rates of diabetes, heart disease and so on in later life. At the same
time, however, needs assessment is not enough by itself, as many conditions generate
113
substantial morbidity (for example chronic conditions) but little can practically be done
about them.
On the other hand, health economists who take a ‘realist’ perspective, focus on
what could be done to improve health and on whether the cost of doing so is affordable
by focusing on the choice between particular interventions, such as surgical procedures
or pharmaceuticals. Health economists assess the value and affordability of an
intervention through ‘incremental cost effectiveness analysis’ (e.g. Williams 1985, Gold,
Siegel et al. 1996, Drummond, Sculpher et al. 2005): each intervention is assessed
compared to the next best alternative in terms of its additional costs, and the additional
benefits it is expected to generate for the average patient.
Benefits are usually not expressed in monetary terms but using metrics such as the
Quality Adjusted Life Year or “QALY” (Williams 1985). These metrics are calculated as
the product of life duration expressed in years and a quality of life weight represented
on a scale ranging from 0 to 1, where 0 corresponds to the quality of life equivalent to
being dead and 1 to that of ‘full health’, respectively. Thus, the unit on the QALY metric,
i.e. one QALY, represents the equivalent of a year spent in full health. In informing
resource allocation decisions, health economists estimate the ‘incremental cost-
effectiveness ratio’ of treating an additional patient, i.e. the ratio between the
additional costs and the additional QALYs of an intervention compared to the next best
alternative and recommend the funding of all interventions below some critical ratio.
From a Portfolio Decision Analysis perspective the approach proposed by health
economists has a normative basis, in that the critical ratio can be interpreted as the
Lagrange multiplier associated with the budget constraint in some implied optimization
problem. However, unless one knows the extent of disease in the population, one has
no idea of the cost coefficients in the budget constraints, and thus what the critical ratio
should be.
The remainder of the chapter is organized as follows. First, we review two
techniques which have received particular attention in the literature, one which has
emphasized the need for explicit Portfolio Decision Analysis and one which has focused
on the need to include multiple criteria and to engage key stakeholders. Second, we
present a case study to illustrate how Multi-Criteria Portfolio Decision Analysis, broadly
114
in the spirit of Phillips and Bana e Costa (2007), can further the development of
techniques to support healthcare planners. Finally, we will offer some reflections on the
particular challenges of doing Portfolio Decision Analysis in a population health context.
In Chapter 8 of this thesis I also reflect on the overall learning from the action
research case studies presented in Chapters 5, 6 and 7.
5.2 Existing techniquesThe challenge for the working health planner is to draw on available information
about healthcare needs of the population and cost-effectiveness, and synthesize this
information in order to establish a programme of activity which will give greatest value
for the locality for which she is responsible. Various approaches have grown up for
helping decision makers with this decision and two have received particular attention:
Generalized Cost Effectiveness Analysis and Programme Budgeting and Marginal
Analysis.
Generalized Cost Effectiveness Analysis (GCEA) is the tool which the World Health
Organization recommends for planning population health (Hutubessy, Chisholm et al.
2003, Tan-Torres Edejer, Baltussen et al. 2003). Similarly to the cost-per-QALY tool of
economists, interventions are assessed compared to an alternative in terms of the ratio
of added costs and benefits. The alternative intervention is a counterfactual which
usually corresponds to what would happen in the absence of the investigated
intervention and costs and benefits are assessed explicitly through a simulation model.
Benefits are measured by Disability Adjusted Life Year (DALY), which are a measure
substantially similar to QALY, although with a negative sense: the DALY is a “bad”
whereas the QALY is a good. Airoldi and Morton (2009) have shown that the way that
the DALY is currently computed makes it problematic as a measure (for example,
increases in length of lifetime may increase DALYs). On the other hand, Morton
(forthcoming) has argued that a suitably corrected version of the DALY could have an

115
interpretation as a metric with similarities to the well-established poverty metric in the
domain of income.
A further distinction between the canonical health economics approach, which
stresses incremental cost-effectiveness, and the GCEA approach, is that in the latter
benefits and costs are estimated at the population level rather than for the average
patient and the alternative uses of limited resources are taken into account, making the
objective function and the budget constraint explicit. In this respect GCEA stands as a
direct descendant of the Global Burden of Disease studies pioneered by the World
Health Organisation (Murray and Lopez 1996), which can in turn trace their lineage to
the techniques of public health needs assessment.
Its proponents highlight that GCEA, although highly informative in its own right,
needs to be integrated with further analysis to take into account other concerns of the
health planner. In particular, the framework models the objective of maximizing
population health explicitly within limited resources, but health planners will be
interested in achieving other goals such as health equity and system responsiveness
(Hutubessy, Chisholm et al. 2003).
A competitor approach, which aims at taking into account the multiple concerns of
the health planner explicitly, is Program Budgeting and Marginal Analysis (PBMA). PBMA
is an economics-inspired approach to public sector planning designed to aid local
decision makers (Mitton and Donaldson 2004). PBMA uses the principles of opportunity
cost and marginal analysis: the “opportunity cost” of providing an intervention is the
value of the best available alternative use of the same resources; and “marginal
analysis” consists in focusing on the additional costs and benefits associated with the
proposed change in service provision (rather than the average costs and benefits of the
resulting, overall portfolio of healthcare services).
PBMA covers a variety of different practices, with a similar process but different
evaluation procedures. The process is led by a facilitator and consists in several steps: to
determine the aim and scope of the analysis, to identify where resources are currently
spent, to form a panel of decision makers, to determine locally relevant criteria for
decision-making, to identify options for investment and disinvestment, to assess options
116
against the set criteria, to validate results and recommend resource re-allocation
(Mitton, Patten et al. 2003).
The evaluation procedure recommended in PBMA is multi-criteria decision analysis,
but the set of criteria and the form of the value function differ between case studies to
reflect the preferences of the local stakeholders. In some cases, the composite concept
of cost-effectiveness is used as a criterion for a multi-criteria value function (Mitton,
Patten et al. 2003). In other cases, the cost-effectiveness of intervention is derived by
calculating the ratio of the multi-criteria benefit score and the cost of each intervention
(Wilson, Rees et al. 2006, Baughan and Ferguson 2008, Kemp and Fordham 2008,
Robson, Bate et al. 2008). In some cases, the concept of need and that of effectiveness
are entered as separate criteria (e.g. Wilson, Rees et al. 2006), in others, the
improvement of the health of the local population, although the single most weighted
criterion, accounts for about 30% of the scores given to each options (Robson, Bate et al.
2008).
PBMA practitioners recognize the need to provide more guidance on the criteria and
the shape of the value function. Peacock, Richardson et al (2007), for instance, propose
a Multi-Attribute Utility function with three criteria, and Wilson, Peacock et al. (2008)
report and reflect on current practices for assessing the value of interventions and to
arrive at a priority ordering. They do not discuss explicitly the link with the Multi-Criteria
Portfolio Decision Analysis literature. Criteria used in selected articles are summarized
in Table 1 on page 43.
Whilst GCEA highlighted the need to formalize the resource allocation problem,
PBMA highlights the need to consider multiple criteria and to engage key stakeholders in
the process. PBMA proponents envisage developing their techniques by drawing more
systematically on models to assess the benefits and costs of interventions from the
health economics and Multi-criteria Decision Analysis literatures (Mitton and Donaldson
2004).
5.3 Case Study
117
Over the last few years we have used Multi-criteria Portfolio Decision Analysis,
broadly in the spirit of Phillips and Bana e Costa (2007) to support a number of local
Primary Care Trusts (Primary Care Trusts) in England. Primary Care Trusts are
organizations responsible for purchasing healthcare services on behalf of their local
population. At the time of writing this chapter, there are 152 Primary Care Trusts in
England with an average population of 330,000 people each.
The problem of selecting which services to purchase and their scale is a portfolio
allocation problem. Primary Care Trusts purchase services from local providers such as
hospitals, ambulance and community care services. The purchase of services is
formalized in separate contracts between the Primary Care Trust and each healthcare
provider, to plan the provision of the anticipated type and volume of care for the local
population in the forthcoming year. These services are funded from general taxation and
offered ‘free of charge’; the available resources are exogenously determined according
to the healthcare need of each Primary Care Trust using a formula which takes into
account factors such as size of the population, its demographic characteristics and its
socio-economic deprivation (Department of Health 2008). The available resources are
typically insufficient to provide all services that would benefit the local population and
Primary Care Trusts are responsible for deciding which interventions should be funded.
In this section we describe the use of Multi-criteria Portfolio Analysis to support the
allocation of resources in a public health programme called ‘Staying Healthy’ in a
Primary Care Trust in central London. The key aim of the programme is to prevent
disease through disease prevention and the promotion of healthy lifestyles. We will
start by explaining the problem faced by the Staying Healthy board and by formulating
the underlying multi-criteria Portfolio Decision Analysis problem. We will then describe
how we engaged local stakeholders in identifying options for resource allocation, and
helped them to express their objectives operationally, to assess the options against the
criteria and to interpret the results of the Portfolio Decision Analysis model.5.3.1 Framing the problemThe Staying Healthy Board is responsible for a wide range of activity to reduce the
prevalence of risk factors such as high blood pressure, obesity and smoking. The
underlying logic of the programme is that by reducing the prevalence of risk factors in a

118
population, the incidence of diseases such as circulatory diseases or cancers can be
reduced and hence the number of premature deaths and preventable ill health would be
lower.
The information available to plan interventions in a ‘Staying Healthy programme’ is
predominantly the current health state of the population in terms of risk factor
prevalence, disease incidence, disease prevalence and associated mortality statistics.
Assessing the value of interventions which promote healthy lifestyles and prevent
diseases is more difficult than assessing the value of curative or palliative services
because the causal chain between action and outcome is longer and more tenuous, and
as a result, the evidence base is weaker.
We used Multi-Criteria Portfolio Decision Analysis in a series of interactive
workshops or “decision conferences” (Phillips 2007) to facilitate the Staying Healthy
Board in integrating the current information about current health state of the
population with the expected benefit of potential interventions, with a focus on the
prevention of cardiovascular diseases (CVD).
To present the decision model underpinning the workshops formally we use the
following notation:
I: set of healthcare interventions, indexed by i=1,...,n
G: set of healthcare intervention groups, indexed by g=1,…,q
A: set of attributes or criteria, indexed by a=1,…,m
We use the notation “ig” to mean “intervention i” falls within group g.
The parameters of our model are as follows:
B: available budget
ci: cost of intervention i;
119
sai added value in terms of attribute a which would be generated by implementing
intervention for all ig. Scores were elicited by participants by attribute a, one
group g at a time;
vi=a wag * sai value of intervention for all ig
wwithin a: within criteria weight
wa across g: across criteria weight
wag = wwithin a * wa across g: weight of attribute or criterion a for scaling interventions in
group g
The decision variable is x=(x1,..., xi ,..., xn)which is a vector of n elements xi [0,1] to
represent the extent to which the proposed intervention could be funded, with 0
representing no funding and 1 representing full funding.
The implied optimization model is hence described by Equation 8:
Equation 8
Max i vi * xi ;
subject to i ci * xi ≤ B
In the rest of the section, we describe how members of the Staying Healthy Board
and a group of stakeholders of the Primary Care Trust used this framework to inform
priority setting by expressing their knowledge and value judgments in the model
parameters and by reflecting on the model results.5.3.2 Planning the workshops

120
The facilitators and two directors in the area of Public Health discussed the problem
faced by the Staying Healthy Board and agreed to explore their investment priorities
with a focus on reducing cerebrovascular diseases (CVD), that is circulatory diseases
which could cause damage to the brain (e.g. stroke) or to the heart (e.g. coronary heart
diseases). The facilitators described the process of Decision Conferencing, which is a set
of working meetings led by an impartial facilitator to build a formal model of the
problem and explore the solution space (Phillips and Bana e Costa 2007) and proposed
to formalize it through a Multi-Criteria Portfolio Decision Analysis model.
The directors decided to engage members of the Staying Healthy Board and key
stakeholders (including family doctors, health visitors and patient representatives) to
populate the model during three half-day meetings at about ten days intervals. The
participation to these workshops ranged from six to ten people.
In the first meeting participants framed the decision problem in terms their
fundamental objectives and by generating a list of alternatives to achieve them (i.e. the
set of criteria A; and the set of interventions I, grouped in thematic areas G), which we
describe in Section 5.3.3. In the second meeting they scored each intervention against
the set criteria, which included cost (i.e. parameters ci and sai), as we describe in Section
5.3.4. Finally, in the last meeting, participants assessed the trade-off across the different
criteria to generate an overall benefit score for each intervention (i.e. the two sets of
weights wwithin a and wa across g), explored the results produced through a Multi-Criteria
Portfolio Decision Analysis software2 and engaged in a discussion to inform priority
setting (Sections 5.3.5 and 5.3.6).5.3.3 The strategic decision frame: objectives and alternativesFollowing the Value-focused thinking framework (Keeney 1996), we engaged
participants in defining the decision problem starting with the identification of their
values and by articulating them in fundamental objectives. In keeping with Keeney, we
distinguished ‘fundamental objectives’, i.e. the ends that participants valued in the
2 We used ‘Equity’, that is a software which was developed by the LSE and currently
maintained by Catalyze Ltd (www.catalyze.co.uk).

121
context of allocating resources to health promotion and prevention activities, from
‘mean objectives’, i.e. the methods to achieve those ends.
Participants initially identified their objectives with the three overall aims articulated
by the Board of the Primary Care Trust:
to reduce the prevalence of key risk factors for premature mortality;
to reduce premature mortality;
to reduce inequalities in prevalence of risk factors and premature mortality.
For each objective, participants discussed the reasons for their importance, in order
to distinguish mean objectives (e.g. reducing prevalence of risk factors) from end
objectives (e.g. reducing premature mortality). The discussion led to the identification of
additional end objectives and to their operational definition. The final list of end
objectives was as follows:
Reducing Premature Mortality (a1): The extent to which an intervention reduces
premature CVD mortality in the medium-run (5-10 years) and the long-run (10+ years)
Improving Individual Quality of Life (a2): The extent to which an intervention improves an
individual’s overall well-being (as defined by the individual).
Improving Social Quality of Life (a3): The extent to which an intervention improves an
individual’s overall opportunities (in employment, education, etc) and their engagement
in social life.
Reducing Health Inequalities (a4): The extent to which an intervention reduces the
unjustifiable and avoidable gaps in health status among different social groups in the local
population
With these end objectives in mind, we invited participants to suggest well-defined
interventions which the Staying Healthy Board should finance. An intervention was
considered “well-defined” if, in principle, it could have been possible to answer the
following questions:
1. How much does it cost to provide the intervention?
2. How many people benefit from it?
3. How exactly do people benefit from it?
Each participant worked individually and listed five to six interventions, writing each
of his or her proposals on a different piece of paper. Participants revised the list of
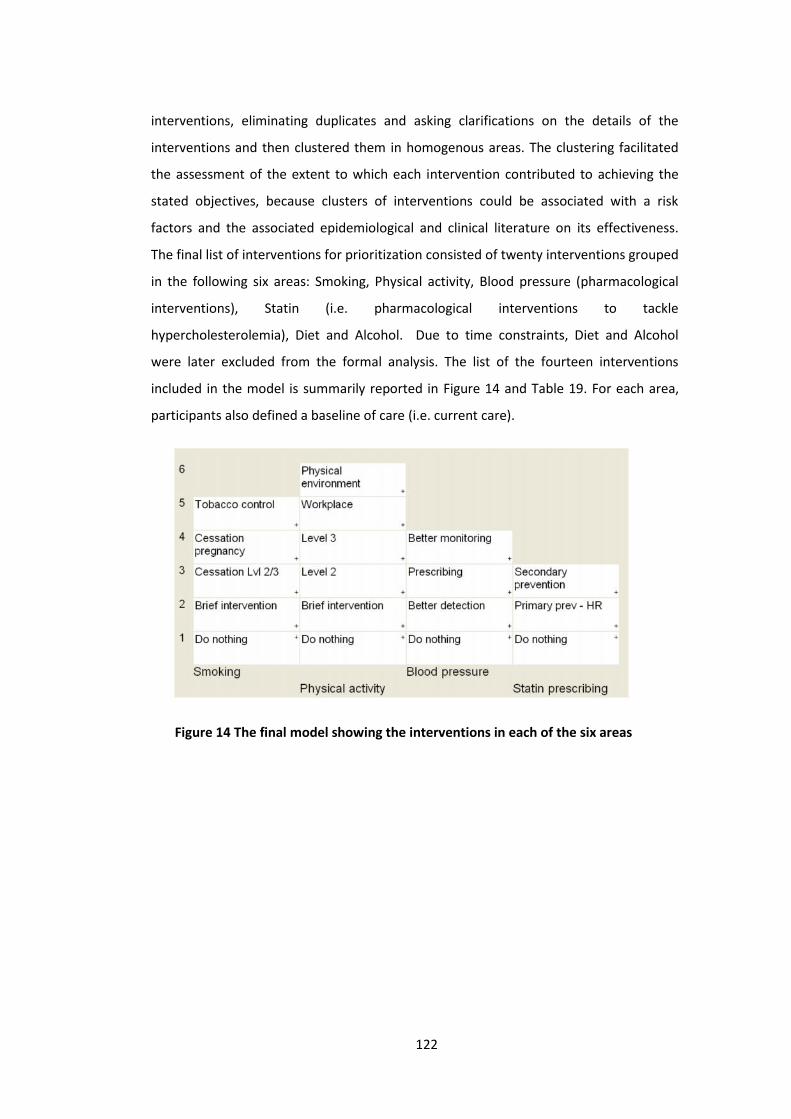
122
interventions, eliminating duplicates and asking clarifications on the details of the
interventions and then clustered them in homogenous areas. The clustering facilitated
the assessment of the extent to which each intervention contributed to achieving the
stated objectives, because clusters of interventions could be associated with a risk
factors and the associated epidemiological and clinical literature on its effectiveness.
The final list of interventions for prioritization consisted of twenty interventions grouped
in the following six areas: Smoking, Physical activity, Blood pressure (pharmacological
interventions), Statin (i.e. pharmacological interventions to tackle
hypercholesterolemia), Diet and Alcohol. Due to time constraints, Diet and Alcohol
were later excluded from the formal analysis. The list of the fourteen interventions
included in the model is summarily reported in Figure 14 and Table 19. For each area,
participants also defined a baseline of care (i.e. current care).
Figure 14 The final model showing the interventions in each of the six areas

123
Table 19 Description of interventions (i) by group (g)
Area (g) Intervention(i) Description
Smok
ing Do nothing Current care with no additional effort by Primary Care Trust
Brief Brief interventions by range of practitioners (GPs, practice nurses, pharmacists, other clinicians)The intervention will benefit all registered people who smoke who would like to give up
Cessation“Level 2 & 3” Intervention in the community including Nicotine Replacement Therapy and counseling through smoking cessation clinics
Pregnancy Smoking cessation in pregnancy
Tobaccocontrol
Home and workplace interventions to promote smoking cessation (including stop smoking advice, having a smoke free environment,clamping down on illegal sales, stopping sales to children)
Phys
ical
act
ivity Do nothing “G-Pack” currently provided, which includes assessment, advice and follow-up
Brief Opportunistic interventions in primary care and community services
Level 2 Targeted intervention to about 1,000 beneficiaries at risk. The intervention consists in fostering motivation, goal-setting, follow-up,and coaching in general. It will be delivered by health trainers
Level 3 Intensive 10-week programme targeted to about 500 beneficiaries post diagnosis (already commissioned)
Workplace Health promotion activities within workplace environment in a proactive manner.
Physicalenvironment
Influencing transport, urban planning, buildings, children(in practice this will involve hiring two persons to implement actions)
Bloo
d pr
essu
re Do nothing Current care with no additional effort by Primary Care Trust
BetterDetection Opportunistic screening (everybody visiting a GP), receiving current care in terms of monitoring and prescribing
Prescribing prescribing, following good practice for those currently detected
BetterMonitoring better monitoring of those currently detected
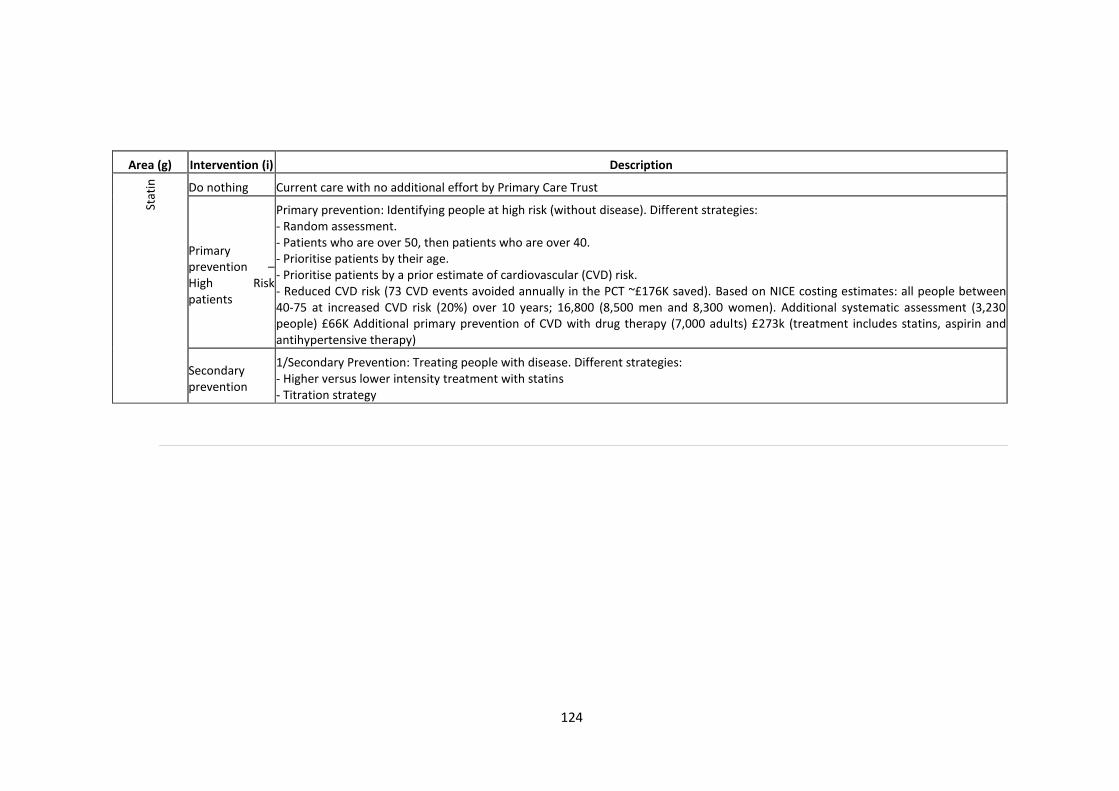
124
Area (g) Intervention (i) DescriptionSt
atin Do nothing Current care with no additional effort by Primary Care Trust
Primaryprevention –High Riskpatients
Primary prevention: Identifying people at high risk (without disease). Different strategies:- Random assessment.- Patients who are over 50, then patients who are over 40.- Prioritise patients by their age.- Prioritise patients by a prior estimate of cardiovascular (CVD) risk.- Reduced CVD risk (73 CVD events avoided annually in the PCT ~£176K saved). Based on NICE costing estimates: all people between40-75 at increased CVD risk (20%) over 10 years; 16,800 (8,500 men and 8,300 women). Additional systematic assessment (3,230people) £66K Additional primary prevention of CVD with drug therapy (7,000 adults) £273k (treatment includes statins, aspirin andantihypertensive therapy)
Secondaryprevention
1/Secondary Prevention: Treating people with disease. Different strategies:- Higher versus lower intensity treatment with statins- Titration strategy

125
5.3.4 ScoringThe scoring process aimed at eliciting parameters sa
i in the Multi-Criteria Portfolio
Decision Analysis model. These assessments were done through direct rating, one area g
at a time and one criterion a at a time. The scores should reflect the ‘added value’ of
the intervention in achieving the considered objective or criterion, where a score of 0
was assigned by default to the current care (interventions labeled ‘do nothing’ in each
area). For example, the group first considered all the interventions in the Smoking area.
We asked the group to identify the one intervention that provided the most impact on
“Reducing health inequalities” in the local population. After some discussion, the group
agreed it was “Tobacco control”, so that intervention was assigned a preference value of
100. Next, the group compared each of the other interventions in the Smoking area to
this one as a benchmark and judged the relative value each intervention would
contribute to “Reducing health inequalities”. Thus, when participants argued that
“Cessation Level 2&3” would provide about 40 percent as much value as “Tobacco
control”, a score of 40 was assigned. In all cases, the ratios of the numbers reflected
ratios of participants’ relative strength of preference for the two interventions. The
group arrived at these relative judgments through discussion and consulting available
evidence. Consistency checks were particularly useful to revise the group’s
assessments. For example, if interventions A, B and C scored 100, 20 and 80,
respectively, then participants were asked if B and C together created the same value
for the criterion under investigation as project A alone. If not, then revisions were made
to the scores until consistency was obtained. Thus, each benefit score gave the relative
added value attributable to Reducing health inequality from commissioning that
intervention.
The process was applied to the projects for all four benefit criteria. Participants
were encouraged to assess scores representing the value associated uniquely with each
criterion, thus avoiding double counting.
The assessment of the value of each intervention to reduce premature mortality
drew from participants’ knowledge of the clinical and epidemiological literature and the
model enabled them to translate the knowledge for their concrete problem. Similarly,
for some interventions participants could draw on the growing body of models which
126
estimate the impact of interventions in improving the quality of life of patients
(measured in QALYs).
On the other hand, the assessment of the ‘Reducing health inequality’ criterion
proved more difficult, as different participants seemed to attach very different
interpretations to the word “inequality”. The exercise highlighted how this concept,
although of general concern both in the local and in the national health policy debate, it
is not operationally clear.
In discussing the value of interventions, participants also clarified how the
intervention should have been implemented in practice and were able to estimate its
costs. The working definition for defining the cost of each intervention was “the cost of
providing an intervention to a pre-specified population group (i.e. the ongoing cost, over
and above the status quo)”.
The overall available budget B was never explicitly defined, although the limitedness
of resources was clearly a constraint for two reasons. Firstly, even though the Staying
Healthy programme had a set budget constraint, the exercise only covered a subset of
the activity they fund; secondly, the aim of the exercise was to explore a systematic
assessment of options which could be used to formulate business cases for negotiating
additional resources. The parameter B remained a variable which defined different
funding constraint scenarios.5.3.5 Weighting the criteriaTotal benefits cannot be calculated until the units of benefit from one area to the
next and one criterion to the next are equated. This was accomplished in three steps.
First, the benefit scores on a given criterion for a particular area were added and
normalized so that the resulting scale extends from 0, representing least preferred, to
100, representing most preferred. Take the scores on Reducing premature mortality for
interventions in the area “Physical activity” as an example. The first column of numbers
in Table 20, below, gives the scores for the Reduction in premature mortality. The
second column gives the cumulative sum of the scores. The third column shows the
normalization, which results in a preference value scale. For this scale, 100 represent

127
the total achievable reduction in premature mortality associated with all six projects,
assuming they are successful.
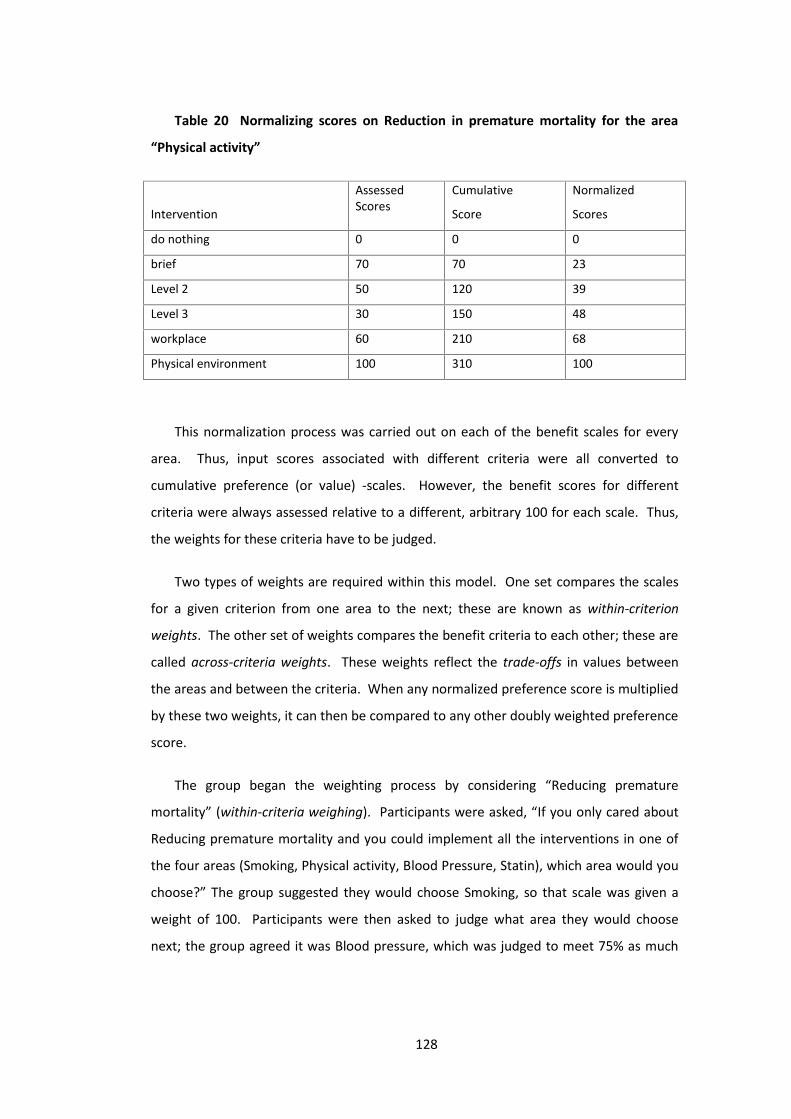
128
Table 20 Normalizing scores on Reduction in premature mortality for the area
“Physical activity”
Intervention
AssessedScores
Cumulative
Score
Normalized
Scores
do nothing 0 0 0
brief 70 70 23
Level 2 50 120 39
Level 3 30 150 48
workplace 60 210 68
Physical environment 100 310 100
This normalization process was carried out on each of the benefit scales for every
area. Thus, input scores associated with different criteria were all converted to
cumulative preference (or value) -scales. However, the benefit scores for different
criteria were always assessed relative to a different, arbitrary 100 for each scale. Thus,
the weights for these criteria have to be judged.
Two types of weights are required within this model. One set compares the scales
for a given criterion from one area to the next; these are known as within-criterion
weights. The other set of weights compares the benefit criteria to each other; these are
called across-criteria weights. These weights reflect the trade-offs in values between
the areas and between the criteria. When any normalized preference score is multiplied
by these two weights, it can then be compared to any other doubly weighted preference
score.
The group began the weighting process by considering “Reducing premature
mortality” (within-criteria weighing). Participants were asked, “If you only cared about
Reducing premature mortality and you could implement all the interventions in one of
the four areas (Smoking, Physical activity, Blood Pressure, Statin), which area would you
choose?” The group suggested they would choose Smoking, so that scale was given a
weight of 100. Participants were then asked to judge what area they would choose
next; the group agreed it was Blood pressure, which was judged to meet 75% as much
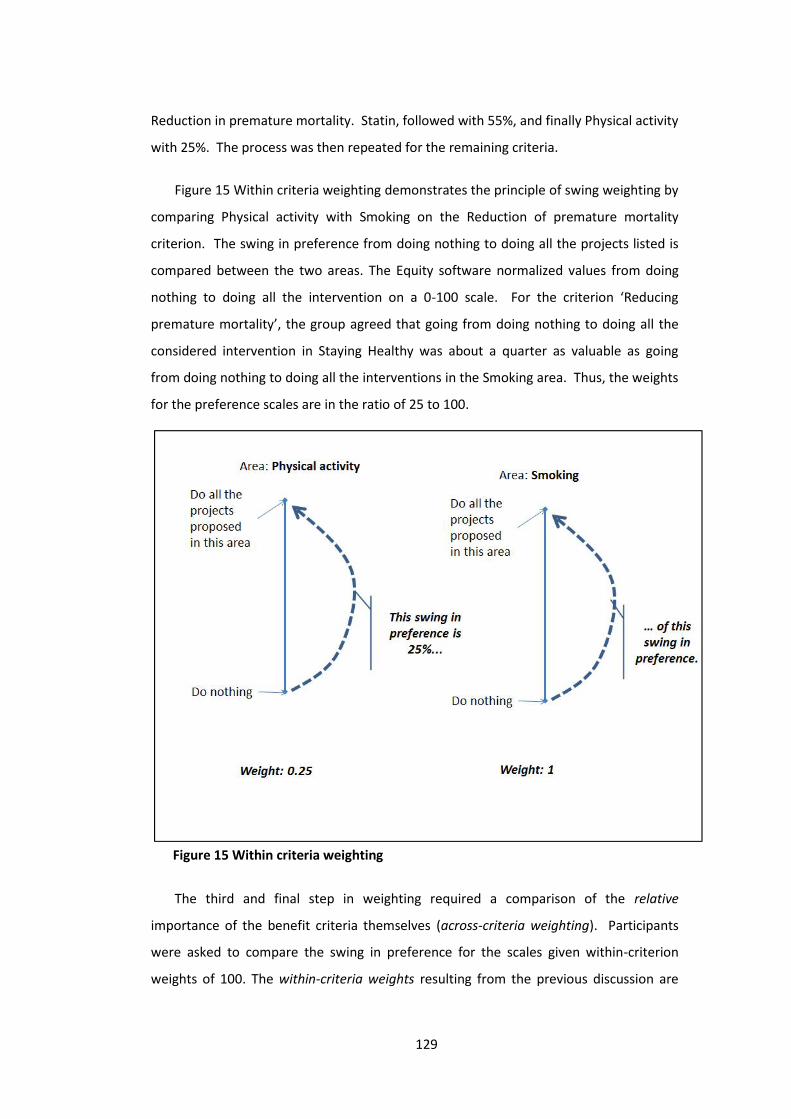
129
Reduction in premature mortality. Statin, followed with 55%, and finally Physical activity
with 25%. The process was then repeated for the remaining criteria.
Figure 15 Within criteria weighting demonstrates the principle of swing weighting by
comparing Physical activity with Smoking on the Reduction of premature mortality
criterion. The swing in preference from doing nothing to doing all the projects listed is
compared between the two areas. The Equity software normalized values from doing
nothing to doing all the intervention on a 0-100 scale. For the criterion ‘Reducing
premature mortality’, the group agreed that going from doing nothing to doing all the
considered intervention in Staying Healthy was about a quarter as valuable as going
from doing nothing to doing all the interventions in the Smoking area. Thus, the weights
for the preference scales are in the ratio of 25 to 100.
The third and final step in weighting required a comparison of the relative
importance of the benefit criteria themselves (across-criteria weighting). Participants
were asked to compare the swing in preference for the scales given within-criterion
weights of 100. The within-criteria weights resulting from the previous discussion are
Figure 15 Within criteria weighting

130
reported in the first rows of Table 21, whilst the across-criteria weights appear in the
bottom row. The group compared the weights of 100 in Reducing health inequality by
doing all intervention in the Smoking area, with Reducing premature mortality by doing
all the intervention in Smoking, with Improving individual quality of life by doing all
interventions in Physical activity, with Improving social quality of life by doing all
interventions in Physical activity (highlighted in bold font in the table). The group
exhibited as strong a preference for the potential Reduction in health inequality or the
potential Reduction in premature mortality by doing all the interventions in Smoking.
They also felt as strong a preference for the potential Improvement in individual or that
in social quality of life that would be achieved by doing all the interventions in the
Physical activity area. However, they thought these were about half as valuable as the
Reduction in health inequalities and premature mortality from the Smoking area. Thus,
across criteria weights of 100 were assigned both to Reducing health inequalities and
premature mortality; and across criteria weights of 50 were assigned to Improving
quality of life both from the individual and the social perspective.
Table 21 Within- and Across-criterion weights
Costongoing
HealthInequality
Prematuremortality
IndividualQoL
SocialQoL
With
in-c
riter
ia w
eigh
ts
Smoking - 100 100 90 20
Physical activity - 50 25 100 100
Blood pressure - 70 75 50 15
statin - 10 55 20 2
diet - 0 0 0 0
alcohol - 0 0 0 0
Across-criteria Weights: 100 100 100 50 50

131
5.3.6 ResultsThe weighting procedure illustrated above allowed the group to arrive at an overall
aggregated value of intervention in terms of its expected contribution to reduce
mortality with its expected contribution to reduce health inequalities and its expected
contribution in improving quality of life. We then divided the benefit score by the
estimated costs of implementing the intervention to assess its value-for-money. We can
think of each of the 14 assessed interventions in terms of a triangle that has the benefit
score in the vertical side and the cost necessary to generate those benefits on the
horizontal side. Thus, the slope of the hypotenuse can be used to signal value-for-
money: the steeper the slope, the better the value-for-money. Some writers have
criticized the use of the value-for-money ordering (Kleinmuntz 2007) as it is not an
optimizing algorithm for the problem represented by Equation 1 However, we find that
it captures simply and directly the critical insight that projects which deliver high benefit
are not a good buy if they simultaneously cost a great deal of money, and allows non-
technical people to understand and “own” the results of the model.
To illustrate the impact of the approach, in this section we first report a graph with
the value-for-money triangles for each area separately; then we combine all triangles in
a single graph to facilitate a comparison of the value contributed by intervention in
different areas.
An examination of the ordered benefit-cost curve for each area is instructive, for the
curves often give an overall view of the areas that is not obvious by looking at the
individual interventions. This curve is a partial efficient frontier, with interventions
ordered by their efficiency score, which is represented by the steepness of the
hypotenuse of the associated Value-for-Money triangle. The illustrative example of the
partial efficient frontier for the ‘Smoking’ area is reported in Figure 16.
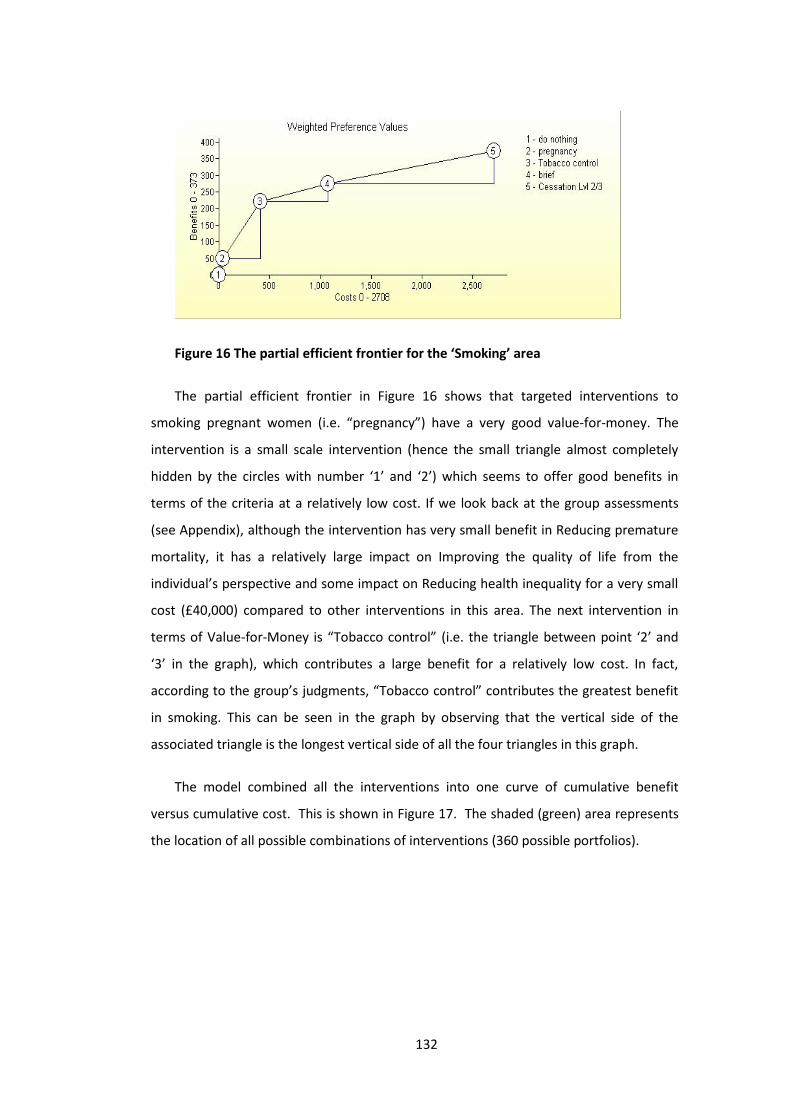
132
Figure 16 The partial efficient frontier for the ‘Smoking’ area
The partial efficient frontier in Figure 16 shows that targeted interventions to
smoking pregnant women (i.e. “pregnancy”) have a very good value-for-money. The
intervention is a small scale intervention (hence the small triangle almost completely
hidden by the circles with number ‘1’ and ‘2’) which seems to offer good benefits in
terms of the criteria at a relatively low cost. If we look back at the group assessments
(see Appendix), although the intervention has very small benefit in Reducing premature
mortality, it has a relatively large impact on Improving the quality of life from the
individual’s perspective and some impact on Reducing health inequality for a very small
cost (£40,000) compared to other interventions in this area. The next intervention in
terms of Value-for-Money is “Tobacco control” (i.e. the triangle between point ‘2’ and
‘3’ in the graph), which contributes a large benefit for a relatively low cost. In fact,
according to the group’s judgments, “Tobacco control” contributes the greatest benefit
in smoking. This can be seen in the graph by observing that the vertical side of the
associated triangle is the longest vertical side of all the four triangles in this graph.
The model combined all the interventions into one curve of cumulative benefit
versus cumulative cost. This is shown in Figure 17. The shaded (green) area represents
the location of all possible combinations of interventions (360 possible portfolios).
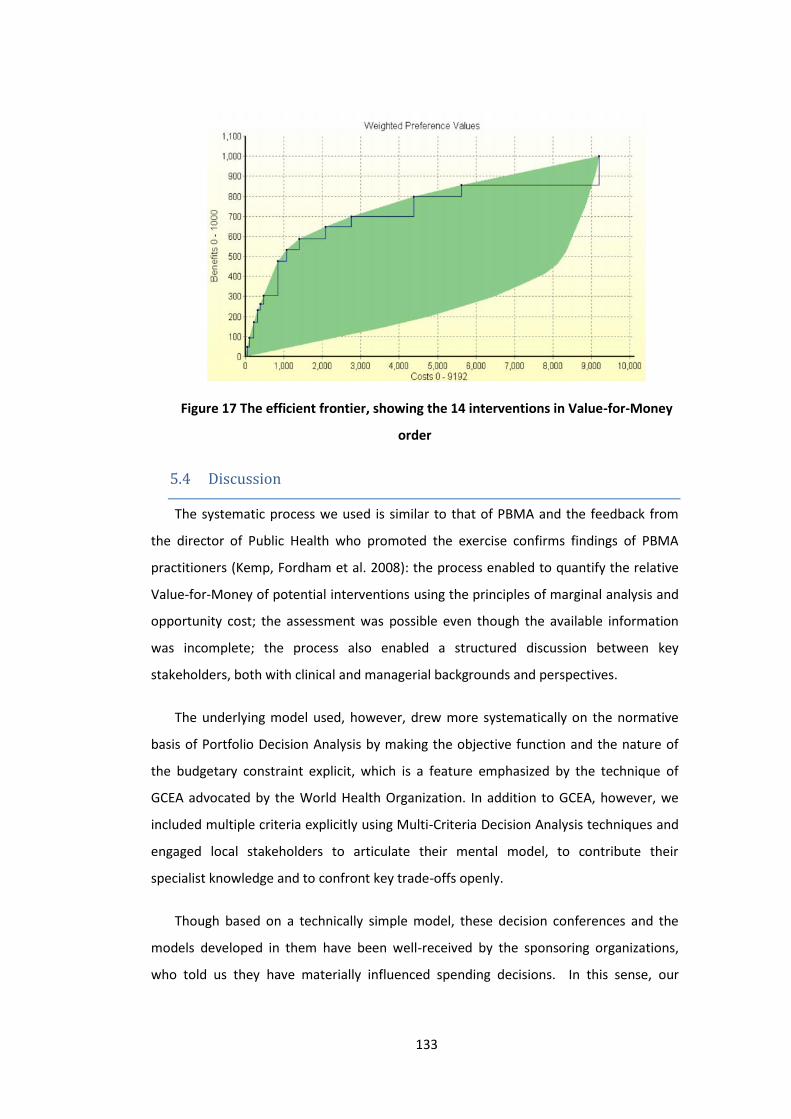
133
Figure 17 The efficient frontier, showing the 14 interventions in Value-for-Money
order5.4 DiscussionThe systematic process we used is similar to that of PBMA and the feedback from
the director of Public Health who promoted the exercise confirms findings of PBMA
practitioners (Kemp, Fordham et al. 2008): the process enabled to quantify the relative
Value-for-Money of potential interventions using the principles of marginal analysis and
opportunity cost; the assessment was possible even though the available information
was incomplete; the process also enabled a structured discussion between key
stakeholders, both with clinical and managerial backgrounds and perspectives.
The underlying model used, however, drew more systematically on the normative
basis of Portfolio Decision Analysis by making the objective function and the nature of
the budgetary constraint explicit, which is a feature emphasized by the technique of
GCEA advocated by the World Health Organization. In addition to GCEA, however, we
included multiple criteria explicitly using Multi-Criteria Decision Analysis techniques and
engaged local stakeholders to articulate their mental model, to contribute their
specialist knowledge and to confront key trade-offs openly.
Though based on a technically simple model, these decision conferences and the
models developed in them have been well-received by the sponsoring organizations,
who told us they have materially influenced spending decisions. In this sense, our
134
experience has been positive and our methods have been “successful”. However, it is
difficult to test the prescriptive validity of the approach. Indeed it is not possible to
verify the material impact of the approach on decisions because there is no
counterfactual, i.e. it is not possible to know what would have happened anyway.
Similarly, it is difficult to verify that the commissioning process improved without a more
formal assessment. In chapter 7 I built a more formal evaluation of the proposed
approach with an independent evaluator who attended the events and interviewed
participants before and after the decision conference.
The limited scale of the intervention described in the case study and the sheer
complexity of healthcare means that many issues have been left unexplored, which we
briefly review here.5.4.1 Use of evidence and disease modelingOur intervention described above uses direct assessment of health benefits, drawing
on expert knowledge, informed by the clinical literature. It should be emphasized that
when making judgments about the extent of a health benefit, despite the availability of
clinical studies and meta-analyses, it is not generally possible to “read off” the health
benefits from a clinical trial, as local populations may have particular characteristics
which differ from the populations of the clinical trials (for example, subjects in clinical
trials are normally more healthy than the typical patient).
One approach to achieving this local contextualization is to use or develop formal
disease models. Such models do exist for most common conditions, and are often of
considerable sophistication. In these models, which use Markov chains, System
Dynamics, or Discrete Event Simulation, a cohort of patients flows through a system of
disease states over a period of time, under differing scenarios and treatment programs.
Such models are themselves based on judgment, but judgments at a more disaggregated
level; and some of the disaggregated judgments at least can be directly validated. We
have developed such models ourselves (e.g. Airoldi, Bevan et al. 2008), but to do so is
highly time-consuming. In a time and resource-limited environment where one is
charged with making assessments on multiple interventions for different conditions,
building a disease model for each is simply not practical.

135
How problematic this reliance on direct expert judgment is depends on the quality
of that judgment relative to the quality of projections of a disease model, and ultimately
there is a cost-benefit tradeoff to be made about whether the improvement in the
quality of the assessment of an outcome that comes from a disease model is worth the
additional investment. We do not have a particularly good sense of how far this is the
case. Certainly, initial assessments by workshop participants of the scale of the benefits
of particular programs could vary massively. However, this could be viewed either as a
cause for concern or as a healthy acknowledgement of uncertainty on matters which are
the subject of continuing scientific dispute. More information or evidence on this point
would be very useful.5.4.2 Health inequalitiesOne of the fundamental findings of public health is there is, globally, a strong and
persistent “socio-economic gradient” in health, whereby the lower socio-economic
classes experience worse health, on a variety of dimensions, and overall, as measured
on metrics such as Life Expectancy and Disability-Free Life Expectancy. In the UK, and in
particular in England, the recently-deposed Labour government took strong but
ultimately ineffectual action to reduce this gap, by allocating additional funds to so-
called “Spearhead” Primary Care Trusts with more deprived population. A persistent
suspicion is that much of these funds did not reach the more deprived populations for
which they were intended, and that the beneficiaries of this expenditure were the more
well-off people who happened to live in the more deprived areas. We are not aware of
compelling evidence for this view, but it is consistent with what we know about
healthcare consumption – that the vocal middle classes access and consume more
healthcare than the remainder of the population despite their generally better health.
The difficulty of tracing the ultimate beneficiaries of these funds illustrates that
most Primary Care Trusts – whatever they may or may not have done – did not have a
transparent system for deciding how resources should be allocated across different
subgroups within their population. The experience with the Primary Care Trust
described above illustrates how difficult building such a system is: “inequality” evoked
very different things for different people, and sometimes for the same people at
different times. Thus, the inequality criterion in our model represented for the group, a
composite of (at least) socio-economic, race, and gender inequality.

136
In ongoing work (Morton and Airoldi 2010), we are attempting to develop a clearer
and more transparent framework for assessing values of healthcare interventions taking
into account aversion to inequality, with a view to informing decisions about, the
targeting of screening programmes on particular subpopulations. A difficulty in
designing such an approach is that while people often feel strongly that health
inequalities are unjust and should be tackled, they simultaneously reject any idea that
one person’s need for healthcare be weighted more heavily than another person’s need
for healthcare. It is not at all obvious how such conflicting moral intuitions are to be
reconciled.5.4.3 Unrelated future costsAn issue which surfaces from time to time in the health economics literature is the
role of so-called “unrelated” future costs (Garber, Weinstein et al. 1996). These are the
healthcare costs which accrue as a result of (for example) saving the life of someone
who then goes on to incur further healthcare expenditures, which had he died, would
have been avoided. The most prominent example of this issue is in the context of
smoking: lung cancer is a quick and cheap way to die as there are no real effective
treatments, and as a result, those who die of the disease save the public purse
considerable sums of money, from long term care late in life, pensions and so on.
Preventing such a death does incur costs to the system further down the line.
From the point of view of a Primary Care Trust these costs do not loom large, and
we do not take them into account in our modeling. In a way this makes sense: Primary
Care Trusts have responsibility for an annual budget which is set by the Department of
Health, and this budget is determined based on the morbidity of their population. Thus,
from the point of view of the individual Primary Care Trust, if they manage to keep more
sick people alive, they will receive more funds (assuming the budget is exogenously
determined). From the point of view of the system as a whole, however, this looks to us
like a bias which promotes longer sicker lives at the expense of shorter healthier ones,
by underestimating the cost of the former.
This offends our economic and moral sensibilities, and raises the concern that we
are contributing to a situation where an increasing number of increasingly ill people
consume an increasing amount of healthcare. How to introduce these so-called
137
“unrelated” future costs into models suitable for use by Primary Care Trust decision
makers is a problem to which we do not yet have a solution.5.4.4 Acute versus preventiveA feature of the intervention described in this chapter is that the decision makers
were interested in considering activities which could ameliorate a range of different
diseases. This is in contrast to the sort of situation where economic evaluation is most
frequently used in healthcare. Often structured appraisal methods are applied in
decision contexts where the choice is between different treatments for the same or
similar conditions. However, restricting the use of analysis in this way means that the
large scale context decisions are often made on the basis of unanalyzed intuitions and
gut-feels. The challenge then, is to develop methods and procedures which can help
decision makers compare treatments which may be very heterogeneous in terms of the
disease which has been targeted and in terms of the characters of the beneficiaries –
consider for example comparing hip replacement and gender reassignment surgery.
One of the biggest distinctions between different sources of treatments which often
loom large in a practical appraisal context is the distinction between acute and
preventive interventions. Acute interventions are typically developed in the hospital
setting – for example surgical procedures such as coronary heart bypass surgery.
Preventive interventions, on the other hand, may take the form of public information
campaigns or the provision of services to help people in the community take better care
of their health – such as services which help people to give up smoking. Acute and
preventive interventions differ both in terms of the nature of the knowledge base
underlying claims on the effectiveness. The effectiveness of acute interventions is
typically studied by randomized controlled trials; while the evidence of effectiveness of
preventative interventions (for example smoking cessation services) is of a different
nature and considered to be weaker. Another and possibly more important difference
between acute and preventative interventions, however, is that because the
beneficiaries of acute interventions are named individuals whereas the beneficiaries of
preventative interventions are statistical individuals, there is a natural constituency to
advocate for the greater uptake of acute interventions.
138
An example which highlights the issues involved is that of national policy on stroke.
According to modelling studies which we worked on in a separate but related piece of
work (Airoldi, Bevan et al. 2008), preventive interventions for stroke offer excellent
opportunities for improving population health at a moderate cost, whereas acute
interventions such as stroke clinics and thrombolysis, although they may substantially
reduce the disability associated with stroke for those unfortunate enough to experience
it, nevertheless cannot compare in quantitative terms to the effectiveness of the
preventative interventions. Yet national policy continues to stress the importance of
implementing stroke clinics and thrombolysis to the almost complete exclusion of
preventative interventions. Accordingly, we see a challenge for portfolio decision
analysis in the healthcare arena as being to provide frameworks for decision makers to
reflect on the appropriate balance between acute and preventive parts of their
portfolios in the light of both the clinical evidence and their own value judgments.5.4.5 The good deathIn the intervention described in this chapter we used an evaluation scheme which
depended heavily on the concept of ‘health’. Some interventions, however, have no or
negligible impact on health but rather are primarily intended to ease the process of
dying (palliative care being the most obvious example). Comparing interventions which
improve health with interventions designed to improve the quality of death seems to be
something which people find difficult conceptually. Part of the reason for this may be
that there is lack of empirical evidence (and a lack of standardised evaluation schemes)
on what constitutes a ‘good death’ and such evidence as there is suggests that tastes
may differ substantially within the population (for example while most people would
prefer a painless death, some may prefer a death which is sudden whereas other may
prefer to have a warning time long enough to set their affairs in order and say goodbye).
Moreover, we suspect that people’s preferences over different sorts of deaths are likely
to be relatively labile, as the issue is one which most people are probably not given to
thinking about deeply and frequently (different forms of bad health, on the other hand,
are relatively familiar and someone who has experienced both a broken arm and a
migraine can relatively easily say which is the more unpleasant experience). There is a
need for decision analysis techniques to be developed which can compare life improving
and death improving interventions.

139
5.5 ConclusionIn this chapter we have outlined the challenge faced by the healthcare planner, who
needs to combine information about the current health status of a defined population
with that on the costs and the effectiveness of possible interventions to improve the
level of health and its distribution. Existing techniques to face this challenge tend to
focus either on the process which the healthcare planner could follow to confront key
tradeoffs (PBMA) or on the explicit modeling of the underlying disease to estimate the
intervention impact on the local health economy (GCEA).
In the case study which we presented, we used the socio-technical approach of
Decision Conferencing (Phillips and Bana e Costa 2007) to engage a group of key
stakeholders in a Primary Care Trust in England and build a model for their resource
allocation problem based on Multi-Criteria Portfolio Decision Analysis, learning from and
building on both these traditions. Our engagement with the National Health Service
continues, and we are refining our methods to deal with some of the challenges outlined
in the previous section.
The approach that we used could be described as low-tech and participative, in the
sense that the methods which we used are not fundamentally technically innovative.
Rather, we have used our case study to draw attention to some of the deep and
complex issues which beset decision making in this area – ambiguous or incomplete
evidence, aversion to inequality, and costs associated with the prolongation of life.
When the issues are so complex, theoretic development is not an optional extra: using
population health metrics such as the DALY as a basis for prioritisation (Airoldi and
Morton, 2009) or weighting health states to model inequality aversion (Østerdal, 2003)
without proper understanding of what one is doing can lead to very odd results.
Yet theory by itself is not enough. Despite the long history of Operations Research
in healthcare, and of the vast database of medical, epidemiological, and health
economic evidence at their disposal, we find that Primary Care Trusts make limited use
of structured techniques which could help them think systematically and quantitatively
about the big questions of what they get for the money they spend. This is a

140
disheartening state of affairs, particularly considering the stresses which healthcare
systems face in coming years. But it is also a reminder of the importance of usability and
accessibility to decision makers operating in a challenging environment. Decision
Analysts – with their respect for theory and their preoccupation with producing tools
which actually work – are perhaps uniquely well-placed to play a role in pushing forward
practice in this important and fascinating area.
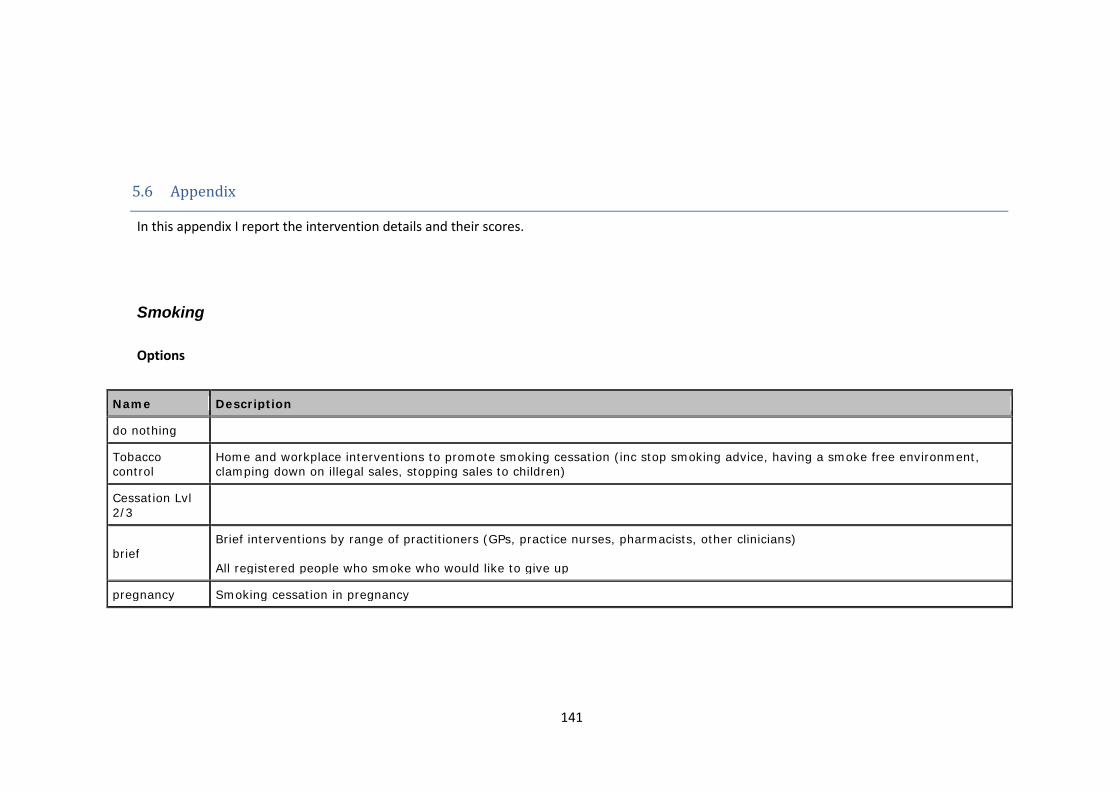
141
5.6 AppendixIn this appendix I report the intervention details and their scores.
Smoking
Options
Name Description
do nothing
Tobaccocontrol
Home and workplace interventions to promote smoking cessation (inc stop smoking advice, having a smoke free environment,clamping down on illegal sales, stopping sales to children)
Cessation Lvl2/3
briefBrief interventions by range of practitioners (GPs, practice nurses, pharmacists, other clinicians)
All registered people who smoke who would like to give up
pregnancy Smoking cessation in pregnancy

142
Incremental Scores
Costs Benefits
Name Costongoing
HealthInequality
Prematuremortality
IndividualQoL
SocialQoL
do nothing 0 0 0 0 0
pregnancy 40 20 5 100 5
Tobacco control 370 100 45 50 45
brief 666 10 25 20 25
Cessation Lvl2/3 1632 40 25 100 25
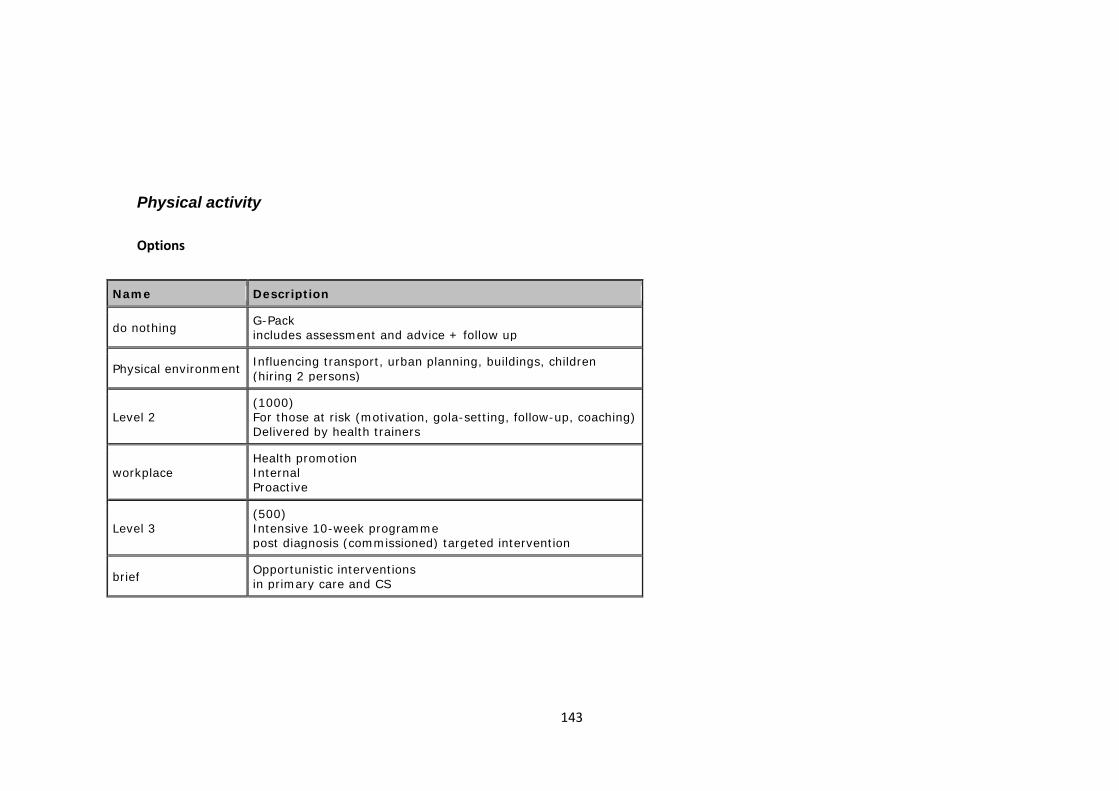
143
Physical activity
Options
Name Description
do nothing G-Packincludes assessment and advice + follow up
Physical environment Influencing transport, urban planning, buildings, children(hiring 2 persons)
Level 2(1000)For those at risk (motivation, gola-setting, follow-up, coaching)Delivered by health trainers
workplaceHealth promotionInternalProactive
Level 3(500)Intensive 10-week programmepost diagnosis (commissioned) targeted intervention
brief Opportunistic interventionsin primary care and CS
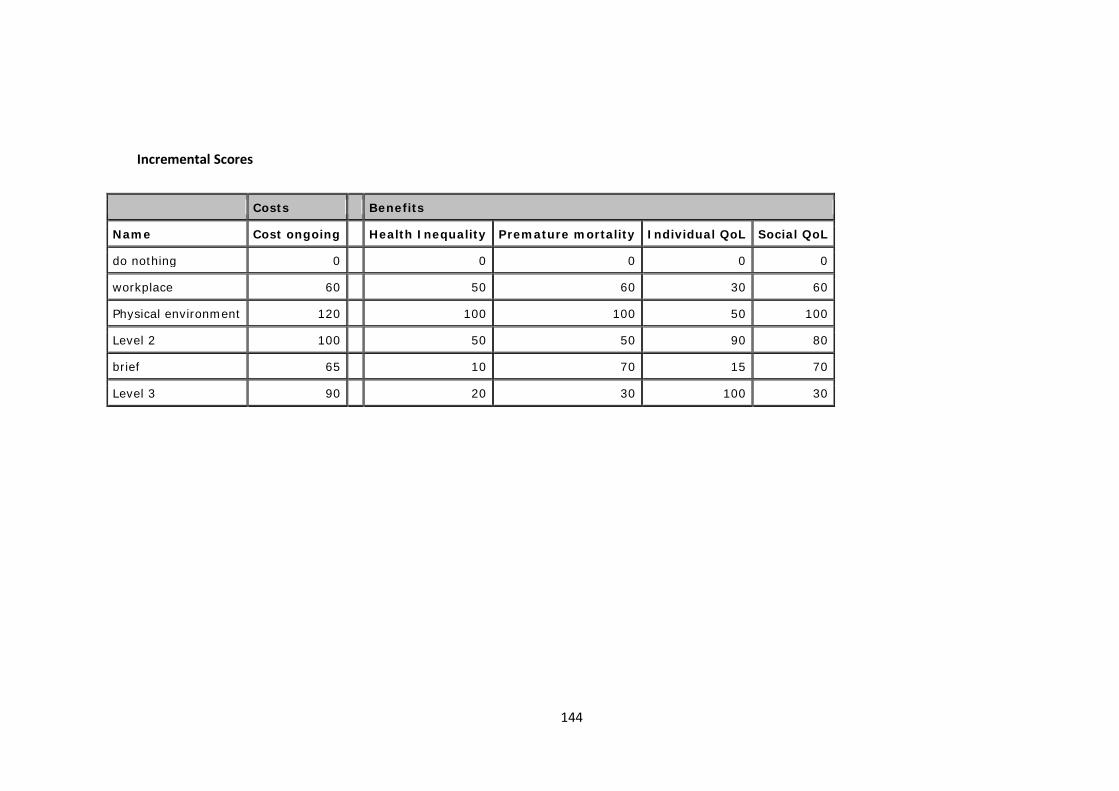
144
Incremental Scores
Costs Benefits
Name Cost ongoing Health Inequality Premature mortality Individual QoL Social QoL
do nothing 0 0 0 0 0
workplace 60 50 60 30 60
Physical environment 120 100 100 50 100
Level 2 100 50 50 90 80
brief 65 10 70 15 70
Level 3 90 20 30 100 30
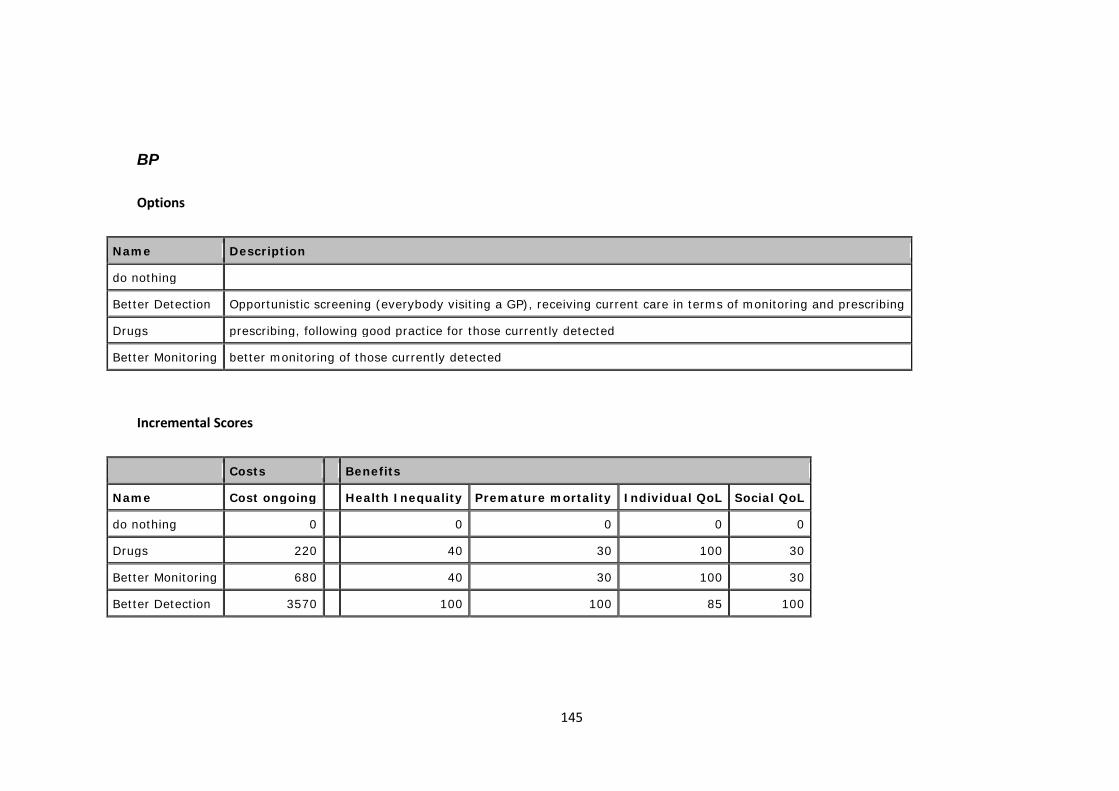
145
BP
Options
Name Description
do nothing
Better Detection Opportunistic screening (everybody visiting a GP), receiving current care in terms of monitoring and prescribing
Drugs prescribing, following good practice for those currently detected
Better Monitoring better monitoring of those currently detected
Incremental Scores
Costs Benefits
Name Cost ongoing Health Inequality Premature mortality Individual QoL Social QoL
do nothing 0 0 0 0 0
Drugs 220 40 30 100 30
Better Monitoring 680 40 30 100 30
Better Detection 3570 100 100 85 100
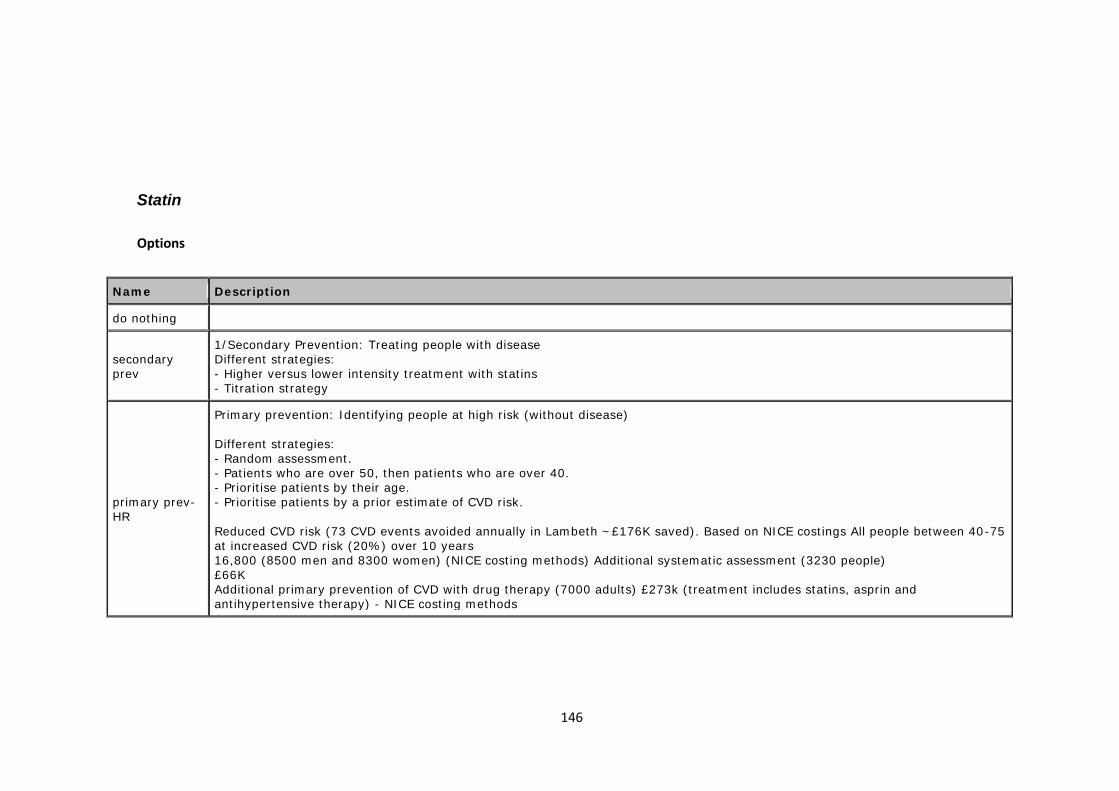
146
Statin
Options
Name Description
do nothing
secondaryprev
1/Secondary Prevention: Treating people with diseaseDifferent strategies:- Higher versus lower intensity treatment with statins- Titration strategy
primary prev-HR
Primary prevention: Identifying people at high risk (without disease)
Different strategies:- Random assessment.- Patients who are over 50, then patients who are over 40.- Prioritise patients by their age.- Prioritise patients by a prior estimate of CVD risk.
Reduced CVD risk (73 CVD events avoided annually in Lambeth ~£176K saved). Based on NICE costings All people between 40-75at increased CVD risk (20%) over 10 years16,800 (8500 men and 8300 women) (NICE costing methods) Additional systematic assessment (3230 people)£66KAdditional primary prevention of CVD with drug therapy (7000 adults) £273k (treatment includes statins, asprin andantihypertensive therapy) - NICE costing methods

147
Incremental Scores
Costs Benefits
Name Cost ongoing Health Inequality Premature mortality Individual QoL Social QoL
do nothing 0 0 0 0 0
primary prev-HR 339 20 100 70 100
secondary prev 1240 100 80 100 80

148
6 Deliberative Cost Effectiveness Analysis to allocate a fixed budget
Abstract
The aim of cost effectiveness analysis (CEA) is to inform the allocation of scarce
resources. Whilst CEA is routinely used in assessing the cost-effectiveness of specific
health technologies by agencies such as the National Institute for Health and Clinical
Excellence (NICE) in the England and Wales, there is extensive evidence that the CEA
framework is not generally used by healthcare planners to allocate a fixed budget to a
portfolio of interventions. CEA in its current form is problematic to use because the
analyses are difficult to understand and it embeds unacceptable assumptions.
Furthermore, it is not clear how interventions for which no published cost-effectiveness
evidence is available should be considered in the resource allocation process. This paper
argues for, and tests the feasibility of, a deliberative approach to CEA. The key
characteristics of the approach are (i) the use of models of requisite detail to assess the
cost-effectiveness of all interventions considered for resource reallocation drawing
explicitly on health economic theory, and on epidemiological and clinical evidence; (ii)
the engagement of key stakeholders in the interactive development of the models and
interpretation of results.
6.1 IntroductionA central problem of healthcare systems funded through taxation or social insurance
is to define the package of services to offer, given a limited budget. The economic
evaluation techniques of Cost-Effectiveness or Cost-Utility Analysis (CEA or CUA) have
been proposed as the tools of choice to solve this problem (Gold, Siegel et al. 1996,
Drummond, Sculpher et al. 2005), and metrics such as the Quality Adjusted Life Year
149
(QALY)(Williams 1985) have been developed to assess the effectiveness of, or utility
generated by, healthcare interventions.
There is a growing literature on the cost-effectiveness of healthcare interventions
and bodies such as the National Institute for Health and Clinical Excellence (NICE) in
England and Wales use CEA systematically to recommend whether a specific drug or
procedure should be provided by the National Health Service (NHS).
There is also extensive evidence, however, that neither CEA principles nor published
cost-effectiveness evidence are systematically used to allocate healthcare budgets to
portfolios of interventions by local or regional health planners (Eddama and Coast 2008).
CEA principles are difficult to use systematically because of the lack of cost-effectiveness
evidence for all interventions considered for funding and the lack of time (and
resources) to commission new CEA. This evidence shows that published cost-
effectiveness studies are difficult to use because of “accessibility” and “acceptability”
barriers, i.e. the ability to understand the details, and accept the assumptions, of the
analyses, a characterisation borrowed from Bryan and colleagues (Bryan, Williams et al.
2007, Williams and Bryan 2007). Accessibility is compromised because of the difficulties
of interpreting the results of CEA due to the need for specialist health economic skills,
lack of access to data used in the analysis and an excessively technical presentation of
results, making it difficult for non health economists to appreciate fully their meaning
and robustness. The acceptability of CEA is limited because of institutional and political
factors (e.g. the inflexibility of the healthcare budgets and the constraints of following
national policies); ethical reasons (e.g. the focus on health maximisation and efficiency);
concerns over the choice of the threshold cost-effectiveness value, over which
interventions are deemed cost-ineffective and should not be funded. Evidence from the
UK suggests that the range of threshold values used by NICE may be too high and that
potentially highly cost-effective interventions for which no CEA is available may be
displaced in order to fund others of lower but documented cost-effectiveness (Martin,
Rice et al. 2008, Appleby, Devlin et al. 2009).
One approach that has been proposed and used to inform healthcare planning in
practice is Program Budgeting and Marginal Analysis (PBMA) (Mooney 1978, Madden,
Hussey et al. 1995, Mitton and Donaldson 2001, Mitton, Patten et al. 2003, Mitton and

150
Donaldson 2004, Peacock, Richardson et al. 2007, Peacock, Mitton et al. 2009). In PBMA
a structured, deliberative approach is used to engage local stakeholders in considering
current spend, and proposing a ‘wish list’ of new interventions and a ‘hit list’ of potential
disinvestments from current activity to fund the new proposals. The value of considered
interventions is generally assessed against all the criteria considered relevant by the
local stakeholders using Multi-Criteria Decision Analysis (MCDA) (Keeney and Raiffa
1976) and participants are invited to assess the impact of changes to healthcare
provision, that is the difference in benefits between funding the interventions on the
wish list or on the hit list.
It is not clear, however, how the criteria proposed within PBMA relate to the
normative principles of health economics, nor it is clear how epidemiological and clinical
evidence can be integrated into the modelling in a consistent way. Furthermore, PBMA
exercises often include a long list of criteria which may make the results of the analysis
inaccessible (Mullen 2004) or may fail to meet the normative requirements of MCDA
(Thokala 2011).
This paper contributes to the debate on overcoming barriers to the use of CEA,
through an action research case study that describes the development and application
of a deliberative approach to CEA. The key characteristics of the approach are (i) the use
of models of requisite detail to assess the cost-effectiveness of all interventions
considered for resource reallocation which draw explicitly on health economic theory,
and on epidemiological and clinical evidence; (ii) the engagement of key stakeholders in
the interactive development of the models and interpretation of results. Section two
describes the research methods. Section three presents the case study in terms of
context, terms of reference, the deliberative approach (formal analysis, communication
procedure and interactive elicitation methods) and results. Section four discusses the
strengths and limitation of the approach on overcoming barriers to the use of CEA;
section five provides concluding remarks.
6.2 Methods
151
This paper employs action research. The term action research covers a multitude of
activities and methods; their common feature is the participative engagement of the
subjects of the analysis in the research, the research objective of analysing the world
and trying to change it at the same time (Eden and Huxham 1996).
The research was conducted in collaboration with and for the Isle of Wight Primary
Care Trust (PCT) of the English NHS in 2008. PCTs were responsible for designing
contracts with providers defining the type and volume of activity they expect to
purchase to meet the health needs of the local population of about 330,000 people on
average. As the local planning and purchasing agency of the NHS, PCTs were funded
through general taxation distributed by a capitation formula (Department of Health
2008).
The approach was organised around evaluation workshops with stakeholders which
took the form of ‘decision conferences’. Decision conferencing (DC), like PBMA, is a
deliberative process. An impartial facilitator works iteratively with key stakeholders to
generate a formal, ‘requisite’ model to assess options on multiple objectives using
Multicriteria Decision Analysis (MCDA) and generate a summary benefit score (Phillips
and Bana e Costa 2007). A model is ‘requisite’ when it is sufficient to represent the
mental models, beliefs about uncertainty and preferences of the participants and
additional model refinements do not generate new insights in the problem (Phillips
1984).
The analysis is based on extensive field notes, which include: the chronological
development of the stakeholder engagement process and of the prioritisation
technique, comments and reflections on these developments of the Strategic Planning
group, semi-structured and unstructured interviews with clinical staff and PCT
managers, email correspondence with PCT staff, direct observation of workshops,
flipcharts produced by workshop participants, clarification questions and comments
received on the report summarising the results of the analysis as well as follow-up
interviews with participants.
In Chapter 8 of this thesis I also reflect on the overall learning from the action
research case studies presented in Chapters 5, 6 and 7.

152
6.3 Case study6.3.1 Organisational context and term of referenceThe Isle of Wight NHS PCT was responsible for healthcare for an Island off the South-
East coast of England with a population of about 140,000. The PCT was comparatively
small and, in contrast to elsewhere in England, it was organised as an integrated
healthcare system with both purchasing and provision responsibilities, but with
governance arrangements to ensure separation of responsibilities.
The analysis of local mortality and disease morbidity conducted by the director of
Public Health (Smith 2008) highlighted five key priority areas to focus on to reduce
mortality and improve quality of life: cardiovascular disease, cancer, respiratory
condition, mental and children health. The financial accounts highlighted a surplus of
about £1m that the PCT could allocate on a recurrent basis from 2008 (Isle of Wight NHS
PCT 2008).
The PCT, which had a duty to engage local stakeholders, used decision conferencing
to involve stakeholders in the five identified priority areas to generate a robust plan for
allocating the additional £1m. The PCT Board recommended looking at costs and using
three criteria to identify value: to increase health, to reduce health inequalities, and to
be operationally and politically feasible.6.3.2 Deliberative CEAThe action research project ran from April to November 2008 and consisted of (i) a
schedule of meetings (two initial meetings in the spring and then fortnightly from June);
(ii) the design, in collaboration with the PCT, of a social process to engage key
stakeholders (including managers, clinicians, patients and public representatives) and of
a technical process to assess the relative cost-effectiveness of all interventions
considered for funding; (iii) the guidance on extracting information from available
demographic and epidemiological data to support the evaluation of different
interventions; (iv) the facilitation of meetings with stakeholders; (v) the analysis of
153
results; (vi) the production of a report to document the process and to identify
recommendations from the analysis; and (vii) follow-up assistance in performing
supplementary analyses.
Executive level leadership was provided through a Strategic Planning group, which
consisted of all eight executive directors (including Jenifer Smith) and the facilitator of
the decision conferences (Mara Airoldi). Its remit was to design an engagement process,
choose a prioritisation technique and put forward recommendations to invest available,
additional resources.
The agreed engagement process consisted of two types of events. The first type was
a two-hour meeting for each of the five priority areas to identify key issues in the
provision of healthcare and to put forward a list of initiatives to improve quality of life
and reduce health inequalities. A mix of stakeholders was invited, chosen by the
commissioning managers to represent the diverse perspectives which they wished to
consider in allocating resources and included: acute and community care clinicians,
council representatives, voluntary sector representatives, nurses, public and patients’
representatives, managers of the hospital and the ambulance service. The number of
participants varied between 10 and 30 (a total of about 100 people were involved in
total). The second type of event was a one-day decision conference to prioritise the
proposed initiatives and to put forward recommendations to allocate resources across
different priority areas. Twenty-five stakeholders attended the event: the eight
executive directors of the PCT, nine commissioning managers, three patients and public
representatives, four clinical experts and one representative of social services.
The area specific workshops identified twenty-one initiatives to be prioritized. Their
total cost was over £5m. The proposed initiatives were described on a standard
template reporting available information on: the expected costs, the estimated number
of people who would benefit, a description of the ‘average’ beneficiary (in terms of
demographics, severity of the condition, socio-economic background) and a quantitative
or qualitative description of the health benefits to patients, their families and carers.
In the decision conference, participants built a formal model of the costs and value
of all twenty-one strategic interventions (indexed by j) interactively, in terms of:
154
costs (cj): the additional annual funding (over and above the status quo)
required in 2009 and 2010 to set-up and to run the intervention, in £’000. Set-
up costs included training and equipment, and the running costs included
staffing;
population health benefit (Nj*Bj): the product of the number (Nj) of patients who
benefit from the intervention and the potential benefit (Bj) in quality (and
length) of life, assuming successful implementation, to the ‘typical’ beneficiary
(e.g. QALY gains);
health inequalities (Ij): the extent to which the intervention has the potential for
reducing both differences in access and differences in health outcomes (across
geographical areas, between men and women, of special groups);
feasibility (pj): Probability of success (from 0% to 100%) of achieving the
assessed benefits, assuming funding is granted and taking into account: ease of
implementation; availability of workforce; acceptability to stakeholders (e.g.
willingness to make this change happen); process complexity (e.g. number of
steps required). This criterion captures the concept of ‘operationally and
politically feasible’ the Board asked the Strategic Planning group to consider in
its terms of reference.
The formal model underpinning the evaluation is to Max j E(vj) * xj, where E()
indicates an expected value calculation, vj is the benefit from intervention j (details of its
calculation will be provided later), and xj is an index variable with value 1 in case
intervention j is funded, and value 0 in case it is not. In the model used during the
workshop, we made a simplifying assumption about E(), namely we assumed that the
intervention j would have been successful and deliver its benefits in full with probability
pj%; if unsuccessful (1-pj% probability), it would have delivered no benefit. This
assumption was subjected to sensitivity analysis after the stakeholder event through a
parameter k[0,1], which represented the proportion of benefits which would have
been achieved in case of unsuccessful interventions. The formal model and its notation
were hidden from workshop participants, who were presented with simpler, accessible
visual aids for each step of the process, which will be described below. The budget
constraint was not modeled explicitly because the PCT had some flexibility on allocating
155
resources in the current and the subsequent year. The aim of the technical model was
hence to generate a priority list of the twenty one interventions in terms of their cost-
effectiveness and to agree the exact amount of available budget after the analysis.
Participants revised the information provided by the standard template which put
forward each initiative and scored them one commissioning group at a time (g, which
corresponded to the priority area specific stakeholders’ workshops), one criterion at a
time as illustrated in Table 22 which reports the assessment for the three proposed
interventions by the commissioning lead for cancer services, who also commissioned all
palliative care. This required:
Validating the number N of people who benefit (using demographic and
epidemiological statistics, data on hospital admissions and expert judgment).
Providing a description of the ‘average’ beneficiary of the proposed intervention
and agreeing a qualitative description of the expected benefit (derived from
clinical evidence of effectiveness and expert judgments).
Quantifying the health benefits B to beneficiaries attributable to action within
the budget period (over the beneficiaries’ lifetime, assuming successful
implementation and compliance). This assessment was informed by evidence
(e.g. of QALY gains) whenever available. Due to time constraints and the
exploratory nature of this approach, we used direct rating with a Visual
Analogue Scale (VAS) technique (von Winterfeldt and Edwards 1986, Parkin and
Devlin 2006) on the basis of the evidence brought to bear by clinical experts
attending the meeting as follows: participants identified the option providing
the greatest individual health benefit which was assigned a score of 100; they
then scored the remaining interventions relative to this benchmark score of 100
and a fixed benchmark of 0 corresponding to ‘no additional health benefits
compared to current care’. A rectangle summarised the population health
impact N*B visually (Figure 18), with the numbers who benefit on the horizontal
axis and the average benefit per person on the vertical axis. The area of the
rectangle is the expected overall benefit of the intervention in the population.

156
Assessing the impact on reducing health inequalities I on a VAS. Interventions
which had no impact on health inequalities were given a score of zero.
Participants identified the option with the greatest potential to reduce health
inequalities (assuming successful implementation and compliance); this was
assigned a score of 100 and the remaining options scored relative to this
benchmark.
Assessing the operational and political feasibility of the option by asking
participants their degree of belief that it would deliver the stated benefits in
probabilistic terms p (with 100% representing absolute confidence).
In case of disagreement, participants explored the reasons and sought a consensus
view, which was usually reached. If a consensus view could not be arrived at, the range
of proposed values was recorded for sensitivity analysis purposes and the majority’s
view at the end of the discussion used for the base model.

157
Table 22 Example of template and scores: options for cancer (a similar template
was used for each of the other four priority areas and their eighteen interventions)
Initiative[j]
No.who
benefitperyear[Nj]
‘Average’beneficiary
Description ofindividual benefit
compared to currentcare
Healthbenefit
perpersonscore
[Bj]
Healthinequalityreductionscore [Ij]
Feasibility(Probabilityof success)
[pj]
Earlydetection&diagnosisin cancer
200
Person inher/his mid-60s, morelikely to befemale andfrom “hard toreach”groups insociety
Earlier diagnosis isassociated withbetter prognosis (weassume no benefitfor people screenedand with negativeresults)
100 100 95%
Palliative& End ofLife care(alldiseases)
1,500
Person inher/his late70s, with lifelimiting longterm healthcondition,equally likelyto be fromany socio-economicgroups
Benefits tocarers/family/friends.
Benefits to patient:no change in lifeexpectancy but abetter quality of lifein its last months
75 50 70%
Relocationof activetreatmentin cancer
300
Person in hermid-60s,more likely tobe female;extremelysevere illness
Patients are alreadyreceiving thistreatment off theisland, but there arepsychologicalbenefits of providingthe service locally
25 0 10%
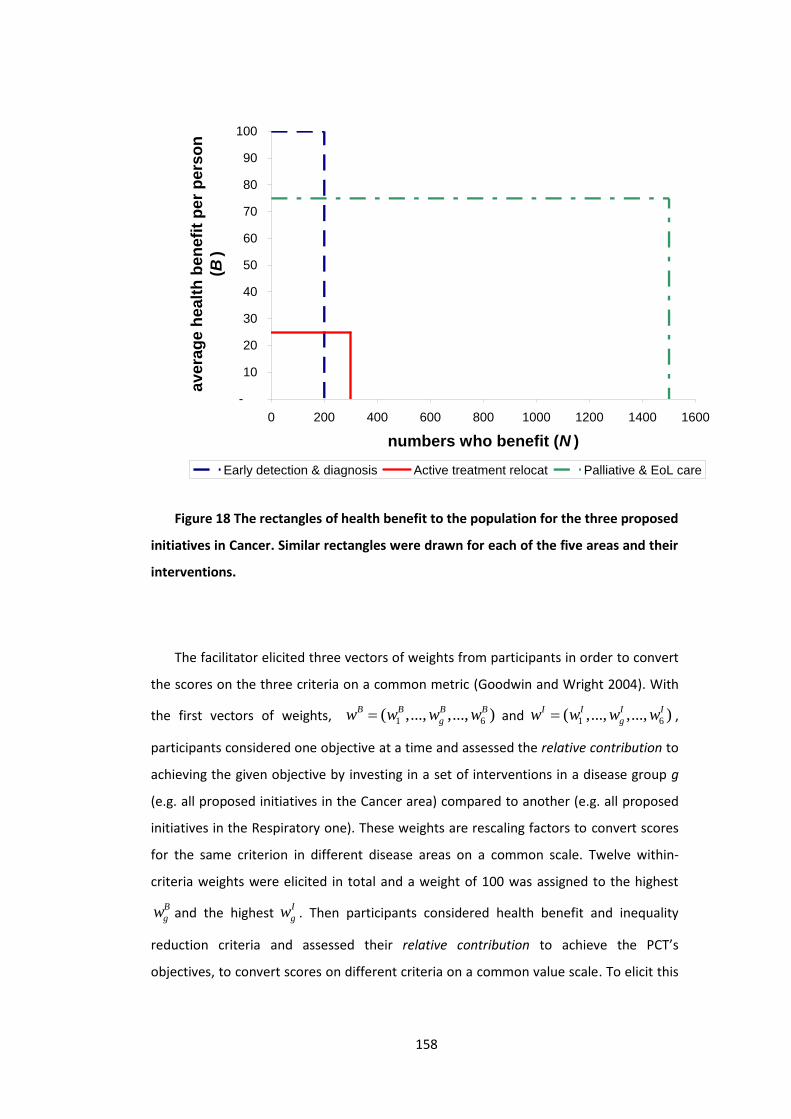
158
Figure 18 The rectangles of health benefit to the population for the three proposed
initiatives in Cancer. Similar rectangles were drawn for each of the five areas and their
interventions.
The facilitator elicited three vectors of weights from participants in order to convert
the scores on the three criteria on a common metric (Goodwin and Wright 2004). With
the first vectors of weights, 1 6( ,..., ,..., )B B B Bgw w w w and 1 6( ,..., ,..., )I I I I
gw w w w ,
participants considered one objective at a time and assessed the relative contribution to
achieving the given objective by investing in a set of interventions in a disease group g
(e.g. all proposed initiatives in the Cancer area) compared to another (e.g. all proposed
initiatives in the Respiratory one). These weights are rescaling factors to convert scores
for the same criterion in different disease areas on a common scale. Twelve within-
criteria weights were elicited in total and a weight of 100 was assigned to the highest
Bgw and the highest I
gw . Then participants considered health benefit and inequality
reduction criteria and assessed their relative contribution to achieve the PCT’s
objectives, to convert scores on different criteria on a common value scale. To elicit this
-
10
20
30
40
50
60
70
80
90
100
0 200 400 600 800 1000 1200 1400 1600
numbers who benefit (N )
aver
age
heal
th b
enef
it pe
r per
son
(B)
Early detection & diagnosis Active treatment relocat Palliative & EoL care

159
weight, participants considered the disease areas which received the highest within
criteria weights of 100. A single rescaling factor W was sufficient to render scores on the
health inequality criterion commensurable with scores on the health benefit criterion.
The weighting judgments express critical value tradeoffs, and the facilitator encouraged
participants to discuss these tradeoffs openly, noting uncertainty and disagreements to
be explored by sensitivity analysis.
Defining ( )g j as the commissioning group of intervention j, the expected value of
each intervention was hence calculated as indicated by Equation 9 (assuming k=0 during
the decision conference and k [0,1] in sensitivity analysis after the event):
Equation 9
( ) ( ) ( ) ( )(1 )B I B Ij j g j j j g j j j g j j j g j jE v p w N B W w I p k w N B W w I
Thus, at the core of the analysis was a value model based on the expected value,
with value computed as a weighted additive combination of health gain and inequality
reduction. There is precedent for this model structure in the decision analysis literature:
for example, Keeney and Winkler (1985) also present an additive model with absolute
and distributional components for evaluating risk reductions.
Third, participants were presented with a triangle that focused the discussion on the
cost-effectiveness of each intervention (Figure 19). The horizontal side of the triangle
represents the additional cost cj associated with the intervention; the vertical side
represents the additional expected benefit score E(vj); and the slope of the hypotenuse
of the triangle represents cost-effectiveness with steeper hypotenuses representing
higher cost-effectiveness. Showing the triangles stimulated a discussion both for their
comparative size and slope. In most cases participants recognised the comparison as a
fair representation of their intuitive judgments, but they had now a language to
entertain a more informed discussion. In few cases results were less intuitive and
explored extensively by revising the assessments of costs and benefits that constituted
the scale and slope of the triangle creating a better understanding of the appraised

160
interventions. Whenever necessary, assessments were revised following this
exploration.
Costs (c)
Reducedinequalitieswacross*wwithinI*I
ImprovedpopulationhealthwwithinB*N*B
Benefitscore(v) Expected
benefitE(v)
For k=0VfM indexE(v)/c
Figure 19 The structure of a value-for-money triangle
6.3.3 ResultsThe triangles were used to generate a priority list in which interventions were
ranked according to value-for-money (Table 23). This ranking is similar to a cost/QALY
league table. Extensive sensitivity analysis was used to explore the uncertainties and
disagreements among participants and the model proved robust. Figure 20 shows the
same information in graphical form. The visual display generated important learning:
for example, one intervention the evaluation of which had attracted considerable
attention within the organisation, was represented by a triangle which was not only
shallow (and thus relatively poor value-for-money), but tiny, because it touched such a
small number of people. Thus, from a population health perspective, and from the point
of view the cost imposed on the system, the intervention had little impact.

161
Table 23 Priority order according to Value-for-money (‘league table’) for k=0.5.
Commissioningarea [g] Intervention [j]
Additionalcost in £k[cj]
Additionalbenefit[E(vj)]
VfM ratio[E(vj)/cj]
Cumulativecost in £k
Cumulativebenefit
RESPIRATORY pneumonia £75 11.84 0.1579 £75 11.84MENTALHEALTH
Dementiaservices £50 5.18 0.1036 £125 17.02
CVD TIA & 2ndaryprevention £130 5.40 0.0415 £255 22.42
MENTALHEALTH Prison MH £150 4.51 0.0301 £405 26.94
CHILDREN Obesity training £60 1.73 0.0289 £465 28.67
CHILDREN Workforcedevelopment £100 2.78 0.0278 £565 31.44
MENTALHEALTH Psych therapies £120 3.05 0.0254 £685 34.49
CANCER Early detectionand diagnostics £300 5.74 0.0191 £985 40.23
CHILDREN CAMHS School £160 2.76 0.0173 £1,145 42.99CVD Prevention £650 10.48 0.0161 £1,795 53.48CHILDREN CAMHS 1:1 £80 1.26 0.0157 £1,875 54.73CVD Cardiac Rehab £100 1.29 0.0129 £1,975 56.02MENTALHEALTH
Alcohol misusesvc £300 3.77 0.0126 £2,275 59.78
MENTALHEALTH Social inclusion £300 3.75 0.0125 £2,575 63.54
CANCER Palliative & EOL £760 9.05 0.0119 £3,335 72.59CHILDREN Obesity 1:1 £140 1.22 0.0087 £3,475 73.81
CHILDREN Primaryprevention £600 4.61 0.0077 £4,075 78.42
CHILDREN Access todental £480 3.24 0.0068 £4,555 81.66
CANCER ActiveTreatment £50 0.31 0.0062 £4,605 81.97
CVD Strokeemergency £600 3.37 0.0056 £5,205 85.34
CVD CHD acute £300 0.78 0.0026 £5,505 86.12
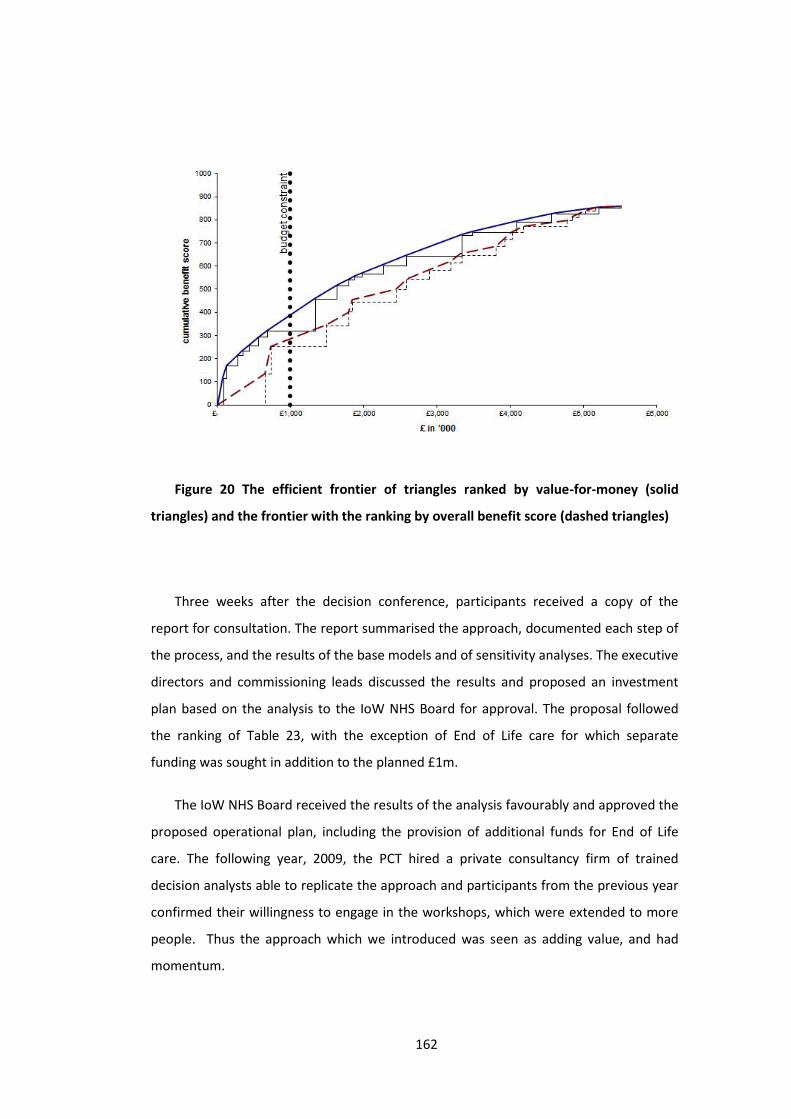
162
Figure 20 The efficient frontier of triangles ranked by value-for-money (solid
triangles) and the frontier with the ranking by overall benefit score (dashed triangles)
Three weeks after the decision conference, participants received a copy of the
report for consultation. The report summarised the approach, documented each step of
the process, and the results of the base models and of sensitivity analyses. The executive
directors and commissioning leads discussed the results and proposed an investment
plan based on the analysis to the IoW NHS Board for approval. The proposal followed
the ranking of Table 23, with the exception of End of Life care for which separate
funding was sought in addition to the planned £1m.
The IoW NHS Board received the results of the analysis favourably and approved the
proposed operational plan, including the provision of additional funds for End of Life
care. The following year, 2009, the PCT hired a private consultancy firm of trained
decision analysts able to replicate the approach and participants from the previous year
confirmed their willingness to engage in the workshops, which were extended to more
people. Thus the approach which we introduced was seen as adding value, and had
momentum.

163
6.4 DiscussionThis section discusses how the use of requisite models and the engagement of
stakeholders in a facilitated, deliberative process contributed to the systematic use of
CEA principles. We frame this discussion in terms of the concepts of accessibility and
acceptability as used in Bryan and colleagues (Bryan, Williams et al. 2007, Williams and
Bryan 2007).6.4.1 AccessibilityThe visual aids proved essential to make the CEA framework accessible to non-
health economists. The use of rectangles to visualise the population health gain helped
clinicians and patients to share their knowledge and to articulate their expert opinion on
the impact for the individual patient; and it enabled participants to discuss more clearly
the details of the implementation, the number of beneficiaries and the associated costs,
and to document the rationales of agreed changes. The visualization of cost-
effectiveness through triangles and their aggregation in an efficient frontier was
particularly useful to communicate the principles of CEA as evidenced by comments
from several participants (mostly managers and patients representatives), who felt they
could fully appreciate the meaning of cost per QALY estimates for the first time.
The understanding of the evaluation framework was crucial both to incorporate
available clinical and epidemiological evidence and to assess interventions for which
evidence was missing or weak. This was particularly evident for interventions in primary
prevention, for which hard evidence was not available and local characteristics of the
health economy were particularly critical: it enabled participants to volunteer estimates
and for these to be challenged by others.
At the decision conference it became evident, however, that the definition of health
inequalities was not as accessible as we would have liked. In particular, if health
inequalities are measured in terms of the health gap between different groups in the
population measured for instance in terms of quality-adjusted life expectancy at birth,
one would expect that the higher the number of health-poor people affected, the higher
the impact on health inequalities. Participants, however, did not consider the number of
164
people affected by the intervention unless prompted by the facilitators and the
rationales used to defend their health inequality score usually reflected their personal
view of the extent of “health-poverty” of a typical beneficiary or his/her deservingness
of better health. The development of a more intuitive and theory-based approach to
modelling health inequality is the focus of ongoing research (Morton and Airoldi 2010).6.4.2 AcceptabilityThe Strategic Planning group (with the objection of one member) found the
approach generally acceptable in terms of the included criteria, their definition, their
operationalisation, and the method to translate values into a priority order, with the
exception of the evaluation of palliative and end of life treatments.
The objecting member raised a general concern with the use of “an approach which
aims at getting the greatest good for the greatest number”. This was clearly a rejection
of the utilitarian principle embedded in the ‘a QALY is a QALY is a QALY’ principle
commonly applied in health economics. At its core the objection was a pragmatic one:
she contended that it would have been difficult to defend hard choices based on the
utilitarian principle in front of the public or the courts. The majority of the Strategic
Planning group, however, thought that the utilitarian principle was acceptable and
highlighted the hard trade-off involved in funding decisions; they agreed to aggregate
health gains across people additively in the analysis and to discuss the political feasibility
of the recommended set of interventions to be funded at the end of the process.
For the specific assessment of palliative and end of life interventions the executive
directors and commissioning leads judged the approach unacceptable and decided to
ignore the results for these treatments. They felt that the value of these interventions is
to provide ‘a good death’ and this could not be captured by the criteria used in the
approach. They were not able to articulate a general, acceptable definition of ‘good
death’ as different patients and their families may have very different needs at this
difficult time of their life and ‘a good death’ may have more to do with allowing them
time to understand these needs and respecting their wishes than with a specific
healthcare intervention (Sandman 2005). The difficulty of using a common tool to assess
curative and palliative interventions is not unique to this case study, as demonstrated by
the debate about the appropriate cost-effectiveness threshold within the cost per QALY
165
approach for end of life treatments, in which some authors advocate for the
appropriateness of a higher cost per QALY threshold (Mason, Jones-Lee et al. 2009,
Towse 2009).
The assessment of preventative interventions and potentially life-saving
interventions posed a similar challenge, with participants invoking the ‘rule of rescue’
principle – the moral imperative to rescue identified people in immediate peril
regardless of the costs – to express their difficulty in comparing the relative health
benefits across these interventions. The director of public health noted that “It is quite
hard for all of us to weigh up the difference between treating one or two very seriously
ill people with the latest technology or treating very large numbers out in the
community who may not be perceived to be as acuely in need of health service. This
[approach] is a means of translating that into measurable benefits of some sort” (The
Health Foundation 2010, p17). The executive directors decided to exclude ‘rule of
rescue’ considerations in the formal analysis in order to be able to quantify and to face
the hard trade-offs between investing in prevention compared to treatment. They
recognised that the choice between prevention and potential cure is an intrinsically
difficult value judgment but also highlighted the value of visualising the opportunity cost
of providing additional treatment to inform their decisions. Their difficulty is consistent
with the current absence of any clear, agreed operationalisation of the rule of rescue
principles (Cookson, McCabe et al. 2008). Despite the dismissal of ‘rule of rescue’
considerations, however, the analysis identified most preventative interventions as cost-
ineffective because they were usually also associated with a relatively low probability of
success (which reduced their expected value).
The opportunity cost of alternative budget allocations was modeled explicitly by using
requisite cost-effectiveness models. Indeed the Board found the efficient frontier
particularly insightful, because it enabled them to articulate a clear rationale for the
proposed allocation based on the principles of opportunity cost. For instance, the
analysis did not support funding for a major package of primary prevention of
cardiovascular disease. The Board discussed the cost of including this package in terms
of the forgone benefits from interventions that would be displaced. As Dr Smith
commented: “[with this approach] you are able to show the board that what you want
to invest in could get 10% more benefit in terms of health outcome than doing it
166
another way. The board doesn’t always want to do that, but it’s a very good way to
understand the basis on which you’re making the decisions” (The Health Foundation
2010, p19).6.5 ConclusionsThe paper presents a case study to illustrate, and to demonstrate the feasibility of, a
deliberative approach to CEA. The proposed approach is not a substitute for
methodologically rigorous CEA for the purpose of technology assessment at the national
level. It does show, however, that health planners at the local or regional level could use
CEA principles systematically even if evidence on the effectiveness and cost-
effectiveness of considered interventions may not be available, and could overcome
known accessibility and acceptability barriers of CEA.
The distinctive characteristics of the approach are the use of requisite detail to
assess the cost-effectiveness of all interventions considered for funding, the use of visual
aids to make CEA concepts accessible to non-health economists, and the engagement of
key stakeholders in the interactive development and interpretation of the models of
cost-effectiveness and the underlying data. Deliberative CEA requires a facilitator
trained in health economics and MCDA. This is because the requisite models use health
economic principles and concepts to combine evidence from public health, demographic
surveys, health economic studies, RCTs, local administrative and accounting systems.
The proposed visual aids enable those with no training in health economists to
understand CEA principles and to contribute value judgments, and expert knowledge in
interpreting available evidence. Stakeholders can also assess judgmentally the cost-
effectiveness of interventions for which no published CEA is available. Although these
estimates are necessarily approximate, they are better than the alternative, which is no
information. Furthermore, these estimates represent explicitly the values and
knowledge of those involved in the resource allocation process and help them to
communicate and explain the rationale of their recommendations.
The success in facilitating clear, value-driven and evidence-based discussions are
attributable to the intellectual robustness of the underpinning health economic theory,
and indeed, where our methods were less informed by health economics – as in the
modelling of inequality, and the health benefit/ inequality tradeoff – we were less

167
successful in facilitating such discussions. In areas where health economics theory has
less purchase as a normative theory – in particular in the valuation of End of Life care –
decision makers set aside the priorities as assessed by the model and, for explicit and
legitimate reasons, made their decisions on the basis of other concerns. This is as it
should be, for in an arena where values are as contested as healthcare, the highest
aspiration for analysis can only be to provide a basis for thoughtful and informed moral
choices.

168
7 Disinvestments in practice: overcoming resistance to change
through a socio-technical approach with local stakeholders
This chapter has been published as: M Airoldi (2013) "Disinvestments in practice:
overcoming resistance to change through a socio-technical approach with local
stakeholders", Journal of Health Politics, Policy and Law, 38 (6): 1151-73
Abstract
For health care, economists have developed Cost-Effectiveness Analysis
(CEA) as a “rational”, analytical tool to set priorities. Attempts to use CEA to
decide how to cut expenditure, however, have been met with stakeholders’
resistance. This paper presents an illustrative case study of the application
of an approach explicitly designed to engage stakeholders with conflicting
objectives in confronting tightening budgets. The outcome of this process,
which engaged a group of stakeholders including patients, carers, clinicians
and managers, was a strategy that reconfigured services to produce more
health gain at reduced total cost. I argue that the key factors that led to
overcoming resistance to change were: (i) the collective character of the
deliberations; (ii) the analysis of the whole pathway; (iii) the presence of
patients; (iv) the development of a model based on CEA principles which
provided a credible rationale for difficult decisions.
7.1 IntroductionFor the United States and many developed countries, fiscal problems mean
constrained growth in the costs of health care against the pressures of inflation from
advances in technology offering the potential to do more to relieve the suffering of

169
aging populations. Although there have always been constraints on the total costs of
health care, which are manifested in different ways according to each country’s systems,
the prospects for the next decade are that these pressures will become more intense.
Economics is the discipline that aims to enable these pressures to be tackled so that
we can achieve the greatest benefit from increasingly scarce resources. For health care,
economists have developed methods to assess benefits without using money as the
numeraire, namely gains in health as measured in Quality-Adjusted Life Years (QALYs;
Williams 1985), to be used in Cost-Effectiveness Analysis (CEA; Gold, Siegel et al. 1996,
Drummond and McGuire 2001, Drummond, Sculpher et al. 2005). CEA aims at informing
evidence-based policies by allocating resources to maximise QALYs. The basic idea
consists in ‘marginal analysis, that is in deriving an ‘incremental cost effectiveness ratio’
(ICER) for each intervention compared to the next best use of resources. This number is
the ratio between the additional costs and the additional benefits measured in QALYs
attributable to the intervention. The lower the ICER, the higher the cost-effectiveness of
the intervention. One may imagine a table with all possible health interventions ranked
from most to least cost-effective. According to CEA, resources should be allocated
according to this ranking, funding interventions from the top of the list and drawing a
line when all available resources are spent. QALYs and CEA are famously used in the
English National Health Service (NHS) in deciding whether new therapies ought or ought
not to be funded from the NHS budget by the National Institute for Health and Clinical
Excellence (NICE). Because it is not feasible to draw a table with all possible health care
interventions, NICE uses a threshold value of between £20,000-£30,000, i.e.
interventions with an ICER below the threshold are generally considered cost effective
and funded (National Institute for Health and Clinical Excellence 2008).
From a ‘technical’ perspective, CEA could support equally well decisions about
funding new interventions or about disinvestments. Disinvestments are “the process of
(partially or completely) withdrawing health resources from existing health care
practices, procedures, technologies, or pharmaceuticals that are deemed to deliver little
or no health gain for their cost, and thus do not represent efficient health resource
allocation” (Elshaug, Hiller et al. 2008, p2). In particular, to advice about disinvestments,
analysts could aim at identifying interventions that are currently available but have an
170
ICER above the threshold. If these disinvestments do not release sufficient resources,
the threshold should be lowered.
In practice, however, the context of funding new interventions and that of
disinvesting are significantly different. Indeed, attempts to identify interventions for
disinvestments through cost/QALY analyses have not been successful to date (Elshaug,
Hiller et al. 2008, Garner and Littlejohns 2011).
A fundamental difference between the investment and disinvestment scenario is
that the loss of an actual service is perceived differently from the failure to obtain a new
service. Key actors in a health-economy (e.g. pharmaceutical companies, providers of
care, clinicians and patients) have hence very different incentives to share private
information about the costs and benefits of specific interventions in the two scenarios.
In the case of investments, they volunteer business cases and models to argue for
additional resources as in the English experience with NICE. In the case of
disinvestments, a health planner wishing to identify a list of interventions that should be
investigated as potential disinvestments is immediately confronted with fierce
stakeholder resistance, for putting a procedure under the lens would automatically
stigmatise it (Elshaug, Moss et al. 2009).
In this paper I present an illustrative case study of priority setting in health care in a
context of decreasing resources, to illuminate how the framework of CEA and a
participative process led to a strategy to reconfigure services to produce more health
gain at reduced total cost. The case study has been conducted in the English NHS, but
results are in principle generalizable to health care systems funded through taxation
such as Australia, Canada or the Medicare and Medicaid programmes in the United
States. The paper is structured as follows. The next section discusses the methods. The
following section presents the case study in detail, including background and terms of
reference, participants, the socio-technical process, results and actual impact. In the
final session I reflect on the political and institutional dynamic created by the socio-
technical process and how it contributed to attain agreement to cut spend.
171
7.2 MethodsIn this paper I use case study and action research. Case studies are particularly
useful to describe how and why an intervention worked in a given time and setting (Yin
2009). Action research is characterized by the participative engagement of the subjects
of the research and by its aim to analyse and at the same time change the organisation
(Eden and Huxham 1996, Gray 2009). Action research is particularly useful for obtaining
a rich description of the intervention in order to generate an emergent theory of what
happened (Montibeller 2007).
The approach I took was decision analytic. Decision analysis is a discipline which
aims at helping an individual or group to formally represent a problem at hand,
systematically analyse it and to agree a course of action. The approach consisted of a
series of workshops in the form of ‘decision conferences’, which are working meetings
attended by key stakeholders, led by an impartial facilitator, to build a ‘requisite’ model
of the problem on-the-spot to incorporate available data and judgments of participants
(Phillips 2007). A model is requisite when it is sufficient to represent the mental models
of participants by representing their beliefs about uncertainty and their preferences and
refinements to the model do not add insights into the problem (Phillips 1984).
The analysis of the case study is based on extensive field notes and a report
produced by an independent evaluator who interviewed participants before and after
the decision conferences. The field notes include the chronological development of the
engagement process, comments and reflections on its development by the Steering
group who oversaw the process, semi-structured and unstructured interviews with
clinical staff, patients and health care managers, email correspondence with event
participants during and after these events, direct observation of workshops, flipcharts
produced during the workshops, minutes of Board meetings following the events,
comments and reflections of participants at a follow-up afternoon with a wider set of
stakeholders to present the methods and results to key actors in the local health
economy, and two follow-up interviews with the health care manager responsible for
managing change (at one and at two years follow-up). The independent evaluator (David
Collier) is a professional consultant who has extensive experience with decision
conferencing and deliberative approaches to support decision making in the public
sector. He conducted a series of interviews with the Steering group, the top

172
management of the PCT and some workshop participants before and after the events,
on an expenses-only basis.
In Chapter 8 of this thesis I also reflect on the overall learning from the action
research case studies presented in Chapters 5, 6 and 7.
7.3 Case study7.3.1 Background and term of referenceSheffield PCT was a large Primary Care Trust (PCT) of the English NHS responsible for
purchasing health care on behalf of a population of about 550,000 people living in
Sheffield, a city in the North of England. It had an annual budget of about £900 million.
PCT budgets were determined by the Department of Health through a capitation
formula (Department of Health 2008).
The PCT had a recurrent overspend on its budget and it expected an increase in
demand because of demographic change. It hence set an organisational goal to save £40
million and 400 additional lives by 2012 (Sheffield PCT 2008). The action research
project described here aimed at strengthening the prioritisation process to contribute to
this goal. The ‘strengthening’ consisted in enabling the PCT: to assess the relative cost
effectiveness of different health care interventions, to use this information in resource
allocation and to communicate planned changes to stakeholders.
In this paper I present the work conducted for and in collaboration with the lead
commissioner for mental health services. He proposed to focus on the care provided to
patients affected by eating disorders, which fell under his remit. These patients have an
abnormal attitude towards food that changes their eating habits. Some may starve
themselves in order to lose weight (anorexia nervosa), others feel compelled to overeat
(binge eating) and others may combine binge eating with forced vomiting (bulimia).
Expenditure in hospital treatment for patients with eating disorders had been
rapidly increasing and the PCT was reacting to demand because it lacked a clear

173
strategy. The lead commissioners suspected that resources spent in this area were not
delivering good value-for-money and he wished to improve the priority setting process
to better allocate available resources.
The strengthened prioritisation process, if successful, will have informed the
development of a commissioning strategy. At the time of writing this paper, eating
disorders services were provided in Sheffield by NHS statutory services, the voluntary
and the private sector in a variety of settings from primary care (e.g. family doctors) to
tertiary care (e.g. specialist, residential care units). The PCT commissioned services from
each of these providers on an incremental basis in order to meet existing demand.
Through the design of a commissioning strategy, the commissioning manager aimed at
agreeing - in collaboration with providers and users of the services - a more proactive
role for the PCT to improve patients’ health, their experience with the service and at the
same time contain costs.7.3.2 ParticipantsA Steering group was set up to oversee the process. It consisted of the Director of
Public Health, three commissioning managers (including that of mental health services),
the Head of Finance, and managers responsible for information services and data
analysis, for patient and stakeholders engagement, and for PCT commissioning. The
Steering group met fortnightly from June to November 2009. The Director of Public
Health chaired these meetings and regularly briefed the CEO and the Director of
Strategy on the progress of the work.
The decision conferencing process involved twenty-four key stakeholders, selected
by the manager responsible for commissioning eating disorder services (17 stakeholders
attended the first meeting and 19 the second one; 14 attended both). These were nine
managers of provider organizations, five clinicians, five patients and carers, two
managers of the PCT, and two representatives of the Mental Health Partnership Board
(a partnership with members from all the main health organizations promoting mental
health in Sheffield which facilitates inter-organizational collaborations to improve health
and reduce health inequalities). I facilitated both meetings, with the support of two
analysts. Before the second meeting, which was attended by several patients, I was also

174
briefed by an expert in eating disorders on the characteristics of these patients and on
how I could best enable them to feel comfortable and to contribute to the discussion.
175
7.3.3 The socio-technical processThe social dimension
The case study took place between June and December 2009. The timing of the key
events is summarised in Figure 21. The scoping of the work was drafted by the
commissioning manager and signed off by the Steering group in July. The scoping
document identified nine intervention areas which broadly captured the PCT spend of
about £1.5million in this disease area: inpatient admissions to specialist hospitals, day-
services, specialist services in the community (Sheffield Eating Disorder Service or,
simply, SEDS), emergency hospital admissions, services offered by community Mental
Health team, specialist services offered by nurses at the University clinic, services
offered by general practitioners, those offered by voluntary sector, and admissions to
acute psychiatric wards.
Two decision conferences which ran from 10am to 4pm engaged the local
stakeholders in iteratively assessing the value and the value-for-money of current
services. The aim of the first meeting was to consider available clinical and
epidemiological evidence on the services provided and to explain the methodology. A
data-pack with evidence from the literature and data available to the PCT was tabled on
the day. The aim of the second meeting was to build a model of the PCT spend across
the identified interventions and their outcomes, based on the best available evidence,
expert and value judgments of participants and to develop insights to inform a
commissioning strategy.
A further meeting was organised to follow-up on the results of the analysis and to
explore possible improvements to available services in a climate of decreasing
resources. Participants were stakeholders who took part in the decision conferencing
process and additional representatives of primary care commissioning.
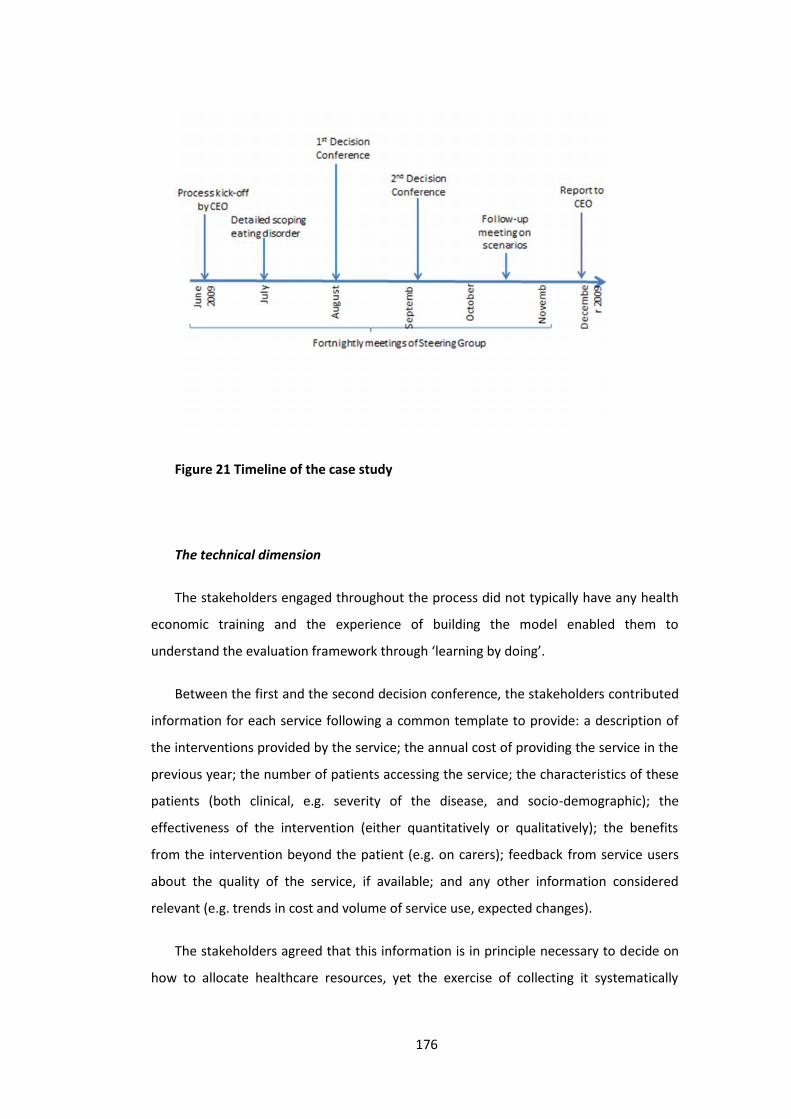
176
Figure 21 Timeline of the case study
The technical dimension
The stakeholders engaged throughout the process did not typically have any health
economic training and the experience of building the model enabled them to
understand the evaluation framework through ‘learning by doing’.
Between the first and the second decision conference, the stakeholders contributed
information for each service following a common template to provide: a description of
the interventions provided by the service; the annual cost of providing the service in the
previous year; the number of patients accessing the service; the characteristics of these
patients (both clinical, e.g. severity of the disease, and socio-demographic); the
effectiveness of the intervention (either quantitatively or qualitatively); the benefits
from the intervention beyond the patient (e.g. on carers); feedback from service users
about the quality of the service, if available; and any other information considered
relevant (e.g. trends in cost and volume of service use, expected changes).
The stakeholders agreed that this information is in principle necessary to decide on
how to allocate healthcare resources, yet the exercise of collecting it systematically
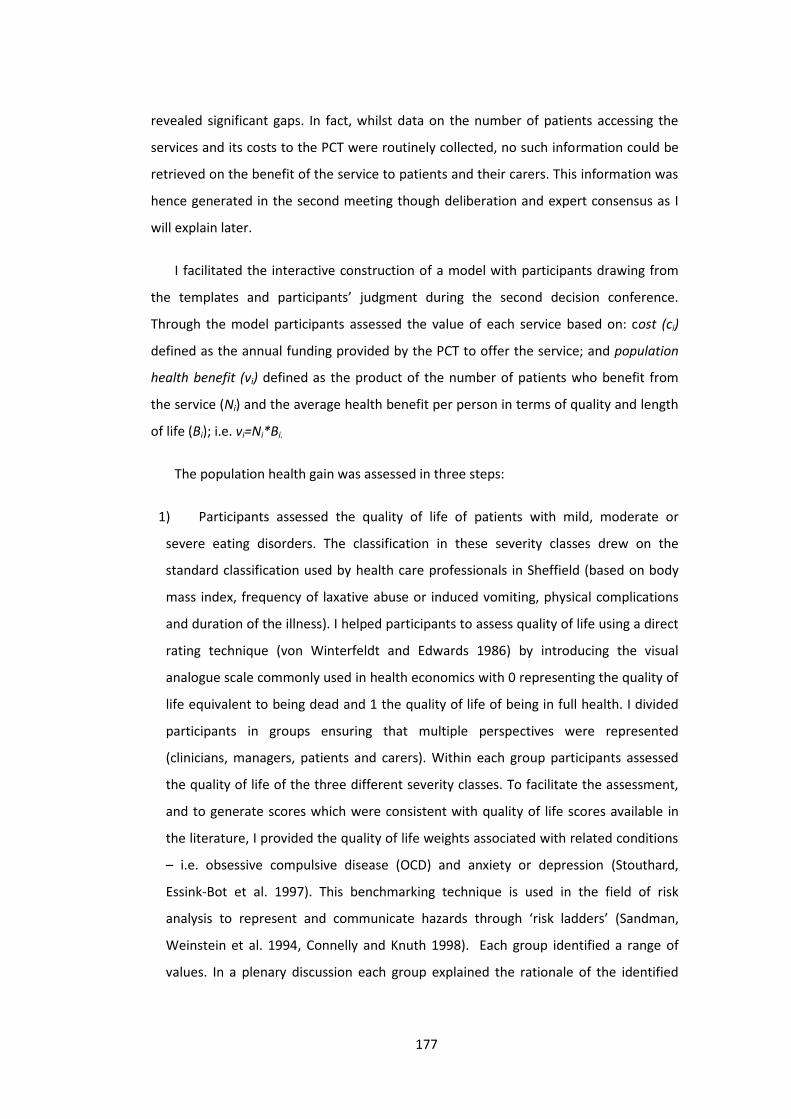
177
revealed significant gaps. In fact, whilst data on the number of patients accessing the
services and its costs to the PCT were routinely collected, no such information could be
retrieved on the benefit of the service to patients and their carers. This information was
hence generated in the second meeting though deliberation and expert consensus as I
will explain later.
I facilitated the interactive construction of a model with participants drawing from
the templates and participants’ judgment during the second decision conference.
Through the model participants assessed the value of each service based on: cost (ci)
defined as the annual funding provided by the PCT to offer the service; and population
health benefit (vi) defined as the product of the number of patients who benefit from
the service (Ni) and the average health benefit per person in terms of quality and length
of life (Bi); i.e. vi=Ni*Bi.
The population health gain was assessed in three steps:
1) Participants assessed the quality of life of patients with mild, moderate or
severe eating disorders. The classification in these severity classes drew on the
standard classification used by health care professionals in Sheffield (based on body
mass index, frequency of laxative abuse or induced vomiting, physical complications
and duration of the illness). I helped participants to assess quality of life using a direct
rating technique (von Winterfeldt and Edwards 1986) by introducing the visual
analogue scale commonly used in health economics with 0 representing the quality of
life equivalent to being dead and 1 the quality of life of being in full health. I divided
participants in groups ensuring that multiple perspectives were represented
(clinicians, managers, patients and carers). Within each group participants assessed
the quality of life of the three different severity classes. To facilitate the assessment,
and to generate scores which were consistent with quality of life scores available in
the literature, I provided the quality of life weights associated with related conditions
– i.e. obsessive compulsive disease (OCD) and anxiety or depression (Stouthard,
Essink-Bot et al. 1997). This benchmarking technique is used in the field of risk
analysis to represent and communicate hazards through ‘risk ladders’ (Sandman,
Weinstein et al. 1994, Connelly and Knuth 1998). Each group identified a range of
values. In a plenary discussion each group explained the rationale of the identified
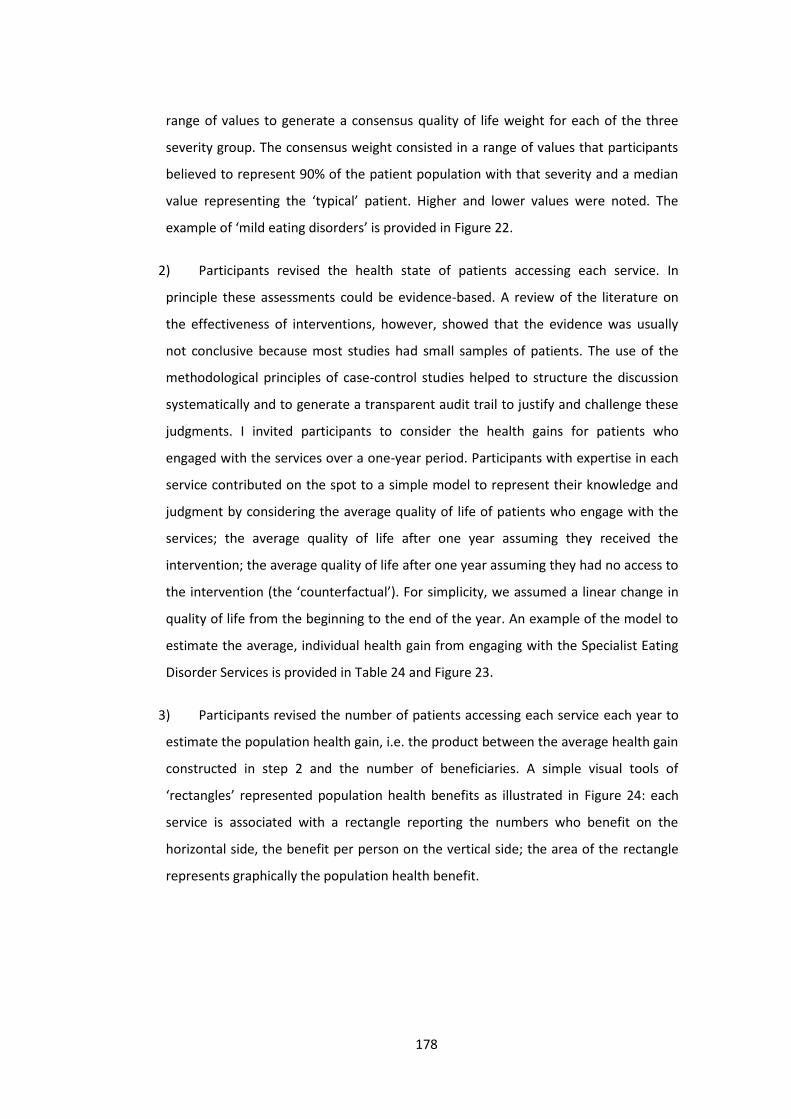
178
range of values to generate a consensus quality of life weight for each of the three
severity group. The consensus weight consisted in a range of values that participants
believed to represent 90% of the patient population with that severity and a median
value representing the ‘typical’ patient. Higher and lower values were noted. The
example of ‘mild eating disorders’ is provided in Figure 22.
2) Participants revised the health state of patients accessing each service. In
principle these assessments could be evidence-based. A review of the literature on
the effectiveness of interventions, however, showed that the evidence was usually
not conclusive because most studies had small samples of patients. The use of the
methodological principles of case-control studies helped to structure the discussion
systematically and to generate a transparent audit trail to justify and challenge these
judgments. I invited participants to consider the health gains for patients who
engaged with the services over a one-year period. Participants with expertise in each
service contributed on the spot to a simple model to represent their knowledge and
judgment by considering the average quality of life of patients who engage with the
services; the average quality of life after one year assuming they received the
intervention; the average quality of life after one year assuming they had no access to
the intervention (the ‘counterfactual’). For simplicity, we assumed a linear change in
quality of life from the beginning to the end of the year. An example of the model to
estimate the average, individual health gain from engaging with the Specialist Eating
Disorder Services is provided in Table 24 and Figure 23.
3) Participants revised the number of patients accessing each service each year to
estimate the population health gain, i.e. the product between the average health gain
constructed in step 2 and the number of beneficiaries. A simple visual tools of
‘rectangles’ represented population health benefits as illustrated in Figure 24: each
service is associated with a rectangle reporting the numbers who benefit on the
horizontal side, the benefit per person on the vertical side; the area of the rectangle
represents graphically the population health benefit.

179
Figure 22 Assessing the quality of life weight of ‘mild eating disorders’
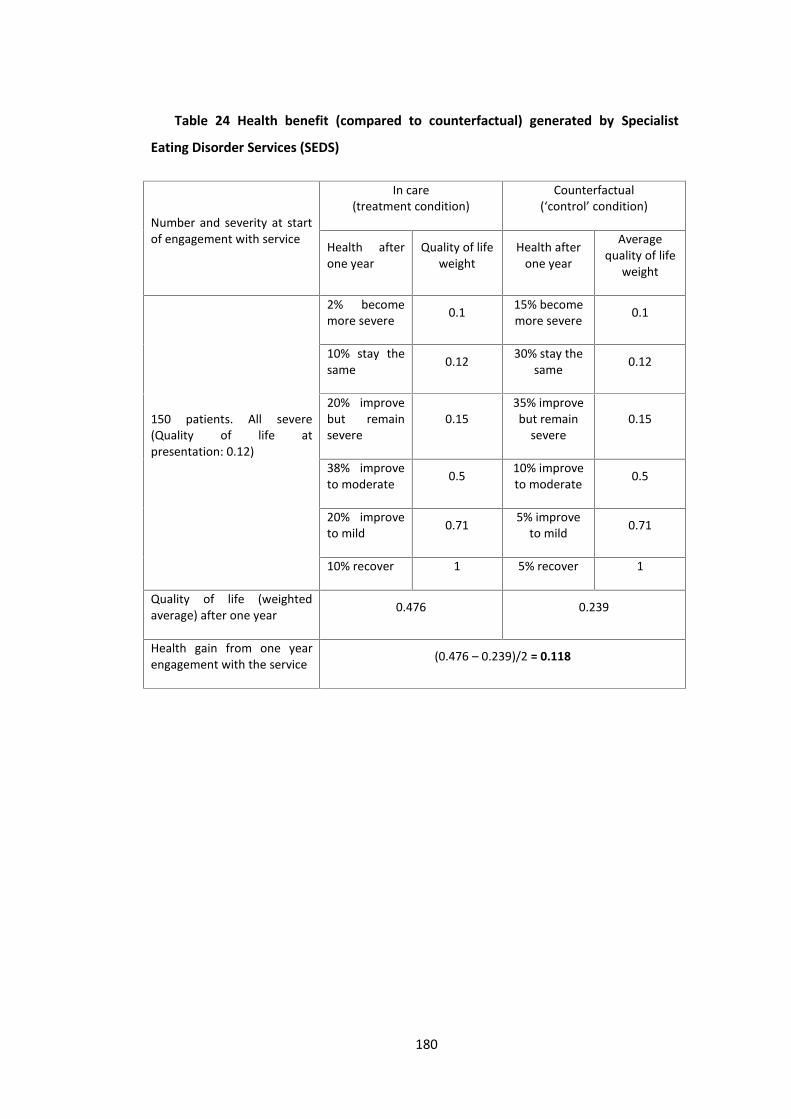
180
Table 24 Health benefit (compared to counterfactual) generated by Specialist
Eating Disorder Services (SEDS)
Number and severity at startof engagement with service
In care(treatment condition)
Counterfactual(‘control’ condition)
Health afterone year
Quality of lifeweight
Health afterone year
Averagequality of life
weight
150 patients. All severe(Quality of life atpresentation: 0.12)
2% becomemore severe 0.1 15% become
more severe 0.1
10% stay thesame 0.12 30% stay the
same 0.12
20% improvebut remainsevere
0.1535% improvebut remain
severe0.15
38% improveto moderate 0.5 10% improve
to moderate 0.5
20% improveto mild 0.71 5% improve
to mild 0.71
10% recover 1 5% recover 1
Quality of life (weightedaverage) after one year 0.476 0.239
Health gain from one yearengagement with the service (0.476 – 0.239)/2 = 0.118

181
Figure 23 Assessing health gains. The solid line represents the simplified healthprofile of the average patient engaging with Specialist Eating Disorder services for oneyear (from a quality of life of 0.12 to 0.476); the dashed line the counterfactual (from aquality of life of 0.12 to 0.239); the shaded area is the health gain, i.e. (0.476-0.239)/2
= 0.118.
Figure 24 Assessed population health benefit represented by the area of the
‘rectangles’ (i.e. numbers who benefit times benefit per person).
Population Health benefit
Specialist Residential unit outof area or private
Private day service inSheffield
SEDS
Emergency medicaladmission (SHT)
Community mental healthteam involvement
University eating disorderprimary care clinics
Voluntarysector
involvement
0
20
40
60
80
100
120
0 20 40 60 80 100 120 140 160
Numbers who benefit
Ben
efit
per p
erso
n
Specialist Residential unit out of area or private Private day service in SheffieldSheffield Eating Disorder Service Emergency medical admission (Sheffield acute trust)Community mental health team involvement University eating disorder primary care clinicsVoluntary sector involvement
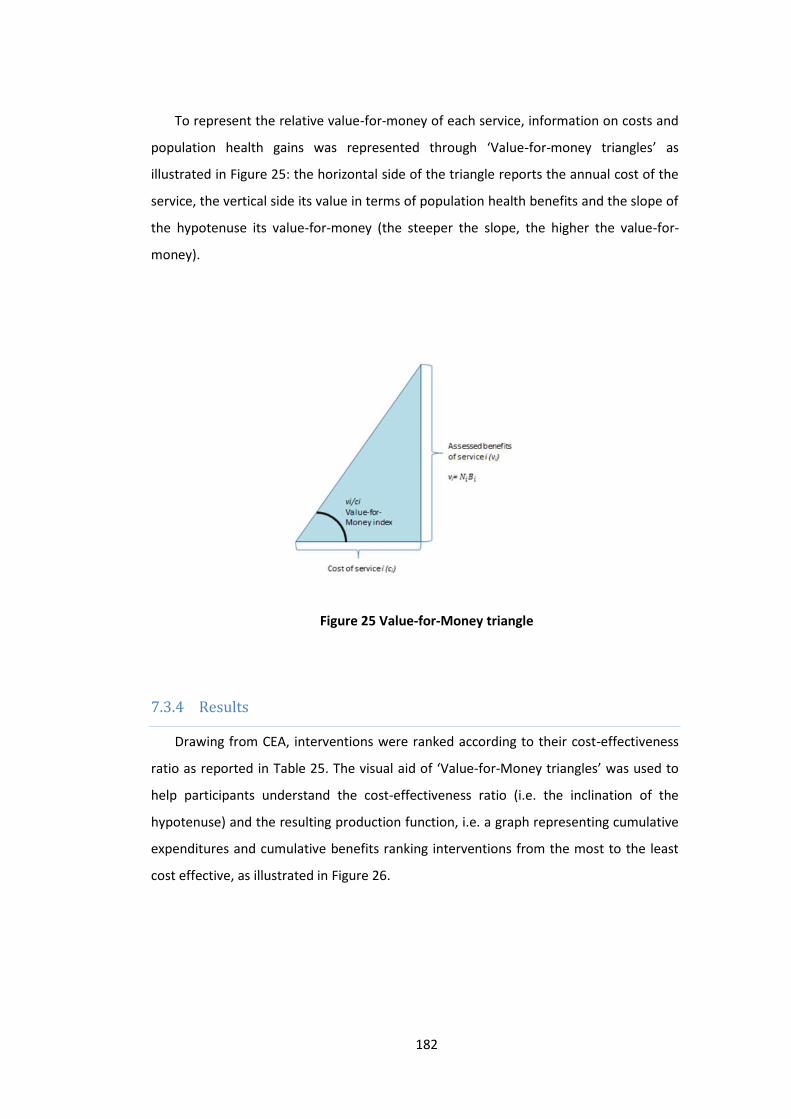
182
To represent the relative value-for-money of each service, information on costs and
population health gains was represented through ‘Value-for-money triangles’ as
illustrated in Figure 25: the horizontal side of the triangle reports the annual cost of the
service, the vertical side its value in terms of population health benefits and the slope of
the hypotenuse its value-for-money (the steeper the slope, the higher the value-for-
money).
Figure 25 Value-for-Money triangle
7.3.4 ResultsDrawing from CEA, interventions were ranked according to their cost-effectiveness
ratio as reported in Table 25. The visual aid of ‘Value-for-Money triangles’ was used to
help participants understand the cost-effectiveness ratio (i.e. the inclination of the
hypotenuse) and the resulting production function, i.e. a graph representing cumulative
expenditures and cumulative benefits ranking interventions from the most to the least
cost effective, as illustrated in Figure 26.

183
Table 25 Interventions ranked by cost-effectiveness or ‘Value-for-Money’
Interventioni
Cost toPCT in£000[ci]
Benefits[vi] Cumulative
costCumulative
benefit
Value-for-Moneyratio (unit of
benefit per poundspent)[vi/ci]
University eatingdisorder primary careclinics
12 7.91 12 7.91 0.659
Voluntary sectorinvolvement 30 11.22 42 19.14 0.374
Sheffield EatingDisorder Service 214 21.74 256 40.87 0.102
Private day service inSheffield 48 1.5 304 42.38 0.031
Emergency medicaladmission (Sheffieldacute trust)
64 0.85 368 43.22 0.013
Specialist hospital orResidential unit out ofarea or private
971 7.44 1,339 50.66 0.008
Admission to acutepsych wards 46 0.04 1,385 50.7 0.001

184
Figure 26 Production function: health benefits to the population with eating
disorders at different level of expenditure. The seven ‘triangles’ correspond to the
seven assessed services in order of their value-for-money, i.e. (starting from the origin
of the graph) 1) University eating disorder primary care clinics; 2) voluntary sector; 3)
Sheffield Eating Disorder Services (SEDS); 4) private day-services; 5) emergency
medical admissions; 6) inpatient admission to specialist hospital; 7) admission to acute
psychiatric wards
Figure 26 shows that three interventions are relatively high value for money (i.e. the
clinic offered by nurses on the University campus, the services provided by the voluntary
sector and SEDS). These services cost about three hundred thousand pounds in
aggregate, i.e. about 20% of the budget spent by the PCT on eating disorders, but
produced about 80% of the estimated population health benefits. The other four
services offered much lower value-for-money. In particular the graph showed clearly
that inpatient admissions were absorbing a very large proportion of the budget and did
not generate much value.
0
10
20
30
40
50
60
£0 £200 £400 £600 £800 £1,000 £1,200 £1,400 £1,600
cumulative spend (in £000)
cum
ulat
ive
bene
fits
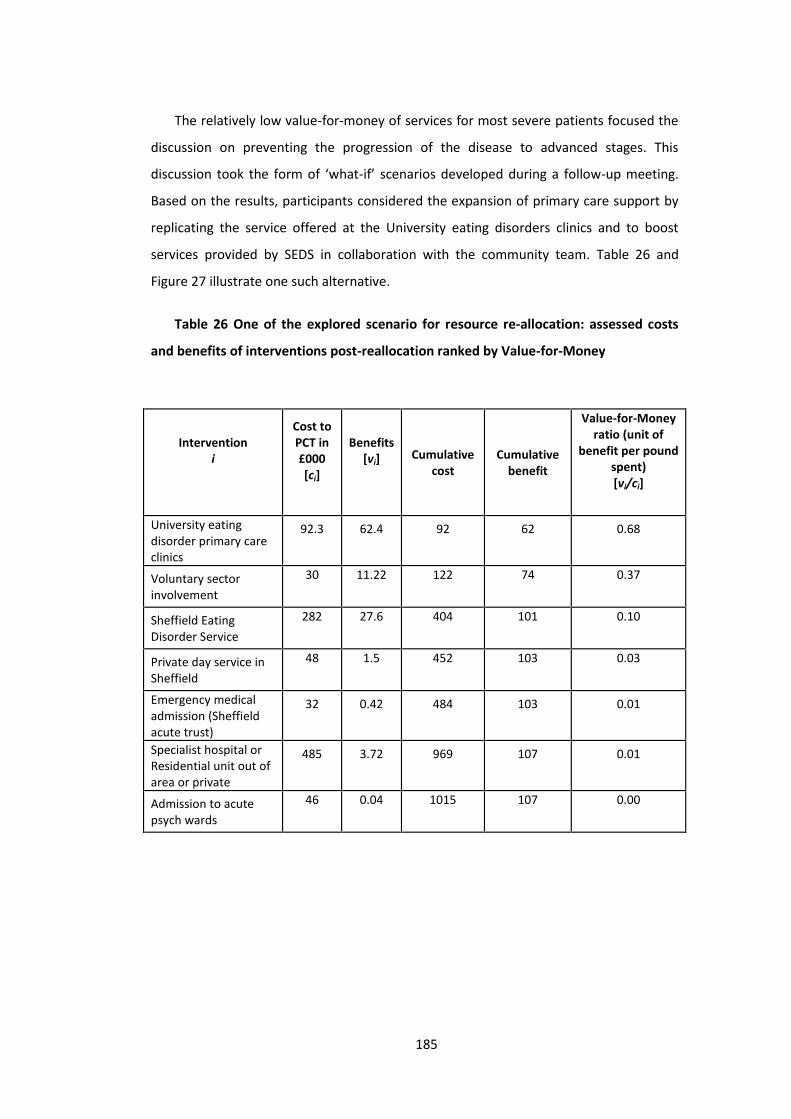
185
The relatively low value-for-money of services for most severe patients focused the
discussion on preventing the progression of the disease to advanced stages. This
discussion took the form of ‘what-if’ scenarios developed during a follow-up meeting.
Based on the results, participants considered the expansion of primary care support by
replicating the service offered at the University eating disorders clinics and to boost
services provided by SEDS in collaboration with the community team. Table 26 and
Figure 27 illustrate one such alternative.
Table 26 One of the explored scenario for resource re-allocation: assessed costs
and benefits of interventions post-reallocation ranked by Value-for-Money
Interventioni
Cost toPCT in£000[ci]
Benefits[vi] Cumulative
costCumulative
benefit
Value-for-Moneyratio (unit of
benefit per poundspent)[vi/ci]
University eatingdisorder primary careclinics
92.3 62.4 92 62 0.68
Voluntary sectorinvolvement
30 11.22 122 74 0.37
Sheffield EatingDisorder Service
282 27.6 404 101 0.10
Private day service inSheffield
48 1.5 452 103 0.03
Emergency medicaladmission (Sheffieldacute trust)
32 0.42 484 103 0.01
Specialist hospital orResidential unit out ofarea or private
485 3.72 969 107 0.01
Admission to acutepsych wards
46 0.04 1015 107 0.00
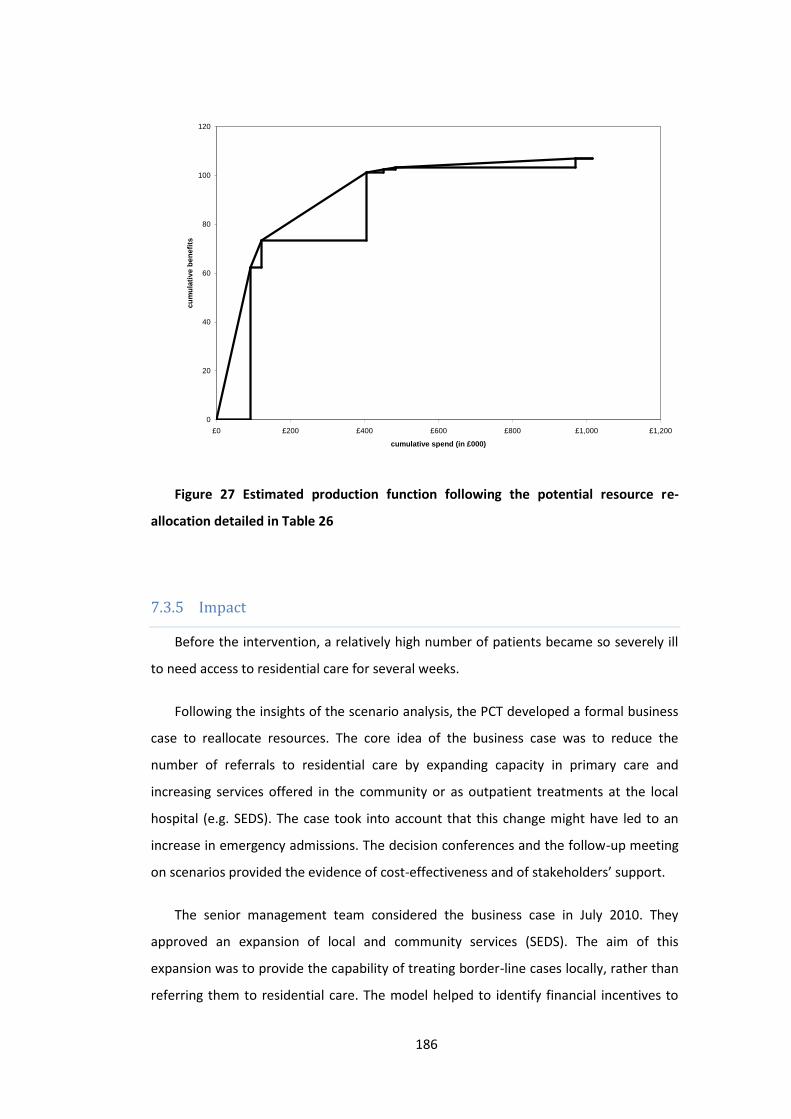
186
Figure 27 Estimated production function following the potential resource re-
allocation detailed in Table 26
7.3.5 ImpactBefore the intervention, a relatively high number of patients became so severely ill
to need access to residential care for several weeks.
Following the insights of the scenario analysis, the PCT developed a formal business
case to reallocate resources. The core idea of the business case was to reduce the
number of referrals to residential care by expanding capacity in primary care and
increasing services offered in the community or as outpatient treatments at the local
hospital (e.g. SEDS). The case took into account that this change might have led to an
increase in emergency admissions. The decision conferences and the follow-up meeting
on scenarios provided the evidence of cost-effectiveness and of stakeholders’ support.
The senior management team considered the business case in July 2010. They
approved an expansion of local and community services (SEDS). The aim of this
expansion was to provide the capability of treating border-line cases locally, rather than
referring them to residential care. The model helped to identify financial incentives to
0
20
40
60
80
100
120
£0 £200 £400 £600 £800 £1,000 £1,200
cumulative spend (in £000)
cum
ulat
ive
bene
fits
187
prevent supplier-induced demand, i.e. that less severe patients would have been
referred as a result of available beds. Managers and clinicians from SEDS estimated the
potential ‘savings’ from expanding their unit’s capacity to treat borderline cases locally.
To ensure they revealed their best clinical judgment, however, they had to contribute to
the cost of private tertiary care services above their prediction. They estimated a 50%
reduction in the cost of these referrals.
The financial net effect of this change was a reduction of spend for the eating
disorder programme by more than 15%. At two-year follow-up, the new care pathway
has been implemented and the savings realised.
7.4 DiscussionThe case study described in this paper is a successful example of disinvestments in
health care, as resources were partially withdrew from residential care services. The
case study is relatively small in scale by focusing on a narrow patient population and by
achieving a relatively small disinvestment compared to the overall PCT budget of about
£1bn. Its small size, however, allowed a close observation and a detailed discussion of
the process with participants in order to draw insights on the role of the analysis and of
the process to support disinvestment decisions as argued in the following sections.7.4.1 ‘Live’ model building with stakeholders increases buy-in ofrecommendationsThe first decision conference opened in a tense atmosphere of mistrust. Participants
were aware of the recurrent overspend of the PCT budget and expected hard decisions,
namely cuts, if they could not articulate the value and cost-effectiveness of particular
services. The mistrust and resistance to change was vocalized earlier on in the meeting,
after one participant articulated that she felt “to be in front of a judge, with everybody
here to defend their own corner, to prove the value of the hard work they do”. At the
end of the first decision conference, however, the atmosphere was radically different
and evidenced by participants’ willingness and actual effort in the ensuing weeks to
collect and to share both data and expert knowledge to build the analytical model and
to inform the process.
188
What did account for this shift in attitude? Participants overtly reported at the end
of the workshop that they could appreciate two attractive features of the approach.
First, the process is participative in assessing the relative value-for-money of local,
current services on the whole pathway of care. Participants noted that, although they
knew of each other and regularly interacted between them, the decision conference was
the first occasion in which they all met. In particular, participants praised the framing of
the problem in terms of informing an overall strategy ‘to benefit the patients they
served’ rather than engaging in hard negotiations between service providers and service
purchaser. Within this frame, participants volunteered private information. The shift
from a defensive to a participative attitude is crucial to enable education and
communication about the logic of change and, as a result, to reduce resistance to
change (Kotter and Schlesinger 1979). The change in attitude is consistent with that
generally observed by practitioners of Decision Conferencing, who claim it enables a
shared understanding of the problem, a sense of common purpose and a commitment
to the way forward (Phillips 2007).
Second, the ‘live’ development of a model also helped participants to understand
the principles of cost effectiveness analysis, which are usually difficult to grasp for
people without a health economic training and hence not used systematically to inform
policy (Bryan, Williams et al. 2007, Eddama and Coast 2008). Participants could hence
contribute data, expert and value judgments, and could use the framework to articulate
alternative resource allocation scenarios. One GP who participated in the events noted
that “[the facilitators] explained [the approach] very well. Even if you’d been there
without knowing the background, it was all talked through. […] There was a good
opportunity for people to be heard and the process wasn’t too cumbersome” (The
Health Foundation 2012). The independent evaluator also noted that “people from a
wide range of backgrounds who would not normally have contact with such approaches
seemed to understand it”. A senior manager, who oversaw the process as members of
the Steering group but did not participate in the event, was particularly surprised that
participants could come to a shared view on benefit assessment despite their different
backgrounds.
189
Model ownership (through stakeholder engagement) is considered a key factor in
generating buy-in for difficult decisions, as discussed in the environmental risk literature
(Renn 1999).
7.4.2 Shifting negotiating powers by assessing all services simultaneouslyThe simultaneous engagement of representatives of services along the pathway of
care also changed the negotiating powers radically. In theory the PCT should negotiate
with several providers for each service which, competing in order to secure a contract,
have an incentive to increase quality and reduce costs. In practice, however, in the case
study there were only one or two providers for each service who, at least in the short
term, faced no competition. Through one-to-one negotiations between the PCT and
each individual provider, the PCT could not control costs easily. This was particularly
difficult for tertiary specialist hospitals because admissions to these services were
agreed for named individuals, case by case on the basis of medical need. Once a patient
was so severely ill to require these services, the PCT paid for them. By considering the
whole pathway of care simultaneously, providers of services who could prevent disease
progression or could manage severe (yet not extremely severe) cases could argue a case
for additional resources by showing the potential savings and the PCT could held them
to account for these estimates through risk sharing.
The change in negotiating power described above is similar to that reported by
Treasury officials in the UK as a result of the creation of the Public Expenditure Survey
Committee (PESC) in the 1960s to control public expenditures (Clarke 1978). The
Committee provided projections of public expenditure by each department assuming
current policies would continue. Before PESC, Treasury officials negotiated the budget
with each Government department, one at a time and felt to be ‘nibbled to death’
(Heclo and Wildavsky 1981, p 207). After PESC, requests for additional funding needed
to be traded-off against other claims for the same resources and, by the end of the
1960s, the Treasury had regained control on public expenditures (Clarke 1973).

190
Two senior managers of mental health commissioning noted that, outside the
decision conferencing environment, participants often returned to their usual
negotiating strategies rather than focusing on the entire pathway to benefit patients.
A key element which during the decision conferences prevented the discussion to
gravitate around partisan interests was the mere presence of patients. The
commissioning manager of mental health services commented that “Just to have service
users involved – any at all – was an enourmus plus. They did provide insights we might
not have had otherwise. They were good at feeding in information such as what it’s like
to spend two or three weeks on an acute medical ward as an eating disorder patient. […]
It’s a brilliant way of getting interested parties to sit down and try to overcome their
particular interest in order to develop a rational approach” (The Health Foundation
2012; p17). Dr Harvey, a GP who attended the decision conferences, said “I have
experience of dysfunctional commissioning in other areas, where someone external
seems to make the decisions and no-one can influence them. But this was a good
opportunity for people providing services at all levels to be heard’ (The Health
Foundation 2012; p18).
7.4.3 Role of the “CEA” to generate a credible rationale for difficult decisionsFourteen months after the process, the commissioning manager reported that the
analytical model had been fundamental to create a business case for change. He
believed that the resources consumed by tertiary services were not delivering as good
value-for-money as other services even before the Decision Conferencing process, but in
the past he had been unable to make a compelling case for shifting resources.
The model developed in the case study draws from QALYs and CEA principles. The
use of quality of life weights (Figure 2) and their combination with time (Figure 3) draws
from the QALY literature. The estimate of the incremental health gain from an
intervention (compared to the status quo, as described in Figure 3 and Table 1) and the
focus on the ratio of incremental costs and benefits (i.e. the slope of the hypotenuse of
the value-for-money triangles) draw from CEA principles.

191
The use of QALYs and CEA principles helped to overcome resistance to change, even
in the absence of rigorous information on the effectiveness of treatments, because of
the deliberative nature of the process. The principles from QALYs and CEA provided a
framework for organizing information, preferences and beliefs of participants, and a
compelling logic to embed them in resource allocation. Once these principles were
established, the use of local agents’ expert judgment and of extensive sensitivity
analyses to overcome gaps in evidence on effectiveness became acceptable.
The analysis, however, was substantially different from rigorous CEA (Gold, Siegel et
al. 1996). “Value-for-money” has not been defined at the margin but at a very high level
of analysis, i.e. that of a service offering a variety of interventions. It was hence not
possible to derive prescriptive policy recommendation about disinvestments by
withdrawing funding from specific interventions of low cost-effectiveness. These
departures from CEA made it feasible to consider the entire pathway of care within the
available time. Considering the pathway of care is particularly important in a
disinvestment scenario to ensure that funded services can sustainably meet the health
care need in the population. Indeed, attempts to disinvest from named procedures
without considering the impact on the pathway of care have usually not been successful
(Kemp, Fordham et al. 2008). This comprehensive exercise helped to avoid the
stakeholder entrenchment typically associated with listing a set of candidate procedures
for disinvestments.
Furthermore, the provision of information on the scale of benefits and costs, which
is not usually provided by published CEA studies, proved fundamental to focus
participants’ attention in generating ideas on improving services with fewer resources
and to focus managerial attention to lead implementation. For instance, although the
analysis indicated that ‘admissions to acute psychiatric wards’ had the lowest value-for-
money, disinvesting from this intervention would not release any significant resource.
Representing the scale of costs and benefits from each service helped participants to
talk about ‘the elephant in the room’, i.e. that about 70% of the resources were spent
on inpatient admissions to specialist hospital but they did not have a significant impact
on population health (they were highly beneficial, but only for a very small number of
patients as indicated by the rectangle of population health in Figure 4). Participants did
not need the analysis to learn about this problem. The analysis, however, helped them
192
to see the opportunity cost of admitting patients in specialist hospital and to focus their
efforts in generating ways to manage borderline cases in the community.
In summary, CEA provided a framework to structure the collection of local
information, to overcome the lack of information on effectiveness by helping
participants in articulating local knowledge, preferences and beliefs into a QALYs-like
measure, and to define ‘value-for-money’ as the ratio of effectiveness and costs. It was
hence a tool to support the organisation to make sense of its current situation and to
use this understanding to prompt improvements (Weick 1995).
7.5 ConclusionIn this paper I describe the results of a piece of action research on re-designing a
pathway of care for eating disorders in Sheffield (UK) at a time of financial pressure. This
work turned out to be relatively successful in supporting a more cost-effective use of
resources, to reduce total expenditure and to overcome resistance to change.
The following key features of the approach appear to be crucial to generate
cooperation among healthcare stakeholders and to generate ideas for more effective
healthcare delivery in the current economic climate: (i) the collective character of the
deliberations, which generated ownership in the model and its results; (ii) the analysis of
the whole pathway, rather than a particular treatment in isolation as in standard CEA,
which helped participants to identify the opportunity cost of alternative budget
allocations; (iii) the presence of patients, which reinforced the need to frame the
problem in terms of ‘benefit to the patients we aim to serve’ rather than that of partisan
economic interests; (iv) the development of a model based on a clear theoretical
framework (i.e. CEA), which provided a credible rationale for difficult decisions.
In musing about whether the approach might work equally well for other efforts to
make health services more cost effective, I identify three conditions that contributed to
the success of the case study. First, the acceptability of the principles of CEA and of
QALYs to assess the value-for-money of healthcare. The exercise presented in this paper
was conducted in England, where these analytical frameworks are to a great extent
legitimised by the work of NICE. There was hence little if no resistance to the idea of

193
developing a CEA-like model and in defining value-for-money as the ratio between
health gains and costs. Second, the interventions or services being assessed should
target a relatively homogeneous population. In this case study, it was hence possible for
participants to agree on a stylized description of the ‘typical’ patient and the impact of a
service on his or her health state. This would be probably too demanding for
heterogeneous patient populations (e.g. orthopaedic or paediatric patients). Finally, the
approach benefited from the leadership of the local commissioning manager, who
succeeded in engaging local stakeholder to attend meetings, share some private
information and provide expert judgments to overcome data gaps.

194
8 Critical discussion and conclusion
This dissertation consists of a review of the literature and five independent essays
on healthcare priority setting, focusing on the value of formal analysis to support local
healthcare planners in allocating a fixed budget. I argued that the available tools are
inadequate; and I designed and tested an alternative.
This chapter is organised as follows. In the first section, I state the original
contribution of my dissertation and support such statement with a critical discussion. In
this chapter I provide a synthesis of the conclusions I have reached from my research,
taken as a whole, rather than repeating the distinctive contributions of each individual
chapter. In the second section I highlight the limitations of my work. In the third section
I reflect on the direction of the field and position my research.
8.1 Critical discussionThis dissertation makes both an intellectual contribution to the field of healthcare
priority setting and a practical contribution to the field of healthcare resource allocation.
The intellectual contribution is a synthesis of both economics and decision analysis that
is designed to remedy problems with each. The review of the literature showed that
tools grounded in health economics are difficult to apply at national level because of
accessibility issues and because of the need for a threshold. They also fail to contribute
to local healthcare priority setting decisions. At the same time, tools grounded in (multi-
criteria) decision analysis fail to incorporate the methodological advances of health
economics. My thesis contributed to closing this gap. The practical contribution is that I
195
designed, and tested the value of, a process and of particular value functions that can be
used by local healthcare planners within their limited resources.
In Chapter 2 I identified two sets of prescriptive approaches to support healthcare
priority setting. On one hand I identified CBA, CEA and GCEA, which purport to
operationalise the normative principles of welfare economics. On the other hand, I
identified PBMA, which is an example of prescriptive approaches to engage key
stakeholders in identifying the resource allocation problem and in assessing the trade-
offs of alternative allocations against multiple criteria. PBMA draws on the normative
principles of (multi-criteria) decision analysis.
Among the first set of approaches, health economists propose CEA as mainstream. A
major reason to prefer CEA to CBA is that it does not require the monetisation of health
benefits. GCEA is an extension of CEA proposed by a group of health economists and
epidemiologists close to the World Health Organisation. Most of the criticisms to CEA
also apply to GCEA. In the following paragraph I will hence focus on discussing the
contribution with respect to CEA and PBMA only.
As I discussed, CEA is theoretically well grounded in welfare economics, but it this
theory cannot be applied because of three main issues. First, the theory of CEA poses
excessive information demands as it requires the broadest possible search procedure
for alternative options and the evaluation of each. To overcome this limitation, health
economists suggest the use of a threshold for cost-effectiveness. There is no agreement,
however, on the appropriate level of this threshold. In fact, the need for a threshold
raises the same issue CEA is intended to avoid, i.e. the monetisation of health gains.
Second, CEA is difficult to understand for non health economists as it requires the ability
to interpret and assess results from complex simulation models, as well as a critical
understanding of the welfare economic principles embedded in health-related social
welfare functions. It is hence inaccessible, i.e. difficult for those responsible for making
recommendations to appreciate and interpret the results of CEA reports. Third, CEA
usually requires good evidence on the effectiveness of interventions, e.g. RCTs. In the
absence of RCTs, CEA are either not conducted or, if conducted, are considered less
robust (Kelly, Morgan et al. 2010).
196
A different set of difficulties confronts local healthcare planners, who need to
allocate a limited budget every year. Local healthcare planners do not have the
economic resources to commission or even to interpret CEA reports. They also have to
make resource allocation decisions in the absence of evidence of ‘good quality’.
PBMA has been proposed as an alternative, pragmatic approach to support (local)
healthcare planners. Indeed, PBMA takes into account the limited skills and resources
available locally. As I discussed in Chapter 2, however, PBMA applications usually do not
embed MCDA principles systematically. In particular, many applications do not employ
the conceptual framework of resource allocation, but include cost and/or cost-
effectiveness as criteria in a multi-attribute value function. The value functions are
usually of additive form, often summing benefits to individual patients (e.g. intervention
effectiveness for the average patient) to benefits at the population level (e.g. size of
population affected), which is a practice that bears no relationship to health economic
principles, or common sense. With the exception of one paper (Peacock, Richardson et
al. 2007), there is no discussion to justify a particular form for the value function.
In my research, I have drawn from the strengths of both health economics and
(multi-criteria) decision analysis to propose “Deliberative CEA”. Deliberative CEA is a
particular application of decision conferencing to the specific context of healthcare
priority setting at the local level. As such, it can be characterized by its technical and
social dimensions, and their interaction by means of a ‘requisite model’.
In section 8.1.1 below, I discuss the normative validity of Deliberative CEA by
reflecting on the different value functions I used in my research. In section 8.1.2 I discuss
the prescriptive validity of the approach I developed by looking at the social process.8.1.1 The ‘technical’ dimension: the value functionThe ‘technical’ dimension of Deliberative CEA is embedded in framing the problem
as a constrained optimisation (i.e. maximising a value function, subject to a budget
constraint) and in the particular shape of the value function.
In my research journey I experimented with different forms for the value function:
an additive form with four criteria akin to those used in PBMA (Chapter 5); a part
additive, part multiplicative value function to trade-off population health and health
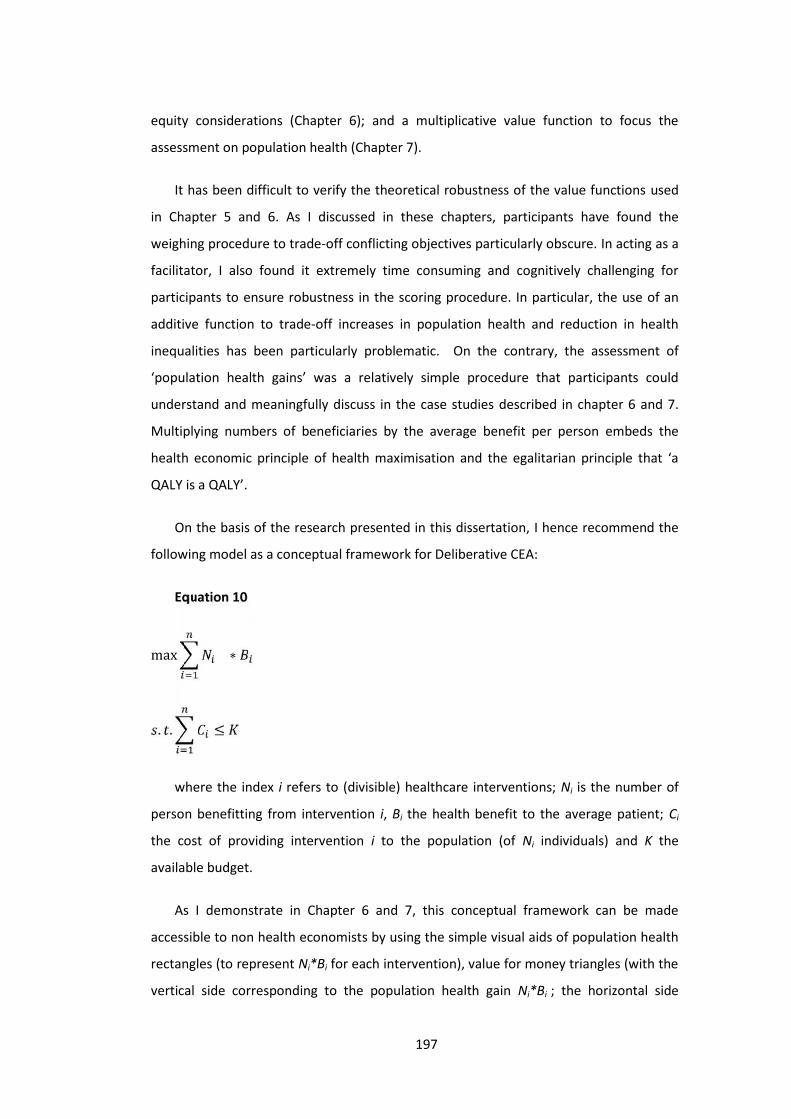
197
equity considerations (Chapter 6); and a multiplicative value function to focus the
assessment on population health (Chapter 7).
It has been difficult to verify the theoretical robustness of the value functions used
in Chapter 5 and 6. As I discussed in these chapters, participants have found the
weighing procedure to trade-off conflicting objectives particularly obscure. In acting as a
facilitator, I also found it extremely time consuming and cognitively challenging for
participants to ensure robustness in the scoring procedure. In particular, the use of an
additive function to trade-off increases in population health and reduction in health
inequalities has been particularly problematic. On the contrary, the assessment of
‘population health gains’ was a relatively simple procedure that participants could
understand and meaningfully discuss in the case studies described in chapter 6 and 7.
Multiplying numbers of beneficiaries by the average benefit per person embeds the
health economic principle of health maximisation and the egalitarian principle that ‘a
QALY is a QALY’.
On the basis of the research presented in this dissertation, I hence recommend the
following model as a conceptual framework for Deliberative CEA:
Equation 10
max ∗. . ≤
where the index i refers to (divisible) healthcare interventions; Ni is the number of
person benefitting from intervention i, Bi the health benefit to the average patient; Ci
the cost of providing intervention i to the population (of Ni individuals) and K the
available budget.
As I demonstrate in Chapter 6 and 7, this conceptual framework can be made
accessible to non health economists by using the simple visual aids of population health
rectangles (to represent Ni*Bi for each intervention), value for money triangles (with the
vertical side corresponding to the population health gain Ni*Bi ; the horizontal side
198
corresponding to the cost Ci; and the slope of the hypotenuse representing cost-
effectiveness or value-for-money) and the efficient frontier to explain the rationale for
ranking interventions according to value-for-money.
The greatest limitation of Equation 10 is the exclusion of other criteria that are
considered relevant by healthcare planners, for instance those reported in the PBMA
literature (see Table 1 on page 43). In some cases additional criteria might be redundant.
For instance, one may argue that ‘local and national priorities’ are set in order to
improve population health and it hence redundant to include it as a separate criterion.
In other cases, some of the criteria used in PBMA are embedded in the framework of
Equation 10. For instance, the benefit to the individual patient (Bi) captures ‘quality of
life’ and ‘effectiveness’ (which, for instance, are two separate criteria in an additive
function in Wilson, Rees et al. 2006) or ‘improvement of efficacy/effectiveness’,
‘improvement in safety’ and ‘improvement in patient reported outcomes’ (Tony,
Wagner et al. 2011). In the case of equity, however, the proposed framework for
deliberative CEA needs to be developed further. The analyses presented in this thesis, in
particular in Chapters 5 and 6, suggests that an additive relationship between a
population health criterion and a health equity criterion is unsatisfactory. It is in fact
difficult to imagine interventions that can produce value by reducing health inequalities
without producing any health benefit. Let us imagine for instance the option of
introducing homeopathic treatments and to target them especially to the most deprived
in the population. If the intervention is not producing any health benefit, the fact that it
is targeted to the most deprived in society is irrelevant. Yet an additive value function
would attach some value to this intervention. The identification of a theoretically sound
way to include health inequality criteria is the subject of further research (Morton and
Airoldi 2010).
My recommended form for the value function is derived from health economics and
is a departure from much of the decision analytic tradition, and in particular from socio-
technical approaches such as decision conferencing and PBMA. This means that there is
a loss in flexibility, as this value function requires facilitators of deliberative CEA
workshops to have a good understanding of normative health economic principles and
that participants cannot simply include in the model all the criteria they consider
important. But this has the massive benefit of preventing misleading recommendations.

199
For instance, in Chapter 3 I considered the practice of using local life tables to estimate
the ‘avoidable DALYs’ in GCEA. This practice, which may make sense in the
measurement of the current BoD would lead to troubling policy recommendations (i.e.
to favour death over extending life for elderly patients with poor quality of life). Chapter
3 identifies the problem and proposes a solution by scrutinizing the theoretical
robustness of the value function. I believe these exercises are necessary to improve our
understanding and practice of priority setting in healthcare.8.1.2 The social dimension: stakeholder engagement, power and trustThe social dimension of Deliberative CEA consists in the engagement of key
stakeholders, such as clinicians, patients, carers, managers and public representatives;
and in the impact of the approach on their interaction, in particular on power and trust
as I discussed in Chapter 7.
The engagement of key stakeholders serves three main purposes (National Research
Council of the National Academies 2008). First, some stakeholders are the intended
beneficiaries of the decision (e.g. patients, carers, public representatives) and hence
have the legitimacy to inform how such decisions are made. In some countries this
legitimacy is formally recognised and patients, carers and public representatives have
the right to be involved in the decision making process (e.g. in the "NHS Constitution" in
England, Department of Health 2010). The importance of involving patients in
healthcare decisions has been emphasised by the work on shared decision making (see
the seminal work of Charles, Gafni et al. 1997). In my experience of working with the
English NHS, the presence of patients has also been fundamental to keep providers
focused on discussing benefits of alternative interventions rather than defending
partisan’s interests.
Second, much of the information necessary to evaluate alternative options is not
available in routinely collected data or published reports. There may be experts,
however, who could overcome gaps in information by sharing their professional
knowledge (e.g. clinicians, managers, expert patients). The second purpose of the
stakeholder engagement is hence to gather expertise to overcome information gaps.
Finally, the stakeholder engagement ensures the approach is participative and that it
200
can hence generate ownership of the problem, it simplifies the process of explaining the
rationale of a decision and it reduces resistance to change.
The value of the social engagement was emphasised in follow-up interviews both in
Sheffield and the Isle of Wight. The commissioning manager of mental health services in
the Sheffield case study commented that ‘Just to have service users involved – any at all
– was an enormous plus. They did provide insights we might not have had otherwise.
They were good at feeding in information such as what it’s like to spend two or three
weeks on an acute medical ward as an eating disorder patient. […] It’s a brilliant way of
getting interested parties to sit down and try to overcome their particular interest in
order to develop a rational approach’ (The Health Foundation 2012; p17).Dr Harvey, a
GP in Sheffield who attended the decision conferences, said “It was new territory to
have everyone sitting down around a table, talking […]. I have experience of
dysfunctional commissioning in other areas, where someone external seems to make
the decisions and no-one can influence them. But this was a good opportunity for
people providing services at all levels to be heard’(The Health Foundation 2012; p 17
and 18). These comments were also reported for the Isle of Wight case study by the
director of public health: “It’s hard work and people put real effort into it, but one of
the big selling points is that it wasn’t difficult getting people for a second year. They
value their contribtion- getting their voice heard and really engaging in the process. […]
The real benefit [of the approach] is engagement in the process” (The Health Foundation
2010; p17).
.
As I discuss in Chapter 7 in particular, Deliberative CEA has also the potential of
building trust and to overcome resistance to change. This was evidenced in follow-up
interviews. The director of public health in Sheffield said that “The findings were easily
accepted. The clinicians were comfortable with them. The socio-technical approach had
made sure they were on board. Its unique benefit was combining that with the scientific
and economic rigour necessary to demonstrate the change in spend was going to be
effective” (The Health Foundation 2012; p18).
The independent evaluator also noted that “the presence of external stakeholders
acted as a brake, along with independent facilitation, on defensiveness or falling back on
201
negotiating positions. The process as a whole did seem a useful vehicle for collaboration
and engagement, and experience in follow up events suggests that the change of
dynamic was a factor in promoting openness” (Collier, 2010).
Current prescriptive approaches involve stakeholders with similar aims. Contrary to
stakeholder engagement in CEA, however, Deliberative CEA and PBMA focus the
analysis on allocating a fixed budget rather than on estimating a precise ratio of costs to
benefits. Stakeholders invited to participate in PBMA and in Deliberative CEA consider
explicitly the opportunity cost of alternative courses of action. The ethical implications
of the recommendations (i.e. possibly tragic consequences) can be hence discussed
explicitly. Furthermore, in Deliberative CEA and PBMA, because the models are more
accessible, stakeholders are deeply involved in building and validating the model. They
are hence more likely to own the model and its recommendations.8.1.3 Requisite modelsOne of the main criticisms to CEA/GCEA is that they rely on sophisticated simulation
models to generate estimates of costs and benefits from alternative interventions.
These models are expensive to produce and to interpret. They are appropriate for
organisations such as the NICE, who has access to the necessary skills and resources.
They are however not an option for local healthcare planners.
In this thesis I took the view that models are tools for thinking (Pidd 2003). In this
view, the output of a model primarily resides in the discussion it enables, rather than the
particular numerical results it produces. As Box and Draper effectively put it “Essentially,
all models are wrong, but some are useful” (Box and Draper 1986, p424). The concept of
‘requisite model’ proposed by Phillips (1984) provides a framework for assessing the
appropriate upper-limit in the complexity of a model, i.e. “a model whose form and
content are sufficient to solve a particular problem” (p29).
In this thesis I use the concept of requisite model both for epidemiological modelling
and for option evaluation models or priority setting. The model developed in Chapter 4,
to illustrate the short and long term consequences of glucose control in type 1 diabetes,
is an example of requisite epidemiological model. The structure of that model was much
simpler than existing epidemiological models as it did not capture, for instance, the

202
interaction across multiple complications associated with diabetes. The extensive
sensitivity analysis and validation with existing models showed that the model was
‘requisite’ to assess the scale of population health benefits, although it could not be as
precise as state-of-the art simulation models.
In Chapters 5, 6 and 7 I use the concept of requisite priority setting models. In these
chapters I did not develop epidemiological models for each intervention in order to
assess their costs and benefits. Although these models would add value, local healthcare
planners do not have the capacity to develop them. Many models are available in
published reports, but they may not have been designed to tackle the issue of
estimating costs or health gains from the particular interventions the planners wish to
assess. In priority setting, the fundamental issue is assessing the forgone benefits of
allocating resources to a particular portfolio of interventions compared to its best
alternative (i.e. the opportunity cost). The models developed in Chapter 5, 6 and 7 (and
in PBMA) aim to be requisite in generating insights around the opportunity cost. As I
argued above, however the form of the value function of Deliberative CEA is
theoretically more robust than those used in PBMA.
8.2 Improving PBMA and CEAIn this thesis I present a new approach to priority setting and resource allocation.
My research, however, also provides the basis for three recommendations to improve
current PBMA or CEA practices as I discuss below.
One recommendation for the PBMA community is to generate samples of value
functions that are theoretically robust and can be used to facilitate workshops. In this
thesis I discuss three different value functions and recommend a function that includes
the following criteria: numbers affected, health gains per person and cost (Equation 10).
A second recommendation for the PBMA and the CEA community is to consider the
entire pathway of care in the context of disinvestments. As I discuss in Chapter 7, the
analysis of the entire pathway contributed to overcoming resistance to change by
shifting the discussion on caring for a patient population rather than on disinvesting
from particular interventions. The analysis of different pathway scenario focused the
203
discussion on achieving the greatest population health benefits given the available
budget.
A final recommendation for the PBMA and CEA community is to use visual aids in
facilitating the discussion on value-for-money. In this thesis I propose three visual aids:
rectangles of population health gains, triangles of value-for-money and the efficiency
frontier. These visual aids proved fundamental to include non health economists in the
discussion by making accessible the principles of health economics and CEA.
8.3 Main limitations and further researchAt the beginning of this dissertation I presented Mark Moore’s framework of public
value in terms of substantive value, legitimacy and operational feasibility. The
contribution of my dissertation is mainly limited to the first aspect of public value, by
assessing the population health gain of alternative allocation of resources, assuming the
list of alternative courses of actions was known. The identification of alternatives to be
assessed requires a problem structuring method that was beyond the scope of my
research.
Within this narrow scope, I focused on prescriptive approaches to healthcare
priority setting. In Chapter 2 I proposed a simple 2x2 matrix to group these approaches
as ‘theoretically robust but impractical’ (CBA, CEA, GCEA), or ‘theoretically weaker but
practical’ (PBMA). Deliberative CEA is a compromise between these two. As I illustrate in
Table 27, however, although theoretically stronger than PBMA, it is not as strong as CEA.
And although more practical than CEA/GCEA, it is not as practical as PBMA. On one
hand, deliberative CEA is not as theoretically strong as CEA because the models
developed are crude. In particular, the measurement of individual health gains relies on
the expert judgements of participants in interpreting and integrating available evidence.
In these assessments, participants are more likely to consider a ‘typical’ (or modal)
patient rather than the average patient. Yet, their assessment is used as a proxy for the
average patient. These assessments take place in the head of participants during the
discussion rather than through mathematical models that could be subjected to peer-

204
review. Participants’ views on the benefits of each intervention do not follow the
protocols for eliciting health-related utility scores.
On the other hand, deliberative CEA is not as flexible as PBMA because it requires a
more sophisticated understanding of decision analysis and health economics. The
availability of skilled facilitator is hence a significant barrier to the usability of the
approach. Furthermore, the consistency checks required to ensure the theoretical
robustness of the model take much time, limiting the number of options that could be
assessed in the available time. The systematic use of health economic principles in
defining the shape of the value function also limits the criteria that can be included in
the analysis. Research into the (lack of) use of health economics suggests that local
healthcare planners have other objectives, e.g. managerial objectives such as meeting
national or local priorities (which may be necessary for the institutional stability of the
organisation).
From a methodological perspective, the value function I propose in Deliberative CEA
has several limitations. In particular, I did not provide a way to satisfactorily account for
equity issues and to trade-off benefits occurring at different points in time. These are
controversial issues currently debated in health economics and it is perhaps not
surprising that I could not solve them. By using a decision analytic approach,
Deliberative CEA can offer a useful perspective to tackle these issues in that it
distinguishes clearly ‘facts’ (e.g. the socio-economic background of beneficiaries from
health interventions) from ‘judgments’ (e.g. how much additional value we wish to
attribute to improving health among the health-poor, who typically come from lower
socio-economic groups). This separation enables those responsible for allocating
resources to engage in an open debate with the local community and produce
recommendations that reflect the preference and judgments of the local community.
This is an area for further research, which can be enriched by testing alternative
techniques to embed distributional concerns or inter-temporal trade-offs (e.g. Morton
and Airoldi 2010).
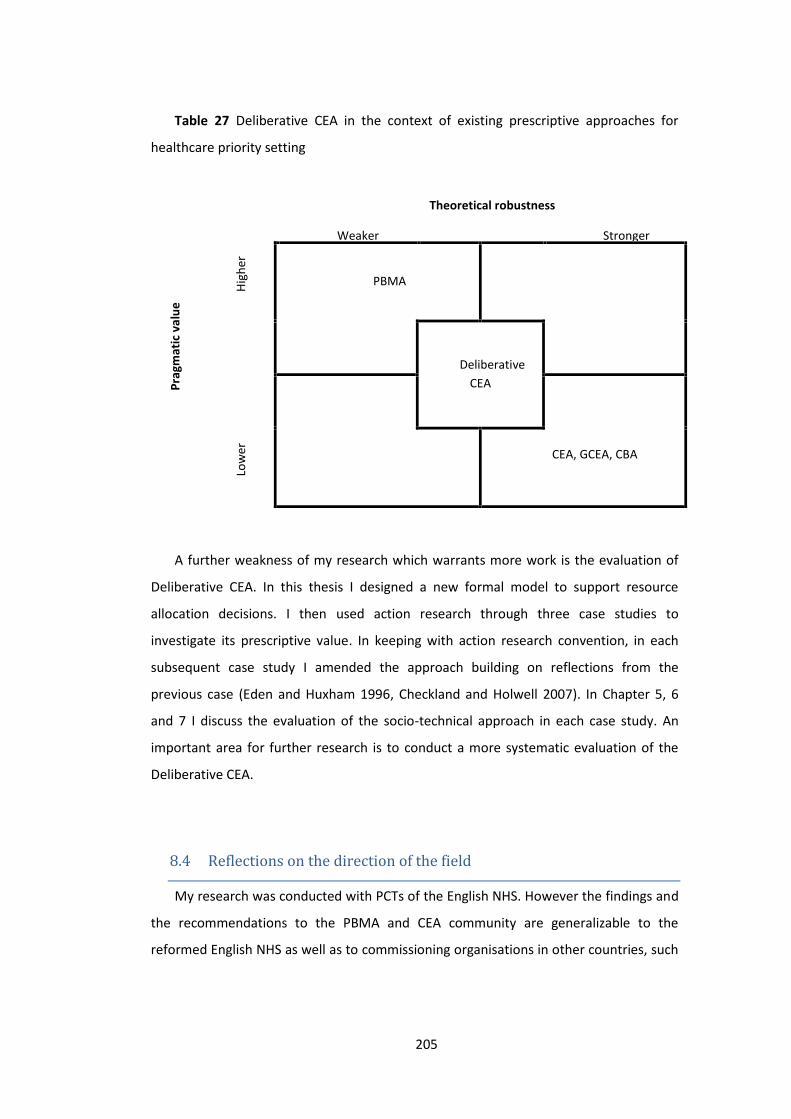
205
Table 27 Deliberative CEA in the context of existing prescriptive approaches for
healthcare priority setting
Theoretical robustness
Prag
mat
ic v
alue
Weaker StrongerHi
gher
PBMA
DeliberativeCEA
Low
er CEA, GCEA, CBA
A further weakness of my research which warrants more work is the evaluation of
Deliberative CEA. In this thesis I designed a new formal model to support resource
allocation decisions. I then used action research through three case studies to
investigate its prescriptive value. In keeping with action research convention, in each
subsequent case study I amended the approach building on reflections from the
previous case (Eden and Huxham 1996, Checkland and Holwell 2007). In Chapter 5, 6
and 7 I discuss the evaluation of the socio-technical approach in each case study. An
important area for further research is to conduct a more systematic evaluation of the
Deliberative CEA.
8.4 Reflections on the direction of the fieldMy research was conducted with PCTs of the English NHS. However the findings and
the recommendations to the PBMA and CEA community are generalizable to the
reformed English NHS as well as to commissioning organisations in other countries, such
206
as Health boards in Wales, Aziende Sanitarie Locali (ASL) in Italy, Local Health Integration
Networks (LHINs) in Ontario, Canada, or Health Boards in New Zealand.
Priority setting will become a more pressing issue in years to come because of
increase in demands from healthcare and a reduction in available public resources
following the economic crisis. There are hence difficult decisions ahead that will affect
the medical care we receive.
At the same time, there is an increased scrutiny and demand on transparency on
decisions affecting the public, especially in healthcare ‘disinvestments’. Mass
participation in the emotionally charged debate about disinvestments can be easily
manipulated (Fishkin 2009).
Both these pressures point to the need to engage those affected by rationing
decision in a well-structured debate to inform decisions (Sen 1979, Renn 1999, Daniels
and Sabin 2002, Fishkin 2009). The objective of my research has been to develop an
approach which uses formal models that are theoretically robust and practical to
structure these debates. My research shows that it will be crucial to engage
stakeholders to overcome resistance to change and it provides a method for doing this.

207
9 References
Acheson, R. (1978). "The definition and identification of need for health care."
Journal of Epidemiology and Community Health 32: 10-15.
Ackoff, R. L. (1979). "The Future of Operational Research is Past." Journal of the
Operational Research Society 30(2): 93-104.
Airoldi, M. (2007). "Gains in QALYs vs. DALYs averted. The troubling implications of
using residual life expectancy." LSE Health working paper series WP8.
Airoldi, M., G. Bevan, A. Morton, et al. (2008). Estimating the health and cost impact
from selected interventions in stroke care in England. QQuIP. Working paper prepared
for the Health Foundation.
Airoldi, M., G. Bevan, A. Morton, et al. (2008). "Facing poor glucose control in type 1
diabetes: requisite models for strategic commissioning." Healthcare Management
Science 11: 89-110.
Airoldi, M. and A. Morton (2009). "Adjusting life for health or disability: stylistic
difference or substantial issue?" Health Economics 18(11): 1237-1247.
Airoldi, M. and A. Morton (2009). "Adjusting Life for Quality or Disability: stylistic
difference or substantial dispute?" Health Economics 18: 1237-1247.
Anand, S. and K. Hanson (1997). "Disability-adjusted life years: a critical review."
Journal of Health Economics 16: 685-702.
Anand, S. and K. Hanson (1997). "Disability-adjusted life years: a critical review."
Journal of Health Economics 16(6): 685-702.
Andrews, G., C. Issakidis, K. Sanderson, et al. (2004). "Utilising survey data to inform
public policy: comparison of the cost-effectiveness of treatment of ten mental
disorders." British Journal of Psychiatry 184: 526-533.
Andrews, G., C. Issakidis, K. Sanderson, et al. (2004). "Utilising survey data to inform
public policy: comparison of the cost-effectiveness of treatment of ten mental
disorders." British Journal of Psychiatry 184: 526-533.
Ansell, D., T. Feest, C. Byrne, et al. (2003). UK Renal Registry. The Sixth Annual
Report. Bristol, The Renal Association.
Appleby, J., N. Devlin, D. Parkin, et al. (2009). "Searching for cost effectiveness
thresholds in the NHS." Health Policy 91(3): 239-245.

208
Arrow, K. J. (1951). An extension of the basic theorems of classical welfare
economics. Proceedings of the Second Berkeley Symposium on Mathematical Statistics
and Probability, Berkeley, University of California Press.
Arrow, K. J. (1963). "Uncertainty and the Welfare Economics of Medical Care."
American Economic Review LIII(5): 941-973.
Arrow, K. J. and G. Debreu (1954). "Existence of an equilibrium for a competitive
economy." Econometrica 22(3): 265-290.
Atkinson, A. B. (1987). "On the measurement of poverty." Econometrica 55(4): 749-
764.
Bagust, A., P. Hopkinson, L. Maslove, et al. (2002). "The projected health care
burden of Type 2 diabetes in the UK from 2000 to 2060." Diabetic Medicine
19(Supplement 4): 1-5.
Baughan, S. and B. Ferguson (2008). Road Testing Programme Budgeting and
Marginal Analysis (PBMA) in three English Regions: Hull Teaching Primary Care Trust
Diabetes Pilot Project. Yorkshire and Humber Public Health Observatory.
Bell, D. E., H. Raiffa and A. Tversky (1988). Descriptive, normative and prescriptive
interactions in decision making. Decision making. Descriptive, normative and
prescriptive interactions. D. E. Bell, H. Raiffa and A. Tversky. Cambridge, Cambridge
University Press.
Belton, V. and T. J. Stewart (2002). Multiple Criterial Decision Analysis. An integrated
approach. London, Kluwer Academic Publishers.
Bergson, A. (1954). "On the concept of social welfare." The Quarterly Journal of
Economics 68(2): 233-252.
Bernoulli, D. (1954). "Exposition of a new theory on the measurement of risk."
Econometrica 22(1): 23-36.
Bevan, G. and S. Hollinghurst (2003). "Cost per quality adjusted life year and
disability adjusted life years: the need for a new paradigm." Expert Review of
Pharmacoeconomics and Outcomes Research 3(4): 469-477.
Bevan, G., S. Hollinghurst, J. Raftery, et al. (1998). The South and West DALYs Project
– Developing a powerful tool for health care planning. Taunton, Somerset Health
Authority.
Birch, S. and a. Gafni (1992). "Cost-effectiveness/utility analyses: Do current decision
rules lead us to where we want to be?" Journal of Health Economics 11: 279-296.

209
Birch, S. and A. Gafni (2007). "Economists’ dream or nightmare? Maximizing health
gains from available resources using the NICE guidelines." Health Economics, Policy and
Law 2: 193-202.
Boardman, A. E., D. H. Greenberg, A. R. Vining, et al. (1996). Cost-benefit analysis:
concepts and practice. Upper Saddle River, New Jersey, Prentice Hall.
Boardman, A. E., D. H. Greenberg, A. R. Vining, et al. (2011). Cost-benefit analysis:
concepts and practice. Upper Saddle River, New Jersey, Pearson Education.
Borch-Johnsen, K., P. Andersen and T. Deckert (1985). "The effect of proteinuria on
relative mortality in type 1 (insulin-dependent) diabetes mellitus." Diabetologia 28: 590-
596.
Box, G. and N. R. Draper (1986). Empirical Model-Building and Response Surfaces,
Wiley.
Brailsford, S., R. Davies, C. Canning, et al. (1998). "Evaluating screening policies for
the early detection of retinopathy in patients with non-insulin dependent diabetes."
Health Care Management Science 1: 115-124.
Brouwer, W. B. F., A. J. Culyer, N. J. A. van Exel, et al. (2008). "Welfarism vs. extra-
welfarism." Journal of Health Economics 27: 325-338.
Bryan, S. and J. Brown (1998). "Extrapolation of cost-effectiveness information to
local settings." J Health Serv Res Policy 3: 108 - 112.
Bryan, S., I. Williams and S. McIver (2007). "Seeing the NICE side of cost-
effectiveness analysis: a qualitative investigation of the use of CEA in NICE technology
appraisals." Health Economics 16: 179-193.
Burk, A. (1938). "A reformulation of certain aspects of welfare economics." The
Quarterly Journal of Economics 52(2): 310-334.
Calabresi, G. and P. Bobbitt (1978). Tragic choices. New York, W W Norton &
Company Inc.
Cartwright, N. and J. Hardie (2012). Evidence-Based Policy: A Practical Guide to
Doing It Better, Open University Press USA.
Centre for Economic Performance's Mental Health Policy Group (2006). The
Depression Report: a new deal for depression and anxiety disorders. London, Centre for
Economic Performance, LSE.

210
Charles, C., A. Gafni and T. Whelan (1997). "Shared decision-making in the medical
encounter: What does it mean? (or it takes at least two to tango)." Social Science &
Medicine 44(5): 681-692.
Charlton, J., R. Hartley, R. Silver, et al. (1983). "Geographical variation in mortality
from conditions amenable to medical intervention in England and Wales." The Lancet
321(8326): 691-696.
Checkland, P. and S. Holwell (2007). Action research: its nature and validity.
Information Systems Action Research. K. N. New York, Springer-Verlag: 3-17.
Chisholm, D. (2005). "Choosing cost-effective interventions in psychiatry: results
from the CHOICE programme of the World Health Organisation." World Psychiatry 4(1):
37-44.
Clarke, P., A. Gray, R. Legood, et al. (2003). "The impact of diabetes-related
complications on healthcare costs: results from the United Kingdom Prospective
Diabetes Study (UKPDS study No. 65)." Diabet Med 20: 442-450.
Clarke, R. (1973). "Parliament and Public Expenditure." The Political Quarterly(137-
153).
Clarke, R. (1978). Public expenditure, management and control. London, The
Macmillan Press.
Coale, A. and P. Demeny (1983). Regional Model Life Tables and Stable Populations.
New York.
Colquitt, J., C. Green, M. Sidhu, et al. (2004). "Clinical and cost-effectiveness of
continuous subcutaneous insulin infusion for diabetes." Health Technology Assessment
8(43).
Connelly, N. A. and B. A. Knuth (1998). "Evaluating Risk Communication: Examining
Target Audience Perceptions About Four Presentation Formats for Fish Consumption
Health Advisory Information." Risk Analysis 18(5): 649-659.
Cookson, R., C. McCabe and A. Tsuchiya (2008). "Public healthcare resource
allocation and the Rule of Rescue." J Med Ethics 34: 540-544.
Cooper, K., S. C. Brailsford, R. Davies, et al. (2006). "A review of health care models
for coronary heart disease interventions." Health Care and Management Science 9: 311-
324.
Culyer, A. J. (1991). "The normative economics of health care finance and provision."
Oxford Review of Economic Policy 5(1): 34-58.

211
Currie, C., D. Kraus, C. Morgan, et al. (1997). "NHS Acute Sector Expenditure for
Diabetes: the Present, Future, and Excess In-patient Cost of Care." Diabetic Medicine
14(8): 686-692.
Currie, C., C. Poole, A. Woehl, et al. (2007). "The financial costs of healthcare
treatment for people with Type 1 or Type 2 diabetes in the UK with particular reference
to differing severity of peripheral neuropathy." Diabetic Medicine 24: 187-194.
Daniels, N. and J. E. Sabin (2002). Setting limits fairly. New York, Oxford University
Press.
Davies, R., S. Brailsford, P. Roderick, et al. (2000). "Using simulation modelling for
evaluating screening services for diabetic retinopathy." Journal of the Operational
Research Society 51: 476-484.
Davies, R., P. Roderick, C. Canning, et al. (2001). "Screening for Diabetic Retinopathy.
The evaluation of screening policies for diabetic retinopathy using computer
simulation." from http://www.management.soton.ac.uk/retinopathy/index.htm.
Dawson, D.H. GravelleM. O'Mahony, et al. (2005). Developing new approaches to
measuring NHS outputs and productivity. York, University of York Centre for Health
Economics: Report RP6.
Dawson, D.H. GravelleM. O'Mahony, et al. (2005). Developing new approaches to
measuring NHS outputs and productivity.
Debreu, G. (1951). "The coefficient of resource utilization." Econometrica 19(3): 273-
292.
Department of Health (2004). NHS Reference cost.
Department of Health. (2004). "Population figures at SHA and PCO level for England
and Wales." from www.dh.gov.uk/assetRoot/04/11/36/62/04113662.xls.
Department of Health (2005). Healthcare output and productivity: accounting for
quality change. Department of Health, London.
Department of Health. (2005). "Healthcare output and productivity: Accounting for
quality change." from
http://www.dh.gov.uk/PublicationsAndStatistics/Publications/PublicationsPolicyAndGui
dance/PublicationsPolicyAndGuidanceArticle/fs/en?CONTENT_ID=4124266&chk=5Qmb
Y7.
Department of Health. (2006). "PCT and SHA roles and functions." Retrieved
08.01.2008, from

212
http://www.dh.gov.uk/en/Publicationsandstatistics/Publications/PublicationsPolicyAnd
Guidance/DH_4134649.
Department of Health (2008). Resource allocation: weighted capitation formula -
sixth edition. Resource Allocation Team. London, Department of Health.
Department of Health (2009). Section 3 ITT and Scope of Work. Invitation to tender
for the contracts to undertake technology assessment reviews (TARs) on behalf of the
National Institute for Health Research (NIHR). Department of Health. London.
Department of Health (2010). The NHS constitution. London, Department of Health
Devlin, N. and D. Parkin (2004). "Does NICE have a cost-e¡ectiveness threshold and
what other factors in£uence its decisions? A binary choice analysis." Health Economics
13: 437-452.
Diabetes Control and Complication Trial (1990). "Diabetes Control and Complication
Trial Update." Diabetes Care 13(4): 427-433.
Diabetes Control and Complication Trial (1993). "The effect of intensive treatment of
diabetes on the development and progression of long-term complications in insulin-
dependent diabetes mellitus." New England Journal of Medicine 329(14): 977-986.
Diabetes Control and Complication Trial (1996). "Lifetime benefits and costs of
intensive therapy as practiced in the Diabetes Control and Complications Trial." JAMA
276(17): 1409-1415.
Diabetes UK (2004). Diabetes in the UK 2004. A report from Diabetes UK. London,
Diabetes UK.
Diabetes UK (2004). The national paediatric diabetes audit. Results from the audit
year 2002.
Dolan, P. (1998). "The measurement of individual utility and social welfare." J Health
Econ 17: 39 - 52.
Dolan, P. and R. Edlin (2002). "Is it really possible to build a bridge between cost-
benefit analysis and cost-effectiveness analysis?" Journal of Health Economics 21: 827-
843.
Donaldson, C., G. Currie and C. Mitton (2002). "Cost effectiveness analysis in health
care: contraindications." BMJ(325).
Drummond, K. F., M. J. Sculpher, G. W. Torrance, et al. (2005). Methods for the
Economic Evaluation of Health Care Programmes. Oxford, OUP.

213
Drummond, M. and A. McGuire (2001). Economic evaluation in health care. Merging
theory with practice. Oxford, Oxford University Press.
Drummond, M. F., J. Cooke and T. Walley (1997). "Economic evaluation under
managed competition: evidence from the U.K." Social Science & Medicine 45(4): 583-
595.
Drummond, M. F., M. J. Sculpher, G. W. Torrance, et al. (2005). Methods for the
Economic Evaluation of Health Care Programmes. Oxford, Oxford University Press.
Drummond, M. F. and H. Weatherly (2000). "Implementing the findings of health
technology assessments. If the CAT got out of the bac, can the TAIL wag the dog?"
International Journal of Technology Assessment in Health Care 16(1): 1-12.
Duthie, T., P. Trueman, J. Chancellor, et al. (1999). "Research into the use of health
economics in decision making in the United Kingdom - Phase II Is health economics 'for
good or evil'?" Health Policy 46: 143-157.
Dyer, J. S. and R. K. Sarin (1979). "Measurable Multiattribute Value Functions."
Operations Research 27(4): 810-822.
Eastman, J.J. JavittW. Herman, et al. (1997). "Model of complications of NIDDM. II.
Analysis of the health benefits and cost-effectiveness of treating NIDDM with the goal of
normoglycemia." Diabetes Care 20(5): 735-744.
Eastman, R.J. JavittW. Herman, et al. (1997). "Model of complications of NIDDM. I.
Model construction and assumptions." Diabetes Care 20(5): 725-734.
Eddama, O. and J. Coast (2008). "A systematic review of the use of economic
evaluation in local decision-making." Health Policy 86: 129-141.
Eddy, D. M. and L. Schlessinger (2003). "Archimedes: a trial-validated model of
diabetes." Diabetes Care 26: 3093-3101.
Eden, C. and C. Huxham (1996). Action Research for the study of organisations.
Handbook of organisations studies. S. Clegg, C. Hardy and W. Nord. Beverly Hills, Sage.
Edwards, W. and F. H. Barron (1994). "SMARTS and SMARTER: Improved Simple
Methods for Multiattribute Utility Measurement." Organizational Behavior and Human
Decision Processes 60: 306-325.
Elshaug, A. G., J. E. Hiller and J. R. Moss (2008). "Exploring policy-makers'
perspectives on disinvestment from ineffective healthcare practices." International
Journal of Technology Assessment in Health Care 24(1): 1-9.
214
Elshaug, A. G., J. R. Moss, P. Littlejohns, et al. (2009). "Identifying existing health care
services that do not provide value for money." MJA 190(5): 269-273.
Etzioni, A. (1967). "Mixed-scanning: A "Third" Approach To Decision-Making." Public
Administration Review 27(5): 385-392.
Evans, D., T. Adam, T.-T. Edejer, et al. (2005). "Time to reassess strategies for
improving health in developing countries." British Medical Journal 331(1133-1136).
Evans, D., T.-T. Edejer, T. Adam, et al. (2005). "Methods to assess the costs and
health effects of interventions for improving health in developing countries." British
Medical Journal 331: 1137-1140.
Fanshel, S. and J. Bush (1970). "A Health-Status Index and Its Application to Health-
Services Outcomes." Operations Research 18(6): 1021-1066.
Fishburn, P. C. (1965). "Independence in utility theory with whole product sets."
Operations Research 13: 28-45.
Fishkin, J. S. (2009). When the People Speak: Deliberative Democracy and Public
Consultation. Oxford, Oxford University Press.
Forouhi, N., D. Merrick, E. Goyder, et al. (2006). "Diabetes prevalence in England,
2001 -- estimates from an epidemiological model." Diabetic Medicine 23(2): 189-197.
Fox-Rushby, J. A. (2002). Disability-adjusted life years (DALYs) for decision making?
An overview of the literature. London, Office of Health Economics.
Fuchs, V. R. (2011). Who Shall Live? Health, Economics and Social Choice. Singapore,
World Scientific Publishing Co. Pte. Ltd.
GAD, G. A. s. D. (2006). "Interim Life Tables 2003-2005. England." Retrieved 10th
March 2007, 2007, from http://www.gad.gov.uk/Life_Tables/Interim_life_tables.htm.
Gafni, A. and S. Birch (2006). "Incremental cost-effectiveness ratios (ICERs): The
silence of the lambda." Social Science & Medicine 62(9): 2091-2100.
Garber, A. M. and C. E. Phelps (1997). "Economic foundations of cost-effectiveness
analysis." Journal of Health Economics 16: 1-31.
Garber, A. M., M. C. Weinstein, G. W. Torrance, et al. (1996). Theoretical
foundations of cost-effectiveness analysis. Cost-effectiveness in health and medicine. M.
R. Gold, J. E. Siegel, L. B. Russell and M. C. Weinstein. Oxford, OUP.
Garner, S. and P. Littlejohns (2011). "Disinvestment from low value clinical
interventions: NICEly done?" BMJ 343: d5194.

215
Gold, M. R., J. E. Siegel, L. B. Russell, et al. (1996). Cost-Effectiveness in Health and
Medicine. New York, Oxford University Press.
Gold, M. R., J. E. Siegel, L. B. Russell, et al., Eds. (1996). Cost-effectiveness in health
and medicine. Oxford, OUP.
Gold, M. R., D. Stevenson and D. G. Fryback (2002). "HALYs and QALYs and DALYs,
Oh my: similarities and differences in summary measures of population health." Annual
Review of Public Health 23: 115-134.
Goldman, N. and G. Lord (1986). "A new look at entropy and the life table."
Demography 23(2): 275-282.
Goodwin, P. and G. Wright (2004). Chapter 13 Resource allocation and negotiation
problems. Decision Analysis for management judgment. Chichester, John Wiley & Son:
329-354.
Gordois, A., P. Scuffham, A. Shearer, et al. (2004). "The health care costs of diabetic
nephropaty in the United States and the United Kingdom." Journal of Diabetes and Its
Complications 18: 18-26.
Gordois, A., A. Shearer, P. Scuffham, et al. (2003). "The health care costs of diabetic
peripheral neuropathy in the United Kingdom." The Diabetic Foot 6: 62-73.
Gray, A., M. Raikou, A. McGuire, et al. (2000). "Cost effectiveness of an intensive
blood glucose control policy in patients with type 2 diabetes: economic analysis
alongside randomised controlled trial (UKPDS 41)." BMJ 320: 1373-1378.
Gray, D. E. (2009). Doing research in the real world. London, Sage.
Hadorn, D. (1991). "Setting health care priorities in Oregon." Journal of the
American Medical Association 265: 2218-2225.
Hansen, B. O., J. L. Hougaard, H. Keiding, et al. (2004). "On the possibility of a bridge
between CBA and CE: comments on a paper by Dolan and Edlin." Journal of Health
Economics 23: 887-898.
Harris, J. E. (1977). "The internal organization of hospitals: some economic
implications." The Bell Journal of Economics 8(2): 467-482.
Harvey, J., L. Craney and D. Kelly (2002). "Estimation of the prevalence of diagnosed
diabetes from primary care and secondary care source data: comparison of record
linkage with capture-recapture analysis." Journal of Epidemiological Community Health
56: 18-23.
216
Harvey, J., K. Rizvi, L. Craney, et al. (2001). "Population-based survey and analysis of
trends in the prevalence of diabetic nephropathy in Type 1 diabetes." Diabetic Medicine
18: 998-1002.
Hausman, D. M. (2006). "Valuing Health." Philosophy & Public Affairs 34(3): 246-274.
Health and Social Care Information Centre (2004). Quality and Outcomes Framework
database.
Heclo, H. and A. Wildavsky (1981). The private government of public money.
London, The Macmillan press.
Herman, W., E. Dasbach, T. Songer, et al. (1997). "The cost-effectiveness of intensive
therapy for diabetes mellitus." Endocrinology and Metabolism Clinics of North America
26(3): 679-695.
Hicks, J. R. (1940). "The valuation of social income." Economica 7(26): 105-124.
HM Treasury (2003). The Green Book: appraisal and evaluation in central
Government. London, TSO.
Holland, W. (1991). European Community Atlas of 'Avoidable Death' - Commission of
the European Communities Health Services Research Series no. 6. Oxford, Oxford
University Press.
Hollinghurst, S. and G. Bevan (2003). "A scientific revolution to resolve the
incomplete paradigms of Cost per Quality Adjusted Life Year and Disability-Adjusted Life-
Years?" Expert Review of Pharmacoeconomics & Outcomes Research 3(4): 469-477.
Hollinghurst, S., G. Bevan and C. Bowie (2000). "Estimating the “avoidable” burden
of disease by Disability Adjusted Life Years (DALYs)." Health Care Management Science
3(1): 9-21.
Hollinghurst, S., G. Bevan and C. Bowie (2000). "Estimating the avoidable burden of
disease by Disability Adjusted Life Years (DALYs)." Health Care Management Science
3(1): 9-21.
House, P. W. (1982). The art of public policy analysis. Thousand Oaks, California,
Sage.
Hutubessy, R., D. Chisholm, T. Edejer, et al. (2003). "Generalized cost-effectiveness
analysis for national-level priority-setting in the health sector." Cost Effectiveness and
Resource Allocation 1(1): 8.
217
Hutubessy, R., D. Chisholm, T. T.-T. Edejer, et al. (2003). "Generalised cost-
effectiveness analysis for national-level priority setting in the health sector." Cost
effectiveness and resource allocation 1(8).
Hutubessy, R., d. Chrisholm, T.-T. Edejer, et al. (2003). "Generalized cost-
effectiveness analysis for national-level priority-setting in the health sector." Cost
Effectiveness and Resource Allocation 1(8).
Hutubessy, R. C. W., R. Baltussen, T. Tan Torres-Edejer, et al. (2002). "Generalised
cost-effectiveness analysis: an aid to decision making in health." Applied Health
Economics and Health Policy 1: 89 - 95.
Hutubessy, R. C. W., R. Baltussen, T. Tan Torres-Edejer, et al. (2003). "WHO-CHOICE:
Choosing interventions that are cost-effective." In: Health system performance
assessment: debate, new methods and empiricism.
Iqbal, Z., A. Price and M. Afza (2006). "Rationalizing rationnig in health care:
experience of two primary care trusts." Journal of Public Health 28: 125-132.
Isle of Wight NHS PCT (2008). Isle of Wight NHS Primary Care Trust Annual report
2007/08. Newport, Isle of Wight NHS.
Jacobs, R., P. C. Smith and A. Street (2006). Measuring Efficiency in Health Care.
Analytic Techniques and Health Policy. Cambridge, Cambridge University Press.
Johannesson, M. (1995). "The relationship between cost-effectiveness analysis and
cost-benefit analysis." Social Science & Medicine 41(4): 483-489.
Johannesson, M., J. S. Pliskin and M. C. Weinstein (1994). "A note on QALYs, time
tradeoff, and discounting." Medical Decision Making 14(2): 188-193.
Johannesson, M. and M. C. Weinstein (1993). "On the decision rules of cost-
effectiveness analysis." Journal of Health Economics 12: 459-467.
Jones-Lee, M. W. (1976). The value of lime. An economic analysis. London, Martin
Robertson & Co.
Kaldor, N. (1939). "Welfare propositions and interpersonal comparison of utility."
The Economic Journal 49(195): 549-552
Keeney, R. L. (1996). "Value-focused thinking: Identifying decision opportunities and
creating alternatives." European Journal of Operational Research 92: 537-549.
Keeney, R. L. and H. Raiffa (1976). Decisions with Multiple Objectives. Preferences
and Value Tradeoffs. Cambridge, Cambridge University Press.

218
Keeney, R. L. and R. L. Winkler (1985). "Evaluating decision strategies for equity of
public risks." Operations Research 33(5): 955-970.
Kelly, M., A. Morgan, S. Ellis, et al. (2010). "Evidence based public health: A review of
the experience of the National Institute of Health and Clinical Excellence (NICE) of
developing public health guidance in England." Social Science & Medicine 71(6): 1056-
1062.
Kemp, L. and R. Fordham (2008). Road Testing Programme Budgeting and Marginal
Analysis (PBMA) in three English Regions: Norfolk Mental Health PBMA Pilot Project.
NHS Health Economics Support Programme.
Kemp, L., R. Fordham, A. Robson, et al. (2008). Road Testing Programme Budgeting
and Marginal Analysis (PBMA) in three English Regions: Hull (Diabetes), Newcastle
(CAHMS), Norfolk (Mental Health).
Kemp, M. C. and Y.-K. Ng (1976). "On the existence of social welfare functions, social
orderings and social decision functions." Economica 43(169): 59-66.
Kernick, D. P. (2000). "The impact of health economics on healthcare delivery."
Pharmacoeconomics 18(4): 311-315.
Keyfitz, N. (1968). Introduction to the mathematics of population. Reading,
Massachusetts, Addison-Wesley.
Klein, R., B. Klein, S. Moss, et al. (1994). "The Wisconsin Epidemiologic study of
diabetic retinopathy. XIV. Ten-year incidence and progression of diabetic retinopathy."
Arch Ophthalmol 112: 1217-1228.
Klein, R., B. Klein, S. Moss, et al. (1998). "The Wisconsin Epidemiologic Study of
Diabetic Retinopathy XVII. The 14-year incidence and progression of diabetic retinopathy
and associated risk factors in type1 diabetes." Ophthalmology 102: 1799-1800.
Klein, R., B. Klein, S. Moss, et al. (1984). "The Wisconsis Epidemiologic Study of
Diabetic Retinopathy." Arch Ophthalmol 102(April): 520-526.
Klein, R., B. Klein, S. Moss, et al. (1989). "The Wisconsin Epidemiologic Study of
Diabetic Retinopathy IX. Four-year incidence and progression of diabetic retinopathy
when age at diagnosis is greater than 30 years." Arch Ophthalmol 107: 244-249.
Klein, R., B. Klein, S. Moss, et al. (1989). "The Wisconsin Epidemiologic Study of
Diabetic Retinopathy IX. Four-year incidence and progression of diabetic retinopathy
when age at diagnosis is less than 30 years." Arch Ophthalmol 107: 237-243.
219
Klein, R., S. Moss, B. Klein, et al. (1989). "Relation of ocular and systemic factors to
survival in diabetes." Arch Intern Med 149: 266-267.
Kleinmuntz, D. N. (2007). Resource allocation decisions. Advances in Decision
Analysis. From Foundations to Applications. W. Edwards, R. F. J. Miles and D. Von
Winterfeldt. New York, Cambridge University Press: 400-418.
Kleinmuntz, D. N. (2007). Resource allocation decisions. Advances in decision
analysis. W. Edwards, R. F. Miles and D. von Winterfeldt. Cambridge, CUP: 400-418.
Kotter, J. P. and L. A. Schlesinger (1979). "Choosing strategies for change." Harvard
Business Review(March-April): 106-114.
Krantz, D. H., R. D. Luce, P. Suppes, et al. (1971). Foundations of Measurement (Vol
I). Mineola, New York, Dover Publications, Inc.
Laing, S.A. SwerdlowS. Slater, et al. (1999). "The British Diabetic Association Cohort
Study, I: all-cause mortality in patients with insulin-treated diabetes mellitus." Diabet
Med 16(6): 459-465.
Laing, S.A. SwerdlowS. Slater, et al. (1999). "The British Diabetic Association Cohort
Study, II: cause-specific mortality in patients with insulin-treated diabetes mellitus."
Diabet Med 16(6): 466-471.
Layard, R. and S. Gleister (1994). Cost Benefit Analysis. Cambridge, Cambridge
University Press.
Lindblom, C. E. (1959). "The Science of 'Muddling Through'." Public Administration
Review 19: 79-99.
Lindsey, J. (2004). Statistical Analysis of Stochastic Processes in Time. Cambridge,
Cambridge University Press.
Lopez, A. D., C. D. Mathers, C. J. L. Murray, et al. (2002). Summary Measures of
Population Health: Concepts, Ethics, Measurement and Application. Geneva, World
Health Organization.
MacLeod, A.A. GrantC. Donaldson, et al. (1998). "Effectiveness and efficiency of
methods of dialysis therapy for end-stage renal disease: systematic reviews." Health
Technology Assessment 2(5).
Madden, L., R. Hussey, G. Mooney, et al. (1995). "Public health and economics in
tandem: programme budgeting, marginal analysis and priority setting in practice."
Health Policy 33: 161-168.
220
Martin, S., N. Rice and P. C. Smith (2008). "Does health care spending improve
health outcomes? Evidence from English programme budgeting data." Journal of Health
Economics 27: 826-842.
Martin, S. and P. C. Smith (2006). Value for money in the NHS. A summary of the
evidence. C. f. H. Economics. York, University of York.
Mas-Colell, A., M. D. Whinston and J. R. Green (1995). Microeconomic Theory. New
York, Oxford University Press.
Mason, H., M. Jones-Lee and C. Donaldson (2009). "Modelling the monetary value of
a QALY: a new approach based on UK data." Health Economics 18: 933-950.
Mauskopf, J., J. Paul, D. Grant, et al. (1998). "The role of cost-consequence analysis
in healthcare decision-making." Pharmacoeconomics 13(3): 277-288.
Maynard, A., K. Bloor and N. Freemantle (2004). "Challenges for the National
Institute for Clinical Excellence " British Medical Journal 329: 227-229.
McNeil, B., R. Wiechselbaum and S. Pauker (1978). "Fallacy of the five-year survival
in lung cancer." New England Journal of Medicine 299(25): 1397-1401.
Melse, J. M., M. L. Essink-Bot, P. G. N. Kramers, et al. (2000). "A national Burden of
Disease calculation: Dutch Disability-Adjusted Life Years." American Journal of Public
Health 90: 1241-1247.
Mitton, C. and C. Donaldson (2001). "Twenty-five years of programme budgeting
and marginal analysis in the health sector, 1974-1999." Journal of Health Services
Research and Policy 6(4): 239-248.
Mitton, C. and C. Donaldson (2004). "Health care priority setting: principles, practice
and challenges." Cost Effectiveness and Resource Allocation 2(3).
Mitton, C. and C. Donaldson (2004). Priority setting toolkit: a guide to the use of
economics in healthcare decision making. London, BMJ Books.
Mitton, C., S. Patten, H. Waldner, et al. (2003). "Priority setting in health authorities:
a novel approach to a historical activity." Social Science & Medicine 57: 1653-1663.
Montibeller, G. (2007). Action-Researching MCDA interventions. 49th British
Operational Research Conference (OR 49), University of Edinburgh, The OR Society.
Mooney, G. (1978). "Planning for balance of care of the elderly." Scottish Journal of
Political Economy 25(2): 149-164.
Mooney, G. and V. Wiseman (2000). "Burden of disease and priority setting." Health
Economics 9: 369-372.
221
Moore, M. H. (1995). Creating public value: strategic management in government.
Cambridge, Massachusetts, Harvard University Press.
Morgan, C., C. Currie, C. Stott, et al. (2000). "The prevalence of multiple diabetes-
related complications." Diabetic Medicine 17: 146-151.
Morris, S. (1997). "A comparison of economic modelling and clinical trials in the
economic evaluation of cholesterol-modifying pharmacotherapy." Health Economics 6:
589-601.
Morton, A. (forthcoming). "Bridging the gap: health equality and the deficit framing
of health." Health Economics.
Morton, A. and M. Airoldi (2010). Incorporating health inequalities considerations in
PCT priority setting (LSEOR10.122). LSEOR Working Paper Series. London, LSE.
Morton, A. and M. Airoldi (2010). Incorporating health inequalities considerations in
PCT priority setting. Working Paper LSEOR 10.122. London, London School of Economics
Operational Research Group.
Moss, S., R. Klein and B. Klein (1992). "The Prevalence and Incidence of Lower
Extremity Amputation in a Diabetic Population." Arch Intern Med 152: 610-616.
Mount Hood 4 Modeling Group (2007). "Computer Modeling of Diabetes and Its
Complications." Diabetes Care 30(6): 1638-1646.
Mowatt, G., L. Vale, J. Perez, et al. (2003). "Systematic review of the effectiveness
and cost-effectiveness, and economic evaluation, of home versus hospital or satellite
unit haemodialysis for people with end-stage renal failure." Health Technology
Assessment 7(2).
Mueller, D. C. (2003). Public Choice III. New York, NY, Cambridge University Press.
Mueller, E., S. Maxion-Bergemann, D. Gultyaev, et al. (2006). "Development and
Validation of the Economic Assessment of Glycemic Control and Long-Term Effects of
Diabetes (EAGLE) Model." Diabetes Technology & Therapeutics 8(2): 219-.
Mullen, P. M. (2004). "Quantifying priorities in healthcare: transparency or illusion?"
Health Service Management Research 17: 47-58.
Murray, C. J. L. (1996). Rethinking DALYs. The Global Burden of Disease: a
comprehensive assessment of mortality and disability from diseases, injuries and risk
factors in 1990 and projected to 2020. C. J. L. Murray and A. D. Lopez. Cambridge, MA,
Harvard School of Public Health, WHO, World Bank. 1: 1-98.

222
Murray, C. J. L. and A. K. Acharya (1997). "Understanding DALYs." Journal of Health
Economics 16: 703-730.
Murray, C. J. L. and A. D. Lopez, Eds. (1996). The Global Burden of Disease. Boston,
Harvard School of Public Health.
Murray, C. J. L. and A. D. Lopez (1997). "The utility of DALYs for public health policy
and research: a reply." Bulletin of the World Health Organisation 75(4): 377-381.
Murray, C. J. L. and A. D. Lopez (2000). "Progress and directions in refining the
Global Burden of Disease approach: a response to Williams." Health Economics 9: 69-82.
Murray, C. J. L., T. Vos, R. Lozano, et al. (2012). "Disability-adjusted life years (DALYs)
for 291 diseases and injuries in 21 regions, 1990?2010: a systematic analysis for the
Global Burden of Disease Study 2010." The Lancet 380(9859): 2197-2223.
Musgrave, R. A. (1959). The Economics of Public Finance. New York, McGraw Hill.
National Clinical Audit Support Programme. (2005). "National Diabetes Audit. Key
findings about the quality of care for people with diabetes in England. Report for the
audit period 2003/04." from
http://www.icservices.nhs.uk/ncasp/pages/audit_topics/diabetes/default-new.asp.
National Institute for Health and Clinical Excellence (2006) "National Institute for
Health and Clinical Excellence." DOI: http://www.nice.org.uk.
National Institute for Health and Clinical Excellence. (2007). "The guidelines manual
2007." from http://www.nice.org.uk/page.aspx?o=422950.
National Institute for Health and Clinical Excellence (2008). Guide to the methods of
technology appraisal. London.
National Institute for Health and Clinical Excellence (2008). Guide to the Methods of
Technology Appraisal. London, NICE.
National Research Council of the National Academies (2008). Public Participation in
Environmental Assessment and Decision Making. Washington, D.C., The National
Academies Press.
Niessen, L. (2002). Roads to health. Multi-state modelling of population health and
resource use, Dutch University Press.
OECD (2012). OECD Health data 2012.
Office of National Statistics (2003). Mortality statistics, Series DH1, no. 36.
Ontario (2006). Local Health System Integration Act.
223
Ortegon, M. M., W. K. Redekop and L. W. Niessen (2004). "Cost-Effectiveness of
Prevention and Treatment of the Diabetic Foot. A Markov analysis." Diabetes Care 27:
901-907.
Østerdahl, L. P. (2005). "Axioms for healthcare resource allocation." Journal of
Health Economics 24: 679-702.
Palmer, A., S. Roze, W. Valentine, et al. (2004). "The CORE Diabetes Model:
projecting long-term clinical outcomes, costs and cost-effectiveness of interventions in
diabetes mellitus (type 1 and 2) to support clinical and reimbursement decision-
making." Current Medical Research and Opinion 20(Suppl. 1): S5-S26.
Palmer, A., C. Weiss, P. Sendi, et al. (2000). "The cost-effectiveness of different
management strategies for Type I diabetes: a Swiss perspective." Diabetologia 43(1): 13-
26.
Pareto, V. (1906). Manuale di economia politica con una introduzione alla scienza
sociale. Milan, Società Editrice Libreria.
Parkin, D. and N. Devlin (2006). "Is there a case for using visual analogue scale
valuations in cost-utility analysis?" Health Economics 15: 653-664.
Parks, R. P. (1976). "An impossibility theorem for fixed preferences: a dictatorial
Bergson-Samuelson Welfare function." The Review of Economic Studies 43(3): 447-450.
Peacock, S. J., C. Mitton, A. Bate, et al. (2009). "Overcoming barriers to priority
setitng using interdisciplinary methods." Health Policy 92: 124-132.
Peacock, S. J., C. Mitton, D. Ruta, et al. (2010). "Priority setting in healthcare:
towards guidelines for the program budgeting and marginal analysis framework." Expert
Review of Pharmacoeconomics and Outcome Research 10(5): 539-552.
Peacock, S. J., J. R. J. Richardson, R. Carter, et al. (2007). "Priority setting in health
care using multi-attribute utility theory and programme budgeting and marginal analysis
(PBMA)." Social Science & Medicine 64: 897-910.
Phillips, L. (1984). "A Theory of Requisite Decision Models." Acta Psychologica 56:
29-48.
Phillips, L. and C. Bana e Costa (2007). "Transparent prioritisation, budgeting and
resource allocation with multi-criteria decision analysis and decision conferencing."
Annals of Operations Research 154: 51-68.
Phillips, L. D. (1984). "A theory of requisite decision models." Acta Psychologica 56:
29-48.
224
Phillips, L. D. (2007). Decision Conferencing. Advances in decision analysis: from
foundations to applications. W. Edwards, R. F. Miles and D. Von Winterfeldt. Cambridge,
CUP.
Phillips, L. D. (2007). Decision Conferencing. Advances in decision analysis : from
foundations to applications. W. Edwards, R. F. J. Miles and D. von Winterfeldt.
Cambridge; New York, Cambridge University Press.
Phillips, L. D. and C. Bana e Costa (2007). "Transparent prioritisation, budgeting and
resource allocation with multi-criteria decision analysis and decision conferencing."
Annals of Operations Research 154(1): 51-68.
Pidd, M. (2003). Tools for Thinking. Modelling in Management Science. Chichester,
John Wiley & Sons.
Pliskin, J. S., D. S. Shepard and M. C. Weinstein (1980). "Utility functions for life years
and health status." Operations Research 28(1): 206-224.
Preston, S. H. (1993). Health Indices as a Guide to Health Sector Planning: A
Demographic Critique. The Epidemiological Transition: Policy and Planning Implications
for Developing Countries Commission on Behavioral and Social Sciences and Education:
126-144.
Quade, E. S. (1971). "A history of cost-effectiveness." RAND paper.
Renn, O. (1999). "A Model for an Analytic-Deliberative Process in Risk
Management." Environ Sci Technol 33(18): 3049-3055.
Robbins, L. (1935). An Essay on the Nature & Significance of Economic Science.
London, Macmillan and Co.
Robinson, S., H. Dickinson, I. Williams, et al. (2011). Setting priorities in health.
London, The Nuffield Trust.
Robson, A., A. Bate and C. Donaldson (2008). Road Testing Programme Budgeting
and Marginal Analysis (PBMA) in three English Regions: Newcastle CAMHS PBMA Pilot
project. IHS and Newcastle University. Newcastle.
Rosenhead, J. and J. Mingers (2001). Rational Analysis for a Problematic World
Revisited: Problem Structuring Methods for Complexity, Uncertainty and Conflict.
Chichester, West Sussex, John Wiley & Sons.
Ross, J. (1995). "The use of economic evaluation in health care: Australian decision
makers' perceptions." Health Policy 31: 103-110.
225
Rossing, P., P. Hougaard, K. Borch-Johnsen, et al. (1996). "Predictors of mortality in
insulin dependend diabetes: 10-year observational follow-up study." British Medical
Journal 313: 779-784.
Rutstein, D., W. Berengerg, T. Chalmers, et al. (1976). "Measuring the quality of
medical care. A clinical method." New England Journal of Medicine 294(11): 582-588.
Samuelson, P. (1947). Foundation of Economic Analysis. Cambridge, MA, Cambridge
University Press.
Samuelson, P. (1977). "Reaffirming the existence of "reasonable" Bergson-
Samuelson Social Welfare Functions." Economica 44(173): 81-88.
Sandel, M. J. (2012). What Money Can't Buy: The Moral Limits of Markets, Allen
Lane.
Sandman, L. (2005). A good death. On the value of death and dying. Maidenhead,
Open University Press.
Sandman, P. M., N. D. Weinstein and P. Miller (1994). "High Risk or Low: How
Location on a “Risk Ladder” Affects Perceived Risk." Risk Analysis 14(1): 35-45.
Savage, L. J. (1954). The Foundations of Statistics. New York, John Wiley & Sons.
Schelling, T. C. (1968). The life you save may be your own. Problems in public
expenditure analysis. S. B. J. Chase. Washington, DC, The Brookings Institution: 127-162.
Scitovsky, T. (1941). "A note on welfare propositions in Economics." The Review of
Economic Studies 9(1): 77-88.
Scitovsky, T. (1951). "The state of Welfare Economics." The American Economic
Review 41(3): 303-315.
Sen, A. (1979). "Personal utilities and public judgment: or what's wrong with welfare
economics." The Economic Journal 89: 537-558.
Sen, A. (1980). Equality of what? The Tanner Lectures on Human Values. S.
McMurrin. Cambridge, Cambridge University Press.
Sen, A. (1986). Social choice theory. Handbook of Mathematical Economics. K. J.
Arrow and M. D. Intriligator. Amsterdam, Elsevier Science. Volume III.
Sheffield PCT (2008). Achieving Balanced Health (2). Five-Year Strategy. Sheffield,
NHS Sheffield.
Shrestha, L. B. (2005). "Life Expectancy in the United States." from
http://www.cnie.org/nle/crsreports/05mar/RL32792.pdf.

226
Sloan, F. A., K. Whetten-Goldstein and A. Wilson (1997). "Hospital pharmacy
decisions, cost containment and the use of cost effectiveness analysis." Social Science &
Medicine 45(4): 523-533.
Smith, A. (1776). An inquiry into the nature and causes of the wealth of nations
London, W. Strahan and T. Cadell.
Smith, J. (2008). Isle of Wight Public Health Annual Report 2008. Newport, Isle of
Wight NHS.
Soedamah-Muthu, S., J. Fuller, H. Mulnier, et al. (2006). "All-cause mortality rates in
patients with Type 1 diabetes mellitus compared to a non-diabetic population from the
General Practice Research Database (GPRD) 1992-1999." Diabetologia 49(4): 660-666.
Soedamah-Muthu, S., J. Fuller, H. Mulnier, et al. (2006). "High Risk of Cardiovascular
Disease in Patients with Type 1 Diabetes in the U.K. A cohort study using the General
Practice Research Database." Diabetes Care 29(4): 798-804.
Stinnett, A. A. and A. D. Paltiel (1996). "Mathematical programming for the efficient
allocation of health care resources." Journal of Health Economics 15: 641-653.
Stouthard, M., M. Essink-Bot, G. Bonsel, et al. (1997). Disability weights for diseases
in the Netherlands. Rotterdam, Erasmus University, Department of Public Health.
Sugden, R. (2007). "Alan Harold Williams 1927-2005." Proceedings of the British
Academy 150: 313-331.
Sugden, R. and A. Williams (1978). The principles of practical cost-benefit analysis.
Oxford, Oxford University Press.
Suppes, P. and J. Zinnes (1963). Basic measurement theory. Handbook of
Mathematical Psychology. R. D. Luce, R. R. Bush and E. Galanter. New York, John Wiley &
Sons. I: 1-76.
Tan-Torres Edejer, T., R. Baltussen, T. Adam, et al. (2003). Making Choices in Health:
WHO guide to cost-effectiveness analysis. Geneva, World Health Organization.
Tan-Torres Edejer, T., R. Baltussen, T. Adam, et al., Eds. (2003). WHO guide to cost-
effectiveness analysis. Geneva, World Health Organisation.
Tengs, T. O., M. E. Adams, J. S. Pliskin, et al. (1995). "Five-hundred life-saving
interventions and their cost-effectiveness." Risk Analysis 15(3): 369-390.
The Health Foundation (2010). Improvement in practice: Commissioning with the
community. The Health Foundation. London, The Health Foundation.

227
The Health Foundation (2012). Looking for value in hard times. The Health
Foundation. London, The Health Foundation.
Thokala, P. (2011). Multiple criteria decision analysis for health technology
assessment. Report by the Decision Support Unit. Sheffield, ScHARR, University of
Sheffield.
Thokala, P. and A. Duenas (2012). "Multiple Criteria Decision Analysis for Health
Technology Assessment." Value in Health 15: 1172-1181.
Thompson, D., S. Kozak and S. Sheps (1999). "Insulin adjustment by a diabetes nurse
educator improves glucose control in insulin-requiring diabetic patients: a randomized
trial." Canadian Medical Association Journal 161: 959-962.
Tomar, R., S. Lee, S. Wu, et al. (1998). "Disease progression and cost of insulin
dependent diabetes mellitus: development and application of a simulation model." 1998
5(4): 24-37.
Tony, M., M. Wagner, H. Khoury, et al. (2011). "Bridging health technology
assessment (HTA) with multicriteria decision analyses (MCDA): field testing of the
EVIDEM framework for coverage decisions by a public payer in Canada." BMC Health
Services Research 11(329).
Torrance, G. W., W. H. Thomas and D. L. Sackett (1972). "A Utitlity Maximization
Model for Evaluation of Health Care Programs." Health Services Research: 118-133.
Towse, A. (2009). "Should NICE's threshold range for cost per QALY be raised? Yes."
BMJ 338(31 January 2009): 268.
UK Centre for the Measurement of Government Activity (2006) "Public Service
Productivity: Health." Economic Trends 628, 26-57.
von der Schulenburg, J. M. G. (2000). The influence of economic evaluation studies
on health care decision-making. Oxford, IOS Press.
von Neumann, J. and O. Morgenstern (1944). Theory of Games and Economic
Behavior. Princeton, New Jersey, Princeton University Press.
von Winterfeldt, D. and W. Edwards (1986). Decision analysis and behavioral
research. Cambridge, Cambridge University Press.
Weick, K. E. (1995). Sensemaking in Organizations, Sage.
Weimer, D. L. and A. R. Vining (2011). Policy analysis: concepts and practice,
Pearson.
228
Weinstein, M. and W. Stason (1977). "Foundation of cost-effectiveness analysis for
health and medical practices." New England Journal of Medicine 296: 716-721.
Williams, A. (1972). "Cost-Benefit Analysis: bastard science? And/or insidious poison
in the body politick?" Journal of Public Economics 1(2): 199-225.
Williams, A. (1985). "Economics of coronary artery bypass grafting." British Medical
Journal 291: 326-329.
Williams, A. (1991). "Is the QALY a technical solution to a political problem? Of
course not." Int J Health Serv 21: 365-369.
Williams, A. (1997). "Intergenerational equity: an exploration of the 'fair innings'
argument." Health Economics 6(2): 117-132.
Williams, A. (1999). "Calculating the Global Burden of Disease: time for a strategic
reappraisal." Health Economics 8: 1-8.
Williams, A. (2004). What could be nicer than NICE? London, Office of Health
Economics.
Williams, I. and S. Bryan (2007). "Understanding the limited impact of econonomic
evaluation in health care resource allocation: a conceptual framework." Health Policy
80: 135-143.
Williams, R., M. Airey, H. Baxter, et al. (2004). "Epidemiology of diabetic retinopathy
and macula oedema: a systematic review." Eye 18: 963-983.
Wilson, E. C., S. J. Peacock and D. Ruta (2008). "Priority setting in practice: what is
the best way to compare cost and benefits?" Health Economics.
Wilson, E. C., J. Rees and R. J. Fordham (2006). "Developing a prioritisation
framework in an English Primary Care Trust." Cost Eff Resour Alloc 4(3).
Wood, I., N. Mallick and A. Wing (1987). "Prediction of resources needed to achieve
the national target for treatment of renal failure." BMJ 294: 1467-1470.
World Bank (1993). World development report 1993: investing in health. Oxford,
Oxford University Press.
World Health Organization (1990). Global Burden of Disease Study.
Yin, R. K. (2009). Case study research: design and methods. Los Angeles, Sage.
Related Documents