Esquire Financial Holdings, Inc. ANNUAL REPORT

Welcome message from author
This document is posted to help you gain knowledge. Please leave a comment to let me know what you think about it! Share it to your friends and learn new things together.
Transcript

Esquire Financial Holdings, Inc.
ANNUAL REPORT
Esq
uir
e F
ina
nc
ial H
ol
din
gs, In
c. 2017 AN
NU
AL REPO
RT

2017 was a transformational year for Esquire as we successfully completed our initial public offering (“IPO”) on the NASDAQ, trading under our symbol “ESQ”. The IPO, coupled with the strong performance of our common stock to date, is a testament to our unique and attractive business model in the market. Our ongoing commitment to the litigation and small business (merchant) communi-ties on a national basis has been and continues to be the foundation for our success. Through the combined efforts of our Board of Directors, management team and employees, we delivered out-standing financial results and record earnings in 2017. In the face of rising interest rates and an extremely competi-tive banking landscape, we grew our adjusted net income(1) by 53%, driven by impressive loan growth of 25% and a 34% increase in fee income. We believe there are three key paths to the Company’s continued success—our unique niche in the legal and small business communities nationally; a strong net interest margin supported by stable low cost deposits; and a diversified revenue mix that includes fee-based income. Our “branchless” low cost deposit model coupled with our unique revenue stream will continue to drive our efficiency ratio below industry standards, while future investments in technology and talent will allow us to scale our model and support growth. Our goal is to transform Esquire into a
top performing fintech institution in the
industry. Our Company is at a true inflec-
tion point for scalability and profitability to
achieve this goal. With excess capital as
a foundation supported by a diverse list of
new institutional investors, we anticipate
continued earnings growth throughout
2018 driven by robust commercial, con-
sumer and small business loan pipelines,
as well as our merchant services and
other fee related income.
Esquire’s strong loan growth and signifi-
cant increase in fee income in 2017
demonstrate our focus and dedication to
this unique business model. At Esquire,
we remain true to our commitment to
serve the litigation and small business
communities nationally through a simple
yet innovative approach to banking—
listen to the customer’s needs and tailor
products and services around those
needs. This model continues to set
Esquire apart from other institutions who
offer a “one product fits all” model. The
litigation community is the foundation for
our impressive loan growth, increased
loan yields, and low cost core deposits,
representing more than 70% of our deposit
base. This foundation is supported by a
strong distribution network anchored by
our founders, board members, investors,
trial bar associations, sales teams, senior
management and current customer
base. We also remained steadfast in
growing our merchant services platform
on a national basis. We provide dynamic
and flexible merchant services solutions
to small business owners, differentiat-
ing us from larger institutions. Our mer-
chant services platform has grown to
approximately 18,000 small businesses
generating $3.3 million in fee-based
income for 2017 and representing $28
million in core low cost deposits at year
end. These small business customers
represent a significant opportunity for
future growth in fee income, core deposits
and enhanced lending opportunities.
The continued success of our unique
model anchored by our recent IPO has
been the key component to delivering
outstanding financial results and record
earnings in 2017. Adjusted net income(1)
increased 53% to $4.3 million or $0.69
per diluted common share. This was
driven by a $70.4 million or 25% increase
in loans to $349 million and a 34%
increase in total fee income to $5.5 million.
Our net interest margin was an enviable
4.43%, driven by higher yielding commer-
cial and consumer loans and funded
with low cost core deposits. Our fee
income represented 22% of total revenue,
driven by merchant services and cus-
tomer related fees. Our diligent approach
to underwriting is evident in our strong
asset quality with no non-performing
assets and an allowance for loan losses
representing 1.22% of total loans. We
anticipate strong loan growth in 2018,
OUR FELLOW SHAREHOLDER,
(1) Excludes the impact of a $683 thousand revaluation of our net deferred tax asset as a result of the new federal tax legislation. Reported or GAAP net income was $3.6 million for the year ended 2017.
SH A R EHOLDER L e t t e r
1
focusing on our attorney-based products and services as well as our commercial real estate lending. Our pipeline of mer-chant opportunities also remains strong. Both loan and fee income opportunities should continue to enhance earnings in 2018. As a foundation for future growth, we successfully raised $26.3 million in common stock (net proceeds) from our IPO, increasing stockholders’ equity to $83.4 million, representing a consoli-dated equity to assets ratio of 15.63%.
Our “branchless” low cost core deposits, representing our primary funding source for growth, totaled $448.5 million, a 21% increase from 2016, with an impressive cost of funds of 0.13% (including demand deposits). These stable funds are primarily driven by our commercial law firm custo-mers’ operating and escrow deposits, representing more than 70% of our total deposit base. We continue to prudently manage growth in deposits, utilizing com-mercial customer sweep programs for our mass tort and class action business banking. These programs remain strong with off-balance sheet funds totaling $478 million at December 31, 2017, gen-erating increases in customer related fees. These funds, coupled with the suc-cessful IPO, will continue to be a source of funding for our future growth.
In 2017, we had our grand opening of the new Corporate Headquarters in Jericho, New York, consolidating all departments in one location to effectively and efficiently service a growing customer base. We re-engineered our Information Technology and Lending Departments to support our
future growth, hiring a seasoned Chief Technology Officer and Chief Lending Officer as well as additional staff in each area. We have launched various technol-ogy initiatives including, but not limited to, our Salesforce based management information, sales and lending platform. The combination of our unique revenue streams, low cost core deposits, lean infrastructure and current and future technology initiatives should continue to increase our returns, making Esquire a premier top performing fintech institution in the industry.
With 2018 upon us, we remain focused on enhancing our strong brand recogni-tion in the legal and small business com-munities we serve nationally, maintaining a strong net interest margin supported by stable low cost deposits, and contin-ually diversifying our revenue stream into stable fee-based income. With capital as our foundation, we will continue to main-tain strong credit standards and invest in talent and infrastructure to support long term growth. We are optimistic about the bank’s future in the face of a variety of challenges that face the industry including, but not limited to: competitive market forces from other institutions and finance companies; the current interest rate environment; new and complex regula-tory requirements; and other factors including cybersecurity and terrorism that remain concerns for us.
Despite these challenges, we believe in our unique business model, the industries we serve, our clients, our Board of Directors, and our employees. We want to thank
each member of the Board of Directors for their enduring service and stewardship throughout the years. We also want to thank our motivated and talented employ-ees who embody the spirit and reputation of our bank.
Finally, on behalf of the Board of Directors, management and our employees, we want to thank our distinguished Share-holders for their trust, confidence and investment in our Company. We thank you for this distinct honor to lead an exceptional Company.
Dennis ShieldsExecutive Chairman of the Board
Andrew C. SaglioccaPresident & Chief Executive Officer
2

Esquire Financial Holdings, Inc. F O R M 10 - K

(This page intentionally left blank)
UNITED STATESSECURITIES AND EXCHANGE COMMISSION
Washington, D.C. 20549
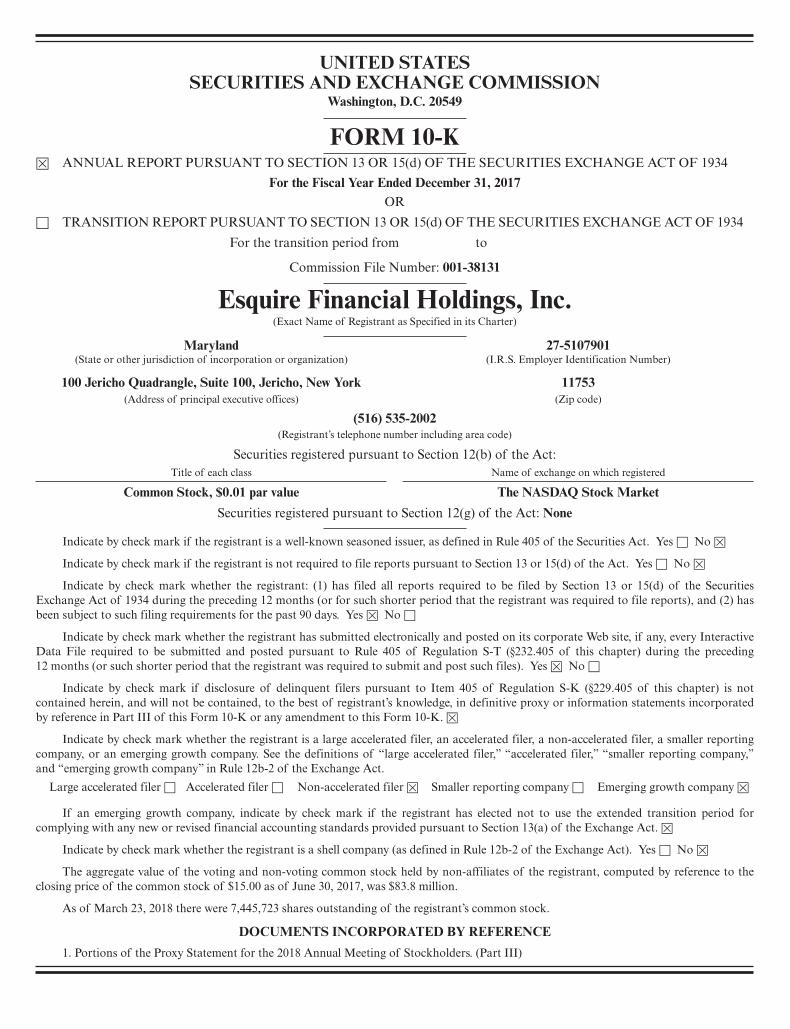
FORM 10-K☒ ANNUAL REPORT PURSUANT TO SECTION 13 OR 15(d) OF THE SECURITIES EXCHANGE ACT OF 1934
For the Fiscal Year Ended December 31, 2017OR
☐ TRANSITION REPORT PURSUANT TO SECTION 13 OR 15(d) OF THE SECURITIES EXCHANGE ACT OF 1934For the transition period from to
Commission File Number: 001-38131
Esquire Financial Holdings, Inc.(Exact Name of Registrant as Specified in its Charter)
Maryland 27-5107901(State or other jurisdiction of incorporation or organization) (I.R.S. Employer Identification Number)
100 Jericho Quadrangle, Suite 100, Jericho, New York 11753(Address of principal executive offices) (Zip code)
(516) 535-2002(Registrant’s telephone number including area code)
Securities registered pursuant to Section 12(b) of the Act:Title of each class Name of exchange on which registered
Common Stock, $0.01 par value The NASDAQ Stock MarketSecurities registered pursuant to Section 12(g) of the Act: None
Indicate by check mark if the registrant is a well-known seasoned issuer, as defined in Rule 405 of the Securities Act. Yes ☐ No ☒
Indicate by check mark if the registrant is not required to file reports pursuant to Section 13 or 15(d) of the Act. Yes ☐ No ☒
Indicate by check mark whether the registrant: (1) has filed all reports required to be filed by Section 13 or 15(d) of the SecuritiesExchange Act of 1934 during the preceding 12 months (or for such shorter period that the registrant was required to file reports), and (2) hasbeen subject to such filing requirements for the past 90 days. Yes ☒ No ☐
Indicate by check mark whether the registrant has submitted electronically and posted on its corporate Web site, if any, every InteractiveData File required to be submitted and posted pursuant to Rule 405 of Regulation S-T (§232.405 of this chapter) during the preceding12 months (or such shorter period that the registrant was required to submit and post such files). Yes ☒ No ☐
Indicate by check mark if disclosure of delinquent filers pursuant to Item 405 of Regulation S-K (§229.405 of this chapter) is notcontained herein, and will not be contained, to the best of registrant’s knowledge, in definitive proxy or information statements incorporatedby reference in Part III of this Form 10-K or any amendment to this Form 10-K. ☒
Indicate by check mark whether the registrant is a large accelerated filer, an accelerated filer, a non-accelerated filer, a smaller reportingcompany, or an emerging growth company. See the definitions of “large accelerated filer,” “accelerated filer,” “smaller reporting company,”and “emerging growth company” in Rule 12b-2 of the Exchange Act.
Large accelerated filer ☐ Accelerated filer ☐ Non-accelerated filer ☒ Smaller reporting company ☐ Emerging growth company ☒
If an emerging growth company, indicate by check mark if the registrant has elected not to use the extended transition period forcomplying with any new or revised financial accounting standards provided pursuant to Section 13(a) of the Exchange Act. ☒
Indicate by check mark whether the registrant is a shell company (as defined in Rule 12b-2 of the Exchange Act). Yes ☐ No ☒
The aggregate value of the voting and non-voting common stock held by non-affiliates of the registrant, computed by reference to theclosing price of the common stock of $15.00 as of June 30, 2017, was $83.8 million.
As of March 23, 2018 there were 7,445,723 shares outstanding of the registrant’s common stock.
DOCUMENTS INCORPORATED BY REFERENCE1. Portions of the Proxy Statement for the 2018 Annual Meeting of Stockholders. (Part III)

(This page intentionally left blank)
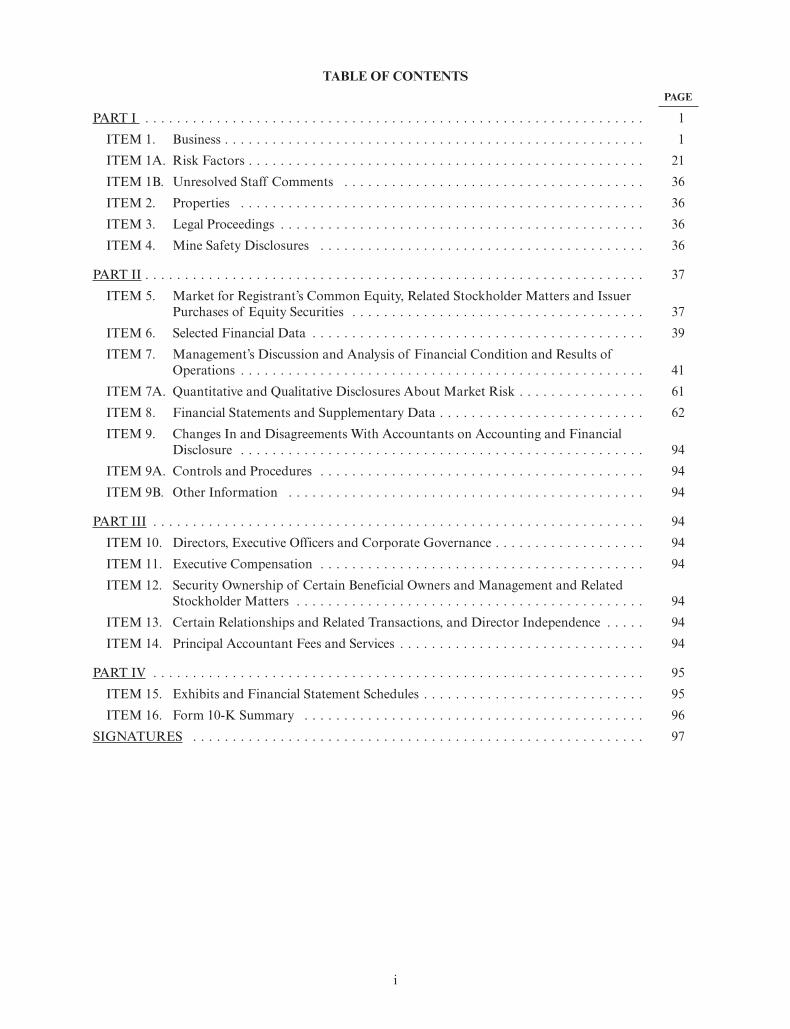
TABLE OF CONTENTSPAGE
PART I . . . . . . . . . . . . . . . . . . . . . . . . . . . . . . . . . . . . . . . . . . . . . . . . . . . . . . . . . . . . . . . 1ITEM 1. Business . . . . . . . . . . . . . . . . . . . . . . . . . . . . . . . . . . . . . . . . . . . . . . . . . . . . . 1ITEM 1A. Risk Factors . . . . . . . . . . . . . . . . . . . . . . . . . . . . . . . . . . . . . . . . . . . . . . . . . . 21ITEM 1B. Unresolved Staff Comments . . . . . . . . . . . . . . . . . . . . . . . . . . . . . . . . . . . . . . 36ITEM 2. Properties . . . . . . . . . . . . . . . . . . . . . . . . . . . . . . . . . . . . . . . . . . . . . . . . . . . 36ITEM 3. Legal Proceedings . . . . . . . . . . . . . . . . . . . . . . . . . . . . . . . . . . . . . . . . . . . . . . 36ITEM 4. Mine Safety Disclosures . . . . . . . . . . . . . . . . . . . . . . . . . . . . . . . . . . . . . . . . . 36
PART II . . . . . . . . . . . . . . . . . . . . . . . . . . . . . . . . . . . . . . . . . . . . . . . . . . . . . . . . . . . . . . . 37ITEM 5. Market for Registrant’s Common Equity, Related Stockholder Matters and Issuer
Purchases of Equity Securities . . . . . . . . . . . . . . . . . . . . . . . . . . . . . . . . . . . . . 37ITEM 6. Selected Financial Data . . . . . . . . . . . . . . . . . . . . . . . . . . . . . . . . . . . . . . . . . . 39ITEM 7. Management’s Discussion and Analysis of Financial Condition and Results of
Operations . . . . . . . . . . . . . . . . . . . . . . . . . . . . . . . . . . . . . . . . . . . . . . . . . . . 41ITEM 7A. Quantitative and Qualitative Disclosures About Market Risk . . . . . . . . . . . . . . . . 61ITEM 8. Financial Statements and Supplementary Data . . . . . . . . . . . . . . . . . . . . . . . . . . 62ITEM 9. Changes In and Disagreements With Accountants on Accounting and Financial
Disclosure . . . . . . . . . . . . . . . . . . . . . . . . . . . . . . . . . . . . . . . . . . . . . . . . . . . 94ITEM 9A. Controls and Procedures . . . . . . . . . . . . . . . . . . . . . . . . . . . . . . . . . . . . . . . . . 94ITEM 9B. Other Information . . . . . . . . . . . . . . . . . . . . . . . . . . . . . . . . . . . . . . . . . . . . . 94
PART III . . . . . . . . . . . . . . . . . . . . . . . . . . . . . . . . . . . . . . . . . . . . . . . . . . . . . . . . . . . . . . 94ITEM 10. Directors, Executive Officers and Corporate Governance . . . . . . . . . . . . . . . . . . . 94ITEM 11. Executive Compensation . . . . . . . . . . . . . . . . . . . . . . . . . . . . . . . . . . . . . . . . . 94ITEM 12. Security Ownership of Certain Beneficial Owners and Management and Related
Stockholder Matters . . . . . . . . . . . . . . . . . . . . . . . . . . . . . . . . . . . . . . . . . . . . 94ITEM 13. Certain Relationships and Related Transactions, and Director Independence . . . . . 94ITEM 14. Principal Accountant Fees and Services . . . . . . . . . . . . . . . . . . . . . . . . . . . . . . . 94
PART IV . . . . . . . . . . . . . . . . . . . . . . . . . . . . . . . . . . . . . . . . . . . . . . . . . . . . . . . . . . . . . . 95ITEM 15. Exhibits and Financial Statement Schedules . . . . . . . . . . . . . . . . . . . . . . . . . . . . 95ITEM 16. Form 10-K Summary . . . . . . . . . . . . . . . . . . . . . . . . . . . . . . . . . . . . . . . . . . . 96
SIGNATURES . . . . . . . . . . . . . . . . . . . . . . . . . . . . . . . . . . . . . . . . . . . . . . . . . . . . . . . . . 97
i

(This page intentionally left blank)
PART I
ITEM 1. Business
Forward Looking Statements
This annual report contains forward-looking statements within the meaning of the federal securitieslaws. These forward-looking statements reflect our current views with respect to, among other things, futureevents and our financial performance. These statements are often, but not always, made through the use ofwords or phrases such as “may,” “might,” “should,” “could,” “predict,” “potential,” “believe,” “expect,”“attribute,” “continue,” “will,” “anticipate,” “seek,” “estimate,” “intend,” “plan,” “projection,” “goal,”“target,” “outlook,” “aim,” “would,” “annualized” and “outlook,” or the negative version of those words orother comparable words or phrases of a future or forward-looking nature. These forward-lookingstatements are not historical facts, and are based on current expectations, estimates and projections aboutour industry, management’s beliefs and certain assumptions made by management, many of which, by theirnature, are inherently uncertain and beyond our control. Accordingly, we caution you that any suchforward-looking statements are not guarantees of future performance and are subject to risks, assumptions,estimates and uncertainties that are difficult to predict. Although we believe that the expectations reflectedin these forward-looking statements are reasonable as of the date made, actual results may prove to bematerially different from the results expressed or implied by the forward-looking statements.
The following factors, among others, could cause actual results to differ materially from the anticipatedresults or other expectations expressed in the forward-looking statements:
• our ability to manage our operations under the current economic conditions nationally and in ourmarket area;
• adverse changes in the financial industry, securities, credit and national local real estate markets(including real estate values);
• risks related to a high concentration of loans secured by real estate located in our market area;
• risks related to a high concentration of loans and deposits dependent upon the legal and“litigation” market;
• the impact of any potential strategic transactions;
• our ability to enter new markets successfully and capitalize on growth opportunities;
• significant increases in our loan losses, including as a result of our inability to resolve classifiedand non-performing assets or reduce risks associated with our loans, and management’sassumptions in determining the adequacy of the allowance for loan losses;
• interest rate fluctuations, which could have an adverse effect on our profitability;
• external economic and/or market factors, such as changes in monetary and fiscal policies and laws,including the interest rate policies of the Board of Governors of the Federal Reserve System(“FRB”), inflation or deflation, changes in the demand for loans, and fluctuations in consumerspending, borrowing and savings habits, which may have an adverse impact on our financialcondition;
• continued or increasing competition from other financial institutions, credit unions, and non-bankfinancial services companies, many of which are subject to different regulations than we are;
• credit risks of lending activities, including changes in the level and trend of loan delinquencies andwrite-offs and in our allowance for loan losses and provision for loan losses;
• our success in increasing our legal and “litigation” market lending;
• our ability to attract and maintain deposits and our success in introducing new financial products;
• losses suffered by merchants or Independent Sales Organizations (ISOs) with whom we dobusiness;
1
• our ability to effectively manage risks related to our merchant services business;
• our ability to leverage the professional and personal relationships of our board members andadvisory board members;
• changes in interest rates generally, including changes in the relative differences between short-termand long-term interest rates and in deposit interest rates, that may affect our net interest marginand funding sources;
• fluctuations in the demand for loans;
• technological changes that may be more difficult or expensive than expected;
• changes in consumer spending, borrowing and savings habits;
• declines in the yield on our assets resulting from the current low interest rate environment;
• declines in our merchant processing income as a result of reduced demand, competition andchanges in laws or government regulations or policies affecting financial institutions, including theDodd-Frank Act and the JOBS Act, which could result in, among other things, increased depositinsurance premiums and assessments, capital requirements, regulatory fees and compliance costs,particularly the new capital regulations, and the resources we have available to address suchchanges;
• changes in accounting policies and practices, as may be adopted by the bank regulatory agencies,the Financial Accounting Standards Board, the Securities and Exchange Commission or thePublic Company Accounting Oversight Board;
• loan delinquencies and changes in the underlying cash flows of our borrowers;
• the impairment of our investment securities;
• our ability to control costs and expenses, particularly those associated with operating as a publiclytraded company;
• the failure or security breaches of computer systems on which we depend;
• political instability;
• acts of war or terrorism;
• competition and innovation with respect to financial products and services by banks, financialinstitutions and non-traditional providers, including retail businesses and technology companies;
• changes in our organization and management and our ability to retain or expand ourmanagement team and our board of directors, as necessary;
• the costs and effects of legal, compliance and regulatory actions, changes and developments,including the initiation and resolution of legal proceedings, regulatory or other governmentalinquiries or investigations, and/or the results of regulatory examinations and reviews;
• the ability of key third-party service providers to perform their obligations to us; and
• other economic, competitive, governmental, regulatory and operational factors affecting ouroperations, pricing, products and services described elsewhere in this annual report.
The foregoing factors should not be construed as exhaustive and should be read in conjunction withother cautionary statements that are included in this annual report. If one or more events related to these orother risks or uncertainties materialize, or if our underlying assumptions prove to be incorrect, actualresults may differ materially from what we anticipate. Accordingly, you should not place undue reliance onany such forward-looking statements. Any forward-looking statement speaks only as of the date on which itis made, and we do not undertake any obligation to publicly update or review any forward-lookingstatement, whether as a result of new information, future developments or otherwise. New risks and
2
uncertainties arise from time to time, and it is not possible for us to predict those events or how they mayaffect us. In addition, we cannot assess the impact of each factor on our business or the extent to which anyfactor, or combination of factors, may cause actual results to differ materially from those contained in anyforward-looking statements.
Esquire Financial Holdings, Inc.’s electronic filings with the SEC, including the Annual Report onForm 10-K, Quarterly Reports on Form 10-Q, Current Reports on Form 8-K and amendments to thesereports filed or furnished pursuant to Sections 13(a) or 15(d) of the Exchange Act, as amended, are madeavailable at no cost in the Investor Relations section of the Company’s website, www.esquirebank.com, assoon as reasonably practicable after the Company files such material with, or furnishes it to, the SEC. TheCompany’s SEC filings are also available through the SEC’s website at www.sec.gov.
Our Company
Esquire Financial Holdings, Inc. (“Esquire Financial” or the “Company”) is a bank holding companyheadquartered in Jericho, New York and registered under the Bank Holding Company Act of 1956, asamended (the “BHC Act”). Through our wholly owned bank subsidiary, Esquire Bank, NationalAssociation (“Esquire Bank” or the “Bank”), we are a full service commercial bank dedicated to serving thefinancial needs of the legal and small business communities on a national basis, as well as commercial andretail customers in the New York metropolitan market. We offer tailored products and solutions to the legalcommunity and their clients as well as dynamic and flexible merchant services solutions to small businessowners, both on a national basis. We also offer traditional banking products for businesses and consumersin our local market area (a subset of the New York metropolitan market). We believe these activities,primarily anchored by our legal community focus, generate a stable source of low cost core deposits and adiverse asset base to support our overall operations. Our commercial and consumer loans tailored to thelitigation market (“Attorney-Related Loans”) enhance our overall yield on our loan portfolio, enabling us toearn attractive risk-adjusted net interest margins. Additionally, our merchant processing activities generate arelatively stable source of fee income. We believe our unique and dynamic business model distinguishes usfrom other banks and non-bank financial services companies in the markets in which we operate asdemonstrated by comparing our performance metrics for the years ended 2017 and 2016.
For the years ended December 31, 2017 and 2016:
• Our net income increased 29.1% to $3.6 million or $0.58 per diluted share.
• We had a net interest margin of 4.43%, an increase from 4.25%, stabilized by a low cost of fundsof 0.13% on our deposits.
• Our loans increased 25.3%, or $70.4 million, to $349.0 million, with no non-performing loans andsolid asset quality metrics.
• Our noninterest income increased 33.7% to $5.5 million, which represented 21.7% of our totalrevenue at December 31, 2017, primarily driven by our merchant services platform.
• As of December 31, 2017, our total assets, loans, deposits and stockholders’ equity totaled$533.6 million, $349.0 million, $448.5 million and $83.4 million, respectively.
On June 30, 2017, we closed our initial public offering (“IPO”) and our stock now trades on theNASDAQ Capital Markets, under the symbol “ESQ”. The aggregate net proceeds to the Company from itsinitial public offering, including the over-allotment shares that closed on July 20, 2017, after deducting theunderwriting discount and estimated offering expenses, are approximately $26.3 million. We have deployedthe net proceeds of the offering to support the growth in Esquire Bank’s loan portfolio, including thepossibility of making larger loans due to our increased legal lending limit, to finance potential strategicacquisitions to the extent such opportunities arise and for other general corporate purposes, which couldinclude other growth initiatives.
We remain true to our commitment to serve the litigation community and our commercial customersthrough our tailored and innovative products and solutions. Our relationships within the litigationcommunity are a key contributor to our loan growth, strong loan yields, and low cost core deposits. Thelitigation community represented more than 70% of our deposit base at December 31, 2017. In addition to
3
our lending activities, we have also remained steadfast in growing our merchant services platform. Weprovide dynamic and flexible merchant services solutions to small business owners. Our merchant servicesplatform has grown to approximately 18,000 small businesses at December 31, 2017, which generated mostof our noninterest income and which represented 21.7% of our revenue for the year ended December 31,2017. We believe merchant services represents a significant opportunity for future growth in fee income,core deposits and enhanced lending opportunities.
Our low cost average core deposits (deposits, excluding time deposits), representing our primaryfunding source for loan growth, totaled $361.7 million at December 31, 2017 resulting in a total cost ofdeposits of 0.13%. These stable low cost funds are driven by our attorney operating and escrow deposits,representing more than 70% of our total deposit base at December 31, 2017. We intend to continue toprudently manage growth in deposits, utilizing customer sweep programs for our mass tort and class actionbusiness banking programs. We do not have traditional “brick and mortar” branches to support our depositgrowth. Instead, we rely on our robust attorney network to gather deposits and our customers utilizeon-line cash management technology to manage their operating and escrow accounts as well as theirbusiness banking needs across the country.
Market Area
We define the market area for our legal community products as law firms practicing within theUnited States, United States territories and United States commonwealths, and we serve the litigationindustry on a nationwide basis. For traditional community banking products and services, our primarymarket area is the New York metropolitan area, specifically Nassau and New York (Manhattan) Countiesin New York and secondarily throughout the state of New York. As a Visa and MasterCard member, weprovide merchant services for small businesses located throughout the United States through relationshipswith third party ISOs.
We have established our niche in the litigation market through the strategic development of a businessmodel that understands our market’s unique needs and provides access to our target customers. We havedesigned unique, value added products and services for our current and potential customers and created adistribution network with direct access to the market through the experience and networks of our Board,Advisory Board, attorney stockholders and certain members of management. A number of our directors,Advisory Board members and investors are well-known, influential market figures and active members ofsome of the leading litigation law firms in the nation and national and state bar associations as well as otherindustry leading companies such as plaintiff financing and structured settlement services. In addition, wehave established informal affiliations or relationships with key industry organizations such as New YorkState Trial Lawyers Association, Consumer Attorneys of California, Florida Justice Association, and anumber of other state trial attorney associations. Through our current law firm clients and otherrelationships, we believe we have access to thousands of trial attorneys.
Our traditional community banking market area has a diversified economy typical of mosturban population centers, with the majority of employment provided by services, wholesale/retail trade,finance/insurance/real estate (“FIRE”) and construction. Services account for the largest employmentsector across the two primary market area counties, while wholesale/retail trade accounts for the secondlargest employment sector in Nassau and New York Counties. New York City is one of the premierfinancial centers in the world, and thus FIRE is the third largest employment sector in New York County.As of June 30, 2017 (the latest date for which information is available), New York County’s $1.1 trilliondeposit market was much larger than the $72.8 billion deposit market in Nassau County.
Competition
The bank and non-bank financial services industries in our markets and surrounding areas is highlycompetitive. We compete with a wide range of regional and national banks located in our market areas aswell as non-bank commercial finance companies on a nationwide basis. We experience competition in bothlending and attracting funds as well as merchant processing services from commercial banks, savingsassociations, credit unions, consumer finance companies, pension trusts, mutual funds, insurancecompanies, mortgage bankers and brokers, brokerage and investment banking firms, non-bank lenders,government agencies and certain other non-financial institutions. Many of these competitors have more
4
assets, capital and lending limits, and resources than we do and may be able to conduct more intensive andbroader-based promotional efforts to reach both commercial and individual customers. Competition fordeposit products can depend heavily on pricing because of the ease with which customers can transferdeposits from one institution to another.
Competition for Attorney-Related Loans is derived primarily from eight to ten nationally-orientedfinancial companies that specialize in this market. Some of these companies are focused exclusively on loansto law firms, while others offer loans to plaintiffs as well. While some overlap exists between the litigationmarket loan products offered by Esquire Bank and these companies (primarily lines of credit, case-cost andpost-settlement commercial loans), there are a number of critical differences that management believes giveEsquire Bank a competitive advantage:
• Esquire Bank can offer more competitive rates on loans compared to specialty finance companiesbecause its cost of funds is much lower than the funding costs for these non-bank competitors;
• the non-bank companies are not able to offer deposit products or business services such as remotedeposit capture or letters of credit, or debit cards; and
• non-banks cannot offer products uniformly across the country because they are not nationalbanks.
Lending Activities
Our strategy is to maintain a loan portfolio that is broadly diversified by type and location. Within thisgeneral strategy, we intend to focus our growth in Attorney-Related Loans, which include commercial andconsumer lending to attorneys, law firms and plaintiffs/claimants where we have expertise and marketinsights. As of December 31, 2017, these product lines in aggregate totaled $154.8 million (or 44.5% of ourloan portfolio). As of December 31, 2017, our commercial Attorney-Related Loans, which consist ofworking capital lines of credit, case cost lines of credit, term loans and post-settlement commercial andother commercial attorney-related loans (“Commercial Attorney-Related Loans”), totaled $127.7 million,or 82.5% of our total attorney-related loan portfolio and 36.7% of our loan portfolio. As of December 31,2017, our consumer Attorney-Related Loans, which consist of post-settlement consumer loans andstructured settlement loans (“Consumer Attorney-Related Loans”), totaled $27.2 million, or 17.5% of ourtotal Attorney-Related Loan portfolio and 7.8% of our loan portfolio. With respect to ourAttorney-Related Loan portfolio, we seek out customers on a nationwide basis.
At December 31, 2017, approximately 49.4% of the Commercial Attorney-Related Loans outstandinghad been extended to customers in New York followed by 11.2% extended to customers in Texas. Ourcurrent Loan Policy limits the percentage of out-of-state loans to 25% per loan type in any one state otherthan New York.
As of December 31, 2017, our total real estate loans, which consist of 1 – 4 family loans, commercialreal estate loans, multifamily loans and construction loans, totaled $179.8 million (or 51.7% of our loanportfolio). The majority of our real estate secured loans are in the areas surrounding the New Yorkmetropolitan area. We anticipate continuing to focus on the commercial and personal credit needs ofbusinesses and individuals in these markets.
The following is a discussion of our major types of lending activity:
Commercial Loans and Lines of Credit (“Commercial”). Commercial loans are originated to localsmall to mid-size businesses to provide short-term financing for inventory, receivables, the purchase ofsupplies, or other operating needs arising during the normal course of business and loans made to ourqualified merchant customers. In addition, specialized and tailored commercial loans are offered toattorneys and law firms nationally. At December 31, 2017, commercial loans (excluding CommercialAttorney-Related Loans of $127.7 million) totaled $8.7 million (or 2.5% of total loans). All commercialloans are originated internally and represented 39.2% of our total loans at December 31, 2017.
Commercial Attorney-Related Loans. The following is a summary of the specialized commercial loanproducts we offer to meet the needs of the litigation community. Commercial Attorney-Related Loans aremade to attorneys and law firms and the outstanding loan balances are included in the loan balance for
5
commercial loans as noted above. A unique aspect of our underwriting involves advances of loan proceedsagainst a “borrowing base,” which typically consists of the inventory of litigation cases for the firm. Wecomplement this with traditional commercial underwriting. See “— Credit Risk Management” below.Generally, the maximum amount a customer may borrow at any time is fixed as a percentage of theborrowing base outstanding at any time.
• Working Capital Lines of Credit (“WC LOC”). WC LOCs are unsecured business lines of creditoffered to law firms for general corporate purposes, including meeting cash flow needs,advertising, financing the purchase of fixed assets, or other reasons. The balance of such loanswas $96.1 million at December 31, 2017 (or 62.1% of total Attorney-Related Loans).
• Case Cost Lines of Credit. Case Cost Lines of Credit (“Case Cost LOC”) are unsecured businesslines of credit that are tied to the costs of contingency cases and totaled $24.4 million atDecember 31, 2017 (or 15.8% of total Attorney-Related Loans). Contingency case costs includecourt filing fees, investigative costs, expert witness fees, deposition costs, and other costs. Recoveryof case costs is derived from gross settlement proceeds from the settled case. In our experience, anaverage case can take two to four years to litigate and law firms are prevented from charging theirclients any interest for the out-of-pocket litigation costs, which amounts to an interest-free loanprovided to the client. Thus, instead of using the law firm’s cash flow, law firms use Case CostLOCs to finance litigation cash flows because the finance charges can be charged against thesettlement proceeds. Case Cost LOCs are not contingent loans, meaning that their repayment isnot dependent on a favorable case settlement. In the event of an unfavorable outcome for theborrower, the loans are repaid from the cash flows of the law firm.
• Term Loans. Term loans are short-term unsecured business loans originated to law firms forgeneral corporate purposes. These loans are offered to law firms at the same terms as those offeredto other types of businesses. Term loans to law firms totaled $7.1 million at December 31, 2017 (or4.6% of total Attorney-Related Loans).
• Post-Settlement Commercial and Other Commercial Attorney-Related Loans. Post-settlementcommercial loans are bridge loans secured by proceeds from non-appealable, settled cases. Othercommercial attorney-related loans consist of both secured and unsecured loans to law firms andattorneys. Post-settlement commercial and other commercial attorney-related loans totaled$68,000 at December 31, 2017.
Consumer Loans. Consumer loans are primarily post-settlement consumer and structured settlementloans made to plaintiffs and claimants as described below. Consumer loans are also originated toindividuals for debt consolidation, home repairs, home improvement or other consumer purchases.Consumer loans are both secured and unsecured. At December 31, 2017, total consumer loans were$31.9 million (or 9.2% of total loans). We believe that our post-settlement consumer loans to claimantsshould increase based upon recent mass tort settlements including, but not limited to, the World TradeCenter Victims Compensation Fund and the NFL Concussion case (“NFL”).
The following is a summary of the specialized Consumer Attorney-Related Loan products we offerto meet the needs of the litigation market. Consumer Attorney-Related Loans, which consistof post-settlement consumer and structured settlement loans, are consumer loans made to individualplaintiffs/claimants and the outstanding loan balances are included in the loan balance for consumer loansas noted above.
• Post-Settlement Consumer Loans. Post-settlement consumer loans are generally bridge loans toindividuals secured by proceeds from settled cases. These loans generally meet the “life needs” ofclaimants in various litigation matters due to the delay between the time of settlement and actualpayment of the settlement. These delays are primarily due to various administrative matters in thecase. The balance of post-settlement consumer loans to individuals was $25.7 million atDecember 31, 2017. NFL loans represented $21.8 million or 85.3% of our total post-settlementloans as of December 31, 2017.
• Structured Settlement Loans. Structured settlement loans are structured such that the annuity
6
provider (a highly rated insurance company) is directed by the court, at the request of theborrower, to deposit the borrower’s payments into an account designated by us. Loan paymentsare then automatically deducted from the annuity payment. At December 31, 2017, structuredloans in our loan portfolio totaled $1.4 million.
Real Estate Loans. The majority of our real estate secured loans are in the areas surrounding theNew York metropolitan area.
Multifamily. Multifamily loans are the largest component of the real estate loan portfolio and totaled$98.4 million (or 28.3% of total loans) at December 31, 2017. The multifamily loan portfolio consists ofloans secured by apartment buildings and mixed-use buildings (predominantly residential incomeproducing) in our primary market area. We originate and purchase multifamily loans. Whether originatedor purchased, all loans are independently underwritten by Esquire Bank utilizing the same underwritingcriteria and approved by the Directors Loan Committee or in accordance with our Board establishedapproval authorities.
1 – 4 Family Residential. Mortgage loans are primarily secured by 1 – 4 family cash flowinginvestment properties ($51.6 million as of December 31, 2017) in our market area. The residential mortgageloan portfolio includes 1 – 4 family income producing investment properties, primary and secondary owneroccupied residences, investor coops and condos. The majority of residential mortgages are originatedinternally, although we do purchase residential mortgages from time to time. Purchased loans are subject toall the asset quality and documentary precautions normally used when originating a loan.
Commercial Real Estate (“CRE”). CRE loans totaled $24.8 million (or 7.1% of total loans) atDecember 31, 2017 and consisted primarily of loans secured by hospitality properties (44.8% of the CREportfolio), mixed use properties (33.2% of the CRE portfolio) and warehouses (13.3% of theCRE portfolio), with the remainder comprised of condo associations and office/retail properties.Owner-occupied loans represented 18.8% of the CRE portfolio at December 31, 2017. We both originateand purchase CRE loans. All loans are independently underwritten by us utilizing the same underwritingcriteria, and approved by the Directors Loan Committee.
Construction Loans. Construction loans are originated on an opportunistic basis and totaled$5 million (or 1.5% of total loans) at December 31, 2017.
Merchant Services Activities
We provide merchant services as an acquiring bank through the third-party or ISO business model inwhich we process credit and debit card transactions on behalf of merchants. This model is designed to shiftsome of the risk from merchant losses resulting from chargebacks, fraud, non-compliance issues or eveninsolvency to the ISO. In an ISO model, the bank and the ISO jointly enter into the merchant agreementwith each merchant. We believe that this model provides an added layer of protection against losses frommerchants since losses that are not absorbed by a merchant would be the liability of the ISO payable fromreserves posted by the ISO or other funds the bank owes to the ISO. Even with this recourse, Esquire Bankis ultimately liable for losses from actions of merchants and those of ISOs. To date, Esquire Bank has notincurred any losses from its merchant services activities.
We entered into the merchant processing business as an acquiring bank in 2012 in an effort to increaseour noninterest income revenue and to provide cross selling opportunities for other business bankingproducts and services. For the year ended December 31, 2017, merchant processing revenues wereapproximately $3.3 million and represented most of our noninterest income, which was 21.7% of our totalrevenue and represented an increase of 33.7% over the comparable prior year period. At December 31,2017, we had agreements with 22 ISOs, we serviced approximately 18,000 merchants, and for the year endedDecember 31, 2017, we processed $3.8 billion in card volume. We intend to continue to expand ourmerchant processing business.
Under the ISO model, Esquire Bank and the ISO determine the appropriate amount of merchantreserves, which is generally based on the nature of the merchant’s business, its chargeback and refundhistory, processing volumes and the merchant’s financial health. The ISO performs an underwriting and riskmanagement review, although Esquire Bank itself also reviews and underwrites every application and
7
performs separate risk monitoring and management to ensure conformance with Esquire Bank’s internalunderwriting policies. As of December 31, 2017, we had contractual arrangements with three paymentprocessors or clearing agents, TSYS, JetPay and TriSource, which are utilized by Esquire Bank and ourISOs to authorize, process and obtain settlement for card transactions.
We have implemented a comprehensive risk mitigation program for our merchant services businesswhich includes detailed policies and procedures applicable to both ISOs and merchants pertaining to duediligence, risk and underwriting and Bank Secrecy Act compliance, among other things. Our MerchantAcquiring and Risk Policy establishes authorities and guidelines for the Bank to acquire merchant servicingarrangements with ISOs, agent banks, direct merchants and through merchant portfolio acquisitions. Suchguidelines include initial and ongoing due diligence requirements and approval authorities. All merchants,regardless of how the merchant is acquired, must meet our Merchant Credit/Underwriting Policyrequirements. In addition, credit approval requirements and authorities for approving merchants and ISOsare clearly defined in our Merchant Acquiring and Risk Policy.
Our Merchant Acquiring and Risk Policy establishes stringent requirements related to the duediligence conducted initially and on an ongoing basis, requirements for the ISO contract, ourresponsibilities and the ISO’s responsibilities in connection with the sponsorship and other matters. In theevent of a potential loss and in accordance with the terms of the ISO Merchant Agreement, we can take thefollowing actions to collect: charge the merchant account; charge the merchant reserve account; charge theISO reserve account; deduct from the ISO monthly residual on an ongoing basis until fully recovered; andmay, if utilized recover through chargeback insurance.
In exchange for the liabilities and costs assumed by ISOs, we receive reduced revenue on our merchantservicing portfolio than direct merchant service providers that do not obtain such indemnification andadministrative support. For the year ended December 31, 2017, we received a blended rate of approximatelyeight basis points for merchant processing, compared to direct merchant service providers that may receivetwo to three times that rate for a portfolio with similar risk characteristics. However, we believe that ouracquiring bank model represents less risk for Esquire Bank.
Deposit Funding
Deposits are our primary source of funds to support our earning assets and growth. We offerdepository products, including checking, savings, money market and certificates of deposit with a variety ofrates. Deposits are insured by the FDIC up to statutory limits. Our unique low cost core deposit model isprimarily driven by escrow and operating accounts from law firms and other litigation settlements on anational basis, representing more than 70% of the $448.5 million in total deposits at December 31, 2017.Our core deposits (excluding time deposits) represent 94.0% of our total deposits at December 31, 2017.Our total cost of deposits is 0.13% at December 31, 2017, anchored by our noninterest bearing demanddeposits and attorney escrow funds representing 42.6% and 33.5%, respectively, of total deposits. Werequire deposit balances associated with our commercial loan arrangements and cash managementrelationships maintained by our commercial lending. We do not use a traditional “brick and mortar”branch network to support our deposit growth and have only one branch, located in Garden City, NewYork. The vast majority of our customers utilize our on-line cash management technology to manage theiroperating and escrow accounts across the country. We continue to experience significant growth in our masstort business banking with off-balance sheet sweeps totaling $478.0 million at December 31, 2017.
Deposits have traditionally been our primary source of funds for use in lending and investmentactivities and we do not utilize borrowings as a significant funding source. Besides generating deposits fromlaw firms and litigation settlements, we also generate deposits from our merchant services platform andother local businesses, individuals through client referrals and other relationships and through our singleretail branch. We believe we have a very stable core deposit base due primarily to the litigation marketstrategy as we strongly encourage and are successful in having law firm borrowers maintain their operatingand escrow banking relationship with us. Our low cost of funds is due to our deposit compositionconsisting of approximately 94.0% in transaction accounts at December 31, 2017. Our deposit strategyprimarily focuses on developing borrowing and other service orientated relationships with customers ratherthan competing with other institutions on rate. We have established deposit concentration thresholds toavoid the possibility of dependence on any single depositor base for funds.
8
Credit Risk Management
We control credit risk both through disciplined underwriting of each transaction, as well as activecredit management processes and procedures to manage risk and minimize loss throughout the life of atransaction. We seek to maintain a broadly diversified loan portfolio in terms of type of customer, type ofloan product, geographic area and industries in which our business customers are engaged. We havedeveloped tailored underwriting criteria and credit management processes for each of the various loanproduct types we offer our customers.
Underwriting. In evaluating each potential loan relationship, we adhere to a disciplined underwritingevaluation process including but not limited to the following:
• understanding the customer’s financial condition and ability to repay the loan;
• verifying that the primary and secondary sources of repayment are adequate in relation to theamount and structure of the loan;
• observing appropriate loan to value guidelines for collateral secured loans;
• maintaining our targeted levels of diversification for the loan portfolio, both as to type ofborrower and geographic location of collateral; and
• ensuring that each loan is properly documented with perfected liens on collateral.
Commercial Loans. These loans are typically made on the basis of the borrower’s ability to makerepayments from the cash flow of the borrower’s business and the collateral securing these loans mayfluctuate in value. Our commercial loans are originated based on the identified cash flow of the borrowerand on the underlying collateral provided by the borrower. Most often, this collateral consists of the caseinventory of the law firm (borrowing base) and, to a lesser extent, accounts receivable or equipment.
• Commercial Attorney-Related Loans (working capital lines of credit, case cost lines of credit, andterm loans). We perform the underwriting criteria typical for commercial business loans(generally, but not limited to three years of tax returns, three years of financial data, cash flows,partner guarantees, partner personal financials and credit history, background checks, etc.). Wealso review the firm’s case inventory to ascertain the value of their future receivables. Typically, atleast three years of successful experience in plaintiff practice are required. Working capital lines ofcredit and case cost lines of credit are floating rate, prime-based loans. The proceeds of a CaseCost loan can only be used against case expenses. These loans are subject to a general securityagreement evidenced by UCC-1 filing on all assets of the borrower, including but not limited tocase inventory, accounts receivable, fixtures and deposits where applicable. A key component ofthe underwriting process is an evaluation of the pending cases of an applicant law firm todetermine the probability and amount of future settlements. These loans are based on aborrowing base that was developed by us whereby a law firm’s case inventory is segmented intovarious stages and evaluated.
Consumer Loans. Consumer loans primarily consist of our Consumer Attorney-Related Loans,which include post-settlement consumer loans and structured settlement loans. Other consumer loansoriginated to individuals for debt consolidation, home repairs, home improvement or other consumerpurchases, are generally dependent on the credit quality of the individual borrower and may be secured orunsecured. To ensure the value of the settlement amount and likelihood and timeframe of payout, werequire an executed settlement agreement or an affidavit of attorney attesting to the existence of anaccepted offer. Post-settlement consumer loans are generally for one year terms with extensions grantedbased on acceptable supporting documentation regarding case status and viability, at Esquire Bank’sdiscretion. Structured settlement loans are generally for terms of three, five or seven years. As thesettlements are court ordered, the risks of settlements being renegotiated after we have made the loans areminimal.
• Post-Settlement Consumer Loans. Post-settlement consumer loans are fully-secured by theproceeds from the settlement and are generated from our internal sales force or from third partybrokers. An executed settlement agreement is a prerequisite for such loans, and the loan-to-value(“LTV”) ratio is generally limited to 50% of the net settlement amount due to the borrower.
9
• Structured Settlement Loans. Structured settlement loans are structured such that the annuityprovider (a highly rated insurance company) is directed by the court, at the request of theborrower, to deposit the borrower’s payments into an account designated by us. Loan paymentsare then automatically deducted from the annuity payment.
1 – 4 Family Residential Loans. Residential mortgage loans are originated or purchased for bothprimary and secondary residences, generally with fixed rates and 30-year or 15-year terms. Adjustable-ratemortgages (“ARMs”) are purchased or originated as 1 year ARMs, 5/1 ARMs, or 7/1 ARMs. We performan extensive credit history review for each borrower. Second homes or investment properties are subject toadditional requirements. Debt-to-income (“DTI”) and debt service coverage, if applicable, ratios generallyconform to industry standards for conforming loans. Flood insurance, title insurance and fire/hazardinsurance are mandatory for all applications, as appropriate.
Commercial Real Estate and Multifamily Loans. Loans secured by commercial and multifamily realestate generally have larger balances and involve a greater degree of risk than 1 – 4 family residentialmortgage loans. Of primary concern in commercial and multifamily real estate lending is the borrower’screditworthiness and the feasibility and cash flow potential of the project. Payments on loans secured byincome properties often depend on successful operation and management of the properties. As a result,repayment of such loans may be subject to a greater extent than residential real estate loans, to adverseconditions in the real estate market or the economy.
In approving a commercial or multifamily real estate loan, we consider and review a global cash flowanalysis of the borrower and consider the net operating income of the property, the borrower’s expertise,credit history and profitability and the value of the underlying property. Maximum LTV ratios are 80% ofappraised value and we generally require that the properties securing these real estate loans have minimumdebt service ratios (the ratio of earnings before debt service to debt service) of 115%. Loan terms arefifteen years or less with the option to extend another five years and amortization is based on a 25 – 30 yearschedule or less. An environmental phase one report is obtained when the possibility exists that hazardousmaterials may have existed on the site, or the site may have been impacted by adjoining properties thathandled hazardous materials. To monitor cash flows on income properties, we require borrowers and loanguarantors, if any, to provide annual financial statements on commercial and multifamily real estate loans.
Construction Loans. Construction lending involves additional risks when compared with permanentresidential lending because funds are advanced upon the security of the project, which is of uncertain valueprior to its completion. This type of lending also typically involves higher loan principal amounts and isoften concentrated with a small number of builders. In addition, generally during the term of aconstruction loan, interest may be funded by the borrower or disbursed from an interest reserve set asidefrom the construction loan budget. These loans often involve the disbursement of substantial funds withrepayment substantially dependent on the success of the ultimate project and the ability of the borrower tosell or lease the property or obtain permanent take-out financing, rather than the ability of the borrower orguarantor to repay principal and interest. Our construction loans are based upon estimates of costs andvalues associated with the completed project. Underwriting is focused on the borrowers’ financial strength,credit history and demonstrated ability to produce a quality product and effectively market and managetheir operations.
Loan Approval Authority. Our lending activities follow written, non-discriminatory, underwritingstandards and loan origination procedures established by our Board of Directors and management. Wehave established several levels of lending authority that have been delegated by the Board of Directors tothe Directors Loan Committee, the Chief Lending Officer and other personnel in accordance with theLending Authority in the Loan Policy. Authority limits are based on the total exposure of the borrower andare conditioned on the loan conforming to the policies contained in the Loan Policy. Any Loan Policyexceptions are fully disclosed to the approving authority.
Loans to One Borrower. In accordance with loans-to-one-borrower regulations, the Bank is generallylimited to lending no more than 15% of its unimpaired capital and unimpaired surplus to any one borroweror borrowing entity. This limit may be increased by an additional 10% for loans secured by readilymarketable collateral having a market value, as determined by reliable and continuously available price
10
quotations, at least equal to the amount of funds outstanding. To qualify for this additional 10% the bankmust perfect a security interest in the collateral and the collateral must have a market value at all times of atleast 100% of the loan amount that exceeds the 15% general limit. At December 31, 2017, our regulatorylimit on loans-to-one borrower was $10.2 million.
Management understands the importance of concentration risk and continuously monitors to ensurethat portfolio risk is balanced between such factors as loan type, industry, geography, collateral, structure,maturity and risk rating, among other things. Our Loan Policy establishes detailed concentration limits andsub limits by loan type and geography.
Ongoing Credit Risk Management. In addition to the tailored underwriting process described above,we perform ongoing risk monitoring and review processes for all credit exposures. Although we grade andclassify our loans internally, we have an independent third party professional firm perform regular loanreviews to confirm loan classifications. We strive to identify potential problem loans early in an effort toaggressively seek resolution of these situations before the loans create a loss, record any necessarycharge-offs promptly and maintain adequate allowance levels for probable loan losses incurred in the loanportfolio.
In general, whenever a particular loan or overall borrower relationship is downgraded to pass-watch orsubstandard based on one or more standard loan grading factors, our credit officers engage in activeevaluation of the asset to determine the appropriate resolution strategy. Management regularly reviews thestatus of the watch list and classified assets portfolio as well as the larger credits in the portfolio.
In addition to our general credit risk management processes, we employ additional risk managementprocesses and procedures for our commercial loans to law firms. We require borrowing base updates at leastannually and also engage in active review and monitoring of the borrowing base collateral itself, includingfield audits.
Investments
We manage our investments primarily for liquidity purposes, with a secondary focus on returns.Substantially all of our investments are classified as available-for-sale and can be used to collateralizeFederal Home Loan Bank of New York (FHLB) borrowings, FRB borrowings, public funds deposits orother borrowings. At December 31, 2017, our investment portfolio had a fair value of $128.8 million, andconsisted primarily of U.S. Government Agency collateralized mortgage obligations and mortgage-backedsecurities.
Our investment objectives are primarily to provide and maintain liquidity, establish an acceptable levelof interest rate risk, to provide a use of funds when demand for loans is weak and to generate a favorablereturn. Our board of directors has the overall responsibility for the investment portfolio, including approvalof our investment policy. The Asset Liability Committee (ALCO) and management are responsible forimplementation of the investment policy and monitoring our investment performance. The Board ofDirectors reviews the status of our investment portfolio monthly.
We are required to maintain an investment in FHLB stock, which investment is based primarily on thelevel of our FHLB borrowings. Additionally, we are required to maintain an investment in Federal ReserveBank of New York stock equal to six percent of our capital and surplus. While we have the authority underapplicable law to invest in derivative securities, we had no investments in derivative securities atDecember 31, 2017.
Borrowings
We maintain diverse funding sources including borrowing lines at the FHLB, two financial institutionsand the Federal Reserve Bank discount window. Although we do not utilize borrowings as a significantfunding source, we have from time to time utilized advances from the FHLB to supplement our supply ofinvestable funds. The FHLB functions as a central reserve bank providing credit for its member financialinstitutions. As a member, we are required to own capital stock in the FHLB and are authorized to applyfor advances on the security of such stock and certain of our whole first mortgage loans and other assets(principally securities which are obligations of, or guaranteed by, the United States), provided certain
11
standards related to creditworthiness have been met. Advances are made under several different programs,each having its own interest rate and range of maturities. Depending on the program, limitations on theamount of advances are based either on a fixed percentage of an institution’s net worth or on the FederalHome Loan Bank’s assessment of the institution’s creditworthiness. As of December 31, 2017, we had$103.4 million of available borrowing capacity with the FHLB. We also had an available line of credit withthe Federal Reserve Bank of New York discount window of $19.4 million. The other borrowing lines aremaintained primarily for contingency funding sources. No amounts were outstanding on any of theaforementioned lines as of December 31, 2017.
Personnel
As of December 31, 2017, we had 61 full-time employees, none of whom are represented by a collectivebargaining unit. We believe we have a good working relationship with our employees.
Subsidiaries
Esquire Bank, National Association is the sole subsidiary of Esquire Financial Holdings, Inc. andthere are no subsidiaries of Esquire Bank, National Association.
Supervision and Regulation
General
Esquire Bank is a national bank organized under the laws of the United States of America and itsdeposits are insured to applicable limits by the Deposit Insurance Fund (the “DIF”). The lending,investment, deposit-taking, and other business authority of Esquire Bank is governed primarily by federallaw and regulations and Esquire Bank is prohibited from engaging in any operations not authorized by suchlaws and regulations. Esquire Bank is subject to extensive regulation, supervision and examination by, andthe enforcement authority of, the Office of the Comptroller of the Currency (the “OCC”), and to a lesserextent by the FDIC, as its deposit insurer, as well as by the FRB. Esquire Bank is also subject to federalfinancial consumer protection and fair lending laws and regulations of the Consumer Financial ProtectionBureau, though the OCC is responsible for examining and supervising the bank’s compliance with theselaws. The regulatory structure establishes a comprehensive framework of activities in which a national bankmay engage and is primarily intended for the protection of depositors, customers and the DIF. Theregulatory structure gives the regulatory agencies extensive discretion in connection with their supervisoryand enforcement activities and examination policies, including policies with respect to the classification ofassets and the establishment of adequate loan loss reserves for regulatory purposes.
Esquire Financial Holdings, Inc. is a bank holding company, due to its control of Esquire Bank, and istherefore subject to the requirements of the BHC Act and regulation and supervision by the FRB. TheCompany files reports with and is subject to periodic examination by the FRB.
Any change in the applicable laws and regulations, whether by the OCC, the FDIC, the FRB orthrough legislation, could have a material adverse impact on Esquire Bank and the Company and theiroperations and the Company’s stockholders.
The Dodd-Frank Act made extensive changes in the regulation of insured depository institutions.Among other things, the Dodd-Frank Act (i) created a new Consumer Financial Protection Bureau as anindependent bureau to assume responsibility for the implementation of the federal financial consumerprotection and fair lending laws and regulations, a function previously assigned to prudential regulators;(although institutions of less than $10 billion in assets, such as Esquire Bank, continue to be examined forcompliance with consumer protection and fair lending laws and regulations by, and be subject to theprimary enforcement authority of their primary federal bank regulator rather than the Consumer FinancialProtection Bureau); (ii) directed changes in the way that institutions are assessed for deposit insurance;(iii) mandated the revision of regulatory capital requirements; (iv) codified the FRB’s long-standing policythat a bank holding company must serve as a source of financial and managerial strength for its subsidiarybanks; (v) required regulations requiring originators of certain securitized loans to retain a percentage ofthe risk for the transferred loans; (vi) stipulated regulatory rate-setting for certain debit card interchange
12
fees; (vii) repealed restrictions on the payment of interest on commercial demand deposits; (viii) enacted theso-called Volcker Rule, which general prohibits banking organizations from engaging in proprietary tradingand from investing in, sponsoring or having certain relationships with hedge funds and (ix) contained anumber of reforms related to mortgage originations.
Many of the provisions of the Dodd-Frank Act had delayed effective dates and/or required theissuance of implementing regulations. The regulatory process is ongoing and the impact on operationscannot yet be fully assessed. However, the Dodd-Frank Act has, and will likely continue to cause increasedregulatory burden, compliance costs and interest expense for the Company and Esquire Bank.
What follows is a summary of some of the laws and regulations applicable to Esquire Bank andEsquire Financial Holdings. The summary is not intended to be exhaustive and is qualified in its entirety byreference to the actual laws and regulations.
Esquire Bank, National Association
Loans and Investments
National banks have authority to originate and purchase any type of loan, including commercial,commercial real estate, residential mortgages or consumer loans. Aggregate loans by a national bank to anysingle borrower or group of related borrowers are generally limited to 15% of Esquire Bank’s capital andsurplus, plus an additional 10% if secured by specified readily marketable collateral.
Federal law and OCC regulations limit Esquire Bank’s investment authority. Generally, a national bankis prohibited from investing in corporate equity securities for its own account other than companies throughwhich the bank conducts its business. Under OCC regulations, a national bank may invest in investmentsecurities up to specified limits depending upon the type of security. “Investment securities” are generallydefined as marketable obligations that are investment grade and not predominantly speculative in nature.The OCC classifies investment securities into five different types and, depending on its type, a national bankmay have the authority to deal in and underwrite the security. The OCC has also permitted national banksto purchase certain noninvestment grade securities that can be reclassified and underwritten as loans.
Lending Standards
The federal banking agencies adopted uniform regulations prescribing standards for extensions ofcredit that are secured by liens or interests in real estate or made for the purpose of financing permanentimprovements to real estate. Under these regulations, all insured depository institutions, such as EsquireBank, must adopt and maintain written policies establishing appropriate limits and standards for extensionsof credit that are secured by liens or interests in real estate or are made for the purpose of financingpermanent improvements to real estate. These policies must establish loan portfolio diversificationstandards, prudent underwriting standards (including loan-to-value limits) that are clear and measurable,loan administration procedures, and documentation, approval and reporting requirements. The real estatelending policies must reflect consideration of the federal bank regulators’ Interagency Guidelines for RealEstate Lending Policies that have been adopted.
Federal Deposit Insurance
Deposit accounts at Esquire Bank are insured by the FDIC’s DIF. Effective July 22, 2010, theDodd-Frank Act permanently raised the deposit insurance available on all deposit accounts to $250,000with a retroactive effective date of January 1, 2008.
Under the FDIC’s risk-based assessment system, insured institutions were assigned a risk categorybased on supervisory evaluations, regulatory capital levels and certain other factors. An institution’s ratedepended upon the category to which it is assigned, and certain adjustments specified by FDIC regulations.Institutions deemed less risky pay FDIC assessments. The Dodd-Frank Act required the FDIC to revise itsprocedures to base its assessments upon each insured institution’s total assets less tangible equity instead ofdeposits. The FDIC finalized a rule, effective April 1, 2011, that set the assessment range at 2.5 to 45 basispoints of total assets less tangible equity. Effective July 1, 2016, the FDIC adopted changes that eliminatedthe risk categories and base assessments for most banks on financial measures and supervisory ratings
13
derived from statistical modeling estimating the probability of failure over three years. In conjunction withthe DIF reserve ratio achieving 1.5%, the assessment range (inclusive of possible adjustments) was alsoreduced for most banks to 1.5 basis points to 30 basis points of total assets less tangible equity.
The FDIC may adjust its assessment scale uniformly, except that no adjustment can deviate more thantwo basis points from the base scale without notice and comment. No insured institution may pay adividend if in default of the federal deposit insurance assessment.
The FDIC may terminate deposit insurance upon a finding that an institution has engaged in unsafe orunsound practices, is in an unsafe or unsound condition to continue operations or has violated anyapplicable law, regulation, rule, order or condition imposed by the FDIC. We do not know of any practice,condition or violation that might lead to termination of Esquire Bank’s deposit insurance.
In addition to the FDIC assessments, the Financing Corporation (FICO) is authorized to impose andcollect, through the FDIC as collection agent, assessments for anticipated payments, issuance costs andcustodial fees on bonds issued by the FICO in the 1980s to recapitalize the now defunct Federal Savings andLoan Insurance Corporation. The bonds issued by the FICO are due to mature in 2017 through 2019.
Capitalization
Federal regulations require FDIC insured depository institutions, including national banks, to meetseveral minimum capital standards: a common equity Tier 1 capital to risk-based assets ratio, a Tier 1capital to risk-based assets ratio, a total capital to risk-based assets and a Tier 1 capital to total assetsleverage ratio. The existing capital requirements were effective January 1, 2015 and are the result of a finalrule implementing regulatory amendments based on recommendations of the Basel Committee on BankingSupervision and certain requirements of the Dodd-Frank Act.
The capital standards require the maintenance of common equity Tier 1 capital, Tier 1 capital andtotal capital to risk-weighted assets of at least 4.5%, 6% and 8%, respectively, and a leverage ratio of at least4% Tier 1 capital. Common equity Tier 1 capital is generally defined as common stockholders’ equity andretained earnings. Tier 1 capital is generally defined as common equity Tier 1 and Additional Tier 1 capital.Additional Tier 1 capital generally includes certain noncumulative perpetual preferred stock and relatedsurplus and minority interests in equity accounts of consolidated subsidiaries. Total capital includes Tier 1capital (common equity Tier 1 capital plus Additional Tier 1 capital) and Tier 2 capital. Tier 2 capital iscomprised of capital instruments and related surplus meeting specified requirements, and may includecumulative preferred stock and long-term perpetual preferred stock, mandatory convertible securities,intermediate preferred stock and subordinated debt. Also included in Tier 2 capital is the allowance for loanand lease losses limited to a maximum of 1.25% of risk-weighted assets and, for institutions that haveexercised an opt-out election regarding the treatment of Accumulated Other Comprehensive Income(“AOCI”), up to 45% of net unrealized gains on available-for-sale equity securities with readily determinablefair market values. Institutions that have not exercised the AOCI opt-out have AOCI incorporated intocommon equity Tier 1 capital (including unrealized gains and losses on available-for-sale-securities). Weexercised the opt-out election regarding the treatment of AOCI. Calculation of all types of regulatorycapital is subject to deductions and adjustments specified in the regulations.
In determining the amount of risk-weighted assets for purposes of calculating risk-based capital ratios,a bank’s assets, including certain off-balance sheet assets (e.g., recourse obligations, direct credit substitutes,residual interests), are multiplied by a risk weight factor assigned by the regulations based on perceivedrisks inherent in the type of asset. Higher levels of capital are required for asset categories believed topresent greater risk. For example, a risk weight of 0% is assigned to cash and U.S. government securities, arisk weight of 50% is generally assigned to prudently underwritten first lien 1 – 4 family residentialmortgages, a risk weight of 100% is assigned to commercial and consumer loans, a risk weight of 150% isassigned to certain past due loans and a risk weight of between 0% to 600% is assigned to permissibleequity interests, depending on certain specified factors.
In addition to establishing the minimum regulatory capital requirements, the regulations limit capitaldistributions and certain discretionary bonus payments to management if the institution does not hold a“capital conservation buffer” consisting of 2.5% of common equity Tier 1 capital to risk-weighted assets
14
above the amount necessary to meet its minimum risk-based capital requirements. The capital conservationbuffer requirement is being phased in beginning January 1, 2016 at 0.625% of risk-weighted assets andincreasing each year until fully implemented at 2.5% on January 1, 2019.
On November 2, 2012, the OCC notified Esquire Bank that it had established minimum capital ratiosfor Esquire Bank requiring Esquire Bank to maintain, commencing December 1, 2012, a Tier 1 leveragecapital ratio of 9.0%, a Tier 1 risk-based capital ratio of 11.0% and a total risk-based capital torisk-weighted assets ratio of 13.0%.
Safety and Soundness StandardsEach federal banking agency, including the OCC, has adopted guidelines establishing general standards
relating to internal controls, information and internal audit systems, loan documentation, creditunderwriting, interest rate exposure, asset growth, asset quality, earnings, compensation, fees and benefitsand information security standards. In general, the guidelines require appropriate systems and practices toidentify and manage the risks and exposures specified in the guidelines. The guidelines prohibit excessivecompensation as an unsafe and unsound practice and describe compensation as excessive when theamounts paid are unreasonable or disproportionate to the services performed by an executive officer,employee, director, or principal stockholder. The FDIC also has issued guidance on risks banks may facefrom third party relationships (e.g. relationships under which the third party provides services to the bank).The guidance generally requires the bank to perform adequate due diligence on the third party,appropriately document the relationship, and perform adequate oversight and auditing, in order to the limitthe risks to the bank.
Prompt Corrective Regulatory ActionFederal law requires that federal bank regulatory authorities take “prompt corrective action” with
respect to institutions that do not meet minimum capital requirements. For these purposes, the statuteestablishes five capital tiers: well capitalized, adequately capitalized, undercapitalized, significantlyundercapitalized and critically undercapitalized.
National banks that have insufficient capital are subject to certain mandatory and discretionarysupervisory measures. For example, a bank that is “undercapitalized” (i.e. fails to comply with anyregulatory capital requirement) is subject to growth limitations and is required to submit a capitalrestoration plan; a holding company that controls such a bank is required to guarantee that the bankcomplies with the restoration plan. A “significantly undercapitalized” bank is subject to additionalrestrictions. National banks deemed by the OCC to be “critically undercapitalized” are subject to theappointment of a receiver or conservator.
The final rule that increased regulatory capital standards also adjusted the prompt corrective actiontiers as of January 1, 2015 to conform to the new capital standards. The various categories now incorporatethe newly adopted common equity Tier 1 capital requirement, an increase in the Tier 1 to risk-based assetsrequirement and other changes. Under the revised prompt corrective action requirements, insureddepository institutions are required to meet the following in order to qualify as “well capitalized:” (1) acommon equity Tier 1 risk-based capital ratio of 6.5% (new standard); (2) a Tier 1 risk-based capital ratioof 8% (increased from 6%); (3) a total risk-based capital ratio of 10% (unchanged) and (4) a Tier 1 leverageratio of 5% (unchanged).
DividendsUnder federal law and applicable regulations, a national bank may generally declare a cash dividend,
without approval from the OCC, in an amount equal to its year-to-date net income plus the prior two years’net income that is still available for cash dividend. Cash dividends exceeding those amounts requireapplication to and approval by the OCC. To pay a cash dividend, a national bank must also maintain anadequate capital conservation buffer under the capital rules discussed above.
Transactions with Affiliates and InsidersSections 23A and 23B of the Federal Reserve Act govern transactions between a national bank and its
affiliates, which includes the Company. The FRB has adopted Regulation W, which implements andinterprets Sections 23A and 23B, in part by codifying prior FRB interpretations.
15
An affiliate of a bank is any company or entity that controls, is controlled by or is under commoncontrol with the bank. A subsidiary of a bank that is not also a depository institution or a “financialsubsidiary” under federal law is not treated as an affiliate of the bank for the purposes of Sections 23A and23B; however, the OCC has the discretion to treat subsidiaries of a bank as affiliates on a case-by-case basis.Section 23A limits the extent to which a bank or its subsidiaries may engage in “covered transactions” withany one affiliate to 10% of the bank’s capital stock and surplus. There is an aggregate limit of 20% of thebank’s capital stock and surplus for such transactions with all affiliates. The term “covered transaction”includes, among other things, the making of a loan to an affiliate, a purchase of assets from an affiliate, theissuance of a guarantee on behalf of an affiliate and the acceptance of securities of an affiliate as collateralfor a loan. All such transactions are required to be on terms and conditions that are consistent with safeand sound banking practices and no transaction may involve the acquisition of any “low quality asset”from an affiliate. Certain covered transactions, such as loans to or guarantees on behalf of an affiliate, mustbe secured by collateral in amounts ranging from 100 to 130 percent of the loan amount, depending uponthe type of collateral. In addition, Section 23B requires that any covered transaction (and specified othertransactions) between a bank and an affiliate must be on terms and conditions that are substantially thesame, or at least as favorable, to the bank, as those that would be provided to a non-affiliate.
A bank’s loans to its executive officers, directors, any owner of more than 10% of its stock (each, an“insider”) and certain entities affiliated with any such person (an insider’s “related interest”) are subject tothe conditions and limitations imposed by Section 22(h) of the Federal Reserve Act and the FRB’sRegulation O. The aggregate amount of a bank’s loans to any insider and the insider’s related interests maynot exceed the loans-to-one-borrower limit applicable to national banks. Aggregate loans by a bank to itsinsiders and insiders’ related interests may not exceed the bank’s unimpaired capital and unimpairedsurplus. With certain exceptions, such as education loans and certain residential mortgages a bank’s loans toits executive officers, may not exceed the greater of $25,000 or 2.5% of the bank’s unimpaired capital andunimpaired surplus, but in no event more than $100,000. Regulation O also requires that any loan to aninsider or a related interest of an insider be approved in advance by a majority of the board of directors ofthe bank, with any interested director not participating in the voting, if the loan, when aggregated with anyexisting loans to that insider or the insider’s related interests, would exceed the lesser or $500,000 or 5% ofthe bank’s unimpaired capital and surplus. Generally, such loans must be made on substantially the sameterms as, and follow credit underwriting procedures that are no less stringent than, those that are prevailingat the time for comparable transactions with other persons and must not present more than a normal risk ofcollectability. An exception is made for extensions of credit made pursuant to a benefit or compensationplan of a bank that is widely available to employees of the bank and that does not give any preference toinsiders of the bank over other employees of the bank.
Enforcement
The OCC has extensive enforcement authority over national banks to correct unsafe or unsoundpractices and violations of law or regulation. Such authority includes the issuance of cease and desistorders, assessment of civil money penalties and removal of officers and directors. The OCC may alsoappoint conservator or receiver for a national bank under specified circumstances, such as where (i) thebank’s assets are less than its obligations to creditors, (ii) the bank is likely to be unable to pay itsobligations or meet depositors’ demands in the normal course of business or (iii) a substantial dissipation ofbank assets or earnings has occurred due to a violation of law of regulation or unsafe or unsound practices.
Federal Reserve System
Under FRB regulations, Esquire Bank is required to maintain reserves at the Federal Reserve Bankagainst its transaction accounts, including checking and NOW accounts. The regulations currently requirethat reserves of 3% be maintained against aggregate transaction accounts over $16.0 million and 10%against that portion of total transaction accounts in excess of $122.3 million. The first $16.0 million ofotherwise reservable balances are exempted from the reserve requirements. The Bank is in compliance withthese requirements. The requirements are adjusted annually by the FRB. The FRB began paying interest onreserves in 2008, currently 1.50%.
16
Examinations and Assessments
Esquire Bank is required to file periodic reports with and is subject to periodic examination by theOCC. Federal regulations generally require periodic on-site examinations for all depository institutions.Esquire Bank is required to pay an annual assessment to the OCC to fund the agency’s operations.
Community Reinvestment Act and Fair Lending Laws
Under the CRA, Esquire Bank has a continuing and affirmative obligation consistent with its safe andsound operation to help meet the credit needs of its entire community, including low and moderate incomeneighborhoods. The CRA does not establish specific lending requirements or programs for financialinstitutions nor does it limit an institution’s discretion to develop the types of products and services that itbelieves are best suited to its particular community. The CRA requires the OCC to assess its record ofmeeting the credit needs of its community and to take that record into account in its evaluation of certainapplications by Esquire Bank. For example, the regulations specify that a bank’s CRA performance will beconsidered in its expansion (e.g., branching or merger) proposals and may be the basis for approving,denying or conditioning the approval of an application. As of the date of its most recent OCC evaluation,Esquire Bank was rated “satisfactory” with respect to its CRA compliance.
USA PATRIOT Act and Money Laundering
Esquire Bank is subject to the federal Bank Secrecy Act (the “BSA”), which incorporates several laws,including the Uniting and Strengthening America by Providing Appropriate Tools Required to Interceptand Obstruct Terrorism Act of 2001, or the USA PATRIOT Act and related regulations. The USAPATRIOT Act gives the federal government powers to address money laundering and terrorist threatsthrough enhanced domestic security measures, expanded surveillance powers, increased informationsharing, and broadened anti-money laundering requirements. By way of amendments to the Bank SecrecyAct, Title III of the USA PATRIOT Act implemented measures intended to encourage information sharingamong bank regulatory agencies and law enforcement bodies. Further, certain provisions of Title III imposeaffirmative obligations on a broad range of financial institutions, including banks, thrifts, brokers, dealers,credit unions, money transfer agents and parties registered under the Commodity Exchange Act.
Among other things, Title III of the USA PATRIOT Act and the related regulations require:
• Establishment of anti-money laundering compliance programs that includes policies, procedures,and internal controls; the appointment of an anti-money laundering compliance officer; a trainingprogram; and independent testing;
• Filing of certain reports to FinCEN and law enforcement that are designated to assist in thedetection and prevention of money laundering and terrorist financing activities;
• Establishment of a program specifying procedures for obtaining and maintaining certain recordsfrom customers seeking to open new accounts, including verifying the identity of customers;
• In certain circumstances, compliance with enhanced due diligence policies, procedures andcontrols designed to detect and report money-laundering, terrorist financing and other suspiciousactivity;
• Monitoring account activity for suspicious transactions; and
• A heightened level of review for certain high risk customers or accounts.
The USA PATRIOT Act also includes prohibitions on correspondent accounts for foreign shell banksand requires compliance with record keeping obligations with respect to correspondent accounts of foreignbanks.
The bank regulatory agencies have increased the regulatory scrutiny of the Bank Secrecy Act andanti-money laundering programs maintained by financial institutions. Significant penalties and fines, as wellas other supervisory orders may be imposed on a financial institution for non-compliance with theserequirements. In addition, the federal bank regulatory agencies must consider the effectiveness of financialinstitutions engaging in a merger transaction in combating money laundering activities.
17
Esquire Bank has adopted policies and procedures to comply with these requirements.
Privacy Laws
Esquire Bank is subject to a variety of federal and state privacy laws, which govern the collection,safeguarding, sharing and use of customer information. For example, the Gramm-Leach-Bliley Act requiresall financial institutions offering financial products or services to retail customers to provide such customerswith the financial institution’s privacy policy and provide such customers the opportunity to “opt out” ofthe sharing of certain personal financial information with unaffiliated third parties. It also requires banks tosafeguard personal information of consumer customers. Some state laws also protect the privacy ofinformation of state residents and require adequate security for such data.
Merchant Services
Esquire Bank is also subject to the rules of Visa, MasterCard and other payment networks in which itparticipates. If Esquire Bank fails to comply with such rules, the networks could impose fines or require usto stop providing merchant services for cards under such network’s brand or routed through such network.
Other Regulations
Esquire Bank’s operations are also subject to federal laws applicable to credit transactions, such as:
• The Truth-In-Lending Act, governing disclosures of credit terms to consumer borrowers;
• The Real Estate Settlement Procedures Act, requiring that borrowers for mortgage loans for 1 – 4family residential real estate receive various disclosures, including good faith estimates ofsettlement costs, lender servicing and escrow account practices, and prohibiting certain practicesthat increase the cost of settlement services;
• The Home Mortgage Disclosure Act, requiring financial institutions to provide information toenable the public and public officials to determine whether a financial institution is fulfilling itsobligation to help meet the housing needs of the community it serves;
• The Equal Credit Opportunity Act and other fair lending laws, prohibiting discrimination on thebasis of race, religion, sex and other prohibited factors in extending credit;
• The Fair Credit Reporting Act, governing the use of credit reports on consumers and theprovision of information to credit reporting agencies;
• Unfair or Deceptive Acts or Practices laws and regulations;
• The Fair Debt Collection Act, governing the manner in which consumer debts may be collected bycollection agencies; and
• The rules and regulations of the various federal agencies charged with the responsibility ofimplementing such federal laws.
The operations of Esquire Bank are further subject to the:
• The Truth in Savings Act, which specifies disclosure requirements with respect to depositaccounts;
• The Right to Financial Privacy Act, which imposes a duty to maintain confidentiality ofconsumer financial records and prescribes procedures for complying with administrativesubpoenas of financial records;
• The Electronic Funds Transfer Act and Regulation E promulgated thereunder, which governautomatic deposits to and withdrawals from deposit accounts and customers’ rights and liabilitiesarising from the use of automated teller machines and other electronic banking services; and
• The Check Clearing for the 21st Century Act (also known as “Check 21”), which gives “substitutechecks,” such as digital check images and copies made from that image, the same legal standing asthe original paper check.
18
Holding Company Regulation
The Company, as a bank holding company controlling Esquire Bank, is subject to regulation andsupervision by the FRB under the BHCA. The Company is periodically examined by, required to submitreports to the FRB and is required to comply with the FRB’s rules and regulations. Among other things,the FRB has authority to restrict activities by a bank holding company that are deemed to pose a seriousrisk to the subsidiary bank. The FRB has historically imposed consolidated capital adequacy guidelines forbank holding structured similar, but not identical, to those of the OCC for national banks. TheDodd-Frank Act directed the FRB to issue consolidated capital requirements for depository institutionholding companies that are no less stringent, both quantitatively and in terms of components of capital,than those applicable to institutions themselves. The previously discussed final rule regarding regulatorycapital requirements implemented the Dodd-Frank Act as to bank holding company capital standards.Consolidated regulatory capital requirements identical to those applicable to the subsidiary banks appliedto bank holding companies as of January 1, 2015. However, the FRB exempts from the consolidated capitalrequirements bank holding companies with less than $1 billion in assets, unless otherwise directed inspecific cases. Consequently, the Company is not currently subject to the consolidated holding companycapital requirements.
The policy of the FRB is that a bank holding company must serve as a source of financial andmanagerial strength to its subsidiary banks by providing capital and other support in times of distress. TheDodd-Frank Act codified the source of strength policy.
Under the prompt corrective action provisions of federal law, a bank holding company parent of anundercapitalized subsidiary bank is required to guarantee, within specified limits, the capital restorationplan that is required of an undercapitalized bank. If an undercapitalized bank fails to file an acceptablecapital restoration plan or fails to implement an accepted plan, the FRB may prohibit the bank holdingcompany parent of the undercapitalized bank from paying dividends or making any other capitaldistribution.
As a bank holding company, the Company is required to obtain the prior approval of the FRB toacquire more than 5% of a class of voting securities of any additional bank or bank holding company or toacquire all or substantially all, the assets of any additional bank or bank holding company. In evaluatingacquisition application, the FRB evaluates factors such as the financial condition, management resourcesand future prospects of the parties, the convenience and needs of the communities involved and competitivefactors. In addition, bank holding companies may generally only engage in activities that are closely relatedto banking as determined by the FRB. Bank holding companies that meet certain criteria may opt tobecome a financial holding company and thereby engage in a broader array of financial activities.
FRB policy is that a bank holding company should pay cash dividends only to the extent that thecompany’s net income for the past two years is sufficient to fund the dividends and the prospective rate ofearnings retention is consistent with the company’s capital needs, asset quality and overall financialcondition. In addition, FRB guidance sets forth the supervisory expectation that bank holding companieswill inform and consult with Federal Reserve Bank staff in advance of issuing a cash dividend that exceedsearnings for the quarter and should inform the Federal Reserve Bank and should eliminate, defer orsignificantly reduce dividends if (i) net income available to stockholders for the past four quarters, net ofdividends previously paid during that period, is not sufficient to fully fund the dividends, (ii) prospectiverate of earnings retention is not consistent with the bank holding company’s capital needs and overallcurrent and prospective financial condition, or (iii) the bank holding company will not meet, or is in dangerof not meeting, its minimum regulatory capital adequacy ratios.
A bank holding company is required to give the FRB prior written notice of any repurchase orredemption of its outstanding equity securities if the gross consideration for repurchase or redemption,when combined with the net consideration paid for all such repurchases or redemptions during thepreceding 12 months, will be equal to 10% or more of the company’s consolidated net worth. The FRB maydisapprove such a repurchase or redemption if it determines that the proposal would constitute an unsafeand unsound practice or violate a law or regulation. Such notice and approval is not required for a bankholding company that meets certain qualitative criteria. However, FRB guidance generally provides forbank holding company consultation with Federal Reserve Bank staff prior to engaging in a repurchase orredemption of a bank holding company’s stock, regardless of whether a formal written notice is required.
19
The above FRB requirements may restrict a bank holding company’s ability to pay dividends tostockholders or engage in repurchases or redemptions of its shares.
Acquisition of Control of the Company. Under the Change in Bank Control Act, no person mayacquire control of a bank holding company such as the Company unless the FRB has been prior writtennotice and has not issued a notice disapproving the proposed acquisition. In evaluating such notices, theFRB takes into consideration such factors as the financial resources, competence, experience and integrityof the acquirer, the future prospects the bank holding company involved and its subsidiary bank and thecompetitive effects of the acquisition. Control, as defined under federal law, means ownership, control of orholding irrevocable proxies representing more than 25% of any class of voting stock, control in any mannerof the election of a majority of the company’s directors, or a determination by the regulator that theacquiror has the power to direct, or directly or indirectly to exercise a controlling influence over, themanagement or policies of the institution. Acquisition of more than 10% of any class of a bank holdingcompany’s voting stock constitutes a rebuttable presumption of control under the regulations under certaincircumstances including where, is the case with the Company, the issuer has registered securities underSection 12 of the Securities Exchange Act of 1934.
Federal Securities Laws
Esquire Financial Holdings, Inc.’s common stock is registered with the Securities and ExchangeCommission. Consequently, Esquire Financial Holdings, Inc. is subject to the information, proxysolicitation, insider trading and other restrictions and requirements of the SEC under the SecuritiesExchange Act of 1934.
Emerging Growth Company Status
The Jumpstart Our Business Startups Act (the “JOBS Act”), which was enacted in April 2012, hasmade numerous changes to the federal securities laws to facilitate access to capital markets. Under the JOBSAct, a company with total annual gross revenues of less than $1.07 billion during its most recentlycompleted fiscal year qualifies as an “emerging growth company.” Esquire Financial Holdings, Inc. qualifiesas an emerging growth company under the JOBS Act.
An “emerging growth company” may choose not to hold stockholder votes to approve annualexecutive compensation (more frequently referred to as “say-on-pay” votes) or executive compensationpayable in connection with a merger (more frequently referred to as “say-on-golden parachute” votes). Anemerging growth company also is not subject to the requirement that its auditors attest to the effectivenessof the company’s internal control over financial reporting, and can provide scaled disclosure regardingexecutive compensation. Finally, an emerging growth company may elect to comply with new or amendedaccounting pronouncements in the same manner as a private company, but must make such election whenthe company is first required to file a registration statement. Such an election is irrevocable during theperiod a company is an emerging growth company. Esquire Financial Holdings, Inc. has elected to complywith new or amended accounting pronouncements in the same manner as a public company.
A company loses emerging growth company status on the earlier of: (i) the last day of the fiscal year ofthe company during which it had total annual gross revenues of $1.07 billion or more; (ii) the last day of thefiscal year of the issuer following the fifth anniversary of the date of the first sale of common equitysecurities of the company pursuant to an effective registration statement under the Securities Act of 1933;(iii) the date on which such company has, during the previous three-year period, issued more than$1.0 billion in non-convertible debt; or (iv) the date on which such company is deemed to be a “largeaccelerated filer” under Securities and Exchange Commission regulations (generally, at least $700 million ofvoting and non-voting equity held by non-affiliates).
Sarbanes-Oxley Act of 2002
The Sarbanes-Oxley Act of 2002 is intended to improve corporate responsibility, to provide forenhanced penalties for accounting and auditing improprieties at publicly traded companies and to protectinvestors by improving the accuracy and reliability of corporate disclosures pursuant to the securities laws.We have policies, procedures and systems designed to comply with these regulations, and we review anddocument such policies, procedures and systems to ensure continued compliance with these regulations.
20
ITEM 1A. Risk Factors
The material risks that management believes affect the Company are described below. You shouldcarefully consider the risks as described below, together with all of the information included herein. Therisks described below are not the only risks the Company faces. Additional risks not presently known alsomay have a material adverse effect on the Company’s results of operations and financial condition.
Risks Related to Our Business
We have a limited operating history and have recently experienced significant growth, which makes it difficultto forecast our revenue and evaluate our business and future prospects.
We have only been in existence since 2006, and in 2015, 2016 and 2017, we experienced significantgrowth following our initial public offering, a capital raise and the conversion from a savings and loanholding company with a savings bank subsidiary to a bank holding company with a national banksubsidiary. As a result of our limited operating history and recent accelerated growth, in particular in ourmerchant services business, our ability to forecast our future results of operations and plan for and modelfuture growth is limited and subject to a number of uncertainties. We have encountered and will continue toencounter risks and uncertainties frequently experienced by growing companies in the financial servicesindustry, such as the risks and uncertainties described herein. Accordingly, we may be unable to prepareaccurate internal financial forecasts and our results of operations in future reporting periods may be belowthe expectations of investors. If we do not address these risks successfully, our results of operations coulddiffer materially from our estimates and forecasts or the expectations of our stockholders, causing ourbusiness to suffer and our stock price to decline.
Because we intend to continue to increase our commercial loans, our credit risk may increase.
At December 31, 2017, our commercial loans totaled $136.4 million, or 39.2% of our total loans,including $127.7 million of Commercial Attorney-Related Loans, which represented 93.6% of ourcommercial loans. We intend to increase our originations of commercial loans, including our CommercialAttorney-Related Loans, which consist of working capital lines of credit, case cost lines of credit, termloans to law firms, and post-settlement commercial and other commercial attorney-related loans. Theseloans generally have more risk than 1 – 4 family residential mortgage loans and commercial loans securedby real estate. Since repayment of commercial loans, including our Commercial Attorney-Related Loans,depends on the successful receipt of settlement proceeds or the successful management and operation of theborrower’s businesses, repayment of such loans can be affected by adverse court decisions and adverseconditions in the local and national economy. Commercial Attorney-Related Loans present unique creditrisks in that attorney or law firm revenues can be volatile depending on the number of cases, the timing ofcourt decisions and the timing of the overall judicial process. In our experience, an average case can taketwo to four years to litigate. Determining the value of an attorney’s or law firm’s case inventory (borrowingbase) is also inherently an imprecise exercise. Though repayment of case lines is not dependent on afavorable case settlement, unfavorable outcomes can ultimately impact the cash flows of the borrower. Anadverse development with respect to one loan or one Commercial Attorney-Related Loan creditrelationship can expose us to significantly greater risk of loss compared to an adverse development withrespect to a 1 – 4 family residential mortgage loan or a commercial real estate loan.
Because we plan to continue to increase our originations of these loans, commercial loans generallyhave a larger average size as compared with other loans such as residential loans, and the collateral forcommercial loans is generally less readily-marketable, losses incurred on a small number of commercialloans could have a disproportionate and material adverse impact on our financial condition and results ofoperations.
A substantial portion of our business is dependent on the prospects of the legal industry and changes in thelegal industry may adversely affect our growth and profitability.
We depend on our relationships within the legal community and our products and services tailored tothe legal industry account for a significant source of our revenue. As we intend to focus our growth on ourAttorney-Related Loan products, changes in the legal industry, including a significant decrease in the
21
number of litigation cases in the United States, reform of the tort industry that reduces the ability ofplaintiffs to bring cases or reduces the damages plaintiffs can receive, or a significant increase in theunemployment rate for attorneys, could, individually or in the aggregate, have a material adverse effect onour profitability, financial condition and growth of our business.
A substantial portion of our loan portfolio consists of multifamily real estate loans and commercial real estateloans, which have a higher degree of risk than other types of loans.
At December 31, 2017, we had $98.4 million of multifamily loans and $24.8 million of commercial realestate loans. Multifamily and commercial real estate loans represented 35.4% of our total loan portfolio atDecember 31, 2017. Multifamily and commercial real estate loans are often larger and involve greater risksthan other types of lending. Because payments on such loans are often dependent on the successfuloperation or development of the property or business involved, repayment of such loans is often moresensitive than other types of loans to adverse conditions in the real estate market or the general businessclimate and economy. Accordingly, a downturn in the real estate market and a challenging business andeconomic environment may increase our risk related to multifamily and commercial real estate loans. Unlikeresidential mortgage loans, which generally are made on the basis of the borrower’s ability to makerepayment from their employment and other income and which are secured by real property whose valuetends to be more easily ascertainable, multifamily and commercial real estate loans typically are made on thebasis of the borrower’s ability to make repayment from the cash flow of the commercial venture. If the cashflow from business operations is reduced, the borrower’s ability to repay the loan may be impaired. Due tothe larger average size of each multifamily and commercial real estate loan as compared with other loanssuch as residential loans, as well as collateral that is generally less readily-marketable, losses incurred on asmall number of multifamily and commercial real estate loans could have a material adverse impact on ourfinancial condition and results of operations.
We expect to increase our originations of consumer loans, including post-settlement consumer and structuredsettlement loans, and such loans generally carry greater risk than loans secured by owner-occupied, 1 – 4family real estate, and these risks will increase as we continue to increase originations of these types of loans.
At December 31, 2017, our consumer loans totaled $31.9 million, or 9.2% of our total loan portfolio,of which $25.7 million, or 80.7%, were post-settlement consumer loans and $1.4 million, or 4.5%, werestructured settlement loans. Consumer loans typically have shorter terms, lower balances, higher yields andhigher risks of default than 1 – 4 family residential loans. Consumer loan collections are dependent on theborrower’s continuing financial stability and are therefore more likely to be affected by adverse personalcircumstances, such as a loss of employment or unexpected medical costs. While our ConsumerAttorney-Related Loans, which consist of post-settlement consumer and structured settlement loans, aretypically well secured by the settlement amount, we can still be exposed to the financial stability of theborrower as a result of unforeseen rulings or administrative legal anomalies with a particular borrower’ssettlement that eliminate or greatly reduce their settlement amount. Additionally, we have a concentrationin NFL loans which totaled $21.8 million or 85.3% of our total post-settlement loans. Furthermore, theapplication of various federal and state laws, including bankruptcy and insolvency laws, may limit ourability to recover on such loans. As we increase our originations of consumer loans, it may becomenecessary to increase our provision for loan losses in the event our losses on these loans increase, whichwould reduce our profits.
As a business operating in the financial services industry, our business and operations may be adverselyaffected in numerous and complex ways by weak economic conditions.
Our business and operations, which primarily consist of lending money to customers in the form ofloans, borrowing money from customers in the form of deposits and investing in securities, are sensitive togeneral business and economic conditions in the United States. If the U.S. economy weakens, our growthand profitability from our lending, deposit and investment operations could be constrained. Uncertaintyabout the federal fiscal policymaking process, the medium and long-term fiscal outlook of the federalgovernment, and future tax rates is a concern for businesses, consumers and investors in the United States.In addition, economic conditions in foreign countries could affect the stability of global financial markets,which could hinder U.S. economic growth. Weak economic conditions are characterized by deflation,
22
fluctuations in debt and equity capital markets, a lack of liquidity and/or depressed prices in the secondarymarket for mortgage loans, increased delinquencies on mortgage, consumer and commercial loans,residential and commercial real estate price declines and lower home sales and commercial activity. Thecurrent economic environment is also characterized by interest rates at historically low levels, which impactsour ability to attract deposits and to generate attractive earnings through our investment portfolio. All ofthese factors are detrimental to our business, and the interplay between these factors can be complex andunpredictable. Our business is also significantly affected by monetary and related policies of the U.S. federalgovernment and its agencies. Changes in any of these policies are influenced by macroeconomic conditionsand other factors that are beyond our control. Adverse economic conditions and government policyresponses to such conditions could have a material adverse effect on our business, financial condition,results of operations and prospects.
A substantial majority of our loans and operations are in New York, and therefore our business is particularlyvulnerable to a downturn in the New York City economy.
Unlike larger financial institutions that are more geographically diversified, a large portion of ourbusiness is concentrated primarily in the state of New York, and in New York City in particular. As ofDecember 31, 2017, 72.8% of our loan portfolio was in New York and our loan portfolio hadconcentrations of 58.5% in New York City. If the local economy, and particularly the real estate market,declines, the rates of delinquencies, defaults, foreclosures, bankruptcies and losses in our loan portfoliowould likely increase. As a result of this lack of diversification in our loan portfolio, a downturn in the localeconomy generally and real estate market specifically could significantly reduce our profitability and growthand adversely affect our financial condition.
Interest rate shifts may reduce net interest income and otherwise negatively impact our financial condition andresults of operations.
The majority of our banking assets are monetary in nature and subject to risk from changes in interestrates. Like most financial institutions, our earnings and cash flows depend to a great extent upon the levelof our net interest income, or the difference between the interest income we earn on loans, investments andother interest earning assets, and the interest we pay on interest bearing liabilities, such as deposits andborrowings. Changes in interest rates can increase or decrease our net interest income, because differenttypes of assets and liabilities may react differently, and at different times, to market interest rate changes.
When interest bearing liabilities mature or reprice more quickly, or to a greater degree than interestearning assets in a period, an increase in interest rates could reduce net interest income. Similarly, wheninterest earning assets mature or reprice more quickly, or to a greater degree than interest bearing liabilities,falling interest rates could reduce net interest income. Additionally, an increase in interest rates may, amongother things, reduce the demand for loans and our ability to originate loans and decrease loan repaymentrates. A decrease in the general level of interest rates may affect us through, among other things, increasedprepayments on our loan portfolio and increased competition for deposits. Accordingly, changes in the levelof market interest rates affect our net yield on interest earning assets, loan origination volume and ouroverall results. Although our asset-liability management strategy is designed to control and mitigateexposure to the risks related to changes in market interest rates, those rates are affected by many factorsoutside of our control, including governmental monetary policies, inflation, deflation, recession, changes inunemployment, the money supply, international disorder and instability in domestic and foreign financialmarkets.
Our small size makes it more difficult for us to compete.
Our small size makes it more difficult to compete with other financial institutions which are generallylarger and can more easily afford to invest in the marketing and technologies needed to attract and retaincustomers. Because our principal source of income is the net interest income we earn on our loans andinvestments after deducting interest paid on deposits and other sources of funds, our ability to generate therevenues needed to cover our expenses and finance such investments is limited by the size of our loan andinvestment portfolios. In addition, we compete with many larger financial institutions and other financialcompanies who operate in the merchant services business. Accordingly, we are not always able to offer new
23
products and services as quickly as our competitors. Our lower earnings also make it more difficult to offercompetitive salaries and benefits. As a smaller institution, we are also disproportionately affected by thecontinually increasing costs of compliance with new banking and other regulations.
We may not be able to grow, and if we do we may have difficulty managing that growth.
Our business strategy is to continue to grow our assets and expand our operations, including throughpotential strategic acquisitions. Our ability to grow depends, in part, upon our ability to expand our marketshare, successfully attract core deposits, and to identify loan and investment opportunities as well asopportunities to generate fee-based income. We can provide no assurance that we will be successful inincreasing the volume of our loans and deposits at acceptable levels and upon terms acceptable to us. Wealso can provide no assurance that we will be successful in expanding our operations organically or throughstrategic acquisition while managing the costs and implementation risks associated with this growthstrategy.
We expect to continue to experience growth in the number of our employees and customers and thescope of our operations. Our success will depend upon the ability of our officers and key employees tocontinue to implement and improve our operational and other systems, to manage multiple, concurrentcustomer relationships, and to hire, train and manage our employees. In the event that we are unable toperform all these tasks and meet these challenges effectively, including continuing to attract core deposits,our operations, and consequently our earnings, could be adversely impacted.
We rely heavily on our management team, our board of directors and our advisory board members and ourbusiness could be adversely affected by the unexpected loss of one or more of our officers or directors.
We are led by a management team with substantial experience in the markets that we serve and thefinancial products that we offer. Our operating strategy focuses on providing products and services throughlong-term relationship managers. Additionally, we rely heavily on our directors’ and our advisory boardmembers’ extensive business and personal contacts and relationships to help establish and maintain ourcustomer base. Accordingly, our success depends in large part on the performance of our key officers anddirectors, as well as on our ability to attract, motivate and retain highly qualified senior and middlemanagement. Competition for employees is intense, and the process of identifying key personnel with thecombination of skills and attributes required to execute our business plan may be lengthy. We may not besuccessful in retaining our key employees or directors and the unexpected loss of services of one or more ofour officers or directors could have a material adverse effect on our business because of their skills,knowledge of our market and financial products, years of industry experience, long-term business andcustomer relationships and the difficulty of finding qualified replacement personnel. If the services of anyof our key personnel should become unavailable for any reason, we may not be able to identify and hirequalified persons on terms acceptable to us, which could have an adverse effect on our business, financialcondition and results of operations.
Our merchants or ISOs may be unable to satisfy obligations for which we may ultimately be liable.
We are subject to the risk of our merchants or ISOs being unable to satisfy obligations for which wemay ultimately be liable. If we are unable to collect amounts due from a merchant or ISO because ofinsolvency or other reasons, we may bear the loss for those full amounts. We manage our credit risk andattempt to mitigate our risk by obtaining reserves, both from merchants and ISOs, and through othercontractual remedies. It is possible, however, that a default on such obligations by one or more of our ISOsor merchants, could, individually or in the aggregate, have a material adverse effect on our business,financial condition and results of operations.
Fraud by merchants or others could have a material adverse effect on our business and financial condition.
We may be subject to liability for fraudulent transactions initiated by merchants or others. Examples ofsuch fraud include when a merchant or other party knowingly uses a stolen or counterfeit card to make atransaction, or if a merchant intentionally fails to deliver the merchandise or services sold in an otherwisevalid transaction. Criminals are using increasingly sophisticated methods to engage in illegal activities such
24
as counterfeiting and fraud. It is possible that incidents of fraud could increase in the future. Failure toeffectively manage risk and prevent fraud would increase our chargeback liability or other liability.Increases in chargebacks or other liability could have a material adverse effect on our business, financialcondition, and results of operations.
Changes in card network rules or standards could adversely affect our business.
In order to provide our merchant services, we are members of the Visa and MasterCard networks. Assuch, we are subject to card network rules that could subject us or our ISOs and merchants to a variety offines or penalties that may be assessed on us, our ISOs, and our merchants. The termination of ourmembership, or the revocation of registration of any of our ISOs, or any changes in card network rules orstandards could increase the cost of operating our merchant servicer business or limit our ability to providemerchant services to or through our customers, and could have a material adverse effect on our business,financial condition and results of operations.
Changes in card network fees could impact our operations.
From time to time, the card networks increase the fees (known as interchange fees) that they charge toacquirers and we charge to our merchants. It is possible that competitive pressures will result in usabsorbing a portion of such increases in the future, which would increase our costs, reduce our profitmargin and adversely affect our business and financial condition. In addition, the card networks requirecertain capital requirements. An increase in the required capital level would further limit our use of capitalfor other purposes.
We are subject to certain operational risks, including, but not limited to, customer or employee fraud and dataprocessing system failures and errors.
Employee errors and employee and customer misconduct could subject us to financial losses orregulatory sanctions and seriously harm our reputation. Misconduct by our employees could include hidingunauthorized activities from us, improper or unauthorized activities on behalf of our customers orimproper use of confidential information. It is not always possible to prevent employee errors andmisconduct, and the precautions we take to prevent and detect this activity may not be effective in all cases.Employee errors could also subject us to financial claims for negligence.
We maintain a system of internal controls and insurance coverage to mitigate against operational risks,including data processing system failures and errors and customer or employee fraud. If our internalcontrols fail to prevent or detect an occurrence, or if any resulting loss is not insured or exceeds applicableinsurance limits, it could have a material adverse effect on our business, financial condition and results ofoperations.
If the allowance for loan losses is not sufficient to cover actual loan losses, earnings could decrease.
Loan customers may not repay their loans according to the terms of their loans, and the collateralsecuring the payment of their loans may be insufficient to assure repayment. We may experience significantcredit losses, which could have a material adverse effect on our operating results. Various assumptions andjudgments about the collectability of the loan portfolio are made, including the creditworthiness ofborrowers and the value of the real estate and other assets serving as collateral for the repayment of manyloans. In determining the amount of the allowance for loan losses, management reviews the loans and theloss and delinquency experience and evaluates economic conditions.
At December 31, 2017, our allowance for loan losses as a percentage of total loans, net of unearnedincome, was 1.22%. The determination of the appropriate level of allowance is subject to judgment andrequires us to make significant estimates of current credit risks and future trends, all of which are subject tomaterial changes. If assumptions prove to be incorrect, the allowance for loan losses may not cover probableincurred losses in the loan portfolio at the date of the financial statements. Significant additions to theallowance would materially decrease net income. Non-performing loans may increase and non-performingor delinquent loans may adversely affect future performance. We had no non-performing loans atDecember 31, 2017. In addition, federal and state regulators periodically review the allowance for loan
25
losses and may require an increase in the allowance for loan losses or recognize further loan charge-offs.Any significant increase in our allowance for loan losses or loan charge-offs as required by these regulatoryagencies could have a material adverse effect on our results of operations and financial condition.
The FASB has adopted a new accounting standard that will be effective for our first fiscal year afterDecember 15, 2019. This standard, referred to as Current Expected Credit Loss, or CECL, will requirefinancial institutions to determine periodic estimates of lifetime expected credit losses on loans, andrecognize the expected credit losses as allowances for loan losses. This will change the current method ofproviding allowances for loan losses that are probable, which may require us to increase our allowance forloan losses, and to greatly increase the types of data we would need to collect and review to determine theappropriate level of the allowance for loan losses. We are currently evaluating the impact this standard willhave on our results of operations and financial position.
Bank regulators periodically review our allowance for loan losses and may require an increase to theprovision for loan losses or further loan charge-offs. Any increase in our allowance for loan losses or loancharge-offs as required by these regulatory authorities may have a material adverse effect on our results ofoperations or financial condition.
Our loan portfolio is unseasoned.With a growing and generally unseasoned loan portfolio, our credit risk may continue to increase and
our future performance could be adversely affected. While we believe we have underwriting standardsdesigned to manage normal lending risks, it is difficult to assess the future performance of our loanportfolio due to the recent origination of many of these loans. As a result, it is difficult to predict whetherany of our loans will become non-performing or delinquent loans, or whether we will have anynon-performing or delinquent loans that will adversely affect our future performance. At December 31,2017, the average age of our loans was 4.42 years, 3.03 years, 3.08 years, 0.99 years, 3.17 years and1.24 years for our 1 – 4 family residential loans, multifamily loans, commercial real estate loans,construction loans, commercial loans and consumer loans, respectively. At December 31, 2017, the averageage of our loan portfolio was 2.47 years.
Changes in the valuation of our securities portfolio could hurt our profits and reduce our stockholders’ equity.Our securities portfolio may be impacted by fluctuations in market value, potentially reducing
accumulated other comprehensive income and/or earnings. Fluctuations in market value may be caused bychanges in market interest rates, lower market prices for securities and limited investor demand.Management evaluates securities for other-than-temporary impairment on a quarterly basis, with morefrequent evaluation for selected issues. In analyzing a debt issuer’s financial condition, managementconsiders whether the securities are issued by the federal government or its agencies, whether downgradesby bond rating agencies have occurred, industry analysts’ reports and, to a lesser extent given the relativelyinsignificant levels of depreciation in our debt portfolio, spread differentials between the effective rates oninstruments in the portfolio compared to risk-free rates. In analyzing an equity issuer’s financial condition,management considers industry analysts’ reports, financial performance and projected target prices ofinvestment analysts within a one-year time frame. If this evaluation shows impairment to the actual orprojected cash flows associated with one or more securities, a potential loss to earnings may occur. Changesin interest rates can also have an adverse effect on our financial condition, as our available-for-sale securitiesare reported at their estimated fair value, and therefore are impacted by fluctuations in interest rates. Weincrease or decrease our stockholders’ equity by the amount of change in the estimated fair value of theavailable-for-sale securities, net of taxes. Declines in market value could result in other-than-temporaryimpairments of these assets, which would lead to accounting charges that could have a material adverseeffect on our net income and capital levels. Refer to “Management’s Discussion and Analysis of FinancialCondition and Results of Operations — Securities Portfolio.”
We may not be able to adequately measure and limit the credit risk associated with our loan portfolio, whichcould adversely affect our profitability.
As a part of the products and services that we offer, we make commercial and commercial real estateloans. The principal economic risk associated with each class of loans is the creditworthiness of theborrower, which is affected by the strength of the relevant business market segment, local market
26
conditions, and general economic conditions. Additional factors related to the credit quality of commercialloans include the quality of the management of the business and the borrower’s ability both to properlyevaluate changes in the supply and demand characteristics affecting their market for products and services,and to effectively respond to those changes. Additional factors related to the credit quality of commercialreal estate loans include tenant vacancy rates and the quality of management of the property. A failure toeffectively measure and limit the credit risk associated with our loan portfolio could have an adverse effecton our business, financial condition, and results of operations.
Changes in economic conditions could cause an increase in delinquencies and nonperforming assets, includingloan charge-offs, which could depress our net income and growth.
Our loan portfolio includes many real estate secured loans, demand for which may decrease duringeconomic downturns as a result of, among other things, an increase in unemployment, a decrease in realestate values and, a slowdown in housing. If we see negative economic conditions develop in the UnitedStates as a whole or our New York market, we could experience higher delinquencies and loan charge-offs,which would reduce our net income and adversely affect our financial condition. Furthermore, to the extentthat real estate collateral is obtained through foreclosure, the costs of holding and marketing the real estatecollateral, as well as the ultimate values obtained from disposition, could reduce our earnings and adverselyaffect our financial condition.
We operate in a highly competitive industry and face significant competition from other financial institutionsand financial services providers, which may decrease our growth or profits.
Consumer and commercial banking as well as merchant services are highly competitive industries. Ourmarket area contains not only a large number of community and regional banks, but also a significantpresence of the country’s largest commercial banks. We compete with other state and national financialinstitutions, as well as savings and loan associations, savings banks, and credit unions, for deposits andloans. In addition, we compete with financial intermediaries, such as consumer finance companies, specialtyfinance companies, commercial finance companies, mortgage banking companies, insurance companies,securities firms, mutual funds, and several government agencies, as well as major retailers, all activelyengaged in providing various types of loans and other financial services, including merchant services.Competition for Attorney-Related Loans is derived primarily from eight to ten nationally-oriented financialcompanies that specialize in this market. Some of these companies are focused exclusively on loans to lawfirms, while others offer loans to plaintiffs as well. We also face significant competition from many largerinstitutions, including large commercial banks and third party processors that operate in the merchantservices business, and our ability to grow that portion of our business depends on us being able to continueto attract and retain ISOs and merchants. Some of these competitors may have a long history of successfuloperations nationally as well as in our market area and greater ties to businesses or the legal community andmore expansive banking relationships, as well as more established depositor bases, fewer regulatoryconstraints, and lower cost structures than we do. Competitors with greater resources may possess anadvantage through their ability to maintain numerous banking locations in more convenient sites, toconduct more extensive promotional and advertising campaigns, or to operate a more developed technologyplatform. Due to their size, many competitors may offer a broader range of products and services, as well asbetter pricing for certain products and services than we can offer. For example, in the current low interestrate environment, competitors with lower costs of capital may solicit our customers to refinance their loanswith a lower interest rate. Further, increased competition among financial services companies due to therecent consolidation of certain competing financial institutions may adversely affect our ability to marketour products and services. Technology has lowered barriers to entry and made it possible for banks andspecifically finance companies to compete in our market area and for non-banks to offer products andservices traditionally provided by banks.
The financial services industry could become even more competitive as a result of legislative,regulatory, and technological changes and continued consolidation. Banks, securities firms, and insurancecompanies can merge under the umbrella of a financial holding company, which can offer virtually any typeof financial service, including banking, securities underwriting, insurance (both agency and underwriting),and merchant banking.
27
Our ability to compete successfully depends on a number of factors, including:
• our ability to develop, maintain, and build upon long-term customer relationships based onquality service and high ethical standards;
• our ability to attract and retain qualified employees to operate our business effectively;
• our ability to expand our market position;
• the scope, relevance, and pricing of products and services that we offer to meet customer needsand demands;
• the rate at which we introduce new products and services relative to our competitors;
• customer satisfaction with our level of service; and
• industry and general economic trends.
Failure to perform in any of these areas could significantly weaken our competitive position, whichcould adversely affect our growth and profitability, which, in turn, could harm our business, financialcondition, and results of operations.
A lack of liquidity could adversely affect our financial condition and results of operations.
Liquidity is essential to our business. We rely on our ability to generate deposits and effectively managethe repayment and maturity schedules of our loans to ensure that we have adequate liquidity to fund ouroperations. An inability to raise funds through deposits, borrowings, the sale of loans and other sourcescould have a substantial negative effect on our liquidity. Our most important source of funds isdeposits. Deposit balances can decrease when customers perceive alternative investments as providing abetter risk/return tradeoff. If customers move money out of bank deposits and into other investments suchas money market funds, we would lose a relatively low-cost source of funds, increasing our funding costsand reducing our net interest income and net income.
Other primary sources of funds consist of cash flows from operations, maturities and sales ofinvestment securities, and proceeds from the issuance and sale of our equity securities to investors.Additional liquidity is provided by the ability to borrow from the Federal Home Loan Bank of New York.We also may borrow funds from third-party lenders, such as other financial institutions. Our access tofunding sources in amounts adequate to finance or capitalize our activities, or on terms that are acceptableto us, could be impaired by factors that affect us directly or the financial services industry or economy ingeneral, such as disruptions in the financial markets or negative views and expectations about the prospectsfor the financial services industry. Our access to funding sources could also be affected by a decrease in thelevel of our business activity as a result of a downturn in our markets or by one or more adverse regulatoryactions against us.
Any decline in available funding could adversely impact our ability to originate loans, invest insecurities, meet our expenses, or to fulfill obligations such as repaying our borrowings or meeting depositwithdrawal demands, any of which could have a material adverse impact on our liquidity, business, financialcondition and results of operations.
Our ten largest deposit clients account for 29.3% of our total deposits.
As of December 31, 2017, our ten largest bank depositors accounted for, in the aggregate, 29.3% ofour total deposits. As a result, a material decrease in the volume of those deposits by a relatively smallnumber of our depositors could reduce our liquidity, in which event it could became necessary for us toreplace those deposits with higher-cost deposits or FHLB borrowings, which would adversely affect our netinterest income and, therefore, our results of operations.
As a bank holding company, the sources of funds available to us are limited.
Any future constraints on liquidity at the holding company level could impair our ability to declareand pay dividends on our common stock. In some instances, notice to, or approval from, the FRB may berequired prior to our declaration or payment of dividends. Further, our operations are primarily conducted
28
by our subsidiary, Esquire Bank, which is subject to significant regulation. Federal banking laws restrict thepayment of dividends by banks to their holding companies, and Esquire Bank will be subject to theserestrictions in paying dividends to us. Because our ability to receive dividends or loans from Esquire Bank isrestricted, our ability to pay dividends to our stockholders is also restricted.
Additionally, the right of a bank holding company to participate in the assets of its subsidiary bank inthe event of a bank-level liquidation or reorganization is subject to the claims of the bank’s creditors,including depositors, which take priority, except to the extent that the holding company may be a creditorwith a recognized claim.
Our ability to maintain our reputation is critical to the success of our business, and the failure to do so maymaterially adversely affect our performance.
We are a community bank, and our reputation is one of the most valuable components of our business.As such, we strive to conduct our business in a manner that enhances our reputation. This is done, in part,by recruiting, hiring, and retaining employees who share our core values of being an integral part of thecommunities we serve, delivering superior service to our customers, and caring about our customers andassociates. If our reputation is negatively affected, by the actions of our employees or otherwise, ourbusiness and, therefore, our operating results may be materially adversely affected. Further, negative publicopinion can expose us to litigation and regulatory action as we seek to implement our growth strategy,which would adversely affect our business, financial condition and results of operations.
We have lower lending limits and different lending risks than certain of our larger, more diversifiedcompetitors.
We are a community banking institution that provides banking services to the local communities in themarket areas in which we operate. Our ability to diversify our economic risks is limited by our own localmarkets and economies. We lend primarily to individuals and to small to medium-sized businesses, whichmay expose us to greater lending risks than those of banks that lend to larger, better-capitalized businesseswith longer operating histories. In addition, our legally mandated lending limits are lower than those ofcertain of our competitors that have more capital than we do. As a result of our size, at December 31, 2017,our legal lending limit was $10.2 million. Our lower lending limits may discourage borrowers with lendingneeds that exceed our limits from doing business with us. We may try to serve such borrowers by selling loanparticipations to other financial institutions; however, this strategy may not succeed.
We face risks related to our operational, technological and organizational infrastructure.
Our ability to grow and compete is dependent on our ability to build or acquire the necessaryoperational and technological infrastructure and to manage the cost of that infrastructure as we expand.Similar to other large corporations, operational risk can manifest itself in many ways, such as errors relatedto failed or inadequate processes, faulty or disabled computer systems, fraud by employees or outsidepersons and exposure to external events. As discussed below, we are dependent on our operationalinfrastructure to help manage these risks. In addition, we are heavily dependent on the strength andcapability of our technology systems which we use both to interface with our customers and to manage ourinternal financial and other systems. Our ability to develop and deliver new products that meet the needs ofour existing customers and attract new ones depends on the functionality of our technology systems.Additionally, our ability to run our business in compliance with applicable laws and regulations isdependent on these infrastructures.
We continuously monitor our operational and technological capabilities and make modifications andimprovements when we believe it will be cost effective to do so. In some instances, we may build andmaintain these capabilities ourselves. We also outsource some of these functions to third parties.Specifically, we depend on third parties to provide our core systems processing, essential web hosting andother internet systems, deposit processing and other processing services. In connection with our merchantservices business, we (and our ISOs) rely on various third parties to provide processing and clearing andsettlement services to us in connection with card transactions. If these third-party service providersexperience difficulties, fail to comply with banking regulations or terminate their services and we are unableto replace them with other service providers, our operations could be interrupted. If an interruption were to
29
continue for a significant period of time, our business, financial condition and results of operations couldbe adversely affected, perhaps materially. Even if we are able to replace them, it may be at a higher cost tous, which could adversely affect our business, financial condition and results of operations. We also face riskfrom the integration of new infrastructure platforms and/or new third party providers of such platformsinto its existing businesses.
A failure in our operational systems or infrastructure, or those of third parties, could impair our liquidity,disrupt our businesses, result in the unauthorized disclosure of confidential information, damage our reputationand cause financial losses.
Our business, and in particular, our merchant services business, is partially dependent on our ability toprocess and monitor, on a daily basis, a large number of transactions, many of which are highly complex,across numerous and diverse markets. These transactions, as well as the information technology services weprovide to clients, often must adhere to client-specific guidelines, as well as legal and regulatory standards.Due to the breadth of our client base and our geographical reach, developing and maintaining ouroperational systems and infrastructure is challenging, particularly as a result of rapidly evolving legal andregulatory requirements and technological shifts. Our financial, accounting, data processing or otheroperating systems and facilities, and, as discussed above, those the third-party service providers upon whichwe depend, may fail to operate properly or become disabled as a result of events that are wholly or partiallybeyond our control, such as a spike in transaction volume, cyber-attack or other unforeseen catastrophicevents, which may adversely affect our ability to process these transactions or provide services.
The occurrence of fraudulent activity, breaches or failures of our information security controls orcybersecurity-related incidents could have a material adverse effect on our business, financial condition andresults of operations.
Our operations rely on the secure processing, storage and transmission of confidential and othersensitive business and consumer information on our computer systems and networks, as well as those ofour ISOs and processors. Under the card network rules and various federal and state laws, we areresponsible for safeguarding such information. Although we take protective measures to maintain theconfidentiality, integrity and availability of information across all geographic and product lines, andendeavor to modify these protective measures as circumstances warrant, the nature of the threats continuesto evolve. As a result, our computer systems, software and networks are vulnerable to unauthorized access,loss or destruction of data (including confidential client information), account takeovers, unavailability ofservice, computer viruses or other malicious code, cyber-attacks and other events that could have an adversesecurity impact. Despite the defensive measures we take to manage our internal technological andoperational infrastructure, these threats have in the past and may in the future originate externally fromthird parties such as foreign governments, organized crime and other hackers, and outsource orinfrastructure-support providers and application developers, or may originate internally from within ourorganization. Given the increasingly high volume of our transactions, certain errors may be repeated orcompounded before they can be discovered and rectified. In addition, security breaches or failures couldresult in the bank incurring liability to ISOs, members of the card network and card issuers in relation toour merchant banking business.
In particular, information pertaining to us and our customers is maintained, and transactions areexecuted, on the networks and systems of us, our customers and certain of our third-party partners, such asour online banking or reporting systems, ISO’s customers and merchants who are part of our merchantbanking business. The secure maintenance and transmission of confidential information, as well asexecution of transactions over these systems, are essential to protect us and our customers against fraudand security breaches and to maintain our clients’ confidence. Breaches of information security also mayoccur, and in infrequent cases have occurred, through intentional or unintentional acts by those havingaccess or gaining access to our systems or our customers’ or counterparties’ confidential information,including employees. In addition, increases in criminal activity levels and sophistication, advances incomputer capabilities, new discoveries, vulnerabilities in third-party technologies (including browsers andoperating systems) or other developments could result in a compromise or breach of the technology,processes and controls that we use to prevent fraudulent transactions and to protect data about us, ourcustomers and underlying transactions, as well as the technology used by our customers to access our
30
systems. We cannot be certain that the security measures we or our ISOs or processors have in place toprotect this sensitive data will be successful or sufficient to protect against all current and emerging threatsdesigned to breach our systems or those of our ISOs or processors. Although we have developed, andcontinue to invest in, systems and processes that are designed to detect and prevent security breaches andcyber-attacks and periodically test our security, a breach of our systems, or those of our ISOs or processors,could result in losses to us or our customers; loss of business and/or customers; damage to our reputation;the incurrence of additional expenses (including the cost of notification to consumers, credit monitoringand forensics, and fees and fines imposed by the card networks); disruption to our business; our inability togrow our online services or other businesses; additional regulatory scrutiny or penalties; or our exposure tocivil litigation and possible financial liability — any of which could have a material adverse effect on ourbusiness, financial condition and results of operations.
If our enterprise risk management framework is not effective at mitigating risk and loss to us, we could sufferunexpected losses and our results of operations could be materially adversely affected.
Our enterprise risk management framework seeks to achieve an appropriate balance between risk andreturn, which is critical to optimizing stockholder value. We have established processes and proceduresintended to identify, measure, monitor, report and analyze the types of risk to which we are subject,including credit, liquidity, operational, regulatory compliance and reputational. However, as with any riskmanagement framework, there are inherent limitations to our risk management strategies as there mayexist, or develop in the future, risks that we have not appropriately anticipated or identified. If our riskmanagement framework proves ineffective, we could suffer unexpected losses and our business and resultsof operations could be materially adversely affected.
Changes in accounting standards could materially impact our financial statements.
From time to time, the Financial Accounting Standards Board or the SEC may change the financialaccounting and reporting standards that govern the preparation of our financial statements. Such changesmay result in us being subject to new or changing accounting and reporting standards. In addition, thebodies that interpret the accounting standards (such as banking regulators, outside auditors ormanagement) may change their interpretations or positions on how these standards should be applied.These changes may be beyond our control, can be hard to predict, and can materially impact how we recordand report our financial condition and results of operations. In some cases, we could be required to apply anew or revised standard retrospectively, or apply an existing standard differently, also retrospectively, ineach case resulting in our needing to revise or restate prior period financial statements.
Risks Related to Our Industry and Regulation
Our business, financial condition, results of operations and future prospects could be adversely affected by thehighly regulated environment and the laws and regulations that govern our operations, corporate governance,executive compensation and accounting principles, or changes in any of them.
As a bank holding company, we are subject to extensive examination, supervision and comprehensiveregulation by various federal and state agencies that govern almost all aspects of our operations. These lawsand regulations are not intended to protect our stockholders. Rather, these laws and regulations areintended to protect customers, depositors, the DIF and the overall financial stability of the U.S. These lawsand regulations, among other matters, prescribe minimum capital requirements, impose limitations on thebusiness activities in which we can engage, limit the dividend or distributions that Esquire Bank can pay tous, restrict the ability of institutions to guarantee our debt, and impose certain specific accountingrequirements on us that may be more restrictive and may result in greater or earlier charges to earnings orreductions in our capital than generally accepted accounting principles would require. Compliance withthese laws and regulations is difficult and costly, and changes to these laws and regulations often imposeadditional compliance costs. Our failure to comply with these laws and regulations, even if the failurefollows good faith effort or reflects a difference in interpretation, could subject us to restrictions on ourbusiness activities, fines and other penalties, any of which could adversely affect our results of operations,capital base and the price of our securities. Further, any new laws, rules and regulations could makecompliance more difficult or expensive.
31
Likewise, the Company operates in an environment that imposes income taxes on its operations at boththe federal and state levels to varying degrees. Strategies and operating routines have been implemented tominimize the impact of these taxes. Consequently, any change in tax legislation could significantly alter theeffectiveness of these strategies.
The net deferred tax asset reported on the Company’s balance sheet generally represents the tax benefitof future deductions from taxable income for items that have already been recognized for financialreporting purposes. The bulk of these deferred tax assets consists of deferred loan loss deductions, deferredcompensation deductions and unrealized losses on available-for-sale securities. The net deferred tax asset ismeasured by applying currently-enacted income tax rates to the accounting period during which the taxbenefit is expected to be realized. On December 22, 2017, H.R.1 commonly known as the Tax Cuts andJobs Act was signed into law. Among other things, the act reduces our corporate federal tax rate from 35%to 21% effective January 1, 2018. As a result we are required to remeasure, through income tax expense, ourdeferred tax assets and liabilities using the enacted rates. The remeasurement of our net deferred tax assetresulted in additional income tax expense of $683,000 for the year ended December 31, 2017. As ofDecember 31, 2017, the Company’s net deferred tax asset was $2.2 million.
Federal regulators periodically examine our business, and we may be required to remediate adverseexamination findings.
The FRB, the OCC and the FDIC, periodically examine our business, including our compliance withlaws and regulations. If, as a result of an examination, a federal banking agency were to determine that ourfinancial condition, capital resources, asset quality, earnings prospects, management, liquidity or otheraspects of any of our operations had become unsatisfactory, or that we were in violation of any law orregulation, it may take a number of different remedial actions as it deems appropriate. These actions includethe power to enjoin “unsafe or unsound” practices, to require affirmative action to correct any conditionsresulting from any violation or practice, to issue an administrative order that can be judicially enforced, todirect an increase in our capital, to restrict our growth, to assess civil monetary penalties against our officersor directors, to remove officers and directors and, if it is concluded that such conditions cannot becorrected or there is an imminent risk of loss to depositors, to terminate our deposit insurance and place usinto receivership or conservatorship. If we become subject to any regulatory actions, it could have a materialadverse effect on our business, results of operations, financial condition and growth prospects.
Legislative and regulatory actions taken now or in the future may increase our costs and impact our business,governance structure, financial condition or results of operations.
The Dodd-Frank Wall Street Reform and Consumer Protection Act (“Dodd-Frank Act”), amongother things, imposed new capital requirements on bank holding companies; changed the base for FDICinsurance assessments to a bank’s average consolidated total assets minus average tangible equity, ratherthan upon its deposit base; permanently raised the current standard deposit insurance limit to $250,000;and expanded the FDIC’s authority to raise insurance premiums. The 2010 Dodd-Frank Wall StreetReform and Consumer Protection Act (the “Dodd-Frank Act”) established the Consumer FinancialProtection Bureau as an independent entity within the FRB, which has broad rulemaking, supervisory andenforcement authority over consumer financial products and services, including deposit products,residential mortgages, home-equity loans and credit cards and contains provisions on mortgage-relatedmatters, such as steering incentives, determinations as to a borrower’s ability to repay and prepaymentpenalties. Although the applicability of certain elements of the Dodd-Frank Act is limited to institutionswith more than $10 billion in assets, there can be no guarantee that such applicability will not be extendedin the future or that regulators or other third parties will not seek to impose such requirements oninstitutions with less than $10 billion in assets, such as Esquire Bank.
Compliance with the Dodd-Frank Act and its implementing regulations has and will continue to resultin additional operating and compliance costs that could have a material adverse effect on our business,financial condition, results of operations and growth prospects.
As a result of the Dodd-Frank Act and recent rulemaking, we are subject to more stringent capitalrequirements.
In July 2013, the U.S. federal banking authorities approved new regulatory capital rules implementingthe Basel III regulatory capital reforms effecting certain changes required by the Dodd-Frank Act. The new
32
regulatory capital requirements are generally applicable to all U.S. banks as well as to bank and saving andloan holding companies, other than “small bank holding companies” (generally bank holding companieswith consolidated assets of less than $1.0 billion, such as the Company). The new regulatory capital rulesnot only increase most of the required minimum regulatory capital ratios, but also introduce a new commonequity Tier 1 capital ratio and the concept of a capital conservation buffer. The new regulatory capital rulesalso expand the current definition of capital by establishing additional criteria that capital instruments mustmeet to be considered additional Tier 1 and Tier 2 capital. In order to be a “well-capitalized” depositoryinstitution under the new regime, an institution must maintain a common equity Tier 1 capital ratio of 6.5%or more; a Tier 1 capital ratio of 8% or more; a total capital ratio of 10% or more; and a leverage ratio of5% or more. Institutions must also maintain a capital conservation buffer consisting of common equityTier 1 capital. The new regulatory capital rules became effective as applied to Esquire Bank on January 1,2015 with a phase-in period that generally extends through January 1, 2019 for many of the changes.
Additionally, on November 2, 2012, the OCC notified Esquire Bank that it had established minimumcapital ratios for Esquire Bank requiring Esquire Bank to maintain, commencing December 1, 2012, a Tier1 leverage capital ratio of 9.0%, a Tier 1 risk-based capital ratio of 11.0% and a total risk-based capital torisk-weighted assets ratio of 13.0%.
The failure to meet applicable regulatory capital requirements, including the minimum capitalrequirements established by the OCC, could result in one or more of our regulators placing limitations orconditions on our activities, including our growth initiatives, or restricting the commencement of newactivities, and could affect customer and investor confidence, our costs of funds and FDIC insurance costs,our ability to pay dividends on our common stock, our ability to make acquisitions, and our business,results of operations and financial conditions, generally.
We are subject to the Community Reinvestment Act and fair lending laws, and failure to comply with theselaws could lead to material penalties.
The Community Reinvestment Act (“CRA”), the Equal Credit Opportunity Act, the Fair Housing Actand other fair lending laws and regulations impose nondiscriminatory lending requirements on financialinstitutions. The Consumer Financial Protection Bureau, the United States Department of Justice andother federal agencies are responsible for enforcing these laws and regulations. A successful challenge to aninstitution’s performance under the CRA or fair lending laws and regulations could result in a wide varietyof sanctions, including the required payment of damages and civil money penalties, injunctive relief,imposition of restrictions on mergers and acquisitions activity and restrictions on expansion activity.Private parties may also have the ability to challenge an institution’s performance under fair lending laws inprivate class action litigation.
FDIC deposit insurance assessments may continue to materially increase in the future, which would have anadverse effect on earnings.
As a member institution of the FDIC, our subsidiary, Esquire Bank, is assessed a quarterly depositinsurance premium. Failed banks nationwide have significantly depleted the insurance fund and reduced theratio of reserves to insured deposits. The FDIC has adopted a Deposit Insurance Fund Restoration Plan,which requires the FDIC’s DIF to attain a 1.35% reserve ratio by September 30, 2020. As a result of thisrequirement, Esquire Bank could be required to pay significantly higher premiums or additional specialassessments that would adversely affect its earnings, thereby reducing the availability of funds to paydividends to us.
Monetary policies and regulations of the Federal Reserve could adversely affect our business, financialcondition and results of operations.
In addition to being affected by general economic conditions, our earnings and growth are affected bythe policies of the FRB. An important function of the FRB is to regulate the money supply and creditconditions. Among the instruments used by the FRB to implement these objectives are open marketpurchases and sales of U.S. government securities, adjustments of the discount rate and changes in banks’reserve requirements against bank deposits. These instruments are used in varying combinations toinfluence overall economic growth and the distribution of credit, bank loans, investments and deposits.Their use also affects interest rates charged on loans or paid on deposits.
33
The monetary policies and regulations of the FRB have had a significant effect on the operating resultsof commercial banks in the past and are expected to continue to do so in the future. The effects of suchpolicies upon our business, financial condition and results of operations cannot be predicted.
We face a risk of noncompliance and enforcement action with the Bank Secrecy Act and other anti-moneylaundering statutes and regulations.
The Bank Secrecy Act, the USA Patriot Act and other laws and regulations require financialinstitutions, among other duties, to institute and maintain an effective anti-money laundering program andto file reports such as suspicious activity reports and currency transaction reports. We are required tocomply with these and other anti-money laundering requirements. The federal banking agencies andFinancial Crimes Enforcement Network are authorized to impose significant civil money penalties forviolations of those requirements and have recently engaged in coordinated enforcement efforts againstbanks and other financial services providers with the U.S. Department of Justice, Drug EnforcementAdministration and Internal Revenue Service. We are also subject to increased scrutiny of compliance withthe rules enforced by the Office of Foreign Assets Control. If our policies, procedures and systems aredeemed deficient, we would be subject to liability, including fines and regulatory actions, which may includerestrictions on our ability to pay dividends and the necessity to obtain regulatory approvals to proceed withcertain aspects of our business plan, including our acquisition plans.
Failure to maintain and implement adequate programs to combat money laundering and terroristfinancing could also have serious reputational consequences for us. Any of these results could have amaterial adverse effect on our business, financial condition, results of operations and growth prospects.
The FRB may require us to commit capital resources to support Esquire Bank.
As a matter of policy, the FRB expects a bank holding company to act as a source of financial andmanagerial strength to a subsidiary bank and to commit resources to support such subsidiary bank. TheDodd-Frank Act codified the FRB’s policy on serving as a source of financial strength. Under the “sourceof strength” doctrine, the FRB may require a bank holding company to make capital injections into atroubled subsidiary bank and may charge the bank holding company with engaging in unsafe and unsoundpractices for failure to commit resources to a subsidiary bank. A capital injection may be required at timeswhen the holding company may not have the resources to provide it and therefore may be required toborrow the funds or raise capital. Any loans by a holding company to its subsidiary banks are subordinatein right of payment to deposits and to certain other indebtedness of such subsidiary bank. In the event of abank holding company’s bankruptcy, the bankruptcy trustee will assume any commitment by the holdingcompany to a federal bank regulatory agency to maintain the capital of a subsidiary bank. Moreover,bankruptcy law provides that claims based on any such commitment will be entitled to a priority ofpayment over the claims of the institution’s general unsecured creditors, including the holders of its noteobligations. Thus, any borrowing that must be done by the Company to make a required capital injectionbecomes more difficult and expensive and could have an adverse effect on our business, financial conditionand results of operations.
We could be adversely affected by the soundness of other financial institutions and other third parties werely on.
Financial services institutions are interrelated as a result of trading, clearing, counterparty or otherrelationships. We have exposure to many different industries and counterparties, and routinely executetransactions with counterparties in the financial services industry, including commercial banks, brokers anddealers, investment banks and other institutional customers. Many of these transactions expose us to creditrisk in the event of a default by a counterparty or client. In addition, our credit risk may be exacerbatedwhen our collateral cannot be foreclosed upon or is liquidated at prices not sufficient to recover the fullamount of the credit or derivative exposure due. Furthermore, successful operation of our merchantservices business depends on the soundness of ISOs, third party processors, clearing agents and others thatwe rely on to conduct our merchant business. Any losses resulting from such third parties could adverselyaffect our business, financial condition and results of operations.
34
We depend on the accuracy and completeness of information about customers and counterparties.
In deciding whether to extend credit or enter into other transactions with our existing and potentialcustomers and counterparties, we may rely on information furnished to us by or on behalf of our existingand potential customers and counterparties, including financial statements and other financial information.We also may rely on representations of our existing and potential customers and counterparties as to theaccuracy and completeness of that information and, with respect to financial statements, on reports ofindependent auditors. In deciding whether to extend credit, we may rely upon our existing and potentialcustomers’ representations that their respective financial statements conform to U.S. generally acceptedaccounting principles, or GAAP, and present fairly, in all material respects, the financial condition, resultsof operations and cash flows of the customer. We also may rely on customer and counterpartyrepresentations and certifications, or other auditors’ reports, with respect to the business and financialcondition of our existing and potential customers and counterparties. Our financial condition, results ofoperations, financial reporting and reputation could be negatively affected if we rely on materiallymisleading, false, incomplete, inaccurate or fraudulent information provided by us by or on behalf of ourexisting or potential customers or counterparties.
Our accounting estimates and risk management processes and controls rely on analytical and forecastingtechniques and models and assumptions, which may not accurately predict future events.
Our accounting policies and methods are fundamental to how we record and report our financialcondition and results of operations. Our management must exercise judgment in selecting and applyingmany of these accounting policies and methods so they comply with GAAP and reflect management’sjudgment of the most appropriate manner to report our financial condition and results. In some cases,management must select the accounting policy or method to apply from two or more alternatives, any ofwhich may be reasonable under the circumstances, yet which may result in our reporting materially differentresults than would have been reported under a different alternative.
Certain accounting policies are critical to presenting our financial condition and results of operations.They require management to make difficult, subjective or complex judgments about matters that areuncertain. Materially different amounts could be reported under different conditions or using differentassumptions or estimates. These critical accounting policies include the allowance for loan losses andincome taxes. Because of the uncertainty of estimates involved in these matters, we may be required to doone or more of the following: significantly increase the allowance for loan losses or sustain loan losses thatare significantly higher than the reserve provided; reduce the carrying value of an asset measured at fairvalue; or significantly increase our accrued tax liability. Any of these could have a material adverse effect onour business, financial condition or results of operations. See “Item 7 — Management’s Discussion andAnalysis of Financial Condition and Results of Operations”.
Our internal controls, disclosure controls, processes and procedures, and corporate governance policiesand procedures are based in part on certain assumptions and can provide only reasonable (not absolute)assurances that the objectives of the system are met. Any failure or circumvention of our controls, processesand procedures or failure to comply with regulations related to controls, processes and procedures couldnecessitate changes in those controls, processes and procedures, which may increase our compliance costs,divert management attention from our business or subject us to regulatory actions and increased regulatoryscrutiny. Any of these could have a material adverse effect on our business, financial condition or results ofoperations.
35
ITEM 1B. Unresolved Staff Comments
None.
ITEM 2. Properties
At December 31, 2017, we conducted business through our corporate headquarters in Jericho,New York (Nassau County), one full service branch in Garden City, New York, and one administrativeoffice in Palm Beach Gardens, Florida. All the current locations and our new headquarters are leasedproperties. At December 31, 2017, the total net book value of our leasehold improvements, furniture,fixtures and equipment was approximately $2.5 million.
We have no current plans to expand our branch network as we believe we are positioned to furtherdevelop our primary markets through the use of technology with limited traditional branch offices.
ITEM 3. Legal Proceedings
Periodically, we are involved in claims and lawsuits, such as claims to enforce liens, condemnationproceedings on properties in which we hold security interests, claims involving the making and servicing ofreal property loans and other issues incident to our business. At December 31, 2017, we are not a party toany pending legal proceedings that we believe would have a material adverse effect on our financialcondition, results of operations or cash flows.
ITEM 4. Mine Safety Disclosures
Not applicable.
36
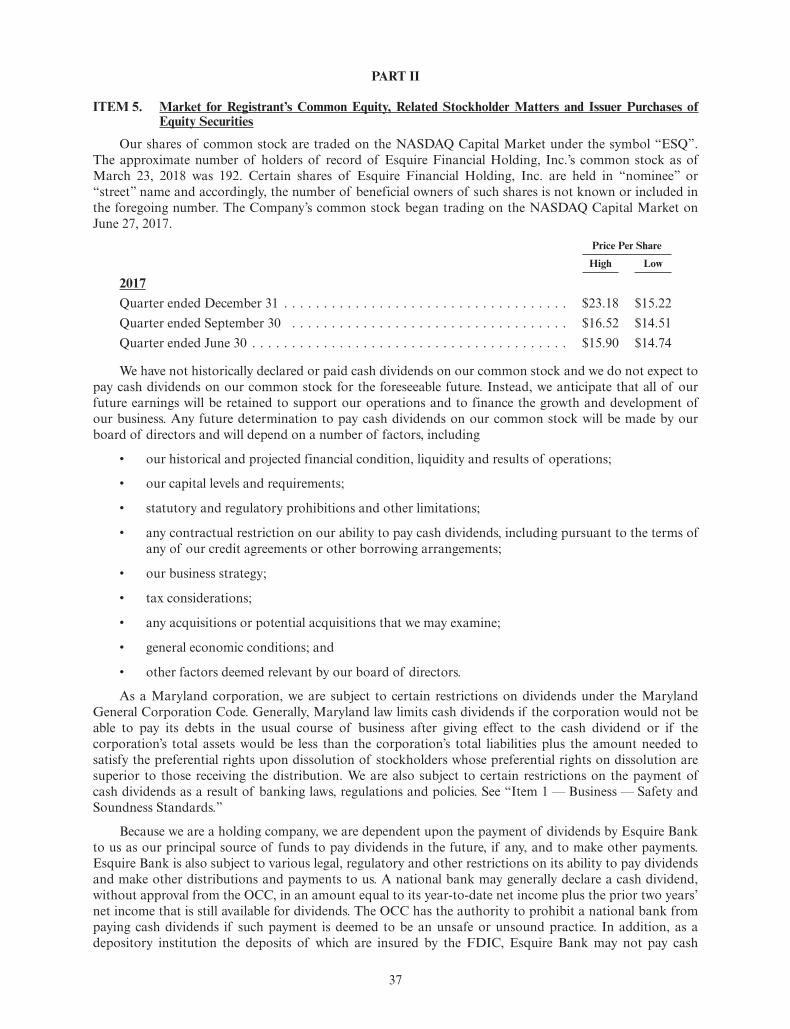
PART II
ITEM 5. Market for Registrant’s Common Equity, Related Stockholder Matters and Issuer Purchases ofEquity Securities
Our shares of common stock are traded on the NASDAQ Capital Market under the symbol “ESQ”.The approximate number of holders of record of Esquire Financial Holding, Inc.’s common stock as ofMarch 23, 2018 was 192. Certain shares of Esquire Financial Holding, Inc. are held in “nominee” or“street” name and accordingly, the number of beneficial owners of such shares is not known or included inthe foregoing number. The Company’s common stock began trading on the NASDAQ Capital Market onJune 27, 2017.
Price Per Share
High Low
2017Quarter ended December 31 . . . . . . . . . . . . . . . . . . . . . . . . . . . . . . . . . . . . $23.18 $15.22Quarter ended September 30 . . . . . . . . . . . . . . . . . . . . . . . . . . . . . . . . . . . $16.52 $14.51Quarter ended June 30 . . . . . . . . . . . . . . . . . . . . . . . . . . . . . . . . . . . . . . . . $15.90 $14.74
We have not historically declared or paid cash dividends on our common stock and we do not expect topay cash dividends on our common stock for the foreseeable future. Instead, we anticipate that all of ourfuture earnings will be retained to support our operations and to finance the growth and development ofour business. Any future determination to pay cash dividends on our common stock will be made by ourboard of directors and will depend on a number of factors, including
• our historical and projected financial condition, liquidity and results of operations;
• our capital levels and requirements;
• statutory and regulatory prohibitions and other limitations;
• any contractual restriction on our ability to pay cash dividends, including pursuant to the terms ofany of our credit agreements or other borrowing arrangements;
• our business strategy;
• tax considerations;
• any acquisitions or potential acquisitions that we may examine;
• general economic conditions; and
• other factors deemed relevant by our board of directors.
As a Maryland corporation, we are subject to certain restrictions on dividends under the MarylandGeneral Corporation Code. Generally, Maryland law limits cash dividends if the corporation would not beable to pay its debts in the usual course of business after giving effect to the cash dividend or if thecorporation’s total assets would be less than the corporation’s total liabilities plus the amount needed tosatisfy the preferential rights upon dissolution of stockholders whose preferential rights on dissolution aresuperior to those receiving the distribution. We are also subject to certain restrictions on the payment ofcash dividends as a result of banking laws, regulations and policies. See “Item 1 — Business — Safety andSoundness Standards.”
Because we are a holding company, we are dependent upon the payment of dividends by Esquire Bankto us as our principal source of funds to pay dividends in the future, if any, and to make other payments.Esquire Bank is also subject to various legal, regulatory and other restrictions on its ability to pay dividendsand make other distributions and payments to us. A national bank may generally declare a cash dividend,without approval from the OCC, in an amount equal to its year-to-date net income plus the prior two years’net income that is still available for dividends. The OCC has the authority to prohibit a national bank frompaying cash dividends if such payment is deemed to be an unsafe or unsound practice. In addition, as adepository institution the deposits of which are insured by the FDIC, Esquire Bank may not pay cash
37
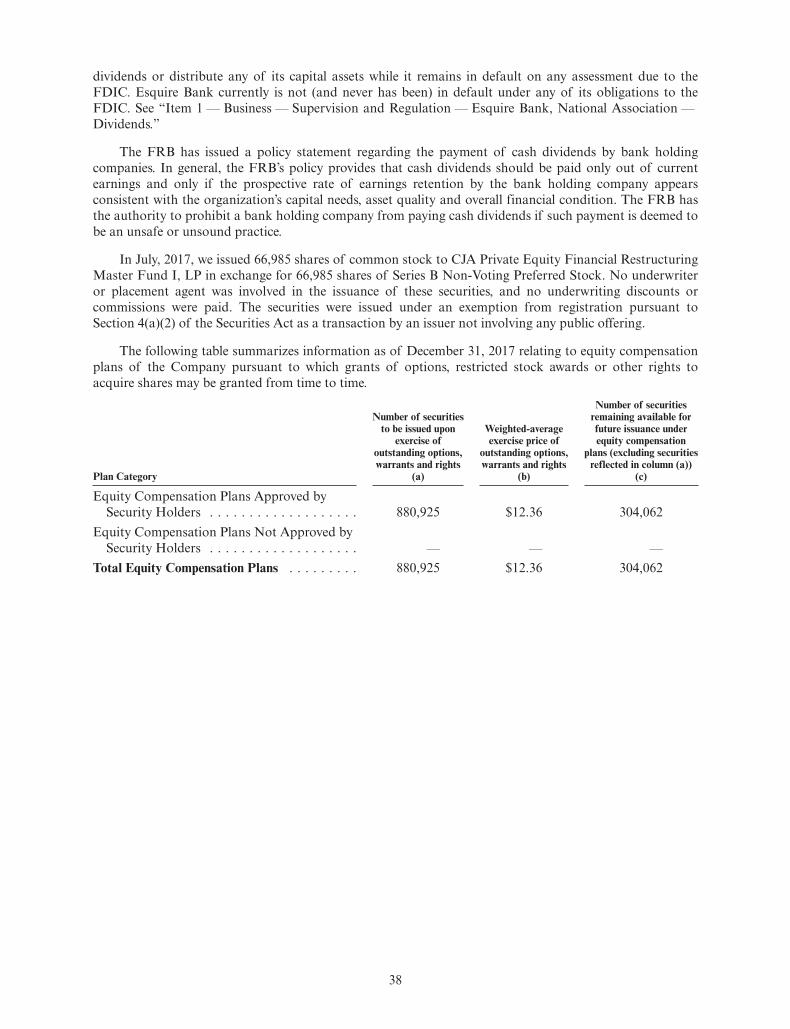
dividends or distribute any of its capital assets while it remains in default on any assessment due to theFDIC. Esquire Bank currently is not (and never has been) in default under any of its obligations to theFDIC. See “Item 1 — Business — Supervision and Regulation — Esquire Bank, National Association —Dividends.”
The FRB has issued a policy statement regarding the payment of cash dividends by bank holdingcompanies. In general, the FRB’s policy provides that cash dividends should be paid only out of currentearnings and only if the prospective rate of earnings retention by the bank holding company appearsconsistent with the organization’s capital needs, asset quality and overall financial condition. The FRB hasthe authority to prohibit a bank holding company from paying cash dividends if such payment is deemed tobe an unsafe or unsound practice.
In July, 2017, we issued 66,985 shares of common stock to CJA Private Equity Financial RestructuringMaster Fund I, LP in exchange for 66,985 shares of Series B Non-Voting Preferred Stock. No underwriteror placement agent was involved in the issuance of these securities, and no underwriting discounts orcommissions were paid. The securities were issued under an exemption from registration pursuant toSection 4(a)(2) of the Securities Act as a transaction by an issuer not involving any public offering.
The following table summarizes information as of December 31, 2017 relating to equity compensationplans of the Company pursuant to which grants of options, restricted stock awards or other rights toacquire shares may be granted from time to time.
Plan Category
Number of securitiesto be issued upon
exercise ofoutstanding options,warrants and rights
(a)
Weighted-averageexercise price of
outstanding options,warrants and rights
(b)
Number of securitiesremaining available forfuture issuance underequity compensation
plans (excluding securitiesreflected in column (a))
(c)
Equity Compensation Plans Approved bySecurity Holders . . . . . . . . . . . . . . . . . . . 880,925 $12.36 304,062
Equity Compensation Plans Not Approved bySecurity Holders . . . . . . . . . . . . . . . . . . . — — —
Total Equity Compensation Plans . . . . . . . . . 880,925 $12.36 304,062
38
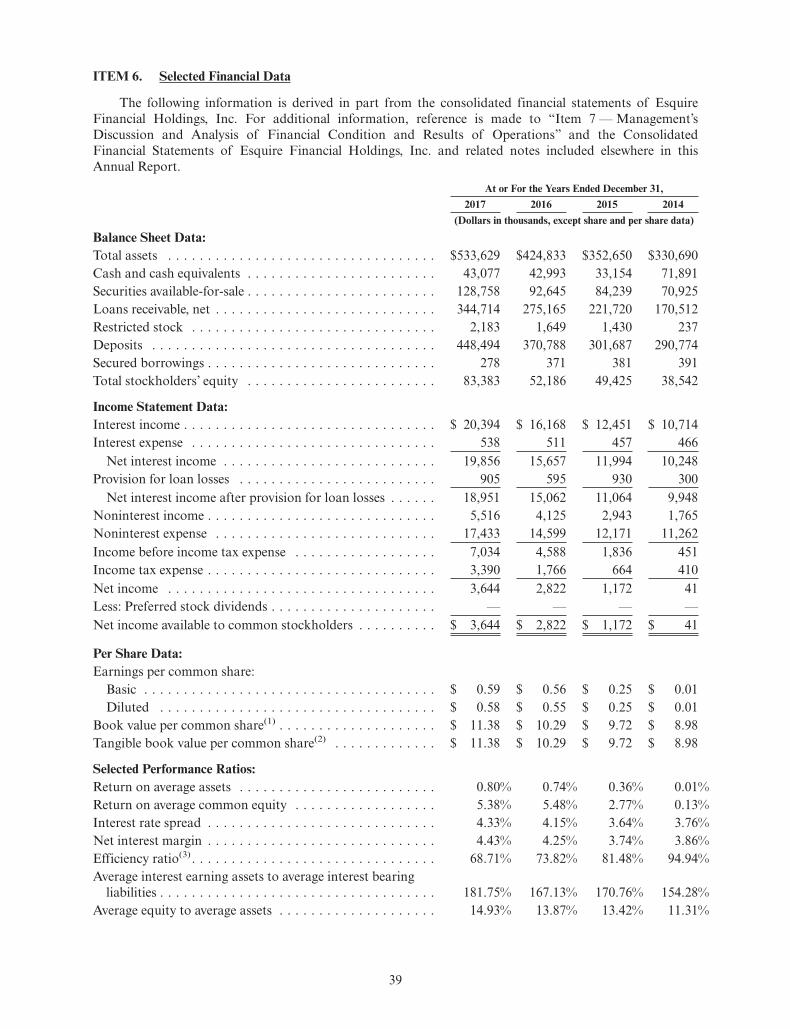
ITEM 6. Selected Financial Data
The following information is derived in part from the consolidated financial statements of EsquireFinancial Holdings, Inc. For additional information, reference is made to “Item 7 — Management’sDiscussion and Analysis of Financial Condition and Results of Operations” and the ConsolidatedFinancial Statements of Esquire Financial Holdings, Inc. and related notes included elsewhere in thisAnnual Report.
At or For the Years Ended December 31,2017 2016 2015 2014
(Dollars in thousands, except share and per share data)
Balance Sheet Data:Total assets . . . . . . . . . . . . . . . . . . . . . . . . . . . . . . . . . . $533,629 $424,833 $352,650 $330,690Cash and cash equivalents . . . . . . . . . . . . . . . . . . . . . . . . 43,077 42,993 33,154 71,891Securities available-for-sale . . . . . . . . . . . . . . . . . . . . . . . . 128,758 92,645 84,239 70,925Loans receivable, net . . . . . . . . . . . . . . . . . . . . . . . . . . . . 344,714 275,165 221,720 170,512Restricted stock . . . . . . . . . . . . . . . . . . . . . . . . . . . . . . . 2,183 1,649 1,430 237Deposits . . . . . . . . . . . . . . . . . . . . . . . . . . . . . . . . . . . . 448,494 370,788 301,687 290,774Secured borrowings . . . . . . . . . . . . . . . . . . . . . . . . . . . . . 278 371 381 391Total stockholders’ equity . . . . . . . . . . . . . . . . . . . . . . . . 83,383 52,186 49,425 38,542
Income Statement Data:Interest income . . . . . . . . . . . . . . . . . . . . . . . . . . . . . . . . $ 20,394 $ 16,168 $ 12,451 $ 10,714Interest expense . . . . . . . . . . . . . . . . . . . . . . . . . . . . . . . 538 511 457 466
Net interest income . . . . . . . . . . . . . . . . . . . . . . . . . . . 19,856 15,657 11,994 10,248Provision for loan losses . . . . . . . . . . . . . . . . . . . . . . . . . 905 595 930 300
Net interest income after provision for loan losses . . . . . . 18,951 15,062 11,064 9,948Noninterest income . . . . . . . . . . . . . . . . . . . . . . . . . . . . . 5,516 4,125 2,943 1,765Noninterest expense . . . . . . . . . . . . . . . . . . . . . . . . . . . . 17,433 14,599 12,171 11,262Income before income tax expense . . . . . . . . . . . . . . . . . . 7,034 4,588 1,836 451Income tax expense . . . . . . . . . . . . . . . . . . . . . . . . . . . . . 3,390 1,766 664 410Net income . . . . . . . . . . . . . . . . . . . . . . . . . . . . . . . . . . 3,644 2,822 1,172 41Less: Preferred stock dividends . . . . . . . . . . . . . . . . . . . . . — — — —Net income available to common stockholders . . . . . . . . . . $ 3,644 $ 2,822 $ 1,172 $ 41
Per Share Data:Earnings per common share:
Basic . . . . . . . . . . . . . . . . . . . . . . . . . . . . . . . . . . . . . $ 0.59 $ 0.56 $ 0.25 $ 0.01Diluted . . . . . . . . . . . . . . . . . . . . . . . . . . . . . . . . . . . $ 0.58 $ 0.55 $ 0.25 $ 0.01
Book value per common share(1) . . . . . . . . . . . . . . . . . . . . $ 11.38 $ 10.29 $ 9.72 $ 8.98Tangible book value per common share(2) . . . . . . . . . . . . . $ 11.38 $ 10.29 $ 9.72 $ 8.98
Selected Performance Ratios:Return on average assets . . . . . . . . . . . . . . . . . . . . . . . . . 0.80% 0.74% 0.36% 0.01%Return on average common equity . . . . . . . . . . . . . . . . . . 5.38% 5.48% 2.77% 0.13%Interest rate spread . . . . . . . . . . . . . . . . . . . . . . . . . . . . . 4.33% 4.15% 3.64% 3.76%Net interest margin . . . . . . . . . . . . . . . . . . . . . . . . . . . . . 4.43% 4.25% 3.74% 3.86%Efficiency ratio(3) . . . . . . . . . . . . . . . . . . . . . . . . . . . . . . . 68.71% 73.82% 81.48% 94.94%Average interest earning assets to average interest bearing
liabilities . . . . . . . . . . . . . . . . . . . . . . . . . . . . . . . . . . . 181.75% 167.13% 170.76% 154.28%Average equity to average assets . . . . . . . . . . . . . . . . . . . . 14.93% 13.87% 13.42% 11.31%
39
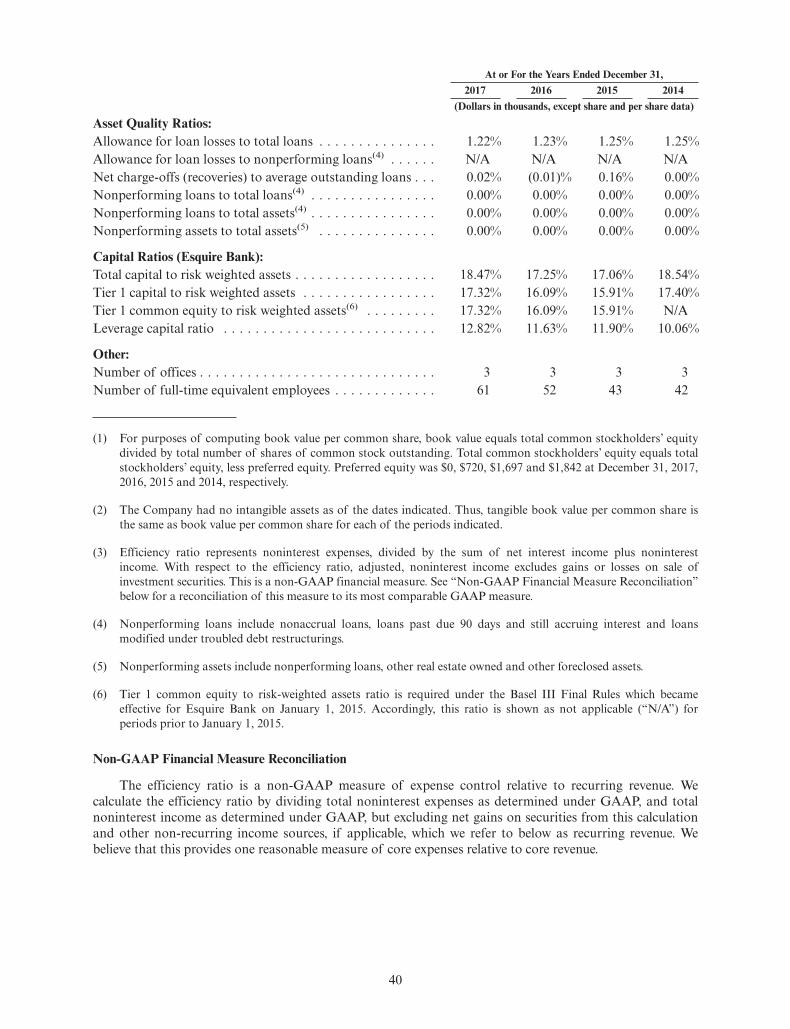
At or For the Years Ended December 31,2017 2016 2015 2014
(Dollars in thousands, except share and per share data)
Asset Quality Ratios:Allowance for loan losses to total loans . . . . . . . . . . . . . . . 1.22% 1.23% 1.25% 1.25%Allowance for loan losses to nonperforming loans(4) . . . . . . N/A N/A N/A N/ANet charge-offs (recoveries) to average outstanding loans . . . 0.02% (0.01)% 0.16% 0.00%Nonperforming loans to total loans(4) . . . . . . . . . . . . . . . . 0.00% 0.00% 0.00% 0.00%Nonperforming loans to total assets(4) . . . . . . . . . . . . . . . . 0.00% 0.00% 0.00% 0.00%Nonperforming assets to total assets(5) . . . . . . . . . . . . . . . 0.00% 0.00% 0.00% 0.00%
Capital Ratios (Esquire Bank):Total capital to risk weighted assets . . . . . . . . . . . . . . . . . . 18.47% 17.25% 17.06% 18.54%Tier 1 capital to risk weighted assets . . . . . . . . . . . . . . . . . 17.32% 16.09% 15.91% 17.40%Tier 1 common equity to risk weighted assets(6) . . . . . . . . . 17.32% 16.09% 15.91% N/ALeverage capital ratio . . . . . . . . . . . . . . . . . . . . . . . . . . . 12.82% 11.63% 11.90% 10.06%
Other:Number of offices . . . . . . . . . . . . . . . . . . . . . . . . . . . . . . 3 3 3 3Number of full-time equivalent employees . . . . . . . . . . . . . 61 52 43 42
(1) For purposes of computing book value per common share, book value equals total common stockholders’ equitydivided by total number of shares of common stock outstanding. Total common stockholders’ equity equals totalstockholders’ equity, less preferred equity. Preferred equity was $0, $720, $1,697 and $1,842 at December 31, 2017,2016, 2015 and 2014, respectively.
(2) The Company had no intangible assets as of the dates indicated. Thus, tangible book value per common share isthe same as book value per common share for each of the periods indicated.
(3) Efficiency ratio represents noninterest expenses, divided by the sum of net interest income plus noninterestincome. With respect to the efficiency ratio, adjusted, noninterest income excludes gains or losses on sale ofinvestment securities. This is a non-GAAP financial measure. See “Non-GAAP Financial Measure Reconciliation”below for a reconciliation of this measure to its most comparable GAAP measure.
(4) Nonperforming loans include nonaccrual loans, loans past due 90 days and still accruing interest and loansmodified under troubled debt restructurings.
(5) Nonperforming assets include nonperforming loans, other real estate owned and other foreclosed assets.
(6) Tier 1 common equity to risk-weighted assets ratio is required under the Basel III Final Rules which becameeffective for Esquire Bank on January 1, 2015. Accordingly, this ratio is shown as not applicable (“N/A”) forperiods prior to January 1, 2015.
Non-GAAP Financial Measure Reconciliation
The efficiency ratio is a non-GAAP measure of expense control relative to recurring revenue. Wecalculate the efficiency ratio by dividing total noninterest expenses as determined under GAAP, and totalnoninterest income as determined under GAAP, but excluding net gains on securities from this calculationand other non-recurring income sources, if applicable, which we refer to below as recurring revenue. Webelieve that this provides one reasonable measure of core expenses relative to core revenue.
40
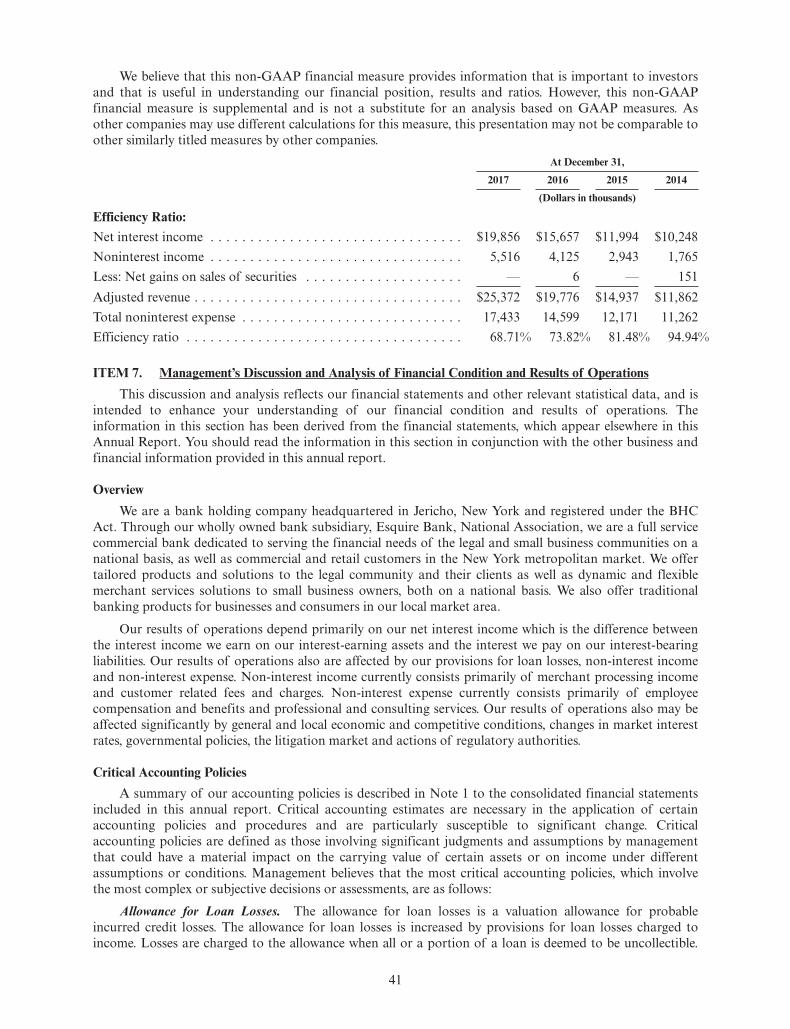
We believe that this non-GAAP financial measure provides information that is important to investorsand that is useful in understanding our financial position, results and ratios. However, this non-GAAPfinancial measure is supplemental and is not a substitute for an analysis based on GAAP measures. Asother companies may use different calculations for this measure, this presentation may not be comparable toother similarly titled measures by other companies.
At December 31,
2017 2016 2015 2014
(Dollars in thousands)
Efficiency Ratio:Net interest income . . . . . . . . . . . . . . . . . . . . . . . . . . . . . . . . $19,856 $15,657 $11,994 $10,248Noninterest income . . . . . . . . . . . . . . . . . . . . . . . . . . . . . . . . 5,516 4,125 2,943 1,765Less: Net gains on sales of securities . . . . . . . . . . . . . . . . . . . . — 6 — 151Adjusted revenue . . . . . . . . . . . . . . . . . . . . . . . . . . . . . . . . . . $25,372 $19,776 $14,937 $11,862Total noninterest expense . . . . . . . . . . . . . . . . . . . . . . . . . . . . 17,433 14,599 12,171 11,262Efficiency ratio . . . . . . . . . . . . . . . . . . . . . . . . . . . . . . . . . . . 68.71% 73.82% 81.48% 94.94%
ITEM 7. Management’s Discussion and Analysis of Financial Condition and Results of Operations
This discussion and analysis reflects our financial statements and other relevant statistical data, and isintended to enhance your understanding of our financial condition and results of operations. Theinformation in this section has been derived from the financial statements, which appear elsewhere in thisAnnual Report. You should read the information in this section in conjunction with the other business andfinancial information provided in this annual report.
Overview
We are a bank holding company headquartered in Jericho, New York and registered under the BHCAct. Through our wholly owned bank subsidiary, Esquire Bank, National Association, we are a full servicecommercial bank dedicated to serving the financial needs of the legal and small business communities on anational basis, as well as commercial and retail customers in the New York metropolitan market. We offertailored products and solutions to the legal community and their clients as well as dynamic and flexiblemerchant services solutions to small business owners, both on a national basis. We also offer traditionalbanking products for businesses and consumers in our local market area.
Our results of operations depend primarily on our net interest income which is the difference betweenthe interest income we earn on our interest-earning assets and the interest we pay on our interest-bearingliabilities. Our results of operations also are affected by our provisions for loan losses, non-interest incomeand non-interest expense. Non-interest income currently consists primarily of merchant processing incomeand customer related fees and charges. Non-interest expense currently consists primarily of employeecompensation and benefits and professional and consulting services. Our results of operations also may beaffected significantly by general and local economic and competitive conditions, changes in market interestrates, governmental policies, the litigation market and actions of regulatory authorities.
Critical Accounting PoliciesA summary of our accounting policies is described in Note 1 to the consolidated financial statements
included in this annual report. Critical accounting estimates are necessary in the application of certainaccounting policies and procedures and are particularly susceptible to significant change. Criticalaccounting policies are defined as those involving significant judgments and assumptions by managementthat could have a material impact on the carrying value of certain assets or on income under differentassumptions or conditions. Management believes that the most critical accounting policies, which involvethe most complex or subjective decisions or assessments, are as follows:
Allowance for Loan Losses. The allowance for loan losses is a valuation allowance for probableincurred credit losses. The allowance for loan losses is increased by provisions for loan losses charged toincome. Losses are charged to the allowance when all or a portion of a loan is deemed to be uncollectible.
41
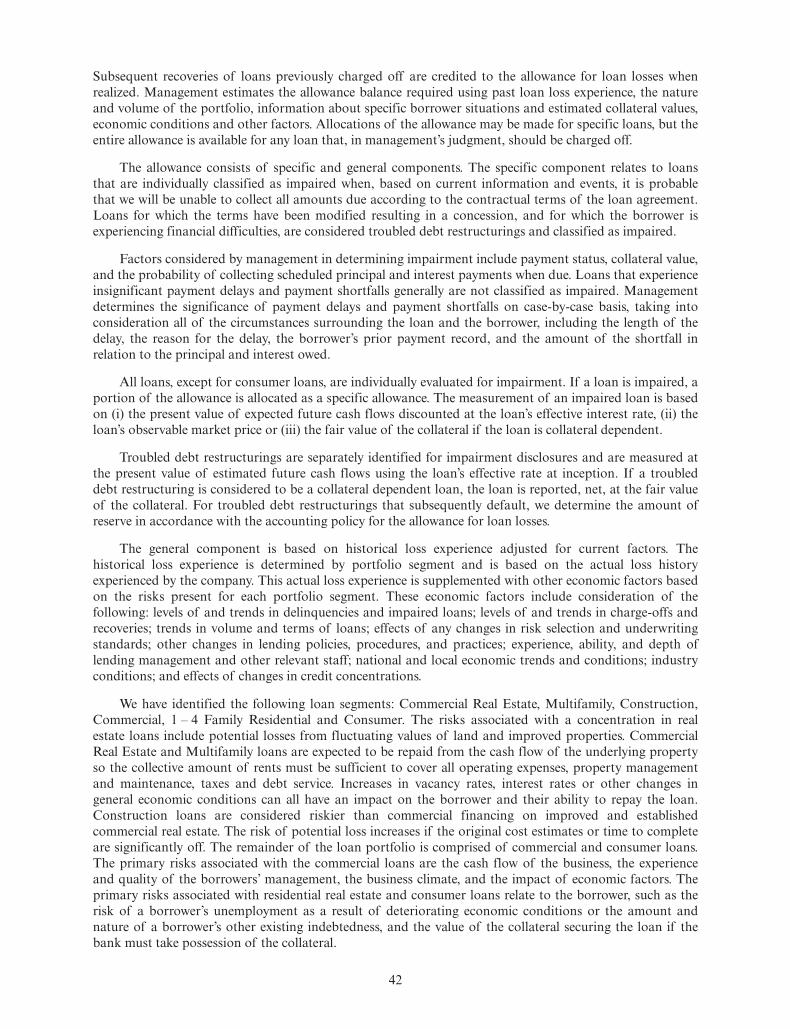
Subsequent recoveries of loans previously charged off are credited to the allowance for loan losses whenrealized. Management estimates the allowance balance required using past loan loss experience, the natureand volume of the portfolio, information about specific borrower situations and estimated collateral values,economic conditions and other factors. Allocations of the allowance may be made for specific loans, but theentire allowance is available for any loan that, in management’s judgment, should be charged off.
The allowance consists of specific and general components. The specific component relates to loansthat are individually classified as impaired when, based on current information and events, it is probablethat we will be unable to collect all amounts due according to the contractual terms of the loan agreement.Loans for which the terms have been modified resulting in a concession, and for which the borrower isexperiencing financial difficulties, are considered troubled debt restructurings and classified as impaired.
Factors considered by management in determining impairment include payment status, collateral value,and the probability of collecting scheduled principal and interest payments when due. Loans that experienceinsignificant payment delays and payment shortfalls generally are not classified as impaired. Managementdetermines the significance of payment delays and payment shortfalls on case-by-case basis, taking intoconsideration all of the circumstances surrounding the loan and the borrower, including the length of thedelay, the reason for the delay, the borrower’s prior payment record, and the amount of the shortfall inrelation to the principal and interest owed.
All loans, except for consumer loans, are individually evaluated for impairment. If a loan is impaired, aportion of the allowance is allocated as a specific allowance. The measurement of an impaired loan is basedon (i) the present value of expected future cash flows discounted at the loan’s effective interest rate, (ii) theloan’s observable market price or (iii) the fair value of the collateral if the loan is collateral dependent.
Troubled debt restructurings are separately identified for impairment disclosures and are measured atthe present value of estimated future cash flows using the loan’s effective rate at inception. If a troubleddebt restructuring is considered to be a collateral dependent loan, the loan is reported, net, at the fair valueof the collateral. For troubled debt restructurings that subsequently default, we determine the amount ofreserve in accordance with the accounting policy for the allowance for loan losses.
The general component is based on historical loss experience adjusted for current factors. Thehistorical loss experience is determined by portfolio segment and is based on the actual loss historyexperienced by the company. This actual loss experience is supplemented with other economic factors basedon the risks present for each portfolio segment. These economic factors include consideration of thefollowing: levels of and trends in delinquencies and impaired loans; levels of and trends in charge-offs andrecoveries; trends in volume and terms of loans; effects of any changes in risk selection and underwritingstandards; other changes in lending policies, procedures, and practices; experience, ability, and depth oflending management and other relevant staff; national and local economic trends and conditions; industryconditions; and effects of changes in credit concentrations.
We have identified the following loan segments: Commercial Real Estate, Multifamily, Construction,Commercial, 1 – 4 Family Residential and Consumer. The risks associated with a concentration in realestate loans include potential losses from fluctuating values of land and improved properties. CommercialReal Estate and Multifamily loans are expected to be repaid from the cash flow of the underlying propertyso the collective amount of rents must be sufficient to cover all operating expenses, property managementand maintenance, taxes and debt service. Increases in vacancy rates, interest rates or other changes ingeneral economic conditions can all have an impact on the borrower and their ability to repay the loan.Construction loans are considered riskier than commercial financing on improved and establishedcommercial real estate. The risk of potential loss increases if the original cost estimates or time to completeare significantly off. The remainder of the loan portfolio is comprised of commercial and consumer loans.The primary risks associated with the commercial loans are the cash flow of the business, the experienceand quality of the borrowers’ management, the business climate, and the impact of economic factors. Theprimary risks associated with residential real estate and consumer loans relate to the borrower, such as therisk of a borrower’s unemployment as a result of deteriorating economic conditions or the amount andnature of a borrower’s other existing indebtedness, and the value of the collateral securing the loan if thebank must take possession of the collateral.
42
Although management uses available information to recognize losses on loans, because ofuncertainties associated with local economic conditions, collateral values and future cash flows on impairedloans, it is reasonably possible that a material change could occur in the allowance for loan losses in thenear term. However, the amount of the change that is reasonably possible cannot be estimated. Theevaluation of the adequacy of loan collateral is often based upon estimates and appraisals. Because ofchanging economic conditions, the valuations determined from such estimates and appraisals may alsochange. Accordingly, we may ultimately incur losses that vary from management’s current estimates.Adjustments to the allowance for loan losses will be reported in the period such adjustments become knownor can be reasonably estimated. All loan losses are charged to the allowance for loan losses when the lossactually occurs or when the collectability of the principal is unlikely. Recoveries are credited to theallowance at the time of recovery.
Income Taxes. Income taxes are provided for under the asset and liability method. Deferred tax assetsand liabilities are recognized for the future tax consequences attributable to differences between thefinancial statement carrying amounts of existing assets and liabilities and their respective tax bases.Deferred tax assets and liabilities are measured using enacted rates expected to apply to taxable income inthe years in which those temporary differences are expected to be recovered or settled. The effect ondeferred taxes of a change in tax rates is recognized in income in the period the change occurs. Deferred taxassets are reduced, through a valuation allowance, if necessary, by the amount of such benefits that are notexpected to be realized based on current available evidence.
A tax position is recognized as a benefit only if it is “more likely than not” that the tax position wouldbe sustained in a tax examination, with a tax examination being presumed to occur. The amount recognizedis the largest amount of tax benefit that is greater than 50% likely of being realized on examination. For taxpositions not meeting the “more likely than not” test, no tax benefit is recorded. The Company recognizesinterest and/or penalties related to income tax matters in income tax expense.
Emerging Growth Company. Pursuant to the JOBS Act, an emerging growth company is provided theoption to adopt new or revised accounting standards that may be issued by the Financial AccountingStandards Board (“FASB”) or the SEC either (i) within the same periods as those otherwise applicable tonon-emerging growth companies or (ii) within the same time periods as private companies. We haveirrevocably elected to adopt new accounting standards within the public company adoption period.
Although we are still evaluating the JOBS Act, we may take advantage of some of the reducedregulatory and reporting requirements that are available to it so long as we qualify as an emerging growthcompany, including, but not limited to, not being required to comply with the auditor attestationrequirements of Section 404(b) of the Sarbanes-Oxley Act, reduced disclosure obligations regardingexecutive compensation, and exemptions from the requirements of holding non-binding advisory votes onexecutive compensation and golden parachute payments.
Discussion and Analysis of Financial Condition for the Years Ended December 31, 2017 and 2016
Assets. Our total assets were $533.6 million at December 31, 2017, an increase of $108.8 million from$424.8 million at December 31, 2016. The increase was primarily due to an increase in loans and securities.
Loan Portfolio Analysis. At December 31, 2017, net loans were $344.7 million, or 64.6% of totalassets, compared to $275.2 million, or 64.8% of total assets, at December 31, 2016. Commercial loansincreased $30.3 million, or 28.6%, to $136.4 million at December 31, 2017 from $106.1 million atDecember 31, 2016. Multifamily loans increased $15.0 million, or 18.0%, to $98.4 million at December 31,2017 from $83.4 million at December 31, 2016. Consumer loans increased $21.3 million or 201.6%, to$31.9 million at December 31, 2017 from $10.6 million at December 31, 2016. 1-4 family residential loansincreased $2.0 million, or 3.9%, to $51.6 million at December 31, 2017 from $49.6 million at December 31,2016. Construction loans decreased $563,000, or 10.0%, to $5.0 million at December 31, 2017 from$5.6 million at December 31, 2016. Commercial real estate loans increased by $2.6 million, or 11.5%, to$24.8 million at December 31, 2017 from $22.2 million at December 31, 2016.
43
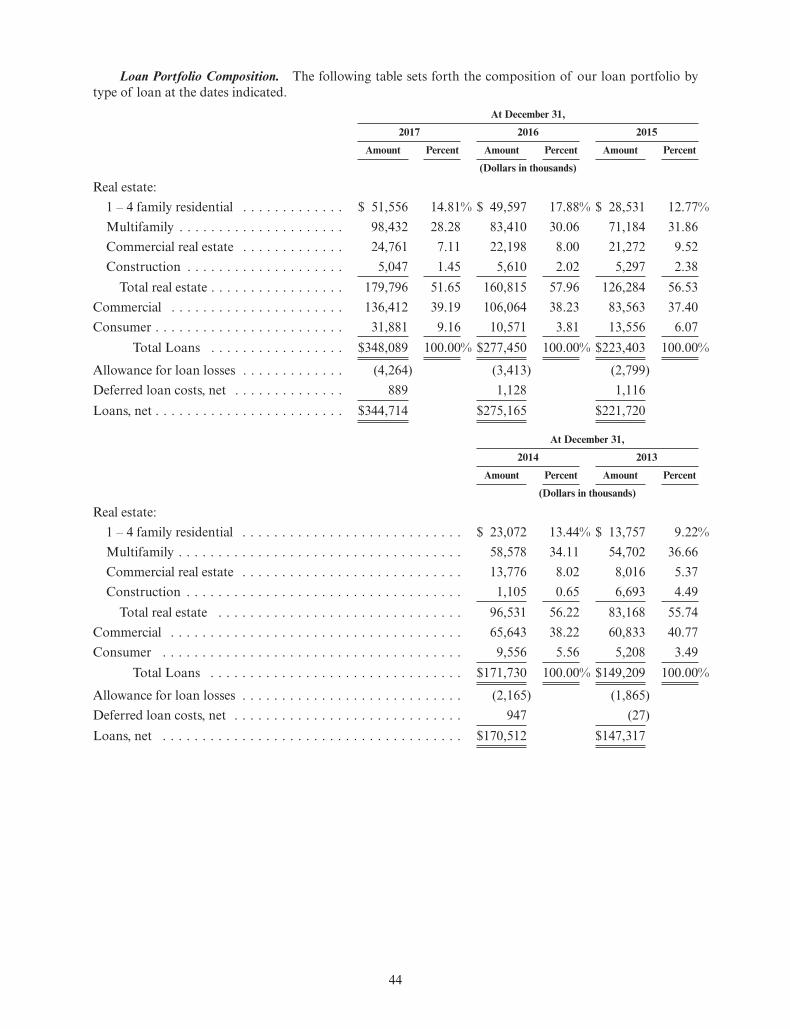
Loan Portfolio Composition. The following table sets forth the composition of our loan portfolio bytype of loan at the dates indicated.
At December 31,
2017 2016 2015
Amount Percent Amount Percent Amount Percent
(Dollars in thousands)
Real estate:1 – 4 family residential . . . . . . . . . . . . . $ 51,556 14.81% $ 49,597 17.88% $ 28,531 12.77%Multifamily . . . . . . . . . . . . . . . . . . . . . 98,432 28.28 83,410 30.06 71,184 31.86Commercial real estate . . . . . . . . . . . . . 24,761 7.11 22,198 8.00 21,272 9.52Construction . . . . . . . . . . . . . . . . . . . . 5,047 1.45 5,610 2.02 5,297 2.38
Total real estate . . . . . . . . . . . . . . . . . 179,796 51.65 160,815 57.96 126,284 56.53Commercial . . . . . . . . . . . . . . . . . . . . . . 136,412 39.19 106,064 38.23 83,563 37.40Consumer . . . . . . . . . . . . . . . . . . . . . . . . 31,881 9.16 10,571 3.81 13,556 6.07
Total Loans . . . . . . . . . . . . . . . . . $348,089 100.00% $277,450 100.00% $223,403 100.00%
Allowance for loan losses . . . . . . . . . . . . . (4,264) (3,413) (2,799)Deferred loan costs, net . . . . . . . . . . . . . . 889 1,128 1,116Loans, net . . . . . . . . . . . . . . . . . . . . . . . . $344,714 $275,165 $221,720
At December 31,
2014 2013
Amount Percent Amount Percent
(Dollars in thousands)
Real estate:1 – 4 family residential . . . . . . . . . . . . . . . . . . . . . . . . . . . . $ 23,072 13.44% $ 13,757 9.22%Multifamily . . . . . . . . . . . . . . . . . . . . . . . . . . . . . . . . . . . . 58,578 34.11 54,702 36.66Commercial real estate . . . . . . . . . . . . . . . . . . . . . . . . . . . . 13,776 8.02 8,016 5.37Construction . . . . . . . . . . . . . . . . . . . . . . . . . . . . . . . . . . . 1,105 0.65 6,693 4.49
Total real estate . . . . . . . . . . . . . . . . . . . . . . . . . . . . . . . 96,531 56.22 83,168 55.74Commercial . . . . . . . . . . . . . . . . . . . . . . . . . . . . . . . . . . . . . 65,643 38.22 60,833 40.77Consumer . . . . . . . . . . . . . . . . . . . . . . . . . . . . . . . . . . . . . . 9,556 5.56 5,208 3.49
Total Loans . . . . . . . . . . . . . . . . . . . . . . . . . . . . . . . . $171,730 100.00% $149,209 100.00%
Allowance for loan losses . . . . . . . . . . . . . . . . . . . . . . . . . . . . (2,165) (1,865)Deferred loan costs, net . . . . . . . . . . . . . . . . . . . . . . . . . . . . . 947 (27)Loans, net . . . . . . . . . . . . . . . . . . . . . . . . . . . . . . . . . . . . . . $170,512 $147,317
44
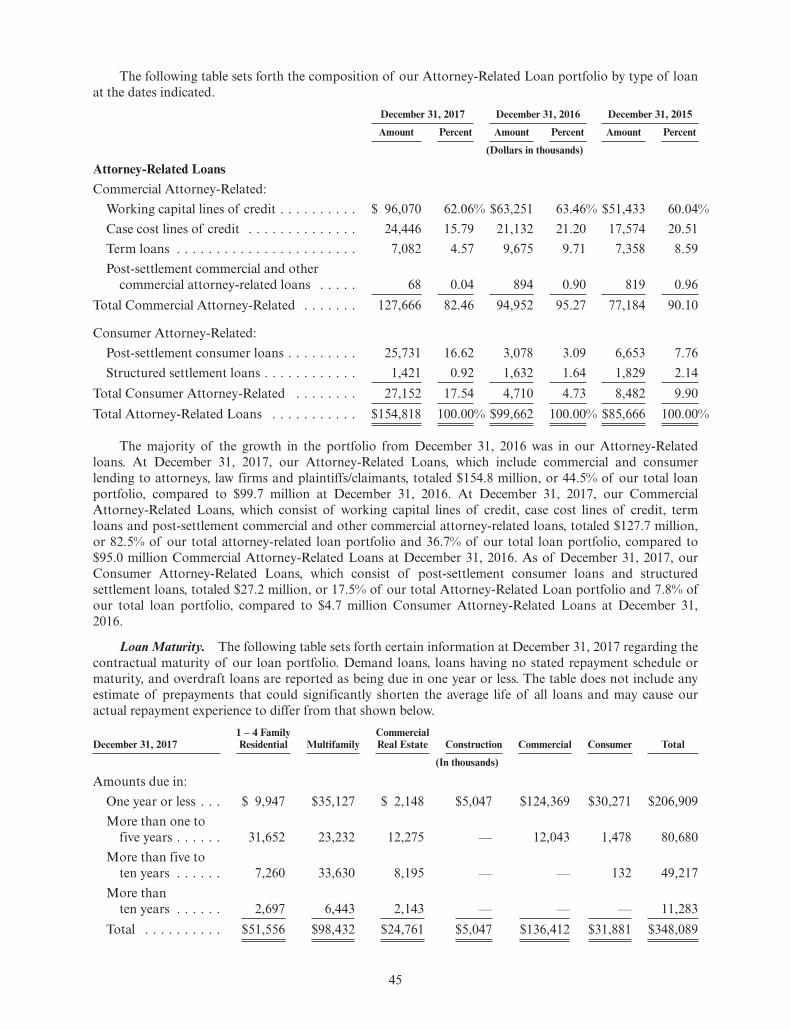
The following table sets forth the composition of our Attorney-Related Loan portfolio by type of loanat the dates indicated.
December 31, 2017 December 31, 2016 December 31, 2015
Amount Percent Amount Percent Amount Percent
(Dollars in thousands)
Attorney-Related LoansCommercial Attorney-Related:
Working capital lines of credit . . . . . . . . . . $ 96,070 62.06% $63,251 63.46% $51,433 60.04%Case cost lines of credit . . . . . . . . . . . . . . 24,446 15.79 21,132 21.20 17,574 20.51Term loans . . . . . . . . . . . . . . . . . . . . . . . 7,082 4.57 9,675 9.71 7,358 8.59Post-settlement commercial and other
commercial attorney-related loans . . . . . 68 0.04 894 0.90 819 0.96Total Commercial Attorney-Related . . . . . . . 127,666 82.46 94,952 95.27 77,184 90.10
Consumer Attorney-Related:Post-settlement consumer loans . . . . . . . . . 25,731 16.62 3,078 3.09 6,653 7.76Structured settlement loans . . . . . . . . . . . . 1,421 0.92 1,632 1.64 1,829 2.14
Total Consumer Attorney-Related . . . . . . . . 27,152 17.54 4,710 4.73 8,482 9.90Total Attorney-Related Loans . . . . . . . . . . . $154,818 100.00% $99,662 100.00% $85,666 100.00%
The majority of the growth in the portfolio from December 31, 2016 was in our Attorney-Relatedloans. At December 31, 2017, our Attorney-Related Loans, which include commercial and consumerlending to attorneys, law firms and plaintiffs/claimants, totaled $154.8 million, or 44.5% of our total loanportfolio, compared to $99.7 million at December 31, 2016. At December 31, 2017, our CommercialAttorney-Related Loans, which consist of working capital lines of credit, case cost lines of credit, termloans and post-settlement commercial and other commercial attorney-related loans, totaled $127.7 million,or 82.5% of our total attorney-related loan portfolio and 36.7% of our total loan portfolio, compared to$95.0 million Commercial Attorney-Related Loans at December 31, 2016. As of December 31, 2017, ourConsumer Attorney-Related Loans, which consist of post-settlement consumer loans and structuredsettlement loans, totaled $27.2 million, or 17.5% of our total Attorney-Related Loan portfolio and 7.8% ofour total loan portfolio, compared to $4.7 million Consumer Attorney-Related Loans at December 31,2016.
Loan Maturity. The following table sets forth certain information at December 31, 2017 regarding thecontractual maturity of our loan portfolio. Demand loans, loans having no stated repayment schedule ormaturity, and overdraft loans are reported as being due in one year or less. The table does not include anyestimate of prepayments that could significantly shorten the average life of all loans and may cause ouractual repayment experience to differ from that shown below.
December 31, 20171 – 4 FamilyResidential Multifamily
CommercialReal Estate Construction Commercial Consumer Total
(In thousands)
Amounts due in:One year or less . . . $ 9,947 $35,127 $ 2,148 $5,047 $124,369 $30,271 $206,909More than one to
five years . . . . . . 31,652 23,232 12,275 — 12,043 1,478 80,680More than five to
ten years . . . . . . 7,260 33,630 8,195 — — 132 49,217More than
ten years . . . . . . 2,697 6,443 2,143 — — — 11,283Total . . . . . . . . . . $51,556 $98,432 $24,761 $5,047 $136,412 $31,881 $348,089
45
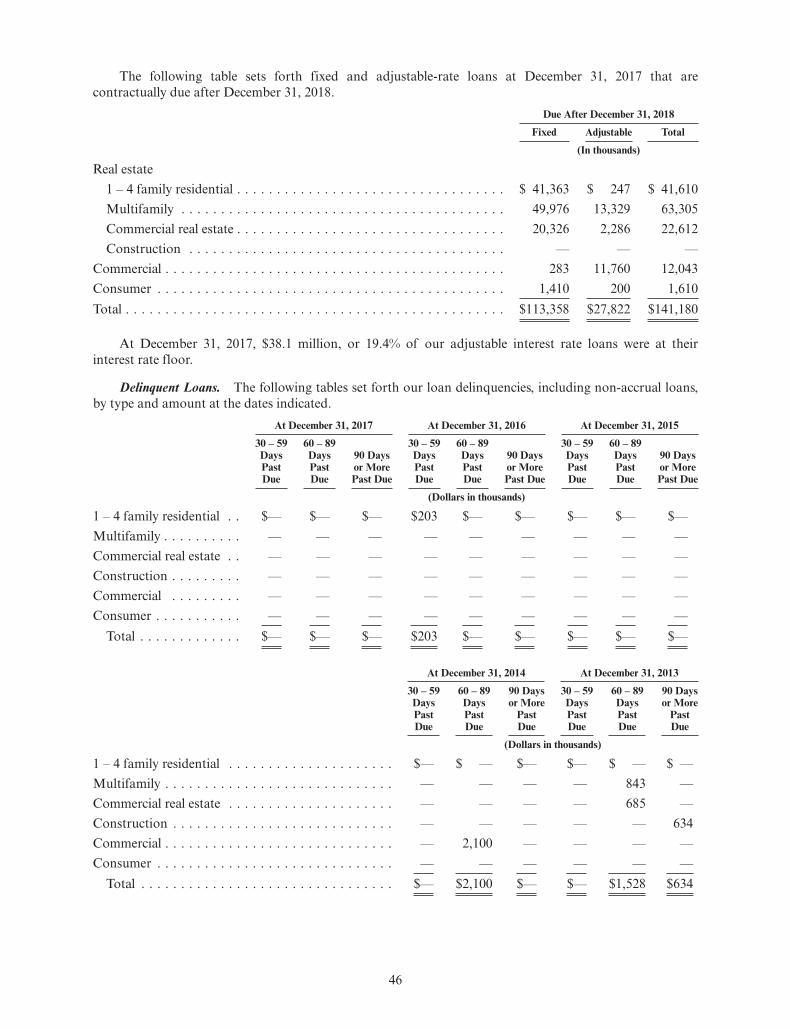
The following table sets forth fixed and adjustable-rate loans at December 31, 2017 that arecontractually due after December 31, 2018.
Due After December 31, 2018
Fixed Adjustable Total
(In thousands)
Real estate1 – 4 family residential . . . . . . . . . . . . . . . . . . . . . . . . . . . . . . . . . . $ 41,363 $ 247 $ 41,610Multifamily . . . . . . . . . . . . . . . . . . . . . . . . . . . . . . . . . . . . . . . . . 49,976 13,329 63,305Commercial real estate . . . . . . . . . . . . . . . . . . . . . . . . . . . . . . . . . . 20,326 2,286 22,612Construction . . . . . . . . . . . . . . . . . . . . . . . . . . . . . . . . . . . . . . . . — — —
Commercial . . . . . . . . . . . . . . . . . . . . . . . . . . . . . . . . . . . . . . . . . . . 283 11,760 12,043Consumer . . . . . . . . . . . . . . . . . . . . . . . . . . . . . . . . . . . . . . . . . . . . 1,410 200 1,610Total . . . . . . . . . . . . . . . . . . . . . . . . . . . . . . . . . . . . . . . . . . . . . . . . $113,358 $27,822 $141,180
At December 31, 2017, $38.1 million, or 19.4% of our adjustable interest rate loans were at theirinterest rate floor.
Delinquent Loans. The following tables set forth our loan delinquencies, including non-accrual loans,by type and amount at the dates indicated.
At December 31, 2017 At December 31, 2016 At December 31, 2015
30 – 59DaysPastDue
60 – 89DaysPastDue
90 Daysor MorePast Due
30 – 59DaysPastDue
60 – 89DaysPastDue
90 Daysor MorePast Due
30 – 59DaysPastDue
60 – 89DaysPastDue
90 Daysor MorePast Due
(Dollars in thousands)
1 – 4 family residential . . $— $— $— $203 $— $— $— $— $—Multifamily . . . . . . . . . . — — — — — — — — —Commercial real estate . . — — — — — — — — —Construction . . . . . . . . . — — — — — — — — —Commercial . . . . . . . . . — — — — — — — — —Consumer . . . . . . . . . . . — — — — — — — — —
Total . . . . . . . . . . . . . $— $— $— $203 $— $— $— $— $—
At December 31, 2014 At December 31, 2013
30 – 59DaysPastDue
60 – 89DaysPastDue
90 Daysor More
PastDue
30 – 59DaysPastDue
60 – 89DaysPastDue
90 Daysor More
PastDue
(Dollars in thousands)
1 – 4 family residential . . . . . . . . . . . . . . . . . . . . . $— $ — $— $— $ — $ —Multifamily . . . . . . . . . . . . . . . . . . . . . . . . . . . . . — — — — 843 —Commercial real estate . . . . . . . . . . . . . . . . . . . . . — — — — 685 —Construction . . . . . . . . . . . . . . . . . . . . . . . . . . . . — — — — — 634Commercial . . . . . . . . . . . . . . . . . . . . . . . . . . . . . — 2,100 — — — —Consumer . . . . . . . . . . . . . . . . . . . . . . . . . . . . . . — — — — — —
Total . . . . . . . . . . . . . . . . . . . . . . . . . . . . . . . . $— $2,100 $— $— $1,528 $634
46
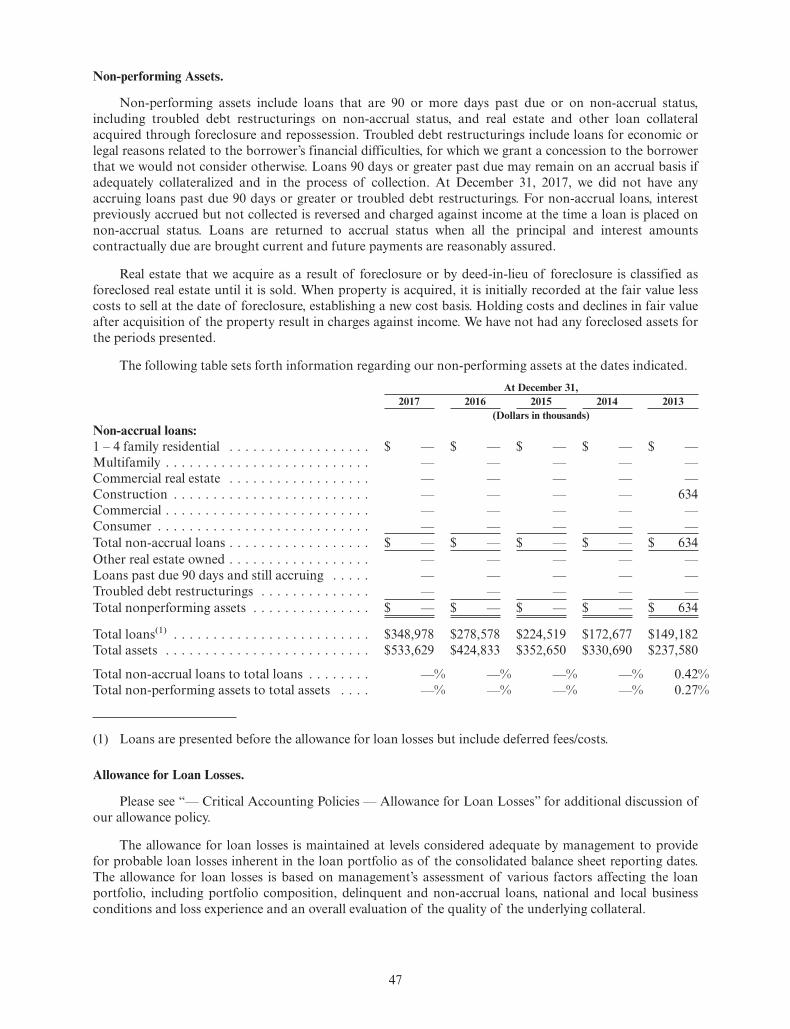
Non-performing Assets.
Non-performing assets include loans that are 90 or more days past due or on non-accrual status,including troubled debt restructurings on non-accrual status, and real estate and other loan collateralacquired through foreclosure and repossession. Troubled debt restructurings include loans for economic orlegal reasons related to the borrower’s financial difficulties, for which we grant a concession to the borrowerthat we would not consider otherwise. Loans 90 days or greater past due may remain on an accrual basis ifadequately collateralized and in the process of collection. At December 31, 2017, we did not have anyaccruing loans past due 90 days or greater or troubled debt restructurings. For non-accrual loans, interestpreviously accrued but not collected is reversed and charged against income at the time a loan is placed onnon-accrual status. Loans are returned to accrual status when all the principal and interest amountscontractually due are brought current and future payments are reasonably assured.
Real estate that we acquire as a result of foreclosure or by deed-in-lieu of foreclosure is classified asforeclosed real estate until it is sold. When property is acquired, it is initially recorded at the fair value lesscosts to sell at the date of foreclosure, establishing a new cost basis. Holding costs and declines in fair valueafter acquisition of the property result in charges against income. We have not had any foreclosed assets forthe periods presented.
The following table sets forth information regarding our non-performing assets at the dates indicated.At December 31,
2017 2016 2015 2014 2013(Dollars in thousands)
Non-accrual loans:1 – 4 family residential . . . . . . . . . . . . . . . . . . $ — $ — $ — $ — $ —Multifamily . . . . . . . . . . . . . . . . . . . . . . . . . . — — — — —Commercial real estate . . . . . . . . . . . . . . . . . . — — — — —Construction . . . . . . . . . . . . . . . . . . . . . . . . . — — — — 634Commercial . . . . . . . . . . . . . . . . . . . . . . . . . . — — — — —Consumer . . . . . . . . . . . . . . . . . . . . . . . . . . . — — — — —Total non-accrual loans . . . . . . . . . . . . . . . . . . $ — $ — $ — $ — $ 634Other real estate owned . . . . . . . . . . . . . . . . . . — — — — —Loans past due 90 days and still accruing . . . . . — — — — —Troubled debt restructurings . . . . . . . . . . . . . . — — — — —Total nonperforming assets . . . . . . . . . . . . . . . $ — $ — $ — $ — $ 634
Total loans(1) . . . . . . . . . . . . . . . . . . . . . . . . . $348,978 $278,578 $224,519 $172,677 $149,182Total assets . . . . . . . . . . . . . . . . . . . . . . . . . . $533,629 $424,833 $352,650 $330,690 $237,580
Total non-accrual loans to total loans . . . . . . . . —% —% —% —% 0.42%Total non-performing assets to total assets . . . . —% —% —% —% 0.27%
(1) Loans are presented before the allowance for loan losses but include deferred fees/costs.
Allowance for Loan Losses.
Please see “— Critical Accounting Policies — Allowance for Loan Losses” for additional discussion ofour allowance policy.
The allowance for loan losses is maintained at levels considered adequate by management to providefor probable loan losses inherent in the loan portfolio as of the consolidated balance sheet reporting dates.The allowance for loan losses is based on management’s assessment of various factors affecting the loanportfolio, including portfolio composition, delinquent and non-accrual loans, national and local businessconditions and loss experience and an overall evaluation of the quality of the underlying collateral.
47
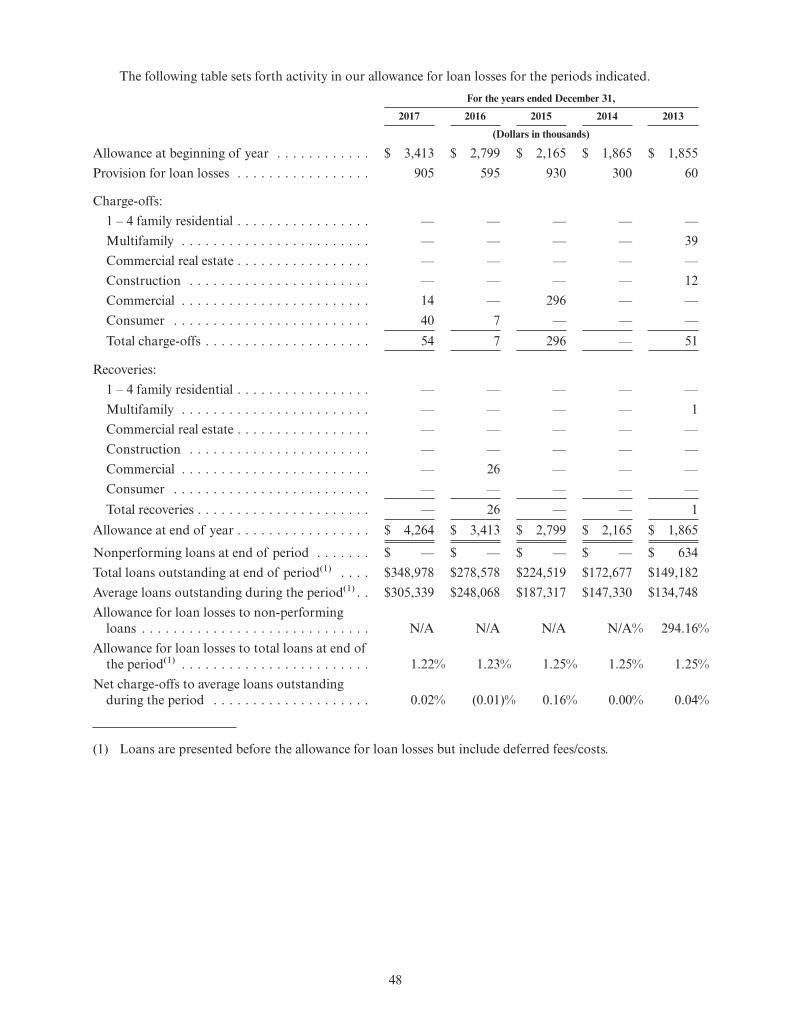
The following table sets forth activity in our allowance for loan losses for the periods indicated.For the years ended December 31,
2017 2016 2015 2014 2013
(Dollars in thousands)
Allowance at beginning of year . . . . . . . . . . . . $ 3,413 $ 2,799 $ 2,165 $ 1,865 $ 1,855Provision for loan losses . . . . . . . . . . . . . . . . . 905 595 930 300 60
Charge-offs:1 – 4 family residential . . . . . . . . . . . . . . . . . — — — — —Multifamily . . . . . . . . . . . . . . . . . . . . . . . . — — — — 39Commercial real estate . . . . . . . . . . . . . . . . . — — — — —Construction . . . . . . . . . . . . . . . . . . . . . . . — — — — 12Commercial . . . . . . . . . . . . . . . . . . . . . . . . 14 — 296 — —Consumer . . . . . . . . . . . . . . . . . . . . . . . . . 40 7 — — —Total charge-offs . . . . . . . . . . . . . . . . . . . . . 54 7 296 — 51
Recoveries:1 – 4 family residential . . . . . . . . . . . . . . . . . — — — — —Multifamily . . . . . . . . . . . . . . . . . . . . . . . . — — — — 1Commercial real estate . . . . . . . . . . . . . . . . . — — — — —Construction . . . . . . . . . . . . . . . . . . . . . . . — — — — —Commercial . . . . . . . . . . . . . . . . . . . . . . . . — 26 — — —Consumer . . . . . . . . . . . . . . . . . . . . . . . . . — — — — —Total recoveries . . . . . . . . . . . . . . . . . . . . . . — 26 — — 1
Allowance at end of year . . . . . . . . . . . . . . . . . $ 4,264 $ 3,413 $ 2,799 $ 2,165 $ 1,865
Nonperforming loans at end of period . . . . . . . $ — $ — $ — $ — $ 634Total loans outstanding at end of period(1) . . . . $348,978 $278,578 $224,519 $172,677 $149,182Average loans outstanding during the period(1) . . $305,339 $248,068 $187,317 $147,330 $134,748Allowance for loan losses to non-performing
loans . . . . . . . . . . . . . . . . . . . . . . . . . . . . . N/A N/A N/A N/A% 294.16%Allowance for loan losses to total loans at end of
the period(1) . . . . . . . . . . . . . . . . . . . . . . . . 1.22% 1.23% 1.25% 1.25% 1.25%Net charge-offs to average loans outstanding
during the period . . . . . . . . . . . . . . . . . . . . 0.02% (0.01)% 0.16% 0.00% 0.04%
(1) Loans are presented before the allowance for loan losses but include deferred fees/costs.
48
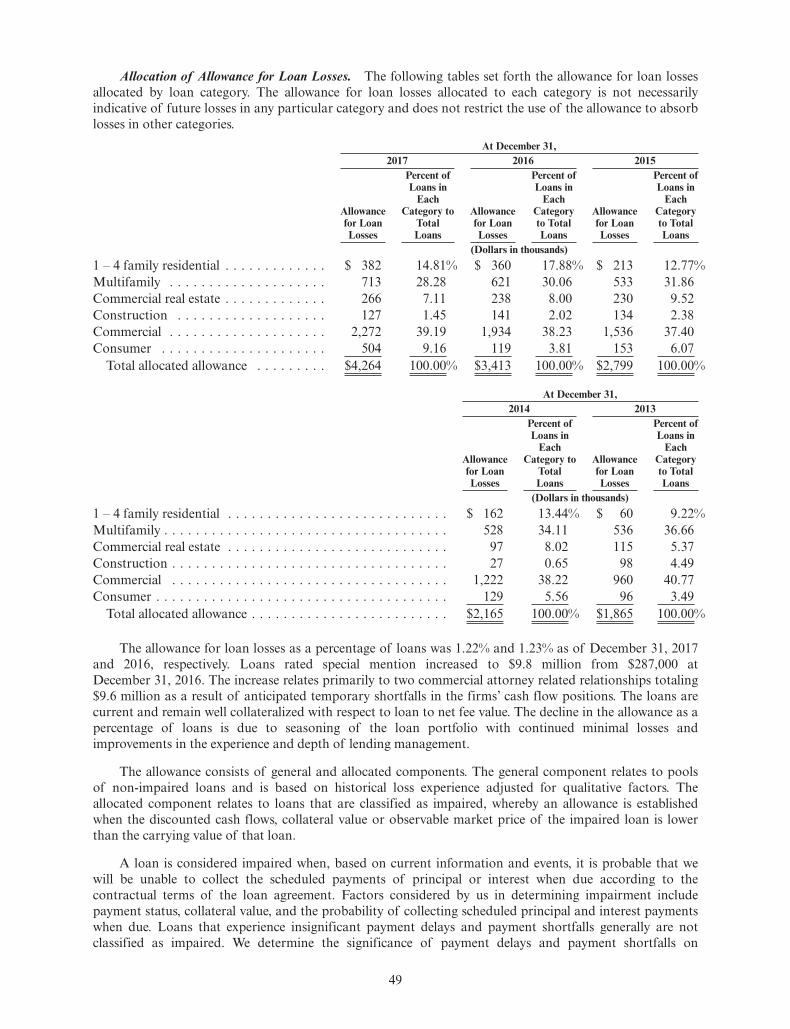
Allocation of Allowance for Loan Losses. The following tables set forth the allowance for loan lossesallocated by loan category. The allowance for loan losses allocated to each category is not necessarilyindicative of future losses in any particular category and does not restrict the use of the allowance to absorblosses in other categories.
At December 31,2017 2016 2015
Allowancefor LoanLosses
Percent ofLoans in
EachCategory to
TotalLoans
Allowancefor LoanLosses
Percent ofLoans in
EachCategoryto TotalLoans
Allowancefor LoanLosses
Percent ofLoans in
EachCategoryto TotalLoans
(Dollars in thousands)1 – 4 family residential . . . . . . . . . . . . . $ 382 14.81% $ 360 17.88% $ 213 12.77%Multifamily . . . . . . . . . . . . . . . . . . . . 713 28.28 621 30.06 533 31.86Commercial real estate . . . . . . . . . . . . . 266 7.11 238 8.00 230 9.52Construction . . . . . . . . . . . . . . . . . . . 127 1.45 141 2.02 134 2.38Commercial . . . . . . . . . . . . . . . . . . . . 2,272 39.19 1,934 38.23 1,536 37.40Consumer . . . . . . . . . . . . . . . . . . . . . 504 9.16 119 3.81 153 6.07
Total allocated allowance . . . . . . . . . $4,264 100.00% $3,413 100.00% $2,799 100.00%
At December 31,2014 2013
Allowancefor LoanLosses
Percent ofLoans in
EachCategory to
TotalLoans
Allowancefor LoanLosses
Percent ofLoans in
EachCategoryto TotalLoans
(Dollars in thousands)1 – 4 family residential . . . . . . . . . . . . . . . . . . . . . . . . . . . . $ 162 13.44% $ 60 9.22%Multifamily . . . . . . . . . . . . . . . . . . . . . . . . . . . . . . . . . . . . 528 34.11 536 36.66Commercial real estate . . . . . . . . . . . . . . . . . . . . . . . . . . . . 97 8.02 115 5.37Construction . . . . . . . . . . . . . . . . . . . . . . . . . . . . . . . . . . . 27 0.65 98 4.49Commercial . . . . . . . . . . . . . . . . . . . . . . . . . . . . . . . . . . . 1,222 38.22 960 40.77Consumer . . . . . . . . . . . . . . . . . . . . . . . . . . . . . . . . . . . . . 129 5.56 96 3.49
Total allocated allowance . . . . . . . . . . . . . . . . . . . . . . . . . $2,165 100.00% $1,865 100.00%
The allowance for loan losses as a percentage of loans was 1.22% and 1.23% as of December 31, 2017and 2016, respectively. Loans rated special mention increased to $9.8 million from $287,000 atDecember 31, 2016. The increase relates primarily to two commercial attorney related relationships totaling$9.6 million as a result of anticipated temporary shortfalls in the firms’ cash flow positions. The loans arecurrent and remain well collateralized with respect to loan to net fee value. The decline in the allowance as apercentage of loans is due to seasoning of the loan portfolio with continued minimal losses andimprovements in the experience and depth of lending management.
The allowance consists of general and allocated components. The general component relates to poolsof non-impaired loans and is based on historical loss experience adjusted for qualitative factors. Theallocated component relates to loans that are classified as impaired, whereby an allowance is establishedwhen the discounted cash flows, collateral value or observable market price of the impaired loan is lowerthan the carrying value of that loan.
A loan is considered impaired when, based on current information and events, it is probable that wewill be unable to collect the scheduled payments of principal or interest when due according to thecontractual terms of the loan agreement. Factors considered by us in determining impairment includepayment status, collateral value, and the probability of collecting scheduled principal and interest paymentswhen due. Loans that experience insignificant payment delays and payment shortfalls generally are notclassified as impaired. We determine the significance of payment delays and payment shortfalls on
49
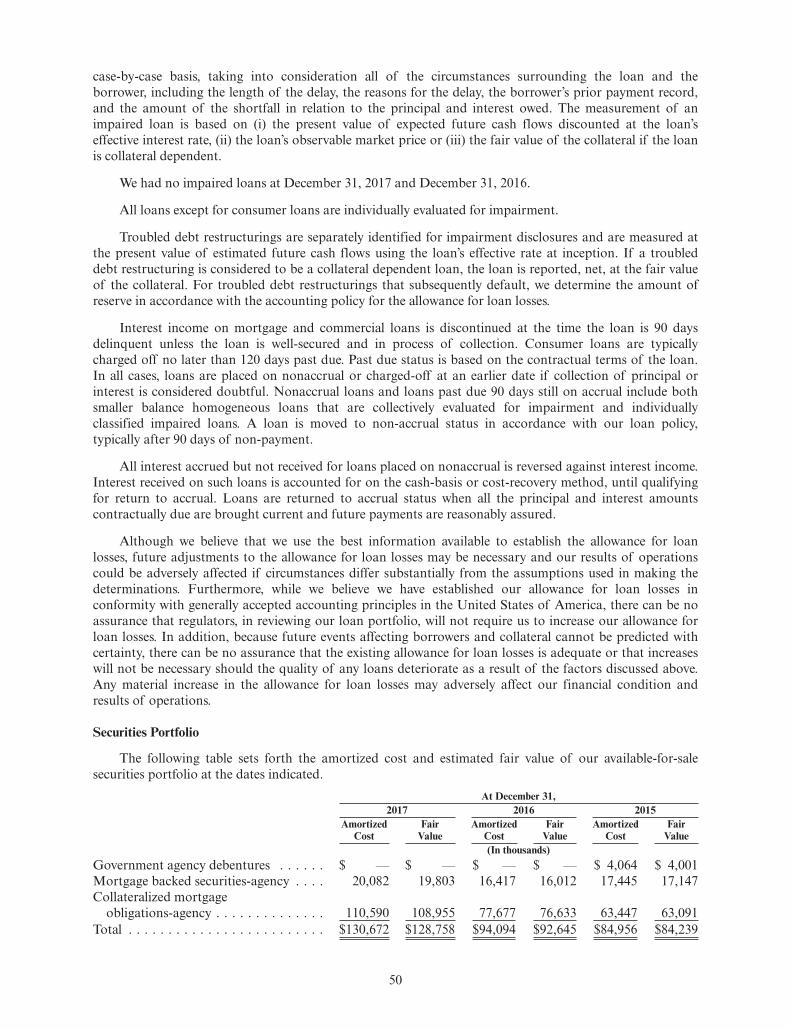
case-by-case basis, taking into consideration all of the circumstances surrounding the loan and theborrower, including the length of the delay, the reasons for the delay, the borrower’s prior payment record,and the amount of the shortfall in relation to the principal and interest owed. The measurement of animpaired loan is based on (i) the present value of expected future cash flows discounted at the loan’seffective interest rate, (ii) the loan’s observable market price or (iii) the fair value of the collateral if the loanis collateral dependent.
We had no impaired loans at December 31, 2017 and December 31, 2016.
All loans except for consumer loans are individually evaluated for impairment.
Troubled debt restructurings are separately identified for impairment disclosures and are measured atthe present value of estimated future cash flows using the loan’s effective rate at inception. If a troubleddebt restructuring is considered to be a collateral dependent loan, the loan is reported, net, at the fair valueof the collateral. For troubled debt restructurings that subsequently default, we determine the amount ofreserve in accordance with the accounting policy for the allowance for loan losses.
Interest income on mortgage and commercial loans is discontinued at the time the loan is 90 daysdelinquent unless the loan is well-secured and in process of collection. Consumer loans are typicallycharged off no later than 120 days past due. Past due status is based on the contractual terms of the loan.In all cases, loans are placed on nonaccrual or charged-off at an earlier date if collection of principal orinterest is considered doubtful. Nonaccrual loans and loans past due 90 days still on accrual include bothsmaller balance homogeneous loans that are collectively evaluated for impairment and individuallyclassified impaired loans. A loan is moved to non-accrual status in accordance with our loan policy,typically after 90 days of non-payment.
All interest accrued but not received for loans placed on nonaccrual is reversed against interest income.Interest received on such loans is accounted for on the cash-basis or cost-recovery method, until qualifyingfor return to accrual. Loans are returned to accrual status when all the principal and interest amountscontractually due are brought current and future payments are reasonably assured.
Although we believe that we use the best information available to establish the allowance for loanlosses, future adjustments to the allowance for loan losses may be necessary and our results of operationscould be adversely affected if circumstances differ substantially from the assumptions used in making thedeterminations. Furthermore, while we believe we have established our allowance for loan losses inconformity with generally accepted accounting principles in the United States of America, there can be noassurance that regulators, in reviewing our loan portfolio, will not require us to increase our allowance forloan losses. In addition, because future events affecting borrowers and collateral cannot be predicted withcertainty, there can be no assurance that the existing allowance for loan losses is adequate or that increaseswill not be necessary should the quality of any loans deteriorate as a result of the factors discussed above.Any material increase in the allowance for loan losses may adversely affect our financial condition andresults of operations.
Securities Portfolio
The following table sets forth the amortized cost and estimated fair value of our available-for-salesecurities portfolio at the dates indicated.
At December 31,2017 2016 2015
AmortizedCost
FairValue
AmortizedCost
FairValue
AmortizedCost
FairValue
(In thousands)Government agency debentures . . . . . . $ — $ — $ — $ — $ 4,064 $ 4,001Mortgage backed securities-agency . . . . 20,082 19,803 16,417 16,012 17,445 17,147Collateralized mortgage
obligations-agency . . . . . . . . . . . . . . 110,590 108,955 77,677 76,633 63,447 63,091Total . . . . . . . . . . . . . . . . . . . . . . . . . $130,672 $128,758 $94,094 $92,645 $84,956 $84,239
50
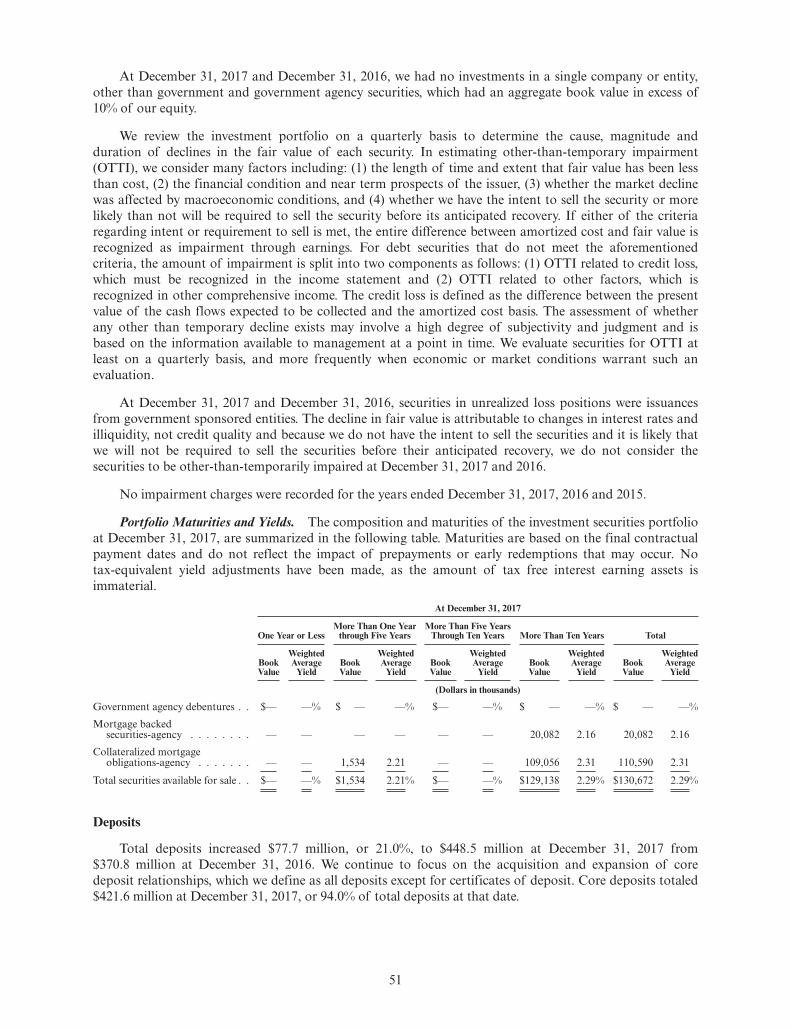
At December 31, 2017 and December 31, 2016, we had no investments in a single company or entity,other than government and government agency securities, which had an aggregate book value in excess of10% of our equity.
We review the investment portfolio on a quarterly basis to determine the cause, magnitude andduration of declines in the fair value of each security. In estimating other-than-temporary impairment(OTTI), we consider many factors including: (1) the length of time and extent that fair value has been lessthan cost, (2) the financial condition and near term prospects of the issuer, (3) whether the market declinewas affected by macroeconomic conditions, and (4) whether we have the intent to sell the security or morelikely than not will be required to sell the security before its anticipated recovery. If either of the criteriaregarding intent or requirement to sell is met, the entire difference between amortized cost and fair value isrecognized as impairment through earnings. For debt securities that do not meet the aforementionedcriteria, the amount of impairment is split into two components as follows: (1) OTTI related to credit loss,which must be recognized in the income statement and (2) OTTI related to other factors, which isrecognized in other comprehensive income. The credit loss is defined as the difference between the presentvalue of the cash flows expected to be collected and the amortized cost basis. The assessment of whetherany other than temporary decline exists may involve a high degree of subjectivity and judgment and isbased on the information available to management at a point in time. We evaluate securities for OTTI atleast on a quarterly basis, and more frequently when economic or market conditions warrant such anevaluation.
At December 31, 2017 and December 31, 2016, securities in unrealized loss positions were issuancesfrom government sponsored entities. The decline in fair value is attributable to changes in interest rates andilliquidity, not credit quality and because we do not have the intent to sell the securities and it is likely thatwe will not be required to sell the securities before their anticipated recovery, we do not consider thesecurities to be other-than-temporarily impaired at December 31, 2017 and 2016.
No impairment charges were recorded for the years ended December 31, 2017, 2016 and 2015.
Portfolio Maturities and Yields. The composition and maturities of the investment securities portfolioat December 31, 2017, are summarized in the following table. Maturities are based on the final contractualpayment dates and do not reflect the impact of prepayments or early redemptions that may occur. Notax-equivalent yield adjustments have been made, as the amount of tax free interest earning assets isimmaterial.
At December 31, 2017
One Year or LessMore Than One Year
through Five YearsMore Than Five Years
Through Ten Years More Than Ten Years Total
BookValue
WeightedAverage
YieldBookValue
WeightedAverage
YieldBookValue
WeightedAverage
YieldBookValue
WeightedAverage
YieldBookValue
WeightedAverage
Yield
(Dollars in thousands)
Government agency debentures . . $— —% $ — —% $— —% $ — —% $ — —%Mortgage backed
securities-agency . . . . . . . . — — — — — — 20,082 2.16 20,082 2.16Collateralized mortgage
obligations-agency . . . . . . . — — 1,534 2.21 — — 109,056 2.31 110,590 2.31
Total securities available for sale . . $— —% $1,534 2.21% $— —% $129,138 2.29% $130,672 2.29%
Deposits
Total deposits increased $77.7 million, or 21.0%, to $448.5 million at December 31, 2017 from$370.8 million at December 31, 2016. We continue to focus on the acquisition and expansion of coredeposit relationships, which we define as all deposits except for certificates of deposit. Core deposits totaled$421.6 million at December 31, 2017, or 94.0% of total deposits at that date.
51
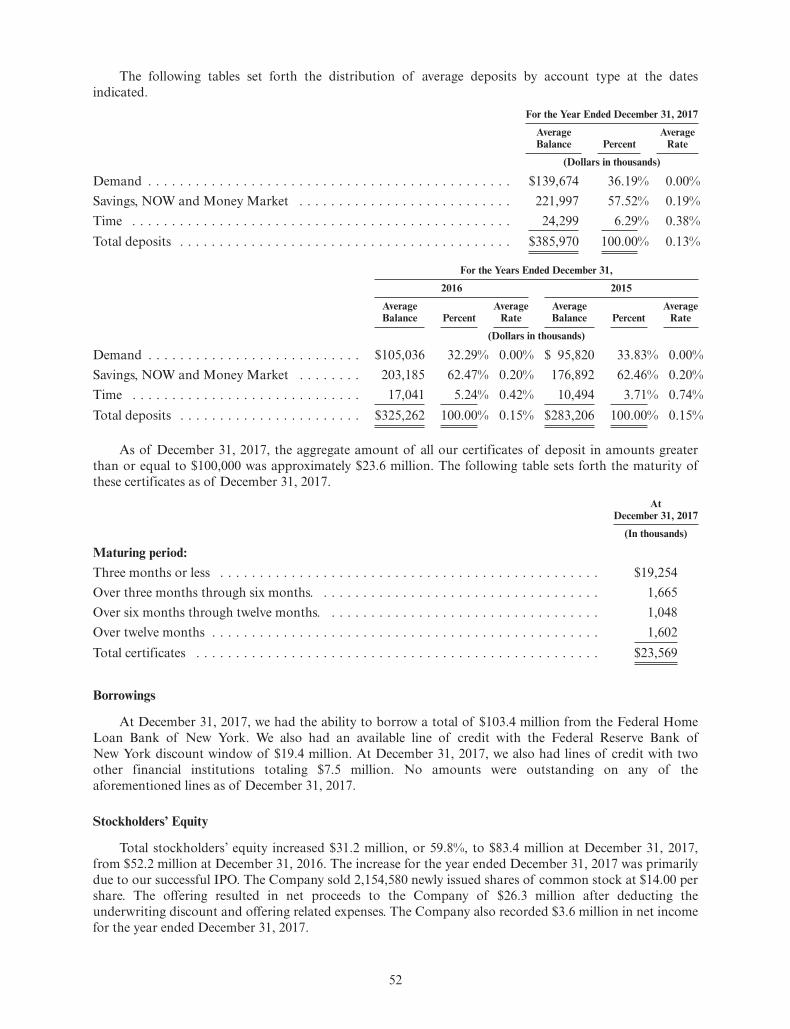
The following tables set forth the distribution of average deposits by account type at the datesindicated.
For the Year Ended December 31, 2017
AverageBalance Percent
AverageRate
(Dollars in thousands)
Demand . . . . . . . . . . . . . . . . . . . . . . . . . . . . . . . . . . . . . . . . . . . . . . $139,674 36.19% 0.00%Savings, NOW and Money Market . . . . . . . . . . . . . . . . . . . . . . . . . . . 221,997 57.52% 0.19%Time . . . . . . . . . . . . . . . . . . . . . . . . . . . . . . . . . . . . . . . . . . . . . . . . 24,299 6.29% 0.38%Total deposits . . . . . . . . . . . . . . . . . . . . . . . . . . . . . . . . . . . . . . . . . . $385,970 100.00% 0.13%
For the Years Ended December 31,
2016 2015
AverageBalance Percent
AverageRate
AverageBalance Percent
AverageRate
(Dollars in thousands)
Demand . . . . . . . . . . . . . . . . . . . . . . . . . . . $105,036 32.29% 0.00% $ 95,820 33.83% 0.00%Savings, NOW and Money Market . . . . . . . . 203,185 62.47% 0.20% 176,892 62.46% 0.20%Time . . . . . . . . . . . . . . . . . . . . . . . . . . . . . 17,041 5.24% 0.42% 10,494 3.71% 0.74%Total deposits . . . . . . . . . . . . . . . . . . . . . . . $325,262 100.00% 0.15% $283,206 100.00% 0.15%
As of December 31, 2017, the aggregate amount of all our certificates of deposit in amounts greaterthan or equal to $100,000 was approximately $23.6 million. The following table sets forth the maturity ofthese certificates as of December 31, 2017.
AtDecember 31, 2017
(In thousands)
Maturing period:Three months or less . . . . . . . . . . . . . . . . . . . . . . . . . . . . . . . . . . . . . . . . . . . . . . . . $19,254Over three months through six months. . . . . . . . . . . . . . . . . . . . . . . . . . . . . . . . . . . . 1,665Over six months through twelve months. . . . . . . . . . . . . . . . . . . . . . . . . . . . . . . . . . . 1,048Over twelve months . . . . . . . . . . . . . . . . . . . . . . . . . . . . . . . . . . . . . . . . . . . . . . . . . 1,602Total certificates . . . . . . . . . . . . . . . . . . . . . . . . . . . . . . . . . . . . . . . . . . . . . . . . . . . $23,569
Borrowings
At December 31, 2017, we had the ability to borrow a total of $103.4 million from the Federal HomeLoan Bank of New York. We also had an available line of credit with the Federal Reserve Bank ofNew York discount window of $19.4 million. At December 31, 2017, we also had lines of credit with twoother financial institutions totaling $7.5 million. No amounts were outstanding on any of theaforementioned lines as of December 31, 2017.
Stockholders’ Equity
Total stockholders’ equity increased $31.2 million, or 59.8%, to $83.4 million at December 31, 2017,from $52.2 million at December 31, 2016. The increase for the year ended December 31, 2017 was primarilydue to our successful IPO. The Company sold 2,154,580 newly issued shares of common stock at $14.00 pershare. The offering resulted in net proceeds to the Company of $26.3 million after deducting theunderwriting discount and offering related expenses. The Company also recorded $3.6 million in net incomefor the year ended December 31, 2017.
52
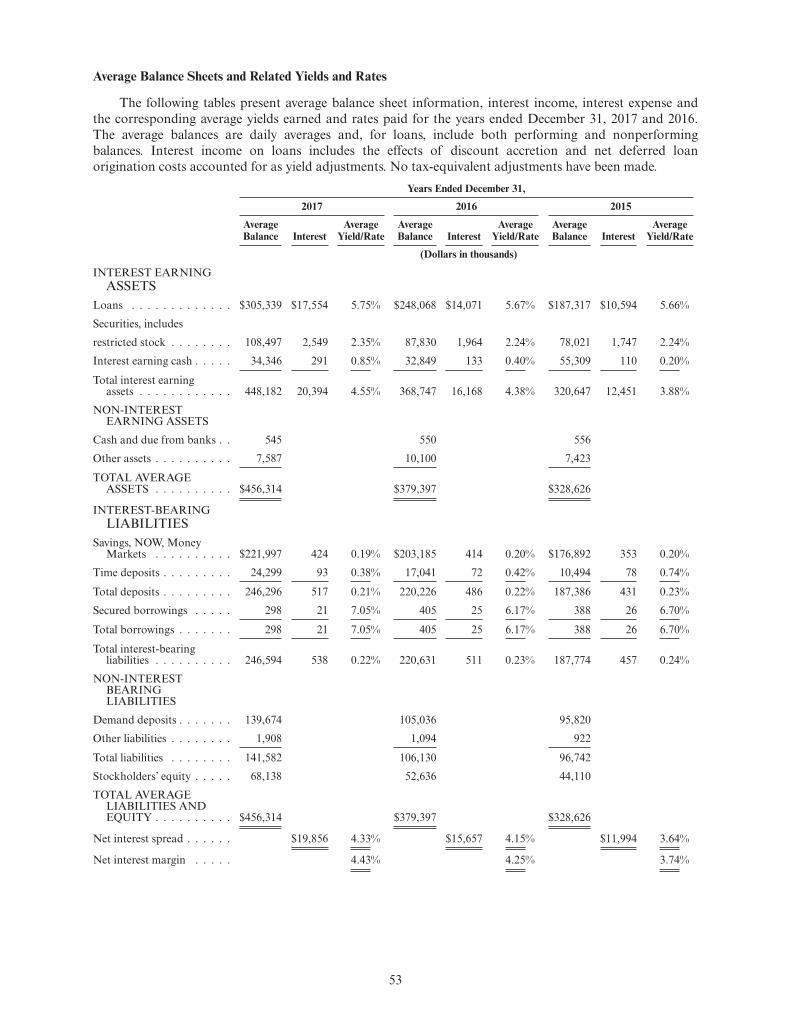
Average Balance Sheets and Related Yields and Rates
The following tables present average balance sheet information, interest income, interest expense andthe corresponding average yields earned and rates paid for the years ended December 31, 2017 and 2016.The average balances are daily averages and, for loans, include both performing and nonperformingbalances. Interest income on loans includes the effects of discount accretion and net deferred loanorigination costs accounted for as yield adjustments. No tax-equivalent adjustments have been made.
Years Ended December 31,
2017 2016 2015
AverageBalance Interest
AverageYield/Rate
AverageBalance Interest
AverageYield/Rate
AverageBalance Interest
AverageYield/Rate
(Dollars in thousands)
INTEREST EARNINGASSETS
Loans . . . . . . . . . . . . . $305,339 $17,554 5.75% $248,068 $14,071 5.67% $187,317 $10,594 5.66%Securities, includesrestricted stock . . . . . . . . 108,497 2,549 2.35% 87,830 1,964 2.24% 78,021 1,747 2.24%Interest earning cash . . . . . 34,346 291 0.85% 32,849 133 0.40% 55,309 110 0.20%
Total interest earningassets . . . . . . . . . . . . 448,182 20,394 4.55% 368,747 16,168 4.38% 320,647 12,451 3.88%
NON-INTERESTEARNING ASSETS
Cash and due from banks . . 545 550 556Other assets . . . . . . . . . . 7,587 10,100 7,423
TOTAL AVERAGEASSETS . . . . . . . . . . $456,314 $379,397 $328,626
INTEREST-BEARINGLIABILITIES
Savings, NOW, MoneyMarkets . . . . . . . . . . $221,997 424 0.19% $203,185 414 0.20% $176,892 353 0.20%
Time deposits . . . . . . . . . 24,299 93 0.38% 17,041 72 0.42% 10,494 78 0.74%
Total deposits . . . . . . . . . 246,296 517 0.21% 220,226 486 0.22% 187,386 431 0.23%Secured borrowings . . . . . 298 21 7.05% 405 25 6.17% 388 26 6.70%
Total borrowings . . . . . . . 298 21 7.05% 405 25 6.17% 388 26 6.70%
Total interest-bearingliabilities . . . . . . . . . . 246,594 538 0.22% 220,631 511 0.23% 187,774 457 0.24%
NON-INTERESTBEARINGLIABILITIES
Demand deposits . . . . . . . 139,674 105,036 95,820Other liabilities . . . . . . . . 1,908 1,094 922
Total liabilities . . . . . . . . 141,582 106,130 96,742Stockholders’ equity . . . . . 68,138 52,636 44,110TOTAL AVERAGE
LIABILITIES ANDEQUITY . . . . . . . . . . $456,314 $379,397 $328,626
Net interest spread . . . . . . $19,856 4.33% $15,657 4.15% $11,994 3.64%
Net interest margin . . . . . 4.43% 4.25% 3.74%
53
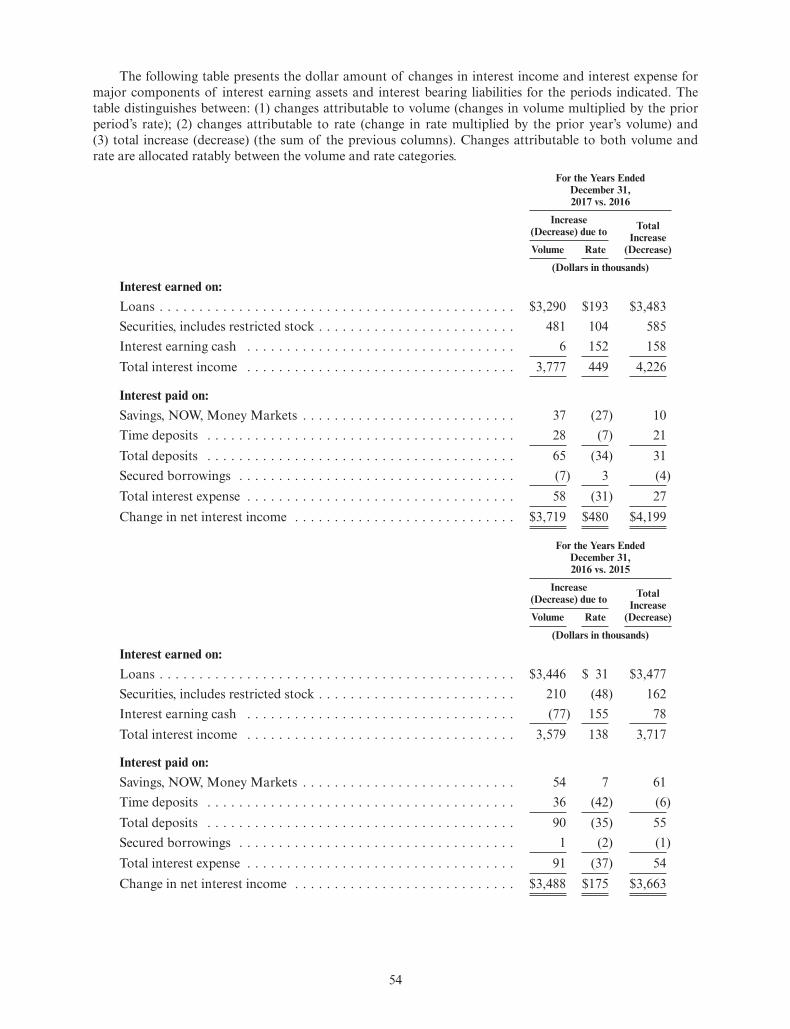
The following table presents the dollar amount of changes in interest income and interest expense formajor components of interest earning assets and interest bearing liabilities for the periods indicated. Thetable distinguishes between: (1) changes attributable to volume (changes in volume multiplied by the priorperiod’s rate); (2) changes attributable to rate (change in rate multiplied by the prior year’s volume) and(3) total increase (decrease) (the sum of the previous columns). Changes attributable to both volume andrate are allocated ratably between the volume and rate categories.
For the Years EndedDecember 31,2017 vs. 2016
Increase(Decrease) due to Total
Increase(Decrease)Volume Rate
(Dollars in thousands)
Interest earned on:Loans . . . . . . . . . . . . . . . . . . . . . . . . . . . . . . . . . . . . . . . . . . . . . $3,290 $193 $3,483Securities, includes restricted stock . . . . . . . . . . . . . . . . . . . . . . . . . 481 104 585Interest earning cash . . . . . . . . . . . . . . . . . . . . . . . . . . . . . . . . . . 6 152 158Total interest income . . . . . . . . . . . . . . . . . . . . . . . . . . . . . . . . . . 3,777 449 4,226
Interest paid on:Savings, NOW, Money Markets . . . . . . . . . . . . . . . . . . . . . . . . . . . 37 (27) 10Time deposits . . . . . . . . . . . . . . . . . . . . . . . . . . . . . . . . . . . . . . . 28 (7) 21Total deposits . . . . . . . . . . . . . . . . . . . . . . . . . . . . . . . . . . . . . . . 65 (34) 31Secured borrowings . . . . . . . . . . . . . . . . . . . . . . . . . . . . . . . . . . . (7) 3 (4)Total interest expense . . . . . . . . . . . . . . . . . . . . . . . . . . . . . . . . . . 58 (31) 27Change in net interest income . . . . . . . . . . . . . . . . . . . . . . . . . . . . $3,719 $480 $4,199
For the Years EndedDecember 31,2016 vs. 2015
Increase(Decrease) due to Total
Increase(Decrease)Volume Rate
(Dollars in thousands)
Interest earned on:Loans . . . . . . . . . . . . . . . . . . . . . . . . . . . . . . . . . . . . . . . . . . . . . $3,446 $ 31 $3,477Securities, includes restricted stock . . . . . . . . . . . . . . . . . . . . . . . . . 210 (48) 162Interest earning cash . . . . . . . . . . . . . . . . . . . . . . . . . . . . . . . . . . (77) 155 78Total interest income . . . . . . . . . . . . . . . . . . . . . . . . . . . . . . . . . . 3,579 138 3,717
Interest paid on:Savings, NOW, Money Markets . . . . . . . . . . . . . . . . . . . . . . . . . . . 54 7 61Time deposits . . . . . . . . . . . . . . . . . . . . . . . . . . . . . . . . . . . . . . . 36 (42) (6)Total deposits . . . . . . . . . . . . . . . . . . . . . . . . . . . . . . . . . . . . . . . 90 (35) 55Secured borrowings . . . . . . . . . . . . . . . . . . . . . . . . . . . . . . . . . . . 1 (2) (1)Total interest expense . . . . . . . . . . . . . . . . . . . . . . . . . . . . . . . . . . 91 (37) 54Change in net interest income . . . . . . . . . . . . . . . . . . . . . . . . . . . . $3,488 $175 $3,663
54
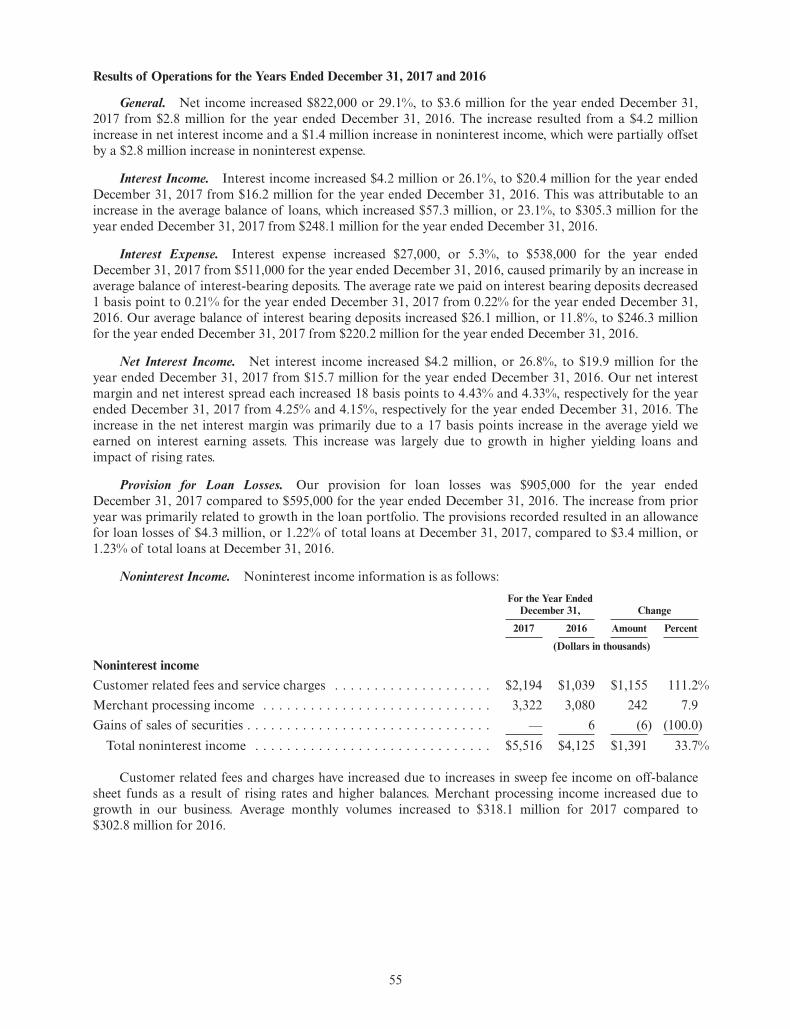
Results of Operations for the Years Ended December 31, 2017 and 2016
General. Net income increased $822,000 or 29.1%, to $3.6 million for the year ended December 31,2017 from $2.8 million for the year ended December 31, 2016. The increase resulted from a $4.2 millionincrease in net interest income and a $1.4 million increase in noninterest income, which were partially offsetby a $2.8 million increase in noninterest expense.
Interest Income. Interest income increased $4.2 million or 26.1%, to $20.4 million for the year endedDecember 31, 2017 from $16.2 million for the year ended December 31, 2016. This was attributable to anincrease in the average balance of loans, which increased $57.3 million, or 23.1%, to $305.3 million for theyear ended December 31, 2017 from $248.1 million for the year ended December 31, 2016.
Interest Expense. Interest expense increased $27,000, or 5.3%, to $538,000 for the year endedDecember 31, 2017 from $511,000 for the year ended December 31, 2016, caused primarily by an increase inaverage balance of interest-bearing deposits. The average rate we paid on interest bearing deposits decreased1 basis point to 0.21% for the year ended December 31, 2017 from 0.22% for the year ended December 31,2016. Our average balance of interest bearing deposits increased $26.1 million, or 11.8%, to $246.3 millionfor the year ended December 31, 2017 from $220.2 million for the year ended December 31, 2016.
Net Interest Income. Net interest income increased $4.2 million, or 26.8%, to $19.9 million for theyear ended December 31, 2017 from $15.7 million for the year ended December 31, 2016. Our net interestmargin and net interest spread each increased 18 basis points to 4.43% and 4.33%, respectively for the yearended December 31, 2017 from 4.25% and 4.15%, respectively for the year ended December 31, 2016. Theincrease in the net interest margin was primarily due to a 17 basis points increase in the average yield weearned on interest earning assets. This increase was largely due to growth in higher yielding loans andimpact of rising rates.
Provision for Loan Losses. Our provision for loan losses was $905,000 for the year endedDecember 31, 2017 compared to $595,000 for the year ended December 31, 2016. The increase from prioryear was primarily related to growth in the loan portfolio. The provisions recorded resulted in an allowancefor loan losses of $4.3 million, or 1.22% of total loans at December 31, 2017, compared to $3.4 million, or1.23% of total loans at December 31, 2016.
Noninterest Income. Noninterest income information is as follows:For the Year Ended
December 31, Change
2017 2016 Amount Percent
(Dollars in thousands)
Noninterest incomeCustomer related fees and service charges . . . . . . . . . . . . . . . . . . . . $2,194 $1,039 $1,155 111.2%Merchant processing income . . . . . . . . . . . . . . . . . . . . . . . . . . . . . 3,322 3,080 242 7.9Gains of sales of securities . . . . . . . . . . . . . . . . . . . . . . . . . . . . . . . — 6 (6) (100.0)
Total noninterest income . . . . . . . . . . . . . . . . . . . . . . . . . . . . . . $5,516 $4,125 $1,391 33.7%
Customer related fees and charges have increased due to increases in sweep fee income on off-balancesheet funds as a result of rising rates and higher balances. Merchant processing income increased due togrowth in our business. Average monthly volumes increased to $318.1 million for 2017 compared to$302.8 million for 2016.
55
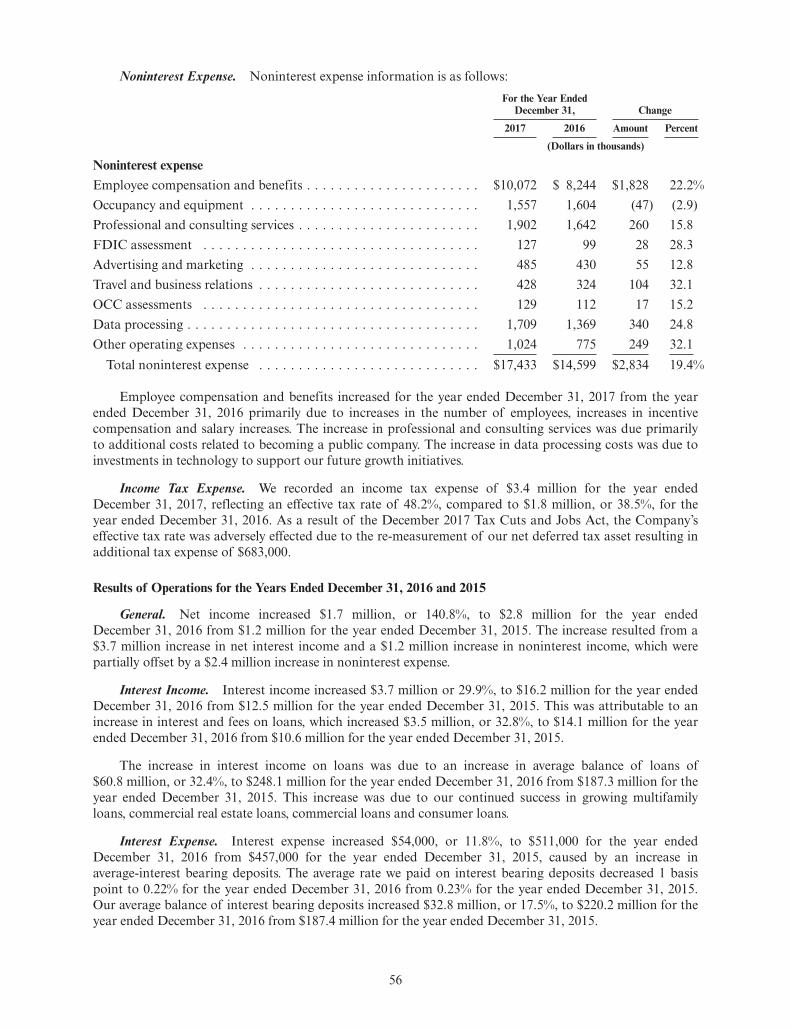
Noninterest Expense. Noninterest expense information is as follows:For the Year Ended
December 31, Change
2017 2016 Amount Percent
(Dollars in thousands)
Noninterest expenseEmployee compensation and benefits . . . . . . . . . . . . . . . . . . . . . . $10,072 $ 8,244 $1,828 22.2%Occupancy and equipment . . . . . . . . . . . . . . . . . . . . . . . . . . . . . 1,557 1,604 (47) (2.9)Professional and consulting services . . . . . . . . . . . . . . . . . . . . . . . 1,902 1,642 260 15.8FDIC assessment . . . . . . . . . . . . . . . . . . . . . . . . . . . . . . . . . . . 127 99 28 28.3Advertising and marketing . . . . . . . . . . . . . . . . . . . . . . . . . . . . . 485 430 55 12.8Travel and business relations . . . . . . . . . . . . . . . . . . . . . . . . . . . . 428 324 104 32.1OCC assessments . . . . . . . . . . . . . . . . . . . . . . . . . . . . . . . . . . . 129 112 17 15.2Data processing . . . . . . . . . . . . . . . . . . . . . . . . . . . . . . . . . . . . . 1,709 1,369 340 24.8Other operating expenses . . . . . . . . . . . . . . . . . . . . . . . . . . . . . . 1,024 775 249 32.1
Total noninterest expense . . . . . . . . . . . . . . . . . . . . . . . . . . . . $17,433 $14,599 $2,834 19.4%
Employee compensation and benefits increased for the year ended December 31, 2017 from the yearended December 31, 2016 primarily due to increases in the number of employees, increases in incentivecompensation and salary increases. The increase in professional and consulting services was due primarilyto additional costs related to becoming a public company. The increase in data processing costs was due toinvestments in technology to support our future growth initiatives.
Income Tax Expense. We recorded an income tax expense of $3.4 million for the year endedDecember 31, 2017, reflecting an effective tax rate of 48.2%, compared to $1.8 million, or 38.5%, for theyear ended December 31, 2016. As a result of the December 2017 Tax Cuts and Jobs Act, the Company’seffective tax rate was adversely effected due to the re-measurement of our net deferred tax asset resulting inadditional tax expense of $683,000.
Results of Operations for the Years Ended December 31, 2016 and 2015
General. Net income increased $1.7 million, or 140.8%, to $2.8 million for the year endedDecember 31, 2016 from $1.2 million for the year ended December 31, 2015. The increase resulted from a$3.7 million increase in net interest income and a $1.2 million increase in noninterest income, which werepartially offset by a $2.4 million increase in noninterest expense.
Interest Income. Interest income increased $3.7 million or 29.9%, to $16.2 million for the year endedDecember 31, 2016 from $12.5 million for the year ended December 31, 2015. This was attributable to anincrease in interest and fees on loans, which increased $3.5 million, or 32.8%, to $14.1 million for the yearended December 31, 2016 from $10.6 million for the year ended December 31, 2015.
The increase in interest income on loans was due to an increase in average balance of loans of$60.8 million, or 32.4%, to $248.1 million for the year ended December 31, 2016 from $187.3 million for theyear ended December 31, 2015. This increase was due to our continued success in growing multifamilyloans, commercial real estate loans, commercial loans and consumer loans.
Interest Expense. Interest expense increased $54,000, or 11.8%, to $511,000 for the year endedDecember 31, 2016 from $457,000 for the year ended December 31, 2015, caused by an increase inaverage-interest bearing deposits. The average rate we paid on interest bearing deposits decreased 1 basispoint to 0.22% for the year ended December 31, 2016 from 0.23% for the year ended December 31, 2015.Our average balance of interest bearing deposits increased $32.8 million, or 17.5%, to $220.2 million for theyear ended December 31, 2016 from $187.4 million for the year ended December 31, 2015.
56
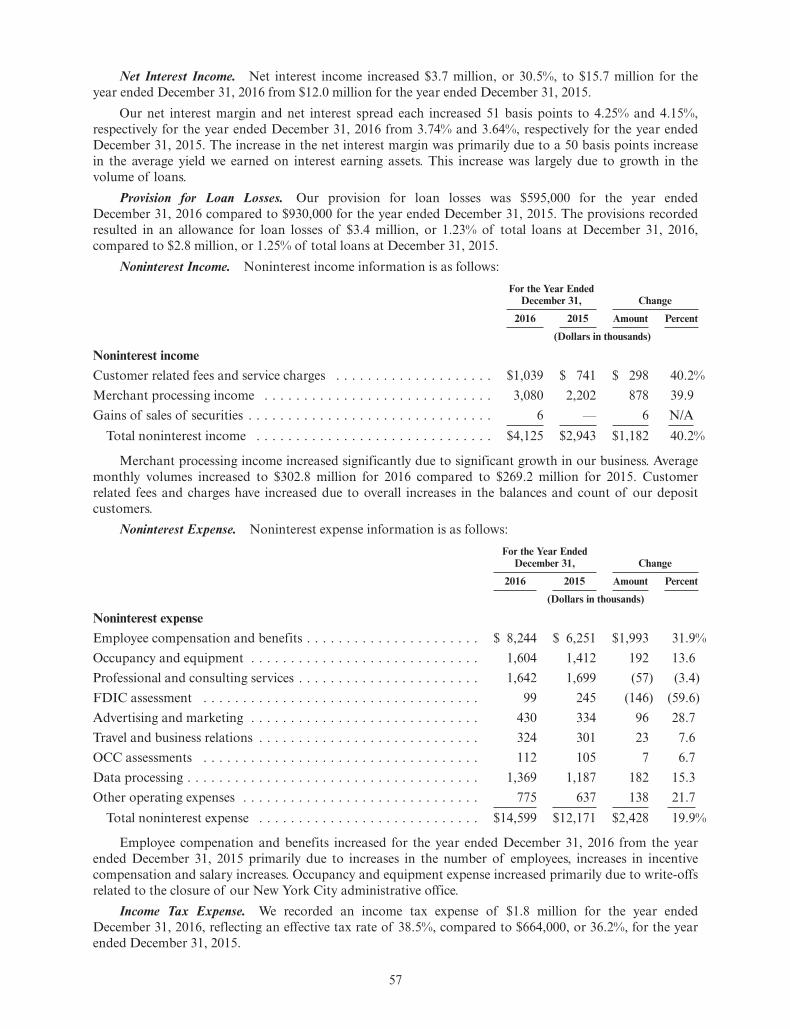
Net Interest Income. Net interest income increased $3.7 million, or 30.5%, to $15.7 million for theyear ended December 31, 2016 from $12.0 million for the year ended December 31, 2015.
Our net interest margin and net interest spread each increased 51 basis points to 4.25% and 4.15%,respectively for the year ended December 31, 2016 from 3.74% and 3.64%, respectively for the year endedDecember 31, 2015. The increase in the net interest margin was primarily due to a 50 basis points increasein the average yield we earned on interest earning assets. This increase was largely due to growth in thevolume of loans.
Provision for Loan Losses. Our provision for loan losses was $595,000 for the year endedDecember 31, 2016 compared to $930,000 for the year ended December 31, 2015. The provisions recordedresulted in an allowance for loan losses of $3.4 million, or 1.23% of total loans at December 31, 2016,compared to $2.8 million, or 1.25% of total loans at December 31, 2015.
Noninterest Income. Noninterest income information is as follows:For the Year Ended
December 31, Change
2016 2015 Amount Percent
(Dollars in thousands)
Noninterest incomeCustomer related fees and service charges . . . . . . . . . . . . . . . . . . . . $1,039 $ 741 $ 298 40.2%Merchant processing income . . . . . . . . . . . . . . . . . . . . . . . . . . . . . 3,080 2,202 878 39.9Gains of sales of securities . . . . . . . . . . . . . . . . . . . . . . . . . . . . . . . 6 — 6 N/A
Total noninterest income . . . . . . . . . . . . . . . . . . . . . . . . . . . . . . $4,125 $2,943 $1,182 40.2%
Merchant processing income increased significantly due to significant growth in our business. Averagemonthly volumes increased to $302.8 million for 2016 compared to $269.2 million for 2015. Customerrelated fees and charges have increased due to overall increases in the balances and count of our depositcustomers.
Noninterest Expense. Noninterest expense information is as follows:For the Year Ended
December 31, Change
2016 2015 Amount Percent
(Dollars in thousands)
Noninterest expenseEmployee compensation and benefits . . . . . . . . . . . . . . . . . . . . . . $ 8,244 $ 6,251 $1,993 31.9%Occupancy and equipment . . . . . . . . . . . . . . . . . . . . . . . . . . . . . 1,604 1,412 192 13.6Professional and consulting services . . . . . . . . . . . . . . . . . . . . . . . 1,642 1,699 (57) (3.4)FDIC assessment . . . . . . . . . . . . . . . . . . . . . . . . . . . . . . . . . . . 99 245 (146) (59.6)Advertising and marketing . . . . . . . . . . . . . . . . . . . . . . . . . . . . . 430 334 96 28.7Travel and business relations . . . . . . . . . . . . . . . . . . . . . . . . . . . . 324 301 23 7.6OCC assessments . . . . . . . . . . . . . . . . . . . . . . . . . . . . . . . . . . . 112 105 7 6.7Data processing . . . . . . . . . . . . . . . . . . . . . . . . . . . . . . . . . . . . . 1,369 1,187 182 15.3Other operating expenses . . . . . . . . . . . . . . . . . . . . . . . . . . . . . . 775 637 138 21.7
Total noninterest expense . . . . . . . . . . . . . . . . . . . . . . . . . . . . $14,599 $12,171 $2,428 19.9%
Employee compenation and benefits increased for the year ended December 31, 2016 from the yearended December 31, 2015 primarily due to increases in the number of employees, increases in incentivecompensation and salary increases. Occupancy and equipment expense increased primarily due to write-offsrelated to the closure of our New York City administrative office.
Income Tax Expense. We recorded an income tax expense of $1.8 million for the year endedDecember 31, 2016, reflecting an effective tax rate of 38.5%, compared to $664,000, or 36.2%, for the yearended December 31, 2015.
57
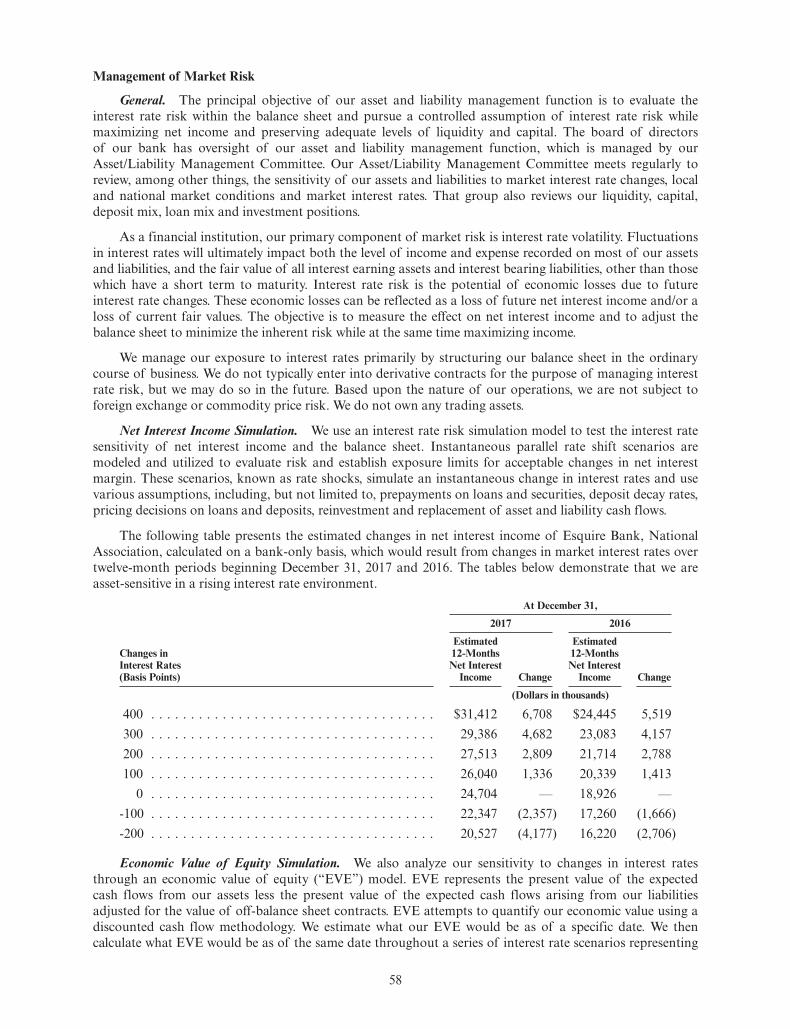
Management of Market Risk
General. The principal objective of our asset and liability management function is to evaluate theinterest rate risk within the balance sheet and pursue a controlled assumption of interest rate risk whilemaximizing net income and preserving adequate levels of liquidity and capital. The board of directorsof our bank has oversight of our asset and liability management function, which is managed by ourAsset/Liability Management Committee. Our Asset/Liability Management Committee meets regularly toreview, among other things, the sensitivity of our assets and liabilities to market interest rate changes, localand national market conditions and market interest rates. That group also reviews our liquidity, capital,deposit mix, loan mix and investment positions.
As a financial institution, our primary component of market risk is interest rate volatility. Fluctuationsin interest rates will ultimately impact both the level of income and expense recorded on most of our assetsand liabilities, and the fair value of all interest earning assets and interest bearing liabilities, other than thosewhich have a short term to maturity. Interest rate risk is the potential of economic losses due to futureinterest rate changes. These economic losses can be reflected as a loss of future net interest income and/or aloss of current fair values. The objective is to measure the effect on net interest income and to adjust thebalance sheet to minimize the inherent risk while at the same time maximizing income.
We manage our exposure to interest rates primarily by structuring our balance sheet in the ordinarycourse of business. We do not typically enter into derivative contracts for the purpose of managing interestrate risk, but we may do so in the future. Based upon the nature of our operations, we are not subject toforeign exchange or commodity price risk. We do not own any trading assets.
Net Interest Income Simulation. We use an interest rate risk simulation model to test the interest ratesensitivity of net interest income and the balance sheet. Instantaneous parallel rate shift scenarios aremodeled and utilized to evaluate risk and establish exposure limits for acceptable changes in net interestmargin. These scenarios, known as rate shocks, simulate an instantaneous change in interest rates and usevarious assumptions, including, but not limited to, prepayments on loans and securities, deposit decay rates,pricing decisions on loans and deposits, reinvestment and replacement of asset and liability cash flows.
The following table presents the estimated changes in net interest income of Esquire Bank, NationalAssociation, calculated on a bank-only basis, which would result from changes in market interest rates overtwelve-month periods beginning December 31, 2017 and 2016. The tables below demonstrate that we areasset-sensitive in a rising interest rate environment.
At December 31,
2017 2016
Changes inInterest Rates(Basis Points)
Estimated12-MonthsNet Interest
Income Change
Estimated12-MonthsNet Interest
Income Change
(Dollars in thousands)
400 . . . . . . . . . . . . . . . . . . . . . . . . . . . . . . . . . . . . $31,412 6,708 $24,445 5,519300 . . . . . . . . . . . . . . . . . . . . . . . . . . . . . . . . . . . . 29,386 4,682 23,083 4,157200 . . . . . . . . . . . . . . . . . . . . . . . . . . . . . . . . . . . . 27,513 2,809 21,714 2,788100 . . . . . . . . . . . . . . . . . . . . . . . . . . . . . . . . . . . . 26,040 1,336 20,339 1,413
0 . . . . . . . . . . . . . . . . . . . . . . . . . . . . . . . . . . . . 24,704 — 18,926 —-100 . . . . . . . . . . . . . . . . . . . . . . . . . . . . . . . . . . . . 22,347 (2,357) 17,260 (1,666)-200 . . . . . . . . . . . . . . . . . . . . . . . . . . . . . . . . . . . . 20,527 (4,177) 16,220 (2,706)
Economic Value of Equity Simulation. We also analyze our sensitivity to changes in interest ratesthrough an economic value of equity (“EVE”) model. EVE represents the present value of the expectedcash flows from our assets less the present value of the expected cash flows arising from our liabilitiesadjusted for the value of off-balance sheet contracts. EVE attempts to quantify our economic value using adiscounted cash flow methodology. We estimate what our EVE would be as of a specific date. We thencalculate what EVE would be as of the same date throughout a series of interest rate scenarios representing
58
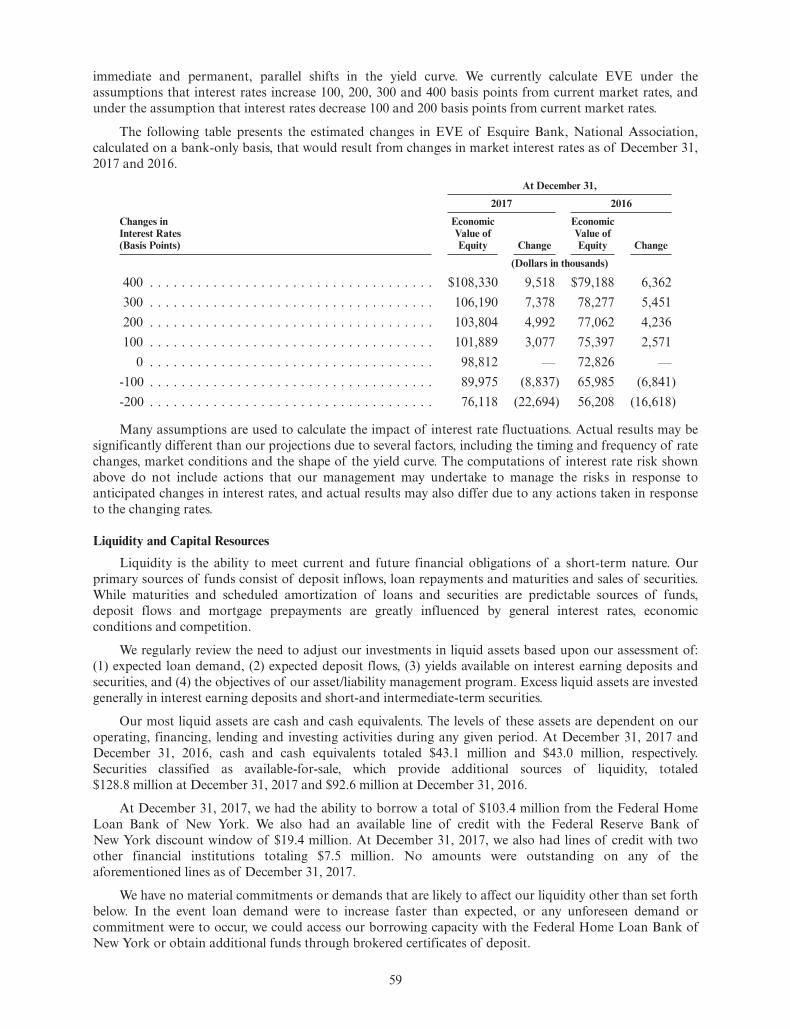
immediate and permanent, parallel shifts in the yield curve. We currently calculate EVE under theassumptions that interest rates increase 100, 200, 300 and 400 basis points from current market rates, andunder the assumption that interest rates decrease 100 and 200 basis points from current market rates.
The following table presents the estimated changes in EVE of Esquire Bank, National Association,calculated on a bank-only basis, that would result from changes in market interest rates as of December 31,2017 and 2016.
At December 31,
2017 2016
Changes inInterest Rates(Basis Points)
EconomicValue ofEquity Change
EconomicValue ofEquity Change
(Dollars in thousands)
400 . . . . . . . . . . . . . . . . . . . . . . . . . . . . . . . . . . . . $108,330 9,518 $79,188 6,362300 . . . . . . . . . . . . . . . . . . . . . . . . . . . . . . . . . . . . 106,190 7,378 78,277 5,451200 . . . . . . . . . . . . . . . . . . . . . . . . . . . . . . . . . . . . 103,804 4,992 77,062 4,236100 . . . . . . . . . . . . . . . . . . . . . . . . . . . . . . . . . . . . 101,889 3,077 75,397 2,571
0 . . . . . . . . . . . . . . . . . . . . . . . . . . . . . . . . . . . . 98,812 — 72,826 —-100 . . . . . . . . . . . . . . . . . . . . . . . . . . . . . . . . . . . . 89,975 (8,837) 65,985 (6,841)-200 . . . . . . . . . . . . . . . . . . . . . . . . . . . . . . . . . . . . 76,118 (22,694) 56,208 (16,618)
Many assumptions are used to calculate the impact of interest rate fluctuations. Actual results may besignificantly different than our projections due to several factors, including the timing and frequency of ratechanges, market conditions and the shape of the yield curve. The computations of interest rate risk shownabove do not include actions that our management may undertake to manage the risks in response toanticipated changes in interest rates, and actual results may also differ due to any actions taken in responseto the changing rates.
Liquidity and Capital Resources
Liquidity is the ability to meet current and future financial obligations of a short-term nature. Ourprimary sources of funds consist of deposit inflows, loan repayments and maturities and sales of securities.While maturities and scheduled amortization of loans and securities are predictable sources of funds,deposit flows and mortgage prepayments are greatly influenced by general interest rates, economicconditions and competition.
We regularly review the need to adjust our investments in liquid assets based upon our assessment of:(1) expected loan demand, (2) expected deposit flows, (3) yields available on interest earning deposits andsecurities, and (4) the objectives of our asset/liability management program. Excess liquid assets are investedgenerally in interest earning deposits and short-and intermediate-term securities.
Our most liquid assets are cash and cash equivalents. The levels of these assets are dependent on ouroperating, financing, lending and investing activities during any given period. At December 31, 2017 andDecember 31, 2016, cash and cash equivalents totaled $43.1 million and $43.0 million, respectively.Securities classified as available-for-sale, which provide additional sources of liquidity, totaled$128.8 million at December 31, 2017 and $92.6 million at December 31, 2016.
At December 31, 2017, we had the ability to borrow a total of $103.4 million from the Federal HomeLoan Bank of New York. We also had an available line of credit with the Federal Reserve Bank ofNew York discount window of $19.4 million. At December 31, 2017, we also had lines of credit with twoother financial institutions totaling $7.5 million. No amounts were outstanding on any of theaforementioned lines as of December 31, 2017.
We have no material commitments or demands that are likely to affect our liquidity other than set forthbelow. In the event loan demand were to increase faster than expected, or any unforeseen demand orcommitment were to occur, we could access our borrowing capacity with the Federal Home Loan Bank ofNew York or obtain additional funds through brokered certificates of deposit.
59
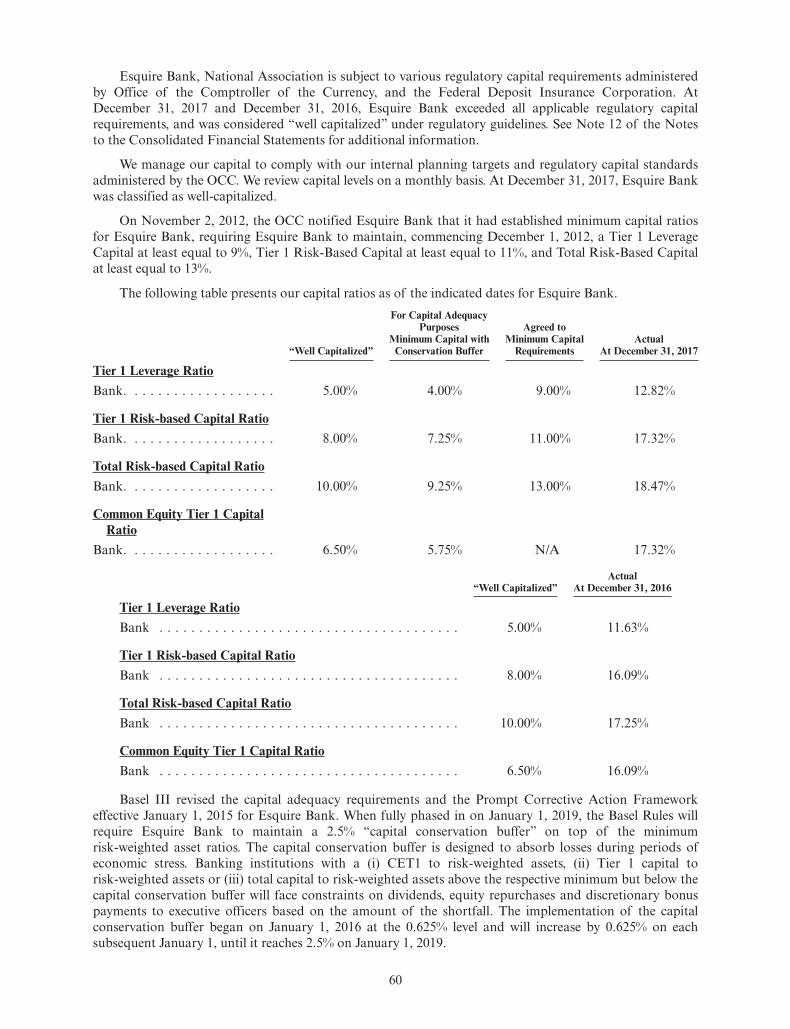
Esquire Bank, National Association is subject to various regulatory capital requirements administeredby Office of the Comptroller of the Currency, and the Federal Deposit Insurance Corporation. AtDecember 31, 2017 and December 31, 2016, Esquire Bank exceeded all applicable regulatory capitalrequirements, and was considered “well capitalized” under regulatory guidelines. See Note 12 of the Notesto the Consolidated Financial Statements for additional information.
We manage our capital to comply with our internal planning targets and regulatory capital standardsadministered by the OCC. We review capital levels on a monthly basis. At December 31, 2017, Esquire Bankwas classified as well-capitalized.
On November 2, 2012, the OCC notified Esquire Bank that it had established minimum capital ratiosfor Esquire Bank, requiring Esquire Bank to maintain, commencing December 1, 2012, a Tier 1 LeverageCapital at least equal to 9%, Tier 1 Risk-Based Capital at least equal to 11%, and Total Risk-Based Capitalat least equal to 13%.
The following table presents our capital ratios as of the indicated dates for Esquire Bank.
“Well Capitalized”
For Capital AdequacyPurposes
Minimum Capital withConservation Buffer
Agreed toMinimum Capital
RequirementsActual
At December 31, 2017
Tier 1 Leverage RatioBank. . . . . . . . . . . . . . . . . . . 5.00% 4.00% 9.00% 12.82%
Tier 1 Risk-based Capital RatioBank. . . . . . . . . . . . . . . . . . . 8.00% 7.25% 11.00% 17.32%
Total Risk-based Capital RatioBank. . . . . . . . . . . . . . . . . . . 10.00% 9.25% 13.00% 18.47%
Common Equity Tier 1 CapitalRatio
Bank. . . . . . . . . . . . . . . . . . . 6.50% 5.75% N/A 17.32%
“Well Capitalized”Actual
At December 31, 2016
Tier 1 Leverage RatioBank . . . . . . . . . . . . . . . . . . . . . . . . . . . . . . . . . . . . . . 5.00% 11.63%
Tier 1 Risk-based Capital RatioBank . . . . . . . . . . . . . . . . . . . . . . . . . . . . . . . . . . . . . . 8.00% 16.09%
Total Risk-based Capital RatioBank . . . . . . . . . . . . . . . . . . . . . . . . . . . . . . . . . . . . . . 10.00% 17.25%
Common Equity Tier 1 Capital RatioBank . . . . . . . . . . . . . . . . . . . . . . . . . . . . . . . . . . . . . . 6.50% 16.09%
Basel III revised the capital adequacy requirements and the Prompt Corrective Action Frameworkeffective January 1, 2015 for Esquire Bank. When fully phased in on January 1, 2019, the Basel Rules willrequire Esquire Bank to maintain a 2.5% “capital conservation buffer” on top of the minimumrisk-weighted asset ratios. The capital conservation buffer is designed to absorb losses during periods ofeconomic stress. Banking institutions with a (i) CET1 to risk-weighted assets, (ii) Tier 1 capital torisk-weighted assets or (iii) total capital to risk-weighted assets above the respective minimum but below thecapital conservation buffer will face constraints on dividends, equity repurchases and discretionary bonuspayments to executive officers based on the amount of the shortfall. The implementation of the capitalconservation buffer began on January 1, 2016 at the 0.625% level and will increase by 0.625% on eachsubsequent January 1, until it reaches 2.5% on January 1, 2019.
60
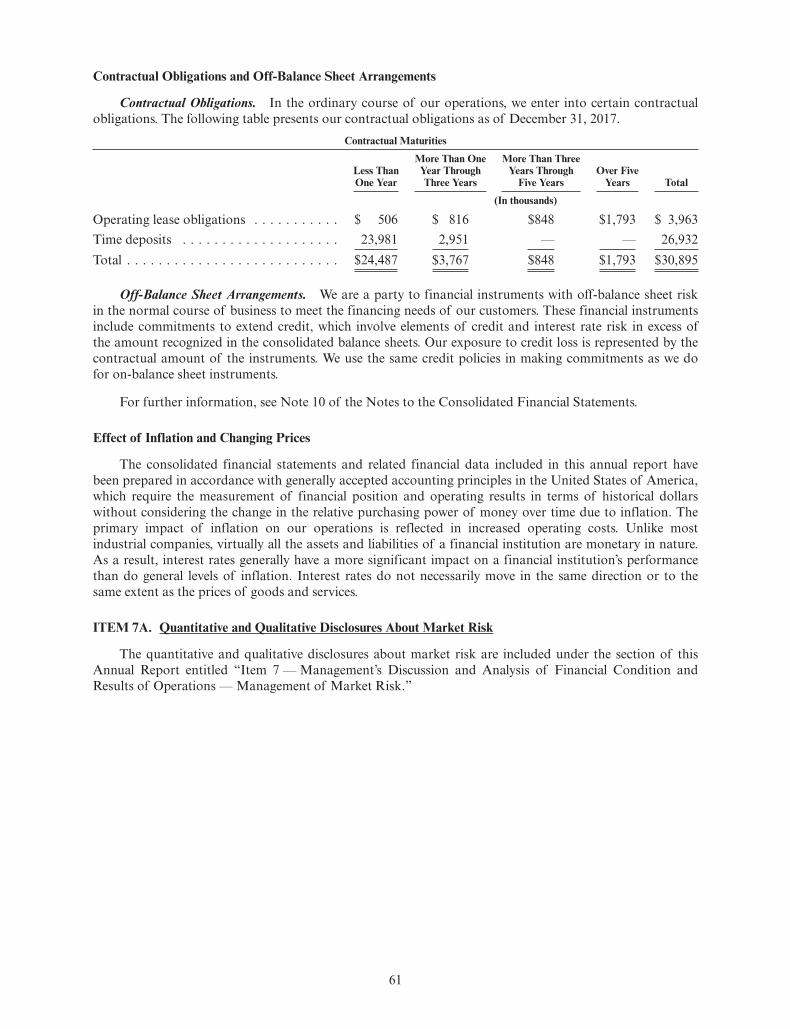
Contractual Obligations and Off-Balance Sheet Arrangements
Contractual Obligations. In the ordinary course of our operations, we enter into certain contractualobligations. The following table presents our contractual obligations as of December 31, 2017.
Contractual Maturities
Less ThanOne Year
More Than OneYear ThroughThree Years
More Than ThreeYears Through
Five YearsOver Five
Years Total
(In thousands)
Operating lease obligations . . . . . . . . . . . $ 506 $ 816 $848 $1,793 $ 3,963Time deposits . . . . . . . . . . . . . . . . . . . . 23,981 2,951 — — 26,932Total . . . . . . . . . . . . . . . . . . . . . . . . . . . $24,487 $3,767 $848 $1,793 $30,895
Off-Balance Sheet Arrangements. We are a party to financial instruments with off-balance sheet riskin the normal course of business to meet the financing needs of our customers. These financial instrumentsinclude commitments to extend credit, which involve elements of credit and interest rate risk in excess ofthe amount recognized in the consolidated balance sheets. Our exposure to credit loss is represented by thecontractual amount of the instruments. We use the same credit policies in making commitments as we dofor on-balance sheet instruments.
For further information, see Note 10 of the Notes to the Consolidated Financial Statements.
Effect of Inflation and Changing Prices
The consolidated financial statements and related financial data included in this annual report havebeen prepared in accordance with generally accepted accounting principles in the United States of America,which require the measurement of financial position and operating results in terms of historical dollarswithout considering the change in the relative purchasing power of money over time due to inflation. Theprimary impact of inflation on our operations is reflected in increased operating costs. Unlike mostindustrial companies, virtually all the assets and liabilities of a financial institution are monetary in nature.As a result, interest rates generally have a more significant impact on a financial institution’s performancethan do general levels of inflation. Interest rates do not necessarily move in the same direction or to thesame extent as the prices of goods and services.
ITEM 7A. Quantitative and Qualitative Disclosures About Market Risk
The quantitative and qualitative disclosures about market risk are included under the section of thisAnnual Report entitled “Item 7 — Management’s Discussion and Analysis of Financial Condition andResults of Operations — Management of Market Risk.”
61
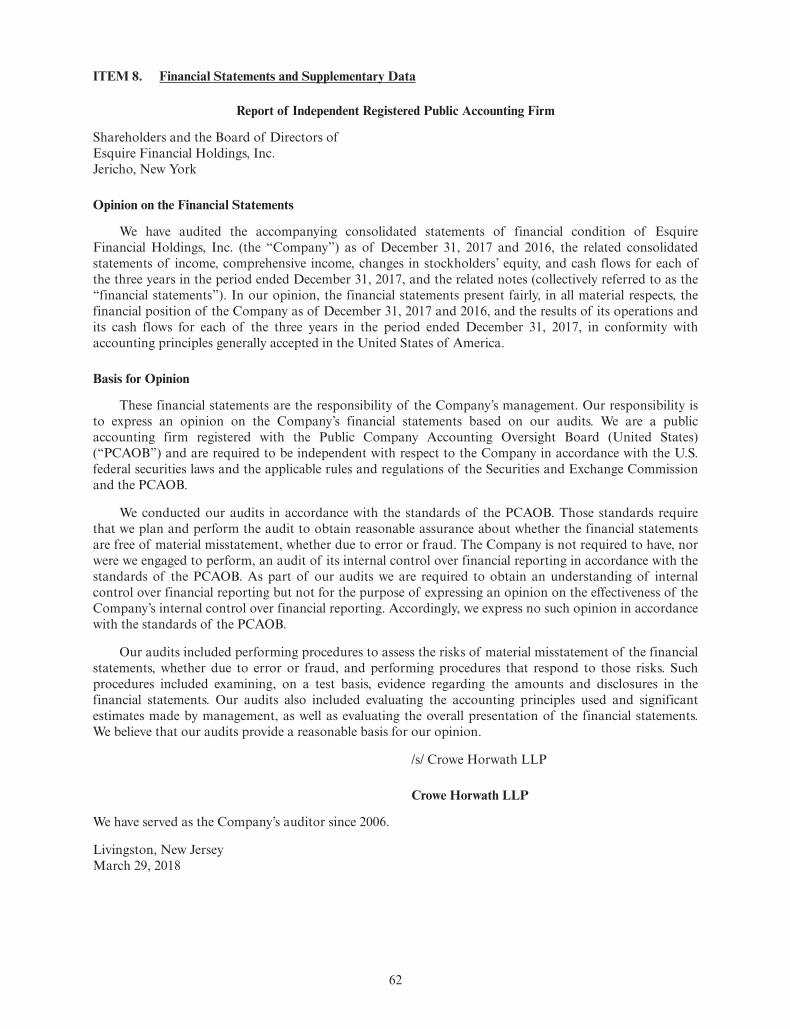
ITEM 8. Financial Statements and Supplementary Data
Report of Independent Registered Public Accounting Firm
Shareholders and the Board of Directors ofEsquire Financial Holdings, Inc.Jericho, New York
Opinion on the Financial Statements
We have audited the accompanying consolidated statements of financial condition of EsquireFinancial Holdings, Inc. (the “Company”) as of December 31, 2017 and 2016, the related consolidatedstatements of income, comprehensive income, changes in stockholders’ equity, and cash flows for each ofthe three years in the period ended December 31, 2017, and the related notes (collectively referred to as the“financial statements”). In our opinion, the financial statements present fairly, in all material respects, thefinancial position of the Company as of December 31, 2017 and 2016, and the results of its operations andits cash flows for each of the three years in the period ended December 31, 2017, in conformity withaccounting principles generally accepted in the United States of America.
Basis for Opinion
These financial statements are the responsibility of the Company’s management. Our responsibility isto express an opinion on the Company’s financial statements based on our audits. We are a publicaccounting firm registered with the Public Company Accounting Oversight Board (United States)(“PCAOB”) and are required to be independent with respect to the Company in accordance with the U.S.federal securities laws and the applicable rules and regulations of the Securities and Exchange Commissionand the PCAOB.
We conducted our audits in accordance with the standards of the PCAOB. Those standards requirethat we plan and perform the audit to obtain reasonable assurance about whether the financial statementsare free of material misstatement, whether due to error or fraud. The Company is not required to have, norwere we engaged to perform, an audit of its internal control over financial reporting in accordance with thestandards of the PCAOB. As part of our audits we are required to obtain an understanding of internalcontrol over financial reporting but not for the purpose of expressing an opinion on the effectiveness of theCompany’s internal control over financial reporting. Accordingly, we express no such opinion in accordancewith the standards of the PCAOB.
Our audits included performing procedures to assess the risks of material misstatement of the financialstatements, whether due to error or fraud, and performing procedures that respond to those risks. Suchprocedures included examining, on a test basis, evidence regarding the amounts and disclosures in thefinancial statements. Our audits also included evaluating the accounting principles used and significantestimates made by management, as well as evaluating the overall presentation of the financial statements.We believe that our audits provide a reasonable basis for our opinion.
/s/ Crowe Horwath LLP
Crowe Horwath LLP
We have served as the Company’s auditor since 2006.
Livingston, New JerseyMarch 29, 2018
62
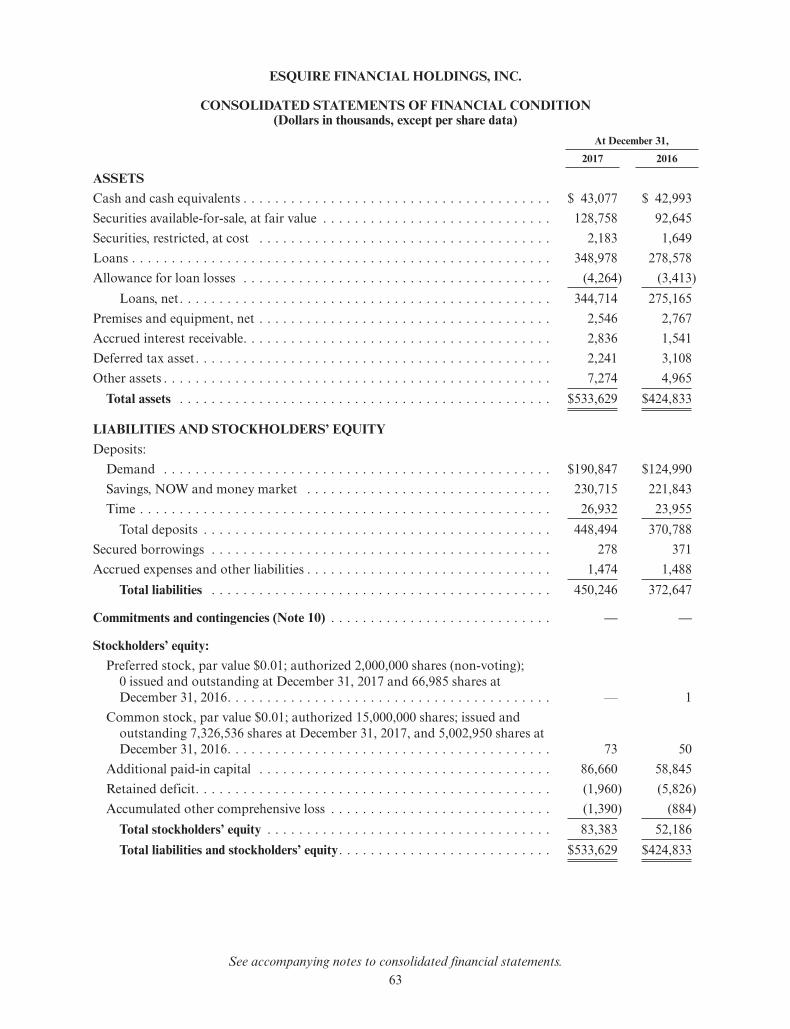
ESQUIRE FINANCIAL HOLDINGS, INC.
CONSOLIDATED STATEMENTS OF FINANCIAL CONDITION(Dollars in thousands, except per share data)
At December 31,
2017 2016
ASSETSCash and cash equivalents . . . . . . . . . . . . . . . . . . . . . . . . . . . . . . . . . . . . . . . $ 43,077 $ 42,993Securities available-for-sale, at fair value . . . . . . . . . . . . . . . . . . . . . . . . . . . . . 128,758 92,645Securities, restricted, at cost . . . . . . . . . . . . . . . . . . . . . . . . . . . . . . . . . . . . . 2,183 1,649Loans . . . . . . . . . . . . . . . . . . . . . . . . . . . . . . . . . . . . . . . . . . . . . . . . . . . . . 348,978 278,578Allowance for loan losses . . . . . . . . . . . . . . . . . . . . . . . . . . . . . . . . . . . . . . . (4,264) (3,413)
Loans, net. . . . . . . . . . . . . . . . . . . . . . . . . . . . . . . . . . . . . . . . . . . . . . . 344,714 275,165Premises and equipment, net . . . . . . . . . . . . . . . . . . . . . . . . . . . . . . . . . . . . . 2,546 2,767Accrued interest receivable. . . . . . . . . . . . . . . . . . . . . . . . . . . . . . . . . . . . . . . 2,836 1,541Deferred tax asset. . . . . . . . . . . . . . . . . . . . . . . . . . . . . . . . . . . . . . . . . . . . . 2,241 3,108Other assets . . . . . . . . . . . . . . . . . . . . . . . . . . . . . . . . . . . . . . . . . . . . . . . . . 7,274 4,965
Total assets . . . . . . . . . . . . . . . . . . . . . . . . . . . . . . . . . . . . . . . . . . . . . . . $533,629 $424,833
LIABILITIES AND STOCKHOLDERS’ EQUITYDeposits:
Demand . . . . . . . . . . . . . . . . . . . . . . . . . . . . . . . . . . . . . . . . . . . . . . . . . $190,847 $124,990Savings, NOW and money market . . . . . . . . . . . . . . . . . . . . . . . . . . . . . . . 230,715 221,843Time . . . . . . . . . . . . . . . . . . . . . . . . . . . . . . . . . . . . . . . . . . . . . . . . . . . . 26,932 23,955
Total deposits . . . . . . . . . . . . . . . . . . . . . . . . . . . . . . . . . . . . . . . . . . . . 448,494 370,788Secured borrowings . . . . . . . . . . . . . . . . . . . . . . . . . . . . . . . . . . . . . . . . . . . 278 371Accrued expenses and other liabilities . . . . . . . . . . . . . . . . . . . . . . . . . . . . . . . 1,474 1,488
Total liabilities . . . . . . . . . . . . . . . . . . . . . . . . . . . . . . . . . . . . . . . . . . . 450,246 372,647
Commitments and contingencies (Note 10) . . . . . . . . . . . . . . . . . . . . . . . . . . . . — —
Stockholders’ equity:Preferred stock, par value $0.01; authorized 2,000,000 shares (non-voting);
0 issued and outstanding at December 31, 2017 and 66,985 shares atDecember 31, 2016. . . . . . . . . . . . . . . . . . . . . . . . . . . . . . . . . . . . . . . . . — 1
Common stock, par value $0.01; authorized 15,000,000 shares; issued andoutstanding 7,326,536 shares at December 31, 2017, and 5,002,950 shares atDecember 31, 2016. . . . . . . . . . . . . . . . . . . . . . . . . . . . . . . . . . . . . . . . . 73 50
Additional paid-in capital . . . . . . . . . . . . . . . . . . . . . . . . . . . . . . . . . . . . . 86,660 58,845Retained deficit. . . . . . . . . . . . . . . . . . . . . . . . . . . . . . . . . . . . . . . . . . . . . (1,960) (5,826)Accumulated other comprehensive loss . . . . . . . . . . . . . . . . . . . . . . . . . . . . (1,390) (884)
Total stockholders’ equity . . . . . . . . . . . . . . . . . . . . . . . . . . . . . . . . . . . . 83,383 52,186Total liabilities and stockholders’ equity. . . . . . . . . . . . . . . . . . . . . . . . . . . $533,629 $424,833
See accompanying notes to consolidated financial statements.63
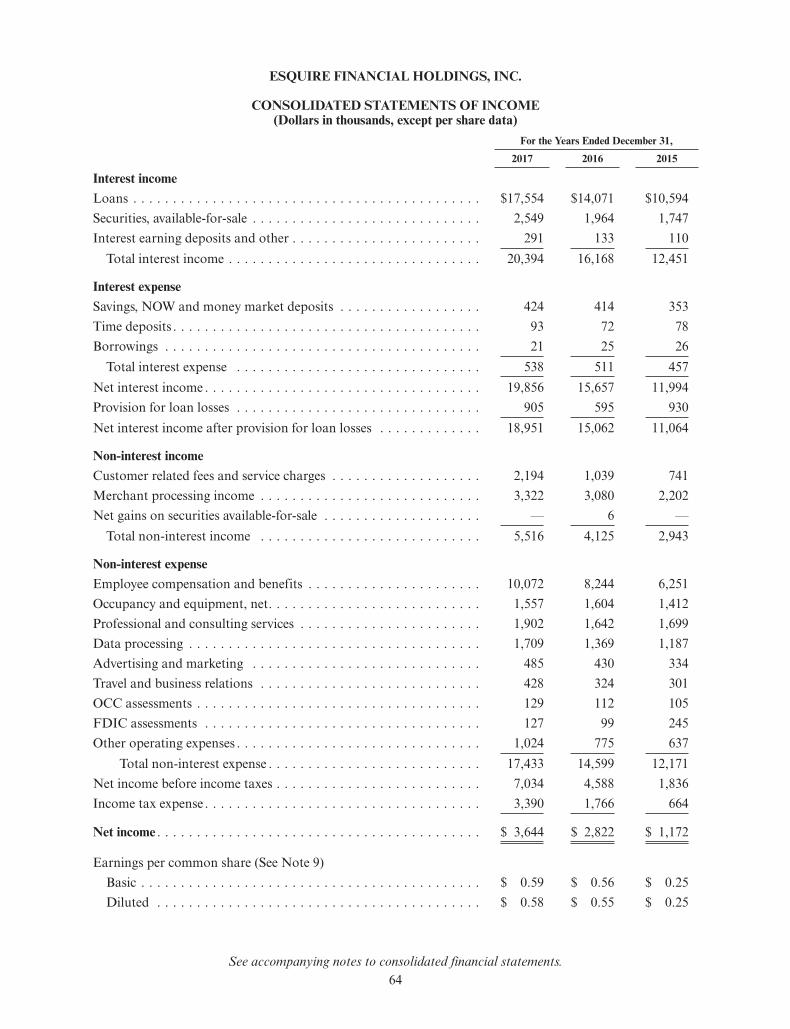
ESQUIRE FINANCIAL HOLDINGS, INC.
CONSOLIDATED STATEMENTS OF INCOME(Dollars in thousands, except per share data)
For the Years Ended December 31,
2017 2016 2015
Interest incomeLoans . . . . . . . . . . . . . . . . . . . . . . . . . . . . . . . . . . . . . . . . . . . . $17,554 $14,071 $10,594Securities, available-for-sale . . . . . . . . . . . . . . . . . . . . . . . . . . . . . 2,549 1,964 1,747Interest earning deposits and other . . . . . . . . . . . . . . . . . . . . . . . . 291 133 110
Total interest income . . . . . . . . . . . . . . . . . . . . . . . . . . . . . . . . 20,394 16,168 12,451
Interest expenseSavings, NOW and money market deposits . . . . . . . . . . . . . . . . . . 424 414 353Time deposits . . . . . . . . . . . . . . . . . . . . . . . . . . . . . . . . . . . . . . . 93 72 78Borrowings . . . . . . . . . . . . . . . . . . . . . . . . . . . . . . . . . . . . . . . . 21 25 26
Total interest expense . . . . . . . . . . . . . . . . . . . . . . . . . . . . . . . 538 511 457Net interest income . . . . . . . . . . . . . . . . . . . . . . . . . . . . . . . . . . . 19,856 15,657 11,994Provision for loan losses . . . . . . . . . . . . . . . . . . . . . . . . . . . . . . . 905 595 930Net interest income after provision for loan losses . . . . . . . . . . . . . 18,951 15,062 11,064
Non-interest incomeCustomer related fees and service charges . . . . . . . . . . . . . . . . . . . 2,194 1,039 741Merchant processing income . . . . . . . . . . . . . . . . . . . . . . . . . . . . 3,322 3,080 2,202Net gains on securities available-for-sale . . . . . . . . . . . . . . . . . . . . — 6 —
Total non-interest income . . . . . . . . . . . . . . . . . . . . . . . . . . . . 5,516 4,125 2,943
Non-interest expenseEmployee compensation and benefits . . . . . . . . . . . . . . . . . . . . . . 10,072 8,244 6,251Occupancy and equipment, net. . . . . . . . . . . . . . . . . . . . . . . . . . . 1,557 1,604 1,412Professional and consulting services . . . . . . . . . . . . . . . . . . . . . . . 1,902 1,642 1,699Data processing . . . . . . . . . . . . . . . . . . . . . . . . . . . . . . . . . . . . . 1,709 1,369 1,187Advertising and marketing . . . . . . . . . . . . . . . . . . . . . . . . . . . . . 485 430 334Travel and business relations . . . . . . . . . . . . . . . . . . . . . . . . . . . . 428 324 301OCC assessments . . . . . . . . . . . . . . . . . . . . . . . . . . . . . . . . . . . . 129 112 105FDIC assessments . . . . . . . . . . . . . . . . . . . . . . . . . . . . . . . . . . . 127 99 245Other operating expenses . . . . . . . . . . . . . . . . . . . . . . . . . . . . . . . 1,024 775 637
Total non-interest expense . . . . . . . . . . . . . . . . . . . . . . . . . . . 17,433 14,599 12,171Net income before income taxes . . . . . . . . . . . . . . . . . . . . . . . . . . 7,034 4,588 1,836Income tax expense . . . . . . . . . . . . . . . . . . . . . . . . . . . . . . . . . . . 3,390 1,766 664
Net income . . . . . . . . . . . . . . . . . . . . . . . . . . . . . . . . . . . . . . . . . $ 3,644 $ 2,822 $ 1,172
Earnings per common share (See Note 9)Basic . . . . . . . . . . . . . . . . . . . . . . . . . . . . . . . . . . . . . . . . . . . $ 0.59 $ 0.56 $ 0.25Diluted . . . . . . . . . . . . . . . . . . . . . . . . . . . . . . . . . . . . . . . . . $ 0.58 $ 0.55 $ 0.25
See accompanying notes to consolidated financial statements.64
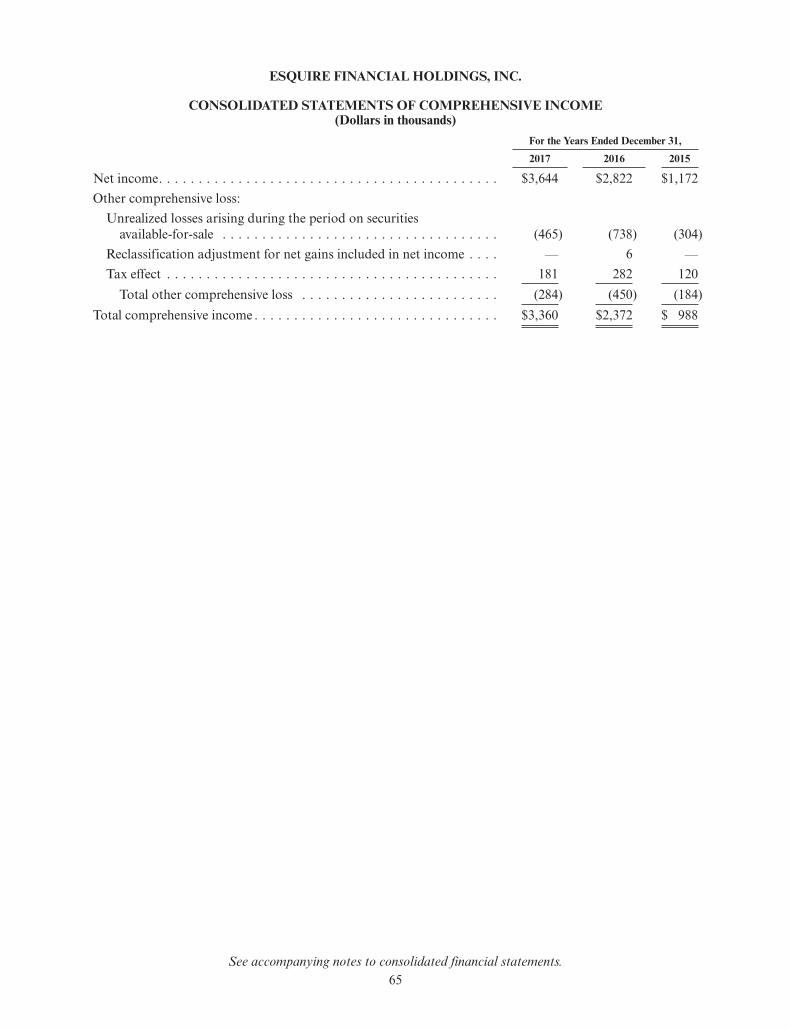
ESQUIRE FINANCIAL HOLDINGS, INC.
CONSOLIDATED STATEMENTS OF COMPREHENSIVE INCOME(Dollars in thousands)
For the Years Ended December 31,
2017 2016 2015
Net income. . . . . . . . . . . . . . . . . . . . . . . . . . . . . . . . . . . . . . . . . . . $3,644 $2,822 $1,172Other comprehensive loss:
Unrealized losses arising during the period on securitiesavailable-for-sale . . . . . . . . . . . . . . . . . . . . . . . . . . . . . . . . . . . (465) (738) (304)
Reclassification adjustment for net gains included in net income . . . . — 6 —Tax effect . . . . . . . . . . . . . . . . . . . . . . . . . . . . . . . . . . . . . . . . . . 181 282 120
Total other comprehensive loss . . . . . . . . . . . . . . . . . . . . . . . . . (284) (450) (184)Total comprehensive income . . . . . . . . . . . . . . . . . . . . . . . . . . . . . . . $3,360 $2,372 $ 988
See accompanying notes to consolidated financial statements.65
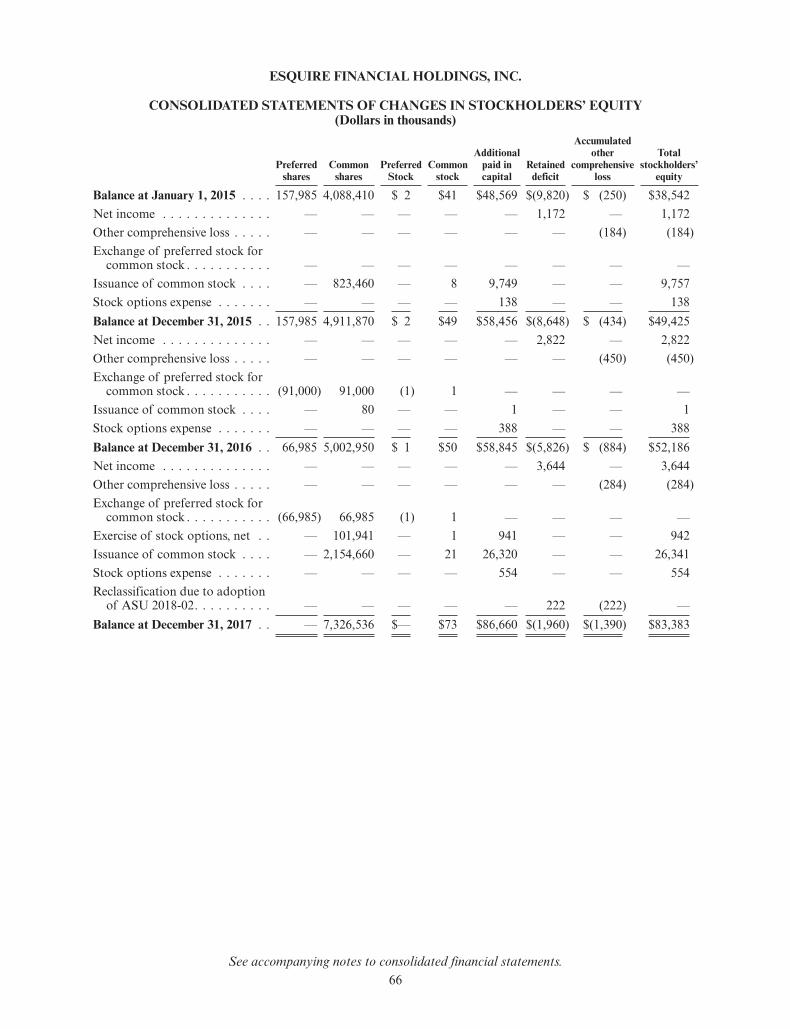
ESQUIRE FINANCIAL HOLDINGS, INC.
CONSOLIDATED STATEMENTS OF CHANGES IN STOCKHOLDERS’ EQUITY(Dollars in thousands)
Preferredshares
Commonshares
PreferredStock
Commonstock
Additionalpaid incapital
Retaineddeficit
Accumulatedother
comprehensiveloss
Totalstockholders’
equity
Balance at January 1, 2015 . . . . 157,985 4,088,410 $ 2 $41 $48,569 $(9,820) $ (250) $38,542Net income . . . . . . . . . . . . . . — — — — — 1,172 — 1,172Other comprehensive loss . . . . . — — — — — — (184) (184)Exchange of preferred stock for
common stock . . . . . . . . . . . — — — — — — — —Issuance of common stock . . . . — 823,460 — 8 9,749 — — 9,757Stock options expense . . . . . . . — — — — 138 — — 138Balance at December 31, 2015 . . 157,985 4,911,870 $ 2 $49 $58,456 $(8,648) $ (434) $49,425Net income . . . . . . . . . . . . . . — — — — — 2,822 — 2,822Other comprehensive loss . . . . . — — — — — — (450) (450)Exchange of preferred stock for
common stock . . . . . . . . . . . (91,000) 91,000 (1) 1 — — — —Issuance of common stock . . . . — 80 — — 1 — — 1Stock options expense . . . . . . . — — — — 388 — — 388Balance at December 31, 2016 . . 66,985 5,002,950 $ 1 $50 $58,845 $(5,826) $ (884) $52,186Net income . . . . . . . . . . . . . . — — — — — 3,644 — 3,644Other comprehensive loss . . . . . — — — — — — (284) (284)Exchange of preferred stock for
common stock . . . . . . . . . . . (66,985) 66,985 (1) 1 — — — —Exercise of stock options, net . . — 101,941 — 1 941 — — 942Issuance of common stock . . . . — 2,154,660 — 21 26,320 — — 26,341Stock options expense . . . . . . . — — — — 554 — — 554Reclassification due to adoption
of ASU 2018-02. . . . . . . . . . — — — — — 222 (222) —Balance at December 31, 2017 . . — 7,326,536 $— $73 $86,660 $(1,960) $(1,390) $83,383
See accompanying notes to consolidated financial statements.66
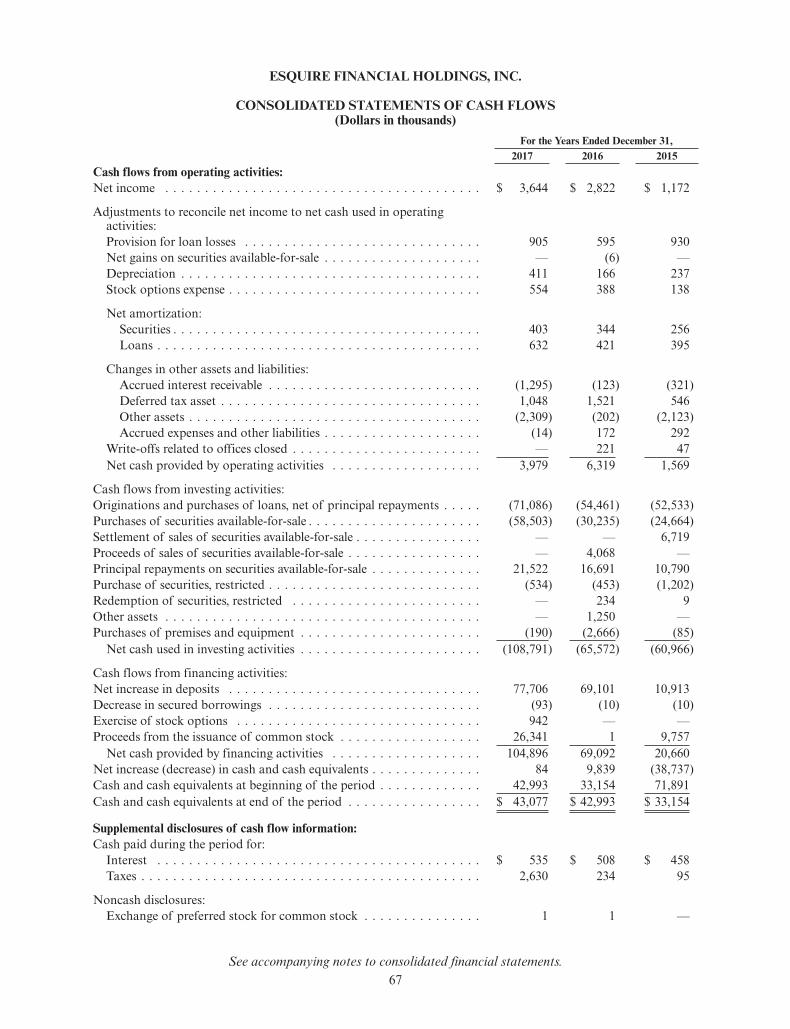
ESQUIRE FINANCIAL HOLDINGS, INC.
CONSOLIDATED STATEMENTS OF CASH FLOWS(Dollars in thousands)
For the Years Ended December 31,2017 2016 2015
Cash flows from operating activities:Net income . . . . . . . . . . . . . . . . . . . . . . . . . . . . . . . . . . . . . . . . $ 3,644 $ 2,822 $ 1,172
Adjustments to reconcile net income to net cash used in operatingactivities:Provision for loan losses . . . . . . . . . . . . . . . . . . . . . . . . . . . . . . 905 595 930Net gains on securities available-for-sale . . . . . . . . . . . . . . . . . . . . — (6) —Depreciation . . . . . . . . . . . . . . . . . . . . . . . . . . . . . . . . . . . . . . 411 166 237Stock options expense . . . . . . . . . . . . . . . . . . . . . . . . . . . . . . . . 554 388 138
Net amortization:Securities . . . . . . . . . . . . . . . . . . . . . . . . . . . . . . . . . . . . . . . 403 344 256Loans . . . . . . . . . . . . . . . . . . . . . . . . . . . . . . . . . . . . . . . . . 632 421 395
Changes in other assets and liabilities:Accrued interest receivable . . . . . . . . . . . . . . . . . . . . . . . . . . . (1,295) (123) (321)Deferred tax asset . . . . . . . . . . . . . . . . . . . . . . . . . . . . . . . . . 1,048 1,521 546Other assets . . . . . . . . . . . . . . . . . . . . . . . . . . . . . . . . . . . . . (2,309) (202) (2,123)Accrued expenses and other liabilities . . . . . . . . . . . . . . . . . . . . (14) 172 292
Write-offs related to offices closed . . . . . . . . . . . . . . . . . . . . . . . . — 221 47Net cash provided by operating activities . . . . . . . . . . . . . . . . . . . 3,979 6,319 1,569
Cash flows from investing activities:Originations and purchases of loans, net of principal repayments . . . . . (71,086) (54,461) (52,533)Purchases of securities available-for-sale . . . . . . . . . . . . . . . . . . . . . . (58,503) (30,235) (24,664)Settlement of sales of securities available-for-sale . . . . . . . . . . . . . . . . — — 6,719Proceeds of sales of securities available-for-sale . . . . . . . . . . . . . . . . . — 4,068 —Principal repayments on securities available-for-sale . . . . . . . . . . . . . . 21,522 16,691 10,790Purchase of securities, restricted . . . . . . . . . . . . . . . . . . . . . . . . . . . (534) (453) (1,202)Redemption of securities, restricted . . . . . . . . . . . . . . . . . . . . . . . . — 234 9Other assets . . . . . . . . . . . . . . . . . . . . . . . . . . . . . . . . . . . . . . . . — 1,250 —Purchases of premises and equipment . . . . . . . . . . . . . . . . . . . . . . . (190) (2,666) (85)
Net cash used in investing activities . . . . . . . . . . . . . . . . . . . . . . . (108,791) (65,572) (60,966)
Cash flows from financing activities:Net increase in deposits . . . . . . . . . . . . . . . . . . . . . . . . . . . . . . . . 77,706 69,101 10,913Decrease in secured borrowings . . . . . . . . . . . . . . . . . . . . . . . . . . . (93) (10) (10)Exercise of stock options . . . . . . . . . . . . . . . . . . . . . . . . . . . . . . . 942 — —Proceeds from the issuance of common stock . . . . . . . . . . . . . . . . . . 26,341 1 9,757
Net cash provided by financing activities . . . . . . . . . . . . . . . . . . . 104,896 69,092 20,660Net increase (decrease) in cash and cash equivalents . . . . . . . . . . . . . . 84 9,839 (38,737)Cash and cash equivalents at beginning of the period . . . . . . . . . . . . . 42,993 33,154 71,891Cash and cash equivalents at end of the period . . . . . . . . . . . . . . . . . $ 43,077 $ 42,993 $ 33,154
Supplemental disclosures of cash flow information:Cash paid during the period for:
Interest . . . . . . . . . . . . . . . . . . . . . . . . . . . . . . . . . . . . . . . . . $ 535 $ 508 $ 458Taxes . . . . . . . . . . . . . . . . . . . . . . . . . . . . . . . . . . . . . . . . . . . 2,630 234 95
Noncash disclosures:Exchange of preferred stock for common stock . . . . . . . . . . . . . . . 1 1 —
See accompanying notes to consolidated financial statements.67
ESQUIRE FINANCIAL HOLDINGS, INC.
NOTES TO CONSOLIDATED FINANCIAL STATEMENTSDecember 31, 2017 and 2016
(Dollars in thousands, except per share data)
NOTE 1 — Business and Summary of Significant Accounting Policies
Business
Esquire Financial Holdings, Inc. (the “Company”) is a registered bank holding company and theparent company of Esquire Bank, National Association (the “Bank”). In August of 2015, the Companyand the Bank were converted from a savings and loan holding company and savings bank to a bank holdingcompany and national bank, respectively, and the Company, formerly a Delaware corporation, wasreincorporated through a merger to a Maryland corporation.
The Bank is an independent, full-service national bank that serves the banking needs of lawprofessionals, professional service firms, small to mid-sized businesses and individuals. The Bank wasestablished in 2006 and began operations in October 2006. The Bank’s headquarters is located in Jericho,New York. The Bank also operates a branch in Garden City, New York and an administrative office inPalm Beach Gardens, Florida.
As a full-service bank, the Bank offers checking, savings, money market and time deposits; a widerange of commercial and consumer loans, as well as customary banking services. Through electronicdelivery channels, the Bank provides bill payment services, wire transfers, ACH origination, accounttransfers and real time deposit relationship updates. These innovative services are complimented with a fullrange of traditional banking products and services. While the Bank is a full-service institution available toall potential customers, the focus is marketing to law firms and other professional service firms, small tomid-sized businesses and individuals in the local community surrounding the branch office and New Yorkboroughs in order to grow the deposit base. Additionally, due in part, to the substantial ties that many ofthe board members and organizers have to the legal community, the Bank concentrates most of itsmarketing efforts on the legal community in these areas and nationally.
The Bank entered into the merchant service business as an acquiring bank in which credit and debitcard transactions are settled on behalf of merchants. The revenue earned on behalf of merchants, net ofexpenses, is paid to the independent sales organizations (ISO’s). The Bank’s revenue from this transaction isshown as merchant processing income on the statements of income. Revenue is recognized when earned.
The consolidated financial statements include Esquire Financial Holdings, Inc. and its wholly ownedsubsidiary, Esquire Bank, N.A. and are referred to as “the Company.” Intercompany transactions andbalances are eliminated in consolidation.
Common Stock Issuances
On June 30, 2017, we completed our initial public offering (“IPO”) and sold 1,800,000 shares ofcommon stock. We received aggregate net proceeds of approximately $21,741, after deducting underwritingdiscount and other offering related expenses. On July 20, 2017 we sold 354,580 additional shares ofcommon stock at the public offering price of $14.00 per share pursuant to the underwriter's over-allotmentoptions. The net proceeds after deducting the underwriting discount and other offering related expenseswere approximately $4,600.
During 2015, the Company sold 823,460 shares of common stock through a private placement offeringfor total proceeds, net of offering costs, of $9,800.
Basis of Presentation and Use of Estimates
The accounting and financial reporting policies are in conformity with U.S. generally acceptedaccounting principles (GAAP). The preparation of financial statements requires that management makeestimates and assumptions that affect the reported amounts of assets and liabilities, the disclosure of
68
ESQUIRE FINANCIAL HOLDINGS, INC.
NOTES TO CONSOLIDATED FINANCIAL STATEMENTSDecember 31, 2017 and 2016
(Dollars in thousands, except per share data)
contingent assets and liabilities at the date of the financial statements and the reported amounts of incomeand expenses during the reporting period. Such estimates are subject to change in the future as additionalinformation becomes available or previously existing circumstances are modified. Actual results could differfrom those estimates.
Statement of Cash Flows
For purposes of the accompanying statements of cash flows, cash and cash equivalents are defined asthe amounts included in the consolidated statements of financial condition under the captions “Cash andcash equivalents”, with contractual maturities of less than 90 days. Net cash flows are reported for customerloan and deposit transactions.
Securities
All securities are classified as available-for-sale and carried at fair value. Unrealized gains and losses onthese securities are reported, net of applicable taxes, as a separate component of accumulated othercomprehensive income (loss), a component of stockholders’ equity.
Interest income on securities, including amortization of premiums and accretion of discounts, isrecognized using the level yield method without anticipating prepayments (except for mortgage-backedsecurities where prepayments are anticipated) over the lives of the individual securities. Realized gains andlosses on sales of securities are computed using the specific identification method.
Loans
Loans that management has the intent and ability to hold for the foreseeable future until maturity orpayoff are stated at the principal amount outstanding, net of deferred loan fees and costs for originatedloans and net of unamortized premiums or discounts for purchased loans. Interest income is recognizedusing the level yield method. Net deferred loan fees, origination costs, unamortized premiums or discountsare recognized in interest income over the loan term as a yield adjustment.
Non-Accrual
Interest income on mortgage and commercial loans is discontinued at the time the loan is 90 daysdelinquent unless the loan is well-secured and in process of collection. Consumer loans are typicallycharged off no later than 120 days past due. Past due status is based on the contractual terms of the loan.In all cases, loans are placed on nonaccrual or charged-off at an earlier date if collection of principal orinterest is considered doubtful. Nonaccrual loans and loans past due 90 days still on accrual include bothsmaller balance homogeneous loans that are collectively evaluated for impairment and individuallyclassified impaired loans. A loan is moved to non-accrual status in accordance with the Company’s policy,typically after 90 days of non-payment.
All interest accrued but not received for loans placed on nonaccrual is reversed against interest income.Interest received on such loans is accounted for on the cash-basis or cost-recovery method, until qualifyingfor return to accrual. Loans are returned to accrual status when all the principal and interest amountscontractually due are brought current and future payments are reasonably assured.
Provision and Allowance for Loan Losses
The allowance for loan losses is a valuation allowance for probable incurred credit losses. Theallowance for loan losses is increased by provisions for loan losses charged to income. Losses are charged tothe allowance when all or a portion of a loan is deemed to be uncollectible. Subsequent recoveries of loanspreviously charged off are credited to the allowance for loan losses when realized. Management estimates
69
ESQUIRE FINANCIAL HOLDINGS, INC.
NOTES TO CONSOLIDATED FINANCIAL STATEMENTSDecember 31, 2017 and 2016
(Dollars in thousands, except per share data)
the allowance balance required using past loan loss experience, the nature and volume of the portfolio,information about specific borrower situations and estimated collateral values, economic conditions andother factors. Allocations of the allowance may be made for specific loans, but the entire allowance isavailable for any loan that, in Management’s judgment, should be charged off.
The allowance consists of specific and general components. The specific component relates to loansthat are individually classified as impaired when, based on current information and events, it is probablethat the Company will be unable to collect all amounts due according to the contractual terms of the loanagreement.
Factors considered by management in determining impairment include payment status, collateral value,and the probability of collecting scheduled principal and interest payments when due. Loans that experienceinsignificant payment delays and payment shortfalls generally are not classified as impaired. Managementdetermines the significance of payment delays and payment shortfalls on a case-by-case basis, taking intoconsideration all of the circumstances surrounding the loan and the borrower, including the length of thedelay, the reasons for the delay, the borrower’s prior payment record, and the amount of the shortfall inrelation to the principal and interest owed.
All loans, except for consumer loans are individually evaluated for impairment. If a loan is impaired, aportion of the allowance is allocated as a specific allowance. The measurement of an impaired loan is basedon (i) the present value of expected future cash flows discounted at the loan’s effective interest rate, (ii) theloan’s observable market price or (iii) the fair value of the collateral if the loan is collateral dependent.
Loans for which the terms have been modified resulting in a concession, and for which the borrower isexperiencing financial difficulties, are considered troubled debt restructurings and classified as impaired.Troubled debt restructurings are separately identified for impairment disclosures and are measured at thepresent value of estimated future cash flows using the loan’s effective rate at inception. If a troubled debtrestructuring is considered to be a collateral dependent loan, the loan is reported, net, at the fair value ofthe collateral. For troubled debt restructurings that subsequently default, the Company determines theamount of reserve in accordance with the accounting policy for the allowance for loan losses. The generalcomponent is based on historical loss experience adjusted for current factors. The historical loss experienceis determined by portfolio segment and is based on the actual loss history experienced by the Company.This actual loss experience is supplemented with other economic factors based on the risks present for eachportfolio segment. These economic factors include consideration of the following: levels of and trends indelinquencies and impaired loans; levels of and trends in charge-offs and recoveries; trends in volume andterms of loans; effects of any changes in risk selection and underwriting standards; other changes in lendingpolicies, procedures, and practices; experience, ability, and depth of lending management and other relevantstaff; national and local economic trends and conditions; industry conditions; and effects of changes incredit concentrations.
Management has identified the following loan segments: Commercial Real Estate, Multifamily,Construction, Commercial, 1 – 4 Family Residential and Consumer. The risks associated with aconcentration in real estate loans include potential losses from fluctuating values of land and improvedproperties. Commercial Real Estate and Multifamily loans are expected to be repaid from the cash flow ofthe underlying property so the collective amount of rents must be sufficient to cover all operating expenses,property management and maintenance, taxes and debt service. Increases in vacancy rates, interest rates orother changes in general economic conditions can all have an impact on the borrower and their ability torepay the loan. Construction loans are considered riskier than commercial financing on improved andestablished commercial real estate. The risk of potential loss increases if the original cost estimates or timeto complete are significantly off. The remainder of the loan portfolio is comprised of commercial andconsumer loans. The primary risks associated with the commercial loans is the cash flow of the business,the experience and quality of the borrowers’ management, the business climate, and the impact of economic
70
ESQUIRE FINANCIAL HOLDINGS, INC.
NOTES TO CONSOLIDATED FINANCIAL STATEMENTSDecember 31, 2017 and 2016
(Dollars in thousands, except per share data)
factors. The primary risks associated with 1 – 4 Family Residential and Consumer loans relate to theborrower, such as the risk of a borrower’s unemployment as a result of deteriorating economic conditionsor the amount and nature of a borrower’s other existing indebtedness, and the value of the collateralsecuring the loan if the Bank must take possession of the collateral.
Premises and Equipment
Premises and equipment, including leasehold improvements, are stated at cost, net of accumulateddepreciation and amortization. Equipment, which includes furniture and fixtures, are depreciated over theassets’ estimated useful lives using the straight-line method (three to ten years). Amortization of leaseholdimprovements is recognized on a straight-line basis over the lesser of the expected lease term or theestimated useful life of the asset. Costs incurred to improve or extend the life of existing assets arecapitalized. Repairs and maintenance are charged to expense.
Federal Home Loan Bank (FHLB) Stock
The Bank is a member of the FHLB system. Members are required to own a certain amount of stockbased on the level of mortgage related assets, borrowings and other factors. FHLB stock is carried at cost,classified as a restricted security and periodically evaluated for impairment based on the ultimate recoveryof par value. Dividends are reported as interest income.
Federal Reserve Bank (FRB) Stock
The Bank is a member of its regional FRB. FRB stock is carried at cost, classified as a restrictedsecurity, and periodically evaluated for impairment based on ultimate recovery of par value. Dividends arereported as interest income.
Loan Commitments and Related Financial Instruments
Financial instruments include off balance sheet credit instruments, such as commitments to make loansand commercial letters of credit, are issued to meet customer financing needs. The face amount for theseitems represents the exposure to loss, before considering customer collateral or ability to repay. Suchfinancial instruments are recorded when they are funded.
Transfers of Financial Assets
Transfers of financial assets are accounted for as sales, when control over the assets has beenrelinquished. Control over transferred assets is deemed to be surrendered when the assets have been isolatedfrom the Company, the transferee obtains the right (free of conditions that constrain it from takingadvantage of that right) to pledge or exchange the transferred assets, and the Company does not maintaineffective control over the transferred assets through an agreement to repurchase them before their maturity.
Income Taxes
Income taxes are provided for under the asset and liability method. Deferred tax assets and liabilitiesare recognized for the future tax consequences attributable to differences between the financial statementcarrying amounts of existing assets and liabilities and their respective tax bases. Deferred tax assets andliabilities are measured using enacted rates expected to apply to taxable income in the years in which thosetemporary differences are expected to be recovered or settled. The effect on deferred taxes of a change intax rates is recognized in income in the period the change occurs. Deferred tax assets are reduced, through avaluation allowance, if necessary, by the amount of such benefits that are not expected to be realized basedon current available evidence.
71
ESQUIRE FINANCIAL HOLDINGS, INC.
NOTES TO CONSOLIDATED FINANCIAL STATEMENTSDecember 31, 2017 and 2016
(Dollars in thousands, except per share data)
A tax position is recognized as a benefit only if it is “more likely than not” that the tax position wouldbe sustained in a tax examination, with a tax examination being presumed to occur. The amount recognizedis the largest amount of tax benefit that is greater than 50% likely of being realized on examination. For taxpositions not meeting the “more likely than not” test, no tax benefit is recorded. The Company recognizesinterest and/or penalties related to income tax matters in income tax expense.
Earnings per Common Share
Basic earnings per common share is net earnings allocated to common stock divided by the weightedaverage number of common shares outstanding during the period. Any outstanding preferred shares areconsidered participating securities for computation of basic earnings per common share. Diluted earningsper common share include the dilutive effect of additional potential common shares issuable under stockoptions.
Share-Based Payment
Share based payment guidance requires the Company to recognize the grant-date fair value of stockoptions and other equity-based compensation issued to employees and non-employees in the statements ofincome. A Black-Scholes model is utilized to estimate the fair value of stock options. Compensation cost forstock options are recognized as non-interest expense in the statement of income on a straight-line basis overthe vesting period of each stock option grant. Compensation cost for stock options includes the impact ofan estimated forfeiture rate. At December 31, 2017, no stock options had vesting conditions linked to theperformance of the Company or market conditions.
Preferred Stock
In December of 2014, an investor executed the purchase of 157,985 shares of 0.00% Series BNon-Voting Preferred Shares at a price of $12.50 per share for proceeds, net of offering costs, ofapproximately $1,800. The preferred stock does not have a maturity date and is not convertible by theholder, but is convertible on a one for one basis into shares of common stock by us under certaincircumstances. In addition, the preferred stock does not have a liquidation preference. Preferred shares haveequal rights to receive dividends when dividends are declared on common stock, and thus are consideredparticipating securities.
In June of 2016, the Company and the preferred shareholder agreed to perform an exchange of 91,000shares of 0.00% of Series B non-voting preferred shares for 91,000 voting common shares, par value $0.01.
In July of 2017, the Company and the preferred shareholder agreed to perform an exchange of 66,985shares of 0.00% of Series B non-voting preferred shares for 66,985 voting common shares, par value $0.01.As of December 31, 2017, there are no preferred shares outstanding.
Dividend Restriction
Banking regulations require maintaining certain capital levels and may limit the dividends paid by thebank to the holding company or by the holding company to shareholders.
Segment Reporting
The Company’s operations are exclusively in the financial services industry and include the provision oftraditional banking services. Management evaluates the performance of the Company based on only onebusiness segment, that of community banking. In the opinion of management, the Company does not haveany other reportable segments as defined by Accounting Standards Codification (ASC) Topic 280,“Disclosure about Segments of an Enterprise and Related Information”.
72
ESQUIRE FINANCIAL HOLDINGS, INC.
NOTES TO CONSOLIDATED FINANCIAL STATEMENTSDecember 31, 2017 and 2016
(Dollars in thousands, except per share data)
Restrictions on Cash
Cash on hand or on deposit with the FRB was required to meet regulatory reserve and clearingrequirements.
Reclassifications
Some items in the prior year financial statements were reclassified to conform to the currentpresentation. Reclassifications had no effect on prior year net income or stockholders’ equity.
Comprehensive Income
Comprehensive income (loss) consists of net income and other comprehensive (loss) income. Othercomprehensive (loss) income includes unrealized gains and losses on securities available-for-sale which arealso recognized as separate components of equity.
Fair Value of Financial Instruments
Fair values of financial instruments are estimated using relevant market information and otherassumptions, as more fully disclosed in a separate note. Fair value estimates involve uncertainties andmatters of significant judgment regarding interest rates, credit risk, prepayments, and other factors,especially in the absence of broad markets for particular items. Changes in assumptions or in marketconditions could significantly affect the estimates.
Loss Contingencies
Loss contingencies, including claims and legal actions arising in the ordinary course of business, arerecorded as liabilities when the likelihood of loss is probable and an amount or range of loss can bereasonably estimated. Management does not believe there now are such matters that will have a materialeffect on the consolidated financial statements.
New Accounting Pronouncements
Accounting Standards Update (ASU) 2014-09, “Revenue from Contracts with Customers (Topic 606)”implements a common revenue standard that clarifies the principles for recognizing revenue. The coreprinciple of ASU 2014-09 is that an entity should recognize revenue to depict the transfer of promisedgoods or services to customers in an amount that reflects the consideration to which the entity expects to beentitled in exchange for those goods or services. To achieve that core principle, an entity should apply thefollowing steps: (i) identify the contract(s) with a customer, (ii) identify the performance obligations in thecontract, (iii) determine the transaction price, (iv) allocate the transaction price to the performanceobligations in the contract and (v) recognize revenue when (or as) the entity satisfies a performanceobligation. ASU 2014-09 was effective for the Company on January 1, 2018. The Company has completedits review of noninterest income revenue within the scope of the guidance and an assessment of its revenuecontracts, and as a result, did not identify material changes related to the timing or amount of revenuerecognition. Also, adoption of this standard is not expected to lead to additional disaggregation of revenuecategories.
On January 5, 2016, the FASB issued ASU 2016-01, “Financial Instruments — Overall: Recognitionand Measurement of Financial Assets and Financial Liabilities” (the ASU). Under this ASU, the currentGAAP model is changed in the areas of accounting for equity investments, financial liabilities under the fairvalue option, and the presentation and disclosure requirements for financial instruments. The ASU will beeffective for public business entities in fiscal years beginning after December 15, 2017, including interimperiods within those fiscal years. Adoption of this standard did not have a material effect on the Company’soperating results or financial condition.
73
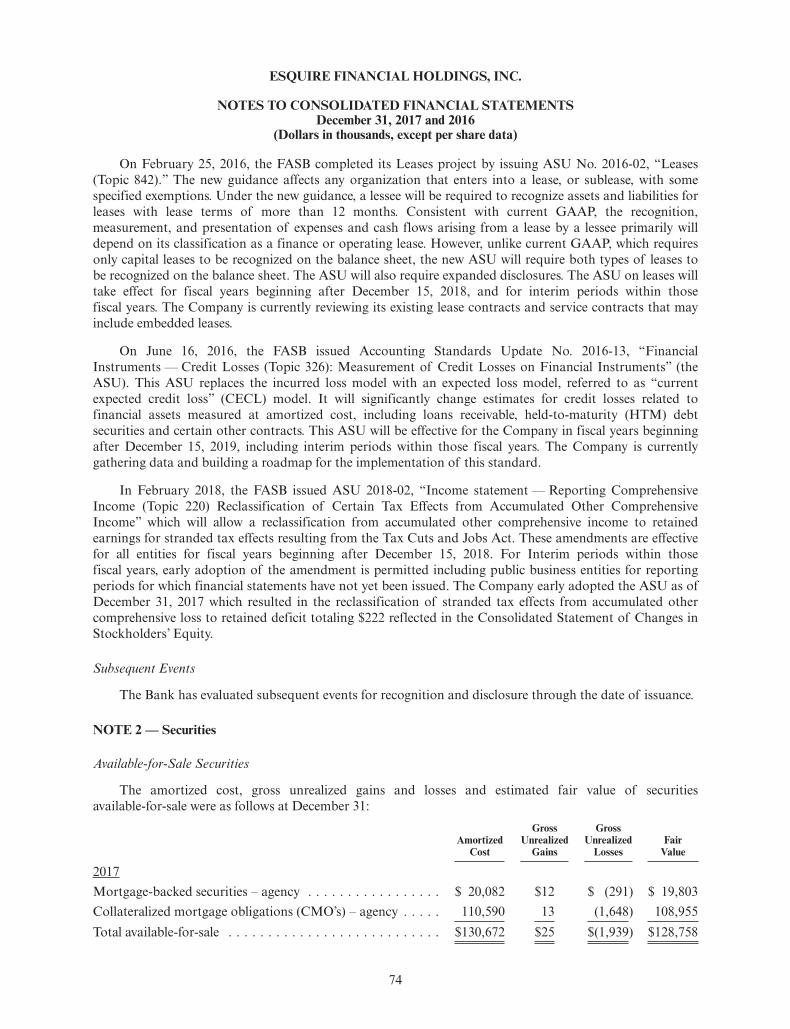
ESQUIRE FINANCIAL HOLDINGS, INC.
NOTES TO CONSOLIDATED FINANCIAL STATEMENTSDecember 31, 2017 and 2016
(Dollars in thousands, except per share data)
On February 25, 2016, the FASB completed its Leases project by issuing ASU No. 2016-02, “Leases(Topic 842).” The new guidance affects any organization that enters into a lease, or sublease, with somespecified exemptions. Under the new guidance, a lessee will be required to recognize assets and liabilities forleases with lease terms of more than 12 months. Consistent with current GAAP, the recognition,measurement, and presentation of expenses and cash flows arising from a lease by a lessee primarily willdepend on its classification as a finance or operating lease. However, unlike current GAAP, which requiresonly capital leases to be recognized on the balance sheet, the new ASU will require both types of leases tobe recognized on the balance sheet. The ASU will also require expanded disclosures. The ASU on leases willtake effect for fiscal years beginning after December 15, 2018, and for interim periods within thosefiscal years. The Company is currently reviewing its existing lease contracts and service contracts that mayinclude embedded leases.
On June 16, 2016, the FASB issued Accounting Standards Update No. 2016-13, “FinancialInstruments — Credit Losses (Topic 326): Measurement of Credit Losses on Financial Instruments” (theASU). This ASU replaces the incurred loss model with an expected loss model, referred to as “currentexpected credit loss” (CECL) model. It will significantly change estimates for credit losses related tofinancial assets measured at amortized cost, including loans receivable, held-to-maturity (HTM) debtsecurities and certain other contracts. This ASU will be effective for the Company in fiscal years beginningafter December 15, 2019, including interim periods within those fiscal years. The Company is currentlygathering data and building a roadmap for the implementation of this standard.
In February 2018, the FASB issued ASU 2018-02, “Income statement — Reporting ComprehensiveIncome (Topic 220) Reclassification of Certain Tax Effects from Accumulated Other ComprehensiveIncome” which will allow a reclassification from accumulated other comprehensive income to retainedearnings for stranded tax effects resulting from the Tax Cuts and Jobs Act. These amendments are effectivefor all entities for fiscal years beginning after December 15, 2018. For Interim periods within thosefiscal years, early adoption of the amendment is permitted including public business entities for reportingperiods for which financial statements have not yet been issued. The Company early adopted the ASU as ofDecember 31, 2017 which resulted in the reclassification of stranded tax effects from accumulated othercomprehensive loss to retained deficit totaling $222 reflected in the Consolidated Statement of Changes inStockholders’ Equity.
Subsequent Events
The Bank has evaluated subsequent events for recognition and disclosure through the date of issuance.
NOTE 2 — Securities
Available-for-Sale Securities
The amortized cost, gross unrealized gains and losses and estimated fair value of securitiesavailable-for-sale were as follows at December 31:
AmortizedCost
GrossUnrealized
Gains
GrossUnrealized
LossesFair
Value
2017Mortgage-backed securities – agency . . . . . . . . . . . . . . . . . $ 20,082 $12 $ (291) $ 19,803Collateralized mortgage obligations (CMO’s) – agency . . . . . 110,590 13 (1,648) 108,955Total available-for-sale . . . . . . . . . . . . . . . . . . . . . . . . . . . $130,672 $25 $(1,939) $128,758
74
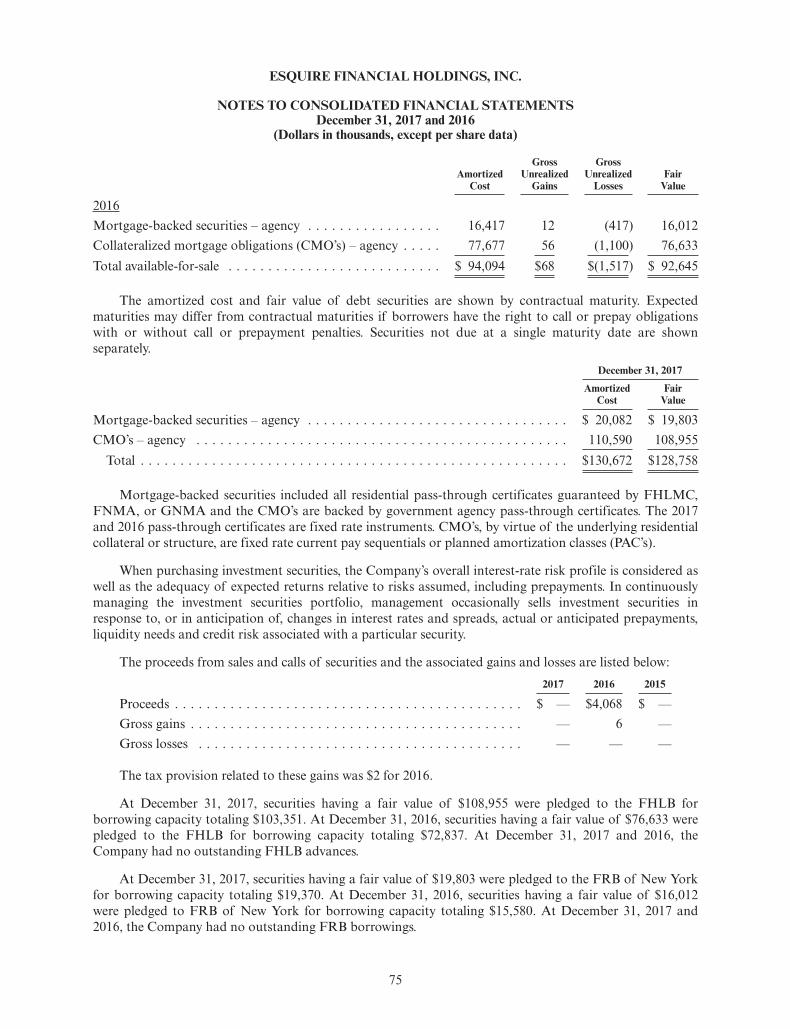
ESQUIRE FINANCIAL HOLDINGS, INC.
NOTES TO CONSOLIDATED FINANCIAL STATEMENTSDecember 31, 2017 and 2016
(Dollars in thousands, except per share data)
AmortizedCost
GrossUnrealized
Gains
GrossUnrealized
LossesFair
Value
2016Mortgage-backed securities – agency . . . . . . . . . . . . . . . . . 16,417 12 (417) 16,012Collateralized mortgage obligations (CMO’s) – agency . . . . . 77,677 56 (1,100) 76,633Total available-for-sale . . . . . . . . . . . . . . . . . . . . . . . . . . . $ 94,094 $68 $(1,517) $ 92,645
The amortized cost and fair value of debt securities are shown by contractual maturity. Expectedmaturities may differ from contractual maturities if borrowers have the right to call or prepay obligationswith or without call or prepayment penalties. Securities not due at a single maturity date are shownseparately.
December 31, 2017
AmortizedCost
FairValue
Mortgage-backed securities – agency . . . . . . . . . . . . . . . . . . . . . . . . . . . . . . . . . $ 20,082 $ 19,803CMO’s – agency . . . . . . . . . . . . . . . . . . . . . . . . . . . . . . . . . . . . . . . . . . . . . . . 110,590 108,955
Total . . . . . . . . . . . . . . . . . . . . . . . . . . . . . . . . . . . . . . . . . . . . . . . . . . . . . . $130,672 $128,758
Mortgage-backed securities included all residential pass-through certificates guaranteed by FHLMC,FNMA, or GNMA and the CMO’s are backed by government agency pass-through certificates. The 2017and 2016 pass-through certificates are fixed rate instruments. CMO’s, by virtue of the underlying residentialcollateral or structure, are fixed rate current pay sequentials or planned amortization classes (PAC’s).
When purchasing investment securities, the Company’s overall interest-rate risk profile is considered aswell as the adequacy of expected returns relative to risks assumed, including prepayments. In continuouslymanaging the investment securities portfolio, management occasionally sells investment securities inresponse to, or in anticipation of, changes in interest rates and spreads, actual or anticipated prepayments,liquidity needs and credit risk associated with a particular security.
The proceeds from sales and calls of securities and the associated gains and losses are listed below:2017 2016 2015
Proceeds . . . . . . . . . . . . . . . . . . . . . . . . . . . . . . . . . . . . . . . . . . . . $ — $4,068 $ —Gross gains . . . . . . . . . . . . . . . . . . . . . . . . . . . . . . . . . . . . . . . . . . — 6 —Gross losses . . . . . . . . . . . . . . . . . . . . . . . . . . . . . . . . . . . . . . . . . — — —
The tax provision related to these gains was $2 for 2016.
At December 31, 2017, securities having a fair value of $108,955 were pledged to the FHLB forborrowing capacity totaling $103,351. At December 31, 2016, securities having a fair value of $76,633 werepledged to the FHLB for borrowing capacity totaling $72,837. At December 31, 2017 and 2016, theCompany had no outstanding FHLB advances.
At December 31, 2017, securities having a fair value of $19,803 were pledged to the FRB of New Yorkfor borrowing capacity totaling $19,370. At December 31, 2016, securities having a fair value of $16,012were pledged to FRB of New York for borrowing capacity totaling $15,580. At December 31, 2017 and2016, the Company had no outstanding FRB borrowings.
75
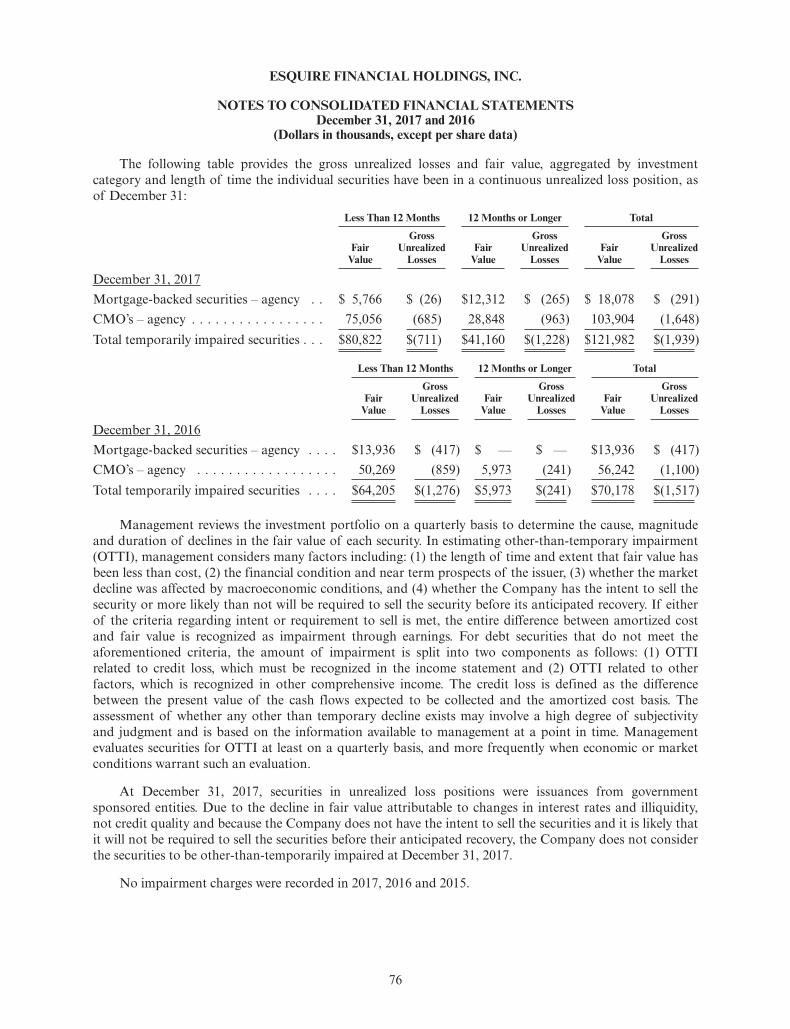
ESQUIRE FINANCIAL HOLDINGS, INC.
NOTES TO CONSOLIDATED FINANCIAL STATEMENTSDecember 31, 2017 and 2016
(Dollars in thousands, except per share data)
The following table provides the gross unrealized losses and fair value, aggregated by investmentcategory and length of time the individual securities have been in a continuous unrealized loss position, asof December 31:
Less Than 12 Months 12 Months or Longer Total
FairValue
GrossUnrealized
LossesFair
Value
GrossUnrealized
LossesFair
Value
GrossUnrealized
Losses
December 31, 2017Mortgage-backed securities – agency . . $ 5,766 $ (26) $12,312 $ (265) $ 18,078 $ (291)CMO’s – agency . . . . . . . . . . . . . . . . . 75,056 (685) 28,848 (963) 103,904 (1,648)Total temporarily impaired securities . . . $80,822 $(711) $41,160 $(1,228) $121,982 $(1,939)
Less Than 12 Months 12 Months or Longer Total
FairValue
GrossUnrealized
LossesFair
Value
GrossUnrealized
LossesFair
Value
GrossUnrealized
Losses
December 31, 2016Mortgage-backed securities – agency . . . . $13,936 $ (417) $ — $ — $13,936 $ (417)CMO’s – agency . . . . . . . . . . . . . . . . . . 50,269 (859) 5,973 (241) 56,242 (1,100)Total temporarily impaired securities . . . . $64,205 $(1,276) $5,973 $(241) $70,178 $(1,517)
Management reviews the investment portfolio on a quarterly basis to determine the cause, magnitudeand duration of declines in the fair value of each security. In estimating other-than-temporary impairment(OTTI), management considers many factors including: (1) the length of time and extent that fair value hasbeen less than cost, (2) the financial condition and near term prospects of the issuer, (3) whether the marketdecline was affected by macroeconomic conditions, and (4) whether the Company has the intent to sell thesecurity or more likely than not will be required to sell the security before its anticipated recovery. If eitherof the criteria regarding intent or requirement to sell is met, the entire difference between amortized costand fair value is recognized as impairment through earnings. For debt securities that do not meet theaforementioned criteria, the amount of impairment is split into two components as follows: (1) OTTIrelated to credit loss, which must be recognized in the income statement and (2) OTTI related to otherfactors, which is recognized in other comprehensive income. The credit loss is defined as the differencebetween the present value of the cash flows expected to be collected and the amortized cost basis. Theassessment of whether any other than temporary decline exists may involve a high degree of subjectivityand judgment and is based on the information available to management at a point in time. Managementevaluates securities for OTTI at least on a quarterly basis, and more frequently when economic or marketconditions warrant such an evaluation.
At December 31, 2017, securities in unrealized loss positions were issuances from governmentsponsored entities. Due to the decline in fair value attributable to changes in interest rates and illiquidity,not credit quality and because the Company does not have the intent to sell the securities and it is likely thatit will not be required to sell the securities before their anticipated recovery, the Company does not considerthe securities to be other-than-temporarily impaired at December 31, 2017.
No impairment charges were recorded in 2017, 2016 and 2015.
76
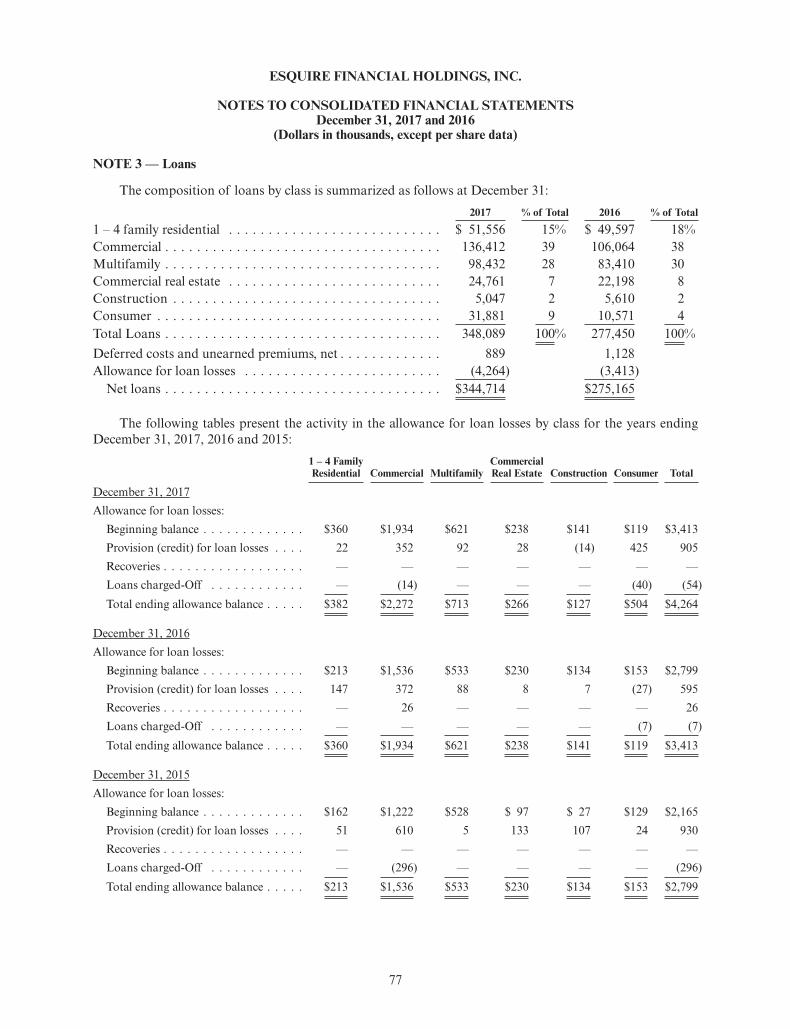
ESQUIRE FINANCIAL HOLDINGS, INC.
NOTES TO CONSOLIDATED FINANCIAL STATEMENTSDecember 31, 2017 and 2016
(Dollars in thousands, except per share data)
NOTE 3 — Loans
The composition of loans by class is summarized as follows at December 31:2017 % of Total 2016 % of Total
1 – 4 family residential . . . . . . . . . . . . . . . . . . . . . . . . . . . $ 51,556 15% $ 49,597 18%Commercial . . . . . . . . . . . . . . . . . . . . . . . . . . . . . . . . . . . 136,412 39 106,064 38Multifamily . . . . . . . . . . . . . . . . . . . . . . . . . . . . . . . . . . . 98,432 28 83,410 30Commercial real estate . . . . . . . . . . . . . . . . . . . . . . . . . . . 24,761 7 22,198 8Construction . . . . . . . . . . . . . . . . . . . . . . . . . . . . . . . . . . 5,047 2 5,610 2Consumer . . . . . . . . . . . . . . . . . . . . . . . . . . . . . . . . . . . . 31,881 9 10,571 4Total Loans . . . . . . . . . . . . . . . . . . . . . . . . . . . . . . . . . . . 348,089 100% 277,450 100%Deferred costs and unearned premiums, net . . . . . . . . . . . . . 889 1,128Allowance for loan losses . . . . . . . . . . . . . . . . . . . . . . . . . (4,264) (3,413)
Net loans . . . . . . . . . . . . . . . . . . . . . . . . . . . . . . . . . . . $344,714 $275,165
The following tables present the activity in the allowance for loan losses by class for the years endingDecember 31, 2017, 2016 and 2015:
1 – 4 FamilyResidential Commercial Multifamily
CommercialReal Estate Construction Consumer Total
December 31, 2017Allowance for loan losses:
Beginning balance . . . . . . . . . . . . . $360 $1,934 $621 $238 $141 $119 $3,413Provision (credit) for loan losses . . . . 22 352 92 28 (14) 425 905Recoveries . . . . . . . . . . . . . . . . . . — — — — — — —Loans charged-Off . . . . . . . . . . . . — (14) — — — (40) (54)Total ending allowance balance . . . . . $382 $2,272 $713 $266 $127 $504 $4,264
December 31, 2016Allowance for loan losses:
Beginning balance . . . . . . . . . . . . . $213 $1,536 $533 $230 $134 $153 $2,799Provision (credit) for loan losses . . . . 147 372 88 8 7 (27) 595Recoveries . . . . . . . . . . . . . . . . . . — 26 — — — — 26Loans charged-Off . . . . . . . . . . . . — — — — — (7) (7)Total ending allowance balance . . . . . $360 $1,934 $621 $238 $141 $119 $3,413
December 31, 2015Allowance for loan losses:
Beginning balance . . . . . . . . . . . . . $162 $1,222 $528 $ 97 $ 27 $129 $2,165Provision (credit) for loan losses . . . . 51 610 5 133 107 24 930Recoveries . . . . . . . . . . . . . . . . . . — — — — — — —Loans charged-Off . . . . . . . . . . . . — (296) — — — — (296)Total ending allowance balance . . . . . $213 $1,536 $533 $230 $134 $153 $2,799
77
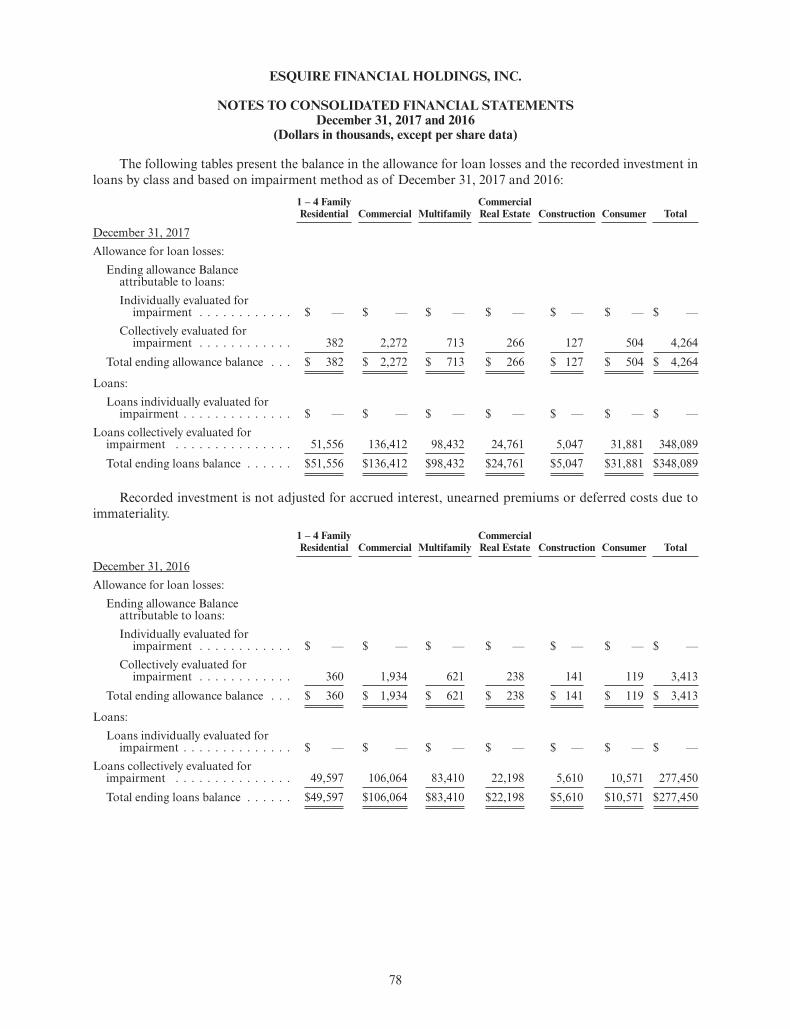
ESQUIRE FINANCIAL HOLDINGS, INC.
NOTES TO CONSOLIDATED FINANCIAL STATEMENTSDecember 31, 2017 and 2016
(Dollars in thousands, except per share data)
The following tables present the balance in the allowance for loan losses and the recorded investment inloans by class and based on impairment method as of December 31, 2017 and 2016:
1 – 4 FamilyResidential Commercial Multifamily
CommercialReal Estate Construction Consumer Total
December 31, 2017Allowance for loan losses:
Ending allowance Balanceattributable to loans:Individually evaluated for
impairment . . . . . . . . . . . . $ — $ — $ — $ — $ — $ — $ —Collectively evaluated for
impairment . . . . . . . . . . . . 382 2,272 713 266 127 504 4,264Total ending allowance balance . . . $ 382 $ 2,272 $ 713 $ 266 $ 127 $ 504 $ 4,264
Loans:Loans individually evaluated for
impairment . . . . . . . . . . . . . . $ — $ — $ — $ — $ — $ — $ —Loans collectively evaluated for
impairment . . . . . . . . . . . . . . . 51,556 136,412 98,432 24,761 5,047 31,881 348,089Total ending loans balance . . . . . . $51,556 $136,412 $98,432 $24,761 $5,047 $31,881 $348,089
Recorded investment is not adjusted for accrued interest, unearned premiums or deferred costs due toimmateriality.
1 – 4 FamilyResidential Commercial Multifamily
CommercialReal Estate Construction Consumer Total
December 31, 2016Allowance for loan losses:
Ending allowance Balanceattributable to loans:Individually evaluated for
impairment . . . . . . . . . . . . $ — $ — $ — $ — $ — $ — $ —Collectively evaluated for
impairment . . . . . . . . . . . . 360 1,934 621 238 141 119 3,413Total ending allowance balance . . . $ 360 $ 1,934 $ 621 $ 238 $ 141 $ 119 $ 3,413
Loans:Loans individually evaluated for
impairment . . . . . . . . . . . . . . $ — $ — $ — $ — $ — $ — $ —Loans collectively evaluated for
impairment . . . . . . . . . . . . . . . 49,597 106,064 83,410 22,198 5,610 10,571 277,450Total ending loans balance . . . . . . $49,597 $106,064 $83,410 $22,198 $5,610 $10,571 $277,450
78
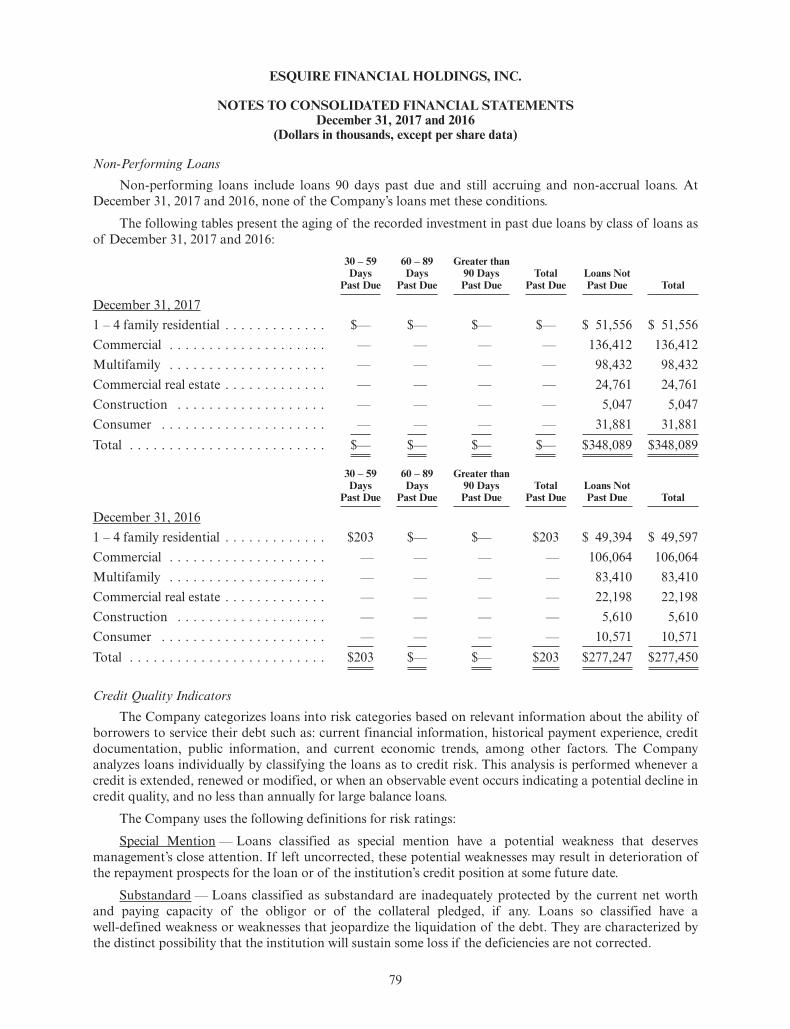
ESQUIRE FINANCIAL HOLDINGS, INC.
NOTES TO CONSOLIDATED FINANCIAL STATEMENTSDecember 31, 2017 and 2016
(Dollars in thousands, except per share data)
Non-Performing LoansNon-performing loans include loans 90 days past due and still accruing and non-accrual loans. At
December 31, 2017 and 2016, none of the Company’s loans met these conditions.
The following tables present the aging of the recorded investment in past due loans by class of loans asof December 31, 2017 and 2016:
30 – 59Days
Past Due
60 – 89Days
Past Due
Greater than90 DaysPast Due
TotalPast Due
Loans NotPast Due Total
December 31, 20171 – 4 family residential . . . . . . . . . . . . . $— $— $— $— $ 51,556 $ 51,556Commercial . . . . . . . . . . . . . . . . . . . . — — — — 136,412 136,412Multifamily . . . . . . . . . . . . . . . . . . . . — — — — 98,432 98,432Commercial real estate . . . . . . . . . . . . . — — — — 24,761 24,761Construction . . . . . . . . . . . . . . . . . . . — — — — 5,047 5,047Consumer . . . . . . . . . . . . . . . . . . . . . — — — — 31,881 31,881Total . . . . . . . . . . . . . . . . . . . . . . . . . $— $— $— $— $348,089 $348,089
30 – 59Days
Past Due
60 – 89Days
Past Due
Greater than90 DaysPast Due
TotalPast Due
Loans NotPast Due Total
December 31, 20161 – 4 family residential . . . . . . . . . . . . . $203 $— $— $203 $ 49,394 $ 49,597Commercial . . . . . . . . . . . . . . . . . . . . — — — — 106,064 106,064Multifamily . . . . . . . . . . . . . . . . . . . . — — — — 83,410 83,410Commercial real estate . . . . . . . . . . . . . — — — — 22,198 22,198Construction . . . . . . . . . . . . . . . . . . . — — — — 5,610 5,610Consumer . . . . . . . . . . . . . . . . . . . . . — — — — 10,571 10,571Total . . . . . . . . . . . . . . . . . . . . . . . . . $203 $— $— $203 $277,247 $277,450
Credit Quality IndicatorsThe Company categorizes loans into risk categories based on relevant information about the ability of
borrowers to service their debt such as: current financial information, historical payment experience, creditdocumentation, public information, and current economic trends, among other factors. The Companyanalyzes loans individually by classifying the loans as to credit risk. This analysis is performed whenever acredit is extended, renewed or modified, or when an observable event occurs indicating a potential decline incredit quality, and no less than annually for large balance loans.
The Company uses the following definitions for risk ratings:
Special Mention — Loans classified as special mention have a potential weakness that deservesmanagement’s close attention. If left uncorrected, these potential weaknesses may result in deterioration ofthe repayment prospects for the loan or of the institution’s credit position at some future date.
Substandard — Loans classified as substandard are inadequately protected by the current net worthand paying capacity of the obligor or of the collateral pledged, if any. Loans so classified have awell-defined weakness or weaknesses that jeopardize the liquidation of the debt. They are characterized bythe distinct possibility that the institution will sustain some loss if the deficiencies are not corrected.
79
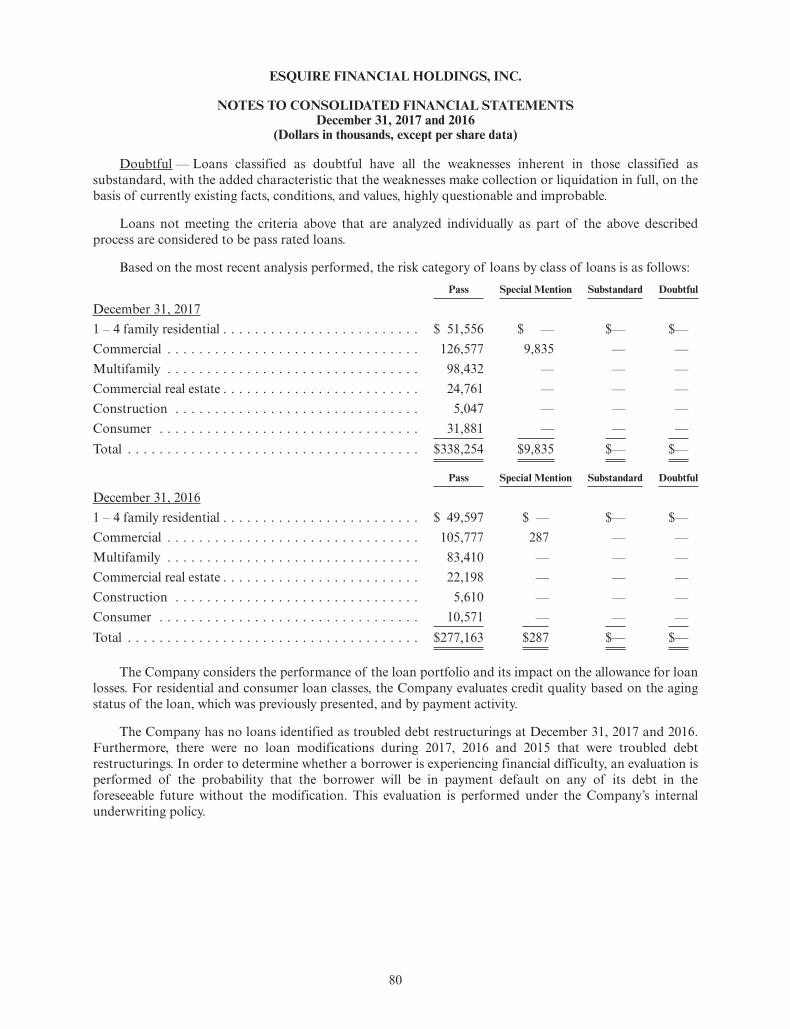
ESQUIRE FINANCIAL HOLDINGS, INC.
NOTES TO CONSOLIDATED FINANCIAL STATEMENTSDecember 31, 2017 and 2016
(Dollars in thousands, except per share data)
Doubtful — Loans classified as doubtful have all the weaknesses inherent in those classified assubstandard, with the added characteristic that the weaknesses make collection or liquidation in full, on thebasis of currently existing facts, conditions, and values, highly questionable and improbable.
Loans not meeting the criteria above that are analyzed individually as part of the above describedprocess are considered to be pass rated loans.
Based on the most recent analysis performed, the risk category of loans by class of loans is as follows:Pass Special Mention Substandard Doubtful
December 31, 20171 – 4 family residential . . . . . . . . . . . . . . . . . . . . . . . . . $ 51,556 $ — $— $—Commercial . . . . . . . . . . . . . . . . . . . . . . . . . . . . . . . . 126,577 9,835 — —Multifamily . . . . . . . . . . . . . . . . . . . . . . . . . . . . . . . . 98,432 — — —Commercial real estate . . . . . . . . . . . . . . . . . . . . . . . . . 24,761 — — —Construction . . . . . . . . . . . . . . . . . . . . . . . . . . . . . . . 5,047 — — —Consumer . . . . . . . . . . . . . . . . . . . . . . . . . . . . . . . . . 31,881 — — —Total . . . . . . . . . . . . . . . . . . . . . . . . . . . . . . . . . . . . . $338,254 $9,835 $— $—
Pass Special Mention Substandard Doubtful
December 31, 20161 – 4 family residential . . . . . . . . . . . . . . . . . . . . . . . . . $ 49,597 $ — $— $—Commercial . . . . . . . . . . . . . . . . . . . . . . . . . . . . . . . . 105,777 287 — —Multifamily . . . . . . . . . . . . . . . . . . . . . . . . . . . . . . . . 83,410 — — —Commercial real estate . . . . . . . . . . . . . . . . . . . . . . . . . 22,198 — — —Construction . . . . . . . . . . . . . . . . . . . . . . . . . . . . . . . 5,610 — — —Consumer . . . . . . . . . . . . . . . . . . . . . . . . . . . . . . . . . 10,571 — — —Total . . . . . . . . . . . . . . . . . . . . . . . . . . . . . . . . . . . . . $277,163 $287 $— $—
The Company considers the performance of the loan portfolio and its impact on the allowance for loanlosses. For residential and consumer loan classes, the Company evaluates credit quality based on the agingstatus of the loan, which was previously presented, and by payment activity.
The Company has no loans identified as troubled debt restructurings at December 31, 2017 and 2016.Furthermore, there were no loan modifications during 2017, 2016 and 2015 that were troubled debtrestructurings. In order to determine whether a borrower is experiencing financial difficulty, an evaluation isperformed of the probability that the borrower will be in payment default on any of its debt in theforeseeable future without the modification. This evaluation is performed under the Company’s internalunderwriting policy.
80
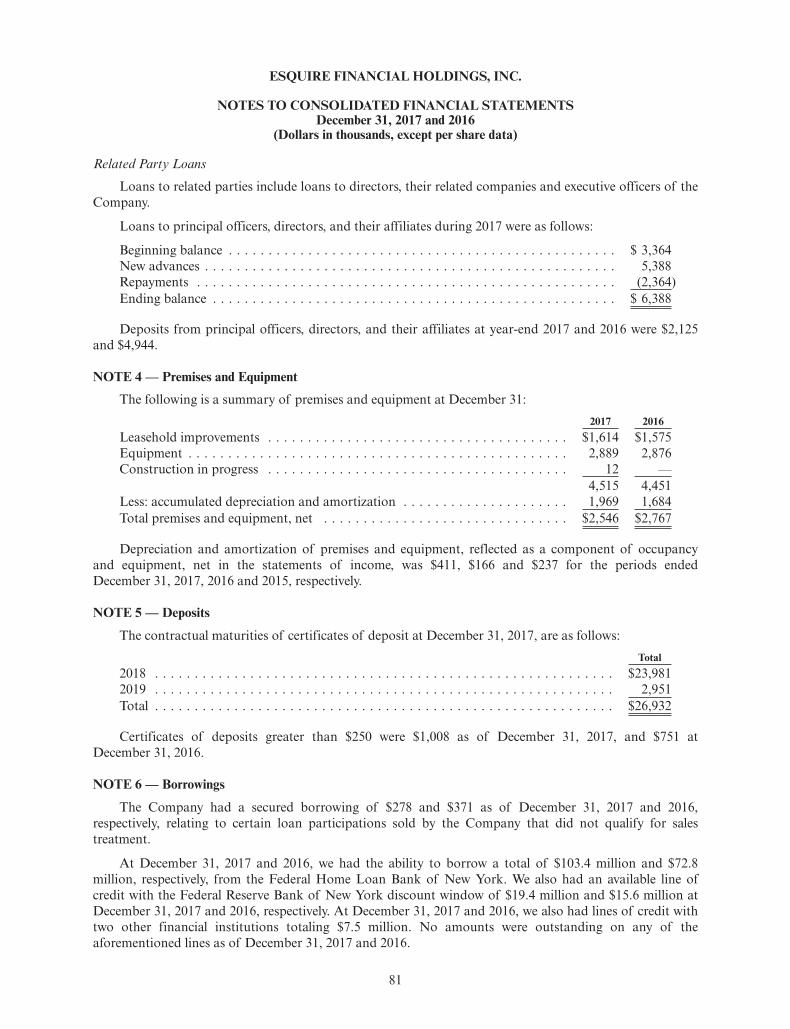
ESQUIRE FINANCIAL HOLDINGS, INC.
NOTES TO CONSOLIDATED FINANCIAL STATEMENTSDecember 31, 2017 and 2016
(Dollars in thousands, except per share data)
Related Party Loans
Loans to related parties include loans to directors, their related companies and executive officers of theCompany.
Loans to principal officers, directors, and their affiliates during 2017 were as follows:
Beginning balance . . . . . . . . . . . . . . . . . . . . . . . . . . . . . . . . . . . . . . . . . . . . . . . . . $ 3,364New advances . . . . . . . . . . . . . . . . . . . . . . . . . . . . . . . . . . . . . . . . . . . . . . . . . . . . 5,388Repayments . . . . . . . . . . . . . . . . . . . . . . . . . . . . . . . . . . . . . . . . . . . . . . . . . . . . . (2,364)Ending balance . . . . . . . . . . . . . . . . . . . . . . . . . . . . . . . . . . . . . . . . . . . . . . . . . . . $ 6,388
Deposits from principal officers, directors, and their affiliates at year-end 2017 and 2016 were $2,125and $4,944.
NOTE 4 — Premises and Equipment
The following is a summary of premises and equipment at December 31:2017 2016
Leasehold improvements . . . . . . . . . . . . . . . . . . . . . . . . . . . . . . . . . . . . . . $1,614 $1,575Equipment . . . . . . . . . . . . . . . . . . . . . . . . . . . . . . . . . . . . . . . . . . . . . . . . 2,889 2,876Construction in progress . . . . . . . . . . . . . . . . . . . . . . . . . . . . . . . . . . . . . . 12 —
4,515 4,451Less: accumulated depreciation and amortization . . . . . . . . . . . . . . . . . . . . . 1,969 1,684Total premises and equipment, net . . . . . . . . . . . . . . . . . . . . . . . . . . . . . . . $2,546 $2,767
Depreciation and amortization of premises and equipment, reflected as a component of occupancyand equipment, net in the statements of income, was $411, $166 and $237 for the periods endedDecember 31, 2017, 2016 and 2015, respectively.
NOTE 5 — Deposits
The contractual maturities of certificates of deposit at December 31, 2017, are as follows:Total
2018 . . . . . . . . . . . . . . . . . . . . . . . . . . . . . . . . . . . . . . . . . . . . . . . . . . . . . . . . . . $23,9812019 . . . . . . . . . . . . . . . . . . . . . . . . . . . . . . . . . . . . . . . . . . . . . . . . . . . . . . . . . . 2,951Total . . . . . . . . . . . . . . . . . . . . . . . . . . . . . . . . . . . . . . . . . . . . . . . . . . . . . . . . . . $26,932
Certificates of deposits greater than $250 were $1,008 as of December 31, 2017, and $751 atDecember 31, 2016.
NOTE 6 — Borrowings
The Company had a secured borrowing of $278 and $371 as of December 31, 2017 and 2016,respectively, relating to certain loan participations sold by the Company that did not qualify for salestreatment.
At December 31, 2017 and 2016, we had the ability to borrow a total of $103.4 million and $72.8million, respectively, from the Federal Home Loan Bank of New York. We also had an available line ofcredit with the Federal Reserve Bank of New York discount window of $19.4 million and $15.6 million atDecember 31, 2017 and 2016, respectively. At December 31, 2017 and 2016, we also had lines of credit withtwo other financial institutions totaling $7.5 million. No amounts were outstanding on any of theaforementioned lines as of December 31, 2017 and 2016.
81
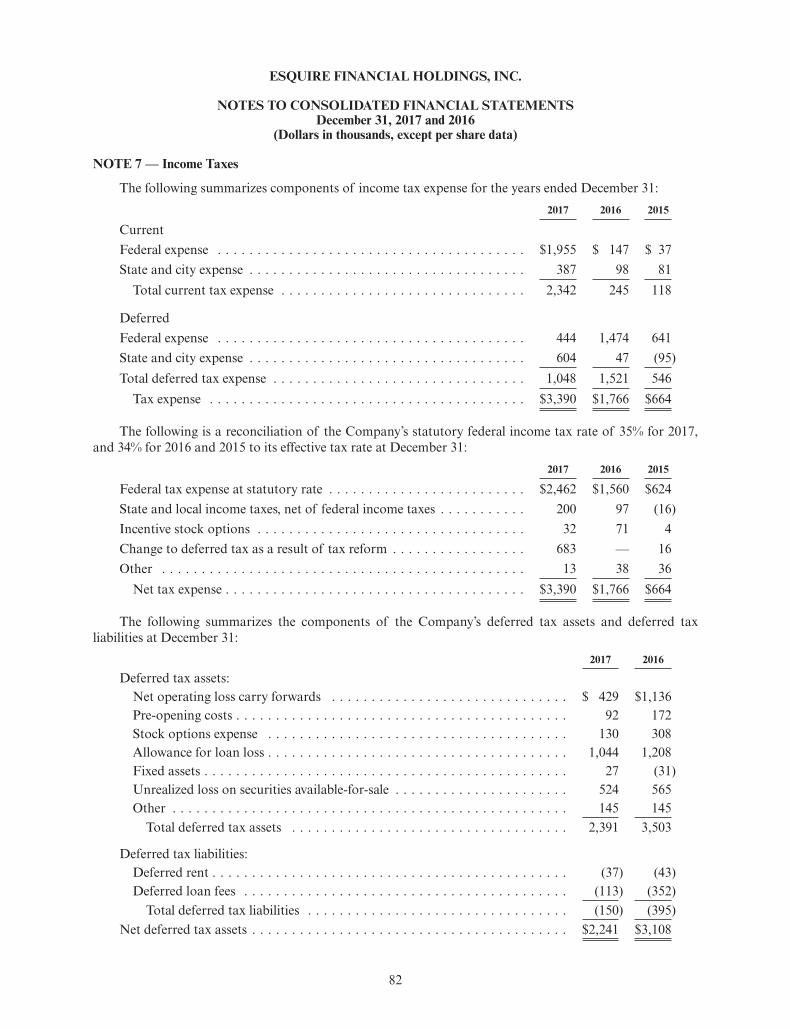
ESQUIRE FINANCIAL HOLDINGS, INC.
NOTES TO CONSOLIDATED FINANCIAL STATEMENTSDecember 31, 2017 and 2016
(Dollars in thousands, except per share data)
NOTE 7 — Income Taxes
The following summarizes components of income tax expense for the years ended December 31:2017 2016 2015
CurrentFederal expense . . . . . . . . . . . . . . . . . . . . . . . . . . . . . . . . . . . . . . . $1,955 $ 147 $ 37State and city expense . . . . . . . . . . . . . . . . . . . . . . . . . . . . . . . . . . . 387 98 81
Total current tax expense . . . . . . . . . . . . . . . . . . . . . . . . . . . . . . . 2,342 245 118
DeferredFederal expense . . . . . . . . . . . . . . . . . . . . . . . . . . . . . . . . . . . . . . . 444 1,474 641State and city expense . . . . . . . . . . . . . . . . . . . . . . . . . . . . . . . . . . . 604 47 (95)Total deferred tax expense . . . . . . . . . . . . . . . . . . . . . . . . . . . . . . . . 1,048 1,521 546
Tax expense . . . . . . . . . . . . . . . . . . . . . . . . . . . . . . . . . . . . . . . . $3,390 $1,766 $664
The following is a reconciliation of the Company’s statutory federal income tax rate of 35% for 2017,and 34% for 2016 and 2015 to its effective tax rate at December 31:
2017 2016 2015
Federal tax expense at statutory rate . . . . . . . . . . . . . . . . . . . . . . . . . $2,462 $1,560 $624State and local income taxes, net of federal income taxes . . . . . . . . . . . 200 97 (16)Incentive stock options . . . . . . . . . . . . . . . . . . . . . . . . . . . . . . . . . . 32 71 4Change to deferred tax as a result of tax reform . . . . . . . . . . . . . . . . . 683 — 16Other . . . . . . . . . . . . . . . . . . . . . . . . . . . . . . . . . . . . . . . . . . . . . . 13 38 36
Net tax expense . . . . . . . . . . . . . . . . . . . . . . . . . . . . . . . . . . . . . . $3,390 $1,766 $664
The following summarizes the components of the Company’s deferred tax assets and deferred taxliabilities at December 31:
2017 2016
Deferred tax assets:Net operating loss carry forwards . . . . . . . . . . . . . . . . . . . . . . . . . . . . . . $ 429 $1,136Pre-opening costs . . . . . . . . . . . . . . . . . . . . . . . . . . . . . . . . . . . . . . . . . . 92 172Stock options expense . . . . . . . . . . . . . . . . . . . . . . . . . . . . . . . . . . . . . . 130 308Allowance for loan loss . . . . . . . . . . . . . . . . . . . . . . . . . . . . . . . . . . . . . . 1,044 1,208Fixed assets . . . . . . . . . . . . . . . . . . . . . . . . . . . . . . . . . . . . . . . . . . . . . . 27 (31)Unrealized loss on securities available-for-sale . . . . . . . . . . . . . . . . . . . . . . 524 565Other . . . . . . . . . . . . . . . . . . . . . . . . . . . . . . . . . . . . . . . . . . . . . . . . . . 145 145
Total deferred tax assets . . . . . . . . . . . . . . . . . . . . . . . . . . . . . . . . . . . 2,391 3,503
Deferred tax liabilities:Deferred rent . . . . . . . . . . . . . . . . . . . . . . . . . . . . . . . . . . . . . . . . . . . . . (37) (43)Deferred loan fees . . . . . . . . . . . . . . . . . . . . . . . . . . . . . . . . . . . . . . . . . (113) (352)
Total deferred tax liabilities . . . . . . . . . . . . . . . . . . . . . . . . . . . . . . . . . (150) (395)Net deferred tax assets . . . . . . . . . . . . . . . . . . . . . . . . . . . . . . . . . . . . . . . . $2,241 $3,108
82
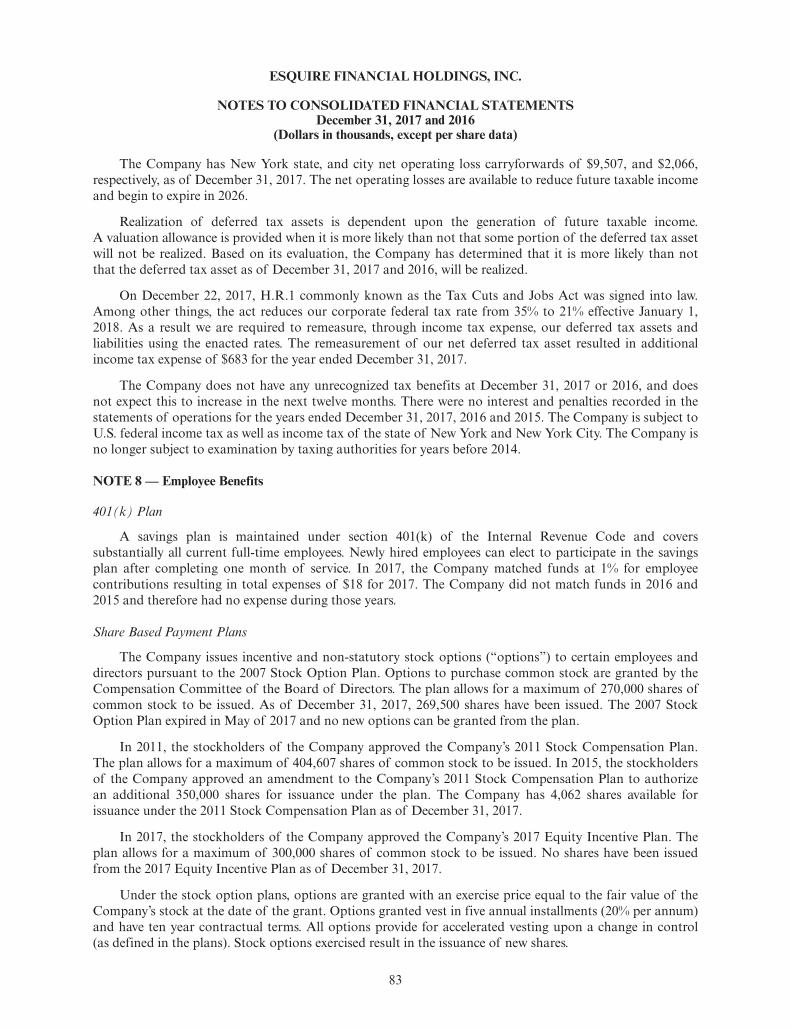
ESQUIRE FINANCIAL HOLDINGS, INC.
NOTES TO CONSOLIDATED FINANCIAL STATEMENTSDecember 31, 2017 and 2016
(Dollars in thousands, except per share data)
The Company has New York state, and city net operating loss carryforwards of $9,507, and $2,066,respectively, as of December 31, 2017. The net operating losses are available to reduce future taxable incomeand begin to expire in 2026.
Realization of deferred tax assets is dependent upon the generation of future taxable income.A valuation allowance is provided when it is more likely than not that some portion of the deferred tax assetwill not be realized. Based on its evaluation, the Company has determined that it is more likely than notthat the deferred tax asset as of December 31, 2017 and 2016, will be realized.
On December 22, 2017, H.R.1 commonly known as the Tax Cuts and Jobs Act was signed into law.Among other things, the act reduces our corporate federal tax rate from 35% to 21% effective January 1,2018. As a result we are required to remeasure, through income tax expense, our deferred tax assets andliabilities using the enacted rates. The remeasurement of our net deferred tax asset resulted in additionalincome tax expense of $683 for the year ended December 31, 2017.
The Company does not have any unrecognized tax benefits at December 31, 2017 or 2016, and doesnot expect this to increase in the next twelve months. There were no interest and penalties recorded in thestatements of operations for the years ended December 31, 2017, 2016 and 2015. The Company is subject toU.S. federal income tax as well as income tax of the state of New York and New York City. The Company isno longer subject to examination by taxing authorities for years before 2014.
NOTE 8 — Employee Benefits
401(k) Plan
A savings plan is maintained under section 401(k) of the Internal Revenue Code and coverssubstantially all current full-time employees. Newly hired employees can elect to participate in the savingsplan after completing one month of service. In 2017, the Company matched funds at 1% for employeecontributions resulting in total expenses of $18 for 2017. The Company did not match funds in 2016 and2015 and therefore had no expense during those years.
Share Based Payment Plans
The Company issues incentive and non-statutory stock options (“options”) to certain employees anddirectors pursuant to the 2007 Stock Option Plan. Options to purchase common stock are granted by theCompensation Committee of the Board of Directors. The plan allows for a maximum of 270,000 shares ofcommon stock to be issued. As of December 31, 2017, 269,500 shares have been issued. The 2007 StockOption Plan expired in May of 2017 and no new options can be granted from the plan.
In 2011, the stockholders of the Company approved the Company’s 2011 Stock Compensation Plan.The plan allows for a maximum of 404,607 shares of common stock to be issued. In 2015, the stockholdersof the Company approved an amendment to the Company’s 2011 Stock Compensation Plan to authorizean additional 350,000 shares for issuance under the plan. The Company has 4,062 shares available forissuance under the 2011 Stock Compensation Plan as of December 31, 2017.
In 2017, the stockholders of the Company approved the Company’s 2017 Equity Incentive Plan. Theplan allows for a maximum of 300,000 shares of common stock to be issued. No shares have been issuedfrom the 2017 Equity Incentive Plan as of December 31, 2017.
Under the stock option plans, options are granted with an exercise price equal to the fair value of theCompany’s stock at the date of the grant. Options granted vest in five annual installments (20% per annum)and have ten year contractual terms. All options provide for accelerated vesting upon a change in control(as defined in the plans). Stock options exercised result in the issuance of new shares.
83
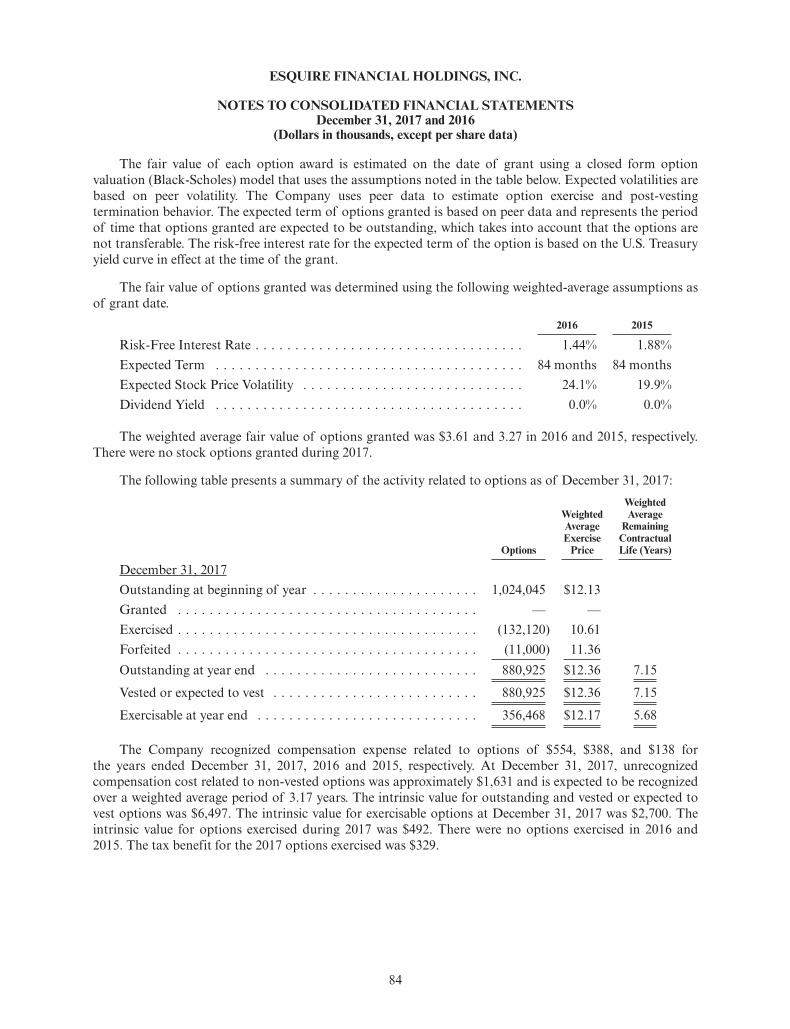
ESQUIRE FINANCIAL HOLDINGS, INC.
NOTES TO CONSOLIDATED FINANCIAL STATEMENTSDecember 31, 2017 and 2016
(Dollars in thousands, except per share data)
The fair value of each option award is estimated on the date of grant using a closed form optionvaluation (Black-Scholes) model that uses the assumptions noted in the table below. Expected volatilities arebased on peer volatility. The Company uses peer data to estimate option exercise and post-vestingtermination behavior. The expected term of options granted is based on peer data and represents the periodof time that options granted are expected to be outstanding, which takes into account that the options arenot transferable. The risk-free interest rate for the expected term of the option is based on the U.S. Treasuryyield curve in effect at the time of the grant.
The fair value of options granted was determined using the following weighted-average assumptions asof grant date.
2016 2015
Risk-Free Interest Rate . . . . . . . . . . . . . . . . . . . . . . . . . . . . . . . . . . 1.44% 1.88%Expected Term . . . . . . . . . . . . . . . . . . . . . . . . . . . . . . . . . . . . . . . 84 months 84 monthsExpected Stock Price Volatility . . . . . . . . . . . . . . . . . . . . . . . . . . . . 24.1% 19.9%Dividend Yield . . . . . . . . . . . . . . . . . . . . . . . . . . . . . . . . . . . . . . . 0.0% 0.0%
The weighted average fair value of options granted was $3.61 and 3.27 in 2016 and 2015, respectively.There were no stock options granted during 2017.
The following table presents a summary of the activity related to options as of December 31, 2017:
Options
WeightedAverageExercise
Price
WeightedAverage
RemainingContractualLife (Years)
December 31, 2017Outstanding at beginning of year . . . . . . . . . . . . . . . . . . . . . 1,024,045 $12.13Granted . . . . . . . . . . . . . . . . . . . . . . . . . . . . . . . . . . . . . . — —Exercised . . . . . . . . . . . . . . . . . . . . . . . . . . . . . . . . . . . . . . (132,120) 10.61Forfeited . . . . . . . . . . . . . . . . . . . . . . . . . . . . . . . . . . . . . . (11,000) 11.36Outstanding at year end . . . . . . . . . . . . . . . . . . . . . . . . . . . 880,925 $12.36 7.15
Vested or expected to vest . . . . . . . . . . . . . . . . . . . . . . . . . . 880,925 $12.36 7.15
Exercisable at year end . . . . . . . . . . . . . . . . . . . . . . . . . . . . 356,468 $12.17 5.68
The Company recognized compensation expense related to options of $554, $388, and $138 forthe years ended December 31, 2017, 2016 and 2015, respectively. At December 31, 2017, unrecognizedcompensation cost related to non-vested options was approximately $1,631 and is expected to be recognizedover a weighted average period of 3.17 years. The intrinsic value for outstanding and vested or expected tovest options was $6,497. The intrinsic value for exercisable options at December 31, 2017 was $2,700. Theintrinsic value for options exercised during 2017 was $492. There were no options exercised in 2016 and2015. The tax benefit for the 2017 options exercised was $329.
84
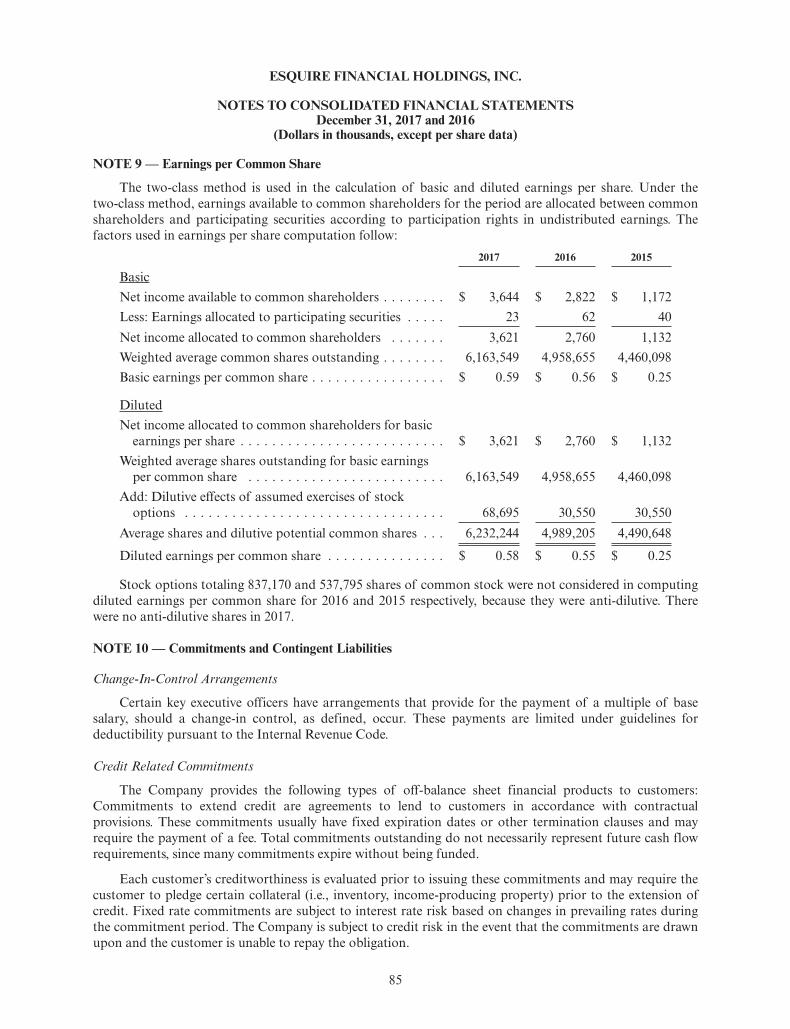
ESQUIRE FINANCIAL HOLDINGS, INC.
NOTES TO CONSOLIDATED FINANCIAL STATEMENTSDecember 31, 2017 and 2016
(Dollars in thousands, except per share data)
NOTE 9 — Earnings per Common Share
The two-class method is used in the calculation of basic and diluted earnings per share. Under thetwo-class method, earnings available to common shareholders for the period are allocated between commonshareholders and participating securities according to participation rights in undistributed earnings. Thefactors used in earnings per share computation follow:
2017 2016 2015
BasicNet income available to common shareholders . . . . . . . . $ 3,644 $ 2,822 $ 1,172Less: Earnings allocated to participating securities . . . . . 23 62 40Net income allocated to common shareholders . . . . . . . 3,621 2,760 1,132Weighted average common shares outstanding . . . . . . . . 6,163,549 4,958,655 4,460,098Basic earnings per common share . . . . . . . . . . . . . . . . . $ 0.59 $ 0.56 $ 0.25
DilutedNet income allocated to common shareholders for basic
earnings per share . . . . . . . . . . . . . . . . . . . . . . . . . . $ 3,621 $ 2,760 $ 1,132Weighted average shares outstanding for basic earnings
per common share . . . . . . . . . . . . . . . . . . . . . . . . . 6,163,549 4,958,655 4,460,098Add: Dilutive effects of assumed exercises of stock
options . . . . . . . . . . . . . . . . . . . . . . . . . . . . . . . . . 68,695 30,550 30,550Average shares and dilutive potential common shares . . . 6,232,244 4,989,205 4,490,648
Diluted earnings per common share . . . . . . . . . . . . . . . $ 0.58 $ 0.55 $ 0.25
Stock options totaling 837,170 and 537,795 shares of common stock were not considered in computingdiluted earnings per common share for 2016 and 2015 respectively, because they were anti-dilutive. Therewere no anti-dilutive shares in 2017.
NOTE 10 — Commitments and Contingent Liabilities
Change-In-Control Arrangements
Certain key executive officers have arrangements that provide for the payment of a multiple of basesalary, should a change-in control, as defined, occur. These payments are limited under guidelines fordeductibility pursuant to the Internal Revenue Code.
Credit Related Commitments
The Company provides the following types of off-balance sheet financial products to customers:Commitments to extend credit are agreements to lend to customers in accordance with contractualprovisions. These commitments usually have fixed expiration dates or other termination clauses and mayrequire the payment of a fee. Total commitments outstanding do not necessarily represent future cash flowrequirements, since many commitments expire without being funded.
Each customer’s creditworthiness is evaluated prior to issuing these commitments and may require thecustomer to pledge certain collateral (i.e., inventory, income-producing property) prior to the extension ofcredit. Fixed rate commitments are subject to interest rate risk based on changes in prevailing rates duringthe commitment period. The Company is subject to credit risk in the event that the commitments are drawnupon and the customer is unable to repay the obligation.
85
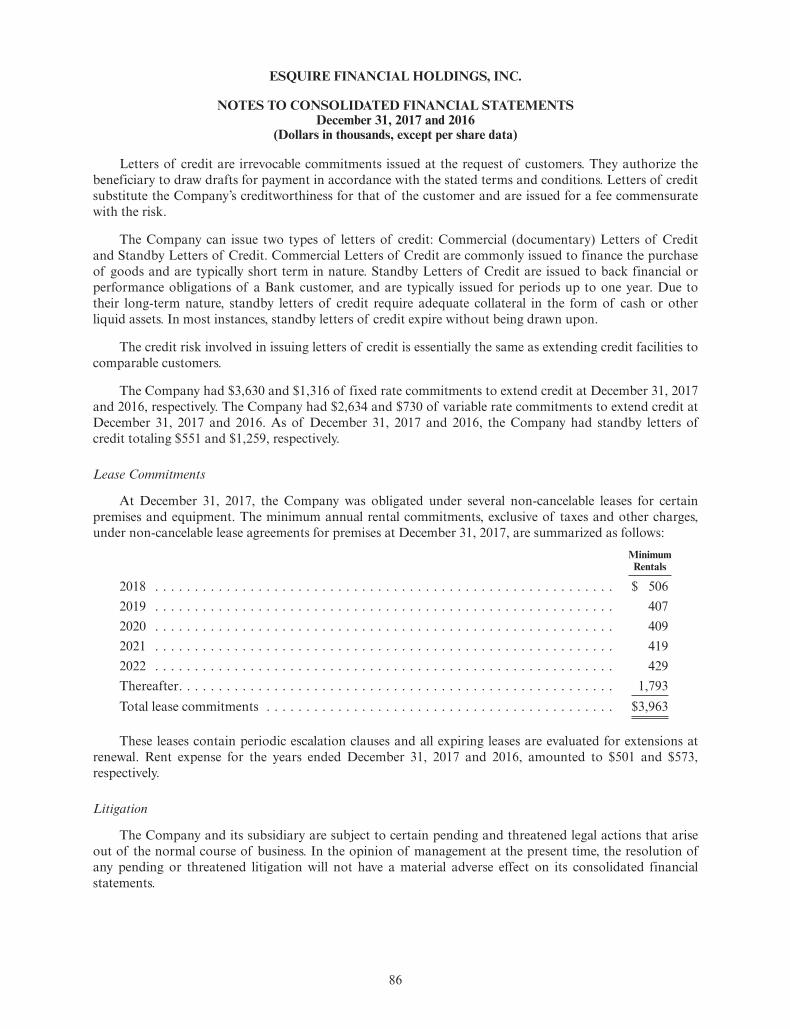
ESQUIRE FINANCIAL HOLDINGS, INC.
NOTES TO CONSOLIDATED FINANCIAL STATEMENTSDecember 31, 2017 and 2016
(Dollars in thousands, except per share data)
Letters of credit are irrevocable commitments issued at the request of customers. They authorize thebeneficiary to draw drafts for payment in accordance with the stated terms and conditions. Letters of creditsubstitute the Company’s creditworthiness for that of the customer and are issued for a fee commensuratewith the risk.
The Company can issue two types of letters of credit: Commercial (documentary) Letters of Creditand Standby Letters of Credit. Commercial Letters of Credit are commonly issued to finance the purchaseof goods and are typically short term in nature. Standby Letters of Credit are issued to back financial orperformance obligations of a Bank customer, and are typically issued for periods up to one year. Due totheir long-term nature, standby letters of credit require adequate collateral in the form of cash or otherliquid assets. In most instances, standby letters of credit expire without being drawn upon.
The credit risk involved in issuing letters of credit is essentially the same as extending credit facilities tocomparable customers.
The Company had $3,630 and $1,316 of fixed rate commitments to extend credit at December 31, 2017and 2016, respectively. The Company had $2,634 and $730 of variable rate commitments to extend credit atDecember 31, 2017 and 2016. As of December 31, 2017 and 2016, the Company had standby letters ofcredit totaling $551 and $1,259, respectively.
Lease Commitments
At December 31, 2017, the Company was obligated under several non-cancelable leases for certainpremises and equipment. The minimum annual rental commitments, exclusive of taxes and other charges,under non-cancelable lease agreements for premises at December 31, 2017, are summarized as follows:
MinimumRentals
2018 . . . . . . . . . . . . . . . . . . . . . . . . . . . . . . . . . . . . . . . . . . . . . . . . . . . . . . . . . . $ 5062019 . . . . . . . . . . . . . . . . . . . . . . . . . . . . . . . . . . . . . . . . . . . . . . . . . . . . . . . . . . 4072020 . . . . . . . . . . . . . . . . . . . . . . . . . . . . . . . . . . . . . . . . . . . . . . . . . . . . . . . . . . 4092021 . . . . . . . . . . . . . . . . . . . . . . . . . . . . . . . . . . . . . . . . . . . . . . . . . . . . . . . . . . 4192022 . . . . . . . . . . . . . . . . . . . . . . . . . . . . . . . . . . . . . . . . . . . . . . . . . . . . . . . . . . 429Thereafter. . . . . . . . . . . . . . . . . . . . . . . . . . . . . . . . . . . . . . . . . . . . . . . . . . . . . . . 1,793Total lease commitments . . . . . . . . . . . . . . . . . . . . . . . . . . . . . . . . . . . . . . . . . . . . $3,963
These leases contain periodic escalation clauses and all expiring leases are evaluated for extensions atrenewal. Rent expense for the years ended December 31, 2017 and 2016, amounted to $501 and $573,respectively.
Litigation
The Company and its subsidiary are subject to certain pending and threatened legal actions that ariseout of the normal course of business. In the opinion of management at the present time, the resolution ofany pending or threatened litigation will not have a material adverse effect on its consolidated financialstatements.
86
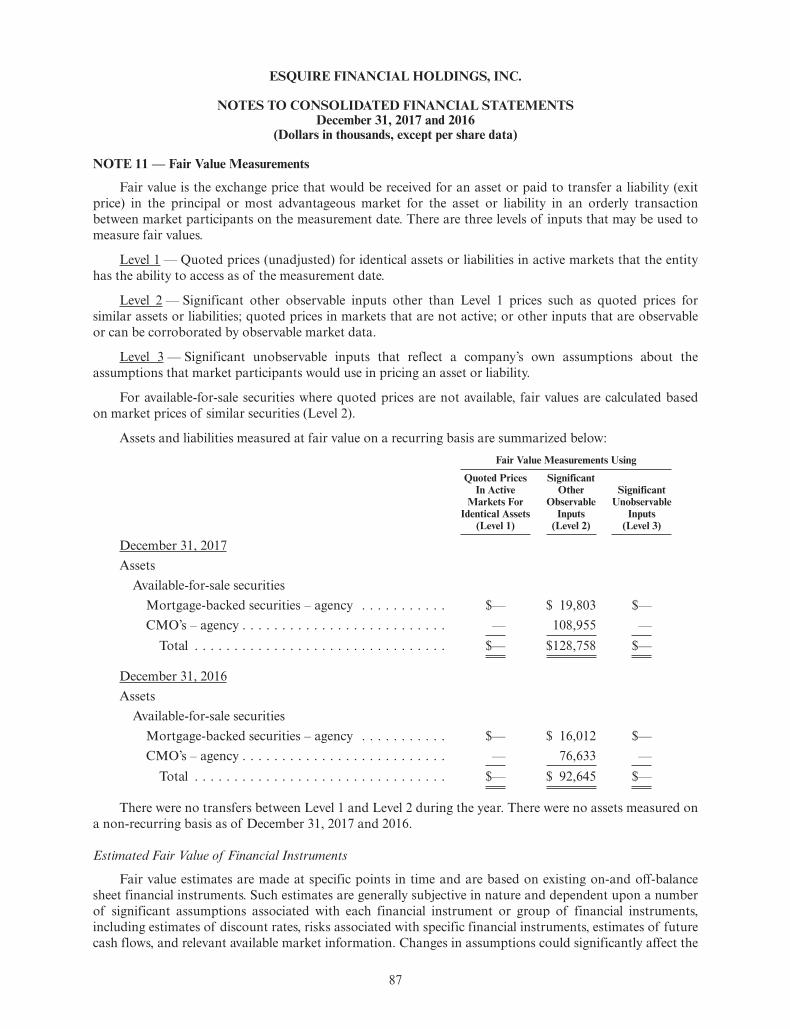
ESQUIRE FINANCIAL HOLDINGS, INC.
NOTES TO CONSOLIDATED FINANCIAL STATEMENTSDecember 31, 2017 and 2016
(Dollars in thousands, except per share data)
NOTE 11 — Fair Value Measurements
Fair value is the exchange price that would be received for an asset or paid to transfer a liability (exitprice) in the principal or most advantageous market for the asset or liability in an orderly transactionbetween market participants on the measurement date. There are three levels of inputs that may be used tomeasure fair values.
Level 1 — Quoted prices (unadjusted) for identical assets or liabilities in active markets that the entityhas the ability to access as of the measurement date.
Level 2 — Significant other observable inputs other than Level 1 prices such as quoted prices forsimilar assets or liabilities; quoted prices in markets that are not active; or other inputs that are observableor can be corroborated by observable market data.
Level 3 — Significant unobservable inputs that reflect a company’s own assumptions about theassumptions that market participants would use in pricing an asset or liability.
For available-for-sale securities where quoted prices are not available, fair values are calculated basedon market prices of similar securities (Level 2).
Assets and liabilities measured at fair value on a recurring basis are summarized below:Fair Value Measurements Using
Quoted PricesIn Active
Markets ForIdentical Assets
(Level 1)
SignificantOther
ObservableInputs
(Level 2)
SignificantUnobservable
Inputs(Level 3)
December 31, 2017Assets
Available-for-sale securitiesMortgage-backed securities – agency . . . . . . . . . . . $— $ 19,803 $—CMO’s – agency . . . . . . . . . . . . . . . . . . . . . . . . . . — 108,955 —
Total . . . . . . . . . . . . . . . . . . . . . . . . . . . . . . . . $— $128,758 $—
December 31, 2016Assets
Available-for-sale securitiesMortgage-backed securities – agency . . . . . . . . . . . $— $ 16,012 $—CMO’s – agency . . . . . . . . . . . . . . . . . . . . . . . . . . — 76,633 —
Total . . . . . . . . . . . . . . . . . . . . . . . . . . . . . . . . $— $ 92,645 $—
There were no transfers between Level 1 and Level 2 during the year. There were no assets measured ona non-recurring basis as of December 31, 2017 and 2016.
Estimated Fair Value of Financial Instruments
Fair value estimates are made at specific points in time and are based on existing on-and off-balancesheet financial instruments. Such estimates are generally subjective in nature and dependent upon a numberof significant assumptions associated with each financial instrument or group of financial instruments,including estimates of discount rates, risks associated with specific financial instruments, estimates of futurecash flows, and relevant available market information. Changes in assumptions could significantly affect the
87
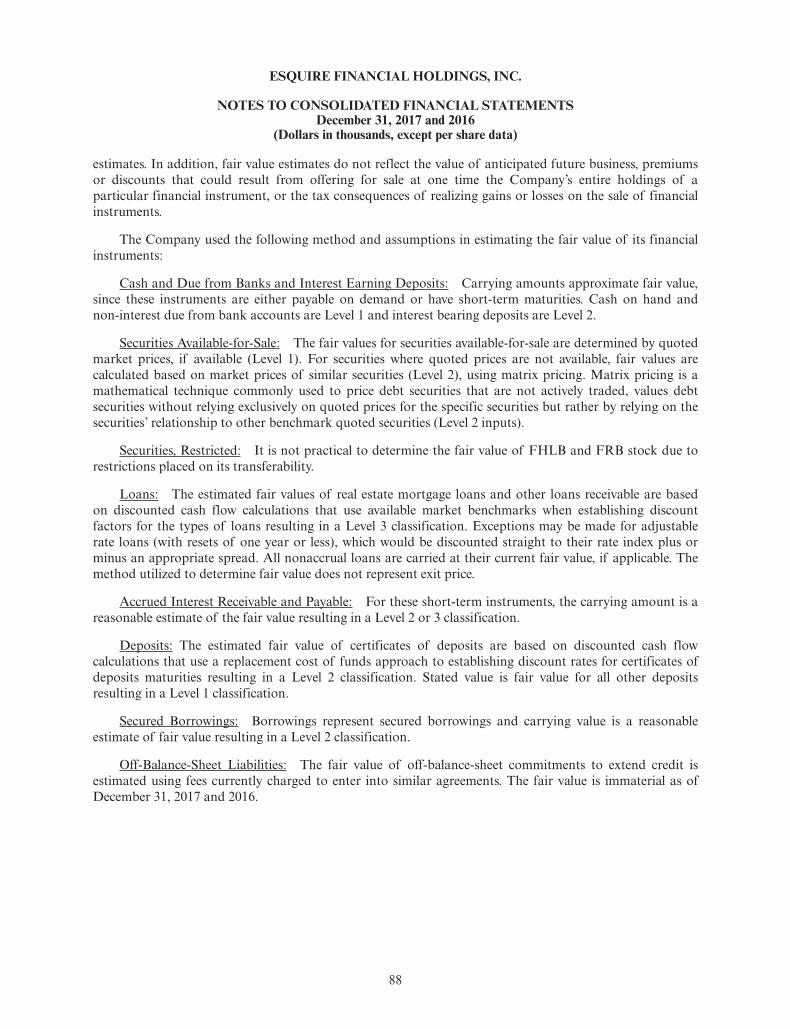
ESQUIRE FINANCIAL HOLDINGS, INC.
NOTES TO CONSOLIDATED FINANCIAL STATEMENTSDecember 31, 2017 and 2016
(Dollars in thousands, except per share data)
estimates. In addition, fair value estimates do not reflect the value of anticipated future business, premiumsor discounts that could result from offering for sale at one time the Company’s entire holdings of aparticular financial instrument, or the tax consequences of realizing gains or losses on the sale of financialinstruments.
The Company used the following method and assumptions in estimating the fair value of its financialinstruments:
Cash and Due from Banks and Interest Earning Deposits: Carrying amounts approximate fair value,since these instruments are either payable on demand or have short-term maturities. Cash on hand andnon-interest due from bank accounts are Level 1 and interest bearing deposits are Level 2.
Securities Available-for-Sale: The fair values for securities available-for-sale are determined by quotedmarket prices, if available (Level 1). For securities where quoted prices are not available, fair values arecalculated based on market prices of similar securities (Level 2), using matrix pricing. Matrix pricing is amathematical technique commonly used to price debt securities that are not actively traded, values debtsecurities without relying exclusively on quoted prices for the specific securities but rather by relying on thesecurities’ relationship to other benchmark quoted securities (Level 2 inputs).
Securities, Restricted: It is not practical to determine the fair value of FHLB and FRB stock due torestrictions placed on its transferability.
Loans: The estimated fair values of real estate mortgage loans and other loans receivable are basedon discounted cash flow calculations that use available market benchmarks when establishing discountfactors for the types of loans resulting in a Level 3 classification. Exceptions may be made for adjustablerate loans (with resets of one year or less), which would be discounted straight to their rate index plus orminus an appropriate spread. All nonaccrual loans are carried at their current fair value, if applicable. Themethod utilized to determine fair value does not represent exit price.
Accrued Interest Receivable and Payable: For these short-term instruments, the carrying amount is areasonable estimate of the fair value resulting in a Level 2 or 3 classification.
Deposits: The estimated fair value of certificates of deposits are based on discounted cash flowcalculations that use a replacement cost of funds approach to establishing discount rates for certificates ofdeposits maturities resulting in a Level 2 classification. Stated value is fair value for all other depositsresulting in a Level 1 classification.
Secured Borrowings: Borrowings represent secured borrowings and carrying value is a reasonableestimate of fair value resulting in a Level 2 classification.
Off-Balance-Sheet Liabilities: The fair value of off-balance-sheet commitments to extend credit isestimated using fees currently charged to enter into similar agreements. The fair value is immaterial as ofDecember 31, 2017 and 2016.
88
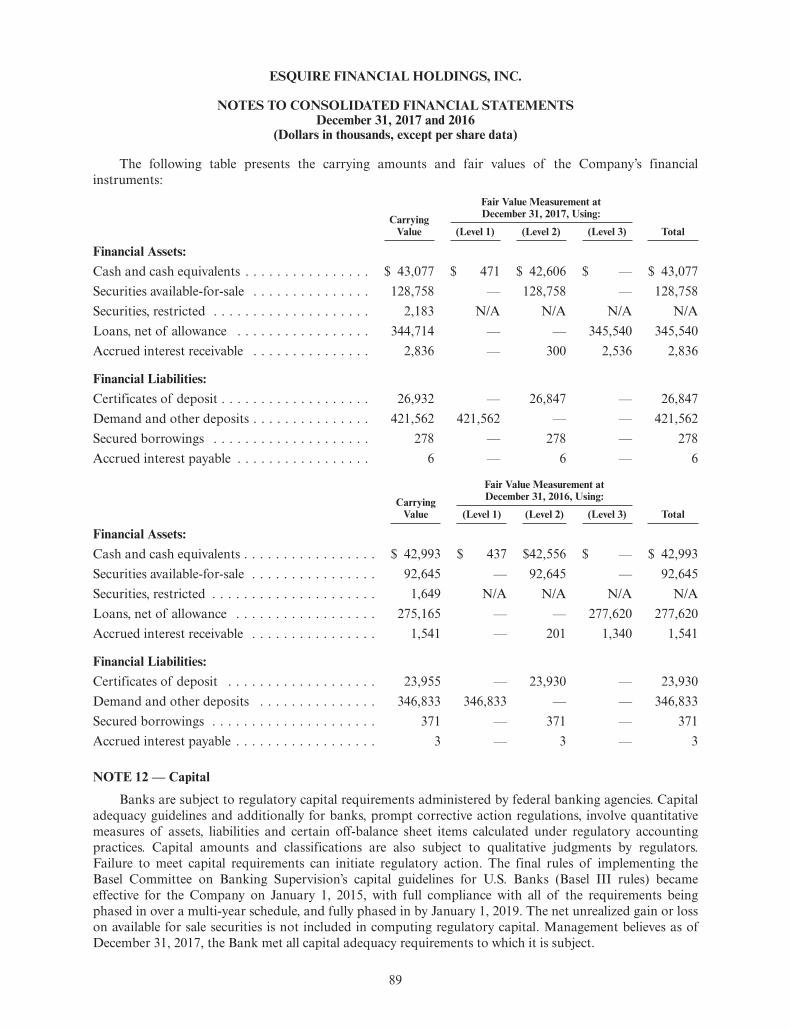
ESQUIRE FINANCIAL HOLDINGS, INC.
NOTES TO CONSOLIDATED FINANCIAL STATEMENTSDecember 31, 2017 and 2016
(Dollars in thousands, except per share data)
The following table presents the carrying amounts and fair values of the Company’s financialinstruments:
CarryingValue
Fair Value Measurement atDecember 31, 2017, Using:
Total(Level 1) (Level 2) (Level 3)
Financial Assets:Cash and cash equivalents . . . . . . . . . . . . . . . . $ 43,077 $ 471 $ 42,606 $ — $ 43,077Securities available-for-sale . . . . . . . . . . . . . . . 128,758 — 128,758 — 128,758Securities, restricted . . . . . . . . . . . . . . . . . . . . 2,183 N/A N/A N/A N/ALoans, net of allowance . . . . . . . . . . . . . . . . . 344,714 — — 345,540 345,540Accrued interest receivable . . . . . . . . . . . . . . . 2,836 — 300 2,536 2,836
Financial Liabilities:Certificates of deposit . . . . . . . . . . . . . . . . . . . 26,932 — 26,847 — 26,847Demand and other deposits . . . . . . . . . . . . . . . 421,562 421,562 — — 421,562Secured borrowings . . . . . . . . . . . . . . . . . . . . 278 — 278 — 278Accrued interest payable . . . . . . . . . . . . . . . . . 6 — 6 — 6
CarryingValue
Fair Value Measurement atDecember 31, 2016, Using:
Total(Level 1) (Level 2) (Level 3)
Financial Assets:Cash and cash equivalents . . . . . . . . . . . . . . . . . $ 42,993 $ 437 $42,556 $ — $ 42,993Securities available-for-sale . . . . . . . . . . . . . . . . 92,645 — 92,645 — 92,645Securities, restricted . . . . . . . . . . . . . . . . . . . . . 1,649 N/A N/A N/A N/ALoans, net of allowance . . . . . . . . . . . . . . . . . . 275,165 — — 277,620 277,620Accrued interest receivable . . . . . . . . . . . . . . . . 1,541 — 201 1,340 1,541
Financial Liabilities:Certificates of deposit . . . . . . . . . . . . . . . . . . . 23,955 — 23,930 — 23,930Demand and other deposits . . . . . . . . . . . . . . . 346,833 346,833 — — 346,833Secured borrowings . . . . . . . . . . . . . . . . . . . . . 371 — 371 — 371Accrued interest payable . . . . . . . . . . . . . . . . . . 3 — 3 — 3
NOTE 12 — Capital
Banks are subject to regulatory capital requirements administered by federal banking agencies. Capitaladequacy guidelines and additionally for banks, prompt corrective action regulations, involve quantitativemeasures of assets, liabilities and certain off-balance sheet items calculated under regulatory accountingpractices. Capital amounts and classifications are also subject to qualitative judgments by regulators.Failure to meet capital requirements can initiate regulatory action. The final rules of implementing theBasel Committee on Banking Supervision’s capital guidelines for U.S. Banks (Basel III rules) becameeffective for the Company on January 1, 2015, with full compliance with all of the requirements beingphased in over a multi-year schedule, and fully phased in by January 1, 2019. The net unrealized gain or losson available for sale securities is not included in computing regulatory capital. Management believes as ofDecember 31, 2017, the Bank met all capital adequacy requirements to which it is subject.
89
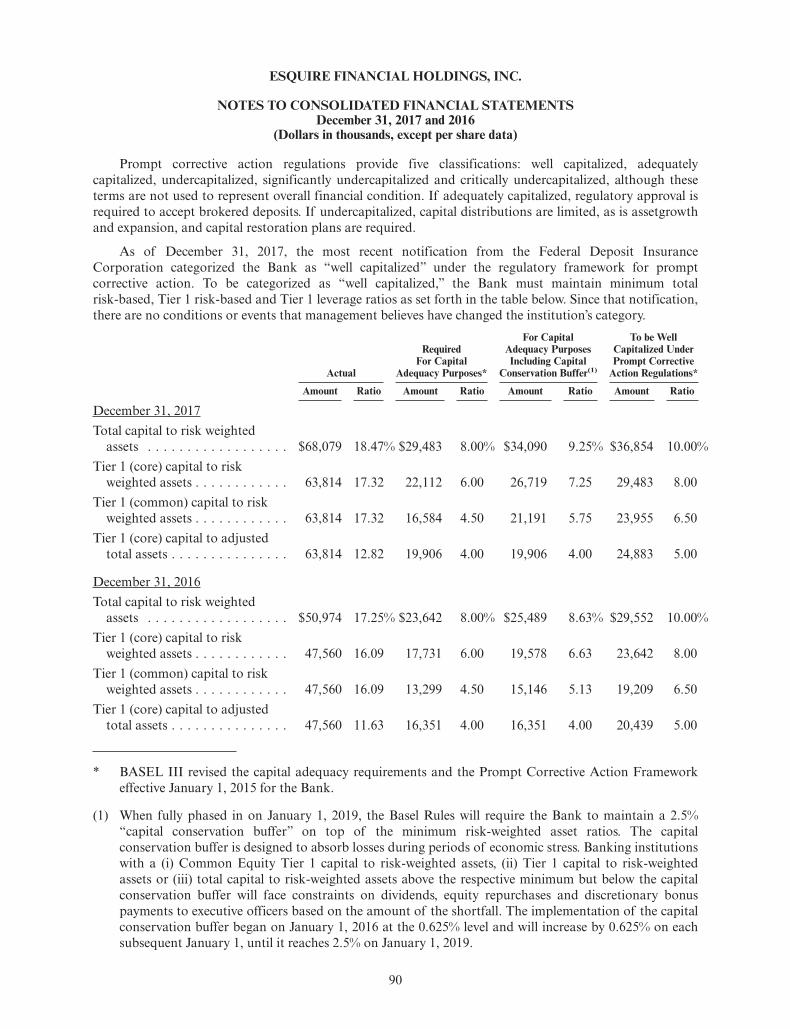
ESQUIRE FINANCIAL HOLDINGS, INC.
NOTES TO CONSOLIDATED FINANCIAL STATEMENTSDecember 31, 2017 and 2016
(Dollars in thousands, except per share data)
Prompt corrective action regulations provide five classifications: well capitalized, adequatelycapitalized, undercapitalized, significantly undercapitalized and critically undercapitalized, although theseterms are not used to represent overall financial condition. If adequately capitalized, regulatory approval isrequired to accept brokered deposits. If undercapitalized, capital distributions are limited, as is assetgrowthand expansion, and capital restoration plans are required.
As of December 31, 2017, the most recent notification from the Federal Deposit InsuranceCorporation categorized the Bank as “well capitalized” under the regulatory framework for promptcorrective action. To be categorized as “well capitalized,” the Bank must maintain minimum totalrisk-based, Tier 1 risk-based and Tier 1 leverage ratios as set forth in the table below. Since that notification,there are no conditions or events that management believes have changed the institution’s category.
Actual
RequiredFor Capital
Adequacy Purposes*
For CapitalAdequacy PurposesIncluding Capital
Conservation Buffer(1)
To be WellCapitalized UnderPrompt Corrective
Action Regulations*
Amount Ratio Amount Ratio Amount Ratio Amount Ratio
December 31, 2017Total capital to risk weighted
assets . . . . . . . . . . . . . . . . . . $68,079 18.47% $29,483 8.00% $34,090 9.25% $36,854 10.00%Tier 1 (core) capital to risk
weighted assets . . . . . . . . . . . . 63,814 17.32 22,112 6.00 26,719 7.25 29,483 8.00Tier 1 (common) capital to risk
weighted assets . . . . . . . . . . . . 63,814 17.32 16,584 4.50 21,191 5.75 23,955 6.50Tier 1 (core) capital to adjusted
total assets . . . . . . . . . . . . . . . 63,814 12.82 19,906 4.00 19,906 4.00 24,883 5.00
December 31, 2016Total capital to risk weighted
assets . . . . . . . . . . . . . . . . . . $50,974 17.25% $23,642 8.00% $25,489 8.63% $29,552 10.00%Tier 1 (core) capital to risk
weighted assets . . . . . . . . . . . . 47,560 16.09 17,731 6.00 19,578 6.63 23,642 8.00Tier 1 (common) capital to risk
weighted assets . . . . . . . . . . . . 47,560 16.09 13,299 4.50 15,146 5.13 19,209 6.50Tier 1 (core) capital to adjusted
total assets . . . . . . . . . . . . . . . 47,560 11.63 16,351 4.00 16,351 4.00 20,439 5.00
* BASEL III revised the capital adequacy requirements and the Prompt Corrective Action Frameworkeffective January 1, 2015 for the Bank.
(1) When fully phased in on January 1, 2019, the Basel Rules will require the Bank to maintain a 2.5%“capital conservation buffer” on top of the minimum risk-weighted asset ratios. The capitalconservation buffer is designed to absorb losses during periods of economic stress. Banking institutionswith a (i) Common Equity Tier 1 capital to risk-weighted assets, (ii) Tier 1 capital to risk-weightedassets or (iii) total capital to risk-weighted assets above the respective minimum but below the capitalconservation buffer will face constraints on dividends, equity repurchases and discretionary bonuspayments to executive officers based on the amount of the shortfall. The implementation of the capitalconservation buffer began on January 1, 2016 at the 0.625% level and will increase by 0.625% on eachsubsequent January 1, until it reaches 2.5% on January 1, 2019.
90
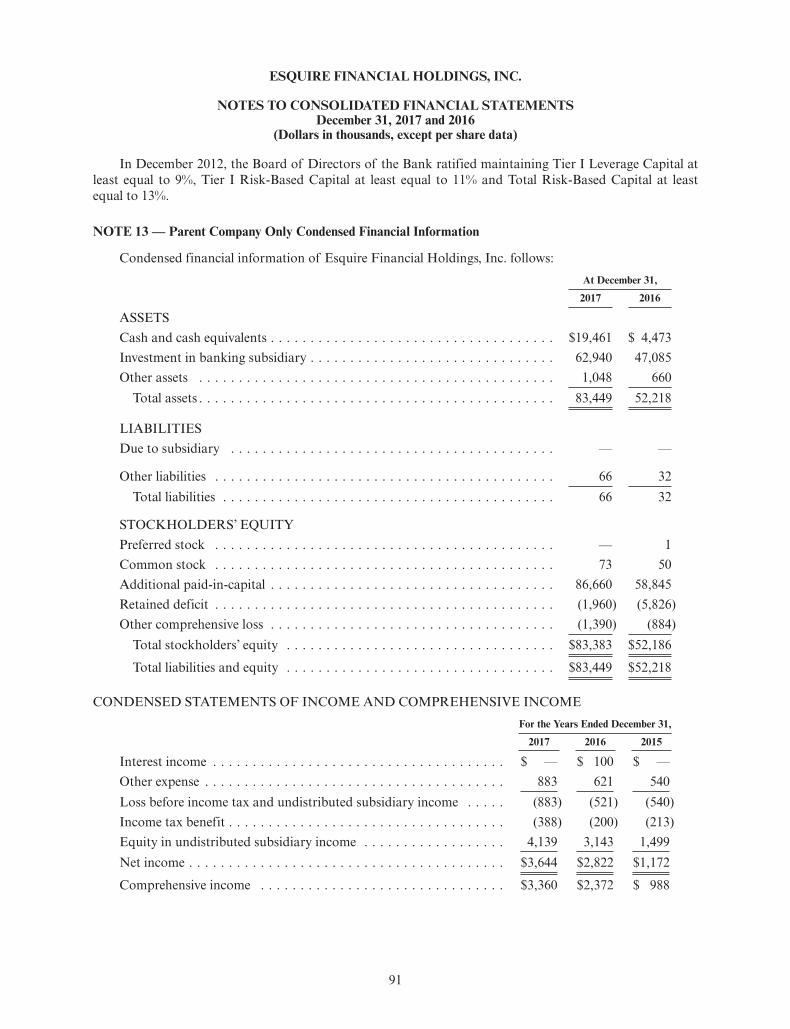
ESQUIRE FINANCIAL HOLDINGS, INC.
NOTES TO CONSOLIDATED FINANCIAL STATEMENTSDecember 31, 2017 and 2016
(Dollars in thousands, except per share data)
In December 2012, the Board of Directors of the Bank ratified maintaining Tier I Leverage Capital atleast equal to 9%, Tier I Risk-Based Capital at least equal to 11% and Total Risk-Based Capital at leastequal to 13%.
NOTE 13 — Parent Company Only Condensed Financial Information
Condensed financial information of Esquire Financial Holdings, Inc. follows:At December 31,
2017 2016
ASSETSCash and cash equivalents . . . . . . . . . . . . . . . . . . . . . . . . . . . . . . . . . . . . $19,461 $ 4,473Investment in banking subsidiary . . . . . . . . . . . . . . . . . . . . . . . . . . . . . . . 62,940 47,085Other assets . . . . . . . . . . . . . . . . . . . . . . . . . . . . . . . . . . . . . . . . . . . . . 1,048 660
Total assets . . . . . . . . . . . . . . . . . . . . . . . . . . . . . . . . . . . . . . . . . . . . . 83,449 52,218
LIABILITIESDue to subsidiary . . . . . . . . . . . . . . . . . . . . . . . . . . . . . . . . . . . . . . . . . — —
Other liabilities . . . . . . . . . . . . . . . . . . . . . . . . . . . . . . . . . . . . . . . . . . . 66 32Total liabilities . . . . . . . . . . . . . . . . . . . . . . . . . . . . . . . . . . . . . . . . . . 66 32
STOCKHOLDERS’ EQUITYPreferred stock . . . . . . . . . . . . . . . . . . . . . . . . . . . . . . . . . . . . . . . . . . . — 1Common stock . . . . . . . . . . . . . . . . . . . . . . . . . . . . . . . . . . . . . . . . . . . 73 50Additional paid-in-capital . . . . . . . . . . . . . . . . . . . . . . . . . . . . . . . . . . . . 86,660 58,845Retained deficit . . . . . . . . . . . . . . . . . . . . . . . . . . . . . . . . . . . . . . . . . . . (1,960) (5,826)Other comprehensive loss . . . . . . . . . . . . . . . . . . . . . . . . . . . . . . . . . . . . (1,390) (884)
Total stockholders’ equity . . . . . . . . . . . . . . . . . . . . . . . . . . . . . . . . . . $83,383 $52,186
Total liabilities and equity . . . . . . . . . . . . . . . . . . . . . . . . . . . . . . . . . . $83,449 $52,218
CONDENSED STATEMENTS OF INCOME AND COMPREHENSIVE INCOMEFor the Years Ended December 31,
2017 2016 2015
Interest income . . . . . . . . . . . . . . . . . . . . . . . . . . . . . . . . . . . . . $ — $ 100 $ —Other expense . . . . . . . . . . . . . . . . . . . . . . . . . . . . . . . . . . . . . . 883 621 540Loss before income tax and undistributed subsidiary income . . . . . (883) (521) (540)Income tax benefit . . . . . . . . . . . . . . . . . . . . . . . . . . . . . . . . . . . (388) (200) (213)Equity in undistributed subsidiary income . . . . . . . . . . . . . . . . . . 4,139 3,143 1,499Net income . . . . . . . . . . . . . . . . . . . . . . . . . . . . . . . . . . . . . . . . $3,644 $2,822 $1,172
Comprehensive income . . . . . . . . . . . . . . . . . . . . . . . . . . . . . . . $3,360 $2,372 $ 988
91
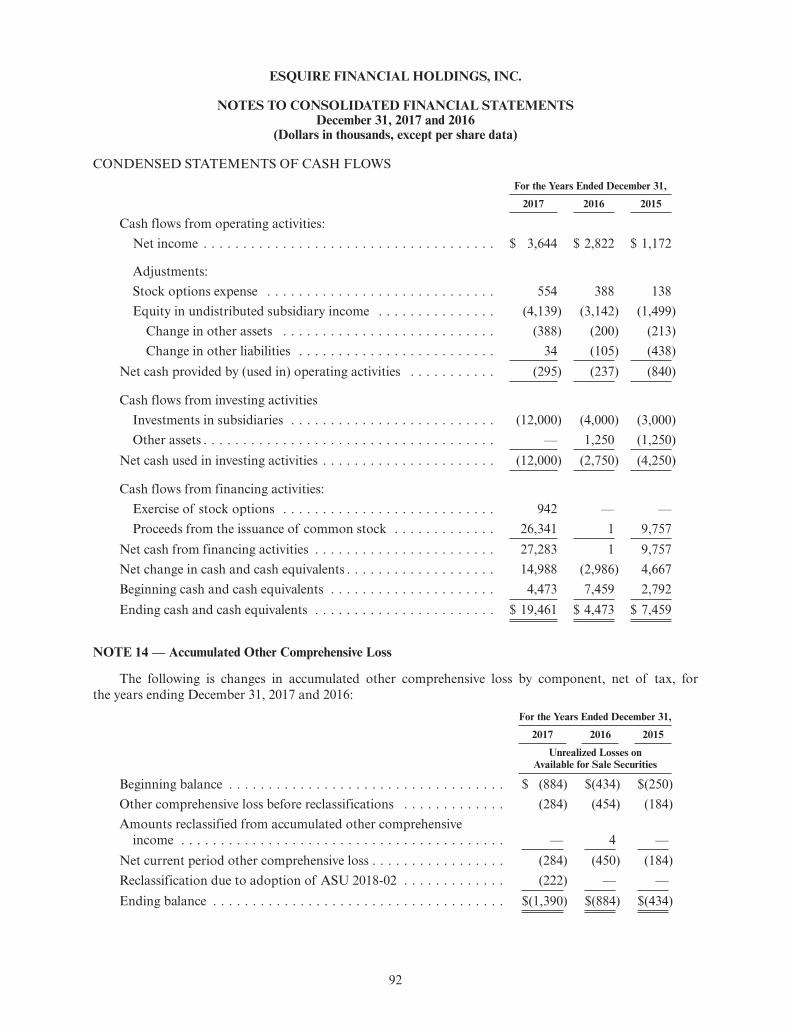
ESQUIRE FINANCIAL HOLDINGS, INC.
NOTES TO CONSOLIDATED FINANCIAL STATEMENTSDecember 31, 2017 and 2016
(Dollars in thousands, except per share data)
CONDENSED STATEMENTS OF CASH FLOWSFor the Years Ended December 31,
2017 2016 2015
Cash flows from operating activities:Net income . . . . . . . . . . . . . . . . . . . . . . . . . . . . . . . . . . . . . $ 3,644 $ 2,822 $ 1,172
Adjustments:Stock options expense . . . . . . . . . . . . . . . . . . . . . . . . . . . . . 554 388 138Equity in undistributed subsidiary income . . . . . . . . . . . . . . . (4,139) (3,142) (1,499)
Change in other assets . . . . . . . . . . . . . . . . . . . . . . . . . . . (388) (200) (213)Change in other liabilities . . . . . . . . . . . . . . . . . . . . . . . . . 34 (105) (438)
Net cash provided by (used in) operating activities . . . . . . . . . . . (295) (237) (840)
Cash flows from investing activitiesInvestments in subsidiaries . . . . . . . . . . . . . . . . . . . . . . . . . . (12,000) (4,000) (3,000)Other assets . . . . . . . . . . . . . . . . . . . . . . . . . . . . . . . . . . . . . — 1,250 (1,250)
Net cash used in investing activities . . . . . . . . . . . . . . . . . . . . . . (12,000) (2,750) (4,250)
Cash flows from financing activities:Exercise of stock options . . . . . . . . . . . . . . . . . . . . . . . . . . . 942 — —Proceeds from the issuance of common stock . . . . . . . . . . . . . 26,341 1 9,757
Net cash from financing activities . . . . . . . . . . . . . . . . . . . . . . . 27,283 1 9,757Net change in cash and cash equivalents . . . . . . . . . . . . . . . . . . . 14,988 (2,986) 4,667Beginning cash and cash equivalents . . . . . . . . . . . . . . . . . . . . . 4,473 7,459 2,792Ending cash and cash equivalents . . . . . . . . . . . . . . . . . . . . . . . $ 19,461 $ 4,473 $ 7,459
NOTE 14 — Accumulated Other Comprehensive Loss
The following is changes in accumulated other comprehensive loss by component, net of tax, forthe years ending December 31, 2017 and 2016:
For the Years Ended December 31,
2017 2016 2015
Unrealized Losses onAvailable for Sale Securities
Beginning balance . . . . . . . . . . . . . . . . . . . . . . . . . . . . . . . . . . . $ (884) $(434) $(250)Other comprehensive loss before reclassifications . . . . . . . . . . . . . (284) (454) (184)Amounts reclassified from accumulated other comprehensive
income . . . . . . . . . . . . . . . . . . . . . . . . . . . . . . . . . . . . . . . . . — 4 —Net current period other comprehensive loss . . . . . . . . . . . . . . . . . (284) (450) (184)Reclassification due to adoption of ASU 2018-02 . . . . . . . . . . . . . (222) — —Ending balance . . . . . . . . . . . . . . . . . . . . . . . . . . . . . . . . . . . . . $(1,390) $(884) $(434)
92
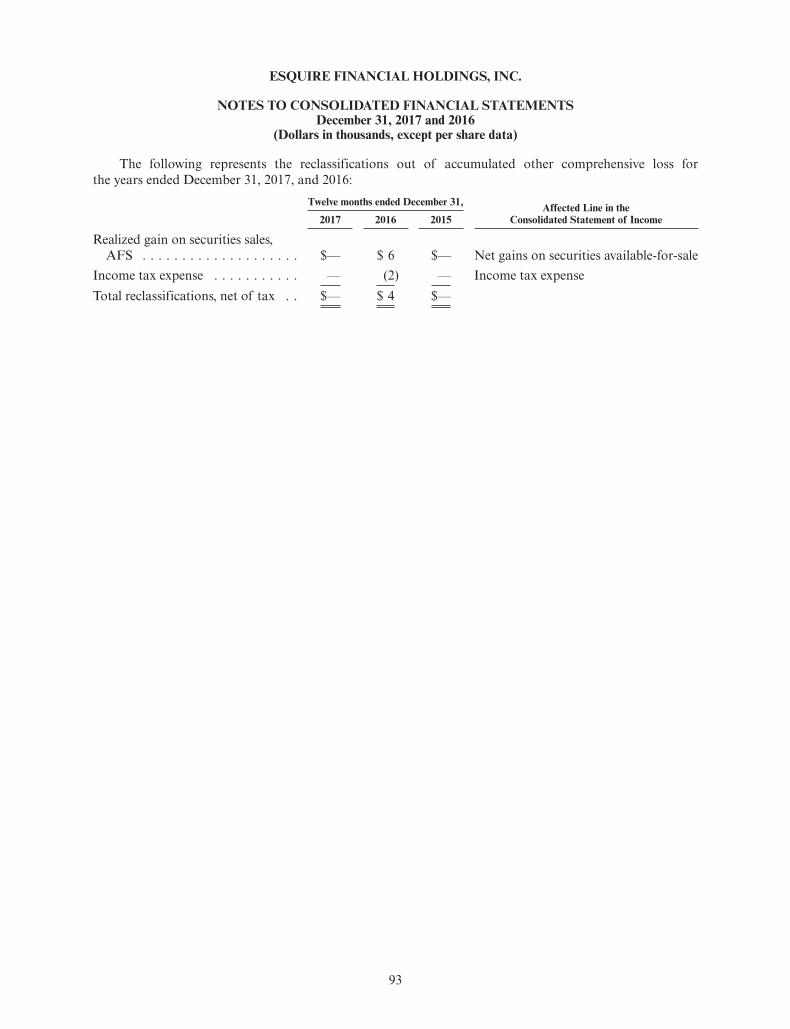
ESQUIRE FINANCIAL HOLDINGS, INC.
NOTES TO CONSOLIDATED FINANCIAL STATEMENTSDecember 31, 2017 and 2016
(Dollars in thousands, except per share data)
The following represents the reclassifications out of accumulated other comprehensive loss forthe years ended December 31, 2017, and 2016:
Twelve months ended December 31, Affected Line in theConsolidated Statement of Income2017 2016 2015
Realized gain on securities sales,AFS . . . . . . . . . . . . . . . . . . . . $— $ 6 $— Net gains on securities available-for-sale
Income tax expense . . . . . . . . . . . — (2) — Income tax expenseTotal reclassifications, net of tax . . $— $ 4 $—
93
ITEM 9. Changes In and Disagreements With Accountants on Accounting and Financial Disclosure
None.
ITEM 9A. Controls and Procedures
Under the supervision and with the participation of our management, including our principalexecutive officer and principal financial officer, we evaluated the effectiveness of the design and operation ofour disclosure controls and procedures (as defined in Rule 13a-15(e) and 15d-15(e) under the ExchangeAct) as of the end of the period covered by this report. Based upon that evaluation, the principal executiveofficer and principal financial officer concluded that, as of the end of the period covered by this report, ourdisclosure controls and procedures were effective.
There were no changes made in our internal controls during the quarter ended December 31, 2017 thathave materially affected, or are reasonably likely to materially affect, the Company’s internal control overfinancial reporting.
This Annual Report does not include a report of management’s assessment regarding internal controlover financial reporting due to a transition period established by rules of the Securities and ExchangeCommission for newly public companies.
ITEM 9B. Other Information
None.
PART III
ITEM 10. Directors, Executive Officers and Corporate Governance
Esquire Financial has adopted a Code of Ethics that applies to its principal executive officer, principalfinancial officer and principal accounting officer or controller or persons performing similar functions. Acopy of the Code is available on Esquire Financial’s website at www.esquirebank.com under “InvestorRelations — Governance Documents.”
The information contained under the section captioned “Proposal I — Election of Directors” in theCompany’s definitive Proxy Statement for the 2018 Annual Meeting of Stockholders (the “ProxyStatement”) is incorporated herein by reference.
ITEM 11. Executive Compensation
The information required by this item is incorporated herein by reference to the section captioned“Proposal I — Election of Directors — Executive Officer Compensation” of the Proxy Statement.
ITEM 12. Security Ownership of Certain Beneficial Owners and Management and Related StockholderMatters
The information required by this item is incorporated herein by reference to the section captioned“Voting Securities and Principal Holders” of the Proxy Statement.
ITEM 13. Certain Relationships and Related Transactions, and Director Independence
The information required by this item is incorporated herein by reference to the sections captioned“Proposal I — Election of Directors — Transactions with Certain Related Persons,” “— BoardIndependence” and “— Meetings and Committees of the Board of Directors” of the Proxy Statement.
ITEM 14. Principal Accountant Fees and Services
The information required by this item is incorporated herein by reference to the section captioned“Proposal II — Ratification of Appointment of Independent Registered Public Accounting Firm” of theProxy Statement.
94
PART IV
ITEM 15. Exhibits and Financial Statement Schedules
3.1 Articles of Incorporation of Esquire Financial Holdings, Inc. (incorporated by reference toExhibit 3.1 in the Registration Statement on Form S-1 (File No. 333-218372) originally filed bythe Company under the Securities Act of 1933 with the Commission on May 31, 2017, and allamendments or reports filed thereto)
3.2 Articles Supplementary of Series B Non-Voting Preferred Stock of Esquire Financial Holdings,Inc. (incorporated by reference to Exhibit 3.2 in the Registration Statement on Form S-1 (FileNo. 333-218372) originally filed by the Company under the Securities Act of 1933 with theCommission on May 31, 2017, and all amendments or reports filed thereto)
3.3 Bylaws of Esquire Financial Holdings, Inc. (incorporated by reference to Exhibit 3.3 in theRegistration Statement on Form S-1/A (File No. 333-218372) originally filed by the Companyunder the Securities Act of 1933 with the Commission on June 22, 2017, and all amendments orreports filed thereto)
4 Form of Common Stock Certificate of Esquire Financial Holdings, Inc. (incorporated byreference to Exhibit 4 in the Registration Statement on Form S-1 (File No. 333-218372) originallyfiled by the Company under the Securities Act of 1933 with the Commission on May 31, 2017,and all amendments or reports filed thereto)
10.1 Letter Agreement regarding Investor Rights, dated December 23, 2014, between EsquireFinancial Holdings, Inc. and CJA Private Equity Financial Restructuring Master Fund I, LP(incorporated by reference to Exhibit 10.1 in the Registration Statement on Form S-1 (FileNo. 333-218372) originally filed by the Company under the Securities Act of 1933 with theCommission on May 31, 2017, and all amendments or reports filed thereto)
10.2 Registration Rights Agreement, dated December 23, 2014, between Esquire Financial Holdings,Inc. and CJA Private Equity Financial Restructuring Master Fund I, LP (incorporated byreference to Exhibit 10.2 in the Registration Statement on Form S-1 (File No. 333-218372)originally filed by the Company under the Securities Act of 1933 with the Commission onMay 31, 2017, and all amendments or reports filed thereto)
10.3 Employment Agreement by and among Esquire Financial Holdings, Inc., Esquire Bank andDennis Shields (incorporated by reference to Exhibit 10.3 in the Registration Statement onForm S-1 (File No. 333-218372) originally filed by the Company under the Securities Act of 1933with the Commission on May 31, 2017, and all amendments or reports filed thereto)†
10.4 Employment Agreement by and among Esquire Financial Holdings, Inc., Esquire Bank andAndrew C. Sagliocca (incorporated by reference to Exhibit 10.4 in the Registration Statement onForm S-1 (File No. 333-218372) originally filed by the Company under the Securities Act of 1933with the Commission on May 31, 2017, and all amendments or reports filed thereto)†
10.5 Employment Agreement by and among Esquire Financial Holdings, Inc., Esquire Bank and EricBader (incorporated by reference to Exhibit 10.5 in the Registration Statement on Form S-1 (FileNo. 333-218372) originally filed by the Company under the Securities Act of 1933 with theCommission on May 31, 2017, and all amendments or reports filed thereto)†
10.6 Employment Agreement by and among Esquire Financial Holdings, Inc., Esquire Bank and AriKornhaber (incorporated by reference to Exhibit 10.6 in the Registration Statement on Form S-1(File No. 333-218372) originally filed by the Company under the Securities Act of 1933 with theCommission on May 31, 2017, and all amendments or reports filed thereto)†
10.7 Esquire Bank 2007 Stock Option Plan (incorporated by reference to Exhibit 10.7 in theRegistration Statement on Form S-1 (File No. 333-218372) originally filed by the Company underthe Securities Act of 1933 with the Commission on May 31, 2017, and all amendments or reportsfiled thereto)†
95
10.8 Esquire Financial Holdings, Inc. 2011 Stock Compensation Plan, as amended (incorporated byreference to Exhibit 10.8 in the Registration Statement on Form S-1 (File No. 333-218372)originally filed by the Company under the Securities Act of 1933 with the Commission onMay 31, 2017, and all amendments or reports filed thereto)†
10.9 Esquire Financial Holdings, Inc. 2017 Equity Incentive Plan (incorporated by reference toAppendix A to the proxy statement for the Annual Meeting of Stockholders of Esquire FinancialHoldings, Inc. (File No. 001-38131), filed by the Company with the Commission on Schedule 14Aunder the Exchange Act on October 3, 2017)†
21 Subsidiaries of Registrant23 Consent of Independent Registered Public Accounting Firm31.1 Certification of Chief Executive Officer pursuant to Rule 13a-14(a) of the Securities Exchange
Act of 1934, as amended, as adopted pursuant to Section 302 of the Sarbanes-Oxley Act of 200231.2 Certification of Chief Financial Officer pursuant to Rule 13a-14(a) of the Securities Exchange
Act of 1934, as amended, as adopted pursuant to Section 302 of the Sarbanes-Oxley Act of 200232 Certification of Chief Executive Officer and Chief Financial Officer pursuant to 18 U.S.C.
Section 1350, as adopted pursuant to Section 906 of the Sarbanes-Oxley Act of 2002101 The following materials from the Company’s Annual Report on Form 10-K, formatted in XBRL:
(i) Consolidated Statements of Financial Condition, (ii) Consolidated Statements of Income, (iii)Consolidated Statements of Comprehensive Income, (iv) Consolidated Statements of Changes inStockholders’ Equity (v) Consolidated Statements of Cash Flows and (v) Notes to theConsolidated Financial Statements
† Management contract or compensation plan or arrangement.
ITEM 16. Form 10-K Summary
None.
96
SIGNATURES
Pursuant to the requirements of Section 13 or 15(d) of the Securities Exchange Act of 1934, theRegistrant has duly caused this report to be signed on its behalf by the undersigned, thereunto dulyauthorized.
ESQUIRE FINANCIAL HOLDINGS, INC.
Date: March 29, 2018 By: /s/ Andrew C. SaglioccaAndrew C. SaglioccaPresident, Chief Executive Officer and Director(Duly Authorized Representative)
Pursuant to the requirements of the Securities Exchange of 1934, this report has been signed below bythe following persons on behalf of the Registrant and in the capacities and on the dates indicated.
Signatures Title Date
/s/ Andrew C. SaglioccaAndrew C. Sagliocca
President and Chief Executive Officer and Director(Principal Executive Officer)
March 29, 2018
/s/ Eric S. BaderEric S. Bader
Eric S. Bader (Principal Financial and AccountingOfficer)
March 29, 2018
/s/ Dennis ShieldsDennis Shields
Executive Chairman March 29, 2018
/s/ Anthony CoelhoAnthony Coelho
Vice Chairman March 29, 2018
/s/ Todd DeutschTodd Deutsch
Director March 29, 2018
/s/ Marc D. GrossmanMarc D. Grossman
Director March 29, 2018
/s/ Russ M. HermanRuss M. Herman
Director March 29, 2018
/s/ Janet HillJanet Hill
Director March 29, 2018
/s/ Robert J. MitzmanRobert J. Mitzman
Director March 29, 2018
/s/ John MorganJohn Morgan
Director March 29, 2018
/s/ Richard T. PowersRichard T. Powers
Director March 29, 2018
/s/ Jack ThompsonJack Thompson
Director March 29, 2018
/s/ Kevin C. WaterhouseKevin C. Waterhouse
Director March 29, 2018
/s/ Selig ZisesSelig Zises
Director March 29, 2018
97

(This page intentionally left blank)
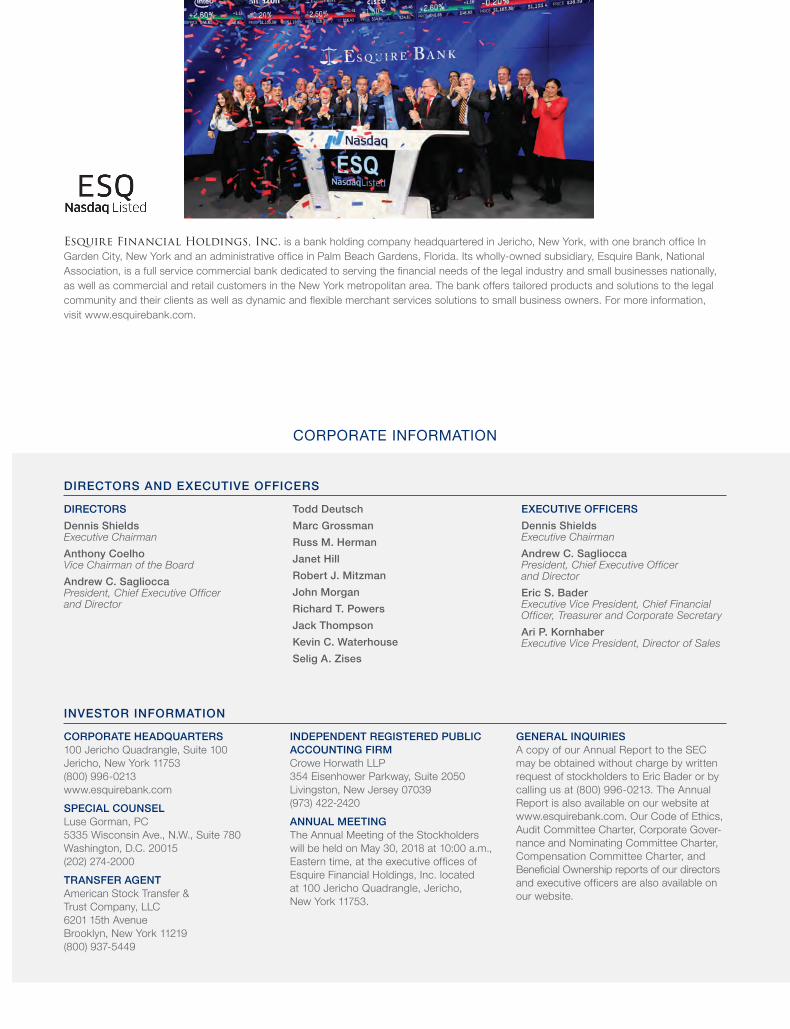
DIRECTORSDennis ShieldsExecutive ChairmanAnthony CoelhoVice Chairman of the BoardAndrew C. SaglioccaPresident, Chief Executive Officer and Director
Todd DeutschMarc GrossmanRuss M. HermanJanet HillRobert J. MitzmanJohn MorganRichard T. PowersJack ThompsonKevin C. WaterhouseSelig A. Zises
EXECUTIVE OFFICERSDennis ShieldsExecutive ChairmanAndrew C. SaglioccaPresident, Chief Executive Officer and DirectorEric S. BaderExecutive Vice President, Chief Financial Officer, Treasurer and Corporate SecretaryAri P. KornhaberExecutive Vice President, Director of Sales
CORPORATE INFORMATION
Esquire Financial Holdings, Inc. is a bank holding company headquartered in Jericho, New York, with one branch office In Garden City, New York and an administrative office in Palm Beach Gardens, Florida. Its wholly-owned subsidiary, Esquire Bank, National Association, is a full service commercial bank dedicated to serving the financial needs of the legal industry and small businesses nationally, as well as commercial and retail customers in the New York metropolitan area. The bank offers tailored products and solutions to the legal community and their clients as well as dynamic and flexible merchant services solutions to small business owners. For more information, visit www.esquirebank.com.
CORPORATE HEADQUARTERS100 Jericho Quadrangle, Suite 100Jericho, New York 11753(800) 996-0213www.esquirebank.comSPECIAL COUNSELLuse Gorman, PC5335 Wisconsin Ave., N.W., Suite 780Washington, D.C. 20015(202) 274-2000TRANSFER AGENTAmerican Stock Transfer & Trust Company, LLC6201 15th AvenueBrooklyn, New York 11219(800) 937-5449
INDEPENDENT REGISTERED PUBLIC ACCOUNTING FIRMCrowe Horwath LLP354 Eisenhower Parkway, Suite 2050Livingston, New Jersey 07039(973) 422-2420ANNUAL MEETINGThe Annual Meeting of the Stockholders will be held on May 30, 2018 at 10:00 a.m., Eastern time, at the executive offices of Esquire Financial Holdings, Inc. located at 100 Jericho Quadrangle, Jericho, New York 11753.
GENERAL INQUIRIESA copy of our Annual Report to the SEC may be obtained without charge by written request of stockholders to Eric Bader or by calling us at (800) 996-0213. The Annual Report is also available on our website at www.esquirebank.com. Our Code of Ethics, Audit Committee Charter, Corporate Gov er-nance and Nominating Committee Charter, Compensation Committee Charter, and Beneficial Ownership reports of our directors and executive officers are also available on our website.
INVESTOR INFORMATION
DIRECTORS AND EXECUTIVE OFFICERS
Esquire Financial Holdings, Inc.
100 JERICHO QUADRANGLE, SUITE 100 JERICHO, NEW YORK 11753
Esq
uir
e F
ina
nc
ial H
ol
din
gs, In
c. 2017 AN
NU
AL REPO
RT
Related Documents