arXiv:astro-ph/9812190v1 9 Dec 1998 A&A manuscript no. (will be inserted by hand later) Your thesaurus codes are: 02 (04.19.1; 04.03.1; 08.07.1; 11.07.1; 12.03.3) ASTRONOMY AND ASTROPHYSICS ESO Imaging Survey AXAF Field: Deep Optical-Infrared Observations, Data Reduction and Photometry R. Rengelink 1 , M. Nonino 1,2 , L. da Costa 1 , S. Zaggia 1,3,4 , T. Erben 1,5 , C. Benoist 1,5 , A. Wicenec 1 , M. Scodeggio 1 , L. F. Olsen 1,6 , D. Guarnieri 7 , E. Deul 1,8 , R. Hook 9 , A. Moorwood 1 , and R. Slijkhuis 1 1 European Southern Observatory, Karl-Schwarzschild-Str. 2, D–85748 Garching b. M¨ unchen, Germany 2 Osservatorio Astronomico di Trieste, Via G.B. Tiepolo 11, I-31144 Trieste, Italy 3 Dipartimento di Astronomia, Univ. di Padova, vicolo dell’Osservatorio 5, I-35125, Padova, Italy 4 Osservatorio Astronomico di Capodimonte, via Moiariello 15, I-80131, Napoli, Italy 5 Max-Planck Institut f¨ ur Astrophysik, Postfach 1523 D-85748, Garching bei M¨ unchen, Germany 6 Astronomisk Observatorium, Juliane Maries Vej 30, DK-2100 Copenhagen, Denmark 7 Osservatorio Astronomico di Pino Torinese, Strada Osservatorio 20, I-10025 Torino, Italy 8 Leiden Observatory, P.O. Box 9513, 2300 RA Leiden, The Netherlands 9 Space Telescope – European Coordinating Facility, Karl-Schwarzschild-Str. 2, D–85748 Garching b. M¨ unchen, Germany Received ; accepted Abstract. This paper presents ground-based data obtained from deep optical and infrared observations carried out at the ESO 3.5 New Technology Telescope (NTT) of a field selected for its low HI content for deep observations with AXAF. These data were taken as part of the ESO Imaging Survey (EIS) pro- gram, a public survey conducted in preparation for the first year of operation of the VLT. Deep CCD images are avail- able for five optical passbands, reaching 2σ limiting magni- tudes of U AB ∼ 27.0, B AB ∼ 27, V AB ∼ 26.5, R AB ∼ 26.5 and I AB ∼ 26. An area of ∼ 56 square arcmin is covered by U BV R observations, and ∼ 30 square arcmin also in I . The infrared observations cover a total area of ∼ 83 square arcmin, reach- ing J AB ∼ 24.5 and K AB ∼ 23.5. This paper describes the ob- servations and data reduction. It also presents images of the surveyed region and lists the optical and infrared photometric parameters of the objects detected on the co-added images of each passband, as well as multicolor optical and infrared cata- logs. These catalogs together with the astrometrically and pho- tometrically calibrated co-added images are public and can be retrieved from the URL “http://www.eso.org/eis”. This data set completes the ESO Imaging Survey program sixteen months after it began in July 1997. Key words: catalogs – surveys – stars:general – galax- ies:general – cosmology:observations 1. Introduction One of the main goals of the ESO Imaging Survey (EIS, Ren- zini & da Costa 1997) has been to carry out deep, multi- color observations in the optical and infrared passbands over a relatively large area (∼ 200 square arcmin) to produce faint galaxy samples (EIS-DEEP). The primary objective is to use the color information to estimate photometric redshifts, and identify galaxies likely to be in the poorly sampled 1 < ∼ z < 2 redshift interval or Lyman-break candidates at z > ∼ 2.5, all of which are interesting targets for follow-up spectroscopic ob- servations with the VLT. The first part of EIS-DEEP consisted of optical and infrared observations of the Hubble Deep Field South (HDF-S). The results have recently been reported and the data made public world-wide (da Costa et al. 1998, hereafter paper I). However, as pointed out in that paper, EIS-DEEP observations were also carried out over a region (hereafter the AXAF field) around α = 03 h 32 m 28 s and δ = −27 ◦ 48 ′ 30 ′′ selected for its low HI column density and where deep X-ray observations will be con- ducted with AXAF (Giacconi 1998). This field, in contrast to HDF-S, is remarkably devoid of bright stars and therefore par- ticularly suitable for deep ground-based imaging. The aim was to cover about 100 square arcmin in five optical ( UBVRI ) and two infrared passbands (JKs) to similar depth of the HDF-S ob- servations, thereby providing another field from which targets can be selected and observed in a different period of the year. In the present paper the data from the AXAF field observa- tions are reported. In section 2, the observations and data reduc- tion are discussed, and co-added images for the different fields and passbands are presented. In section 3, the basic photomet- ric parameters of sources detected in each passband are listed as well as optical, infrared and optical-infrared multicolor cata- logs. Using these catalogs the characteristics of the data are ex- plored in section 4. Finally, a preliminary list of high-z galaxy candidates is selected. A brief summary is presented in sec- tion 5.

Welcome message from author
This document is posted to help you gain knowledge. Please leave a comment to let me know what you think about it! Share it to your friends and learn new things together.
Transcript
arX
iv:a
stro
-ph/
9812
190v
1 9
Dec
199
8A&A manuscript no.(will be inserted by hand later)
Your thesaurus codes are:02 (04.19.1; 04.03.1; 08.07.1; 11.07.1; 12.03.3)
ASTRONOMYAND
ASTROPHYSICS
ESO Imaging Survey
AXAF Field: Deep Optical-Infrared Observations, Data Reduction and Photometry
R. Rengelink1, M. Nonino1,2, L. da Costa1, S. Zaggia1,3,4, T. Erben1,5, C. Benoist1,5, A. Wicenec1, M. Scodeggio1, L. F.Olsen1,6, D. Guarnieri7, E. Deul1,8, R. Hook9, A. Moorwood1, and R. Slijkhuis1
1 European Southern Observatory, Karl-Schwarzschild-Str.2, D–85748 Garching b. Munchen, Germany2 Osservatorio Astronomico di Trieste, Via G.B. Tiepolo 11, I-31144 Trieste, Italy3 Dipartimento di Astronomia, Univ. di Padova, vicolo dell’Osservatorio 5, I-35125, Padova, Italy4 Osservatorio Astronomico di Capodimonte, via Moiariello 15, I-80131, Napoli, Italy5 Max-Planck Institut fur Astrophysik, Postfach 1523 D-85748, Garching bei Munchen, Germany6 Astronomisk Observatorium, Juliane Maries Vej 30, DK-2100Copenhagen, Denmark7 Osservatorio Astronomico di Pino Torinese, Strada Osservatorio 20, I-10025 Torino, Italy8 Leiden Observatory, P.O. Box 9513, 2300 RA Leiden, The Netherlands9 Space Telescope – European Coordinating Facility, Karl-Schwarzschild-Str. 2, D–85748 Garching b. Munchen, Germany
Received ; accepted
Abstract. This paper presents ground-based data obtainedfrom deep optical and infrared observations carried out at theESO 3.5 New Technology Telescope (NTT) of a field selectedfor its low HI content for deep observations with AXAF. Thesedata were taken as part of the ESO Imaging Survey (EIS) pro-gram, a public survey conducted in preparation for the firstyear of operation of the VLT. Deep CCD images are avail-able for five optical passbands, reaching 2σ limiting magni-tudes ofUAB ∼ 27.0,BAB ∼ 27,VAB ∼ 26.5,RAB ∼ 26.5 andIAB ∼ 26. An area of∼ 56 square arcmin is covered byUBVRobservations, and∼ 30 square arcmin also inI . The infraredobservations cover a total area of∼ 83 square arcmin, reach-ing JAB ∼ 24.5 andKAB ∼ 23.5. This paper describes the ob-servations and data reduction. It also presents images of thesurveyed region and lists the optical and infrared photometricparameters of the objects detected on the co-added images ofeach passband, as well as multicolor optical and infrared cata-logs. These catalogs together with the astrometrically andpho-tometrically calibrated co-added images are public and canberetrieved from the URL “http://www.eso.org/eis”. This data setcompletes the ESO Imaging Survey program sixteen monthsafter it began in July 1997.
Key words: catalogs – surveys – stars:general – galax-ies:general – cosmology:observations
1. Introduction
One of the main goals of the ESO Imaging Survey (EIS, Ren-zini & da Costa 1997) has been to carry out deep, multi-color observations in the optical and infrared passbands overa relatively large area (∼ 200 square arcmin) to produce faintgalaxy samples (EIS-DEEP). The primary objective is to use
the color information to estimate photometric redshifts, andidentify galaxies likely to be in the poorly sampled 1<
∼z< 2
redshift interval or Lyman-break candidates atz >∼
2.5, all ofwhich are interesting targets for follow-up spectroscopicob-servations with the VLT.
The first part of EIS-DEEP consisted of optical and infraredobservations of the Hubble Deep Field South (HDF-S). Theresults have recently been reported and the data made publicworld-wide (da Costaet al.1998, hereafter paper I). However,as pointed out in that paper, EIS-DEEP observations were alsocarried out over a region (hereafter the AXAF field) aroundα = 03h32m28s and δ = −27◦48′30′′ selected for its low HIcolumn density and where deep X-ray observations will be con-ducted with AXAF (Giacconi 1998). This field, in contrast toHDF-S, is remarkably devoid of bright stars and therefore par-ticularly suitable for deep ground-based imaging. The aim wasto cover about 100 square arcmin in five optical (UBVRI) andtwo infrared passbands (JKs) to similar depth of the HDF-S ob-servations, thereby providing another field from which targetscan be selected and observed in a different period of the year.
In the present paper the data from the AXAF field observa-tions are reported. In section 2, the observations and data reduc-tion are discussed, and co-added images for the different fieldsand passbands are presented. In section 3, the basic photomet-ric parameters of sources detected in each passband are listedas well as optical, infrared and optical-infrared multicolor cata-logs. Using these catalogs the characteristics of the data are ex-plored in section 4. Finally, a preliminary list of high-z galaxycandidates is selected. A brief summary is presented in sec-tion 5.
2 R. Rengelink et al.: ESO Imaging Survey
Table 1. SUSI2 and SOFI Pointings (J2000.0)
Field αsusi2 δsusi2 αso f i δso f i
AXAF1 03:32:16.7 -27:46:00.0 03:32:17.5 -27:46:10.0AXAF2 03:32:38.0 -27:46:00.0 03:32:37.5 -27:46:10.0AXAF3 - - 03:32:17.5 -27:50:35.0AXAF4 - - 03:32:37.5 -27:50:35.0
2. Observations and Data Reduction
The original goal of the EIS-DEEP observations of the AXAFfield was to observe four adjacent and contiguous regions cen-tered on the nominal position selected for the X-ray observa-tions, where the sensitivity and image quality of the X-ray im-ages are expected to be the best. Therefore, the pointings oftheoptical and infrared cameras were chosen in such a way as tohave the X-ray center in a region where the sensitivity of themosaic, built from different pointings from the ground-basedobservations, is highest, taking into account both the physicalcharacteristics of the optical and infrared cameras used and theoverlap between the images. The pointings adopted in the con-struction of the optical and infrared mosaics are listed in Ta-ble 1. As discussed below, while the infrared mosaic is essen-tially complete inJ andKs, the optical is only half-way com-plete due to time and weather constraints.
The optical observations were carried out using the SUSI2camera (D’Odoricoet al.1998) at the f/11 Nasmyth focus A ofthe New Technology Telescope (NTT). The camera consists oftwo thinned, anti-reflection coated, 2k× 4k, 15µmpixel EEVCCDs (ESO #45, and #46), with the long side aligned in thenorth-south direction, leading to a field of view of 5.46×5.46square arcmin. The observations were carried out using a 2×
2 binning, yielding a scale of 0.16 arcsec per pixel. The gapseparating the two CCDs corresponds to∼ 8 arcsec on the sky.To minimize the effect of the inter-chip gap. the observationswere carried out using the same dithering pattern as describedin paper I.
The optical observations were carried out in the pe-riod August-November 1998, using broad-bandUBVRI filters(ESO # 810, 811, 812, 825, and 814, see SUSI2 web page).With exception of theRfilter, these are the same filters used inthe HDF-S observations. A total of 12 nights were allocated foroptical EIS-DEEP observations which were split between theHDF-S and AXAF fields. However, because of poor weatherconditions it was not possible to complete the program as orig-inally envisioned. Complete observations in all optical pass-bands are available for AXAF1, while for AXAF2I -band dataare missing.
Table 2 summarizes the observations, listing for each fieldand passband the total integration time, the number of expo-sures, the range of seeing as measured on individual exposures,the full-width at half-maximum (FWHM) of the point spreadfunction (PSF) in the final co-added image, and the estimated1σ limiting isophote within a 1 square arcsec area. Single ex-posures ranged from 800 sec (U) to 250 sec (R).
Table 2. Summary of Optical Observations
Filter ttotal Nf seeing FWHM1 µ1lim
range(sec) (arcsec) (arcsec) (mag arcsec−2)
AXAF1U 17000 21 0.8-1.0 0.90 27.81B 6600 22 0.7-1.0 1.10 28.76V 5500 22 1.0-1.2 0.88 28.46R 5500 22 0.7-1.0 0.89 28.06I 12600 21 0.8-1.4 1.31 27.51AXAF2U 13000 16 0.7-1.2 0.90 27.81B 5400 18 1.0-1.2 1.10 28.76V 5500 22 0.7-1.1 0.88 28.46R 5500 22 0.7-1.1 0.89 28.06
1 Values determined from AXAF1+2 mosaic.
As described in paper I, analysis of the Landolt standardsyields the following estimates for the accuracy of the zero-points:± 0.1 mag inU ; ±0.03 mag inB; ±0.03 mag inV;±0.04 mag inR; and±0.05 mag inI . These results apply toboth chips, with the relative zero-point difference between thechips being smaller than their estimated errors. Only for theU andB filters there are significant color terms relative to theJohnson system. The photometric accuracy of the EIS-DEEPdata was evaluated in paper I by comparing them with thoseavailable from other independent observations of the HDF-Sfield. As described in paper I the agreement is excellent withthe scatter being fully accounted for by the measurement errorsestimated from SExtractor.
The measured magnitudes were corrected for galac-tic absorption, usingE(B − V) = 0.009 as derived fromSchlegel, Finkbeiner & Davis (1998), yieldingAU = 0.05 mag,AB=0.03 mag,AV=0.02 mag,AR=0.02 mag andAI =0.01 mag.To facilitate the comparison with other authors, all magnitudesgiven below have been converted to theAB system using thefollowing relations:UAB = U + 0.82;BAB = B− 0.06;VAB =V;RAB = R+ 0.17; andIAB = I + 0.42, unless specified oth-erwise.
A total of 180 science frames were obtained for the AXAFfield and reduced using standard IRAF tasks. A complete de-scription of the various reduction steps can be found in paper I.After the frames were corrected for all instrumental effects, aneye-inspection was carried out to mask out features such assatellite tracks.
Infrared observations were obtained using the SOFI cam-era (Moorwood, Cuby & Lidman 1998) also at the NTT. SOFIis equipped with a Rockwell 10242 detector that, when usedtogether with its large field objective, provides images with apixel scale of 0.29 arcsec, and a field of view of about 4.9×4.9square arcmin. The infrared pointings, listed in Table 1 werechosen so as to take into account the smaller field of view ofSOFI and produce a contiguous mosaic slightly smaller thanthat in the optical. The final infrared mosaic has an area of83 square arcmin. The jittering pattern used was the same as
R. Rengelink et al.: ESO Imaging Survey 3
Fig. 1. Final co-added mosaic (11.2× 5.6 square arcmin) foreach of the optical passbands showing from top to bottom theU , B, V, RandI . Note that only one field is avaliable inI .
described in paper I. Individual observations comprised sixtyone-minute exposures, with each exposure being the averageof six ten-second sub-exposures.
Infrared observations in theJ andKs bands were obtainedduring the same period as the optical data. Total integrationtimes, the number of frames, the seeing range, the FWHM mea-
Fig. 2. Final co-added infrared mosaicJ (upper panel) andKs(lower panel). The images are about 9.0×9.0 square arcmin.
sured on the co-added images, and the estimated 1σ limitingisophote within one square arcsec are given in Table 3.
During all nights infrared standards taken from Persson(1997) were observed. From the photometric solutions the er-rors in the absolute photometric zero-points are found to be:± 0.05 mag inJ and± 0.05 mag inKs. These magnitudeswere also converted to theAB system, using:JAB = J + 0.89andKAB = Ks+1.86.
A total of 1380 SOFI science frames in the AXAF fieldwere reduced, as detailed in paper I, utilizing the programjitterfrom the astronomical data-reduction packageeclipse, writtenby N. Devillard (Devillard, 1998).
After removing all the instrumental signatures, both opticaland infrared images were input to the EIS pipeline for astro-metric calibration using the USNO-A V1.0 catalog as refer-ence. In the case of SUSI2, independent astrometric solutionswere found for the two chips. Before the astrometric calibra-tion, images were processed by SExtractor using a high detec-tion threshold to measure the size of the PSF of each frame, tocreate weight maps for co-addition and to flag cosmic rays and
4 R. Rengelink et al.: ESO Imaging Survey
Table 3. Summary of Infrared Observations
Filter ttotal Nf seeing FWHM1 µ1lim
range(sec) (arcsec) (arcsec) (mag arcsec−2)
AXAF1J 10800 180 0.8-1.2 0.99 25.32Ks 10800 180 0.8-1.1 0.95 23.83AXAF2J 10800 180 0.7-0.9 0.99 25.32Ks 10800 180 0.8-1.0 0.95 23.83AXAF3J 10800 180 0.7-0.9 0.99 25.32Ks 10800 180 0.8-1.3 0.95 23.83AXAF4J 10800 180 0.7-0.8 0.99 25.32Ks 7200 120 0.7-1.0 0.95 23.83
1 Values determined from combined AXAF1-4 mosaic.
defects. Images in the same passband were then co-added usingthe ”drizzle” method, originally created to handle HST images(Fruchter & Hook 1998), at the same resolution as the originalimages. In the process of co-addition, images taken in photo-metric nights were used as reference and all other images werecorrected to have the same instrumental magnitudes after ex-tinction correction. Finally, the absolute zero-point wasdeter-mined and stored in the header of the co-added image. In addi-tion, in order to allow the production of optical-infrared multi-color catalogs based on a single detection image (χ2-image), aco-added image of the optical data matching the infrared imageresolution was also created over the area they overlap.
The resulting optical and infrared mosaics in each pass-band are shown in Figures 1 and 2. Note that there are noI -band data for AXAF2. Figure 7 is a true-color image of theoptical mosaic of the AXAF field with the blue channel rep-resented by theU+Bimage, the green and red channels by theV andR images, respectively. Figure 8 shows a true-color im-age of the region of overlap of SOFI and SUSI2 observationswith the blue channel represented by theU+B image, the greenchannel by theV+R image, and the red channel by theJ+Ksimage. All the co-added images, including the correspondingweights and masks, are public and may be requested from theURL ”http://www.eso.org/eis”.
3. Object Catalogs
The above images were used to produce an array of source cata-logs. These include: co-added single passband, multi-passbandoptical and optical-infrared catalogs of sources extracted fromthe image mosaics. As in paper I, theχ2 technique (Szalay,Connolly & Szolokov 1998) was used in the production of themulti-color catalogs. These catalogs have the same format asthose of paper I and ASCII versions can be found at the URL“http://www.eso.org/eis”. An overview of the available cata-logs is presented in Table 4. Note that the number of sourcesin the I single band catalog is smaller, because this band only
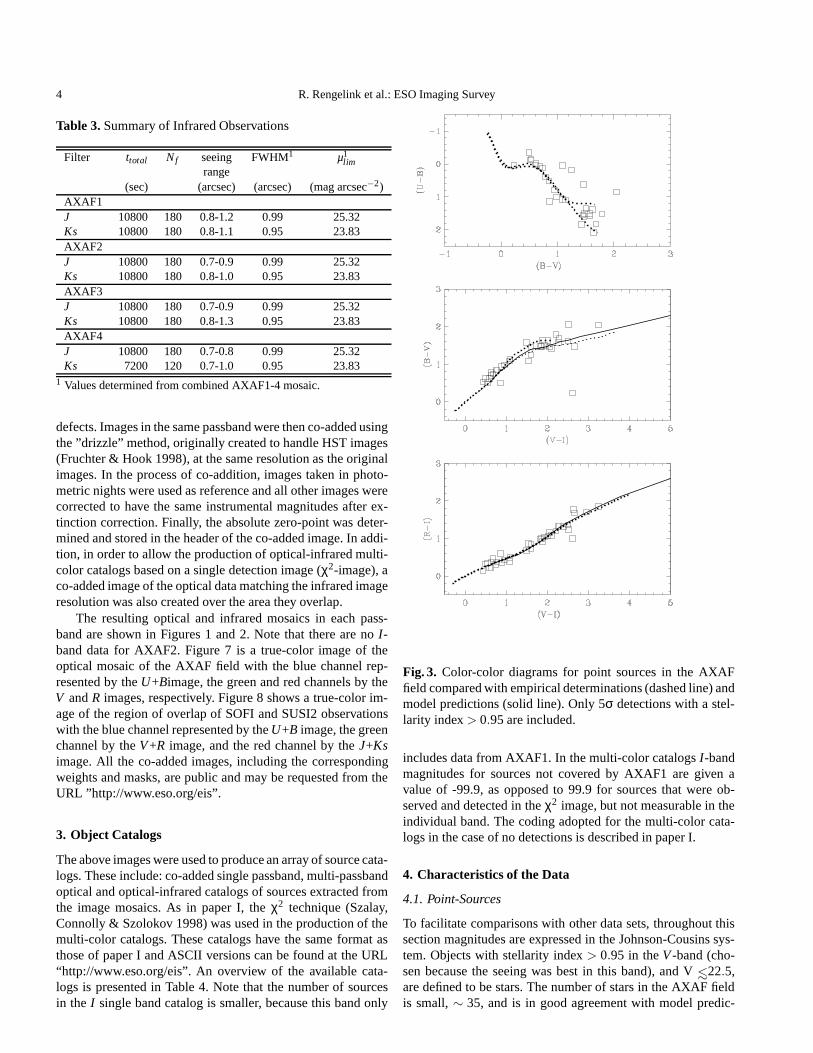
Fig. 3. Color-color diagrams for point sources in the AXAFfield compared with empirical determinations (dashed line)andmodel predictions (solid line). Only 5σ detections with a stel-larity index> 0.95 are included.
includes data from AXAF1. In the multi-color catalogsI -bandmagnitudes for sources not covered by AXAF1 are given avalue of -99.9, as opposed to 99.9 for sources that were ob-served and detected in theχ2 image, but not measurable in theindividual band. The coding adopted for the multi-color cata-logs in the case of no detections is described in paper I.
4. Characteristics of the Data
4.1. Point-Sources
To facilitate comparisons with other data sets, throughoutthissection magnitudes are expressed in the Johnson-Cousins sys-tem. Objects with stellarity index> 0.95 in theV-band (cho-sen because the seeing was best in this band), and V<
∼22.5,
are defined to be stars. The number of stars in the AXAF fieldis small,∼ 35, and is in good agreement with model predic-
R. Rengelink et al.: ESO Imaging Survey 5
Table 4. Summary of Catalogs
Single Band Nob j Area[arcmin2]
U 3271 55.85B 3716 55.85V 3460 55.85R 4137 55.85I 1569 29.60J 3150 83.26Ks 3015 83.26Multi-ColorAXAF Optical 6875 55.851
AXAF OIR2 3990 42.68AXAF IR 4583 83.26
1 see text2 OIR = optical-infrared
tions from Haywood, Robin & Creze (1997, see also Paper I).A good check for the adopted zeropoints is provided by thestellar color-color diagrams. Optical color-color diagrams arepresented in Figure 3, showing examples involving all the op-tical passbands used. All the colors have been corrected forreddening and the(U −B) and(B−V) colors have been cor-rected for the color term derived in paper I. Only 5σ detections,in all passbands, are included in these diagrams. For compari-son, the empirical relations compiled by Caldwellet al.(1993)and, whenever available, the theoretical isochrone taken fromBaraffeet al. (1997) are used. The theoretical model assumesa 10 Gyr, [M/H]= −1 population, typical for halo stars, andis fine-tuned to model low-mass main sequence stars. As canbe seen, in all cases the EIS-DEEP data are in good agreementwith the empirical and/or model sequences.
4.2. Galaxies
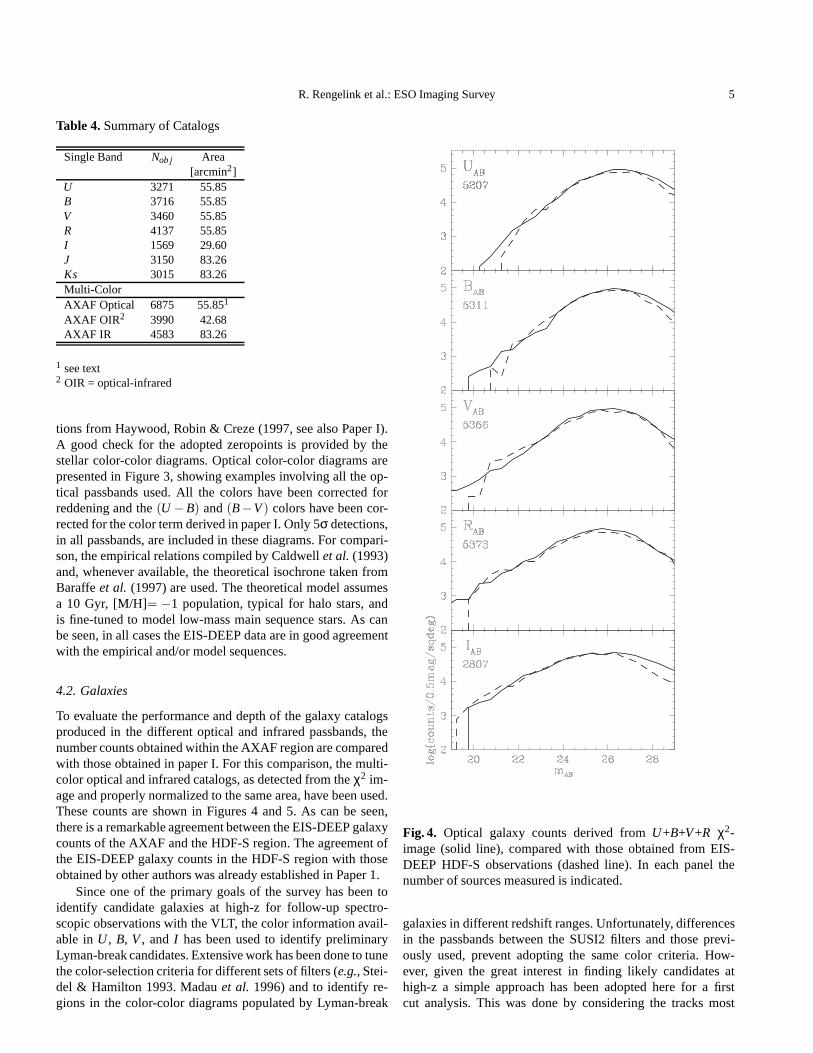
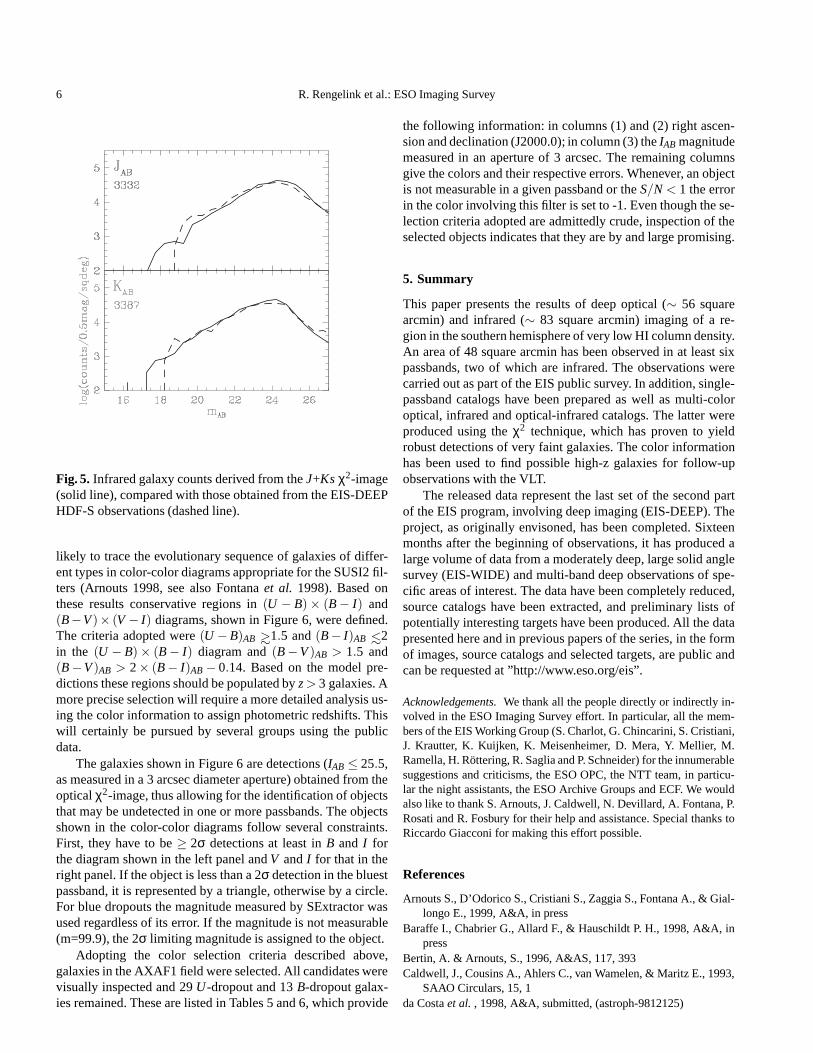
To evaluate the performance and depth of the galaxy catalogsproduced in the different optical and infrared passbands, thenumber counts obtained within the AXAF region are comparedwith those obtained in paper I. For this comparison, the multi-color optical and infrared catalogs, as detected from theχ2 im-age and properly normalized to the same area, have been used.These counts are shown in Figures 4 and 5. As can be seen,there is a remarkable agreement between the EIS-DEEP galaxycounts of the AXAF and the HDF-S region. The agreement ofthe EIS-DEEP galaxy counts in the HDF-S region with thoseobtained by other authors was already established in Paper 1.
Since one of the primary goals of the survey has been toidentify candidate galaxies at high-z for follow-up spectro-scopic observations with the VLT, the color information avail-able inU , B, V, and I has been used to identify preliminaryLyman-break candidates. Extensive work has been done to tunethe color-selection criteria for different sets of filters (e.g., Stei-del & Hamilton 1993. Madauet al. 1996) and to identify re-gions in the color-color diagrams populated by Lyman-break
Fig. 4. Optical galaxy counts derived fromU+B+V+R χ2-image (solid line), compared with those obtained from EIS-DEEP HDF-S observations (dashed line). In each panel thenumber of sources measured is indicated.
galaxies in different redshift ranges. Unfortunately, differencesin the passbands between the SUSI2 filters and those previ-ously used, prevent adopting the same color criteria. How-ever, given the great interest in finding likely candidates athigh-z a simple approach has been adopted here for a firstcut analysis. This was done by considering the tracks most
6 R. Rengelink et al.: ESO Imaging Survey
Fig. 5. Infrared galaxy counts derived from theJ+Ks χ2-image(solid line), compared with those obtained from the EIS-DEEPHDF-S observations (dashed line).
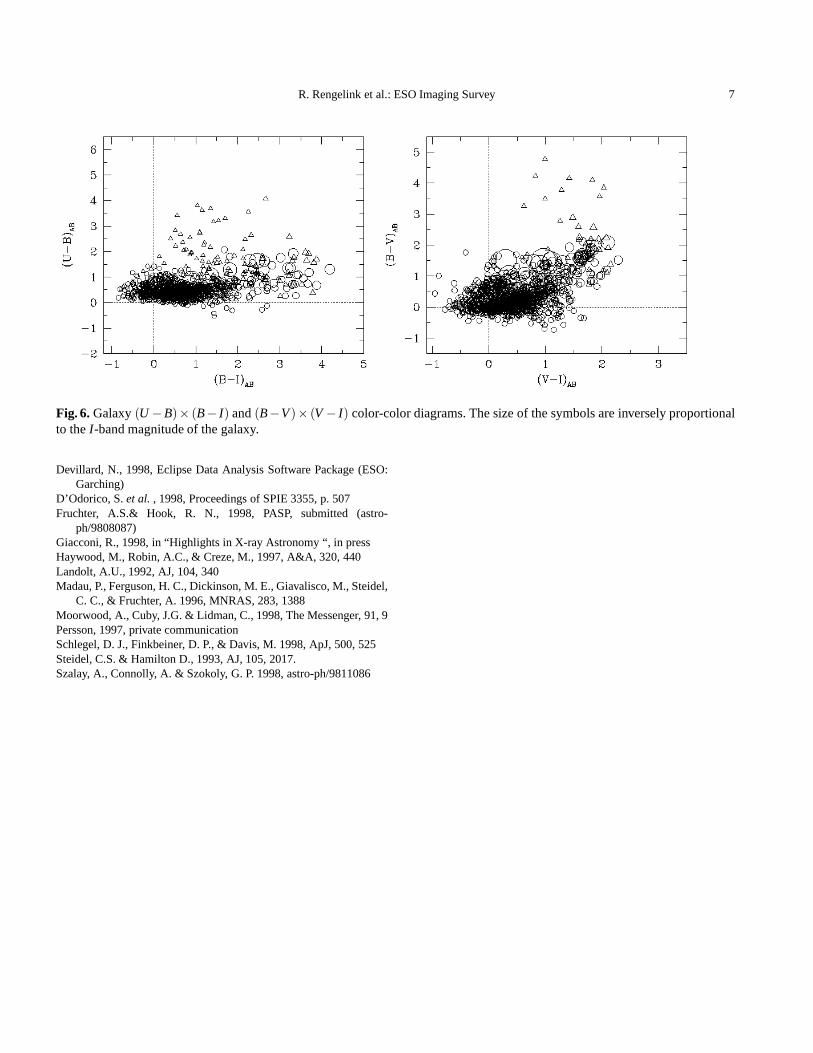
likely to trace the evolutionary sequence of galaxies of differ-ent types in color-color diagrams appropriate for the SUSI2fil-ters (Arnouts 1998, see also Fontanaet al. 1998). Based onthese results conservative regions in(U − B)× (B− I) and(B−V)× (V − I) diagrams, shown in Figure 6, were defined.The criteria adopted were(U −B)AB >
∼1.5 and(B− I)AB <
∼2
in the (U − B)× (B− I) diagram and(B−V)AB > 1.5 and(B−V)AB > 2× (B− I)AB− 0.14. Based on the model pre-dictions these regions should be populated byz> 3 galaxies. Amore precise selection will require a more detailed analysis us-ing the color information to assign photometric redshifts.Thiswill certainly be pursued by several groups using the publicdata.
The galaxies shown in Figure 6 are detections (IAB ≤ 25.5,as measured in a 3 arcsec diameter aperture) obtained from theopticalχ2-image, thus allowing for the identification of objectsthat may be undetected in one or more passbands. The objectsshown in the color-color diagrams follow several constraints.First, they have to be≥ 2σ detections at least inB and I forthe diagram shown in the left panel andV andI for that in theright panel. If the object is less than a 2σ detection in the bluestpassband, it is represented by a triangle, otherwise by a circle.For blue dropouts the magnitude measured by SExtractor wasused regardless of its error. If the magnitude is not measurable(m=99.9), the 2σ limiting magnitude is assigned to the object.
Adopting the color selection criteria described above,galaxies in the AXAF1 field were selected. All candidates werevisually inspected and 29U-dropout and 13B-dropout galax-ies remained. These are listed in Tables 5 and 6, which provide
the following information: in columns (1) and (2) right ascen-sion and declination (J2000.0); in column (3) theIAB magnitudemeasured in an aperture of 3 arcsec. The remaining columnsgive the colors and their respective errors. Whenever, an objectis not measurable in a given passband or theS/N < 1 the errorin the color involving this filter is set to -1. Even though these-lection criteria adopted are admittedly crude, inspectionof theselected objects indicates that they are by and large promising.
5. Summary
This paper presents the results of deep optical (∼ 56 squarearcmin) and infrared (∼ 83 square arcmin) imaging of a re-gion in the southern hemisphere of very low HI column density.An area of 48 square arcmin has been observed in at least sixpassbands, two of which are infrared. The observations werecarried out as part of the EIS public survey. In addition, single-passband catalogs have been prepared as well as multi-coloroptical, infrared and optical-infrared catalogs. The latter wereproduced using theχ2 technique, which has proven to yieldrobust detections of very faint galaxies. The color informationhas been used to find possible high-z galaxies for follow-upobservations with the VLT.
The released data represent the last set of the second partof the EIS program, involving deep imaging (EIS-DEEP). Theproject, as originally envisoned, has been completed. Sixteenmonths after the beginning of observations, it has producedalarge volume of data from a moderately deep, large solid anglesurvey (EIS-WIDE) and multi-band deep observations of spe-cific areas of interest. The data have been completely reduced,source catalogs have been extracted, and preliminary listsofpotentially interesting targets have been produced. All the datapresented here and in previous papers of the series, in the formof images, source catalogs and selected targets, are publicandcan be requested at ”http://www.eso.org/eis”.
Acknowledgements.We thank all the people directly or indirectly in-volved in the ESO Imaging Survey effort. In particular, all the mem-bers of the EIS Working Group (S. Charlot, G. Chincarini, S. Cristiani,J. Krautter, K. Kuijken, K. Meisenheimer, D. Mera, Y. Mellier, M.Ramella, H. Rottering, R. Saglia and P. Schneider) for the innumerablesuggestions and criticisms, the ESO OPC, the NTT team, in particu-lar the night assistants, the ESO Archive Groups and ECF. We wouldalso like to thank S. Arnouts, J. Caldwell, N. Devillard, A. Fontana, P.Rosati and R. Fosbury for their help and assistance. Specialthanks toRiccardo Giacconi for making this effort possible.
References
Arnouts S., D’Odorico S., Cristiani S., Zaggia S., Fontana A., & Gial-longo E., 1999, A&A, in press
Baraffe I., Chabrier G., Allard F., & Hauschildt P. H., 1998,A&A, inpress
Bertin, A. & Arnouts, S., 1996, A&AS, 117, 393Caldwell, J., Cousins A., Ahlers C., van Wamelen, & Maritz E., 1993,
SAAO Circulars, 15, 1da Costaet al. , 1998, A&A, submitted, (astroph-9812125)
R. Rengelink et al.: ESO Imaging Survey 7 �������������������������������������������������������������������������������������������������������������������������������������������������������������������������������������������������������������������������������������������������������������������������������������������������������������������������������������������������������������������������������������������������������������������������������������������������������������������������������������������������������������������� ��������������������������������������������������������������������������������������������������������������������������������������������������������������������������������������������������������������������������������������������������������������������������������������������������������������������������������������������������������������������������������������������������������������������������������������������������������������������������������������������������������������������
Fig. 6. Galaxy(U −B)× (B− I) and(B−V)× (V − I) color-color diagrams. The size of the symbols are inverselyproportionalto theI -band magnitude of the galaxy.
Devillard, N., 1998, Eclipse Data Analysis Software Package (ESO:Garching)
D’Odorico, S.et al. , 1998, Proceedings of SPIE 3355, p. 507Fruchter, A.S.& Hook, R. N., 1998, PASP, submitted (astro-
ph/9808087)Giacconi, R., 1998, in “Highlights in X-ray Astronomy “, in pressHaywood, M., Robin, A.C., & Creze, M., 1997, A&A, 320, 440Landolt, A.U., 1992, AJ, 104, 340Madau, P., Ferguson, H. C., Dickinson, M. E., Giavalisco, M., Steidel,
C. C., & Fruchter, A. 1996, MNRAS, 283, 1388Moorwood, A., Cuby, J.G. & Lidman, C., 1998, The Messenger, 91, 9Persson, 1997, private communicationSchlegel, D. J., Finkbeiner, D. P., & Davis, M. 1998, ApJ, 500, 525Steidel, C.S. & Hamilton D., 1993, AJ, 105, 2017.Szalay, A., Connolly, A. & Szokoly, G. P. 1998, astro-ph/9811086

8 R. Rengelink et al.: ESO Imaging Survey
Table 5. High-z Galaxy Candidates (U-dropouts).
# α δ IAB(3′′) (U −B) ε (B− I) ε
1 03:32:05.84 −27:48:15.9 22.99 2.07 0.50 1.68 0.092 03:32:18.29 −27:47:22.8 24.85 3.63 5.89 1.15 0.263 03:32:15.15 −27:47:54.5 23.81 1.56 0.62 1.51 0.174 03:32:17.25 −27:47:54.3 25.26 1.78 2.41 1.52 0.465 03:32:09.60 −27:47:39.8 25.41 2.51 1.78 0.40 0.316 03:32:19.43 −27:47:28.3 25.45 3.82 −1.00 1.04 0.407 03:32:03.53 −27:47:21.0 24.98 1.68 2.05 1.45 0.428 03:32:13.53 −27:47:19.6 25.35 3.31 −1.00 1.70 0.569 03:32:18.30 −27:47:14.5 25.28 1.95 1.59 0.88 0.32
10 03:32:22.72 −27:46:37.6 25.36 3.42 4.47 0.55 0.3011 03:32:15.47 −27:46:31.4 23.92 1.84 1.15 1.91 0.2312 03:32:04.40 −27:46:03.2 25.38 2.69 2.69 0.63 0.3313 03:32:17.93 −27:45:36.1 24.83 1.64 1.64 1.74 0.3714 03:32:09.07 −27:45:35.2 24.99 2.55 1.90 0.86 0.2615 03:32:16.63 −27:45:20.1 25.34 2.09 1.97 0.77 0.3816 03:32:03.31 −27:45:18.7 25.37 1.81 1.29 0.13 0.3817 03:32:13.79 −27:45:12.9 25.16 1.88 1.31 0.86 0.3318 03:32:15.70 −27:45:15.2 25.38 1.96 1.97 0.90 0.4319 03:32:09.62 −27:45:14.5 25.02 1.85 1.42 1.17 0.3120 03:32:22.48 −27:44:38.2 25.47 3.21 −1.00 1.54 0.5521 03:32:05.01 −27:44:31.6 24.02 2.17 1.29 1.34 0.1622 03:32:28.26 −27:44:03.4 25.30 3.69 −1.00 1.35 0.3823 03:32:14.49 −27:44:05.6 24.91 1.72 1.30 1.02 0.2924 03:32:18.23 −27:44:21.9 25.18 1.58 1.68 1.31 0.3825 03:32:03.85 −27:44:05.4 25.49 2.84 3.94 0.51 0.4126 03:32:08.51 −27:43:58.2 25.28 1.54 0.70 0.25 0.2827 03:32:26.39 −27:43:46.5 25.20 1.57 1.70 1.58 0.3628 03:32:03.58 −27:43:40.5 25.03 2.35 3.77 1.21 0.4329 03:32:16.15 −27:44:01.6 25.22 2.26 3.26 1.19 0.44
Table 6. High-z Galaxy Candidates (B-dropouts).
# α δ IAB(3′′) (B−V) ε (V − I) ε
1 03:32:14.37 −27:48:31.2 25.28 3.79 −1.00 1.29 0.512 03:32:06.62 −27:47:47.5 24.72 4.77 −1.00 1.00 0.233 03:32:16.21 −27:47:36.6 25.38 1.71 0.97 0.68 0.364 03:32:13.53 −27:47:19.6 25.35 1.61 0.53 0.09 0.315 03:32:20.31 −27:47:18.1 24.92 4.16 −1.00 1.42 0.346 03:32:09.19 −27:46:52.7 24.57 4.10 −1.00 1.83 0.377 03:32:05.08 −27:46:12.3 24.92 3.26 2.39 0.62 0.238 03:32:12.30 −27:45:24.7 23.55 2.89 1.10 1.48 0.139 03:32:18.94 −27:45:23.6 24.55 1.59 0.40 0.66 0.17
10 03:32:06.24 −27:45:01.8 25.07 1.61 0.65 0.58 0.2711 03:32:25.82 −27:44:34.6 24.92 1.51 0.40 0.62 0.1612 03:32:10.14 −27:44:09.7 24.65 1.69 0.45 0.49 0.1913 03:32:17.75 −27:43:40.1 25.33 4.23 −1.00 0.83 0.36
R. Rengelink et al.: ESO Imaging Survey 9
Fig. 7. Plate 1. True-color image of the AXAF optical mosaic based onfour passbands. The blue channel is represented by theU+B image, the green channel by theV image, and the red channel by theR image. The edges of the field have been trimmed toexclude the imprint of the dithering pattern. This color image covers an area of approximately 10.5×5.3 square arcmin.
10 R. Rengelink et al.: ESO Imaging Survey
Fig. 8. Plate 2. True-color image of part of the AXAF field for which the optical and infrared observations overlap. it is based on6 passbands covering an extended spectral region. The blue channel is represented by theU+B image, the green channel by theV+R image, and the red channel by theJ+Ks image. This color image covers an area of approximately 9.1×5.1 square arcmincorresponding to the SUSI2-SOFI overlap in the AXAF field.

This figure "fig1.jpg" is available in "jpg" format from:
http://arxiv.org/ps/astro-ph/9812190v1

This figure "fig2a.jpg" is available in "jpg" format from:
http://arxiv.org/ps/astro-ph/9812190v1

This figure "fig2b.jpg" is available in "jpg" format from:
http://arxiv.org/ps/astro-ph/9812190v1

This figure "fig7.jpg" is available in "jpg" format from:
http://arxiv.org/ps/astro-ph/9812190v1

This figure "fig8.jpg" is available in "jpg" format from:
http://arxiv.org/ps/astro-ph/9812190v1
Related Documents