arXiv:astro-ph/9909351v1 21 Sep 1999 A&A manuscript no. (will be inserted by hand later) Your thesaurus codes are: 11.01.2; 11.06.2; 11.09.2; 11.16.1; 11.17.3; 13.09.1 ASTRONOMY AND ASTROPHYSICS Near-infrared photometry of isolated spirals with and without an AGN. I: The Data. ⋆ I. M´ arquez 1,2 , F. Durret 2,3 , R.M. Gonz´ alez Delgado 1 , I. Marrero 1 , J. Masegosa 1 , J. Maza 4 , M. Moles 5 , E. P´ erez 1 , and M. Roth 6 1 Instituto de Astrof´ ısica de Andaluc´ ıa (CSIC), Apartado 3004 , E-18080 Granada, Spain 2 Institut d’Astrophysique de Paris, CNRS, 98bis Bd Arago, F-75014 Paris, France 3 DAEC, Observatoire de Paris, Universit´ e Paris VII, CNRS (UA 173), F-92195 Meudon Cedex, France 4 Departamento de Astronom´ ıa, Universidad de Chile, Casilla 36D, Santiago, Chile 5 Instituto de Matem´aticas y F´ ısica Fundamental (CSIC), Madrid, Spain and Observatorio Astron´omico Nacional, Madrid, Spain. Presently on sabbatical leave at Queen Mary & Westfield College, London, UK 6 Observatories of the Carnegie Institution of Washington, 813 Barbara Street, Pasadena, CA91101 Received, ; accepted, Abstract. We present infrared imaging data in the J and K’ bands obtained for 18 active spiral galaxies, together with 11 non active galaxies taken as a control sample. All of them were chosen to satisfy well defined isolation cri- teria so that the observed properties are not related to gravitational interaction. For each object we give: the im- age in the K’ band, the sharp-divided image (obtained by dividing the observed image by a filtered one), the dif- ference image (obtained by subtracting a model to the observed one), the color J-K’ image, the ellipticity and position angle profiles, the surface brightness profiles in J and K’, their fits by bulge+disk models and the color gradient. We have found that four (one) active (control) galax- ies previously classified as non-barred turn out to have bars when observed in the near-infrared. One of these four galaxies (UGC 1395) also harbours a secondary bar. For 15 (9 active, 6 control) out of 24 (14 active, 10 control) of the optically classified barred galaxies (SB or SX) we find that a secondary bar (or a disk, a lense or an elongated ring) is present. The work presented here is part of a large program (DEGAS) aimed at finding whether there are differences between active and non active galaxies in the properties of their central regions that could be connected with the onset of nuclear activity. Key words: galaxies: active - galaxies: fundamental pa- rameters - galaxies: photometry - infrared: galaxies Send offprint requests to : I. M´arquez ([email protected]) ⋆ Based on data obtained at: the European Southern Ob- servatory, La Silla, Chile, the T´ elescope Bernard Lyot, Calar Alto Observatory, Las Campanas Observatory. Also based on observations made with the NASA/ESA Hubble Space Tele- scope, obtained from the data archive at the Space Telescope Institute. 1. Introduction The existence of non-axysimmetric components of the galactic potential has been frequently invoked as an ef- ficient way to transport gas from the galaxy scale down to the nucleus to fuel the AGN. In particular, the shocks and gravitational torques induced by a galactic bar 1 can make the gas loose angular momentum and therefore facilitate the fuelling mechanism (Shlosman et al. 1989). Neverthe- less, it has been suggested that there is not a preference for Seyfert nuclei to occur in barred galaxies (Heckman 1980; Simkim et al. 1980). This result is confirmed by statistical analyses on the catalogued morphology of Seyfert galaxies (Moles et al. 1995) and through near-infrared imaging stu- dies (McLeod & Rieke 1995; Alonso-Herrero et al. 1996; Mulchaey & Regan 1997). We have started a large observational program aimed at studying the conditions for the onset of activity in galactic nuclei. Based on previous work (Moles et al. 1995), we search for detailed morphological and kinematical dif- ferences between active and non active galaxies of similar global morphology. We particularly pay attention to those that could facilitate the transport of gas towards the very central regions and the nucleus (for an example of the complete analysis of one of our sample galaxies see P´ erez et al. 1999). For this purpose, we are obtaining optical and near-infrared images and long slit spectroscopy with the best possible spatial resolution. We selected a sample of galaxies, out of which 18 host active nuclei and the rest form a control sample of non active galaxies (see Sect. 1). 1 we mean bar = primary bar; when considering secondary bars, it will be clearly stated

Welcome message from author
This document is posted to help you gain knowledge. Please leave a comment to let me know what you think about it! Share it to your friends and learn new things together.
Transcript
arX
iv:a
stro
-ph/
9909
351v
1 2
1 Se
p 19
99A&A manuscript no.
(will be inserted by hand later)
Your thesaurus codes are:
11.01.2; 11.06.2; 11.09.2; 11.16.1; 11.17.3; 13.09.1
ASTRONOMYAND
ASTROPHYSICS
Near-infrared photometry of isolated spirals with andwithout an AGN. I: The Data. ⋆
I. Marquez1,2, F. Durret2,3, R.M. Gonzalez Delgado1, I. Marrero1, J. Masegosa1, J. Maza4, M. Moles5,
E. Perez1, and M. Roth6
1 Instituto de Astrofısica de Andalucıa (CSIC), Apartado 3004 , E-18080 Granada, Spain2 Institut d’Astrophysique de Paris, CNRS, 98bis Bd Arago, F-75014 Paris, France3 DAEC, Observatoire de Paris, Universite Paris VII, CNRS (UA 173), F-92195 Meudon Cedex, France4 Departamento de Astronomıa, Universidad de Chile, Casilla 36D, Santiago, Chile5 Instituto de Matematicas y Fısica Fundamental (CSIC), Madrid, Spain and Observatorio Astronomico Nacional, Madrid,
Spain. Presently on sabbatical leave at Queen Mary & Westfield College, London, UK6 Observatories of the Carnegie Institution of Washington, 813 Barbara Street, Pasadena, CA91101
Received, ; accepted,
Abstract. We present infrared imaging data in the J andK’ bands obtained for 18 active spiral galaxies, togetherwith 11 non active galaxies taken as a control sample. Allof them were chosen to satisfy well defined isolation cri-teria so that the observed properties are not related togravitational interaction. For each object we give: the im-age in the K’ band, the sharp-divided image (obtained bydividing the observed image by a filtered one), the dif-ference image (obtained by subtracting a model to theobserved one), the color J-K’ image, the ellipticity andposition angle profiles, the surface brightness profiles inJ and K’, their fits by bulge+disk models and the colorgradient.
We have found that four (one) active (control) galax-ies previously classified as non-barred turn out to havebars when observed in the near-infrared. One of these fourgalaxies (UGC 1395) also harbours a secondary bar. For15 (9 active, 6 control) out of 24 (14 active, 10 control) ofthe optically classified barred galaxies (SB or SX) we findthat a secondary bar (or a disk, a lense or an elongatedring) is present.
The work presented here is part of a large program(DEGAS) aimed at finding whether there are differencesbetween active and non active galaxies in the propertiesof their central regions that could be connected with theonset of nuclear activity.
Key words: galaxies: active - galaxies: fundamental pa-rameters - galaxies: photometry - infrared: galaxies
Send offprint requests to: I. Marquez ([email protected])⋆ Based on data obtained at: the European Southern Ob-
servatory, La Silla, Chile, the Telescope Bernard Lyot, CalarAlto Observatory, Las Campanas Observatory. Also based onobservations made with the NASA/ESA Hubble Space Tele-scope, obtained from the data archive at the Space TelescopeInstitute.
1. Introduction
The existence of non-axysimmetric components of thegalactic potential has been frequently invoked as an ef-ficient way to transport gas from the galaxy scale down tothe nucleus to fuel the AGN. In particular, the shocks andgravitational torques induced by a galactic bar 1 can makethe gas loose angular momentum and therefore facilitatethe fuelling mechanism (Shlosman et al. 1989). Neverthe-less, it has been suggested that there is not a preference forSeyfert nuclei to occur in barred galaxies (Heckman 1980;Simkim et al. 1980). This result is confirmed by statisticalanalyses on the catalogued morphology of Seyfert galaxies(Moles et al. 1995) and through near-infrared imaging stu-dies (McLeod & Rieke 1995; Alonso-Herrero et al. 1996;Mulchaey & Regan 1997).
We have started a large observational program aimedat studying the conditions for the onset of activity ingalactic nuclei. Based on previous work (Moles et al. 1995),we search for detailed morphological and kinematical dif-ferences between active and non active galaxies of similarglobal morphology. We particularly pay attention to thosethat could facilitate the transport of gas towards the verycentral regions and the nucleus (for an example of thecomplete analysis of one of our sample galaxies see Perezet al. 1999). For this purpose, we are obtaining optical andnear-infrared images and long slit spectroscopy with thebest possible spatial resolution.
We selected a sample of galaxies, out of which 18 hostactive nuclei and the rest form a control sample of nonactive galaxies (see Sect. 1).
1 we mean bar = primary bar; when considering secondarybars, it will be clearly stated
2 I. Marquez et al.: Near-infrared photometry of isolated spirals with and without an AGN. I: The Data.
In this paper we present the first data set: the infraredimaging data in the J and K’ bands. Infrared imagingis particularly important because it allows to trace theold stellar population, and to separate the various com-ponents (the bulge, disk, bar(s) and spiral arms) with thesmallest contribution of the active nucleus and less con-tamination by dust absorption. In fact, various K bandimaging studies have revealed that bars were present ingalaxies classified as unbarred in the optical (McLeod &Rieke 1995; Mulchaey & Regan 1997), hence showing thatthe near-infrared is better suited for these purposes. Thesample is described in Section 2. In Section 3 we presentthe near-infrared data we have obtained together with theHST archive images we used. In Section 4 we describethe different methods of analysis applied to the images.In Sections 5 and 6 the results are described for each ofthe galaxies in both sets of active and non-active spiralsrespectively. The summary is given in Section 2.
A discussion on the NIR properties of these galaxies,together with the comparison of active versus non-activegalaxies derived from these data will be presented in acompanion paper (Marquez et al., in preparation).
2. The sample
The active galaxies have been chosen with the followingcriteria: (a) Seyfert 1 or 2 from the Veron-Cetty & Veron(1993) catalogue; (b) with morphological information inthe RC3 Catalogue; (c) isolated, in the sense of not hav-ing a companion within 0.4 Mpc (H0=75 km/s/Mpc) andcz<500 km/s, or companions catalogued by Nilson with-out known z; (d) nearby, cz<6000 km/s; and (e) interme-diate inclination (30 to 65◦). The control sample galaxieshave been selected among spirals verifying the same condi-tions (b), (c), (d) and (e), and with types similar to thoseof the active spirals. Thus, all the galaxies in our sampleare isolated, in the sense of avoiding possible effects ofinteractions with luminous nearby galaxies. 2
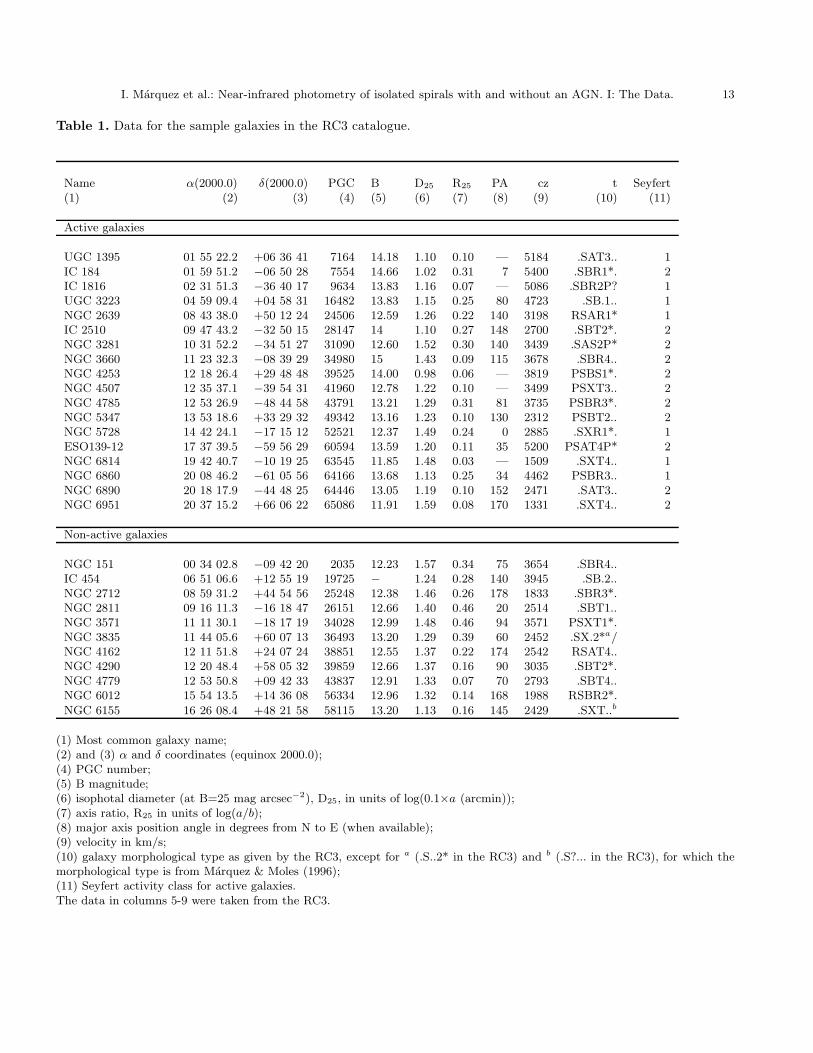
The main properties of the sample galaxies, as givenin the RC3 catalogue are presented in Table 1.
The samples are not large enough to allow statisti-cally significant results, but the detailed study of each ofthe galaxies in these samples should give us at least hintson what differences between active and non-active isolatedspiral galaxies, if any, are to be taken into account to iden-tify the conditions for the onset of nuclear activity.
The active sample extends farther in redshift. In par-ticular, there are six active galaxies with cz> 4000 km/s,but none in the control sample. Although this changes thephysical resolution achieved for those objects, we don’texpect any bias due to that difference. Absolute meanB luminosities give MB = −20.4 ± 0.6 for Seyferts and
2 in a strict sense, they are weakly interacting systems, sincewe don’t take into account the possibility of being surroundedby dwarf galaxies or HI clouds.
MB = −20.3 ± 0.9 for non-active galaxies. Some contri-bution from the active galaxies would be expected as aconsequence of the presence of the active nucleus itselfand of the higher levels of star formation sometimes ob-served in that kind of galaxies (Maiolino & Rieke 1995). Ifany, this effect is not systematically present in our smallsamples, which can therefore be considered as comparablewith respect to the host galaxy luminosity. The distribu-tion of inclinations is almost flat for the non-active galax-ies, whereas there is a deficiency of active galaxies at largeinclinations, as expected for an optically selected sampleof active galaxies (McLeod & Rieke 1995). The morpho-logical types of spiral active galaxies are earlier than Sbc,resembling the type distribution of active galaxies in theVeron-Cetty & Veron catalogue (Moles et al. 1995); non-active galaxies have been selected to have similar types.Looking at the presence of bars in the galaxies of bothsamples (as catalogued in the RC3), we notice that onlyone galaxy in the list of non-active objects is unbarred,and three more are of intermediate type X. For the activegalaxies, half are barred and four more of type X. As al-ready quoted, the presence of a primary bar does not seemto be the direct cause for the nuclear activity. Otherwisethe lists of active and non active galaxies we have observedare rather similar in global properties. We therefore esti-mate that the sample of non-active galaxies is well suitedto be used as a control sample.
3. The data
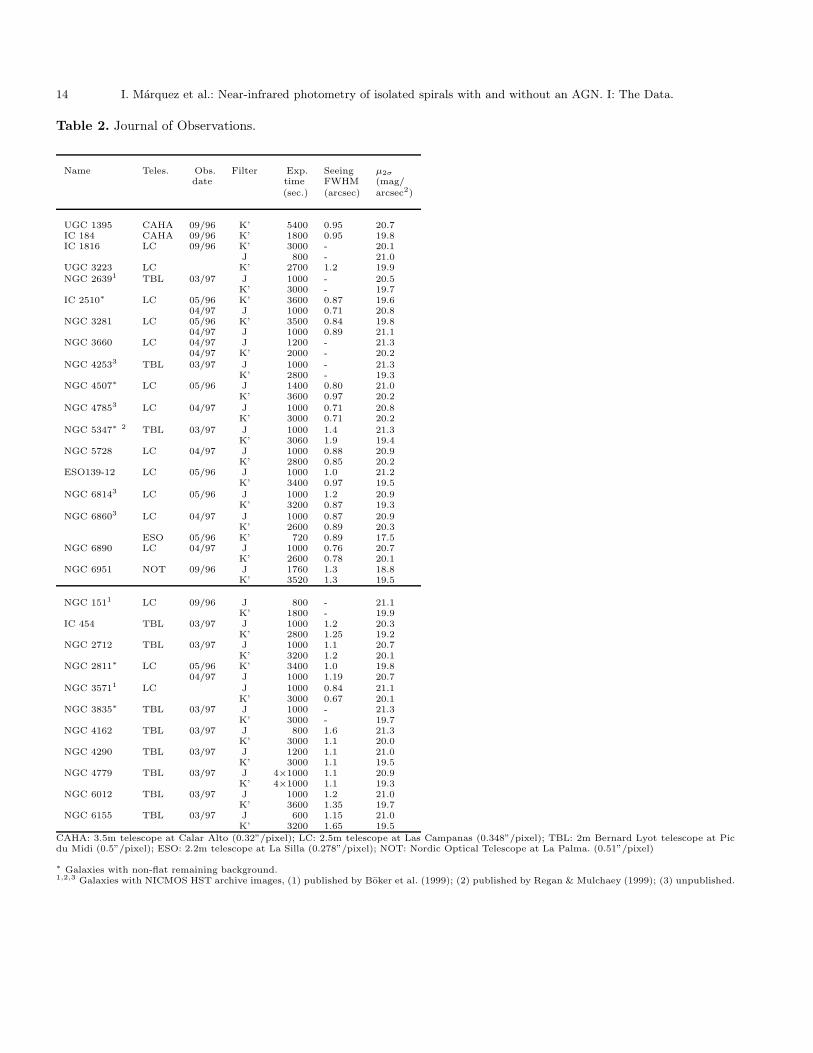
We have obtained K’ images for the 18 active galaxiestogether with J images for 15 of them. J and K’ im-ages were taken for 11 non-active spirals. The infrareddata have been acquired mainly with three telescopes:the 2m Telescope Bernard Lyot (Pic du Midi Observa-tory, France), the 2.5m DuPont telescope (Las Campanas,Chile), and the 3.5m telescope at Calar Alto (Spain). Wehave also used some short observations taken with theESO 2.2m telescope in La Silla for the relative calibrationof one of the J images obtained during a non-photometricnight. The journal of observations is presented in Table 2.We always used NICMOS-3 256×256 detectors; the pixelscales are given in Table 2.
As seen in Table 1, there are some galaxies with ex-tended angular sizes close to 2 arcmin or even larger, whichdo not fit in a single frame. For two of them, namely NGC4779 and NGC 6951, a mosaic of images was performedin order to have images for the entire galaxy disk.
The data reduction and calibration was performed, fol-lowing the standard procedures with the IRAF3 software
3 IRAF is the Image Analysis and Reduction Facitily madeavailable to the astronomical community by the National Op-tical Astronomy Observatories, which are operated by the As-sociation of Universities for Research in Astronomy (AURA),Inc., under contract with the U.S. National Science Founda-tion.
I. Marquez et al.: Near-infrared photometry of isolated spirals with and without an AGN. I: The Data. 3
and SQIID package. For the objects, exposures of typicallyabout 2 minutes (dithered in short exposures of about 20sin J and 50s in K’ offset by about 2-3 arcsec) were takenon the source and on the sky, until the total integrationtime was achieved (see Table 2). A median dark frame wascalculated for every night with the same exposure timethan that of the objects by using the corresponding darkframes obtained before and after the observations. Flat-field frames were obtained for each filter by subtractingthe median dark frame from the sky frames, normaliz-ing the resulting frames and calculating the median. Wethen subtracted the dark frame from the object frame, di-vided by the normalized flat-field and subtracted the cor-responding sky frame. Sometimes, another constant hadto be subtracted in order to attain the zero backgroundlevel. In order to align the resulting frames to better thana pixel fraction we used the non-saturated stars in theseframes or, when there were no stars, we used the centre ofthe galaxy. For the flux calibration a number of standardstars were observed and mean extinction coefficients wereapplied (kJ and kK′ in magnitudes airmass−1 are respec-tively 0.12 and 0.08 for Las Campanas and La Silla, 0.12and 0.10 for the TBL, 0.057 and 0.042 for the NOT andkK′=0.1 for Calar Alto). The error level on the standardstars amount to 10%. In column 7 of Table 2 we give theisophotal magnitude/arcsec2 corresponding to 2σ of thebackground.
We have retrieved HST calibrated infrared images ob-tained with NICMOS (filter F160W) for the eight galaxiesfor which such data was available (see column 1 in Table2).
4. Methods of analysis
4.1. Morphological features
K’ images of the galaxies in grey scale with isocontoursoverlaid are shown if in Figs. 1a-28a. All figures are onlyavailable in electronic form.
In order to detect the presence of features showing adeparture from radial symmetry such as bars and spiralarms, we have used a masking technique. We filtered theoriginal images with a box of 2-3 times the FWHM ofthe seeing (median filter) and divided the observed imageby the filtered one. The resulting images (hereafter calledthe sharp-divided images to differenciate them from thoseobtained by subtraction, i.e. the so-called unsharp mask-ing technique) are shown in Figs. 1b-28b. This technique isvery well suited to trace asymmetries in the light distribu-tion, such as bars, spiral arms, dust lanes, rings; it allowsthe subtraction of the diffuse background in a very con-venient way to look for subtle, small-scale variations anddiscuss the possible presence of both dust extinguishedand more luminous regions (Sofue et al. 1994; Marquez &Moles 1996; Marquez et al. 1996; Erwin & Sparke 1999;Laine et al. 1999).
The presence of bars can be determined quantitativelyby studying the behaviour of isophotal position angles(PAs) and ellipticities (ǫs): a bar is characterized by alocal maximum in the ǫ corresponding to a constant PA(Wozniak et al. 1995; Friedli et al. 1996; Jungwiert etal. 1997). Therefore, we have fit ellipses to the isophotes(Jedrzejewski 1987) with the IRAF ellipse task in sts-das.analysis.isophote, allowing the center, PA and ǫ tovary from one isophote to the next. Foreground stars havebeen masked out. The resulting parameters allow the re-construction of a model galaxy. The difference betweenthe original image and the model (hereafter called the di-fference images) are particularly useful to trace all thefeatures that cannot be described with ellipses, as spiralarms and boxy or peanut-like components. They are givenin Figs. 1c-28c and discussed separately for each galaxy.When the PA suddenly changes from one isophote to thenext, the model cannot work for the regions left inside (seeFigs. 1c, 8c, 9c, 11c, 12c, 15c, 18c, 19c, 25c and 26c).
4.2. Surface photometry and photometric decomposition
The major axis PA (counted anticlockwise from north toeast as usual) and ǫ from the ellipse fitting are drawnas a function of the ellipse semi-major axis (therefore, inradius) in Figs. 1e-28e.
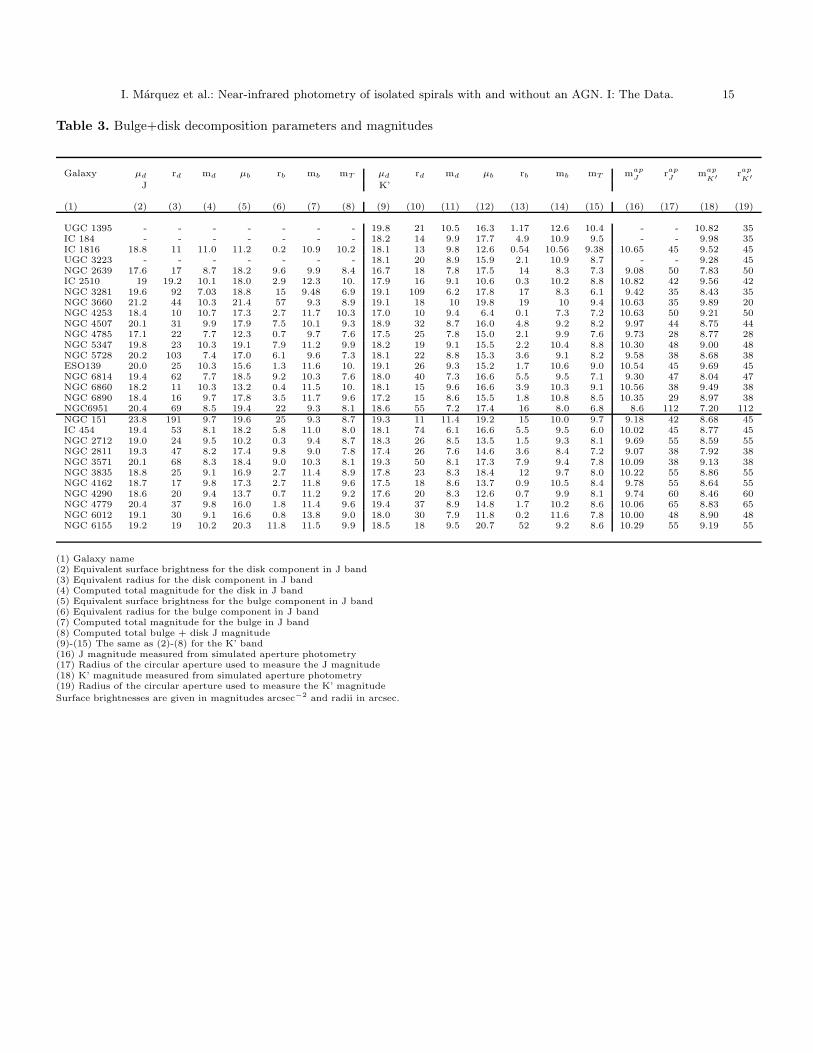
In Figs. 1f-28f the surface brightness profiles (isopho-tal magnitude fit to the ellipse versus ellipse semi-majoraxis) are given for K’ and J. We have used the 1-D result-ing profiles to obtain the bulge and disk contributions. Wehave fit an exponential to the outermost region (the disk),subtracted it to the observed profile and fit a r1/4 law (thebulge) to the residual; this calculation was continued un-til convergence was achieved (see Marquez & Moles 1996,1999). The resulting bulge and disk parameters are givenin Table 3. The surface brightness profiles in J and K’ areplotted in Figs. 1f-28f with the bulge, disk and bulge+diskfits superimposed. The corresponding residuals are shownin Figs. 1g-28g. Since residual background subtraction isthe biggest source of error in determining the profiles (seefor instance de Jong 1996), we caution the reader that inthe cases where the galaxy occupies most of the frame andthe residual background level could only be determined invery small regions, the error in the profiles can reach 15-20%. Otherwise, residuals are in general smaller than 20%,except in the bar and spiral arm regions.
4.3. Color images and color gradients
For galaxies for which a J band image is also available,we display in Figs. 1d-28d the ratio of the J to K’ images(after background subtraction), median filtered by 3×3pixels in order to enhance the S/N of the outer regions.Color images will allow a more complete description ofthe previously detected morphological features in terms ofthe contribution of dust and/or star forming events. We
4 I. Marquez et al.: Near-infrared photometry of isolated spirals with and without an AGN. I: The Data.
note that in the cases where the background is not flat,somewhat structured color images are obtained (galaxieswith non-flat remaining backgrounds are indicated withan asterisk in column 1 of Table 2).
Magnitudes integrated in circular apertures and J-K’color gradients were obtained from the curves of growth asin Marquez & Moles (1996). The apertures and the corre-sponding magnitudes are given in Table 3. Color gradientsare shown in Figs. 1h-28h for galaxies for which we havedata in the two bands. The background subtraction wasdone as described above and the same caveat applies, inthe sense that some color gradient could be artificiallyproduced for the galaxies with non-flat backgrounds.
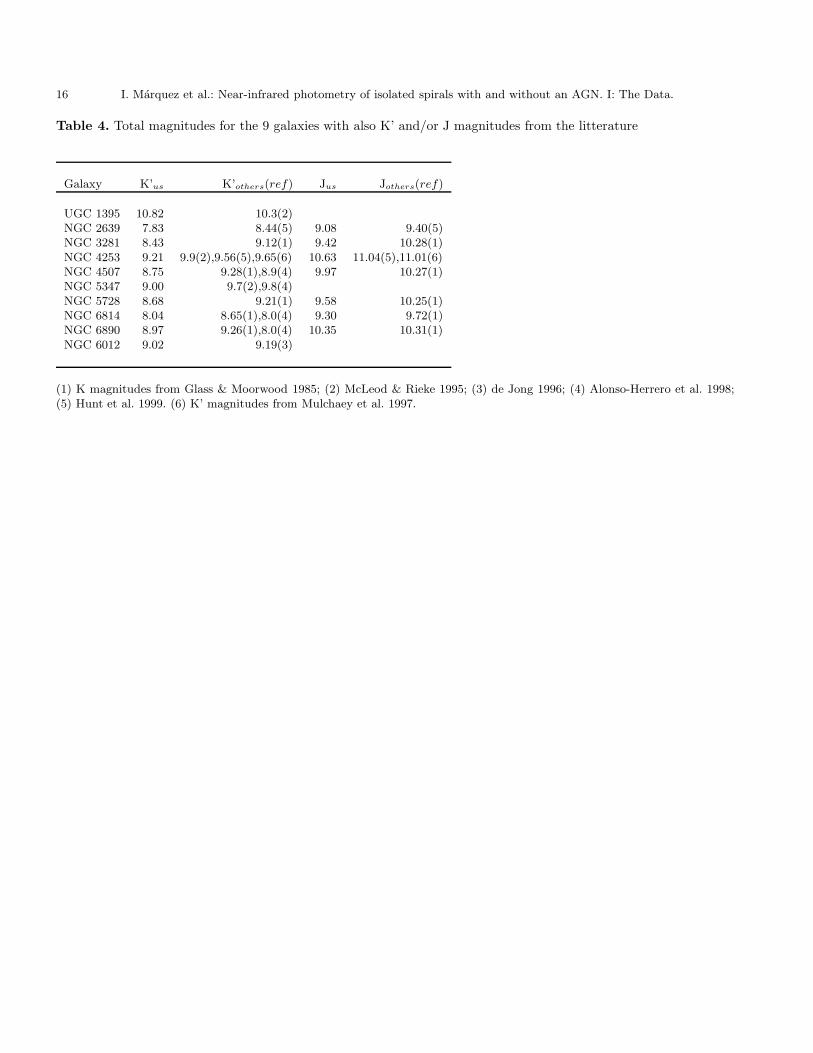
In Table 4 we give the magnitudes that we measurefor 9 galaxies, together with J, K’ and/or K magnitudesfound in the literature. A straightforward comparison be-tween our J values and those reported in previous works(for the same apertures) gives: Jus− Jother = −0.42±0.25.Only 4 galaxies in our sample have been observed in K’by Mulchaey et al. (1997); we find: K’us− K’Mulchaey =0.015 ± 0.63. If we exclude NGC 6890 (see section 5.17)we obtain: K’us− K’Mulchaey = −0.30 ± 0.36. For 10galaxies and a total of 12 measurements, we find: K’us−
Kother = −0.42 ± 0.32. This value is comparable to thedifference between K’Mulchaey and Kother (−0.55 ± 0.49).These differences in the zero points are not critical for ourpurposes and will not be discussed further. In any case,we notice that the differences in the colour indexes J-K’are within the errors.
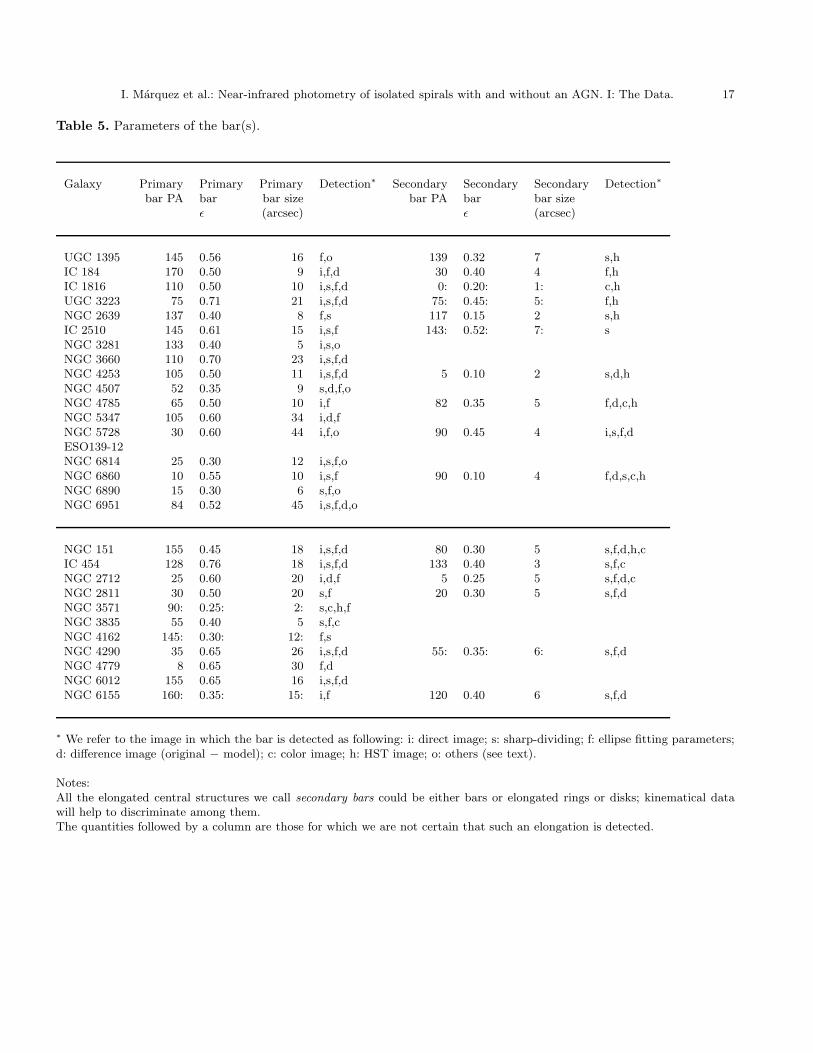
In Table 5 we give the parameters we determine forprimary and secondary bars 4 in the sample galaxies. Wespecify what of the methods above have been used to de-tect the presence of secondary bars (or primary bars whendetected for the first time), and if evidences are found inavailable HST images. We note that, excepting the sec-ondary bar of IC 2510, only seen in the sharp-divided im-age (just marginally in the PA-ǫ plot), the secondary barsare obtained in at least two methods.
5. Description of individual active galaxies.
5.1. UGC 1395
The K’ image in Fig. 1a shows an extended bulge fromwhich two spiral arms originate. A small elongation is seenin the center, that could be due to the presence of a smallbar (see below). Although this galaxy is classified as S(rs)bin the RC3, McLeod & Rieke (1995) already reported thepresence of a bar with a 16 arcsec radius, PA=145◦ andǫ=0.5 from their K image. It doesn’t show up in our sharp-divided image in Fig. 1b, but is clearly detected in the plotof ǫ and PA with radius (Fig. 1e) which is in agreementwith Peletier et al. (1999). The parameters we deduce for
4 we note that all the elongated central structures we callsecondary bars could be either bars or elongated rings or disks;kinematical data will help to discriminate among them.
the bar from that plot are very similar to those reportedby McLeod & Rieke (1995).
The sharp-divided image reveals the presence of asmall bar, extending along PA = 139◦, up to 7 arcsecfrom the center. It is not detected in the PA and ǫ plotas it is too weak to be apparent. Other evidence for thisnuclear bar is the curved dust pattern that surrounds thevery central region in the broad band HST image (filterF606W) by Malkan et al. (1998).
The difference image in Fig. 1c shows that the overallfit is good except in the region where the arm contributionis important. The surface brightness profile (in agreementwith that of McLeod & Rieke) is well fit by a bulge+diskmodel, except in the zone where the arm contribution isimportant (Figs. 1f and 1g).
5.2. IC 184
This galaxy shows rotation of the PA and twisting of theisophotes in the central region. Evidence for the existenceof a bar inside the primary bar is presented in Figs. 2band 2e, where ǫ shows two maxima for a rather constantPA. The inner bar is also evident in the broad band HSTimage by Malkan et al. (1998). The region connecting thetwo bars is visible in Fig. 2b as a thin curved elongationstarting at the end of the inner (thicker) bar.
The difference image in Fig. 2c shows the two nestedbars as well as the region where the spiral arms begin; thespiral arm to the north is much brighter than its southerncounterpart. Due to the bars and arms, the residuals arehigh except in the very outer zones (Fig. 2g), and the bulge+ disk fit is not very good (Fig. 2f).
5.3. IC 1816
A big bar (Fig. 3e) and three spiral arms are detected,among which the north west arm is the brightest and mostdetached (Fig. 3a). At large scales, the image has a some-what triangular shape. A small galaxy is seen 35 arcsec tothe south along PA=168◦, but no redshift is available forit.
The sharp-divided image (Fig. 3b) clearly reveals thebar, the ring, and the spiral arms. Note that the verycentral zone appears somewhat elongated.
The bar and arms are also clearly seen in the differenceimage (Fig. 3c), and except for the bar region the residualsare quite small (Fig. 3g). The bulge + disk model fits thedata very well except for the bar region (Fig. 3f).
The J/K’ image (Fig. 3d) has a rather smooth aspectexcept at the very center where a small, elongated struc-ture is seen, just in the direction traced by the offset dustlane in the broad band HST image by Malkan et al. (1998).It could be the signature of a nuclear bar within a 1 arc-second radius (see also Fig. 3e).
I. Marquez et al.: Near-infrared photometry of isolated spirals with and without an AGN. I: The Data. 5
5.4. UGC 3223
This is a classical barred SBa galaxy, with a very largebar (Figs. 4a and 4e). The sharp-divided image (Fig. 4b)clearly reveals the bar as well as the beginning of twospiral arms originating at both extremities of the bar.
The bulge + disk model fits well the observed pro-file except in the bar region (Fig. 4f), and except for this(large) region the residuals are very small (Fig. 4g). Thespiral arms appear most clearly in the difference image(Fig. 4c).
We find evidence for the presence of an inner bar in Fig.4e (see Table 5). In fact, an inner bar feature is evident inthe HST broad band image by Malkan et al. (1998), witha curved dust lane structure associated with it.
5.5. NGC 2639
This galaxy appears to be very regular at first sight (Fig.5a). However, the sharp-divided image (Fig. 5b) revealsthe presence of a fat primary bar, at variance with itsRSa(r) classification. We note that Fig. 5e shows a roughlyconstant PA value for the whole galaxy, precluding adefinitive quantification of the primary bar extension. Inany case, NGC 2639 has to be classified as barred (orlensed) on the basis of the IR images.
The difference image reveals the existence of two spiralarms, one to the north west and the other to the southeast, which splits into two arms (Fig. 5c). The surfacebrightness profile (in agreement with that by Moriondoet al. 1998) decomposition, specially in the K’ band (Fig.5f), implies very small residuals except in the lense andthe spiral arm region (Fig. 5g).
A red arc-like feature going from the SE spiral armnorthwards to the NW arm is visible in Fig. 5d, cor-responding to the presence of dust lanes which clearlyappear in the broad band HST image by Malkan et al.(1998). This would indicate the presence of a small cen-tral bar. An elongated ring-like structure from 9 to 18arcseconds in radius is seen in the Paα HST image byBoker et al. (1999), i.e., a ring just exterior to the bar.This small bar is further confirmed by the sharp-dividingmethod and the ellipse fitting applied to the HST H image(see Figs. 5e and 29).
5.6. IC 2510
The K’ band image shows a bar, spiral arms and a pseudo-ring (Fig. 6a). The spiral arm to the south is clearly vis-ible on the sharp-divided image (Fig. 6b), as well as asecondary bar.
The difference image (Fig. 6c) shows very distinctlythe spiral. This is the only case for which we detect asecondary bar only from one method. Moreover, primaryand secondary bars have almost the same PA. We there-fore quote the secondary bar as doubtful in Table 5.
The bulge + disk decomposition gives good results ex-cept in the bar region, specially in K’ (Figs. 6f and 6g).The J/K’ image remains quite constant (Figs. 6d and 6h).
5.7. NGC 3281
The K’ image (Fig. 7a) shows an elongated boxy bulgewith possible spiral arms coming out of it. This galaxy isclassified as non-barred in the RC3. However, the sharp-divided image (Fig. 7b) clearly shows the existence of aweak bar. The possible existence of a bar was alreadysuggested by Xanthopoulos (1996), on the basis of an Iband image. We also detect weak spiral arms in the sharp-divided image. Since these structures are weak, the PA isroughly constant throughout the galaxy (Fig. 7e); how-ever, they do induce a small bump in the surface bright-ness profiles (Fig. 7f).
The J/K’ image (Fig. 7d) shows that the (J-K’) colorindex is fainter in the nucleus, in the small spiral structurearound the nucleus, and in the region of the bar.
5.8. NGC 3660
A strong bar is seen in the K’ image of this galaxy (Fig.8a) but the ring is barely visible. On the other hand, boththe bar and ring appear clearly on the sharp-divided image(Fig. 8b).
The edges of the bar can also be seen in the differ-ence image (Fig. 8c); the bar parameters are determinedfrom Fig. 8e. ¿From an R image, Chapelon et al. (1999)give PA=116◦ out to 16 arcsec for the bar. This agreeswith Friedli et al. (1996) who show that bars are generallylonger in K than in R.
The J/K’ color image (Fig. 8d) shows a smooth struc-ture, increasingly red towards the center, and a steep cen-tral gradient (Fig. 8h). The bar region also appears red-der than the surroundings. The color map also shows clearhints of the existence of a small, red circumnuclear region.
Due to the large size of this galaxy, the bulge+diskdecomposition is not reliable (Fig. 8f), as confirmed bythe high residuals (Fig. 8g).
5.9. NGC 4253
This galaxy has a thick bar and a weak external ring (Fig.9a). Its nucleus is displaced relatively to the centroid ofthe outer isophotes. The bar parameters from Fig. 9e arein agreement with previous results in J (Alonso-Herreroet al. 1998) and K (McLeod & Rieke 1995; Peletier et al.1999). Note that this direction is also that of the stellarbar seen at optical wavelengths (Mulchaey & Wilson 1996,Mulchaey et al. 1996).
The sharp-divided image (Fig. 9b) reveals the presenceof a small structure, possibly a secondary bar, roughlyperpendicular to the main bar. This feature appears evenmore clearly on the difference image (Fig. 9c).
6 I. Marquez et al.: Near-infrared photometry of isolated spirals with and without an AGN. I: The Data.
The J/K’ image shows a double nuclear structure witha (J-K’) color index redder than the rest of the galaxy(Fig. 9d); this structure can explain the observed decen-tering. Notice that in the very central zone (r < 3 arcsec)ǫ is not the same in J and K (Fig. 9e). This feature seemsto correspond to that delineated by the dust pattern thatsurrounds the innermost 2 arcsec in the HST optical image(Malkan et al. 1998). Unfortunately, the nucleus is satu-rated in the infrared HST image, so we cannot analysethe presence of faint nuclear elongations. Nevertheless, acurved dust pattern feature with a radius of ≈4 arcsec canbe seen along the NE-SW direction (Fig. 30), favouring thepresence of a nuclear bar.
The profile is in good agreement with that given byMcLeod & Rieke (1995). The bulge+disk fit is quite sat-isfactory (Figs. 9f and 9g).
5.10. NGC 4507
The K’ image agrees with that of Mulchaey et al. (1997),and indeed shows no clear presence of a bar (Fig. 10a). Anoticeable curved dust lane to the SE reaching the inner-most 2 arcsec is visible in the HST image by Malkan etal. (1998).
The sharp-divided image (Fig. 10b) clearly shows a barthat is also apparent on the difference image (Fig. 10c).This bar had been already reported by Mulchaey et al.(1997) (r= 10.5 arcsec, PA=53◦ , ǫ=0.34).
ǫ and PA show strong variations at 18-20 arcsec fromthe nucleus, where the spiral arms begin (Fig. 10e) andproduce a small bump over the bulge+disk fit (Fig. 10f).The bar is also apparent as a small enhancement overthis fit. However, due to the relative weakness of the barand arms, the residuals remain small (Fig. 10g). The J/K’image is quite smooth except in the very nucleus, whichhas much redder colors (Fig. 10d) than the outer galaxy.
5.11. NGC 4785
This galaxy has a bright thick bar (Fig. 11a) and a com-plex spiral structure with several arms, including a thinarm to the south with several blobs. Note that the majoraxis orientation varies with radius in the central 14 arcsec(Fig. 11e).
The sharp-divided image reveals the presence of a ringand shows well the spiral arms (Fig. 11b). These featuresare also clearly visible in the difference image (Fig. 11c),where a small central bar seems to be present. The exis-tence of such a small bar is confirmed by the J/K image(Fig. 11d) and by the variations of ǫ and PA with ra-dius (Fig. 11e) both in ground based and HST images.The sharp-dividing method applied to the NICMOS HSTimage shows an inner elongation of ≈ 1.5 arcsec alongPA=109◦ (Fig. 31).
The colour image is quite constant except at the lo-cation of the arms and inner ring which appear redder inthe J/K’ color image (Figs. 11d and 11h).
5.12. NGC 5347
The K’ image of this galaxy only shows a large bar, therest of the structure being very smooth with hardly anyhint for the presence of spiral arms (Fig. 12a), in agree-ment with Mulchaey et al. (1997). Even the sharp-dividedimage shows no structure (Fig. 12b) except for the brightnucleus.
However, the extremities of the bar appear well inthe difference image (Fig. 12c), and the existence of abar is confirmed by the PA and ǫ variations both fromground based and HST images (Fig. 12e) (in agreementwith Mulchaey et al. 1997) and by the excess over thebulge+disk fit (Figs. 12f and 12g).
Surprisingly, the J/K’ image reveals a double structureseparated by ≈ 3 arcsec, resembling a double nucleus (Fig.12h). The close inspection of the color optical to near-infrared image by Regan & Mulchaey (1999), shows thatthis may result from the dust lane crossing the nucleus.
5.13. NGC 5728
This galaxy is larger than the size of our infrared images,so we will only present here the properties of the innerregions.
The K’ image clearly shows the presence of a small barwithin the large bar (Fig. 13a), both already reported byWozniak et al. (1995) in their BVRI images. The smallbar appears even more strongly in the sharp-divided im-age (Fig. 13b), where a small inner ring is also visible(r ≈ 4 arcsec, corresponding to the ring reported by Buta& Crocker 1993). The small bar and ring as well as the ex-tremities of the large bar are also visible in the differenceimage (Fig. 13c), while the nucleus and ring show weakerJ relative to K’ than the rest of the galaxy (Fig. 13d).
Two maxima of ǫ coupled with a constant PA (Fig.13e) allow to determine both primary and secondary barparameters (see also Shaw et al. 1993, Wozniak et al.1995).
Since we obviously do not reach the galaxy disk, thebulge+ disk fit cannot be fully correct (Figs. 13f and 13g).
5.14. ESO 139-12
This galaxy shows a very regular structure in the K’ band(Fig. 14a), with a luminous bulge and no bar. No structureappears either in the sharp-divided or difference images(Figs. 14b and 14c), and the J/K’ image appears to bevery smooth (Figs. 14d and h). A faint and quite curveddust lane is visible in the published HST image (Malkanet al. 1998) within the central 2 arcsec only.
I. Marquez et al.: Near-infrared photometry of isolated spirals with and without an AGN. I: The Data. 7
While ǫ does not vary much with radius, the PA doesvary strongly as the isophotes are seen to rotate (Fig. 14e),probably due to the effect of the flocculent spiral structure.
The bulge+disk fit is acceptable, with residuals smallerthan 20% throughout (Figs. 14f and 14g). The J/K’ im-age shows a red nuclear region, also visible in the colorgradient plot (Fig. 14h).
5.15. NGC 6814
This galaxy shows a beautiful spiral structure on the K’image, with spiral arms emerging from a thick bar (Fig.15a). Our image appears to be quite similar to that ofMulchaey et al. (1997).
The spiral structure is seen in the sharp-divided image,where the bar is traced as a faint elongation (Fig. 15b).The spiral structure is clearly observed in the differenceimage (Fig. 15c).
Except for the very nucleus, the J/K’ image remainsconstant throughout the galaxy, excepting the innermost2 arcsec, which are redder (Figs. 15d and 15h).
The bar parameters from (Fig. 15e) are in agreementwith Mulchaey et al. (1997). Note the strong and suddenchange of PA at the radius where the spiral arms begin.However the bulge+disk fit is very good (Figs. 15f and15g). The NICMOS HST image is saturated in the nu-cleus, so it cannot be used to gather information on thepresence of inner structures. The bar is seen as a thickelongated 10 arcsec structure along the NS direction inFig. 32.
5.16. NGC 6860
This galaxy has an asymmetrical bar along PA∼ 10◦, moreextended to the north than to the south (Fig. 16a). Thering is not apparent in the K’ image, where we barelydetect the beginning of a spiral arm north of the bar.
The bar in the sharp-divided image appears clearlybent (Fig. 16b), possibly due to the dynamical effects of asmall inner bar (Figs. 16b, 16c, 16d). The difference image(Fig. 16c) also evidences a faint spiral arm detaching fromthe southern end of the outer bar to the north east, and abrighter, tighter arm starting at the west end of the innerbar to the South. The variations of ǫ and PA with radius(Fig. 16e) hints on the presence of a secondary bar.
The J/K’ image confirms the existence of a small red-der inner bar (Fig. 16d), that is also evidenced by the dustlane structure in the HST image by Malkan et al. (1998).The main bar and the beginning of the spiral arms appearas bumps in the bulge+disk fit (Figs. 16f and 16g). Thecolor gradient is very steep in the central regions (Fig.16h).
5.17. NGC 6890
Despite its classification as a non-barred galaxy, the K’image of NGC 6890 reveals a strong bar (Figs. 17a ande), together with the beginning of two spiral arms at theextremities of the bar, the northern arm being brighterthan the southern one (Fig. 17b). These features are alsoapparent in the K’ image by Mulchaey et al. (1997), butthese authors give PA=179◦ corresponding to a radius r ≈14 arcsec, where the PA strongly decreases. However, theirplots of the PA and ǫ show that the bar actually extendsup to about 6 arcsec with PA ≈ 15◦, in agreement with ourvalues. We also note that, even considering the differencesin the photometry (see Table 4) the isophotal levels differby more than 6 magnitudes, those by Mulchaey et al. beingextremely bright and most probably incorrect.
The difference image reveals a beautiful spiral struc-ture as well as a possible inner ring (10-15 arcsec) (Fig.17c). This inner ring seems confirmed by the J/K’ im-age (Fig. 17d), where J appears to be somewhat largeraround the nucleus than in the very central region. No-tice a smooth decrease of J relative to K’ with increasingradius from 2 arcsec outwards (Fig. 17h). The NICMOSHST image shows spiraling structure reaching the centralarsecond, with some hints of dust at 0.5 arcsec (Fig. 33).
The bulge+disk fit is quite good except in the armregions (Figs. 17f and 17g).
5.18. NGC 6951
This is the first galaxy of our sample for which all the nec-essary data has been acquired (imaging and spectroscopy);it has been studied in detail by Perez et al. (1999) and willnot be presented here. We just note that no secondary baris detected even in NIR HST images.
6. Description of individual non active galaxies.
6.1. NGC 151
This galaxy is larger than the size of our infrared images,so we only present here the properties of the inner regions.
The K’ image shows a strong and broad bar, a diskystructure, a large ring, and a nuclear region roughly per-pendicular to the bar (Fig. 18a). Besides confirming thepresence of a weak ring, the sharp-divided image revealsthe existence of a small bar roughly perpendicular to thelarge bar (Fig. 18b). These features appear very clearlyin the difference image (Fig. 18c) and are quantified bylooking at the variations of ǫ and PA with radius (Fig.18e). The Paα image by Boker et al. (1999) shows thatthere is star formation ocurring at the ends of the bar andalong the ring. The sharp-masking method applied to theHST F160W image confirms the presence of the inner barwhich can be traced closer to the nucleus (r ≈ 2.5 arcsec,PA=68◦, Fig. 34).
8 I. Marquez et al.: Near-infrared photometry of isolated spirals with and without an AGN. I: The Data.
The J/K’ image shows a roughly circular redder regionof 7 arcsec radius (Fig. 18d); the inner bar is seen as aslightly redder elongation along PA≈ 90◦.
The bulge+disk fits are merely indicative since the im-age is too small to reach the disk (Fig. 18f). They showthe existence of the two bars.
6.2. IC 454
This galaxy has a particularly large bar, with the westarm more visible than the east one (Fig. 19a). The brightfeature at the north west end of the bar is most probablya superimposed star. The central region of the bar andthe west arm are clearly seen in the sharp-divided image(Fig. 19b), while the extremities of the bar appear morestrongly on the difference image (Fig. 19c). This illustratesthe fact that the sharp-dividing method is very well suitedto detect elongated features which do not always appearas clearly in the difference images (in the cases where theycan be nicely fit by ellipses). The PA and ǫ plots evidencethe presence of a secondary bar (see also Fig. 19c).
The J/K’ image and (J-K’) color gradient appear quiteconstant except in the bulge region and central bar where(J-K’) is redder (Figs. 19d and 19h). The bulge+disk fitis quite good except at the extremities of the bar (Figs.19f and 19g).
6.3. NGC 2712
This galaxy also has a very large bar, and well developedarms, the eastern being brighter than the western one(Fig. 20a). The sharp-divided image (Fig. 20b) reveals thepresence of a small bar within the large bar. This is con-firmed by the difference image (Fig. 20c), where the spiralarms are also apparent. The ǫ and PA variations allow toquantify the parameters for both bars (Figs. 20e and 20h).
The J/K’ image shows that the small bar is bluer,at variance with the other nuclear regions which all ap-pear redder in (J-K’) (Fig. 20e), including the surround-ing emission. The joint analysis with the optical data willallow a full interpretation of this result. This structure isalso visible in the color gradient, which remains constantfurther out (Fig. 20h).
The bulge+disk fit is obviously not good because ofthe strong bar and spiral arms (Figs. 20f and 20g).
6.4. NGC 2811
The entire galaxy almost fits in the K’ image, which hasa quite regular aspect, with no obvious bar or arms (Fig.21a). This image is very similar to that by Jungwiert etal. (1997) in the H band. On the other hand, the sharp-divided and difference images clearly reveal the presenceof a bar, a smaller bar and weak spiral arms (Figs. 21band 21c). The existence of two bars is confirmed by thevariations of ǫ and PA (Fig. 21e).
The J/K’ image is smooth, with a reddish bar anda blue surrounding ring (Fig. 21d). The bulge+disk fitsare satisfactory, with small residuals throughout (Figs. 21fand 21g).
6.5. NGC 3571
This galaxy does not fit entirely in the K’ frame. The K’image shows no evidence for a bar (Fig. 22a), but thesharp-divided image does show the existence of a smallthick bar (Fig. 22b). Due to its small size and relativeroundness, the bar cannot be detected either in the dif-ference image (Fig. 22c) nor in the ǫ and PA plots (Fig.22e). However, the ellipse fitting to the HST image evi-dences this structure as a clear elongation of ∼2 arcsecalong PA=90◦(Fig. 22e). This is confirmed by the HSTsharp-divided image (Fig. 35) derived from the Boker etal. (1999) data.
The J/K’ image is quite smooth, with the central re-gion somewhat redder than the outer zones (Fig. 22d).
The bulge+disk fits are quite good (Figs. 22e and 22f)even if we do not have an image of the entire galaxy (Fig.23h).
6.6. NGC 3835 (UGC 6703)
A thick bar and two spiral arms can be seen in the K’image (Fig. 23a) and even better in the sharp-divided im-age (Fig. 23b), while the difference image only shows thespiral arms clearly, but not the bar (Fig. 23c).
The characteristics of the bar can be seen in the vari-ations of ǫ and PA with radius (Fig. 23e).
The J/K’ image shows a small extension (4 arcsecin radius) along the east-west direction where the (J-K’)colour is bluer than for the rest of the galaxy (Fig. 23d).Better resolution images should be obtained in order to as-certain what causes the misalignment between this struc-ture in the color image and the inner bar.
Because of the presence of the spiral arms, thebulge+disk fits are not very good (Figs. 23f and 23g).
6.7. NGC 4162 (UGC 7193)
The K’ image of this galaxy is quite irregular (Fig. 24a);two arms with a flocculent appearance can be seen, but nobar. The sharp-divided image does not show any strongfeature (Fig. 24b). On the other hand, the difference im-age reveals a beautiful spiral structure (Fig. 24c), with acircumnuclear ring, three rather closed spiral arms start-ing from the ring towards the north and three other moreopen spiral arms also starting from the ring but towardsthe south (Fig. 24c).
The ǫ and PA variations with radius may reveal thepresence of a bar (Fig. 24e); however, this feature doesnot appear very clearly in these plots and we only have
I. Marquez et al.: Near-infrared photometry of isolated spirals with and without an AGN. I: The Data. 9
some hints of a small thick bar in Fig. 24b, so we cannotbe completely certain of its detection.
The bar and spiral arms appear in the bulge+disk fitsin J and K’ as bumps at about 12, 20 and 38 arcsec (Figs.24f and 24g). The J/K’ image is quite smooth, with (J-K’)somewhat redder at the center (Fig. 24d).
6.8. NGC 4290
The K’ image shows the bar, spiral arms and a large weakexternal ring (Fig. 25a); the central isophotes are twistedrelative to the bar. The sharp-divided image seems to showa small structure in the center at PA=90◦ (Fig. 25b);the bar and spiral arms are clearly seen. These structuresappear even more strongly in the difference image (Fig.25c). The ǫ and PA variations are also consistent with theexistence of two bars (Fig. 25e); however, it is difficult tosay if the small structure in the center is really a smallbar within the bar because it is thick and faint.
The bulge+disk fits are good except in the bar andspiral arm regions (Figs. 25f and 25g). The J/K’ imageand the color gradient are very smooth, with a slightlyredder nucleus (Figs. 25d and 25h).
6.9. NGC 4779
A mosaic of images was obtained for this galaxy, so ourdata really encompasses the entire object.
The K’ image shows a strong bar, and weak flocculentand asymmetric spiral structure (Fig. 26a), as confirmedby the sharp-divided image (Fig. 26b). The bar and be-ginning of the spiral arms appear more clearly on the dif-ference image (Fig. 26c). Chapelon et al. (1999) find a barwith PA=5◦ and r ≈ 16 arcsec. The bar that we measureis somewhat longer (Fig. 26e), in agreement with Friedliet al.’s (1996) result that bars are generally longer in Kthan in R (see also NGC 3660).
The J/K’ colour image is fairly smooth (Fig. 26d). Thebulge+disk fits clearly show the bar and spiral arm regions(Figs. 26f and 26g).
6.10. NGC 6012 (UGC 10083)
The K’ image shows a bar with somewhat peculiar sharpedges; no evidence either for spiral arms or for a ring isseen, in spite of the classification of this galaxy as RSBR2*(Fig. 27a). This image is consistent with the smaller oneobtained by de Jong & van der Kruit (1994). The peculiaraspect of the bar is confirmed by the sharp-divided anddifference images (Figs. 27b and 27c), where the bar seemsto be crossed by a dust lane. In this case, the bar wouldbe young and star formation should be observable alongit; we will therefore look for evidence for star formation inour spectra.
The difference image also shows evidence for brightspots towards the edges of the bar, specially towards the
north (Fig. 27c); although this could be a star superim-posed on the galaxy, the fact that there is a faint southerncounterpart tends to indicate that these regions may bothbe in the galaxy.
The variations of ǫ and PA with radius (Fig. 27e) givebar parameters in agreement with de Jong’s (1996) results.
The bulge+disk model fits the profiles very nicely ex-cept in the region of the bar and bright spots (Figs. 27fand 27g). The J/K’ image and color gradient are quitesmooth throughout the galaxy (Figs. 27d and 27h).
6.11. NGC 6155
A small bar is visible on the K’ image, together with aspiral arm starting northward and another one wrappedtowards the south east (Fig. 28a). Note that the center isdisplaced relatively to the centroid of the outer isophotes.
The bar and north spiral arm appear faintly on thesharp-divided image (Fig. 28b) and much more clearly onthe difference image (Fig. 28c). The variations of ǫ and PAwith radius (Fig. 28e) show that the bar reaches a radiusof 6 arcsec (PA=120◦). A larger bar may be present up to15 arcsec (PA=160◦); however, we cannot be certain thatit is a bar since the spiral arms seem to start at a smallerradial distance than the edges of this structure.
The bulge+disk model shows the strong contributionof the bar and spiral arms (Figs. 28f and 28g).
The J/K’ image is fairly smooth and becomes redderat the very center (Figs. 28d and 28h).
7. Summary
We have observed a sample of 29 isolated spiral galaxies:18 host an AGN (Seyfert 1 or Seyfert 2) and 11 are non-active galaxies. We present here the infrared data in the Jand K’ bands, as well as the image analysis. This includessharp-divided images obtained by dividing the observedimages by their filtered counterparts, difference images,obtained by fitting ellipses to the isophotes and subtract-ing such models to the observed images, and colour J/K’images. A bulge+disk model was fit to the image profiles,and the corresponding fit parameters are given.
Four (one) out of five (one) of the optically classifiednon-barred active (control) galaxies result to harbour abar. Three of them had already been described as barredgalaxies, as derived either from NIR (UGC 1395, whichalso has a secondary bar, and NGC 6890) or optical I(NGC 3281) analyses. The other two (NGC 2639 and NGC4162) are classified as barred for the first time. For 15 (9active, 6 control) out of 24 (14 active, 10 control) of theoptically classified barred galaxies (SB or SX) we find thata secondary bar (or a disk, a lense or an elongated ring;see table 5 for those cases for which the reported centralelongation remains uncertain) is present.
A discussion on the physical properties of these galax-ies, together with the comparison of the properties of ac-
10 I. Marquez et al.: Near-infrared photometry of isolated spirals with and without an AGN. I: The Data.
tive versus non-active galaxies derived from these data willbe presented in a forthcoming paper (Marquez et al., inpreparation).
Acknowledgements. I. Marquez acknowledges financial sup-port from the Spanish Ministerio de Educacion y Ciencia(EX94-8826734). This work is financed by DGICyT grantsPB93-0139 and PR95-329. We acknowledge financial sup-port from INSU-CNRS for several observing trips. Financialsupport to develop the present investigation has been ob-tained by the French-Spanish HF1996-0104 and HF1998-0052and the Chilean-Spanish bilateral agreement CSIC-CONICYT99CL0018.
We thank Ron Probst, who made available the SQIID pack-age for the reduction of infrared images within IRAF availableto us. This research has made use of the NASA/IPAC extra-galactic database (NED), which is operated by the Jet Propul-sion Laboratory under contract with the National Aeronauticsand Space Administration.
References
Alonso-Herrero A., Ward M.J., Kotilainen J., 1996, MNRAS278, 902
Alonso-Herrero A., Simpson C., Ward M.J., Wilson A.S., 1998,ApJ 495, 196
Boker T., Calzetti D., Sparks W. et al., 1999, astro-ph/9903307Buta R., Crocker D.A., 1993, AJ 105, 1344Chapelon S., Contini T., Davoust E., 1999, A&A 345, 81de Jong R.S, van der Kruit P.C., 1994, A&AS 106, 451de Jong R.S., 1996, A&AS 118, 557Erwin, P., Sparke, L. 1999, ApJL, in press (astro-ph/9906262)Friedli D., Wozniak H., Martinet L., Bratschi P., 1996, A&AS
118, 461Glass, I.S., Moorwood, A.F.M., 1985, MNRAS 214, 429Heckman, T.M., 1980, A&A 87, 142Hunt L.K., Malkan M.A., Rush B. et al., 1999, astro-
ph/9905066Jedrzejewski, R.I. 1987, MNRAS 226, 747Jungwiert B., Combes F., Axon D.J., 1997, A&AS 125, 479Laine S., Knapen J.H., Perez-Ramırez D., Doyon R., Nadeau
D., 1999, MNRAS 302, L33Maiolino R., Rieke G.H., 1995, ApJ 454, 95Malkan M.A., Gorjian V., Tam R., 1998, ApJS 117, 25Marquez I., Moles M., 1996, A&AS 120, 1Marquez I., Moles M., Masegosa, J., 1996, A&A 310, 401Marquez I., Moles M., 1999, A&A 344, 421McLeod K.K., Rieke G.H., 1995, ApJ 441, 96Moles M., Marquez I., Perez E., 1995, ApJ 438, 604Moriondo G., Giovanardi C., Hunt L.K., 1998, A&AS 130, 81Mulchaey J.S., Wilson A.S., 1996, ApJ 455, L17Mulchaey J.S., Wilson A.S., Tsvetanov Z., 1996, ApJS 102,
309Mulchaey J.S., Regan M.W., 1997, ApJL 482, L135Mulchaey J.S., Regan M.W., Kundu A., 1997, ApJS 110, 299Peletier R.F., Knapen J.H., Shlosman I. et al. 1999, astro-
ph/9905076Perez E., Marquez I., Marrero I. et al., 1999, A&A submittedRegan M.W., Mulchaey J.S., 1999, astro-ph/9902053 (AJ)Shaw M.A., Combes F., Axon D.J., Wright G.S., 1993, A&A
273, 31
Shlosman I., Frank J. and Begelman, M. 1989, Nature 338, 45Simkim S.M., Su H.J, Schwarz M.P., 1980, ApJ 237, 404Sofue Y., Yoshida S., Aoki T. et al., 1994, PASJ 46, 1Veron-Cetty M.P., Veron P., 1993, “A catalogue of Quasars
and Active Nuclei”, 6th Edition, ESO Scientific Report#13
Wozniak H., Friedli D., Martinet L., Martin P., Bratschi P.,1995, A&AS 111, 115
Xanthopoulos E., 1996, MNRAS 280, 6
I. Marquez et al.: Near-infrared photometry of isolated spirals with and without an AGN. I: The Data. 11
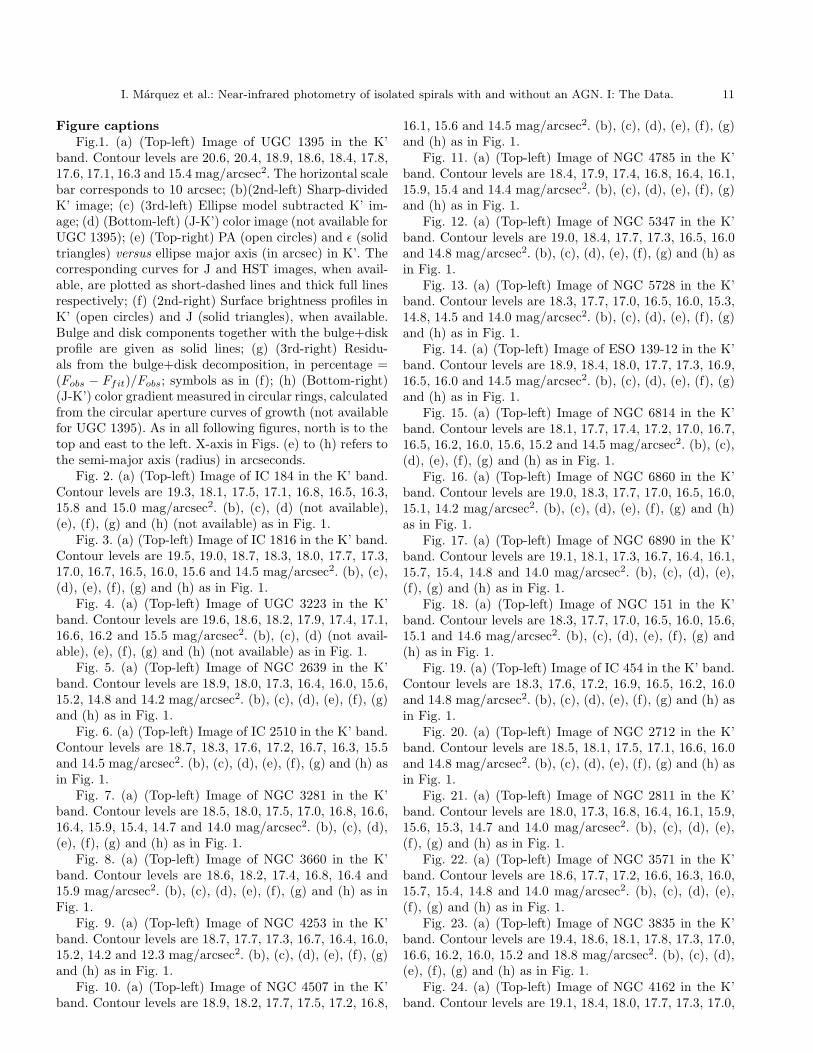
Figure captions
Fig.1. (a) (Top-left) Image of UGC 1395 in the K’band. Contour levels are 20.6, 20.4, 18.9, 18.6, 18.4, 17.8,17.6, 17.1, 16.3 and 15.4 mag/arcsec2. The horizontal scalebar corresponds to 10 arcsec; (b)(2nd-left) Sharp-dividedK’ image; (c) (3rd-left) Ellipse model subtracted K’ im-age; (d) (Bottom-left) (J-K’) color image (not available forUGC 1395); (e) (Top-right) PA (open circles) and ǫ (solidtriangles) versus ellipse major axis (in arcsec) in K’. Thecorresponding curves for J and HST images, when avail-able, are plotted as short-dashed lines and thick full linesrespectively; (f) (2nd-right) Surface brightness profiles inK’ (open circles) and J (solid triangles), when available.Bulge and disk components together with the bulge+diskprofile are given as solid lines; (g) (3rd-right) Residu-als from the bulge+disk decomposition, in percentage =(Fobs − Ffit)/Fobs; symbols as in (f); (h) (Bottom-right)(J-K’) color gradient measured in circular rings, calculatedfrom the circular aperture curves of growth (not availablefor UGC 1395). As in all following figures, north is to thetop and east to the left. X-axis in Figs. (e) to (h) refers tothe semi-major axis (radius) in arcseconds.
Fig. 2. (a) (Top-left) Image of IC 184 in the K’ band.Contour levels are 19.3, 18.1, 17.5, 17.1, 16.8, 16.5, 16.3,15.8 and 15.0 mag/arcsec2. (b), (c), (d) (not available),(e), (f), (g) and (h) (not available) as in Fig. 1.
Fig. 3. (a) (Top-left) Image of IC 1816 in the K’ band.Contour levels are 19.5, 19.0, 18.7, 18.3, 18.0, 17.7, 17.3,17.0, 16.7, 16.5, 16.0, 15.6 and 14.5 mag/arcsec2. (b), (c),(d), (e), (f), (g) and (h) as in Fig. 1.
Fig. 4. (a) (Top-left) Image of UGC 3223 in the K’band. Contour levels are 19.6, 18.6, 18.2, 17.9, 17.4, 17.1,16.6, 16.2 and 15.5 mag/arcsec2. (b), (c), (d) (not avail-able), (e), (f), (g) and (h) (not available) as in Fig. 1.
Fig. 5. (a) (Top-left) Image of NGC 2639 in the K’band. Contour levels are 18.9, 18.0, 17.3, 16.4, 16.0, 15.6,15.2, 14.8 and 14.2 mag/arcsec2. (b), (c), (d), (e), (f), (g)and (h) as in Fig. 1.
Fig. 6. (a) (Top-left) Image of IC 2510 in the K’ band.Contour levels are 18.7, 18.3, 17.6, 17.2, 16.7, 16.3, 15.5and 14.5 mag/arcsec2. (b), (c), (d), (e), (f), (g) and (h) asin Fig. 1.
Fig. 7. (a) (Top-left) Image of NGC 3281 in the K’band. Contour levels are 18.5, 18.0, 17.5, 17.0, 16.8, 16.6,16.4, 15.9, 15.4, 14.7 and 14.0 mag/arcsec2. (b), (c), (d),(e), (f), (g) and (h) as in Fig. 1.
Fig. 8. (a) (Top-left) Image of NGC 3660 in the K’band. Contour levels are 18.6, 18.2, 17.4, 16.8, 16.4 and15.9 mag/arcsec2. (b), (c), (d), (e), (f), (g) and (h) as inFig. 1.
Fig. 9. (a) (Top-left) Image of NGC 4253 in the K’band. Contour levels are 18.7, 17.7, 17.3, 16.7, 16.4, 16.0,15.2, 14.2 and 12.3 mag/arcsec2. (b), (c), (d), (e), (f), (g)and (h) as in Fig. 1.
Fig. 10. (a) (Top-left) Image of NGC 4507 in the K’band. Contour levels are 18.9, 18.2, 17.7, 17.5, 17.2, 16.8,
16.1, 15.6 and 14.5 mag/arcsec2. (b), (c), (d), (e), (f), (g)and (h) as in Fig. 1.
Fig. 11. (a) (Top-left) Image of NGC 4785 in the K’band. Contour levels are 18.4, 17.9, 17.4, 16.8, 16.4, 16.1,15.9, 15.4 and 14.4 mag/arcsec2. (b), (c), (d), (e), (f), (g)and (h) as in Fig. 1.
Fig. 12. (a) (Top-left) Image of NGC 5347 in the K’band. Contour levels are 19.0, 18.4, 17.7, 17.3, 16.5, 16.0and 14.8 mag/arcsec2. (b), (c), (d), (e), (f), (g) and (h) asin Fig. 1.
Fig. 13. (a) (Top-left) Image of NGC 5728 in the K’band. Contour levels are 18.3, 17.7, 17.0, 16.5, 16.0, 15.3,14.8, 14.5 and 14.0 mag/arcsec2. (b), (c), (d), (e), (f), (g)and (h) as in Fig. 1.
Fig. 14. (a) (Top-left) Image of ESO 139-12 in the K’band. Contour levels are 18.9, 18.4, 18.0, 17.7, 17.3, 16.9,16.5, 16.0 and 14.5 mag/arcsec2. (b), (c), (d), (e), (f), (g)and (h) as in Fig. 1.
Fig. 15. (a) (Top-left) Image of NGC 6814 in the K’band. Contour levels are 18.1, 17.7, 17.4, 17.2, 17.0, 16.7,16.5, 16.2, 16.0, 15.6, 15.2 and 14.5 mag/arcsec2. (b), (c),(d), (e), (f), (g) and (h) as in Fig. 1.
Fig. 16. (a) (Top-left) Image of NGC 6860 in the K’band. Contour levels are 19.0, 18.3, 17.7, 17.0, 16.5, 16.0,15.1, 14.2 mag/arcsec2. (b), (c), (d), (e), (f), (g) and (h)as in Fig. 1.
Fig. 17. (a) (Top-left) Image of NGC 6890 in the K’band. Contour levels are 19.1, 18.1, 17.3, 16.7, 16.4, 16.1,15.7, 15.4, 14.8 and 14.0 mag/arcsec2. (b), (c), (d), (e),(f), (g) and (h) as in Fig. 1.
Fig. 18. (a) (Top-left) Image of NGC 151 in the K’band. Contour levels are 18.3, 17.7, 17.0, 16.5, 16.0, 15.6,15.1 and 14.6 mag/arcsec2. (b), (c), (d), (e), (f), (g) and(h) as in Fig. 1.
Fig. 19. (a) (Top-left) Image of IC 454 in the K’ band.Contour levels are 18.3, 17.6, 17.2, 16.9, 16.5, 16.2, 16.0and 14.8 mag/arcsec2. (b), (c), (d), (e), (f), (g) and (h) asin Fig. 1.
Fig. 20. (a) (Top-left) Image of NGC 2712 in the K’band. Contour levels are 18.5, 18.1, 17.5, 17.1, 16.6, 16.0and 14.8 mag/arcsec2. (b), (c), (d), (e), (f), (g) and (h) asin Fig. 1.
Fig. 21. (a) (Top-left) Image of NGC 2811 in the K’band. Contour levels are 18.0, 17.3, 16.8, 16.4, 16.1, 15.9,15.6, 15.3, 14.7 and 14.0 mag/arcsec2. (b), (c), (d), (e),(f), (g) and (h) as in Fig. 1.
Fig. 22. (a) (Top-left) Image of NGC 3571 in the K’band. Contour levels are 18.6, 17.7, 17.2, 16.6, 16.3, 16.0,15.7, 15.4, 14.8 and 14.0 mag/arcsec2. (b), (c), (d), (e),(f), (g) and (h) as in Fig. 1.
Fig. 23. (a) (Top-left) Image of NGC 3835 in the K’band. Contour levels are 19.4, 18.6, 18.1, 17.8, 17.3, 17.0,16.6, 16.2, 16.0, 15.2 and 18.8 mag/arcsec2. (b), (c), (d),(e), (f), (g) and (h) as in Fig. 1.
Fig. 24. (a) (Top-left) Image of NGC 4162 in the K’band. Contour levels are 19.1, 18.4, 18.0, 17.7, 17.3, 17.0,
12 I. Marquez et al.: Near-infrared photometry of isolated spirals with and without an AGN. I: The Data.
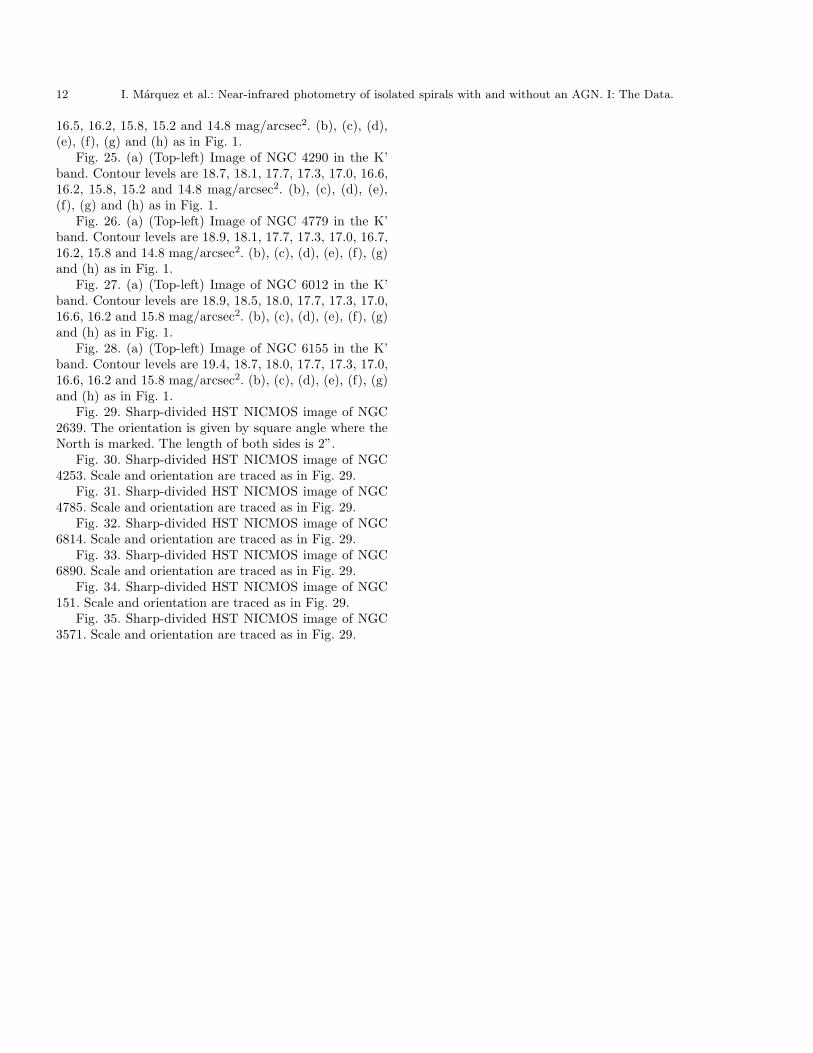
16.5, 16.2, 15.8, 15.2 and 14.8 mag/arcsec2. (b), (c), (d),(e), (f), (g) and (h) as in Fig. 1.
Fig. 25. (a) (Top-left) Image of NGC 4290 in the K’band. Contour levels are 18.7, 18.1, 17.7, 17.3, 17.0, 16.6,16.2, 15.8, 15.2 and 14.8 mag/arcsec2. (b), (c), (d), (e),(f), (g) and (h) as in Fig. 1.
Fig. 26. (a) (Top-left) Image of NGC 4779 in the K’band. Contour levels are 18.9, 18.1, 17.7, 17.3, 17.0, 16.7,16.2, 15.8 and 14.8 mag/arcsec2. (b), (c), (d), (e), (f), (g)and (h) as in Fig. 1.
Fig. 27. (a) (Top-left) Image of NGC 6012 in the K’band. Contour levels are 18.9, 18.5, 18.0, 17.7, 17.3, 17.0,16.6, 16.2 and 15.8 mag/arcsec2. (b), (c), (d), (e), (f), (g)and (h) as in Fig. 1.
Fig. 28. (a) (Top-left) Image of NGC 6155 in the K’band. Contour levels are 19.4, 18.7, 18.0, 17.7, 17.3, 17.0,16.6, 16.2 and 15.8 mag/arcsec2. (b), (c), (d), (e), (f), (g)and (h) as in Fig. 1.
Fig. 29. Sharp-divided HST NICMOS image of NGC2639. The orientation is given by square angle where theNorth is marked. The length of both sides is 2”.
Fig. 30. Sharp-divided HST NICMOS image of NGC4253. Scale and orientation are traced as in Fig. 29.
Fig. 31. Sharp-divided HST NICMOS image of NGC4785. Scale and orientation are traced as in Fig. 29.
Fig. 32. Sharp-divided HST NICMOS image of NGC6814. Scale and orientation are traced as in Fig. 29.
Fig. 33. Sharp-divided HST NICMOS image of NGC6890. Scale and orientation are traced as in Fig. 29.
Fig. 34. Sharp-divided HST NICMOS image of NGC151. Scale and orientation are traced as in Fig. 29.
Fig. 35. Sharp-divided HST NICMOS image of NGC3571. Scale and orientation are traced as in Fig. 29.
I. Marquez et al.: Near-infrared photometry of isolated spirals with and without an AGN. I: The Data. 13
Table 1. Data for the sample galaxies in the RC3 catalogue.
Name α(2000.0) δ(2000.0) PGC B D25 R25 PA cz t Seyfert(1) (2) (3) (4) (5) (6) (7) (8) (9) (10) (11)
Active galaxies
UGC 1395 01 55 22.2 +06 36 41 7164 14.18 1.10 0.10 — 5184 .SAT3.. 1IC 184 01 59 51.2 −06 50 28 7554 14.66 1.02 0.31 7 5400 .SBR1*. 2IC 1816 02 31 51.3 −36 40 17 9634 13.83 1.16 0.07 — 5086 .SBR2P? 1UGC 3223 04 59 09.4 +04 58 31 16482 13.83 1.15 0.25 80 4723 .SB.1.. 1NGC 2639 08 43 38.0 +50 12 24 24506 12.59 1.26 0.22 140 3198 RSAR1* 1IC 2510 09 47 43.2 −32 50 15 28147 14 1.10 0.27 148 2700 .SBT2*. 2NGC 3281 10 31 52.2 −34 51 27 31090 12.60 1.52 0.30 140 3439 .SAS2P* 2NGC 3660 11 23 32.3 −08 39 29 34980 15 1.43 0.09 115 3678 .SBR4.. 2NGC 4253 12 18 26.4 +29 48 48 39525 14.00 0.98 0.06 — 3819 PSBS1*. 2NGC 4507 12 35 37.1 −39 54 31 41960 12.78 1.22 0.10 — 3499 PSXT3.. 2NGC 4785 12 53 26.9 −48 44 58 43791 13.21 1.29 0.31 81 3735 PSBR3*. 2NGC 5347 13 53 18.6 +33 29 32 49342 13.16 1.23 0.10 130 2312 PSBT2.. 2NGC 5728 14 42 24.1 −17 15 12 52521 12.37 1.49 0.24 0 2885 .SXR1*. 1ESO139-12 17 37 39.5 −59 56 29 60594 13.59 1.20 0.11 35 5200 PSAT4P* 2NGC 6814 19 42 40.7 −10 19 25 63545 11.85 1.48 0.03 — 1509 .SXT4.. 1NGC 6860 20 08 46.2 −61 05 56 64166 13.68 1.13 0.25 34 4462 PSBR3.. 1NGC 6890 20 18 17.9 −44 48 25 64446 13.05 1.19 0.10 152 2471 .SAT3.. 2NGC 6951 20 37 15.2 +66 06 22 65086 11.91 1.59 0.08 170 1331 .SXT4.. 2
Non-active galaxies
NGC 151 00 34 02.8 −09 42 20 2035 12.23 1.57 0.34 75 3654 .SBR4..IC 454 06 51 06.6 +12 55 19 19725 − 1.24 0.28 140 3945 .SB.2..NGC 2712 08 59 31.2 +44 54 56 25248 12.38 1.46 0.26 178 1833 .SBR3*.NGC 2811 09 16 11.3 −16 18 47 26151 12.66 1.40 0.46 20 2514 .SBT1..NGC 3571 11 11 30.1 −18 17 19 34028 12.99 1.48 0.46 94 3571 PSXT1*.NGC 3835 11 44 05.6 +60 07 13 36493 13.20 1.29 0.39 60 2452 .SX.2*a/NGC 4162 12 11 51.8 +24 07 24 38851 12.55 1.37 0.22 174 2542 RSAT4..NGC 4290 12 20 48.4 +58 05 32 39859 12.66 1.37 0.16 90 3035 .SBT2*.NGC 4779 12 53 50.8 +09 42 33 43837 12.91 1.33 0.07 70 2793 .SBT4..NGC 6012 15 54 13.5 +14 36 08 56334 12.96 1.32 0.14 168 1988 RSBR2*.
NGC 6155 16 26 08.4 +48 21 58 58115 13.20 1.13 0.16 145 2429 .SXT..b
(1) Most common galaxy name;(2) and (3) α and δ coordinates (equinox 2000.0);(4) PGC number;(5) B magnitude;(6) isophotal diameter (at B=25 mag arcsec−2), D25, in units of log(0.1×a (arcmin));(7) axis ratio, R25 in units of log(a/b);(8) major axis position angle in degrees from N to E (when available);(9) velocity in km/s;(10) galaxy morphological type as given by the RC3, except for a (.S..2* in the RC3) and b (.S?... in the RC3), for which themorphological type is from Marquez & Moles (1996);(11) Seyfert activity class for active galaxies.The data in columns 5-9 were taken from the RC3.
14 I. Marquez et al.: Near-infrared photometry of isolated spirals with and without an AGN. I: The Data.
Table 2. Journal of Observations.
Name Teles. Obs. Filter Exp. Seeing µ2σ
date time FWHM (mag/(sec.) (arcsec) arcsec2)
UGC 1395 CAHA 09/96 K’ 5400 0.95 20.7IC 184 CAHA 09/96 K’ 1800 0.95 19.8IC 1816 LC 09/96 K’ 3000 - 20.1
J 800 - 21.0UGC 3223 LC K’ 2700 1.2 19.9NGC 26391 TBL 03/97 J 1000 - 20.5
K’ 3000 - 19.7IC 2510∗ LC 05/96 K’ 3600 0.87 19.6
04/97 J 1000 0.71 20.8NGC 3281 LC 05/96 K’ 3500 0.84 19.8
04/97 J 1000 0.89 21.1NGC 3660 LC 04/97 J 1200 - 21.3
04/97 K’ 2000 - 20.2NGC 42533 TBL 03/97 J 1000 - 21.3
K’ 2800 - 19.3NGC 4507∗ LC 05/96 J 1400 0.80 21.0
K’ 3600 0.97 20.2NGC 47853 LC 04/97 J 1000 0.71 20.8
K’ 3000 0.71 20.2NGC 5347∗ 2 TBL 03/97 J 1000 1.4 21.3
K’ 3060 1.9 19.4NGC 5728 LC 04/97 J 1000 0.88 20.9
K’ 2800 0.85 20.2ESO139-12 LC 05/96 J 1000 1.0 21.2
K’ 3400 0.97 19.5NGC 68143 LC 05/96 J 1000 1.2 20.9
K’ 3200 0.87 19.3NGC 68603 LC 04/97 J 1000 0.87 20.9
K’ 2600 0.89 20.3ESO 05/96 K’ 720 0.89 17.5
NGC 6890 LC 04/97 J 1000 0.76 20.7K’ 2600 0.78 20.1
NGC 6951 NOT 09/96 J 1760 1.3 18.8K’ 3520 1.3 19.5
NGC 1511 LC 09/96 J 800 - 21.1K’ 1800 - 19.9
IC 454 TBL 03/97 J 1000 1.2 20.3K’ 2800 1.25 19.2
NGC 2712 TBL 03/97 J 1000 1.1 20.7K’ 3200 1.2 20.1
NGC 2811∗ LC 05/96 K’ 3400 1.0 19.804/97 J 1000 1.19 20.7
NGC 35711 LC J 1000 0.84 21.1K’ 3000 0.67 20.1
NGC 3835∗ TBL 03/97 J 1000 - 21.3K’ 3000 - 19.7
NGC 4162 TBL 03/97 J 800 1.6 21.3K’ 3000 1.1 20.0
NGC 4290 TBL 03/97 J 1200 1.1 21.0K’ 3000 1.1 19.5
NGC 4779 TBL 03/97 J 4×1000 1.1 20.9K’ 4×1000 1.1 19.3
NGC 6012 TBL 03/97 J 1000 1.2 21.0K’ 3600 1.35 19.7
NGC 6155 TBL 03/97 J 600 1.15 21.0K’ 3200 1.65 19.5
CAHA: 3.5m telescope at Calar Alto (0.32”/pixel); LC: 2.5m telescope at Las Campanas (0.348”/pixel); TBL: 2m Bernard Lyot telescope at Picdu Midi (0.5”/pixel); ESO: 2.2m telescope at La Silla (0.278”/pixel); NOT: Nordic Optical Telescope at La Palma. (0.51”/pixel)
∗ Galaxies with non-flat remaining background.1,2,3 Galaxies with NICMOS HST archive images, (1) published by Boker et al. (1999); (2) published by Regan & Mulchaey (1999); (3) unpublished.
I. Marquez et al.: Near-infrared photometry of isolated spirals with and without an AGN. I: The Data. 15
Table 3. Bulge+disk decomposition parameters and magnitudes
Galaxy µd rd md µb rb mb mT µd rd md µb rb mb mT map
Jrap
Jmap
K′rap
K′
J K’
(1) (2) (3) (4) (5) (6) (7) (8) (9) (10) (11) (12) (13) (14) (15) (16) (17) (18) (19)
UGC 1395 - - - - - - - 19.8 21 10.5 16.3 1.17 12.6 10.4 - - 10.82 35IC 184 - - - - - - - 18.2 14 9.9 17.7 4.9 10.9 9.5 - - 9.98 35IC 1816 18.8 11 11.0 11.2 0.2 10.9 10.2 18.1 13 9.8 12.6 0.54 10.56 9.38 10.65 45 9.52 45UGC 3223 - - - - - - - 18.1 20 8.9 15.9 2.1 10.9 8.7 - - 9.28 45NGC 2639 17.6 17 8.7 18.2 9.6 9.9 8.4 16.7 18 7.8 17.5 14 8.3 7.3 9.08 50 7.83 50IC 2510 19 19.2 10.1 18.0 2.9 12.3 10. 17.9 16 9.1 10.6 0.3 10.2 8.8 10.82 42 9.56 42NGC 3281 19.6 92 7.03 18.8 15 9.48 6.9 19.1 109 6.2 17.8 17 8.3 6.1 9.42 35 8.43 35NGC 3660 21.2 44 10.3 21.4 57 9.3 8.9 19.1 18 10 19.8 19 10 9.4 10.63 35 9.89 20NGC 4253 18.4 10 10.7 17.3 2.7 11.7 10.3 17.0 10 9.4 6.4 0.1 7.3 7.2 10.63 50 9.21 50NGC 4507 20.1 31 9.9 17.9 7.5 10.1 9.3 18.9 32 8.7 16.0 4.8 9.2 8.2 9.97 44 8.75 44NGC 4785 17.1 22 7.7 12.3 0.7 9.7 7.6 17.5 25 7.8 15.0 2.1 9.9 7.6 9.73 28 8.77 28NGC 5347 19.8 23 10.3 19.1 7.9 11.2 9.9 18.2 19 9.1 15.5 2.2 10.4 8.8 10.30 48 9.00 48NGC 5728 20.2 103 7.4 17.0 6.1 9.6 7.3 18.1 22 8.8 15.3 3.6 9.1 8.2 9.58 38 8.68 38ESO139 20.0 25 10.3 15.6 1.3 11.6 10. 19.1 26 9.3 15.2 1.7 10.6 9.0 10.54 45 9.69 45NGC 6814 19.4 62 7.7 18.5 9.2 10.3 7.6 18.0 40 7.3 16.6 5.5 9.5 7.1 9.30 47 8.04 47NGC 6860 18.2 11 10.3 13.2 0.4 11.5 10. 18.1 15 9.6 16.6 3.9 10.3 9.1 10.56 38 9.49 38NGC 6890 18.4 16 9.7 17.8 3.5 11.7 9.6 17.2 15 8.6 15.5 1.8 10.8 8.5 10.35 29 8.97 38NGC6951 20.4 69 8.5 19.4 22 9.3 8.1 18.6 55 7.2 17.4 16 8.0 6.8 8.6 112 7.20 112NGC 151 23.8 191 9.7 19.6 25 9.3 8.7 19.3 11 11.4 19.2 15 10.0 9.7 9.18 42 8.68 45IC 454 19.4 53 8.1 18.2 5.8 11.0 8.0 18.1 74 6.1 16.6 5.5 9.5 6.0 10.02 45 8.77 45NGC 2712 19.0 24 9.5 10.2 0.3 9.4 8.7 18.3 26 8.5 13.5 1.5 9.3 8.1 9.69 55 8.59 55NGC 2811 19.3 47 8.2 17.4 9.8 9.0 7.8 17.4 26 7.6 14.6 3.6 8.4 7.2 9.07 38 7.92 38NGC 3571 20.1 68 8.3 18.4 9.0 10.3 8.1 19.3 50 8.1 17.3 7.9 9.4 7.8 10.09 38 9.13 38NGC 3835 18.8 25 9.1 16.9 2.7 11.4 8.9 17.8 23 8.3 18.4 12 9.7 8.0 10.22 55 8.86 55NGC 4162 18.7 17 9.8 17.3 2.7 11.8 9.6 17.5 18 8.6 13.7 0.9 10.5 8.4 9.78 55 8.64 55NGC 4290 18.6 20 9.4 13.7 0.7 11.2 9.2 17.6 20 8.3 12.6 0.7 9.9 8.1 9.74 60 8.46 60NGC 4779 20.4 37 9.8 16.0 1.8 11.4 9.6 19.4 37 8.9 14.8 1.7 10.2 8.6 10.06 65 8.83 65NGC 6012 19.1 30 9.1 16.6 0.8 13.8 9.0 18.0 30 7.9 11.8 0.2 11.6 7.8 10.00 48 8.90 48NGC 6155 19.2 19 10.2 20.3 11.8 11.5 9.9 18.5 18 9.5 20.7 52 9.2 8.6 10.29 55 9.19 55
(1) Galaxy name(2) Equivalent surface brightness for the disk component in J band(3) Equivalent radius for the disk component in J band(4) Computed total magnitude for the disk in J band(5) Equivalent surface brightness for the bulge component in J band(6) Equivalent radius for the bulge component in J band(7) Computed total magnitude for the bulge in J band(8) Computed total bulge + disk J magnitude(9)-(15) The same as (2)-(8) for the K’ band(16) J magnitude measured from simulated aperture photometry(17) Radius of the circular aperture used to measure the J magnitude(18) K’ magnitude measured from simulated aperture photometry(19) Radius of the circular aperture used to measure the K’ magnitude
Surface brightnesses are given in magnitudes arcsec−2 and radii in arcsec.
16 I. Marquez et al.: Near-infrared photometry of isolated spirals with and without an AGN. I: The Data.
Table 4. Total magnitudes for the 9 galaxies with also K’ and/or J magnitudes from the litterature
Galaxy K’us K’others(ref) Jus Jothers(ref)
UGC 1395 10.82 10.3(2)NGC 2639 7.83 8.44(5) 9.08 9.40(5)NGC 3281 8.43 9.12(1) 9.42 10.28(1)NGC 4253 9.21 9.9(2),9.56(5),9.65(6) 10.63 11.04(5),11.01(6)NGC 4507 8.75 9.28(1),8.9(4) 9.97 10.27(1)NGC 5347 9.00 9.7(2),9.8(4)NGC 5728 8.68 9.21(1) 9.58 10.25(1)NGC 6814 8.04 8.65(1),8.0(4) 9.30 9.72(1)NGC 6890 8.97 9.26(1),8.0(4) 10.35 10.31(1)NGC 6012 9.02 9.19(3)
(1) K magnitudes from Glass & Moorwood 1985; (2) McLeod & Rieke 1995; (3) de Jong 1996; (4) Alonso-Herrero et al. 1998;(5) Hunt et al. 1999. (6) K’ magnitudes from Mulchaey et al. 1997.
I. Marquez et al.: Near-infrared photometry of isolated spirals with and without an AGN. I: The Data. 17
Table 5. Parameters of the bar(s).
Galaxy Primary Primary Primary Detection∗ Secondary Secondary Secondary Detection∗
bar PA bar bar size bar PA bar bar sizeǫ (arcsec) ǫ (arcsec)
UGC 1395 145 0.56 16 f,o 139 0.32 7 s,hIC 184 170 0.50 9 i,f,d 30 0.40 4 f,hIC 1816 110 0.50 10 i,s,f,d 0: 0.20: 1: c,hUGC 3223 75 0.71 21 i,s,f,d 75: 0.45: 5: f,hNGC 2639 137 0.40 8 f,s 117 0.15 2 s,hIC 2510 145 0.61 15 i,s,f 143: 0.52: 7: sNGC 3281 133 0.40 5 i,s,oNGC 3660 110 0.70 23 i,s,f,dNGC 4253 105 0.50 11 i,s,f,d 5 0.10 2 s,d,hNGC 4507 52 0.35 9 s,d,f,oNGC 4785 65 0.50 10 i,f 82 0.35 5 f,d,c,hNGC 5347 105 0.60 34 i,d,fNGC 5728 30 0.60 44 i,f,o 90 0.45 4 i,s,f,dESO139-12NGC 6814 25 0.30 12 i,s,f,oNGC 6860 10 0.55 10 i,s,f 90 0.10 4 f,d,s,c,hNGC 6890 15 0.30 6 s,f,oNGC 6951 84 0.52 45 i,s,f,d,o
NGC 151 155 0.45 18 i,s,f,d 80 0.30 5 s,f,d,h,cIC 454 128 0.76 18 i,s,f,d 133 0.40 3 s,f,cNGC 2712 25 0.60 20 i,d,f 5 0.25 5 s,f,d,cNGC 2811 30 0.50 20 s,f 20 0.30 5 s,f,dNGC 3571 90: 0.25: 2: s,c,h,fNGC 3835 55 0.40 5 s,f,cNGC 4162 145: 0.30: 12: f,sNGC 4290 35 0.65 26 i,s,f,d 55: 0.35: 6: s,f,dNGC 4779 8 0.65 30 f,dNGC 6012 155 0.65 16 i,s,f,dNGC 6155 160: 0.35: 15: i,f 120 0.40 6 s,f,d
∗ We refer to the image in which the bar is detected as following: i: direct image; s: sharp-dividing; f: ellipse fitting parameters;d: difference image (original − model); c: color image; h: HST image; o: others (see text).
Notes:All the elongated central structures we call secondary bars could be either bars or elongated rings or disks; kinematical datawill help to discriminate among them.The quantities followed by a column are those for which we are not certain that such an elongation is detected.

This figure "marquezf1.gif" is available in "gif" format from:
http://arxiv.org/ps/astro-ph/9909351v1

This figure "marquezf2.gif" is available in "gif" format from:
http://arxiv.org/ps/astro-ph/9909351v1

This figure "marquezf3.gif" is available in "gif" format from:
http://arxiv.org/ps/astro-ph/9909351v1

This figure "marquezf4.gif" is available in "gif" format from:
http://arxiv.org/ps/astro-ph/9909351v1

This figure "marquezf5.gif" is available in "gif" format from:
http://arxiv.org/ps/astro-ph/9909351v1

This figure "marquezf6.gif" is available in "gif" format from:
http://arxiv.org/ps/astro-ph/9909351v1

This figure "marquezf7.gif" is available in "gif" format from:
http://arxiv.org/ps/astro-ph/9909351v1

This figure "marquezf8.gif" is available in "gif" format from:
http://arxiv.org/ps/astro-ph/9909351v1

This figure "marquezf9.gif" is available in "gif" format from:
http://arxiv.org/ps/astro-ph/9909351v1

This figure "marquezf10.gif" is available in "gif" format from:
http://arxiv.org/ps/astro-ph/9909351v1

This figure "marquezf11.gif" is available in "gif" format from:
http://arxiv.org/ps/astro-ph/9909351v1

This figure "marquezf12.gif" is available in "gif" format from:
http://arxiv.org/ps/astro-ph/9909351v1

This figure "marquezf13.gif" is available in "gif" format from:
http://arxiv.org/ps/astro-ph/9909351v1

This figure "marquezf14.gif" is available in "gif" format from:
http://arxiv.org/ps/astro-ph/9909351v1

This figure "marquezf15.gif" is available in "gif" format from:
http://arxiv.org/ps/astro-ph/9909351v1

This figure "marquezf16.gif" is available in "gif" format from:
http://arxiv.org/ps/astro-ph/9909351v1

This figure "marquezf17.gif" is available in "gif" format from:
http://arxiv.org/ps/astro-ph/9909351v1

This figure "marquezf18.gif" is available in "gif" format from:
http://arxiv.org/ps/astro-ph/9909351v1

This figure "marquezf19.gif" is available in "gif" format from:
http://arxiv.org/ps/astro-ph/9909351v1

This figure "marquezf20.gif" is available in "gif" format from:
http://arxiv.org/ps/astro-ph/9909351v1

This figure "marquezf21.gif" is available in "gif" format from:
http://arxiv.org/ps/astro-ph/9909351v1

This figure "marquezf22.gif" is available in "gif" format from:
http://arxiv.org/ps/astro-ph/9909351v1

This figure "marquezf23.gif" is available in "gif" format from:
http://arxiv.org/ps/astro-ph/9909351v1

This figure "marquezf24.gif" is available in "gif" format from:
http://arxiv.org/ps/astro-ph/9909351v1

This figure "marquezf25.gif" is available in "gif" format from:
http://arxiv.org/ps/astro-ph/9909351v1

This figure "marquezf26.gif" is available in "gif" format from:
http://arxiv.org/ps/astro-ph/9909351v1

This figure "marquezf27.gif" is available in "gif" format from:
http://arxiv.org/ps/astro-ph/9909351v1

This figure "marquezf28.gif" is available in "gif" format from:
http://arxiv.org/ps/astro-ph/9909351v1

This figure "marquezf29.gif" is available in "gif" format from:
http://arxiv.org/ps/astro-ph/9909351v1

This figure "marquezf30.gif" is available in "gif" format from:
http://arxiv.org/ps/astro-ph/9909351v1

This figure "marquezf31.gif" is available in "gif" format from:
http://arxiv.org/ps/astro-ph/9909351v1

This figure "marquezf32.gif" is available in "gif" format from:
http://arxiv.org/ps/astro-ph/9909351v1

This figure "marquezf33.gif" is available in "gif" format from:
http://arxiv.org/ps/astro-ph/9909351v1

This figure "marquezf34.gif" is available in "gif" format from:
http://arxiv.org/ps/astro-ph/9909351v1

This figure "marquezf35.gif" is available in "gif" format from:
http://arxiv.org/ps/astro-ph/9909351v1
Related Documents