University of South Florida Scholar Commons Graduate eses and Dissertations Graduate School 2007 Error equivalence theory for manufacturing process control Hui Wang University of South Florida Follow this and additional works at: hp://scholarcommons.usf.edu/etd Part of the American Studies Commons is Dissertation is brought to you for free and open access by the Graduate School at Scholar Commons. It has been accepted for inclusion in Graduate eses and Dissertations by an authorized administrator of Scholar Commons. For more information, please contact [email protected]. Scholar Commons Citation Wang, Hui, "Error equivalence theory for manufacturing process control" (2007). Graduate eses and Dissertations. hp://scholarcommons.usf.edu/etd/2403

Welcome message from author
This document is posted to help you gain knowledge. Please leave a comment to let me know what you think about it! Share it to your friends and learn new things together.
Transcript

University of South FloridaScholar Commons
Graduate Theses and Dissertations Graduate School
2007
Error equivalence theory for manufacturing processcontrolHui WangUniversity of South Florida
Follow this and additional works at: http://scholarcommons.usf.edu/etd
Part of the American Studies Commons
This Dissertation is brought to you for free and open access by the Graduate School at Scholar Commons. It has been accepted for inclusion inGraduate Theses and Dissertations by an authorized administrator of Scholar Commons. For more information, please [email protected].
Scholar Commons CitationWang, Hui, "Error equivalence theory for manufacturing process control" (2007). Graduate Theses and Dissertations.http://scholarcommons.usf.edu/etd/2403

Error Equivalence Theory for Manufacturing Process Control
by
Hui Wang
A dissertation submitted in partial fulfillment of the requirements for the degree of
Doctor of Philosophy Department of Industrial and Management Systems Engineering
College of Engineering University of South Florida
Major Professor: Qiang Huang, Ph.D. Shekhar Bhansali, Ph.D.
Tapas K. Das, Ph.D. Yuncheng You, Ph.D.
José L. Zayas-Castro, Ph.D.
Date of Approval: April 17, 2007
Keywords: error cancellation, process modeling, root cause identification, automatic process adjustment, statistical quality control
© Copyright 2007, Hui Wang

Dedication
To my parents.

Acknowledgements
I would like to express my sincere gratitude to Prof. Qiang Huang, my advisor,
for sharing his insightful ideas in research, for providing continual encouragement and
critical mentoring. Prof. Huang’s innovative ideas, broad and in-depth knowledge in
manufacturing and applied statistics have been a great inspiration to me. Without him, I
would not be able to accomplish what I have accomplished. Throughout my four-year
PhD studies, he has always been wholeheartedly supporting me to steer through countless
difficulties in all aspects of my life.
I want to thank my dissertation committee members, Prof. Tapas K. Das, Prof.
José Zayas-Castro, Prof. Shekhar Bhansali, and Prof. Yuncheng You for their valuable
suggestions and assistance. I wish to thank Prof. Louis Martin-Vega and Prof. A.N.V.
Rao for their constructive suggestions when they were my dissertation committee
members. I am also grateful to Dr. Reuven Katz from the University of Michigan for his
advice on clarifying several vague concepts in Chapter Two.
Special thanks are given to all other faculty members, Ms. Gloria Hanshaw, Ms.
Jackie Stephens, and Mr. Chris Paulus in the IMSE department for their kind help during
my Ph.D. studies.
In addition, I would like to express my sincere appreciation to my friends, Mr.
Shaoqiang Chen, Mr. Xi Zhang, Ms. Diana Prieto, Mr. Yang Tan, and other fellow IMSE
graduate students.
Finally, I am forever indebted to my wonderful parents Zulin Chen and Yongkang
Wang. I would have never finished this dissertation without their endless love,
encouragement and unconditional support. I owe them so much.

i
Table of Contents
List of Tables iii List of Figures iv Abstract vi Chapter 1 Introduction 1 1.1 Phenomena of Error Equivalence in Manufacturing Processes 2 1.2 Related Work and the State of the Arts 4 1.2.1 Research Review for Modeling Process Errors 4 1.2.2 Research Review for Process Root Cause Diagnosis 8
1.2.3 Research Review for Process Control 9 1.2.4 Summary of Literature Review 12
1.3 Dissertation Outline 13 Chapter 2 Error Equivalence Modeling and Variation Propagation Modeling Based on Error Equivalence 15 2.1 Preliminaries and Notations 16 2.2 Mathematical Modeling of the Error Equivalence Phenomenon in
Manufacturing 20 2.3 Error Equivalence Modeling for Machining Processes 22 2.3.1 Concept of Equivalent Fixture Error 22 2.3.2 Derivation of EFE Model 24 2.4 Variation Propagation Modeling Based on Error Equivalence for Multi-
Operation Machining Process 28 2.4.1 Background Review for Multi-Operational Manufacturing
Process 28 2.4.2 Variation Propagation Model Derivation 30 2.4.3 Discussion for Error Grouping in Machining Processes 35 2.5 EFE Validation and Modeling Demonstration 36 2.5.1 Experimental Validation of EFE 37 2.5.2 Multi-Operational Variation Propagation Modeling with Grouped EFEs 38 2.6 Summary 45 Chapter 3 Error Cancellation Modeling and Its Application in Process Control 47 3.1 Error Cancellation and Its Theoretical Implications 48 3.1.1 Diagnosability Analysis of Manufacturing Process with Error
Equivalence 49

ii
3.1.2 Sequential Root Cause Identification 50 3.1.3 Error-Canceling-Error Compensation Strategy 52 3.2 Applications of Error Cancellation in a Milling Process 55 3.2.1 Diagnosis Based on Error Equivalence 55 3.2.2 Error Compensation Simulation 60 3.3 Summary 62 Chapter 4 Dynamic Error Equivalence Modeling and In-Line Monitoring of
Dynamic Equivalent Fixture Errors 64 4.1 Introduction to Modeling of Dynamic Errors 66 4.2 Latent Variable Modeling of Machine Tool Dynamic Errors 67 4.2.1 Description of Data 67 4.2.2 Latent Variable Modeling of Machine Tool Dynamic Error 71 4.3 In-Line Monitoring of Dynamic Equivalent Errors of Machine Tool 78 4.4 Isolation of Lagged Variables and Sensors Responsible for the Out-of-
Control Signal 82 4.5 Summary 85 Chapter 5 Error Compensation Based on Dynamic Error Equivalence for
Reducing Dimensional Variation in Discrete Machining Processes 87 5.1 Automatic Process Adjustment Based on Error Equivalence Mechanism 88 5.2 SPC Integrated Process Adjustment Based on Error Equivalence 91 5.3 Simulation of Error Equivalence Process Adjustment 94 5.4 Adjustment Algorithm Evaluation 98 5.5 Summary 102 Chapter 6 Conclusions and Future Work 104 6.1 Conclusions 104 6.2 Future Work 106 References 107 Appendices 115
Appendix A: Infinitesimal Analysis of Workpiece Deviation Due to Fixture Errors 116
Appendix B: Proof for Proposition in Chapter 2 117 Appendix C: Proof for Corollary in Chapter 2 118 Appendix D: Determine Difference Order for D(q) 119 Appendix E: Screened Variables 120 Appendix F: Results of Partial Least Square Estimation 121 About the Author End Page

iii
List of Tables Table 2.1 Measurement Results (Under PCS0) 38 Table 2.2 Machined Features Specification 39 Table 2.3 Coordinates of Locating Points on the Primary Datum Surfaces
(Unit: mm) 39 Table 3.1 Measured Features (mm) 59 Table 3.2 Estimation of u for 5 Replicates (mm) 59 Table 3.3 Error Decomposition (mm) 60 Table A.1 First Order Difference 119 Table A.2 Second Order Difference 119 Table A.3 Screened Variables With Autoregressive Terms 120 Table A.4 Screened Variables without Autoregressive Terms 120 Table A.5 Percentage of Variance Explained by Latent Variables 121 Table A.6 Regression Coefficient B 121 Table A.7 Matrix W(PTW)-1 122 Table A.8 Scores for Points 10, 33, and 56 122

iv
List of Figures Figure 1.1 Error Equivalence in Machining 3 Figure 1.2 Error Equivalence in Assembly 3 Figure 1.3 The Framework of Error Equivalence Theory 14 Figure 2.1 Modeling of Part Feature Deviation 17 Figure 2.2 General 3-2-1 Locating Scheme and FCS0 18 Figure 2.3 Modeling of Workpiece Positioning Error 20 Figure 2.4 Mathematical Modeling of Error Equivalence 21 Figure 2.5 Equivalent Fixture Error 23 Figure 2.6 EFE Derivation 25 Figure 2.7 Non-Planar Datum Surfaces 26 Figure 2.8 Pin-Hole Locating Scheme 27 Figure 2.9 Model Derivation 30 Figure 2.10 Raw Workpiece and Locating Scheme (Unit: mm) 37 Figure 2.11 Workpiece and Locating 39 Figure 2.12 Two Cutting Operations 40 Figure 3.1 Error-Canceling-Error Strategy 53 Figure 3.2 Process Adjustment Using EFE Concept 53 Figure 3.3 Sequential Root Cause Identification Procedures 58 Figure 3.4 Error Compensation for Each Locator 60 Figure 3.5 Mean and Standard Deviation of Two Features 61

v
Figure 4.1 Thermal Sensor Locations on a Machine Tool 68 Figure 4.2 Machine Tool Temperature and Thermal Error Data 69 Figure 4.3 Stationarity Treatment 70 Figure 4.4 Equivalent Fixture Error of Fig. 4.2 75 Figure 4.5 Model Prediction and Residuals 78 Figure 4.6 Ellipse Format Chart 80 Figure 4.7 Control Ellipse for Future Observations 81 Figure 4.8 Standardized Scores in Points 10, 33, and 56 83 Figure 4.9 Lagged Variable Contributions to Score Component 2 84 Figure 4.10 Sensor Contributions to Score Component 2 85 Figure 5.1 Adjustment Based on Error Equivalence 94 Figure 5.2(a) Machine Tool Temperature and Error Data 95 Figure 5.2(b) Thermal Error Measurements 95 Figure 5.3 EFE Adjustment 97 Figure 5.4 Monitoring Thickness and Standard Deviation of Edge Length 98 Figure 5.5 Effect of Parameters Change in Process Adjustment Algorithm 101

vi
Error Equivalence Theory For Manufacturing Process Control
Hui Wang
ABSTRACT
Due to uncertainty in manufacturing processes, applied probability and statistics
have been widely applied for quality and productivity improvement. In spite of
significant achievements made in causality modeling for control of process variations,
there exists a lack of understanding on error equivalence phenomenon, which concerns
the mechanism that different error sources result in identical variation patterns on part
features. This so called error equivalence phenomenon could have dual effects on
dimensional control: significantly increasing the complexity of root cause identification,
and providing an opportunity to use one error source to counteract or compensate the
others.
Most of previous research has focused on analyses of individual errors, process
modeling of variation propagation, process diagnosis, reduction of sensing noise, and
error compensation for machine tool. This dissertation presents a mathematical
formulation of the error equivalence to achieve a better, insightful understanding, and
control of manufacturing process.
The first issue to be studied is mathematical modeling of the error equivalence
phenomenon in manufacturing to predict product variation. Using kinematic analysis and
analytical geometry, the research derives an error equivalence model that can transform

vii
different types of errors to the equivalent amount of one base error. A causal process
model is then developed to predict the joint impact of multiple process errors on product
features.
Second, error equivalence analysis is conducted for root cause identification.
Based on the error equivalence modeling, this study proposes a sequential root cause
identification procedure to detect and pinpoint the error sources. Comparing with the
conventional measurement strategy, the proposed sequential procedure identifies the
potential error sources more effectively.
Finally, an error-canceling-error compensation strategy with integration of
statistical quality control is proposed. A novel error compensation approach has been
proposed to compensate for process errors by controlling the base error. The adjustment
process and product quality will be monitored by quality control charts. Based on the
monitoring results, an updating scheme is developed to enhance the stability and
sensitivity of the compensation algorithm. These aspects constitute the “Error
Equivalence Theory”. The research will lead to new analytical tools and algorithms for
continuous variation reduction and quality improvement in manufacturing.

1
Chapter 1
Introduction
The intense global competition has been driving the manufacturers to
continuously improve quality in the life cycle of product design and manufacturing. Vital
to the competition success is the product variation reduction to achieve the continuous
manufacturing process improvement. However, variation reduction for the process
improvement has been an extremely challenging issue because of the following reasons:
Prediction of quality performance with process variation. Due to the uncertain nature
of the manufacturing process, probabilistic models and statistics have been widely
applied to depict the process variation. However, there exists a lack of understanding
on “error equivalence”, an engineering phenomenon concerning the mechanism that
multiple error sources result in the identical variation pattern. This fact impacts
almost every stage of variation control (e.g., process root cause diagnosis and error
compensation). Therefore, to better predict the process performance, error
equivalence has to be quantitatively modeled and analyzed.
Control of a varying process. Variation control strategies must be incorporated in the
early stage of manufacturing process design. The control strategy involves statistical
quality control (SQC), root cause identification and automatic process error
compensation to reduce potential large variations. The dual effects of error
equivalence on process control have not been well studied. For instance, the
phenomenon of error equivalence could conceal the information of multiple errors

2
and thus significantly increase the complexity of root cause identification (diagnosis).
It may provide an opportunity to purposely use one error source to counteract the
others and thereby reduce overall process variations. Hence, the inclusion of error
equivalence mechanism into quality control may create a new control paradigm of
manufacturing process, i.e., information collection in support of process diagnosis,
root cause identification, and SPC (statistical process control) integrated process error
compensation.
Therefore, the aforementioned issues entail an essential analysis of error
equivalence for process improvement. The goal of this work is to model the error
equivalence in traditional discrete manufacturing to achieve an insightful understanding
of process variation and a better process control.
1.1 Phenomena of Error Equivalence in Manufacturing Processes
In a manufacturing process, product quality can be affected by multiple error
sources. For example, the dominant root cause of quality problems in a machining
process includes fixture, datum, and machine tool errors. A fixture is a device used to
locate, clamp, and support a workpiece during machining, assembly, or inspection.
Fixture error is considered to be a significant fixture deviation of a locator from its
specified position. Machining datum surfaces are those part features that are in direct
contact with the fixture locators. Datum error is deemed to be the significant deviation of
datum surfaces and is mainly induced by imperfections in raw workpieces or faulty
operations in the previous stages. Together the fixture and datum surfaces provide a
reference system for accurate cutting operations using machine tools. Machine tool error

3
is modeled in terms of significant tool path deviations from its intended route. This
dissertation mainly focuses on kinematic aspects of these three error types.
A widely observed engineering phenomenon is that the individual error sources
can result in the identical variation patterns on product features in manufacturing process.
For instance, in a machining process, all aforementioned process deviations can generate
the same amount of feature deviation x as shown in Fig. 1.1 (Wang, Huang, and Katz,
2005; and Wang and Huang, 2006). This error equivalence phenomenon is also observed
in many other manufacturing processes, e.g., the automotive body assembly process (Fig.
1.2, Ding, et al., 2005).
Deviated tool path
Nominal tool path
(b) Machine process with machine tool error
(c) Machining process with datum error
(a) Machine process with fixture error
Nominal tool path
Deviated datumsurface
Fixture locator deviations
Deviated tool path
Nominal tool path
(b) Machine process with machine tool error
(c) Machining process with datum error
(a) Machine process with fixture error
Nominal tool path
Deviated datumsurface
Fixture locator deviations
x x
xx
xx
Δf
Δm
Δd
Deviated tool path
Nominal tool path
(b) Machine process with machine tool error
(c) Machining process with datum error
(a) Machine process with fixture error
Nominal tool path
Deviated datumsurface
Fixture locator deviations
Deviated tool path
Nominal tool path
(b) Machine process with machine tool error
(c) Machining process with datum error
(a) Machine process with fixture error
Nominal tool path
Deviated datumsurface
Fixture locator deviations
x x
xx
xx
Δf
Δm
ΔdPart 1 Part 2Part 1 Part 2
Part 1 Part 2Fixture deviation
Part 1 Part 2Part 1 Part 2Fixture deviation
Workpiece deviation or reorientation error
(a)
(b)
Figure 1.1 Error Equivalence in Machining Figure 1.2 Error Equivalence in Assembly
The impact of such an error equivalence phenomenon on manufacturing process
control is twofold. On the one hand, it significantly increases the complexity of variation
control. As an example, identifying the root causes becomes extremely challenging when
different error sources are able to produce the identical dimensional variations. On the
other hand, the error equivalence phenomenon provides an opportunity to purposely use
4
one error source to counteract another in order to reduce process variation. In both cases,
a fundamental understanding of this complex engineering phenomenon will assist to
improve manufacturing process control.
1.2 Related Work and the State of the Arts
The study on error equivalence is, however, very limited. Most related research
on process error modeling has been focused on the analysis of the individual error
sources, e.g., the fixture errors and machine tool errors, how these errors impact the
product quality, and thereby how to diagnose the errors and reduce variation by process
control. This section reviews the related research on process errors modeling, diagnosis
and control.
1.2.1 Research Review for Modeling Process Errors
Fixture error. Fixture error has been considered as one of crucial factors in the optimal
fixture design and analysis. Shawki and Abdel-Aal (1965) experimentally studied the
impact of fixture wear on the positional accuracy of the workpiece. Asada and By (1985)
proposed kinematic modeling, analysis, and characterization of adaptable fixturing.
Screw theory has been developed to estimate the locating accuracy under the rigid body
assumption (Ohwovoriole, 1981). Weil, Darel, and Laloum (1991) then developed
several optimization approaches to minimize the workpiece positioning errors. A robust
fixture design was proposed by Cai, Hu, and Yuan (1997) to minimize the positional
error. Marin and Ferreira (2003) analyzed the influence of dimensional locator errors on
tolerance allocation problem. Researchers also considered the geometry of datum surface
for the fixture design. Optimization of locating setup proposed by Weil, et al. (1991) was

5
based on the locally linearized part geometry. Choudhuri and De Meter (1999)
considered the contact geometry between the locators and workpiece to investigate the
impact of fixture locator tolerance scheme on geometric error of the feature.
Machine tool error. Machine tool error can be due to thermal effect, cutting force, and
geometric error of machine tool. Various approaches have been proposed for the machine
tool error modeling and compensation. The cutting process modeling has been focused on
the understanding of cutting forces, dynamics of machine tool structure, and surface
profile generation (Smith and Tlusty, 1991; Ehmann, et al., 1991; Kline, Devor, and
Shareef, 1982; Wu and Liu, 1985; Sutherland and DeVor, 1986; Altintas and Lee, 1998;
Kapoor, et al., 1998; Huang and Liang, 2005; Mann, et al., 2005; Li and Shin, 2006; and
Liu, et al., 2006). Machine volumetric error modeling studies the error of the relative
movement between the cutting tool and the ideal workpiece for error compensation or
machine design (Schultschik, 1977; Ferreira and Liu, 1986; Donmez, et al., 1986;
Anjanappa, et al., 1988; Bryan, 1990; Kurtoglu, 1990; Soons, Theuws, and Schellekens,
1992; Chen, et al., 1993; and Frey, Otto, and Pflager, 1997). A volumetric error model of
a 3-axis jig boring machine is developed by Schultschik (1977) using a vector chain
expression. Ferreira and Liu (1986) developed a model studying the geometric error of a
3-axis machine using homogeneous coordinate transformation. A general methodology
for modeling the multi-axis machine was developed by Soons, Theuws, and Schellekens
(1992). The volumetric error model combining geometric and thermal errors was
proposed to compensate for time varying error in real time (Chen, et al., 1993). Other
approaches, including empirical, trigonometric, and error matrix methods were
summarized by Ferreira and Liu (1986).

6
Machine tool thermal error. With the increasing demand for improved machining
accuracy in recent years, the problem of thermal deformation of machine tool structures
is becoming more critical than ever. In order to maintain part quality under various
thermal conditions, two approaches have been studied extensively over the past decades:
error avoidance approach and error compensation approach (Bryan, 1990). Thermal
errors could be reduced with structural improvement of machine tools through careful
design and manufacturing technology. This is known as the error avoidance approach.
However, there are, in many cases, cost or physical limitations to accuracy improvement
that cannot be overcome solely by production and design techniques. Recently, due to the
development of sensing, modeling, and computer techniques, the thermal error reduction
through real time machine tool error compensation has been increasingly considered, in
which the thermal error is modeled as a function of machine temperatures collected by
thermal sensors (Chen, et al., 1993).
For most thermal error compensation systems, the thermal errors are predicted
with temperature-error models. The effectiveness of thermal error compensation largely
relies on the accuracy of prediction of time varying thermal errors during machining.
Various thermal error modeling schemes have been reported in literature, which can be
classified into two categories: time independent static modeling and time dependent
dynamic modeling. The first category of studies, time independent static modeling,
assumes that thermal errors can be uniquely described by current machine tool
temperature measurements (Chen, et al., 1993; and Kurtoglu, 1990). It only considers the
statistical relationship between temperature measurements and thermal deformations,
while neglects the dynamic characteristics of machine thermoelastic systems.

7
Nevertheless, the information contained in the discrete temperature measurements, which
only catches a subset of the whole machine tool temperature field (Venugopal and Barash,
1986), is incomplete and therefore the problem is not uniquely defined. This motivates
the second category of studies for modeling the dynamic effects of thermal errors
(Moriwaki, et al., 1998) and the recent progress is to apply system identification (SI)
theory to thermal error modeling (Yang and Ni, 2003). Both these two categories of
studies reveal that the number of sensors, sensor location, temperature history, and lagged
variable selection are critical to achieve high model prediction accuracy and model
robustness to different working conditions.
As a summary, the studies of process errors have been focused on the modeling of
individual error sources, process variation monitoring, and variation reduction.
Equivalence relationship between multiple errors has not been sufficiently addressed.
Causality modeling. Models of predicting surface quality are often deterministic and used
for a single machining station (Li and Shin, 2006). In the recent decade, more research
can be found to investigate the causal relationship between part features and errors,
especially in a complex manufacturing system. The available model formulation includes
time series model (Lawless, Mackay, and Robinson, 1999), state space models (Jin and
Shi, 1999; Ding, Ceglarek, and Shi, 2000; Huang, Shi, and Yuan, 2003; Djurdjanovic and
Ni, 2001; Zhou, Huang, and Shi, 2003; and Huang and Shi, 2004), and state transition
model (Mantripragada and Whitney, 1999). The results of the process error model can be
summarized as follows. Denote by x the dimensional deviation of a workpiece of N
operations and by u=(u1, u2, …, up)T the multiple error sources from all operations. The
relationship between x and u can be represented by

8
x = =1Σ + = + ,pi i iΓ u ε Γu ε (1.1)
where Γi’s are sensitivity matrices determined by process and product design and
Γ= 1 2 p⎡ ⎤⎣ ⎦Γ Γ Γ . ε is the noise term. This line of research (Hu, 1997; Jin and Shi,
1999; Mantripragada and Whitney, 1999; Djurdjanovic and Ni, 2001; Camelio, Hu, and
Ceglarek, 2003; Agapiou, et al., 2003; Agapiou, et al., 2005; Zhou, et al., 2003; Huang,
Zhou, and Shi, 2002; Zhou, Huang, and Shi, 2003; Huang, Shi, and Yuan, 2003; and
Huang and Shi, 2004) provides a solid foundation for conducting further analysis of the
error equivalence.
1.2.2 Research Review for Process Root Cause Diagnosis
The approaches developed for root cause diagnosis include variation pattern
mapping (Ceglarek and Shi, 1996), variation estimation based on physical models (Apley
and Shi, 1998; Chang and Gossard, 1998; Ding, Ceglarek, and Shi, 2002; Zhou, et al.,
2003; Camelio and Hu, 2004; Carlson and Söderberg, 2003; Huang, Zhou, and Shi, 2002;
Huang and Shi, 2004; and Li and Zhou, 2006), and variation pattern extraction from
measurement data.
Ceglarek, Shi, and Wu (1994) developed root cause diagnostic algorithm for
autobody assembly line where fixture errors are dominant process faults. Principal
component analysis (PCA) has been applied to fixture error diagnosis by Hu and Wu
(1992), who make a physical interpretation of the principal components and thereby get
insightful understanding of root causes of process variation. Ceglarek and Shi (1996)
integrated PCA, fixture design, and pattern recognition and have achieved considerable
success in identifying problems resulting from worn, loose, or broken fixture elements in

9
the assembly process. However, this method cannot detect multiple fixture errors. A PCA
based diagnostic algorithm has also been proposed by Rong, Ceglarek, and Shi (2000).
Apley and Shi (1998) developed a diagnostic algorithm that is able to detect multiple
fixture faults occurring simultaneously. Their continuing work in 2001 presented a
statistical technique to diagnose root causes of process variability by using a causality
model. Ding, Ceglarek, and Shi (2002) derived a PCA based diagnostics from the state
space model.
However, the number of the simultaneous error patterns may grow significantly as
more manufacturing operations are involved. The multiple error patterns are rarely
orthogonal and they are difficult to distinguish from each other. Therefore, the
manufacturing process may not be diagnosable. Ding, Shi, and Ceglarek (2002) analyzed
the diagnosability of multistage manufacturing processes and applied the results to the
evaluation of sensor distribution strategy. Zhou, et al. (2003) developed a more general
framework for diagnosability analysis by considering aliasing faulty structures for
coupled errors in a partially diagnosable process. Further studies are needed on the fault
diagnosis for a general machining process where multiple types of errors occur.
1.2.3 Research Review for Process Control
The objective of process control is to keep the output as close as possible to the
target all the time. Other than the traditional SPC where Shewhart, EWMA, and CUSUM
control charts are the common techniques, automatic process control (APC) and its
integration with SPC have gained more attention in recent decades.

10
Automatic process control. APC uses feedback or feedforward control to counteract the
effects of root causes and reduce the process variation. Although SPC achieved great
success in discrete manufacturing, APC is more likely to be used in continuous process
industries where the process output has a tendency to drift away. The early research on
APC can be tracked back to Box’s early research (Box, 1957; Box and Jenkins 1963,
1970; Box and Draper, 1969; 1970; and Box and Kramer, 1992). In APC, the most
theoretically discussed control rule is the minimum mean squared error (MMSE) control.
It is based on the stochastic control theory (Åström, 1970) to find out the optimal control
rule to minimize the mean square error of the process output. However, since MMSE
control has unstable modes (Åström and Wittenmark, 1990; and Tsung, 2000), in some
occasions, it causes the process to adapt to the disturbance changes and causes larger
output response. In industries, proportional-integral-derivative (PID) control tuning is the
most common control technique (Åström, 1988). Its purpose is to reduce the output
variance as much as possible based on the PID controller. Compared with many MMSE
controllers, PID controller is more robust in varying environments.
Integration of APC and SPC. More recently, more research efforts are directed towards
the approach combining SPC and APC to secure both the process optimization and
quality improvement. MacGregor (1988) was among the first to suggest SPC charts to
monitor the controlled process. The similarities and overlap between SPC and APC were
described. The integration of APC and SPC has been reviewed by Box and Kramer
(1992). In these early dissertations, a minimum cost strategy is suggested to adjust the
process and SPC chart is used as dead bands or filtering device (English and Case, 1990)
for feedback controlled process. This dead band concept was extended for multivariate

11
problems by Del Castillo (1996). Vander Wiel, et al. (1992) proposed an algorithmic
statistical process control (ASPC), which reduces the process variation by APC and then
monitors the process to detect and remove root cause of variation using SPC. Tucker, et
al. (1993) elaborated on the ASPC by giving an overall philosophy, guidelines,
justification, and indicating related research issues.
Parallel to the integration work, research (MacGregor and Harris, 1997; Harris
and Ross, 1991) has been implemented for correcting SPC procedures due to the effect of
correlation and applying these procedures for monitoring a controlled process. Tsung
(2000) proposed an integrated approach to simultaneously monitor and diagnose
controlled process using dynamic principal component analysis and minimax distance
classifier.
In the early research of integrating APC and SPC, the only monitored variable is
the controlled output. Output monitoring alone cannot provide sufficient information on
the process change because it has been compensated for by controllers. MacGregor (1991)
suggested monitoring the output of the controller. Messina, et al. (1996) then considered
the monitoring controller output under an autoregressive moving average disturbance
process and proposed jointly monitoring for process output and controlled signal. Tsung,
et al. (1999) proposed a procedure for jointly monitoring the PID controlled output and
controlled signal using bivariate SPC. The SPC robustness was also investigated. In
addition, researchers also applied APC and SPC to run-to-run (RTR) process control,
which refers to performing control action between runs instead of during a run (Del
Castillo, 1996; Butler and Stefani, 1994; Mozumder, et al., 1994; Sachs, et al., 1995; and

12
Tsung and Shi, 1999). Del Castillo and Hurwitz (1997) reviewed research work on RTR
control.
Most of SPC integrated APC approaches have been mainly applied to continuous
process. The adjustment in discrete process relies on the control of servo motor,
interpolator and adaptive loop in the machine tools (Åström, 1970, 1990) or
compensation of individual error sources. Little work discussed the potential application
of APC in a discrete manufacturing process where the dominant control strategy is to
construct control chart to identify the assignable cause. There is a lack of methodology
that can compensate for the joint effect of multiple error sources.
1.2.4 Summary of Literature Review
Process modeling. Previous research has been focused on the analyses of individual
errors and causality modeling in manufacturing processes. The research on the
variation reduction and process control has not studied the error equivalence
phenomenon in manufacturing processes. There is a lack of physical model to
describe the error equivalence so as to study its impact on process control.
Model based root cause diagnosis. Previous research has extensively studied the
process sensing strategy, statistical process monitoring, diagnosability analysis, and
diagnostic algorithms. Those studies did not address the challenges the error
equivalence brings to the root cause diagnosis of manufacturing process with multiple
error sources.
Error compensation. Previous research widely studied the SPC integrated automatic
process adjustment in continuous manufacturing processes. The traditional error

13
compensation strategy for a discrete manufacturing process is to offset the process
errors individually and may not be cost effective. Hence it is desirable to study the
impact of the error equivalence mechanism on the error compensation.
1.3 Dissertation Outline
The insightful understanding and full utilization of the error equivalence require
advances in: mathematical modeling of the error equivalence phenomenon in
manufacturing, error equivalence analysis for root cause identification, and error
equivalence analysis for automatic process error compensation with integration of SPC.
These research aspects constitute the error equivalence theory.
The challenge for these research advances is the fusion of engineering science and
statistics into the modeling of error equivalence and the life cycle of controlling process
variations. The overall framework of error equivalence theory is shown in Fig 1.1.
Chapter 1 describes phenomenon of error equivalence and reviews the related
work for process modeling, diagnosis, and process control.
Chapter 2 presents a tentative mathematical definition of error equivalence and
models the error equivalence phenomenon through a kinematic analysis of workpiece and
errors. The error equivalence model has been verified by a real milling process. In
addition, a state space model based on error equivalence is derived to study the variation
stackup in the multistage manufacturing process. The procedure of variation propagation
model based on error equivalence has been demonstrated via a case study.
Chapter 3 intends to further explore the error equivalence mechanism and
discusses its theoretical implication in root cause identification as well as automatic

14
process adjustment for time invariant errors. A sequential root cause identification
procedure has been proposed to distinguish multiple types of errors in the machining
processes. The diagnostic algorithm is experimentally validated by a milling process. The
process adjustment based on error equivalence is illustrated with a simulation.
Chapter 4 builds a dynamic model of process errors to study the dynamic error
equivalence. In addition, statistical process control is introduced to monitor the dynamic
equivalent errors.
Based on the conclusion of Chapter 4, an automatic process adjustment algorithm
using error equivalence is derived to compensate for dynamic errors in a discrete
manufacturing process in Chapter 5. The performance of the adjustment rule, including
stability and sensitivity has been evaluated. Furthermore, the adjustment algorithm is
integrated with SPC so that changes in both adjustment algorithm and manufacturing can
be detected.
Chapter 6 concludes the dissertation. Prospects of future research are also
discussed.
Error equivalencemethodology
Chapter 2 Error equivalence modeling
to predict quality
Chapter 3 Error cancellation and its
implication
Chapter 4 Dynamic equivalent error
modeling and in-line monitoring
Chapter 5 Error-canceling-error strategy with integration of SPC
Design phase Manufacturing phase
Engineering science
• Kinematics• Product design• Manufacturing
Statistics• Probabilistic modeling
of process uncertainty
• Dynamic errors• Sensing constraints
• Regression analysis • System identification
• Error sources• Variation patterns• Sensing constraints
• Information collection• Hypothesis testing• Variance decomposition
• Statistical process control
• Error sources• Adjustment & evaluation• Engineering constraints
Figure 1.3 The Framework of Error Equivalence Theory

15
Chapter 2
Error Equivalence Modeling and Variation Propagation Modeling Based on Error
Equivalence*
This chapter models the phenomenon of the error equivalence in the machining
processes by considering how multiple errors (including fixture, and datum, and machine
tool) generate the same pattern on part features. The equivalent transformations between
multiple errors are derived through a kinematic analysis of process errors. As a result,
error sources can be grouped so that root cause identification can be conducted in a
sequential manner, which generally requires fewer feature measurements than the
previous approaches. The case study demonstrates the model validity through a real
cutting experiment.
The chapter is organized as follows. Section 2.1 introduces some preliminaries
and notations. Section 2.2 defines the error equivalence and overviews the methodology.
Error equivalence model in machining processes is derived in Section 2.3. As an example
of applying the error equivalence model, Section 2.4 presents a new variation propagation
model for multi-operational machining processes. The case studies have been conducted
in Section 2.5. Conclusions and future research work are discussed in Section 2.6.
*The work in this chapter has appeared in Wang, H., Huang, Q., and Katz, R., 2005, “Multi-Operational Machining Processes
Modeling for Sequential Root Cause Identification and Measurement Reduction,” ASME Transactions, Journal of Manufacturing
Science and Engineering, 127, pp. 512-52.

16
2.1 Preliminaries and Notations
This section introduces kinematic analysis of machining process, including
representations of surface and its spatial transformation caused by process errors in a
manufacturing process. The results will be used to derive error equivalence
transformation.
By vectorial surface model (Martinsen, 1993; and Huang, Shi, and Yuan, 2003),
an M-surface part X is represented as a vector in the part coordinate system (PCS)
X = ( )1
TT T Tj MX X X… … , j=1, …, M, (2.1)
where Xj denotes the jth surface and it is represented as
Xj = ( )TT Tj j jrv p = (vjx vjy vjz pjx pjy pjz rj)T , (2.2)
where vj=(vjx vjy vjz)T, pj=( pjx pjy pjz)T, and rj are orientation, location and size of surface
j, respectively. Subscripts x, y, and z denote orthogonal directions in the coordinate
system. M is determined by product design and process planning. The size of cylindrical
hole can be represented by the radius of the hole and size of plane is zero.
The nominal surface j and part are denoted as 0jX and X0, respectively. The
deviation of Xj is denoted as xj=Xj- 0jX = ( )TT T
j j jrΔ Δ Δv p as shown in Fig. 2.1, where
Euler parameters and matrix H will be described in Eq. (2.4). Accordingly, the part
deviation is denoted as x= ( )1
TT T Tj Mx x x… … . The feature deviation x of a workpiece can
be represented as a function of multiple errors sources (u1, u2, …, up)T,
x = =1Σ ( ) + ,pi i if u ε (2.3)
where fi(.)’s are functions determined by process and product design. ε is the noise term.
Process errors {ui} involved in machining mainly include those during setup and cutting

17
operations. Since the part is modeled as a vector, operations and their errors can be
viewed as vector transformations. Therefore, homogeneous transformation matrix (HTM)
is generally applied to model both operations and operational errors. For instance, HTM
FHP is used to model the nominal setup at operation k. It transforms 0jX from the nominal
PCS (denoted as PCS0) to the nominal fixture coordinate system (FCS0). Since setup
error could be induced by fixture error and datum error, we use HTMs Hf and Hd to
denote the additional transformation of 0jX in the FCS0 caused by fixture error and datum
error, respectively.
y
x
z
n0 p0
o
D0Nominal Feature
p1
n1
D1 Machined Feature
3 2
3 1
2 1
1 2 22 1 2
( )=2 2 10 0 0 1
e e xe e ye e z
H q
δ δδ δ
δδ δ
−⎛ ⎞⎜ ⎟−⎜ ⎟⎜ ⎟−⎜ ⎟⎝ ⎠
y
x
z
n0 p0
o
D0Nominal Feature
p1
n1
D1 Machined Feature
3 2
3 1
2 1
1 2 22 1 2
( )=2 2 10 0 0 1
e e xe e ye e z
H q
δ δδ δ
δδ δ
−⎛ ⎞⎜ ⎟−⎜ ⎟⎜ ⎟−⎜ ⎟⎝ ⎠
Figure 2.1 Modeling of Part Feature Deviation
To describe fixture error, the common 3-2-1 fixture locating scheme is adopted
(Fig. 2.2). The fixture is represented by the positions of 6 locators in the FCS, i.e., (fix fiy
fiz)T, i=1,…, 6. Not losing generality, the FCS0 is established with f1z=f2z=f3z =f4y=f5y=f6x=
0. The fixture error is denoted as deviations of locators, i.e., Δf=(Δf1z Δf2z Δf3z Δf4y Δf5y
Δf6x)T.. Cai, Hu, and Yuan (1997) nicely presented the relationship between Δf and Hf.
Their key results are summarized in Appendix A.

18
Block workpiece
Figure 2.2 General 3-2-1 Locating Scheme and FCS0
The datum error is included in the incoming workpiece x. For the surfaces used as
the primary, secondary, and tertiary datum, their errors are denoted as xI, xII, and xIII,
respectively. Datum error is then D I II III( )T T T T=x x x x . The relationship between datum
error and Hd will be derived in Section 2.2 using the concept of equivalent fixture error.
The datum error is first converted to the equivalent amount of fixture locator errors
(denoted as Δd). Then the results in Cai , Hu, and Yuan (1997) can be directly applied to
find Hd through Δd.
The nominal cutting operation or the tool path can be modeled as MHFFHP
0jX ,
where MHF transforms a part surface from the FCS0 to the nominal machine tool
coordinate system (MCS0). (When deriving the results, we choose the MCS0 to be the
same as the FCS0, i.e., MHF= I8×8. Discussion is given in Section 2.4.3 when MHF is not
identity matrix.) We use Hm to represent the transformation of tool path (from nominal to
the real one) caused by machine tool error. Only geometric errors of machine tool are
considered in this work. Fig. 2.3 shows the transformation due to process errors. As an
example to show the form of HTM, Hm is given as

19
,
00 1
m
mm
m m
m
m
xyz
γ
⎛ ⎞⎜ ⎟⎜ ⎟⎜ ⎟⎜ ⎟⎜ ⎟⎜ ⎟⎜ ⎟⎜ ⎟⎜ ⎟⎜ ⎟⎜ ⎟⎝ ⎠
Rot 0 0 0
H = 0 Rot 0
0 00 0
(2.4)
where rotation matrix Rotm has the following form under small deviation assumption
(Huang and Shi, 2003),
3 2
3 1
2 1
1 -2 2= 2 1 -2
-2 2 1
m m
m m m
m m
e ee ee e
δ δδ δδ δ
⎛ ⎞⎜ ⎟⎜ ⎟⎜ ⎟⎝ ⎠
Rot
and (δe1m δe2m δe3m)T are deviations of Euler parameters, representing deviation of tool
path orientation. Rotm on the upper left corner of Eq. (2.4) transforms the orientation of
surface, while the second Rotm transforms the surface position. (xm ym zm)T represents
deviation of tool path in position. γm is the ratio of actual and ideal surface size. When
γm=1, there is no size deviation due to the machine tool error. Accordingly, we define the
machine tool error as ( Tmδq γm-1)T, where δqm=(xm ym zm δe1m δe2m δe3m)T. The
equivalent fixture error due to machine tool is denoted as Δm.
Notations δqd and δqf can also be introduced for the parameters in Hd and Hf in a
similar way. Since datum and fixture errors have no impact on the surface size, we have
γd= γf=1.

20
H(δq)
y
x
z
o
y
x
z
oLocator 1
Locator m
Locator 2
……
H(q)
3 2
3 1
2 1
1 2 22 1 2
( )=2 2 10 0 0 1
e e xe e ye e z
H q
δ δδ δ
δδ δ
−⎛ ⎞⎜ ⎟−⎜ ⎟⎜ ⎟−⎜ ⎟⎝ ⎠
Figure 2.3 Modeling of Workpiece Positioning Error
2.2 Mathematical Modeling of the Error Equivalence Phenomenon in Manufacturing
Suppose p random error sources ui’s lead to dimensional deviation x as x =
fi(ui)+εi, i=1,2,…,p. ui’s are assumed to be independent from one another and the noise
term has mean E(εi)=0, and covariance Cov(εi)= 2iε
σ I, where I is an identity matrix. A
tentative definition of error equivalence is given as follows.
Definition: Two error sources ui and uj are equivalent if expectation E[fi(ui)]= E[fj(uj)].
That is, the equivalence among random errors is evaluated by the resultant mean shift
patterns in product features.
It should be noted that errors might not be equivalent under all situations. For
instance, the surface profile deviation caused by a machine tool might not be reproduced
by a fixture. This study only focuses on the situations that error equivalence holds.
If error sources ui and uj are equivalent, it is feasible to transform ui into
equivalent amount of error in terms of uj without affecting the analysis of feature
deviation x. This fact prompts error equivalence transformation to derive the error
equivalence model.

21
Positioning errors of workpiece and HTM matrices
Process errors
* =ix
δq1
δq2
δqp
…
H(δq1)
…
H(δq2)
H(δqp)
Equivalent errors to x1
Feature deviation
Ki ui * *=1= Σ +p
i ix Γ u ε
1*2
*p
uu
u
1
2
p
uu
u
Positioning errors of workpiece and HTM matrices
Process errors
* =ix
δq1
δq2
δqp
…
H(δq1)
…
H(δq2)
H(δqp)
Equivalent errors to x1
Feature deviation
Ki ui * *=1= Σ +p
i ix Γ u ε
1*2
*p
uu
u
1
2
p
uu
u
1
2
p
uu
u
Figure 2.4 Mathematical Modeling of Error Equivalence
Fig. 2.4 outlines the basic idea of mathematical modeling of the error equivalence
phenomenon. If p process errors ui’s are equivalent, the first step of modeling is to
transform ui’s into a base type error u1 through * =i i iu K u . A significant advantage of this
equivalent transformation is that the causal relationship between base error u1 and feature
deviation, i.e., x=f1(u1), can be generally applied to other types of error sources. The
manufacturing operation (e.g., cutting or setup operation) can be represented by a HTM
matrix H(δq), where the deviation of Euler parameters (δq) (see Fig. 2.3) are related to
the operational error. The remaining modeling steps can therefore be focused on the
causal model x=f1(u1) because the transformed errors *iu ’s are to be grouped together
into *=1Σ p
i iu with *1u = u1. The process model presented by Eq. (2.3) can be rewritten as x=
*=1Σ ( )p
i i if u . Since *iu ’s are treated as base error u1, the process model based on error
equivalence modeling thus becomes
x *1 2 =1 1= ( , ,..., ) + = Σ ( )p
p i if u u u ε f u + ε. (2.5)
If function f1 could be approximated by a linear function Γ*, the model becomes
x= *Γ u + ε, with u= *=1Σ p
i iu . (2.6)

22
The definition also shows the way to check the error equivalence condition. We can first
estimate E( *iu ) and Cov( *
iu ) from measurement data using maximum likelihood
estimation (MLE) method. Then the definition of error equivalence can be directly
applied.
Transforming error sources into a base error implies the transformation of
manufacturing operations into a base operation, i.e., the operation with base error only.
Operations with other types of errors become flawless because all the process errors have
been transferred to the base operation.
The derivation of this dissertation is under the linearity assumption, under which
equivalence transformation and quality prediction model assume linear form. The
nonlinear deformation of products is not considered in this study.
2.3 Error Equivalence Modeling for Machining Processes
We first introduce the concept of equivalent fixture error, by which a variation
propagation model is developed by grouping fixture, datum, and machine tool errors.
Condition of error grouping is also discussed in this section.
2.3.1 Concept of Equivalent Fixture Error
In a general machining process, three major error sources are considered: fixture
error Δf, machine tool error δqm, and datum surface error xD. The fixture error is chosen
as the base error because of the following reasons:
Fixture error is simply represented by the deviation of fixture locators, while machine
tool error is relatively complicated. The datum error is usually caused by fixture or
machine tool errors.

23
Fixture error has been well studied. Methods are readily available for the analysis of
workpiece positioning error (Weill, Darel, and Laloum, 1991; Rong and Bai, 1996;
Cai, Hu, and Yuan, 1997; Wang, 2000; and Marin and Ferreira, 2003), the resultant
feature deviation, and fixture error diagnosis (Hu and Wu, 1992; Apley and Shi, 1998,
2001; and Ceglarek and Shi, 1996).
Flexible fixtures have been available whose locators are adjustable for
accommodating a product family. It is possible to adjust the locator lengths for the
purpose of error compensation.
The base error in terms of fixture error is called equivalent fixture error (EFE),
which can be illustrated with a 2-D block workpiece (Fig. 2.5).
Equivalent locator errorMachine tool error Actual tool path Nominal
tool path
Δm1
Δm2
Δm3
Equivalent locator errorMachine tool error Actual tool path Nominal
tool path
Δm1
Δm2
Δm3 (a) (b)
Figure 2.5 Equivalent Fixture Error
In Fig. 2.5(a), the dash line block with surfaces ( 01X 0
2X 03X 0
4X ) is in its
nominal setup position. Due to datum error occurring on surface X1, the block has to be
transformed to position (X1 X2 X3 X4) (the solid line block) around the locating point f3.
The workpiece position transformation is described by HTM Hd. The EFE due to datum
error, denoted by Δd=(Δd1z Δd2z Δd3z Δd4y Δd5y Δd6x)T, can be derived by finding the
difference between actual (Hd FHP ( 0TjX 1)T) and nominal datum surfaces (FHP ( 0T
jX 1)T),
where {j}⊂ {I, II, III}. In Fig. 2.5(a), the equivalent fixture deviation is Δd1 and Δd2. In
Fig. 2.5(b), EFE due to machine tool error can be derived in a similar way. The left panel
X3
X2 X1
X4
f1 f2
f3
04X
01X
02X
Δd1 Δd2
03X

24
shows that the machined surface X3 deviates from designed position 03X due to machine
tool errors. The EFE transforms the workpiece from nominal position ( 01X 0
2X 03X 0
4X )
to dash line position shown in right panel. A nominal cutting operation can yield the same
surface deviation as machine tool error does in the left panel. Therefore, the inverse of
Hm transforms X3 to its nominal position 03X in the FCS. The EFE due to machine tool
error, denoted by Δm=(Δm1z Δm2z Δm3z Δm4y Δm5y Δm6x)T, can be uniquely determined
by the difference between -1mH FHP ( 0T
jX 1)T and FHP ( 0TjX 1)T at the locating point,
where {j}⊂ {I, II, III}. In this example, the equivalent fixture locator deviation Δm1 and
Δm2 is determined by difference between surfaces 01X and X1 at locating point 1 and 2.
Δm3 can be computed by the difference between surfaces 02X and X2 at locating point 3.
2.3.2 Derivation of EFE Model
The equivalent locator deviation caused by either datum error or machine tool
error can be computed by the distance between two points where locators intersect the
nominal datum 0jX = 0 0 0 0 0 0( )T
jx jy jz jx jy jzv v v p p p and deviated datum surfaces Xj=(vjx vjy
vjz pjx pjy pjz) (Fig. 2.6), where j=I, II, III represents three datum surfaces. nj is the
normal vector of datum surface and it is equal to orientation vector vj when datum surface
is planar.
Let Δd=(Δd1z Δd2z Δd3z Δd4y Δd5y Δd6x)T and Δm=(Δm1z Δm2z Δm3z Δm4y
Δm5y Δm6x)T represent EFEs caused by datum and machine tool errors, respectively.
Using analytical geometry, EFEs can be derived as

25
I I I I I I
II II II II II II
III III III III III III
( ) -[ ( - ) ( - )] / - , 1, 2,3,
( ) -[ ( - ) ( - )] / - , 4,5,
( ) -[ ( - ) ( - )] / - , 6.
iz iz x ix x y iy y z z iz
iy iy x ix x z iz z y y iy
ix ix y iy y z iz z x x ix
d or m n f p n f p n p f i
d or m n f p n f p n p f i
d or m n f p n f p n p f i
Δ Δ = + + =
Δ Δ = + + =
Δ Δ = + + =
(2.7)
The orientation vector nj and position pj of the plane Xj can be further expanded
by datum error xj or machine tool error δqm.
Figure 2.6 EFE Derivation
When computing Δd, deviated surface Xj can be determined by datum error plus
the nominal, i.e., 0j j j= +X X x . Eq. (2.7) is then linearized as:
I I I
II II II
III III III
- , 1,2,3,
- , 4,5,
- , 6.
iz ix x iy y z
iy ix x iz z y
ix iy y iz z x
d f v f v p i
d f v f v p i
d f v f v p i
Δ = − Δ − Δ Δ =
Δ = − Δ − Δ Δ =
Δ = − Δ − Δ Δ =
or I
2 II
III
.⎛ ⎞⎜ ⎟
Δ = ⎜ ⎟⎜ ⎟⎝ ⎠
xd K x
x
(2.8)
The mapping matrix relating datum error to Δd is 1
2 2
3
⎛ ⎞⎜ ⎟= ⎜ ⎟⎜ ⎟⎝ ⎠
G 0 0K 0 G 0
0 0 G
where
1 1
1 2 2
3 3
0 0 0 10 0 0 10 0 0 1
x y
x x
x x
f ff ff f
⎛ ⎞⎜ ⎟= −⎜ ⎟⎜ ⎟⎝ ⎠
G , 4 42
5 5
0 0 1 00 0 1 0
x z
x z
f ff f
⎛ ⎞= −⎜ ⎟
⎝ ⎠G , and
( )3 6 60 1 0 0y zf f= −G .
When deriving Δm, we use the relationship between Xj and machine tool error
δqm. Linearization of Eq. (2.7) using the first order of Tayler expansion then yields
Δd (or Δm) 0jX
Xj
Deviated datum surface
Locators Nominal datum surface
nj
0jn

26
3Δ =m K δqm, and
1 1
2 2
3 33
4 4
5 5
6 6
0 0 1 2 2 00 0 1 2 2 00 0 1 2 2 00 1 0 2 0 20 1 0 2 0 21 0 0 0 2 2
y x
y x
y x
z x
z x
z y
f ff ff f
f ff f
f f
− −⎛ ⎞⎜ ⎟− −⎜ ⎟⎜ ⎟− −
= ⎜ ⎟− −⎜ ⎟
⎜ ⎟− −⎜ ⎟⎜ ⎟− −⎝ ⎠
K .
Figure 2.7 Non-Planar Datum Surfaces
This modeling is applicable for the case where datum surfaces are all planes.
When the surface is not planar, we should use tangential plane of surface at each locating
point as datum surface. Fig. 2.7 shows the setup of a 2-D part with non-planar datum
surfaces. The datum surfaces are tangential planes T1, T2, and T3. The corresponding
normal vectors are n1, n2, and n3, respectively. If the implicit form surface equation is
represented by fj(xj, yj, zj)=0, nj and pj are determined by
, , ( , , ) 0
T
j j jj j jx jy jz
j j j
f f ff p p p
x y z⎛ ⎞∂ ∂ ∂
= =⎜ ⎟⎜ ⎟∂ ∂ ∂⎝ ⎠n , j=I,II,…,VI. (2.10)
The following is for a brief derivation on orientation v and position vector p of
three datum surfaces. If the features j1, j2 and j3 that are selected as the first, second and
tertiary datum surface are planar, orientation vector of three datum surfaces can be vI=vj1,
vII=vj2, and vIII=vj3. However, if j2 and j3 are cylindrical holes where round pin and
diamond pin reside respectively, such locating scheme is equivalent to a simplified 3-2-1
T1 T2 n2 n1
n3
T3
(2.9)

27
fixture locating scheme as shown in Fig. 2.8. We can set the origin of fixture coordinate
system at the point of pj2, and f1z=f2z=f3z=f4x=f4y=f4z=f5y=f5z=f6x=f6y=f6z=0.
z
y
v I
v III
j 2
j 3
f 5f 1 f 2
f f 3f 6
v j 3
v j 2
p j 3
p j
Second datum surface IIPrimary datum surface I
Tertiary datum surface III
Locating point
z
y
v I
v III
j 2
j 3
f 5f 1 f 2
f f 3f 6
v j 3
v j 2
p j 3
p j
Second datum surface IIPrimary datum surface I
Tertiary datum surface III
Locating point Figure 2.8 Pin-Hole Locating Scheme
The orientation vector for second datum surface is defined to be
( )2 2 3
3 2 3 2 3 3 3 2 3 3 3 2 3 3 3 2 3 3 3 2 3 3 3 2
II ( )
= ,
j j j
j y j z j y j z j z j y j z j y j z j x j z j x j x j z j x j z j x j y j x j y j y j x j y j xv p v p v p v p v p v p v p v p v p v p v p v p
= × −
− + + − − + + − − + + −
v v p p (2.11)
where orientation vj and position pj of holes are parameters that vary within infinitesimal
range. The normal vector for the tertiary datum surface is
( )2 3 2 3 2 3 2 3III - - -j j j x j x j y j y j z j zp p p p p p= − =n p p . (2.12)
Deviation of normal vector is determined by differentiation and linearization of vI, vII,
and vIII. The results are given as follows:
If three datum surfaces are planar:
ΔnI=Δvj1, ΔnII=Δvj2, ΔnIII=Δvj3 , and (2.13)
ΔpI=Δpj1, ΔpII=Δpj2, ΔpIII=Δpj3.

28
If j1 is plane, j2 and j3 are cylindrical hole:
Δn1=Δvj1, 2 3 3 3 2 3 2
3 2 3 3 2
3 2 3 2 3 3 2 3 3
II
II
II
( - ) ,
( - ) ,
( - ) ( - ) ( - ) ,
x j y j y j z j y j y j y j y
y j x j x j z j x j x
z j y j y j x j x j x j z j x j x j z
n p p v p p p p
n p p v p p
n p p v p p v p p v
Δ = Δ −Δ + Δ = −Δ + Δ
Δ = Δ + Δ −Δ
Δ = Δ + Δ = Δ
2 3
2 3
2 3
3
3
3
,
,
.
x j x j x
y j y j y
z j z j z
n p p
n p p
n p p
Δ = Δ −Δ
Δ = Δ −Δ
Δ = Δ −Δ
2.4 Variation Propagation Modeling Based on Error Equivalence for Multi-Operation
Machining Process
2.4.1 Background Review for Multi-Operational Manufacturing Process
Due to the increasing complexity of products and the requirements of quick
response and flexibility, manufacturing process has evolved into complex systems
consisting of many stages, where the variation can be accumulated through multiple
stages onto the final product. Such variation transmission has been widely investigated.
Variation propagation modeling has been proved to be an effective way for
variation reduction and design synthesis in multi-operational manufacturing processes. A
brief review is given to the previously developed state space model.
For an N-operation manufacturing process, the state of the kth operation x(k) is
described as a linear combination of the previous state x(k-1), process input u(k), and
natural process variation ζ(k). Quality characteristic y(k) is a linear transformation of state
x(k) plus measurement noise η(k). Under small deviation assumption, the model has the
following form
(2.14)

29
x(k)=A(k-1)x(k-1)+B(k)u(k)+ζ(k), k=1, 2, …, N, (2.15)
y(k)=C(k)x(k)+η(k), {k}⊂ {1, 2, …, N}.
For machining processes, state vector x(k) represents the deviations of part
features. The process deviation u(k) includes fixture and machine tool deviations, while
the datum deviation is contained in x(k-1). State transition matrix A(k-1) and input
coefficient matrix B(k) are constant matrices determined by product and process design.
The matrix C(k) is determined by measurement design. Denote by y the quality
characteristics of N operations and by u the process deviations from all operations. The
relationship between y and u can be obtained by solving Eq. (2.15), which ends up with a
linear model in the form y=Γu+ε or x=Γu+ε. Diagnosis and measurement synthesis can
be performed by analyzing the rank of matrix Γ (Ding, et al., 2003; and Zhou, Huang,
and Shi, 2003). The problem encountered, however, is that Γ is often not full rank for
machining processes. One natural thought is to increase the dimension of quality
characteristics y to increase the rank of Γ matrix. Nevertheless, this strategy cannot
guarantee the full rank of Γ because datum, fixture, and machine tool errors could
generate the same error patterns on part features. Previously developed approaches for
machining processes (Huang, Shi, and Yuan, 2003; Djurdjanovic and Ni, 2001; and Zhou,
Huang, and Shi, 2003), however, did not model the error equivalence. Consequently, it is
difficult to distinguish error sources at each operation (Huang and Shi, 2004).
The strategy proposed in this chapter is to formulate the variation propagation
model using the proposed EFE concept. With this concept, datum error and machine tool
error are transformed to equivalent fixture locator errors at each operation. As a result,
the dimension of u can be reduced by properly grouping three types of errors together.

30
The rationale of the proposed methodology is to conduct measurement in a sequential
manner for root cause identification. First, only necessary information is provided to
identify whether there is any error in the process. If not, additional measurement is
deemed as waste of resources. Second, if any error is identified, further measurement will
be conducted to distinguish three types of errors. This methodology generally requires
less feature measurements than the previous approaches. A detailed diagnostic algorithm
will be presented in Chapter 3.
2.4.2 Variation Propagation Model Derivation
This section shows the derivation procedure for the surface deviation xj(k) (Fig.
2.9). It can be easily extended for part deviation x(k) and establishing state space model.
Figure 2.9 Model Derivation
Step 1 models how feature quality is affected by faulty setup and cutting
operation at the kth stage. Parameters δqd(k), δqf(k), and δqm(k) in HTMs are intermediate
variables linking Δf(k) , Δd(k), and Δm(k) with feature deviation xj(k). Step 2 derives
how fixture error Δf(k), EFE Δd(k) and Δm(k) affect δqd(k), δqf(k), and δqm(k),
respectively. Step 3 describes how errors from previous operation (datum error) affect
Δd(k).
Δf(k)
Δm(k) δqm(k)
Δd(k)δqd(k)
xj(k) δqf(k)
Step 1 Step 3 Step 2
xI(k-1) xII(k-1) xIII(k-1)

31
Step 1. After setup operation, the part surface can be represented by FHP(k)( 0 ( )Tj kX 1)T.
The machined surface j is represented as Hm(k)FHP(k)( 0 ( )Tj kX 1)T in the FCS0. After
transforming the surface to the PCS0 (Huang and Shi, 2003), the actual surface Xj(k) is:
( ) ( )-1 -1 -1 0( ) 1 ( ) ( ) ( ) ( ) ( ) ( ) 1 ,T TT F F T
j P d f m P jk k k k k k kX = H H H H H X (2.16)
where 0 0 0 0 0 0 0( ) ( ( ) ( ) ( ) ( ) ( ) ( ))Tj jx jy jz jx jy jzk v k v k v k p k p k p k=X . By substituting Eq. (2.4)
into Eq. (2.16), we can compute the actual machined surface Xj(k). After ignoring higher
order error terms, Eq. (2.16) can be rewritten as:
6 10
1 18
( ) ( ) ( )( ) ( ) ( )( )
jd jf jmj j
j
k k kk k kr k δ×
×
−⎛ ⎞= +⎜ ⎟⎜ ⎟⎝ ⎠
A A A 0x q ζ0
, and
0 0
0 0
0 0
0 0
0 0
0 0
0 0 0 0 2 20 0 0 2 0 20 0 0 2 2 0
( ) ( ) ( )1 0 0 0 2 2
0 1 0 2 0 20 0 1 2 2 0
jz jy
jz jx
jy jxjd jf jm
jz jy
jz jx
jy jx
v vv vv v
k k kp p
p pp p
⎛ ⎞−⎜ ⎟
−⎜ ⎟⎜ ⎟−
= = − = ⎜ ⎟− −⎜ ⎟⎜ ⎟− −⎜ ⎟⎜ ⎟− −⎝ ⎠
A A A if FHP(k)=I,
where rank(Ajd)≤5 and ( )( )= ( ) ( ) ( ) ( ) 1TT T T
d f m mk k k k kδ δ δ δ γ− −q q q q . ζ(k) is the modeling
error for operation k. Index k is omitted within matrices Ajd(k), Ajf(k) and Ajm(k).
The δq(k) can be grouped because of Ajd(k)=Ajf(k)=-Ajm(k). Eq. (2.17) is
( )( )6 1 T0
1 6
( )( ) ( ( ) 0) ( ( ) ( )) ( )-1 ( )( )
Tjd T Tj d f m m
j
kk k k k k kr k δ δ δ γ×
×
⎛ ⎞= + − +⎜ ⎟⎜ ⎟⎝ ⎠
A 0x q q q ζ0 , (2.18)
where the dimension of δq(k) is reduced from 19 to 7.
The expression for Ajd(k), Ajf(k) and -Ajm(k) in Eq. (2.17) is only given under the
condition of FHP(k)=I. In Section 2.4.3, we will show that Ajd(k)=Ajf(k)=-Ajm(k) and error
grouping still hold if FHP(k)≠I.
(2.17)

32
Step 2. Relationship between δqf(k) and Δf has been given as 1 Δfδ −=q -J ΦE f by Cai, et
al., (1997) (refer to Appendix A for a brief summary of the result). By the concept of
EFE, Δd and Δm are equivalent to Δf. Therefore, δqd(k) and δqm(k) can be determined
accordingly by the same approach, i.e.,
1 Δdδ −=q -J ΦE d and (2.19)
1 1( Δ ) Δ ,mδ − −= − − =q J ΦE m J ΦE m (2.20)
where matrix E is an 18×6 matrix (see Appendix A). Since 1m−H (not Hm) transforms the
workpiece from nominal position to its real position in the FCS (refer to Fig. 2.5(b)), we
add minus sign before 1 Δ−−J ΦE m in Eq. (2.20). It turns out that Jacobian matrix J and
orientation matrix Φ in Eqs. (2.19) and (2.20) are the same as those in Eq. (A.1).
Therefore, we still can group errors after substituting Eqs. (A.1), (2.19), and (2.20) into
Eq. (2.18),
( )( ) ( ) Δ ( ) 0 ( ) ( ) ( )TT
j j j jk k k k k k= + +x B d B u ζ , (2.21)
where -1
6 10
1 6
( ) ( ) ( )( )
( )jd
jj
k k kk
r k×
×
⎛ ⎞= ⎜ ⎟⎜ ⎟⎝ ⎠
-A J Φ E 0B
0 is the input coefficient matrix linking errors
at the current operation with feature deviation, rank ( -1( ) ( ) ( )jd k k k-A J Φ E )≤ 5, and
u(k)=((Δf(k) +Δm(k)) T, γm(k)-1) T.
Step 3. EFE Δd(k) in Eq. (2.18) becomes
I
II22 22
III7 22 22 22
22 1
( 1)( 1)( )
,( 1)1 1 1
1
kkkk×
× ×
×
⎛ ⎞−⎜ ⎟
−Δ⎛ ⎞ ⎛ ⎞ ⎛ ⎞ ⎜ ⎟=⎜ ⎟ ⎜ ⎟ ⎜ ⎟ ⎜ ⎟−⎝ ⎠ ⎝ ⎠ ⎝ ⎠ ⎜ ⎟⎜ ⎟⎝ ⎠
xxd Ψ 0 G 0
Hx0 0 (2.22)

33
where matrix H transforms deviations of three datum surfaces from PCS0 to FCS0. It is
defined as 1 3
1 3
1 3
1 21
( 0)
( 0)
( 0)1
F F F TP P P
F F FF TP P P P
F F F TP P P
x y z
x y z
x y z
×
×
×
×
⎛ ⎞⎜ ⎟⎜ ⎟⎜ ⎟⎜ ⎟⎜ ⎟⎝ ⎠
0
R 0
00
; where FRP= diag(FRotP FRotP γm FRotP
FRotP γm FRotP FRotP γm). FRotP is the rotational block matrix in FHP. (FxP FyP FzP)T are
translation parameters. Matrix 1
2
3
= ⎛ ⎞⎜ ⎟⎜ ⎟⎜ ⎟⎝ ⎠
Ψ 0 0Ψ 0 Ψ 0
0 0 Ψ
maps the deviation of workpiece to
the EFE with 1 1
1 2 2
3 3
0 0 0 1 00 0 0 1 00 0 0 1 0
x y
x y
x y
f ff ff f
⎛ ⎞⎜ ⎟
= −⎜ ⎟⎜ ⎟⎝ ⎠
Ψ , 4 42
5 5
0 0 1 0 00 0 1 0 0
x z
x z
f ff f
⎛ ⎞= −⎜ ⎟
⎝ ⎠Ψ , and
( )3 6 60 1 0 0 0y zf f= −Ψ . Matrix G is introduced for computing deviation of
orientation vector of datum surface under two conditions:
• If all datum surfaces are planar: G=I;
• If XI is plane, XII and XIII are cylindrical holes, G can be obtained by differentiating
II II III( )× −v p p and pII-pIII. Considering the results in Eq. (2.14), we have
7 7
11 12
4 3 4 4 4 7
21 22
4 3 4 4 4 7
×
× × ×
× × ×
⎛ ⎞⎜ ⎟⎜ ⎟⎜ ⎟⎜ ⎟=⎜ ⎟⎜ ⎟⎜ ⎟⎜ ⎟⎝ ⎠
0 0I
G GG 0
0 I 0G G
00 I 0
, where 2 3
3 2
11
0 0 0 0 1 0 00 0 - 1 0 0 0
0 - 0 0 0 0 0j x j x
j x j x
p p
p p
⎛ ⎞−⎜ ⎟
=⎜ ⎟⎜ ⎟⎜ ⎟⎝ ⎠
G ,
12
0 0 0 0 1 0 00 0 0 1 0 0 00 0 0 0 0 0 0
⎛ ⎞⎜ ⎟= −⎜ ⎟⎜ ⎟⎝ ⎠
G , 21
0 0 0 1 0 0 00 0 0 0 1 0 00 0 0 0 0 1 0
⎛ ⎞⎜ ⎟= ⎜ ⎟⎜ ⎟⎝ ⎠
G , 22
0 0 0 1 0 0 00 0 0 0 1 0 00 0 0 0 0 1 0
−⎛ ⎞⎜ ⎟= −⎜ ⎟⎜ ⎟−⎝ ⎠
G .

34
Substituting Eq. (2.22) into Eq. (2.21), state transition matrix Aj(k-1) can be
obtained and we derive the variation propagation model for the surface j at operation k. If
we assemble the model for all the features and datum surfaces, the equation in the form
of the state space model can be obtained. The dimension of input vector u(k) is reduced
from 13 to 7 because of error grouping. Thus the order of matrix Γ*TΓ* is greatly reduced.
The dimension of output vector x(k) required to make Γ*TΓ* full rank is reduced as well.
When FCS, PCS, and MCS coincide, and the orientation vectors of datum surfaces are
(0 0 -1 0 0 0 0)T, (0 -1 0 0 0 0 0)T, and (-1 0 0 0 0 0 0)T in the FCS, we get input matrix
*jΓ corresponding to the machined surface j ( )0 0 0 0 0 0 0
T
x y z x y zv v v p p p as
* 1j jd
−= −Γ A J ΦE , (2.23)
which yields *jΓ matrix, i.e.,

35
G j* =
i
k
f3 x H f4 z- f5 z L vy0+ f2 x H- f4 z+ f5 z L vy0+H f4 x- f5 xL H f2 y- f3 yL vz0H f4 x- f5 xL H f3 x H f1 y- f2 yL+ f2 x H- f1 y+ f3 yL+ fx H f2 y- f3 yLL
f3 x H f4 z- f5 z L vy0+ f1 x H- f4 z+ f5 z L vy0+H f4 x- f5 xL H f1 y- f3 yL vz0H f4 x- f5 xL H f3 x H- f1 y+ f2 yL+ f2 x H f1 y- f3 yL+ f1 x H- f2 y+ f3 yLL
H f2 x- f3 xL H f4 z vx0- f5 z vx0+H- f4 x+ f5 xL vz0LH f4 x- f5 xL H f3 x H- f1 y+ f2 yL+ f2 x H f1 y- f3 yL+ fx H- f2 y+ f3 yLL
H fx- f3 xL H f4 z vx0- f5 z vx0+H- f4 x+ f5 xL vz0LH f4 x- f5 xL H f3 x H- f1 y+ f2 yL+ f1 x H- f2 y+ f3 yL+ f2 x H f1 y- f3 yLL
- f2 y vx0+ f3 y vx0+H f2 x- f3 xL vy0f3 x H f1 y- f2 yL+ f1 x H f2 y- f3 yL+ f2 x H- f1 y+ f3 yL
f1 y v1 x0- f3 y vx0+H- f1 x+ f3 xL vy0f3 x H f1 y- f2 yL+ f1 x H f2 y- f3 yL+ f2 x H- f1 y+ f3 yL
- f2 x H f4 z- f5 z L H f6 y-py0L+ f3 x H f4 z - f5 zL H f6 y+py0L+H f4 x- f5 xL H f2 y- f3 yL H f6 z -pz0LH f4 x- f5 xL H f3 x H- f1 y+ f2 yL+ f2 x H f1 y- f3 yL+ f1 x H- f2 y+ f3 yLL
- f1 x H f4 z- f5 z L H f6 y-py0L+ f3 x H f4 z - f5 zL H f6 y-py0L+H f4 x- f5 xL H f1 y- f3 yL H f6 z -pz0LH f4 x- f5 xL H f3 x H f1 y- f2 yL+ f1 x H f2 y- f3 yL+ f2 x H- f1 y+ f3 yLL
H f2 x- f3 xL HH- f4 z+ f5 z L px0+ f5 x H f4 z-pz0L+ f4 x H- f5 z +pz0LLH f4 x- f5 xL H f3 x H- f1 y+ f2 yL+ f2 x H f1 y- f3 yL+ f1 x H- f2 y+ f3 yLL
H f1 x- f3 xL HH- f4 z + f5 zL px0+ f5 x H f4 z +pz0L- f4 x H f5 z-pz0LLH f4 x- f5 xL H f3 x H f1 y- f2 yL+ f1 x H f2 y- f3 yL+ f2 x H- f1 y+ f3 yLL
H- f2 y+ f3 yL px0+ f3 x H f2 y-py0L- f2 x H f3 y-py0 Lf3 x H f1 y- f2 yL+ f1 x H f2 y- f3 yL+ f2 x H- f1 y+ f3 yL
H f1 y- f3 yL px0- f3 x H f1 y-py0L+ f1 x H f3 y-py0Lf3 x H f1 y- f2 yL+ fx H f2 y- f3 yL+ f2 x H- f1 y+ f3 yL
f2 x H f4 z- f5 z L vy0+ f1 x H- f4 z+ f5 z L vy0+H f4 x- f5 xL H f1 y- f2 yL vz0H f4 x- f5 xL H f3 x H f1 y- f2 yL+ f2 x H- f1 y+ f3 yL+ fx H f2 y- f3 yLL
vy0f4 x- f5 x
vy0- f4 x+ f5 x
0H fx- f2 xL H f4 z vx0- f5 z vx0+H- f4 x+ f5 xL vz0L
H f4 x- f5 xL H f3 x H f1 y- f2 yL+ f2 x H- f1 y+ f3 yL+ f1 x H f2 y- f3 yLLvx0
- f4 x+ f5 x
vx0f4 x- f5 x
0- f1 y vx0+ f2 y vx0+H f1 x- f2 xL vy0
f3 x H f1 y- f2 yL+ f1 x H f2 y- f3 yL+ f2 x H- f1 y+ f3 yL0 0 0
- f1 x H f4 z- f5 z L H f6 y-py0L+ f2 x H f4 z - f5 zL H f6 y-py0L+H f4 x- f5 xL H f1 y- f2 yL H f6 z -pz0LH f4 x- f5 xL H f3 x H- f1 y+ f2 yL+ f2 x H f1 y- f3 yL+ f1 x H- f2 y+ f3 yLL
f6 y-py0
- f4 x+ f5 x
f6 y-py0
f4 x- f5 x-1
H f1 x- f2 xL HH- f4 z + f5 zL px0+ f5 x H f4 z -pz0L- f4 x H f5 z-pz0LLH f4 x- f5 xL H f3 x H- f1 y+ f2 yL+ f2 x H f1 y- f3 yL+ f1 x H- f2 y+ f3 yLL
f5 x-px0f4 x- f5 x
f4 x-px0- f4 x+ f5 x
0H- fy+ f2 yL px0+ f2 x H f1 y-py0L- fx H f2 y-py0L
f3 x H f1 y- f2 yL+ f1 x H f2 y- f3 yL+ f2 x H- f1 y+ f3 yL0 0 0
y
{ where we can see that matrices *
jΓ corresponding to three EFEs are the same.
The structure of Eq. (2.17) proves our previous claim that it is hard to conduct
root cause identification using previously developed models. It also reveals that fixture
and machine tool cannot be distinguished without in-process measurements on either
fixture locators or the machine tool at each operation.
2.4.3 Discussion for Error Grouping in Machining Processes
In Section 2.4.2, the model derivation is based on the assumption that
transformation matrix FHM(k) is identity. In addition, the expression of Ajd (k), Ajf(k) and
-Ajm(k) are given under the condition of FHM(k)=I. In this section, a necessary and
sufficient condition for error grouping is discussed.
,

36
Proposition 2.1 (Condition on grouping variables) The linear equation
( ) ( )1 2 1 2= = ,T Tn mx x x u u u… …x Γ (2.24)
where Γ={gij}n×m, i=1,2,…, n; j=1, 2,…, m; x1, x2, ..., xn and u1, u2, ..., um are variables,
can be grouped into the following form
( )1 2
T
np p p u=x with 1 1 2 2 ... m mu k u k u k u= + + + . (2.25)
where pi and kj are certain coefficients, if and only if the rank of matrix Γ is one or zero.
In our study, the coefficient matrices of Δd, Δf, and Δm are the same, (see Eqs.
(A.1), (2.19), and (2.20)), which satisfies the sufficient condition for grouping.
In the above discussion, we assume the transformation matrix FHP and FHM to be
identities. If three coordinate systems do not coincide with each other, the coefficient
matrices for Δd, Δf, and Δm are still the same when FHP ≠I8×8 and FHM =I8×8. However,
this is not true when FHM≠I8×8. We have the following conclusion.
Corollary. MCS0 and FCS0 must coincide to perform error grouping in the proposed
model. However, this requirement can be easily satisfied in modeling stage. The proofs of
the proposition and corollary are listed in Appendix B.
2.5 EFE Validation and Modeling Demonstration
This section validates the EFE with a milling process and demonstrates the
modeling procedures for a multi-operational machining process.

37
2.5.1 Experimental Validation of EFE
We machine 6 blocks to validate EFE model. The first three parts are cut with
only datum error, while the rest are cut with only machine tool error. The datum error and
machine tool error are set in such a way that Δd=Δm=(1.105 0 0 0 0 0)T, i.e., their EFEs
are the same based on Eqs. (2.8) and (2.9). Then we can measure the machined surface
and compare the surface orientation and position.
Fig. 2.10 shows the specification of raw workpiece and fixture layout. Only top
surface X is machined and its specification is X0= (0 0 1 0 0 20.32 0) T. Using Eq. (2.21),
the deviated surface X is predicted as (0 -0.0175 0.9998 0 0 18.88)T.
Figure 2.10 Raw Workpiece and Locating Scheme (Unit: mm)
Table 2.1 shows the measurement of the machined surface. As can be seen, the
discrepancies between two samples are very small. The measurement data are also
comparable with the predicted results. Therefore, the experiment supports EFE model.
Locating Point
f1
f2 f3
f4 f6
z
y
(a) (b)
22.86 0.01±
101.6 0.1±76.2 0.1±
19.2 0.01±
57 0.01±
19 0.01± 63.3 0.01±
50.8 0.01±
8 0.01±
76.2 0.1±
X
f5
y
x
z x
x Grooves 38 0.01±
19 0.01±

38
Table 2.1 Measurement Results (Under PCS0) X vx vy vz px py pz
Sample 1 (Datum Error)
0 -0.0174 0.9998 0 0 18.880 -0.0001 -0.0174 0.9998 0 0 18.882
0 -0.0174 0.9998 0 0 18.881 Sample 2
(Machine Tool Error)
0 -0.0172 0.9999 0 0 18.880 -0.0001 -0.0173 0.9999 0 0 18.884
0 -0.0163 0.9999 0 0 18.887
2.5.2 Multi-Operational Variation Propagation Modeling With Grouped EFEs
A machining process for V-8 cylinder head is employed to illustrate modeling
procedure and the advantage of the modeling approach. The drawing of workpiece and
the locating points are shown in Fig. 2.11. The surfaces chosen are marked as X1- X8. X1
is the exhaust face, while X2 and X3 are two cup plug holes on the X1. X4 is spark plug
tube hole and X5 is a hole for the exhaust lash adjuster. X4 and X5 are two angle holes and
the specifications are given in section plots S1-S1 and S2-S2. Center of X7 is set to be the
origin of nominal part coordinate system. Based on the dimensions shown in Fig. 2.11,
the specification of each machined surface is listed in Table 2.2.

39
x
X3
p2
X8
s1
X6
p3
X4
p2
s1 400350
X1
p3
300
X4
s1-s1
X7
y
p1
p1
52.69
X6
X7
X6
64.5
X5
s2 19.25
X2
X5
s2-s2
115.09
44.41
s250
X7
X6
74
Figure 2.11 Workpiece and Locating
The workpiece goes through two operations (Fig. 2.12): the first operation mills
X1 and drills X2 and X3 using datum surfaces X6, X7 and X8; and the second operation
drills X4 and X5 using datum surface X1, X2 and X3. The locator positions on the primary
datum planes are given in Table 2.3.
Table 2.2 Machined Features Specification Feature
Component Part Features (In the PCS0, Unit: mm)
X1 X2 X3 X4 X5 X6 X7 X8 vx(k) vy(k) vz(k) px(k) py(k) pz(k) r (k)
0 1 0 0
131 0 0
0 1 0
19.25 131
81.25 7.5
0 1 0
319.25 131
81.25 7.5
0 0.43 0.90 350
52.69 0
4.6
0 0.28 -0.96
50 44.41 115.09 16.92
0 0 -1 0 0 0 0
0 0 1 0 0 0 5
0 0 1
400 0 0 5
Table 2.3 Coordinates of Locating Points on the Primary Datum Surfaces (Unit: mm) p1 p2 p3
Operation 1 (-7, 109, 0) (407, 109, 0) (200, -11, 0) Operation 2 (19.25, 131, 61.25) (319.25, 131, 61.25) (169.25, 131, 11.25)

40
X6
X1
X6
X1
Operation 1 Operation 2
Figure 2.12 Two Cutting Operations
The state vector is x(k)= ( )1 2 3 4 5( ) ( ) ( ) ( ) ( )TT T T T Tk k k k kx x x x x . Since diagnosis
of feature size is relatively straightforward, we do not consider effect of size. In this case
study, we also assume that the workpiece is perfect, i.e., (0)j =x 0 , j=1,2,…,5.
As a comparison, before using the proposed methodology, we can check the
number of necessary measurements for identifying errors via previously proposed model
(Zhou, Huang, and Shi, 2003; Huang and Shi, 2004). It can be observed that there are 12
error components (6 fixture and 6 machine tool error components) as input to the model
for each operation and therefore, total 24 inputs entails 24 components in quality
characteristic for root cause identification. Since each feature contains 6 components, at
least 12/6=2 features are required for each operation. However, we have shown in Eq.
(2.21) that the rank of block matrix -1( ) ( )jd k k-A J Φ E in Bj(k) does not exceed 5. More
features information is needed to identify all the errors. Therefore, the number of features
identifying errors for each operation should be no less than 3. In this case study where
only two operations are considered, total amount of measured features should not be less
than 3×2=6 even if the purpose is to identify whether errors occur in the process. Using
Eqs. (2.21) and (2.22), we calculate Aj(k) and Bj(k), based on which the model in the
grouped form is formulated as follows.

41
Operation 1: Because the first operation only mills X1 and drills X2 and X3, input
matrices for features 4 and 5 are zero. The results are:
6 11
1 6
0 0 0 0.0025 0.0025 00 0 0 0 0 0
0.0042 0.0042 0.0083 0 0 00 0 0 0.3275 0.3275 1(1) ,0 0 0 1 0 0
1.0748 0.1086 0.1833 0 0 00
×
×
−⎛ ⎞⎜ ⎟⎜ ⎟⎜ ⎟− −⎜ ⎟
− −=⎜ ⎟⎜ ⎟−⎜ ⎟− −⎜ ⎟⎜ ⎟⎝ ⎠
0B
0
6 12
1 6
0 0 0 0.0025 0.0025 00 0 0 0 0 0
0.0042 0.0042 0.0083 0 0 00.1963 0.1963 0 0.3275 0.3275 1(1) ,
0.3385 0.3385 0.6771 0.9519 0.0481 01.0283 0 1551 0.1833 0 0 0
7.5
×
×
−⎛ ⎞⎜ ⎟⎜ ⎟⎜ ⎟− −⎜ ⎟− − −=⎜ ⎟⎜ ⎟− − −⎜ ⎟− −⎜ ⎟⎜ ⎟⎝ ⎠
0B
0
6 1 6 63 4 5
1 6
0 0 0 0.0025 0.0025 00 0 0 0 0 0
0.0042 0.0042 0.0083 0 0 00.1963 0.1963 0 0.3275 0.3275 1(1) , (1) , and (1)
4.60.3385 0.3385 0.6771 0.2019 0.7981 00.3036 0.8797 0.1833 0 0 0
7.5
× ×
×
−⎛ ⎞⎜ ⎟⎜ ⎟⎜ ⎟− −⎜ ⎟ ⎛ ⎞− − −= =⎜ ⎟ ⎜ ⎟
⎝ ⎠⎜ ⎟− − −⎜ ⎟− −⎜ ⎟⎜ ⎟⎝ ⎠
0 0B B B
0
6 6 .16.92
×⎛ ⎞= ⎜ ⎟⎝ ⎠
0
The state equation for operation k can be assembled as:
17 71
7 72
7 73
7 74
7 75
( (0) 1) ( (0) 1)( (1) 1)
(1)(1)(1)(1)(1)(1)
1 11T TT T diag
×
×
×
×
×
⎛ ⎞ ⎛ ⎞ ⎛ ⎞⎜ ⎟ ⎜ ⎟ ⎜ ⎟⎜ ⎟ ⎜ ⎟ ⎜ ⎟⎜ ⎟ ⎜ ⎟ ⎜ ⎟
= +⎜ ⎟ ⎜ ⎟ ⎜ ⎟⎜ ⎟ ⎜ ⎟ ⎜ ⎟⎜ ⎟ ⎜ ⎟ ⎜ ⎟⎜ ⎟ ⎜ ⎟ ⎜ ⎟⎜ ⎟ ⎜ ⎟⎜ ⎟ ⎝ ⎠ ⎝ ⎠⎝ ⎠
Α xx
BΙ 0 0 0 0 0 0xB0 Ι 0 0 0 0 0x
0 0 Ι 0 0 0 0x0 0 0 Ι 0 0 0x0 0 0 0 Ι 0 0x0 0 0 0 0
1 1
2 22
3 33 35 1
4 44
5 55
6 61 35
2 1( (1) 0)
(1) (1)(1) (1)(1)(1) (1)(1) (1)(1) (1) ,(1) 0(1) (1)(1)(1) (1)
0
z z
z z
z z
y y
y y
x x
diag
f mf mf mf mf mf m
×
××
Δ + Δ⎛ ⎞⎛ ⎞⎜ ⎟Δ + Δ⎜ ⎟⎜ ⎟⎜ ⎟⎜ ⎟Δ + Δ⎜ ⎟ ⎛ ⎞⎜ ⎟
Δ + Δ⎜ ⎟ + ⎜ ⎟⎜ ⎟⎜ ⎟ ⎝ ⎠⎜ ⎟Δ + Δ⎜ ⎟⎜ ⎟⎜ ⎟ Δ + Δ⎜ ⎟⎜ ⎟⎝ ⎠⎜ ⎟
⎝ ⎠B
B 0 ζBB0
0
where identity block matrix in A(0) represents that the corresponding features have not
been machined. Since HTM is used to derive Δd(k) as shown in Eq. (2.22), dimension of
state vector has to be increased by using “1” as the last entry, i.e., (xT(k) 1)T. ζ(k) are the
stackup of ζj(k), where j=1, 2,…,5. Zeros in the last row of the model are introduced to
make the matrix dimension consistent.
Operation 2: Since FHP(2)≠I, expression of Ajd(k) presented in Eq. (2.17) does not
apply for the second operation. However, according to the corollary in Section 2.4.3, we

42
can still derive A(1) and B(2) by substituting non-identity matrix FHP in (2.16), followed
by the same procedure for deriving Eqs. (2.17), (2.18), and (2.21).
6 14
1 6
0.001 0.001 0 0.0023 0.0023 00.0038 0.0038 0.0075 0 0 00.0018 0.0018 0.0036 0 0 00.1892 0.1892 0 0.2025 0 2025 1(2) ,0.6081 0.0248 1 5833 0 0 0
0.3263 0.3263 0.6526 0 1725 0.8275 04.6
×
×
− −⎛ ⎞⎜ ⎟−⎜ ⎟⎜ ⎟− −⎜ ⎟− − −=⎜ ⎟⎜ ⎟−⎜ ⎟
− − −⎜ ⎟⎜ ⎟⎝ ⎠
0B
0
6 15
1 6
0.007 0.007 0 0.0024 0.0024 00.004 0.004 0.008 0 0 00.0011 0.0011 0.0023 0 0 00.2092 0.2092 0 0.0852 0.0852 1(2) ,0.5961 0.2203 0.6242 0 0 00.3608 0.3608 0.7216 0.9225 0.0775 0
1692
×
×
− −⎛ ⎞⎜ ⎟− −⎜ ⎟⎜ ⎟− − −⎜ ⎟− − −=⎜ ⎟⎜ ⎟−⎜ ⎟
− − −⎜ ⎟⎜ ⎟⎝ ⎠
0B
0
B1(2)= 07×7, and B2(2)=B3(2)=diag(06×6, 7.5).
Since datum error is generated by the first operation, state transition matrix must
be calculated. By Eqs. (2.21) and (2.22), rotational deviation of the surface caused by
datum errors can be expressed by 1
-12
3
(1)( ) ( ) ( ) (1)
(1)
Fjd Pk k k
⎛ ⎞⎜ ⎟
− ⎜ ⎟⎜ ⎟⎝ ⎠
xA J Φ EΨ R G x
x
, where j=4, 5. For
the convenience of displaying results, we can denote
( ) -11 2 3 ( ) ( ) ( ) F
j j j jd Pk k k= −Λ Λ Λ A J Φ EΨ R G . The results are
41 42
1 7 1 7
0.4305 0 0 0 0 0 0 0 0 0 0 09026 0 00 0 0.9026 0 0 0 0 0 0 0 0 0 0 00 0 0.4305 0 0 0 0 0 0 0 0 0 0 0
78.31 0 0 0 0 0 0 0 0 0 1 81 0 0, ,331 0 81 0 1 0 0 0 0 0 0 0 0 00 0 78.31 0 0 0 0 0 0 0 0 331 1 0
× ×
⎛ ⎞ ⎛ ⎞⎜ ⎟ ⎜ ⎟−⎜ ⎟ ⎜ ⎟⎜ ⎟ ⎜ ⎟⎜ ⎟ ⎜ ⎟− −= =⎜ ⎟ ⎜ ⎟⎜ ⎟ ⎜ ⎟−⎜ ⎟ ⎜ ⎟
− −⎜ ⎟ ⎜ ⎟⎜ ⎟ ⎜ ⎟⎝ ⎠ ⎝ ⎠
Λ Λ
0 0
43
1 7
0 0 0 0 0.9026 0 00 0 0 0 0 0 00 0 0 0 0 0 00 0 0 0 81 0 0 ,0 0 0 0 0 0 00 0 0 0 331 0 0
×
−⎛ ⎞⎜ ⎟⎜ ⎟⎜ ⎟⎜ ⎟
= ⎜ ⎟⎜ ⎟⎜ ⎟⎜ ⎟⎜ ⎟⎝ ⎠
Λ
0
51 52
1 7 1 7
0.2756 0 0 0 0 0 0 0 0 0 0 0.9613 0 00 0 0.9613 0 0 0 0 0 0 0 0 0 0 00 0 0.2756 0 0 0 0 0 0 0 0 0 0 0
86.59 0 0 0 0 0 0 0 0 0 1 34.09 0 0, ,31 0 34.09 0 1 0 0 0 0 0 0 0 0 00 0 86.59 0 0 0 0 0 0 0 0 31 1 0
× ×
−⎛ ⎞ ⎛ ⎞⎜ ⎟ ⎜ ⎟⎜ ⎟ ⎜ ⎟⎜ ⎟ ⎜ ⎟⎜ ⎟ ⎜ ⎟−= =⎜ ⎟ ⎜ ⎟⎜ ⎟ ⎜ ⎟− −⎜ ⎟ ⎜ ⎟
− −⎜ ⎟ ⎜ ⎟⎜ ⎟ ⎜ ⎟⎝ ⎠ ⎝ ⎠
Λ Λ
0 0
53
1 7
0 0 0 0 0.9613 0 00 0 0 0 0 0 00 0 0 0 0 0 00 0 0 0 34.09 0 0 ,0 0 0 0 0 0 00 0 0 0 31 0 0
×
⎛ ⎞⎜ ⎟⎜ ⎟⎜ ⎟⎜ ⎟
−= ⎜ ⎟⎜ ⎟⎜ ⎟⎜ ⎟⎜ ⎟⎝ ⎠
Λ
0

43
The translational deviation of surface can be calculated by
-11 3 1 4 1 4( ) ( ) ( ) ( 0)F F F F F F F F F T
jd P P P P P P P P Pk k k x y z x y z x y z× × ×−A J Φ EΨ 0 0 0 . We
denote this expression as a column vector 4jΛ . The calculation results are Λ54=Λ44=(01×3
-19.25 -131 -81.25 0)T.
The state equation can be assembled as
7 7 7 11 1
7 7 7 12 2
7 7 7 13
41 42 43 7 7 7 7 444
51 52 53 7 7 7 7 545
( (1) 1)( (2) 1)
(2) (1)(2) (1)(2)(2)(2)
11T T diag
× ×
× ×
× ×
× ×
× ×
⎛ ⎞⎛ ⎞⎜ ⎟⎜ ⎟⎜ ⎟⎜ ⎟⎜ ⎟⎜ ⎟
= ⎜ ⎟⎜ ⎟⎜ ⎟⎜ ⎟⎜ ⎟⎜ ⎟⎜ ⎟⎜ ⎟⎜ ⎟ ⎜ ⎟⎝ ⎠ ⎝ ⎠
Ax
I 0 0 0 0 0x x0 I 0 0 0 0x x0 0 I 0 0 0x xΛ Λ Λ 0 0 ΛxΛ Λ Λ 0 0 Λx0 0 0 0 0
1 11
2 22
3 33 35 13
4 444
5 555
1 35
( (2) 1)( (1) 1)
(2) (2)(2)(2) (2)(2)(2) (2)(2)(1)(2) (2)(2)(1)(2) (2)(2)(1)
01T T
z z
z z
z z
y y
y y
diag
f mf mf mf mf m
×
×
Δ +Δ⎛ ⎞⎛ ⎞
Δ +Δ⎜ ⎟⎜ ⎟⎜ ⎟⎜ ⎟ Δ +Δ⎜ ⎟⎜ ⎟
Δ +Δ⎜ ⎟+⎜ ⎟⎜ ⎟⎜ ⎟ Δ +Δ⎜ ⎟⎜ ⎟⎜ ⎟⎜ ⎟ Δ⎜ ⎟ ⎜ ⎟⎝ ⎠ ⎝ ⎠
Bx
BBB 0BxBx0 6 6
2 1
(2).
0
(2) (2)x xf m
×
⎛ ⎞⎜ ⎟⎜ ⎟⎜ ⎟
⎛ ⎞⎜ ⎟+⎜ ⎟⎜ ⎟⎝ ⎠⎜ ⎟
⎜ ⎟+Δ⎜ ⎟
⎜ ⎟⎝ ⎠
ζ
0
Solving the state equation for two operations, the model for root cause identification is
( )( )
( )( )
( )( )
(1) 0 (1) 0 (1) 0(1)given by (1) (1) (1)(2) 0 (2) 0 (2) 0
T T TT T T
T T TT T T
⎛ ⎞ ⎛ ⎞ ⎛ ⎞⎛ ⎞⎜ ⎟ ⎜ ⎟ ⎜ ⎟= +⎜ ⎟⎜ ⎟ ⎜ ⎟ ⎜ ⎟⎜ ⎟⎝ ⎠⎜ ⎟ ⎜ ⎟ ⎜ ⎟
⎝ ⎠ ⎝ ⎠ ⎝ ⎠
y u ζB 0y = C A B By u ζ
.
Output matrix C is determined by the selection of measured features. An
optimized selection of measured features for root cause identification must maximize the
rank of matrix Γ, while minimize number of rows in matrix C, i.e., the minimum number
of components in vector y. In this example, the number of errors to be determined is 12
and the minimum number of feature components to be measured should be 12. Each
feature component is selected as one entry in vector xj(k), e.g., vj(k) in xj(k) can be chosen
as a feature component. Thus, the entry “1” appears at most once in each row of feature
selection matrix C. The position of “1” is determined by non-zero entry in
(1)(1) (1) (2)
⎛ ⎞⎜ ⎟⎜ ⎟⎝ ⎠
B 0A B B
. For this case study, 4 features are selected and the output matrix C is

44
chosen as: 1 212 72
3 4×
⎛ ⎞= ⎜ ⎟⎝ ⎠
0 C C 0 0 0 0 0 0 0C
0 0 0 0 0 0 0 0 C C, where
1 4
1 4 1 4 1 4 4 6 1
1 4
1 0
0 0
×
× × × ×
×
⎛ ⎞⎜ ⎟= ⎜ ⎟⎜ ⎟⎝ ⎠
0C 0 0 I 0
0, 5 5
2 6 11×
×
⎛ ⎞= ⎜ ⎟⎝ ⎠
0C 0 ,
1 4
3 4 1 4 1 4 4 6 1
1 4
1 0
0 0
×
× × × ×
×
⎛ ⎞⎜ ⎟= ⎜ ⎟⎜ ⎟⎝ ⎠
0C 0 0 I 0
0, and
5 54 6 21
××
⎛ ⎞= ⎜ ⎟⎝ ⎠
0C 0 . The size of other zero block matrices in C is 7×7.
After removing the zero rows in u and corresponding columns in
(1)(1) (1) (2)
⎛ ⎞⎜ ⎟⎜ ⎟⎝ ⎠
B 0C A B B
, we obtain the equation (1) Δ (1) Δ (1)(2) Δ (1) Δ (1)
+⎛ ⎞ ⎛ ⎞= +⎜ ⎟ ⎜ ⎟⎜ ⎟ ⎜ ⎟+⎝ ⎠ ⎝ ⎠
y f my = Γ εy f m
for
diagnosis of errors that occur at each operation, where ε is the noise term composing of
ζ(1) and ζ(2) in the first and second operations and
*
0 0 0 0.0025 0.0025 0 0 0 0 0 0 00.0083 0.0042 0.0042 0 0 0 0 0 0 0 0 0
0 0.1963 0.1963 0.3275 0.3275 1 0 0 0 0 0 00.6771 0.3385 0.3385 0.9519 0.0481 0 0 0 0 0 0 0
0.1833 1.0283 0.1551 0 0 0 0 0 0 0 0 00.1833 0.3036 0.8797 0 0 0 0 0 0 0 0 0
0 0 0 0.678 0.6
−− −− − −
− − −− −− −
=−
Γ78 0 0 0.001 0.001 0.0023 0.0023 0
0.0036 0.0018 0.0018 0 0 0 0.0036 0.0018 0.0018 0 0 00 0.1963 0.1963 60.6183 60.6183 1 0 0.1892 0.1892 0.2025 0.2025 1
0.675 0.3375 0.3375 0.1725 0.8275 0 1.5833 0.6801 0.0248 0 0 00.4692 0
− −− − − −− − − − − −− − − − −
− −
.
.702 0.1712 248.25 248.25 0 0.6526 0.3263 0.3263 0.1725 0.8275 00.5383 0.6675 0.2057 23.25 23.25 0 0.7216 0.3608 0.3608 0.9225 0.0775 0
⎛ ⎞⎜ ⎟⎜ ⎟⎜ ⎟⎜ ⎟⎜ ⎟⎜ ⎟⎜ ⎟⎜ ⎟⎜ ⎟⎜ ⎟⎜ ⎟⎜ ⎟⎜ ⎟⎜ ⎟⎜ ⎟− − − −⎜ ⎟⎜ ⎟− − − − − −⎝ ⎠
It can be observed that the rank of Γ* is 12. The least square estimation can thus
be performed. Therefore, measuring 4 features makes it possible to identify 12 error
components. Only 12 components in quality characteristic y are needed for identifying if
there are errors. The proposed approach identifies location of root cause without having
to find out every potential error. Compared with quality characteristic components (at

45
least 24) and 6 features measured based on the previous model, reduction on the model
dimension and measurements by the proposed approach is significant. If fixture and
machine tool errors should be further distinguished, the strategy of sequential root cause
identification suggests that additional in-process measurement only needs to be taken on
the faulty (equivalent) locator(s). Therefore, the proposed strategy generally requires less
features and in-process measurement for root cause identification.
2.6 Summary
This chapter presents a mathematical formulation of error equivalence and
prediction of process variations. The error equivalence formulation, based on a novel
concept of error equivalence transformation, helps to understand and model the
mechanism that different error sources result in the identical variation pattern on part
features. The derived quality prediction model (causal model) embedded with error
equivalence mechanism can reveal more physical insights into the process variation.
As an application of error equivalence model in a multi-operational machining
processes, this chapter presents a variation propagation modeling that facilitates root
cause identification and measurement strategy. The benefit of introducing equivalent
errors in the process modeling is that the process errors can be grouped with the base
error (in the machining process, datum error and machine tool error can be grouped with
fixture error). As a result, the dimension of model inputs is significantly reduced
compared with previous modeling methodologies.
The feasibility of error grouping is discussed. It is shown that the symmetry of
HTM in the infinitesimal analysis is the key factor for error grouping since the coordinate

46
transformation may possibly violate the symmetry in HTM multiplication. The modeling
results indicate that HTM between the PCS and the FCS does not affect the symmetry in
HTM multiplication. This grouping approach requires merging the MCS and the FCS
during modeling to satisfy the condition of grouping. The requirement can easily be
satisfied in the modeling stage.
The case studies demonstrated the validity of error equivalence model in the
machining process, modeling procedure, and its implementation in measurement
reduction. The modeling work presented in this chapter establishes the basis for root
cause identification of multiple error sources and error-canceling-error automatic process
adjustment.

47
Chapter 3
Error Cancellation Modeling and Its Application in Process Control*
Due to the error equivalence mechanism, the impacts of errors on part features
may cancel one another. Error cancellation may hinder the error information from being
identified and therefore increase the complexity of root cause identification. However, we
can maneuver one error to cancel other errors and reduce process variation. By
considering such dual effects of error cancellation, this chapter intends to study the
implications of error cancellation based on the derived error equivalence model.
Section 3.1 analyzes error cancellation and its theoretical implications from the
perspectives of process monitoring and control, including root cause diagnosis and error
compensation. Using error cancellation, a sequential root cause identification procedure
and error-canceling-error methodology are developed to reduce the time invariant process
errors. In Section 3.2, the proposed diagnostic procedure is demonstrated by a machining
experiment and the error compensation is also illustrated with a simulation study. A
summary is given in Section 3.3.
*The work in this chapter has appeared in Wang, H. and Huang, Q , 2006, “Error Cancellation Modeling and Its Application in
Machining Process Control,” IIE Transactions on Quality and Reliability, 38, pp.379-388.

48
3.1 Error Cancellation and Its Theoretical Implications
It has been widely noted that the impact of multiple error sources on product
features may cancel out one another. This phenomenon may have the drawback that it is
possible for it to conceal the fact that multiple errors have occurred in the process,
however, there is the opportunity for us to purposely use one type of error to counteract
or compensate another error and thereby reduce variation.
Error equivalence can model the error cancellation and the impact of errors on
feature deviation. By Eq. (2.6), we have
E(x)=ΓE(u*)= Γ*E( *=1Σ p
i iu )=Γ*E( =1Σ pi i iK u ), and (3.1a)
Cov(x)= Γ*Cov(u*)Γ*T+ Cov( )ε = Γ*Cov[ =1Σ Cov( )p Ti i i iK u K ]Γ*T+ Cov( )ε , (3.1b)
where E(.) and Cov(.) represent expectation and variance-covariance matrix of random
variables in the parentheses.
Eq. (3.1a) indicates that the cancellation effect of three types of errors can be
modeled as a linear combination of mean shift of equivalent amount of base errors, i.e.,
*=1(Σ )p
i iE u ,. Their impacts on feature deviation are described by mapping matrix Γ* in Eq.
(2.6). For a special case that three types of errors completely cancel each other, i.e.,
*=1(Σ )p
i iE u is statistically insignificant, the mean of process output is within control. It
should be noticed that the variances caused by three types of errors cannot be cancelled
(see Eq. (3.1b)). In the machining process, Eq. (2.6) becomes
x= ( )( )* * * +TT T TΔ Δ ΔΓ Γ Γ d f m ε =Γ*(Δd+Δf+Δm)+ε (3.2)
and error cancellation is modeled by E(Δd+Δf+Δm).

49
Modeling of error cancellation has many theoretical implications on machining
process control. This section discusses the implications on three issues: diagnosability
analysis, root cause identification, and error compensation.
3.1.1 Diagnosability Analysis of Manufacturing Process with Error Equivalence
This chapter studies the diagnosability of the process that is governed by a general
linear causal model as follows, which relates the errors to the feature deviation x,
x ( )1 2 .TT T T
p= + = +Γu ε Γ u u u ε (3.3a)
where matrix Γ is determined by the part specification. Its relationship with Γ* will be
discussed in Proposition 3.1. In the machining process, the model becomes
x= ( )D .TT T T
mδΔ +Γ x f q ε (3.3b)
Under a certain measurement strategy, diagnosability study aims to determine
whether all the process errors ui’s are estimable. If the process is diagnosable, the least
square estimation (LSE) can be performed, i.e.,
( )1 2
TT T Tpu u u =(ΓTΓ)-1Γx. (3.4)
The diagnosability depends on the rank of Γ (Zhou, et al., 2003). We can see that Eq. (3.4)
requires ΓTΓ to be full rank, or equivalently, all the columns in Γ to be independent.
Proposition 1 addresses the structure of Γ for a machining process.
Proposition 3.1. If error equivalence holds for process errors ( )1 2
TT T Tpu u u , the
process will not be diagnosable with measurement of quality characteristic x. In the
machining process, block matrices in matrix Γ (see Eq. (3.4)) corresponding to three

50
types of errors are dependent and matrix ΓTΓ is always not full rank, i.e., fixture, datum,
and machine tool errors cannot be distinguished by measuring the part features only.
Proof. If we use transformation matrices Ki to transform errors ui to base error u1, Eq.
(2.6) becomes
( )* * *2 1 2= .
TT T Tp p⎡ ⎤ +⎣ ⎦x Γ Γ K Γ K u u u ε (3.5a)
In the machining process, matrices K2 (from Eq. (2.8)) and K3 (Eq. (2.9)) transform
datum error Dx to Δd and machine tool error δqm to Δm, respectively. Eq. (2.6) becomes
( )* * *2 3 D=[ ] + .
TT T TmδΔx Γ K Γ Γ K x f q ε (3.5b)
Comparing Eq. (3.5a) with Eq. (3.4), we obtain matrix Γ= * * *2 p⎡ ⎤⎣ ⎦Γ Γ K Γ K .
However, the columns corresponding to fixture and machine tool errors in matrix Γ are
dependent because columns of Γ*Ki’s are the linear combination of columns of Γ*.
Therefore, rank of Γ equals the rank of Γ*. This also implies that the system is not
diagnosable.
An implication of this proposition is that LSE of ( )1 2
TT T Tpu u u in Eq. (3.4)
cannot be obtained. However, the causal model (3.2) with error grouped eliminates the
linearly dependent columns in matrix Γ and therefore Γ can be full rank. This fact leads
to sequential root cause identification in Section 3.1.2.
3.1.2 Sequential Root Cause Identification
Using Eq. (3.2), the grouped errors u can be estimated as
*( ) *( ) * * 1 * ( )1
ˆ ˆ ( )pn n T T nii
−=
= =∑u u Γ Γ Γ x , n=1, 2, …, N, (3.6a)

51
where *( )ˆ niu is the LSE of ui for the nth replicate of measurement. In a machining process,
*( )1ˆp n
ii=∑ u becomes ( ) ( ) ( )ˆˆ ˆn n nΔ + Δ + Δd f m . Each row of Γ* corresponds to output feature
while each column of Γ* corresponds to component of error vectors. Hence, the number
of rows of Γ* must be larger than the number of its columns to ensure that sufficient
features are measured for LSE. The mean and variance-covariance of the detected errors
are
1ˆ ˆE( ) E( )p
i ii== ∑u K u and
1垐Cov( ) Cov( ) .p T
i i ii== ∑u K u K (3.6b)
Proposition 3.1 indicates that measurement other than quality characteristics x is
necessary to distinguish error sources. However, it will not be economical to take the
additional measurement if no process error occurs. A sequential procedure is thus
proposed for root cause identification:
• Necessary error information (e.g., off-line measurement on workpieces) is collected
first to identify the occurrence of error sources using Eq. (3.6a). The process error
information can be analyzed by conducting hypothesis test on ( )1ˆ{ }n N
n=u . Since the
estimated u is a mixture of noise and errors, a proper test statistic should be
developed to detect the errors from process noise. Hypothesis testing for mean and
variance can then be used to find out if the errors are mean shift or large variance.
• Additional measurement (e.g., in-line measurement on process errors) is then
conducted to distinguish different types of errors ( )1 2
TT T Tpu u u . E( u ) and
Cov( u ) will be estimated with the in-process measurement of (p-1) error sources. By
Eq. (3.6b) the remaining unmeasured errors can be obtained. The detailed procedures
for the machining process will be given in the Section 3.2.1.

52
3.1.3 Error-Canceling-Error Compensation Strategy
We can use the effect of error cancellation to compensate process errors. An
adjustment algorithm based on error equivalence mechanism can be designed to adjust the
base error u1 to compensate the other process errors {ui} 2pi= . With the development of
adjustable fixture whose locator length is changeable, it is feasible to compensate errors
only by changing the length of locators. We use index i to represent the ith adjustment
period. During period i, N part feature deviations {x(i), (n)} 1Nn= are measured to determine
the amount of locator adjustment. Such compensation is only implemented at the
beginning of the period. Denote c(i) as the accumulative amount of locator length adjusted
after the ith period and the beginning of period i+1. The compensation procedure can be
illustrated with Fig. 3.1. One can see that a nominal machining process is disturbed by
errors Δd, Δf and Δm, and the observation noise ε. Error sources, noise, and machining
process constitute a disturbed process, as marked in the dash line block. Using the feature
deviation x(i) for the ith period as input (x(i) can be estimated by the average of N
measured parts in the period i, i.e., ( ) ( )ˆ i i=x x ), an adjustment algorithm is introduced to
generate signal c(i) to manipulate adjustable fixture locators to counteract the errors for the
(i+1)th machining period. The amount of compensation at period i+1 should be c(i)-c(i-1).
The error compensation model can then be
x(i+1)=S(i+1)+Γ*c(i) and S(i+1)=Γ*u(i+1)+ε(i+1), (3.7)
where S(i+1) is the output of the disturbed process for time i+1. This term represents the
feature deviation measured without any compensation being made.

53
Figure 3.1 Error-Canceling-Error Strategy
The adjustment using equivalent errors can be illustrated with an example in Fig.
3.2, where a prismatic part is set up in a fixture with locators f1, f2, and f3. We expect to
perform a parallel cutting on the top plane of the part. If the tool path tilts due to thermal
effect, the yielded top plane will also tilt the same angle. However, under the adjustable
fixture where the length of locator pin is adjustable, we may find out the adjustment
amount (black bar in right panel of Fig. 3.2) for f1, f2, and f3 such that the part tilts the
same angle as the deviated tool path. Obviously, a conforming part can still be obtained.
Similarly, we can also adjust fixture locators to compensate the datum error. The amount
of adjustment can be determined by EFE using Eq. (2.9). With this concept, the feature
deviation caused by machine tool thermal error (tilted tool path) can also be generated by
EFE (Δm1 Δm2 Δm3) alone. In order to compensate this error, we must apply the amount
of adjustment (-Δm1 -Δm2 -Δm3) to these locating pins.
Figure 3.2 Process Adjustment Using EFE Concept
f1 f2
f3
Deviated tool pathDeviated tool
f1
Δm1 Δm2 Δm3
f2
f3
x
Adjustmentc
u Nominal Machining (Γ)
ε

54
In this chapter, the compensation focuses on time invariant error because they
account for the majority of overall machining errors (Zhou, Huang, and Shi, 2003). The
negative value of predicted equivalent errors can be used to adjust locators. From Eq.
(3.7), it is clear that if we set Γ*c(i)=-Γ*u(i+1), then the adjustment can cancel out the
process errors and deviation is x(i+1)= ε(i+1). The adjustment c(i) can be the LSE of u(i+1),
i.e.,
c(i)= ( 1)ˆ i+u =-[ * * 1 * ( )( )T T i−Γ Γ Γ x -c(i-1)], and c(1)= * * 1 * (1)( )T T−− Γ Γ Γ x . (3.8)
By solving the recursive Eq. (3.8), we derive an integral adjustment that can
minimize mean square error (MSE) of the feature deviation, i.e.,
c(i)= * * 1 * ( ) ( ) ( ) ( )
1 1
ˆˆ ˆ( ) ( )i i
T T t t t t
t t
−
= =
− = − Δ + Δ + Δ∑ ∑Γ Γ Γ x d f m . (3.9)
Eq. (3.9) shows that the accumulative amount of compensation for the next period is equal
to the sum of the LSE of EFE of all current and previous time periods of machining. The
accumulative compensation c(i) is helpful for evaluation of adjustment performance such
as stability and robustness analysis. The amount of compensation for the i+1th period is
c(i)- c(i-1),
( ) ( 1) * * 1 * ( )( )i i T T i− −− = −c c Γ Γ Γ x . (3.10)
The compensation accuracy can be estimated by x(i)-Γ*( *TΓ Γ*)-1 *TΓ x(i), i.e., the
difference between x(i) and its LSE. Denote range space of Γ* as R(Γ*) and null space of
*TΓ as N( *TΓ ). Spaces R(Γ*) and N( *TΓ ) are orthogonal and constitute the whole vector
space Rq×1, where q is the number of rows in x(i) (or Γ*). By the property of LSE, we
know that the estimation error vector x(i)- Γ*( *TΓ Γ*)-1 *TΓ x(i) is orthogonal to R(Γ*).
Therefore, the compensation accuracy of Eq. (3.9) can be estimated by projection of

55
observation (feature deviation) vector x(i) onto N( *TΓ ). This conclusion also shows the
components of observation that can be compensated. The projection of observation vector
x(i) onto space R(Γ*) can be fully compensated with Eq. (3.9) whereas the projection onto
N( *TΓ ) cannot be compensated.
In practice, the accuracy that the adjustable locator can achieve must be
considered. Suppose the standard deviation of locator’s movement is σf. We can set the
stopping region for applying error compensation with 99.73% confidence
-3σf≤c(i)-c(i-1)≤3σf. (3.11)
It should be noted that the error-canceling-error strategy in Eq. (3.9) is valid for
compensation of time invariant process errors. Compensation strategy for dynamic errors
will be studied in Chapter 5.
3.2 Applications of Error Cancellation in a Milling Process
Discussion in Section 3.1 implies the application of equivalent errors in sequential
root cause identification and error compensation. The diagnostic algorithms are proposed
in this section and demonstrated with a machining experiment. EFE compensation for
process control is illustrated with a simulation.
3.2.1 Diagnosis Based on Error Equivalence
There are several diagnostic approaches (Ceglarek and Shi, 1996; Apley and Shi,
1998; and Rong, Shi, and Ceglarek, 2001) that have achieved considerable success in
fixture errors detection. The approach proposed by Apley and Shi (1998) can effectively
identify multiple fixture errors. By extending this approach, we use it for sequential root
cause identification:

56
Step 1: Conduct measurement on features and datum surfaces of raw workpiece to
estimate error sources *( )ˆ nu for the nth replicate by Eq. (3.6). The grouped error can be
estimated by the average of ( )ˆ nu over N measured workpieces, i.e., * *( )
1
1ˆ ˆN
n
nN =
= ∑u u ,
n=1,2, …N. As mentioned in Section 3.2, the error vector ( )ˆ nu is the mixture of error
sources and process noise.
Step 2: To detect the errors from the process noise, we can use F test statistic introduced
by Apley and Shi (1998):
2
* * -1 2,
ˆˆ[( ) ]
ii T
i i
SFSε
=Γ Γ
, i=1, 2, …, 6, (3.12)
where 2 ( ) 2
1
1ˆ ˆ[ ]N
ni i
nS u
N =
= ∑ , and ( )ˆ niu represents the ith component in vector u (n). * * -1
,( )Ti iΓ Γ
is the ith diagonal entry of matrix * * 1( )T −Γ Γ . The estimator for variance of noise is
2 ( ) ( )
1
1ˆ ˆ ˆ( - 6)
Nn T n
nS
N qε=
= ∑ε ε , and ( ) ( ) * ( )ˆ ˆn n n= −ε x Γ u is for noise terms. When Fi>F1-α(N, N(q-
6)), we conclude that the ith error significantly occurs with confidence of 100(1-α)%. By
investigating { ( )ˆ niu } 1
Nn= for mean ui (H0: ui=0 vs. H1: ui≠0), and variance σ 2
ui (H0: σ 2ui≤σ
20
vs. H1: σ 2ui >σ
20 ), one can determine whether the pattern of the errors is mean shift or
variance. σ 20 is a small value. In the case study, we choose σ 2
0 =0.1mm2. Under the
normality assumption of EFEs (Δd, Δf, and Δm), we can use the T test statistic
( ) 2
1
1/ ( )( 1)
Nn
i i in
T u u uN N =
= −− ∑ and compare it with t1-α/2(n-1) to test mean shift.
2 ( ) 2 20
1
( ) /N
ni i
n
u uχ σ=
= −∑ is used and compared with χ 21 α− (n-1) to test variance. α is the

57
significance level. If Fi<F1-α(N, N(q-6)), no errors occur at the ith locator, or the errors
cannot be distinguished from process noise.
Step 3: Apply the additional measurement on locators and datum surfaces to distinguish
errors whenever errors are identified. Denote Δf ( )ni , Δd ( )n
i , and Δm ( )ni as the ith
component in vector Δf(n), Δd(n), and Δm(n), respectively. Locator deviation {Δf ( )ni } 1
Nn=
and datum surfaces {X ( )nj } 1
Nn= are measured. The EFE {Δd ( )n
i } 1Nn= caused by datum error
can be calculated by Eq. (2.8). The mean shift of the errors can be estimated using the
sample mean of Δd ( )ni , Δf ( )n
i , and Δm ( )ni =u ( )n
i -Δd ( )ni -Δf ( )n
i . The variance can then be
estimated by the sample variance for Δd ( )ni , Δf ( )n
i , and Δm ( )ni . If the errors turn out to be
the mean shift (ui≠0 for certain i), machine tool error in terms of EFE is ˆ imΔ = ˆiu -Δdi-Δfi,
where Δdi and Δfi are the average EFE over all N parts. Machine tool error δqm is then
determined by the inverse of Eq. (2.9)
δqm=1
3 .− ΔK m (3.13)
The variance of grouped error (σ 2ui ) can then be decomposed as
2 2 2 2ui di fi miσ σ σ σ= + + . (3.14)
If σ 2ui >σ
20 , variances caused by three types of errors 2
diσ , 2fiσ , and 2
miσ can be estimated
by the sample variance of {Δd ( )ni } 1
Nn= , {Δf ( )n
i } 1Nn= , and {Δ ( )ˆ n
im } 1Nn= . The 100(1-2α)%
confidence interval (CI) of Δm is ( ˆΔ ±m L ), where z1-α follows the cumulative standard
normal distribution such that 21 / 21 1
2z ue duα α
π− −
−∞= −∫ and
-1 -11 1,1 1 6,6
6 1ˆ ˆ( ( ) ... ( ) )T T T
u u u uz zα ε α εσ σ− −×
=L Γ Γ Γ Γ . The corresponding CI vector for δqm is

58
( 1 13 3− −Δ ±K m K L ). The CI for Δd and Δf can be obtained by (Δdi 1 / 2 ( 1) /diS t n nα−± − ) and
(Δfi 1 / 2 ( 1) /fiS t n nα−± − ), where Sdi and Sfi are the sample variance for {Δd ( )ni } 1
Nn= and
{Δf ( )ni } 1
Nn= . This approach can effectively identify the machine tool errors.
Identification of error occurrence Decision-making on taking in-process measurement on
certain
Error decomposition and individual error identification
Diagnosability analysis
*( ) * * -1 * ( )ˆ = ( )n T T nu Γ Γ Γ x2
* * -1 2,
ˆˆ[( ) ]
ii T
i i
SFSε
=Γ Γ
* *2[ ]pΓ Γ K Γ K
( )1
ˆ ˆE( ) p ni ii=
= ∑u K u
1ˆ ˆCov( ) Cov( )p T
i i ii==∑u K u K
iu
Sequential Root Cause Identification Identification of error occurrence Decision-making on
taking in-process measurement on
certain
Error decomposition and individual error identification
Diagnosability analysis
*( ) * * -1 * ( )ˆ = ( )n T T nu Γ Γ Γ x2
* * -1 2,
ˆˆ[( ) ]
ii T
i i
SFSε
=Γ Γ
* *2[ ]pΓ Γ K Γ K
( )1
ˆ ˆE( ) p ni ii=
= ∑u K u
1ˆ ˆCov( ) Cov( )p T
i i ii==∑u K u K
iu
Identification of error occurrence Decision-making on taking in-process measurement on
certain
Error decomposition and individual error identification
Diagnosability analysis
*( ) * * -1 * ( )ˆ = ( )n T T nu Γ Γ Γ x2
* * -1 2,
ˆˆ[( ) ]
ii T
i i
SFSε
=Γ Γ
* *2[ ]pΓ Γ K Γ K
( )1
ˆ ˆE( ) p ni ii=
= ∑u K u
1ˆ ˆCov( ) Cov( )p T
i i ii==∑u K u K
iu
Sequential Root Cause Identification
Figure 3.3 Sequential Root Cause Identification Procedures
Fig. 3.3 shows the sequential diagnostic methodology under the error equivalence
mechanism. It can be seen that the sequential diagnostic methodology includes
diagnosability analysis (Proposition 3.1) and sequential root cause identification.
To demonstrate the model and the diagnostic procedure, we intentionally
introduced datum and machine tool errors to mill 5 block workpieces. We use the same
setup, raw workpiece, and fixturing scheme as Fig. 2.10. Coordinate system xyz fixed
with nominal fixture is also introduced to represent the plane. Top plane X1 and side
plane X2 are to be milled. All 8 vertices are marked as 1~8 and their coordinates in the
coordinate system xyz are measured to help to determine X1 and X2. In this chapter, the
unit is mm for the length and radian for the angle. Under the coordinate system in the Fig.
2.9, surface specifications are X1=(0 0 1 0 0 15.24)T, and X2=(0 1 0 0 96.5 0)T. From
model (3.2) and Eq. (2.23), we get *1*2
( ) ,i i i i i⎛ ⎞= Δ + Δ + Δ +⎜ ⎟⎝ ⎠
Γx d f m ε
Γwhere

59
1
0 0.0263 0.0263 0 0 00.0158 0.0079 0.0079 0 0 0
0 0 0 0 0 0,
0 0.1379 0.1379 13368 13368 10.0828 0.0414 0.0414 1.5 0.5 013033 0.8483 1.1517 0 0 0
−⎛ ⎞⎜ ⎟−⎜ ⎟⎜ ⎟
=⎜ ⎟− − −⎜ ⎟
⎜ ⎟− −⎜ ⎟⎜ ⎟− −⎝ ⎠
Γ
2
0 0 0 0.0263 0.0263 00 0 0 0 0 0
0.0158 0.0079 0.0079 0 0 0.
0 0.2632 0.2632 1.2026 1.2026 10.158 0.079 0.079 1.5 05 00.2212 1.6106 0.3894 0 0 0
−⎛ ⎞⎜ ⎟⎜ ⎟⎜ ⎟− −
=⎜ ⎟− − −⎜ ⎟
⎜ ⎟− − −⎜ ⎟⎜ ⎟−⎝ ⎠
Γ
The number of rows q in Γ is 12. We set fixture error to be zero (Δf=0). The primary
datum plane I is pre-machined to be XI=(0 0.018 -0.998 0 0.207 -1.486)T and its
corresponding EFE is Δd=(1.105 0 0 0 0 0)Tmm. The machine tool error is set to be
δqm=(0 0.175 -1.44 0.0175 0 0)T by adjusting the orientation and position of tool path.
Based on coordinates of the vertices 1~8 measured, the feature deviations are given in
Table 3.1. Since X1 and X2 are all planes, the deviations Δrj’s of surface size are all zero.
Following steps 1-3, the identified EFEs are given in Tables 3.2 and 3.3.
Table 3.1 Measured Features (mm) X1 X2 n 1 2 3 4 5 1 2 3 4 5 Δvx Δvy Δvz Δpx Δpy Δpz
-0.001 -0.033 0.000 0.000 -0.145 -3.877
-0.000 -0.034 -0.000 -0.000 -0.163 -2.749
0.000 -0.0390.000 0.000 -0.119-2.329
-0.000-0.0340.000 0.000 -0.185-3.509
0.001 -0.0350.000 0.000 -0.153-2.459
0.0000.0000.0320.0000.3470.579
-0.0000.000 0.034 0.000 0.379 0.358
0.000 0.000 0.032 0.000 0.253 0.479
0.0000.0000.0360.0000.3070.539
0.0000.0000.0350.0000.2680.429
Table 3.2 Estimation of u for 5 Replicates (mm)
u (1) u (2) u (3) u (4) u (5) u T χ2 2.937 0.050 0.002 0.055 0.047 0.004
2.133 0.090 0.090 -0.031 -0.031 0.000
1.775 -0.064 -0.0562 0.003 0.004 -0.001
2.697 0.057 0.057 0.039 0.039 0.000
1.902 0.002 0.020 0.015 0.018 -0.001
2.289 0.027 0.023 0.016 0.015 0.001
10.119 - - - - -
10.247 - - - - -
We choose α to be 0.01. The threshold value F0.99(5,5(12-6))=F0.99 (5,30) =3.699.
In Table 3.2, we can see that F1>3.699, which indicates that error occurs at locator 1.
Using the data in the first row of Table 3.2 to conduct T and χ2 tests for mean and

60
variance, respectively, we find that T>t1-0.01/2 (5-1)= t0.995(4)=4.604 and
χ2<χ 21 0 01− (4)=13.277. Hence, we conclude that there is significant mean shift while the
variance is not large. If we make the additional measurement, by Eq. (3.13), the 98%
confidence interval for the detected mean shift of machine tool error is δqm=(0.006 0.167
-1.540 0.018 -0.000 0.000)T± (0.008 0.001 0.000 0.000 0.001 0.000)T, which is consistent
with the pre-introduced errors. The EFE causal model and diagnostic algorithm is
experimentally validated.
Table 3.3 Error Decomposition (mm) Locators u Fi Δf Δd Δm
1 2 3 4 5 6
2.289 0.027 0.023 0.016 0.015 0.001
19.5250.051 0.005 0.613 0.073 0.002
0 0 0 0 0 0
1.105 0 0 0 0 0
1.184 0.027 0.023 0.016 0.015 0.003
Figure 3.4 Error Compensation for Each Locator
3.2.2 Error Compensation Simulation
Using the same machining process as in Section 3.2.1, we can simulate error
compensation for 5 adjustment periods. Total 5 parts are sampled during each period. The
fixture error is set to be Δf=(0.276 0 0 0.276 0 0)Tmm. The machine tool error is set to be

61
δqm=(-0.075 -0.023 0.329 -0.0023 0.0075 0)T and its EFE is Δm=(0 0 0.286 0 0 0)Tmm.
We assume the measurement noise to follow N(0, (0.002mm)2) for displacement and N(0,
(0.001rad)2) for orientation. The compensation values can be calculated by Eqs. (3.9) and
(3.10). In this case study, the accuracy of the locator movement is assumed to be
σf=0.01mm and the criterion for stopping the compensation is -0.03≤c(i)-c(i-1)≤0.03mm
(see Eq. (3.11)). Fig. 3.4 shows the compensation (c(i)-c(i-1)) for locators f1~f4. The values
of adjustment periods 2~5 are given by the solid line in the figure. The dash dot line
represents the value of ± 3σf. The adjustments for locators f5 and f6 are all zero and not
shown in the figure. One can see that the effect of compensation in the second period is
dominant. The compensation for the subsequent periods is relatively small because no
significant error sources are introduced for these periods.
1 2 3 4 515
15.1
15.2
15.3
15.4
Adjustment Period
lz(m
m)
1 2 3 4 596.3
96.35
96.4
96.45
96.5
96.55
Adjustment Period
ly (m
m)
1 2 3 4 50
0.1
0.2
0.3
0.4
Adjustment PeriodSta
ndar
d de
viat
ion
of lz
(mm
)
1 2 3 4 50
0.1
0.2
0.3
0.4
Adjustment PeriodSta
ndar
d de
viat
ion
of ly
(mm
)
Figure 3.5 Mean and Standard Deviation of Two Features
The effect of error compensation can be illustrated with the quality improvement
of two features, the plane distance along z axis (lz) and y axis (ly) as shown in Fig. 3.5. lz
can be estimated by the mean and standard deviation of length of edges l15, l 26, l 37 and l
48 and ly can be estimated by l14, l23, l67 and l58 for each machining period, where lmn is the

62
distance between the vertices m and n and is estimated by the edge length of 5 parts in
each period. Milling of planes X1 and X2 impacts the plane distance along z and y axes.
The nominal part should have the same length of edges along z and y directions (15.24
and 96.5mm, see the dash line in Fig. 3.5), respectively. However, in the first adjustment
period (i=1) without error compensation, the errors of edge lengths are beyond specified
tolerance. In the periods 2~5 when compensation algorithm has been applied, deviation
of lz and ly is significantly reduced.
3.3 Summary
This chapter investigates error cancellation among multiple errors (datum, fixture,
and machine tool errors) for improving quality control in machining processes. As a
summary, the implications of studying error cancellation are as follows:
First, process errors may cancel one another and conceal the error information. It
has been proved that a machining process with datum, fixture, and machine tool errors
cannot be diagnosable by only measuring the part features. To overcome this problem, a
sequential procedure is therefore proposed, i.e., first identify error occurrence based on
measurement of product deviation x and an F test statistics, and then discriminate error
sources using in-process measurements (not product features) and hypothesis test only if
process error is detected. This procedure can detect the mean shift as well as the variance
of process errors from the process noise. A case study for a milling process of block parts
has shown that the proposed approach can effectively identify the error sources.
Second, an error-canceling-error process adjustment strategy can be developed.
Study of error cancellation also suggests that errors (machine tool and datum errors) can

63
be compensated by adjusting the base error (the length of fixture locators). An integral
adjustment algorithm is presented in this chapter for compensation of time invariant error.
It has been shown that the accumulative amount of compensation is equal to the sum of
the LSE of EFE of all previous time periods of machining. The procedure has been
demonstrated with a simulation study.

64
Chapter 4
Dynamic Error Equivalence Modeling and In-Line Monitoring of Dynamic Equivalent
Fixture Errors*
This chapter studies the error equivalence of dynamic errors and thereby
establishes a process model for the purpose of APC based on the dynamic equivalent
errors. Considering process monitoring and data collection, this chapter presents a new
concept, in addition to the widely recognized error avoidance and error compensation
approaches, to control the effects of dynamic errors by in-line monitoring of process
dynamic errors. This chapter selects the thermal effect of machine tool errors as an
example to demonstrate the modeling and monitoring of dynamic equivalent errors.
The remainder of the chapter includes 4 sections. Section 4.1 introduces the
problems in dynamic process modeling. In Section 4.2, based on an experiment, latent
variable modeling (LVM) method is applied to build an ARX model for dynamic errors
(thermal errors). Variable selection strategy is also discussed for the situation that high
accuracy is required for model prediction. Using the latent variable model, the in-line
monitoring of thermal error and control chart design are presented in Section 4.3. Section
4.4 discusses the isolation of lagged variables and sensors responsible for out-of-control
signals. A summary is given in Section 4.5.
*This work will appear in Wang, H., Huang, Q., and Yang, H., 2007, “Latent Variable Modeling and In-Line Monitoring of Machine
Tool Thermal Errors,” accepted by Journal of Manufacturing System.

65
Nomenclature
N number of observations
A number of latent variables
p number of part characteristics required by design specification
c number of thermal sensors mounted onto a machine tool
t time index
l time lag l
ZT transpose of matrix Z
δp×1(n) thermal errors at time period n
ΔN×p thermal error history from t = 1 to t = N, [δ(1) δ(2) … δ(N)]T
sc×1(n) readings of c thermal sensors at time t, [s1
(n) s2(n) … sc
(n)]T
SN×c temperature history of machine tool from t = 1 to t = N, [s(1) s(2) … s(N)]T
XN×k descriptor data
YN×m response data
LV latent variables of X and Y, [LV1 …LVA]T (A«k+m)
TN×A common scores of X and Y
SLV sample covariance matrix of latent variables LV
Pk×A X loadings
Qm×A Y loadings

66
Wk×A weights of variables in X
EN×k X residuals
FN×m Y residuals
q back shift operator
D(q) difference operator with dj = 1 or 2 (j=1,2,…,c or p), Diag[(1-q-1)d1,
(1-q-1)d2,…]
S(i,j) a matrix [D(q)s(i) D(q)s(i+1) … D(q)s(j)]T
Δ(i,j) a matrix [(D(q)δ(i) D(q)δ(i+1) …, D(q)δ(j)]T
4.1 Introduction to Modeling of Dynamic Errors
Since dynamic errors may have great impact on part quality, in-line monitoring of
dynamic errors is a very important issue for quality improvement. For example, thermally
induced errors account for a large percentage of machine tool errors and hence in-line
monitoring and compensation of thermal errors are critical to reduce process variations.
Although as shown in Chapter 1, the SI based dynamic modeling methodology
shows significant advantages over the static one in terms of model accuracy and
robustness, several barriers still remain when applying SI theory to the thermal error
modeling:
• how to determine the number of temperature measurements that is sufficient to build
an adequate SI model, in order to avoid excess amount of sensors to be mounted onto
a machine tool.
• how to select appropriate lagged variables when a large number of thermal sensors
are available. The stepwise regression is commonly applied for variable selection

67
(Chen, et al., 1993). However, this method has certain limitations when being applied
to model strongly correlated historical data. Thus a systematic approach for the
selection of appropriate lagged variables is necessary for determining the structure of
the dynamic model.
• how to effectively estimate machine thermal status and predict machine performance
when the sensing resource is limited.
The purpose of this chapter is to overcome aforementioned difficulties. It presents
a new concept of controlling machining thermal effects by in-line monitoring of machine
thermal status based on SPC. Limited number of thermal sensors are employed to track
the temperature distribution of machine tools and to detect out-of-control machine
thermal status as the results of environment change, machine degradation, or process
parameters change. The recently developed LVM method (Shi and MacGregor, 2000)
provides a powerful tool for variable selection and model order determination. This
method will be employed in both dynamic modeling and in-line monitoring.
4.2 Latent Variable Modeling of Machine Tool Dynamic Errors
4.2.1 Description of Data
In thermal error modeling, the collected information includes machine tool
temperature and thermal error (provided by in-line probing system). Suppose c thermal
sensors are mounted on a machine tool. Let sc×1(n) = [s1
(n) s2(n) … sc
(n)]T denote the c
sensor readings at time t and SN×c = [s(1) s(2) … s(N)]T denote temperature history of
machine tool from time t = 1 to t = N. Suppose p characteristics are probed and the
measured readings for thermal error δqm(n) are denoted by δp×1
(n). Then ΔN×p = [δ(1)

68
δ(2) … δ(N)]T represents thermal error history. SN×c and ΔN×p are nonstationary
multivariate time series data. This fact can be illustrated by an example. As shown in Fig.
4.1, 11 sensors are mounted onto a CNC machine tool, where S #i denotes sensor i (i=1,
2, …, 11). Under certain working conditions, the sensor readings over time index are
shown in the left panel of Fig. 4.2. At the same time, in-line probing system provides the
thermal errors in z direction of machine tool spindle (right panel of Fig. 4.2). The
nonstationary nature of the data is obvious.
Figure 4.1 Thermal Sensor Locations on a Machine Tool
For engineering processes, the common treatment on nonstationarity is to take the
first or second order difference on original data and check the first two moments for
adequacy test (Box and Jenkins, 1970). Define a difference operator Dc×c(q) = Diag[(1-q-
1)d1, (1-q-1)d2,…, (1-q-1)dj, …], where dj = 1 or 2 (j=1,2,…,c or p) and q-1 is the back shift
operator, i.e., (1-q-1)z(t)=z(t)-z(t-1). Therefore, to obtain stationary time series, the
temperature and thermal error data are transformed as
S #4
Column
Spindle Motor
Spindle Driving Box
S #1
S #8
S #7
Backside View
S #6
S#11
S #9 S #5
S #3
S #10
S #2
11 Thermal Sensors
X Z
Y

69
D(q)(SN×c) = [D(q)s(1) D(q)s(2) … D(q)s(N)]T, (4.1)
D(q)(ΔN×p) = [D(q)δ(1) D(q)δ(2) … D(q)δ(N)]T. (4.2)
For simplicity, denote [D(q)s(i) D(q)s(i+1) … D(q)s(j)]T as S(i,j) and [D(q)δ(i)
D(q)δ(i+1)… D(q)δ(j)]T as Δ(i,j) with i<j.
0 50 100 15020
22
24
26
28
30
32
34
36
38
40Machine Tool Temperature
Time
Tem
pera
ture
(Cel
sius
Deg
ree)
0 50 100 150-5
0
5
10
15
20
25
30
35
40
45Thermal Error in z Direction
Time
Def
orm
atio
n(μ m
)
Figure 4.2 Machine Tool Temperature and Thermal Error Data
The order dj in D(q) is determined by the nature of data. For the example data in
Fig. 4.2, we can take the first and second order difference of the temperature and thermal
error data. The first and second order differences of the temperature and thermal error
data are shown in Fig. 4.3. We can also compute the mean and variance of these data
differences. Among the total 120 observations (Fig. 4.2), two segments are randomly
selected. Segment 1 contains observation No. 5 to 45 and Segment 2 contains the
observation No. 50 to 90. The mean and variance of differences of these two segments
are shown Tables A.1 and A.2 in Appendix D. We can see that the second order
differences in two segments are very small and it is not necessary to consider the second
order difference in the model (Box and Jenkins, 1970). Therefore, the first order
difference is sufficient for the temperature and thermal error data in this example.

70
0 50 100 150-1
0
1
2The first order diff. of temperature
0 50 100 150-10
-5
0
5
10
0 50 100 150-1
-0.5
0
0.5
1
0 50 100 150-10
-5
0
5
10
Time Index
The first order diff. of thermal error
The second order diff. of temperature The second order diff. of thermal error
Time Index Figure 4.3 Stationarity Treatment
Rather than in a unique format presented in (Shi and MacGregor, 2000),
construction of descriptor data X and response Y for the modeling study is depending
upon whether in situ measurement of thermal deformation is sufficiently available during
the process. There are commonly two situations. The first one is that thermal sensing
information is sufficient and accurate model prediction can be achieved for real time
thermal error compensation. Another situation is that thermal sensing information may be
inadequate for model based compensation whereas in-line monitoring of machine thermal
status and prediction of process degradation is important to continuous maintenance of
product quality.
If the in situ measurements of thermal error are available, for example, using
process intermittent probing, the lagged variables both in temperature and thermal error
histories can be included in screening procedure of lagged input variable, and

71
determining the model structure. Suppose the speculated maximum time lag is l, where l
can be chosen as a number large initially, the input vector X and output vector Y can be
represented as
X = [S(1,N-l+1) S(2, N-l+2) … S(l,N) Δ(1,N-l+1) Δ(2, N-l+2) … Δ(l-1,N-1)], (4.3)
Y = Δ(l,N). (4.4)
Here, block matrix S(i,N-l+i) is regarded as the data collection for variable difference t(i)-
t (i-1), where t is the variable vector of temperature. Matrix Δ(i,Ν-l+i) contains data
collection of the variable difference mδq (i)- mδq (i-1). Eq. (4.3) enables the screening
procedure to consider the lagged variables both in temperature history and thermal error
history.
If the in situ measurement of thermal error is unavailable, the X can only be
formed with time sequences of temperature measurements:
X = [S(1,N-l+1), S(2, N-l+2),…, S(l,N)]. (4.5)
When using data matrices (4.4) and (4.5), we can avoid stopping normal
production and monitor thermal error in situ.
4.2.2 Latent Variable Modeling of Machine Tool Dynamic Error
Latent variable modeling is a method for constructing predictive models when the
factors are many and highly collinear (Burnham, Viveros, and MacGregor, 1999). The
general model structure is
X = TPT + E, (4.6)
Y = TQT + F, (4.7)
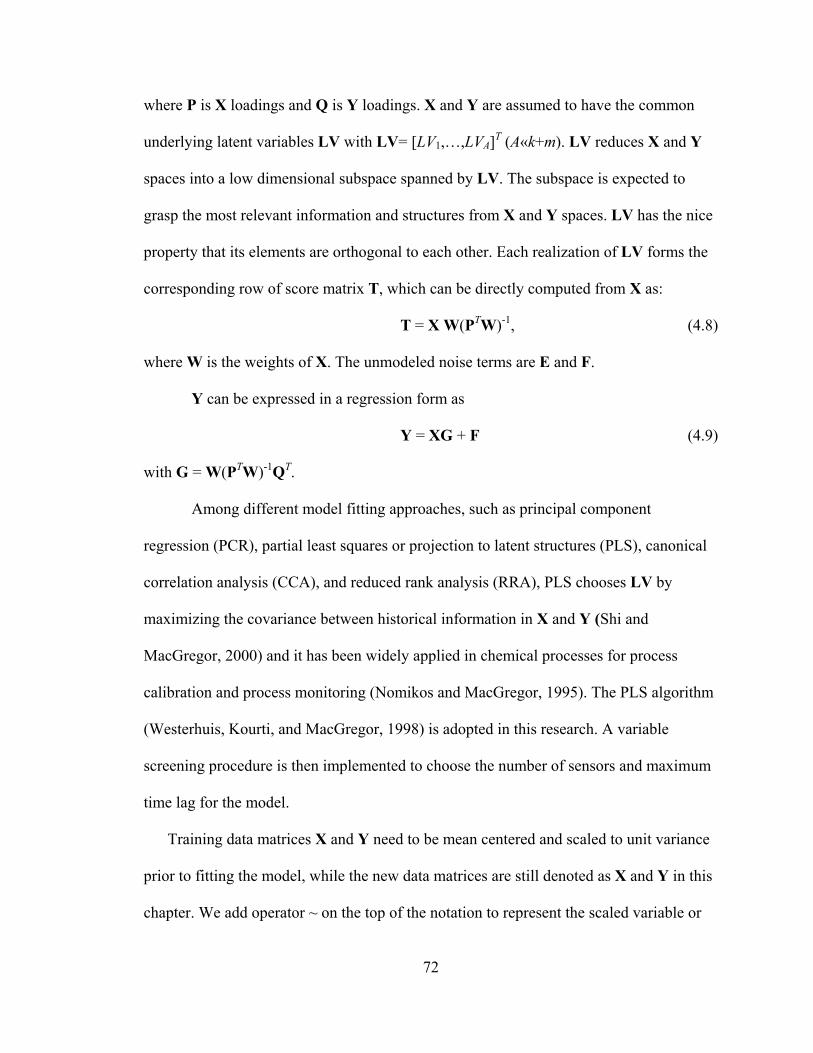
72
where P is X loadings and Q is Y loadings. X and Y are assumed to have the common
underlying latent variables LV with LV= [LV1,…,LVA]T (A«k+m). LV reduces X and Y
spaces into a low dimensional subspace spanned by LV. The subspace is expected to
grasp the most relevant information and structures from X and Y spaces. LV has the nice
property that its elements are orthogonal to each other. Each realization of LV forms the
corresponding row of score matrix T, which can be directly computed from X as:
T = X W(PTW)-1, (4.8)
where W is the weights of X. The unmodeled noise terms are E and F.
Y can be expressed in a regression form as
Y = XG + F (4.9)
with G = W(PTW)-1QT.
Among different model fitting approaches, such as principal component
regression (PCR), partial least squares or projection to latent structures (PLS), canonical
correlation analysis (CCA), and reduced rank analysis (RRA), PLS chooses LV by
maximizing the covariance between historical information in X and Y (Shi and
MacGregor, 2000) and it has been widely applied in chemical processes for process
calibration and process monitoring (Nomikos and MacGregor, 1995). The PLS algorithm
(Westerhuis, Kourti, and MacGregor, 1998) is adopted in this research. A variable
screening procedure is then implemented to choose the number of sensors and maximum
time lag for the model.
Training data matrices X and Y need to be mean centered and scaled to unit variance
prior to fitting the model, while the new data matrices are still denoted as X and Y in this
chapter. We add operator ~ on the top of the notation to represent the scaled variable or

73
data matrix (scale for each column). Hence, the input vector X and output vector Υ can
be represented as
X =[S (1,n-l+1) S (2, n-l+2) …S (l,n) Δ (1,n-l+1) Δ (2, n-l+2) …Δ (l-1,n-1)], (4.10)
Υ =Δ (l, n).
X is an n-l+1 by rl+6(l-1) matrix consisting of the data collection of temperatures
and thermal errors. Here, the block matrix S (i,n-l+i) contains n-l+1 scaled temperature
data vectors for {s(i)~s(n-l+i)}i=1,2,…l and can be regarded as the data collection of the
variable difference t (i)- t (i-1), i=1,2…l, over a period from i to n-l+I. Similarly, matrix
Δ (i,n-l+i) includes n-l+1 scaled thermal error vectors for {δ(i)~ δ(n-l+i)} i=1,2,…l and is an
(n-l+1)-period (from i to n-l+i) data collection of the variable difference mδq (i)- mδq (i-1).
Temperatures will be used for input and thermal errors will be for autoregressive terms in
the model. Υ includes the data collection of thermal errors mδq (n). By LVM fitting
procedure, we fit the regression coefficient G in Eq. (4.9) to the data in Eq. (4.10). Hence,
the first order differences of errors at time period n can be represented as the function of
error sources in the previous periods:
1 2( ) ( 1) ( ) ( ) ( 1) ( ) ( ) ( 1)
1 1
ˆ ˆ ˆ ˆ[ ] [ ]p p
n n l n l n l l n l n lm m m m
l l
δ δ δ δ− − − − − − −
= =
− = − − + −∑ ∑q q A q q Β t t , (4.11)
where ( )lA is a 6×6 square coefficient matrix and its non-zero entries come from the
entries in G corresponding to autoregressive terms. ( )lB is a 6×11 coefficient matrix and
its non-zero entries come from the entries in G corresponding to the temperature
variables (see the example of the coefficient matrices in the case study). p1 and p2
represent the maximum time lag for temperature and thermal error in the model. Time lag
p1 is for A and p2 for B , n≥n0. n0 is the starting period when the adjustment applies.

74
Scaling the data back with the mean and variance from the training dataset, we have
1 2( ) ( 1) ( ) ( ) ( 1) ( ) ( ) ( 1) ( ) ( 1)
0 01 1
垐 垐[ ] [ ]p p
n n l n l n l l n l n l n nm m m m
l l
δ δ δ δ− − − − − − − −
= =
− =− − + − + −∑ ∑q q A q q Β t t D D , (4.12)
where D0(n) is the intercept term that is the linear combination of the means of the
original data. A(l) and B(l) are the coefficient matrices after scaling back the data.
Considering Eq. (2.9), we get
1
2
( ) ( 1) ( ) 1 ( ) ( 1)
1
( ) ( ) ( 1) ( ) ( 1)0 0
1
[ ]
[ ] [ ].
pn n l n l n l
lp
l n l n l n n
l
− − − − −
=
− − − −
=
Δ −Δ =− Δ −Δ +
− + −
∑
∑
m m K A K m m
K B t t K D D (4.13)
Denote q-1 as the backward operator, e.g., q-1Δm(n) represents Δm(n-1). Canceling (1-q-1)
on both hand sides of Eq. (4.13) leads to
1 2( ) ( ) 1 ( ) ( ) ( ) ( )
01 1
p pn l n l l n l n
l l
− − −
= =
Δ = − Δ + +∑ ∑m K A K m K B t K , (4.14)
where ( )0nK is a matrix that is related to the initial condition t(n0), Δm(n0) and intercept
term ( )0nD . Eq. (4.14) is the fitted model for the quasi-static EFE thermal error. It will
predict the thermal error at the next period based on all the previous information such as
the temperatures and thermal errors collected. It can also be applied to the equivalent
error compensation (or automatic process adjustment) that has been discussed in Chapter
3. Design of process adjustment algorithm will be discussed in the next chapter.
Since the thermal errors in Fig. 4.2 are along z direction only, the equivalent
amount of fixture error (EFE) is the same as thermal errors (see Fig. 4.4). We make the
notations of EFE and thermal errors interchangeable in Section 4.3.

75
Figure 4.4 Equivalent Fixture Error of Fig. 4.2
As to the situation one mentioned in Section 4.2.1, we fit the model to data for
variable screening. Given the 120 observations in Fig. 4.2, suppose the maximum time
lag is 6 (or a larger number) for δ(t)1×1 and s(t)
11×1 (note: δ is one dimensional for this case).
Using the first 94 observations as training set and construct X and Y by Eqs. (4.3) and
(4.4), we can see that after first order difference, l=6-1=5. So, according to Eq. (4.3), total
l×c+l-1=(6-1)×11+(6-1)-1=59 candidate variables in X90×59 need to be screened to fit
the corresponding thermal error data Y90×1. The number of latent variables is determined
by the percentage of variance they can explain. To start, just assume there are 30 latent
variables and fit the model expressed by Eqs. (4.6) and (4.7). Based on the index of
variable importance for projection (VIP: a variable with VIP greater than 0.8 is assumed
to be significant) (Wold, 1994) and regression coefficients G, 29 input variables in X are
screened out (Table A.3 in the Appendix E).
Table A.3 suggests that sensor 9 seems to be insignificant in the thermal error
model. However, in the experiment, sensor 9 is mounted onto the places near spindle
motor and spindle bearing (Fig. 4.1), which appear to be major influencing heat sources.
By further investigating the significant factors, (1-q-1)δ(t-2) and (1-q-1)δ(t-1), the lagged
deformation information, which are related with temperature information from sensor 9,
are found in the model.
f1 f2
f3
Nominal tool path
Deviated tool pathf3
z
z
Nominal tool path
f1 f2

76
The maximum time lag for temperature data and the thermal error is 5. The model
could also be refitted with several larger time lags to be certain no significant lagged
variables were missed. Sensors 1, 3, 4, 5, 7, 8, and 10 all appear at least 3 times with
different lags in the model, which indicates that those 3 sensors might have more
complicated thermal dynamic behaviors than the rest.
Since in-line probing is usually not easily accessible during production, LV
modeling with only lagged temperature variables is a main focus in this chapter. For the
rest of this section, a latent variable model will be built for in-line monitoring of machine
tool thermal errors, in the case no sufficient information is available for error
compensation.
We still use the first 94 observations for model fitting and assume 30 latent
variables without autoregressive terms. The rest of data will be used for model testing.
With the data matrices X90×55 (Eq. (4.5)) and Y90×1 (Eq. (4.4)), the model fitting
procedure includes two steps, i.e.,
• Screen sensors and find A latent variables;
• Refit model with significant sensors and A latent variables.
The screening procedure remains the same and the result is given by Table A.4.
Based on the percentage of variance explained by the latent variables (Table A.5 in
Appendix E), choose 9 latent variables out of 30, i.e., A = 9, which explain 86.954% of
variation in X and 96.6966% of variation in Y (see the ninth latent variable in Table A.5).
Therefore, 24 input variables (denoted as x 24 1× ) in Table A.4 are used to refit the model to
get LV9×1= xTW(PTW)-1, W, T, P, Q and G.

77
To test model accuracy, first, we can use the temperature observations No. 95 to
No. 119 as input for predicting thermal errors. After taking the first order difference, the
new 25 observations are mean centered and scaled with the mean and variance obtained
from training dataset. Denote the pre-processed data as Xnew. By Eq. (4.8), the new score
Tnew is obtained as Tnew = XnewW(PTW)-1. By Eq. (4.9), the predicted Y is Y =
XnewW(PTW)-1QT and the residuals are F=Y- Y . The first 60 observations in another
experiment are used to predict the thermal errors in a similar manner.
Y needs to be added with mean and scaled back with the variance from the
training dataset. Given the first new initial thermal error, we integrate the post-processed
Y and compare it with the observed thermal errors (Fig. 4.5). As can be seen, the
residuals are small and this result is satisfactory.
If sensing information is sufficient, the prediction power of the model developed
by SI theory is normally higher than the one obtained from LVM method. If not, LVM
method is expected to have better performance. The reason is that LVM method is to
model the underlying structure in X and Y, rather than to model the impact of X on Y.
Therefore, reduced sensing information does not limit LVM’s capability to find out some
basic structures from the data, i.e., getting T = XW(PTW)-1 from X and Y. The heat
sources in a machine tool are abundant and more sensors are needed to well describe the
temperature field. Thus LVM based in-line monitoring method is more appropriate for
the given situation.

78
93 98 103 108 113 118 123-20
-10
0
10
20
30
40
50
Ther
mal
Err
or (μ
m)
Time Index
0 10 20 30 40 50 60-20
-10
0
10
20
30
40
Ther
mal
Err
or (μ
m)
Time Index
Prediction error for subsequent data in the same experiment
Prediction error for another experiment
Predicted Thermal Error
Predicted Thermal Error
Observed Thermal Error
Observed Thermal Error
Residual
Residual
Figure 4.5 Model Prediction and Residuals
4.3 In-Line Monitoring of Dynamic Equivalent Errors of Machine Tool
The first step of in-line monitoring is to obtain historical temperature and thermal
error data collected from a machine tool under normal working conditions. Then these
data are used to fit a model using the same technique as introduced in Section 4.2. Its
basic idea is to fit a latent variable model (Eqs. (4.6) and (4.7)) and monitor the process
based on latent structures captured by utilizing the process information (e.g. temperature)
and historical product information (e.g. thermal error) (Kourti and MacGregor, 1996).
This section demonstrates the method to build control charts and to monitor machine tool
thermal error.

79
We still use the data in Fig. 4.2 as an example. Suppose the first 94 observations
on temperature and thermal error data are available for the training stage. During
production, only temperature measurements are available. We need to find out whether
the thermal behavior of the machine tool is changed to increase thermal errors.
With the model fitted in Section 4.2.2 (the second situation), we have T, P, Q and
LV9×1. If the 24 variables are denoted as vector x24×1, then LV9×1 can be expressed as
LVT = xTW(PTW)-1, (4.15)
with W(PTW)-1 given in Table A.7 in Appendix E.
Use ta to denote the one realization of LV (or one row in matrix T) and ta = [t1,
t2,…, tA]T with A = 9 in the example. Define a Hostelling’s T2 statistic in terms of latent
variables as
22
21
Aa
a a
tTs=
= ∑ , (4.16)
where 2as stands for the variance of ta. It can be estimated from eigenvalues of the sample
covariance matrix of T, i.e., SLV. Since t1, t2,…, tA are orthogonal to each other, SLV is a
diagonal matrix and the estimator of 2as is given by
2 [ ]a aas diag= LVS . (4.17)
The control limit can be set by the F distribution (Johnson and Wichern, 1998),
2
2,
( 1) ( )( ) A n A
A nT Fn n A
α−
−≤
−, (4.18)
where FA, n-A(α) is the upper 100(1-α)% critical point of F distribution with degree of
freedom of (A, n-A).

80
In the example, Diag[SLV] = [7.6719, 3.1620, 2.5583, 1.0428, 1.0312, 1.2627,
0.3845, 0.2626, 0.5375], i.e., 21s = 7.6719 and 2
9s = 0.5375.
-10 -5 0 5 10-10
-5
0
5
10
1033
56
t Score 1
t Sco
re 2
Ellipse Format Chart
Figure 4.6 Ellipse Format Chart
We can see from Table A.5 that latent variable 1 accounts for the majority of the
variance for the dependent variables. If only first two latent variables are considered, the
elliptic control chart can be employed to monitor the stability of the machine tool. To
build phase I control chart, the 2T statistic is approximated by χ2 distribution with 2
degrees of freedom (Johnson and Wichern, 1998), i.e.,
2 22 21 2
22 21 2
( )t tTs s
χ α= + ≤ , (4.19)
where 22 ( )χ α is the upper 100(1-α)% critical point of χ2 distribution with 2 degrees of
freedom.
For level α = 0.05 ( 22 (0.05) 5.9915χ = ), the ellipse format chart for the 90
observations is shown in Fig. 4.5 (after the first order difference, 90 data points are left
for charting). In Fig. 4.6, points 10, 33, and 56 are beyond the limit. The scores of those 3

81
points need to be eliminated from T (not from X) before building phase II control chart.
After the elimination, Diag[SLV] = [7.7625, 2.4835, 2.6186, 1.0622, 1.0390, 1.1998,
0.3514, 0.2604, 0.5361]. This will be used for constructing phase II control limits.
-8 -6 -4 -2 0 2 4 6 8
-6
-4
-2
0
2
4
6
t Score 1
t Sco
re 2
Ellipse Format Chart for Future Observation
6.3529
6.3529
6.3529
6.3529
Figure 4.7 Control Ellipse for Future Observations
By Eq. (4.18), the phase II control chart is designed as
2 2 2new,1 new,22
2, 22 21 2
t t 2( 1) ( )( 2) nnT F
s s n nα−
−= + ≤
−, (4.20)
where n is the number of observations for constructing the control limits (n = 90-3 = 87
in the example). 21s and 2
2s are computed from phase I, i.e., 21s = 7.2636 and 2
2s = 2.3244.
2new,1t and 2
new,2t come from the future observations and they are the first two entries of tnew.
For a new observation (xnew)24×1
(tnew)T= (xnew)TW(PTW)-1. (4.21)
Suppose observations No. 95 to No. 119 are new measurements. The control ellipse
based on Eq. (4.18) is shown in Fig. 4.7 (α = 0.05, and F2, 85(0.05)=3.1038), which
suggests that the machine tool thermal condition is stable.

82
4.4 Isolation of Lagged Variables and Sensors Responsible for the Out-of-Control Signal
Although the control charts can identify out-of-control signals, they are unable to
determine the root causes. Contribution plots have been suggested to isolate the variables
responsible for the out-of-control signals (Kourti and MacGregor, 1996). The idea is to
check the standardized scores (i.e., ta/sa) with high values and to further investigate the
variables that have the large contributions to those scores.
In Section 4.3, points 10, 33, and 56 are identified to be out-of-control. The scores
of these 3 points (the rows in T corresponding to these points) are listed in Table A.8. For
each realization of LV (or each point), plot ta/sa with a = 1,2,…,9 on the same graph (Fig.
4.8).
With 95% confidence of type I error, the Bonferroni limit for the graph in Fig. 4.8
is ±2.7 (Alt, 1985). We can see that the second score component (i.e., the second latent
variable) of those 3 points is the main contributing factors to the out-of-control signal.

83
1 2 3 4 5 6 7 8 9-1
0
1
2
3Standardized Score in Point 10
Components
Stan
dard
ized
Sco
re in
Poi
nt
1 2 3 4 5 6 7 8 9-2
-1
0
1
2
3Standardized Score in Point 33
Components
Stan
dard
ized
Sco
re in
Poi
nt1 2 3 4 5 6 7 8 9
-4
-2
0
2
4Standardized Score in Point 56
Components
Stan
dard
ized
Sco
re in
Poi
nt
Figure 4.8 Standardized Scores in Points 10, 33, and 56
Since tT= xTW(PTW)-1 (refer to Table A.7 for W(PTW)-1), we can further
investigate the contributions of lagged variable in x and contributing sensors responsible
for the signals. For each realization of LV, the contribution of variable xj (the jth
component in x 24 1× , j=1,2,..,24 and t=10, 33, and 56 for this example) to the score of the
ath score component is defined to be (Kourti and MacGregor, 1996)
Contributiona,j=xjeaj, (4.22)
where eaj is the jth component in the ath column (corresponding to ath score component)
of matrix W(PTW)-1.
To the second latent variable in points 10, 33, and 56, the contributions of 24
variables (see Table A.4 for the variables) are shown in Fig. 4.9. Clearly, variable No.21,
i.e. (1-q-1)s7(t), makes the largest contributions to the signals.

84
0 5 10 15 20 25-0.5
0
0.5
1
1.5Point 10
Variable No.
Con
tribu
tion
to S
core
Com
pone
nt 2
0 5 10 15 20 25-0.5
0
0.5
1Point 33
Variable No.
Con
tribu
tion
to S
core
Com
pone
nt 2
0 5 10 15 20 25-1.5
-1
-0.5
0
0.5Point 56
Variable No.
Con
tribu
tion
to S
core
Com
pone
nt 2
Figure 4.9 Lagged Variable Contributions to Score Component 2
Since the 24 lagged variables are from 10 sensors (sensor 9 is excluded by the
screening procedure), study on the aggregated contributions from each sensor might
provide valuable information for root cause determination, i.e., finding out the main heat
sources that lead to thermal errors. The aggregated contribution can be found by
summing up the contribution of lagged variables corresponding to each sensor (see the
correspondence in Table A.6). Fig. 4.10 shows the contributions of 10 sensors to the
second latent variable of points 10, 33, and 56. Although this latent variable is the main
contributing factor to the out-of-control signal in these 3 points, the patterns in terms of
sensor contributions are quite different. In these points the heat sources at sensors 3, 4,
and 7 are the main factors causing the changes of machine tool thermal condition. Further
investigation should be taken to find out the physical reasons, such as spindle bearing

85
overheating or coolant not functioning. All the sensor contributions for point 56 for score
component 2 take negative values because the data was sampled at cooling down cycle.
1 2 3 4 5 6 7 8 9 10-0.5
0
0.5
1
1.5
Sensor No.
Sens
or C
ontri
butio
nPoint 10
1 2 3 4 5 6 7 8 9 10-0.5
0
0.5
1
Sensor No.
Sens
or C
ontri
butio
n
Point 33
1 2 3 4 5 6 7 8 9 10-1.5
-1
-0.5
0
Sensor No.
Sens
or C
ontri
butio
n
Point 56
Figure 4.10 Sensor Contributions to Score Component 2
If more latent variables are beyond limits in Fig. 4.8, we can study the overall
average lagged variable contribution and sensor contribution. The procedure of
computing the overall average variable contribution is similar to that in Kourti and
MacGregor (1996).
4.5 Summary
This chapter models the error equivalence for the dynamic process errors and
develops the in-line monitoring of the equivalent dynamic process errors and process
degradation caused by thermal errors. Machine tool thermal errors are selected as an
example to demonstrate the dynamic error equivalence modeling and process monitoring

86
in machining. The thermal sensors and maximum time lag are chosen according to a
screening procedure applied to results of LVM. The in-line monitoring of dynamic
equivalent errors is achieved by theories of statistical quality control: first T2 control chart
is built to detect out of limit signal; then bar plots of normalized scores and contribution
are created to identify the major contributing latent variables, the contribution of each
lagged variable and sensor to the thermal errors. These procedures show that LVM
method provides interesting results in variable screening, model prediction, and
especially in in-line monitoring and root cause identification. LVM method is especially
appropriate for multivariate measurements and ill-conditioned data, and it could also
provide a benchmark to judge whether the sensing information is sufficient to perform
dynamic error compensation.
The success of applying LVM method in monitoring is due to the property of LV
model, i.e., finding out the latent variables that maximize the covariance between process
variable (e.g., temperature) and product variable (e.g., thermal errors). LVM method
captures the thermal patterns from the historical data collected from an in-control
machine tool. Future observation is assumed to be out-of-control signal if the pattern
changes are detected. Once an out-of-control signal is detected, the study shows that the
lagged variable and sensor contribution plots are very helpful to determine the root
causes.

87
Chapter 5
Error Compensation Based on Dynamic Error Equivalence for Reducing Dimensional
Variation in Discrete Machining Processes*
Traditional SPC technique has been widely employed for the process monitoring
in discrete manufacturing. However, SPC does not consider any adjustment that prevents
the process drifting from the target. Furthermore, many in-line adjustment approaches,
such as thermal error compensation and avoidance, are designed only for machine tool
error reduction. This chapter intends to fully utilize the engineering process information
and propose an alternative compensation strategy that could automatically reduce the
overall process variations. Based on the model of dynamic equivalent errors developed in
Chapter 4, a SPC integrated error-canceling-error APC methodology is derived to
compensate for both time invariant and dynamic errors by adjusting the base error. The
performance of the adjustment algorithm such as stability and sensitivity is then
evaluated. A self updating scheme for the adjustment algorithm has been proposed to
track the latest process information as well. This process adjustment has been simulated
using the data collected from a real machining process. The results show that this
algorithm can improve the machining accuracy and reduce the process variations.
* The work in this chapter has appeared in Wang, H. and Huang, Q., 2007, “Using Error Equivalence Concept to Automatically
Adjust Discrete Manufacturing Processes for Dimensional Variation Reduction,” ASME Transactions, Journal of Manufacturing
Science and Engineering, 129, 644-652.
88
In Section 5.1, an error equivalence adjustment algorithm is derived to counteract
the machining process variation. Its integration with SPC is discussed in Section 5.2. The
adjustment algorithm is implemented via a case study in Section 5.3. Section 5.4
evaluates the performance of the APC methodology such as stability and sensitivity when
a change in the dynamics of process occurs. Conclusions are given in Section 5.5.
5.1 Automatic Process Adjustment Based on Error Equivalence Mechanism
For a manufacturing process with causal relationship x = f(u1, u2,…,up) + ε, the
traditional error compensation strategy is to minimize individual process errors ui’s so as
to reduce output deviation u. As pointed out in Chapter 3, since error equivalence also
implies the cancellation among process errors, this allows us to develop a new
compensation strategy, i.e., treating all process error sources as a system and using one
error to compensate for the others. For instance, with the development of flexible fixture
whose locator length is adjustable, it is feasible to compensate for the overall process
errors in the machining process by changing locator length. In this new strategy, the
outputs of the adjustment algorithm and process will be monitored using SPC methods.
The main purpose is to monitor unexpected events such as adjustment device failure.
It should be noted that compensation cost is a critical factor to be considered in
real applications. It is not discussed in this study because cost issue is often case
dependent.
Using the observed feature deviation x(n) at time period n as input, the proposed
error equivalence based algorithm 1uG generates adjustment c(n) to counteract *( 1)
2p ni i
+=Σ u
for the (n+1)th time period. Let c(n) be the cumulative amount of adjustment. x(n+1) is

89
x(n+1) = Γ*c(n) + Γ* *( 1)2
p ni i
+=Σ u +ε(n+1). (5.1)
The adjustment c(n) should be able to cancel E(x) and reduce the process variation. The
adjustment algorithm can be designed to reduce the mean squared deviation of product
feature, i.e., min E ( 1) 2[ ]n+x . As proposed by Capilla, et al., (1999), we can treat a simpler
problem of minimizing an instantaneous performance index, min ( 1) 2ˆ[ ]n+x . Taking the
first derivative of ( 1) 2ˆ[ ]n+x and equaling it to zero, the adjustment rule can be summarized
as follows. When the process errors *iu ’s are all static, the adjustment to reduce the mean
shift of the process output is
( ) * * * 1 * ( )1
ˆ ( ) .nn T T kjj S k
−∈ =
= − = −∑ ∑c u Γ Γ Γ x (5.2)
where S is the set for the static errors. Eq. (5.2) is in fact the same as Eq. (3.9).
Considering static and dynamic process errors, the process adjustment c(n) using error
equivalence turns out to be
( ) * *( 1) * *( ){ | }ˆ ˆ ˆ ˆ({ } ),n n k
j i j i k k nj S i D j S i Dg+
<∈ ∈ ∈ ∈= − − = − −∑ ∑ ∑ ∑c u u u u
*( ) ( 1) * * 1 * ( ) *ˆ ( )n n T T ni ji D j S
− −∈ ∈
= − + −∑ ∑u c Γ Γ Γ x u , (5.3)
where D is the set for dynamic errors. *ˆ jj S∈∑ u and *( 1)ˆ nii D
+∈∑ u are the process static and
dynamic equivalent errors based on the least square estimation, respectively. Dynamic
errors can be represented by *( 1) *( )ˆ ˆ({ } )n ki i ki D i D
g+∈ ∈
=∑ ∑u u , where g(.) is the fitted
dynamic model of process errors. Since the process will compensate for the same amount
of error *2
ˆpjj=∑ u at each time period, the proposed sequential root cause identification
procedure can be applied to identify the error sources.

90
In the machining processes, the dynamic machine tool error can be represented by
an ARX model with the temperatures of machine tool as input (see Eq. (4.13)).
Substituting process model (4.13) into Eq. (5.1), the prediction for feature deviation at
period n+1 is
1 2( 1) * ( ) * ( ) 1 ( ) * ( ) ( ) * * ( )3 3 01 0
ˆ ˆ[ ]p pn n l n l l n l njl l j S
+ − − −= = ∈
= − Δ + + +∑ ∑ ∑x Γ c Γ K A K m Γ K B t Γ u K . (5.4)
The adjustment rule for machining process is then
c(n) 1 2( ) 1 ( ) ( ) ( ) * ( )3 3 01 0
ˆp pl n l l n l njl l j S
− − −= = ∈
= Δ − − −∑ ∑ ∑K A K m K B t u K , c(n0)=0, and
( ) ( 1) * * 1 * ( ) *ˆ ˆ( )n l n l T T n ljj S
− − − − −∈
Δ = − + −∑m c Γ Γ Γ x u . (5.5)
Static error is obtained by direct measurement or by equation
* * * 1 * *ˆ ( )T Tj ij S i D
−∈ ∈
= −∑ ∑u Γ Γ Γ x u , (5.6)
where x and *ii D∈∑ u are the measurements of feature deviation and dynamic errors
when fitting the error model g(.).
Applicable conditions of compensation strategy. The base error u1 is not random because
of the adjustment. Although the adjustment c is expected to compensate for the remaining
process errors *2=Σ i
pi x , it becomes a new random error source because of the variability in
the actuator. Therefore, the adjusted total process error *au has
*2ˆ ˆE( ) E( ) E( )p
a i i i== + Σu c K u and *2ˆ ˆCov( ) Cov( ) Cov( )p T
a i i i i== + Σu c K u K . (5.7)
1xG normally aims to keep the process output x on the target and with the minimum
variation. The commonly used adjustment algorithm is to let E(c) =− 2 ˆE( )pi i i=Σ K u or
*ˆE( )u = 0. However, the generalized variance of error *au or Det( *ˆCov( )au ) is not
necessary to be smaller than the one without adjustment, where Det(.) represents the

91
determinant of the matrix in the parentheses. Cleary, if Det( Cov( )c ) ≤ Det( 1ˆCov( )u ), the
new compensation strategy will uniformly reduce process variation. If Det( Cov( )c ) >
Det( 1ˆCov( )u ) but the increase of total process variation (Det( *ˆvar( )au )-Det( *ˆCov( )u ))
/Det( *ˆCov( )u ) is insignificant, the compensation might be acceptable as well. For
instance, the precision of fixture is usually much higher than the workpiece and machine
tool. An adjustable fixture equipped could have lower precision or larger Det( Cov( )c ).
The minor percentage of fixture variation in the tool process errors might justify the
application of error compensation because it brings the process on the target.
Compensation is normally not effective if Det( Cov( )c )>Det( 1ˆCov( )u ) and
(Det( *ˆCov( )au )-Det( *ˆCov( )u ))/Det( *ˆCov( )u ) is appreciable.
The conventional compensation strategy aims to offset ˆE( )iu and reduce ˆCov( )iu
individually. It will be effective if there are only a few process errors dominating in ˆE( )u
and ˆCov( )u . Otherwise, a large number of adjustments are needed to compensate for all
error sources in order to keep the process output x on target. Under this condition, these
two compensation strategies can be applied complementarily. The error sources with the
largest variations can be counteracted using conventional methods to reduce ˆCov( )u ,
whereas the new compensation strategy is to achieve *ˆE( )au = 0.
5.2 SPC Integrated Process Adjustment Based on Error Equivalence
In real application, process adjustment as shown in Eq. (5.5) has to consider the
following practical problems:

92
Over Adjustment. Over adjustment may increase the production cost and process
variation. However, the adjustment does not need to be implemented in the periods when:
• The process errors are not significant compared to the assigned tolerance of base
errors (denoted by *1
σ±u
). We can predict the process errors in the next period and test
if the predicted errors are within tolerance.
• The adjustment is beyond the accuracy limit of the device. Therefore, in the early
stage of adjustment system design, we should choose the device whose accuracy limit
matches the assigned tolerance of base errors.
Fast varying errors. The adjustment in Eq. (5.5) only compensates for the slow varying
dynamic errors (quasi-static errors), which are relatively constant between the adjacent
periods. Large process variation within one period can lead to large adjustment errors in x.
In order to identify such process change, the samples of outputs {x(n)} of the
manufacturing process within one period can be monitored by quality control charts.
Unexpected process errors. On some occasions, unexpected process errors (e.g., variation
of adjustable fixture locator, hot chips during machining) have not been considered in {ui}
and thus the adjusted process could show a large variation. Integration of SPC and APC
is an economic way to reduce the variation of adjusted process though it has been rarely
applied in a discrete manufacturing process. Monitoring the estimated noise, i.e.,
( )ˆ nε =x(n)- * *( )2
p ni i=ΣΓ u -Γ*c(n-1) can help to detect if unexpected errors impact the process
output. When the unexpected errors take place, we can also update the process error
model to track the latest information about errors and make a closer prediction. With the
updating scheme, the coefficients in function g(.) also change with period n. In the
machining process, suppose we measure the temperature and thermal error every period,

93
and the measurement data are available at the period 1~n0. The updating adjustment
procedure can be proposed as follows:
At the beginning of period n0+k, data, including part features (measured by CMM)
{x(n0+k-l)}, thermal errors (measured by in-line probes) {δqm(n0+k-l)}, and temperatures
(measured by thermal sensors) {t(n0+k-l)}, are collected to compute the locator
adjustment c(n0+k-1)-c(n0+k-2). k=1, 2, 3,…(Eq. (5.5)). Then cut the parts after the
adjustment. With the updating scheme, the fitted coefficient matrices {A(l)} and {B(l)}
in Eq. (5.5) also change with period n (or equivalently, updating iteration). So, it is
reasonable to denote them as {An(l)} and {Bn
(l)}.
At the end of period n0+k, measure the parts and take the average of measurement
results to estimate x(n0+k).
Increase k and repeat the above procedures.
Since SPC is an effective tool to enhance the process robustness, we can develop
a SPC strategy for the adjusted process by collecting the information of process output x(n)
and adjustment output c(n) for each sample product. Then we can do the following:
Monitor samples of feature deviation x within one period to determine whether the
period length is appropriate for quasi-static error assumption. Shorter period duration
might be necessary when quality control chart signals an alarm.
Monitor the part features x(n) by multivariate control charts, c(n) by multivariate
EWMA chart and the noise estimation ( )ˆ nε for all the samples to identify whether
unexpected errors or process change occurs.
Update the adjustment algorithm when the control chart indicates out-of-control of
x(n), c(n), or systematic trend of ( )ˆ nε .

94
Within the device accuracy limit, the incremental adjustment c(n)-c(n-1) should be
applied (to compensate for the quasi-static errors) only when cumulative adjustment
c(n) exceeds control limits determined by the tolerance of the base error *1u and
meanwhile incremental adjustment c(n)-c(n-1) exceeds device accuracy limits. Both
error tolerance and device accuracy limits define a dead band for the adjustment.
The SPC integrated adjustment based on error equivalence can be shown by Fig.
5.1. To simplify the representation, the figure only shows the adjustment scheme for
compensating static errors.
Manufacturing processes (Γ*)*
2pi i=Σ u
1uG
ε
c
xu*
a
( ) * ( ) *( ){ | }
*( ) ( ) * * 1 * ( ) *
ˆ ˆ({ } ),
ˆ ( )
n n kj i k k nj S i D
k n T T ki ji D j S
g <∈ ∈
−∈ ∈
=− −
=− + −
∑ ∑∑ ∑
c u u
u c Γ Γ Γ x u
Error equivalence adjustment
Statistical quality control
• EWMA chart monitoring c
• Monitoring x
Dead band
Figure 5.1 Adjustment Based on Error Equivalence
5.3 Simulation of Error Equivalence Process Adjustment
We use the same single stage milling process to implement the process adjustment
as in Chapter 2. The process performs cutting on two planes X1 and X2 as shown in Fig.
2.9 in Chapter 2. Thickness along the z direction lz and y direction ly are the part features
to be controlled (the nominal thickness of the finished part is lz =15.24 ± 0.1mm and
ly=96.5 ± 0.1mm).

95
In this simulation, we use the data (Fig. 5.2(a)) from the experiment. There are 11
thermal sensors mounted on the CNC milling machine to collect data (r=11). The thermal
deviation is measured along two directions: the angular deviation α around x axis and
translational deformation along z direction of the tool head (see Fig. 5.2(b)). The left
panel of Fig. 5.2(a) shows the readings from 11 thermal sensors. The middle and right
panels show the measurement of thermal errors. The data are collected in each adjustment
period.
0 50 100 15020
22
24
26
28
30
32
34
36
38
40
Time Period
Tem
pera
ture
(Cel
cius
deg
ree)
0 50 100 150-0.005
0
0.005
0.01
0.015
0.02
0.025
0.03
0.035
0.04
0.045
Def
orm
atio
n al
ong
z di
rect
ion
(mm
)
0 50 100 150-0.005
0
0.005
0.01
0.015
0.02
0.025
0.03
0.035
0.04
Def
orm
atio
n ar
ound
x d
irect
ion
Time Period Time Period Figure 5.2 (a) Machine Tool Temperature and Error Data
Figure 5.2 (b) Thermal Error Measurements
Δz
α
Tool path
Tool head

96
We have derived Γ* in Chapter 3 to be:
0 0.0263 0.0263 0 0 00.0158 0.0079 0.0079 0 0 0
0 0 0 0 0 00 0.1379 0.1379 1.3368 1.3368 1
0.0828 0.0414 0.0414 1.5 0.5 01.3033 0.8483 1.1517 0 0 00 0 0 0.0263 0.0263 00 0 0 0 0 0
0.0158 0.0079 0.0079 0 0 00 02632 0.2632 1.2026 1.2026
−−
− − −− −− −
=−
− −− −
Γ .
10.158 0.079 0.079 1.5 05 00.2212 1.6106 0.3894 0 0 0
⎛ ⎞⎜ ⎟⎜ ⎟⎜ ⎟⎜ ⎟⎜ ⎟⎜ ⎟⎜ ⎟⎜ ⎟⎜ ⎟⎜ ⎟⎜ ⎟⎜ ⎟⎜ ⎟⎜ ⎟−⎜ ⎟− − −⎜ ⎟⎜ ⎟−⎝ ⎠
(5.8)
Suppose the maximum time lag in the model is 5, and N=95, the fitted coefficient matrix
G is
(4) (4) (0) (0) (4) (1)1 11 1 11 1 1(4) (4) (0) (0) (4) (1)1 11 1 11 2 2
0 00 0
Tv v v v a aw w w w a a⎛ ⎞
= ⎜ ⎟⎝ ⎠
G… … … …… … … …
where vi(l) and ai(l) are fitted coefficients. Then coefficient matrices )(~ lA and )(~ lB are
( )1( )
( )2
0 0 0 0 0 00 0 0 0 0 00 0 0 0 00 0 0 0 00 0 0 0 0 00 0 0 0 0 0
ll
l
aa
⎛ ⎞⎜ ⎟⎜ ⎟⎜ ⎟−
= ⎜ ⎟−⎜ ⎟
⎜ ⎟⎜ ⎟⎜ ⎟⎝ ⎠
A and ( ) ( ) ( ) ( )1 2 3 11( )( ) ( ) ( ) ( )1 2 3 11
6 11
0 0 0 00 0 0 0
0 0 0 00 0 0 0
l l l ll
l l l l
v v v vw w w w
×
⎛ ⎞⎜ ⎟⎜ ⎟⎜ ⎟
=⎜ ⎟⎜ ⎟⎜ ⎟⎜ ⎟⎜ ⎟⎝ ⎠
B
………………
. (5.9)
The static kinematic errors, after being transformed to equivalent fixture error, are
assumed to be *ˆ jj S∈∑ u =[0.4 0 0.35 0 0 0]T mm. The measurement noise ε(n) is assumed
to follow N(0, (0.002mm)2) for displacement and N(0, (0.001rad)2) for orientation. For
each adjustment period, 5 parts go through the cutting operation. We use average of 5

97
measurements to estimate the real feature deviation for each period. Thermal error and
temperature for 95 periods (So, n0=95) are available before the adjustment is applied. The
measurements of temperature from i~95+i periods and thermal error from i~94+i are used
to estimate the adjustment of locator pins for the (95+i)th period, i=1,2,…,20. The
adjustment algorithm is updated after measuring the parts at the (95+i)th period.
The accuracy of the locator movement is assumed to be σf=0.003mm and the
criterion for stopping the compensation is -0.01≤c(n)-c(n-1)≤0.01mm. The values of
adjustments for 6 locators are given by the solid line in the Fig. 5.3. The dash dot line
represents the value of ± 3σf. The adjustments for locators 4, 5, and 6 are zero since the
EFEs of errors introduced on these locators are zero in this example.
94 99 104 109 114-0 6
-0 5
-0 4
-0 3
-0 2
-0 1
0
0 1
Adjustment Period or Parts
Am
ount
of A
djus
tmen
t(mm
)
94 99 104 109 114-0 12
-0 1
-0 08
-0 06
-0 04
-0 02
0
0 02
94 99 104 109 114-0 5
-0 4
-0 3
-0 2
-0 1
0
0 1
0 2
Am
ount
of A
djus
tmen
t(mm
)
Am
ount
of A
djus
tmen
t(mm
)
Adjustment Period or Parts Adjustment Period or PartsLocator 1 Locator 2 Locator 3
Figure 5.3 EFE Adjustment
The effect of the automatic process adjustment can be evaluated by monitoring
the thickness of the part ly and lz. The mean of such distance (in each period) is estimated
by the average of 4 edge lengths along y and z directions at that period. The variance in
each period is estimated by the variance of the 4 edge lengths.

98
94 104 11414 9
15
15 1
15 2
15 3
15 4
Adjustment Period
Ave
rage
thic
knes
s (m
m)
94 104 1140
0 1
0 2
0 3
0 4
0 5
0 6
0 7
Adjustment PeriodSt
anda
rd d
evia
tion
of th
ickn
ess (
mm
)94 104 114
96 46
96 47
96 48
96 49
96 5
96 51
96 52
96 53
Adjustment Period94 104 1140
0 01
0 02
0 03
0 04
0 05
0 06
Adjustment Period
Ave
rage
thic
knes
s (m
m)
Stan
dard
dev
iatio
n of
thic
knes
s (m
m)
Figure 5.4 Monitoring Thickness and Standard Deviation of Edge Length
Fig. 5.4 shows the mean and standard deviation of the thickness for 20 adjustment
periods (periods 95~114). There is no adjustment applied in period 95. We can see that,
after the process adjustment, the mean of the thickness is within specification limit
( ± 0.01mm) and variance is greatly reduced. We conclude that the proposed adjustment
algorithm can significantly increase the product quality. It should be noticed that the
thickness ly has less mean shift than that lz. This is because plane X2 tilts around x axis
and the distances between edges ly are smaller along z direction. Such edge layout leads
to edge lengths with less variance and mean shift.
5.4 Adjustment Algorithm Evaluation
Since the adjustment algorithm may have unstable modes, it is necessary to
estimate the performance such as stability and sensitivity. The stability of the adjustment
algorithm means that an error in the output can be cancelled by an adjustment sequence
that converges to zero. One can obtain the stability of the algorithm by inspecting the
poles of the transfer function of Eq. (5.5). Sensitivity refers to how the quality could be

99
affected whenever moderate changes occur in the algorithm parameters. This can be
analyzed by differentiating Eq. (5.5) with respect to coefficients in function g(.).
Introducing backward operator q-1, Eq. (5.5) can be represented as
1
1 2 1
( ) 1 ( )3 31
( ) 1 * * 1 * ( ) ( ) ( ) ( ) 1 * * ( )3 3 3 01 0 1
[ ]
ˆ ˆ( )
p l l l nnl
p p pl T T l n l l n l nn n n j jl l l j S j S
q
q q
− − −=
− − − − −= = = ∈ ∈
+
= − − − −
∑∑ ∑ ∑ ∑ ∑
I K A K c
K A K Γ Γ Γ x K B t K A K u u K (5.10)
The stability of the algorithm is governed by the entries in 6×6 matrix
1 ( ) 1 1 13 31
[ ]p l lnl
q− − − −=
+ ∑I K A K . If the roots of denominator of each entry contain the poles
inside the unit circle in q plane, the algorithm is stable.
It clear that the adjustment algorithm is always stable if the thermal error model
does not contain autoregressive term, i.e., An(l)=0. When autoregressive terms are
included in the model, the algorithm may be unstable though the prediction accuracy may
increase. The designed algorithm at certain periods may contain unstable poles (poles
outside unit circle). This may cause the adjustment exhibit fluctuation and large output if
the parameters An(l) and Bn
(l) in the algorithm had been unchanged as n increase. The
solution for unstable output can be to use the model without autoregressive term since
such algorithm is always stable. Another solution is to introduce the updating scheme
which makes the adjustment output capture the latest process information. In this case,
Eq. (5.10) is not strictly proper to evaluate the stability for only one adjustment period
because model for Δm(n-l-1) is different from Δm(n-l). In practice, the proposed algorithm
can achieve satisfactory results. This has been validated by the results from the
simulation study in Section 5.3.

100
Another important issue is the sensitivity of the algorithm to the modeling errors
that can feasibly occur. If there are moderate changes of modeling parameters (entries in
matrices A ( )ln ) and B ( )l
n ), we are more interested in how the quality of the product could
be affected. Such change may be due to several reasons, including sensor reading errors
and change of lubrication condition. To study sensitivity, expand Eq. (5.5) as
1
2
1 2
3( ) ( ) ( ) ( )1 21 1
11 ( ) ( ) ( ) ( )1 00 1
3 11( ) ( ) ( ) ( ) ( ) ( )2 01 1 0 1
( )6
[ ] ,
[ ] , 1,2,3,
, 4,5,
0,
pn l l n lj jy i il i
p l l n l ni i y i i il i
p pn l n l l n l nj jz i i i jz i i il i l in
c a a f h m
v w f t u k j
c a f h m w f t u k j
c
−= =
−= =
− −= = = =
= − + Δ
− + − − =
= − Δ − − − =
=
∑ ∑∑ ∑∑ ∑ ∑ ∑
(5.11)
where hi is the function of fixture coordinates f1, …, f6. Differentiating both hand sides of
Eq. (5.11) leads to
1 1
2 2
1 2
3 3( ) ( ) ( ) ( ) ( )1 21 1 1 1
11 11( ) ( ) ( ) ( )10 1 0 1
3 11( ) ( ) ( ) ( ) ( )21 1 0 1
, 1,2,3,
,
p pn n l l n l lj i i i i jyl i l i
p pn l l n l li i y i il i l i
p pn n l l n l lj jz i i jz i il i l i
c h m a h m f a
t v f t w j
c f h m a f t w j
− −= = = =
− −= = = =
− −= = = =
Δ = − Δ Δ − Δ Δ
− Δ − Δ =
Δ = − Δ Δ − Δ =
∑ ∑ ∑ ∑∑ ∑ ∑ ∑∑ ∑ ∑ ∑
( )6
4,5,
0.ncΔ =
(5.12)
Δm(n-l) is only related to the previously fitted model and is not affected by the fitting error
of An(l) and Bn
(l). It can be considered as a constant when we conduct the sensitivity
analysis. For the example in Section 5.3, substituting the values of coordinates yields
1 1
2 2
1 1
2
( )1 1 2 3 2 1 2 3 11 1
11 11
0 1 0 1
( )1 2 3 2 1 2 3 11 1
11
0 1
(25 16.3 22.1 ) (1.3 0.8 1.2 )
19.2 ,
(107.5 70 95 ) (1.3 0.8 1.2 )
p pnl l
p pi i i il i l i
p pnj l l
pi il i
c m m m a m m m a
t v t w
c m m m a m m m a
t v
= =
= = = =
= =
= =
Δ = Δ + Δ − Δ Δ + Δ + Δ − Δ Δ
− Δ − Δ
Δ = Δ + Δ − Δ Δ + Δ + Δ − Δ Δ
− Δ
∑ ∑∑ ∑ ∑ ∑∑ ∑∑ ∑ 2
1 2
11
0 111( )
1 2 3 21 0 1( )6
82.5 , 2,3,
( 13.3 8.4 11.5 ) 10 , 4,5,
0.
pi il i
p pnj i il l in
t w j
c m m m a t w j
c
= =
= = =
− Δ =
Δ = − Δ − Δ + Δ Δ − Δ =
Δ =
∑ ∑∑ ∑ ∑
(5.13)

101
To simplify the representation, time indices (n-l) and l are dropped in this
equation. We can conclude the following about the adjustment algorithm at time period n,
• There is no adjustment on the locator 6.
• Deviation of coefficients a1(n-l) and vi
(n-l) does not affect the adjustment c4(n) and c5
(n);
and a1(n-l) has the same effect on the adjustment of c1
(n), c2(n), and c3
(n).
• The adjustment for locators 2 and 3 are more likely to be affected by the fitting errors.
Locators 4 and 5 are less sensitive to the fitting error. This is because the thermal
error occurs is only around z and along x directions. The EFEs on locators 1, 2, and 3
have more impact on the feature deviation than on locators 4 and 5. Locator 6 never
affects feature deviation along these two directions.
94 99 104 109 11414.6
14.8
15
15.2
15.4
15.6
15.8
16
Adjustment Period
Ave
rage
thic
knes
s al
ong
z di
rect
ion
(mm
)
94 99 104 109 114
96.48
96.49
96.5
96.51
96.52
96.53
96.54
96.55
96.56
Adjustment Period
Ave
rage
thic
knes
s al
ong
y di
rect
ion(
mm
)
Figure 5.5 Effect of Parameters Change in Process Adjustment Algorithm

102
The updating scheme can effectively enhance the sensitivity robustness of the
adjustment algorithm. We have simulated the feature deviation when there are changes of
50%, 200%, 350% and 500% in the coefficients v6(0) and w6
(0) in matrix B105(0). Fig. 5.5
shows an example when there are changes up to 500% in the coefficients. We can notice
a large variation of feature lz at period 104 and 105. Feature ly is not too much affected.
After period 105, the feature lz falls within the specification limit since the adverse effect
of the fitting error has been counteracted by the updated model.
5.5 Summary
APC and its integration with traditional SPC have not been sufficiently
addressed in discrete machining processes. Regarding the error compensation, the
conventional method in machining processes is to compensate for the multiple errors
individually. Based on the dynamic error equivalence model developed in Chapter 4, this
chapter derives a novel SPC integrated error-canceling-error APC methodology to
compensate for joint impact of errors in the machining process. As an alternative strategy,
an APC methodology by using one type of error to compensate for others has been
proposed. The method shows an advantage that it compensates for the overall process
variation without interrupting production in the machining processes. The applicable
condition of this new compensation strategy is also discussed.
This chapter first develops an error equivalence adjustment method based on the
engineering process causal model and statistical model of dynamic equivalent errors. It
uses prediction from the statistical process error model to compensate for the errors in the
future periods. Second, SPC is applied to the adjusted process to identify the unexpected

103
process errors. When SPC signals an alert, the fitted model is updated to obtain the latest
information of the dynamic process. The adjustment algorithm is implemented using the
data collected from a milling process. It has been shown that the error equivalence
adjustment can effectively improve the machining accuracy and reduce the variation. In
addition, a discussion on the applicable condition of compensation strategy shows that
the variation of adjustment to the base error must be relatively small compared with that
of the base error itself. Finally, the performance of designed adjustment algorithm is
analyzed. It has been demonstrated that the proposed updating scheme is effective to tune
the parameters and stabilize its output. The sensitivity of adjustment output to the change
of model parameters is also studied. It helps to find out the parameters that contribute
most to the deviations in the adjustment outputs.

104
Chapter 6
Conclusions and Future Work
6.1 Conclusions
Process quality improvement usually relies on the modeling of process variations.
Models that can reveal the physics of fundamental engineering phenomena could provide
better insights into the process and significantly enhance the quality. The work in this
dissertation aims to improve the understanding of error equivalence phenomenon, that is,
different types of process errors can result in the same feature deviation on parts. The
implication of error equivalence mechanism can greatly impact the prediction and quality
control in manufacturing processes. The major contributions of this dissertation are
summarized as follows
Error equivalence modeling. A rigorous mathematical definition of error equivalence
is introduced. An error transformation is proposed to establish the mathematical
formulation of error equivalence phenomenon. By the kinematic analysis, equivalent
errors are transformed into one base error. In machining processes, the base error is
chosen to be fixture deviation and other types of errors, including datum and machine
tool errors, are transformed to the fixture error. A process causal model is derived to
depict how the base errors affect the features of parts. The error equivalence is
investigated for both static and dynamic process errors. The model serves as the base
for quality prediction and control.

105
Sequential root cause diagnosis strategy. Due to the error equivalence mechanism,
errors may cancel each other on the part features and may conceal the process
information for process diagnosis. The proposed sequential diagnostic methodology
based on error equivalence overcomes the difficulty by conducting diagnosability
analysis, identifying the existence of process variations, and distinguishing the
multiple error sources.
Error-canceling-error compensation strategy integrated with SPC. The error
cancellation is further explored and a novel error-canceling-error APC strategy is
proposed, i.e., treating all error sources as one system and using the base error to
automatically compensate or adjust the others for process variation reduction. An
error equivalence adjustment algorithm is designed to compensate both time invariant
and dynamic errors. By monitoring outputs from the manufacturing process as well as
adjustment algorithm, SPC could enhance the robustness of the controlled process.
In this dissertation, the studies and analyses are based on a machining process.
However, error equivalence methodology for process control is generic and can be easily
extended to other discrete manufacturing processes.

106
6.2 Future Work
This study aims to establish error equivalence theory and obtain insights into this
fundamental phenomenon for improved process variation control. In addition to the
results obtained in the modeling, diagnosis and error compensation, we can further
expand the impact of error equivalence on the life cycle of product design and
manufacturing. The error equivalence can facilitate tolerance synthesis and optimal
tolerance allocation in a complex manufacturing process. For example, process tolerance
can be allocated only to the total amount of equivalent error at the initial design stage.
This would lead to reducing the dimension of design space. Then the tolerance would be
further distributed for individual error sources at late stages of process design when more
process information becomes available.
Furthermore, since error equivalence phenomenon widely exists in different types
of manufacturing processes, it could be expected to develop error equivalence based
quality control strategy for certain advanced manufacturing processes such as
micromachining.

107
References
Agapiou, J.S., Steinhilper, E., Gu, F., and Bandyopadhyay, P., 2003, “A Predictive Modeling Methodology for Part Quality from Machining Lines,” NAMRI/SME Transactions, XXXI, pp. 629-636.
Agapiou, J.S., Steinhilper, E., Bandyopadhyay, P., and Xie, J., 2005, “A
Predictive Modeling Methodology for Part Quality from Machining Lines,” 2005 ASME Mechanical Engineering Congress and Exposition, IMECE2005-79352.
Altintas, Y. and Lee, P., 1998, “Mechanics and Dynamics of Ball End Milling,”
ASME Transactions, Journal of Manufacturing Science and Engineering, 120, pp. 684-692.
Anjanappa, M., Anand, D.K., Kirk, J.A., and Shyam, S., 1988, “Error correction
methodologies and control strategies for numerical machines,” Control Methods for Manufacturing Process, 7, pp. 41-49.
Apley, D. and Shi, J., 1998, “Diagnosis of Multiple Fixture Faults in Panel
Assembly,” ASME Transactions, Journal of Manufacturing Science and Engineering, 120, pp. 793-801.
Apley, D. and Shi, J., 2001, “A Factor-Analysis Method for Diagnosing
Variability in Multivariate Manufacturing Processes”, Technometrics, 43, pp. 84-95. Asada, H. and By, A.B., 1985, “Kinematic Analysis of Workpart Fixturing for
Flexible Assembly with Automatically Reconfigurable Fixtures,” IEEE Transactions on Robotics and Automation, RA-1, pp. 86-94.
Åström, K.J., 1970, Introduction to Stochastic Control Theory, Academic Press,
NY. Åström, K.J., 1988, Automatic Tuning of PID Controllers, Instrument Society of
America, Research Triangle Park, NC. Åström, K.J. and Wittenmark, B., 1990, Computer Controlled Systems: Theory
and Design, 2nd edn., Prentice Hall, Englewood Cliffs, NJ. Box, G.E.P., 1957, “Evolutionary Operation: A Method for Increasing Industrial
Productivity,” Applied Statistics, 6, pp. 81-101.

108
Box, G.E.P. and Jenkins, G.M., 1963, “Further Contributions to Adaptive Quality Control: Simultaneous Estimation of Dynamics: Non-zero Costs,” Bulletin of the International Statistics Institute, 34th Session, Ottawa, pp. 943-974.
Box, G.E.P. and Jenkins, G.M., 1970, Time Series Analysis Forecasting and
Control, Holden-Day, Oakland, CA. Box, G.E.P. and Kramer, T., 1992, “Statistical Process Monitoring and Feedback
Adjustment- A Discussion,” Technometrics, 34, pp. 251-285. Box, G.E.P. and Draper, N.R., 1969, Evolutionary operation: A statistical method
for process improvement, John Wiley & Sons, NY. Bryan, J.B., 1990, “International Status of Thermal Error Research,” Annals of the
CIRP, 39, pp. 645-656. Butler, S.W. and Stefani, J.A., 1994, “Supervisory Run-to-Run Control of
Polysilicon Gate Etch Using in Situ Ellipsometry,” IEEE Transactions on Semiconductor Manufacturing, 7, pp. 193-201.
Cai, W., Hu, S., and Yuan, J., 1997, “Variational Method of Robust Fixture
Configuration Design for 3-D Workpiece,” ASME Transactions, Journal of Manufacturing Science and Engineering, 119, pp. 593-602.
Camelio, J. and Hu, S., 2004, “Multiple Fault Diagnosis for Sheet Metal Fixtures
Using Designated Component Analysis,” Transactions of the ASME, Journal of Manufacturing Science and Engineering, 126, pp. 91-97.
Camelio, J., Hu, S. and Ceglarek, D., 2003, “Modeling Variation Propagation of
Multi-Station Assembly Systems with Compliant Parts,” Transactions of the ASME, Journal of Mechanical Design, 125, pp. 673-681.
Capilla, C., Ferrer, A., and Romero, R., 1999, “Integration of Statistical and
Engineering Process Control in a Continuous Polymerization Process,” Technometrics, 41, pp. 14-28.
Carlson, J. S. and Söderberg, R., 2003, “Assembly Root Cause Analysis: A Way
to Reduce Dimensional Variation in Assembled Products,” International Journal of Flexible Manufacturing Systems, 15, pp. 113-150.
Ceglarek, D. and Shi, J., 1996, “Fixture Failure Diagnosis for Auto Body
Assembly Using Pattern Recognition,” ASME Transactions, Journal of Engineering for Industry, 118, pp. 55-65.

109
Ceglarek, D., Shi, J., and Wu, S.M., 1994, “A Knowledge-Based Diagnostic Approach for the Launch of the Auto-Body Assembly Process,” ASME Transactions, Journal of Engineering for Industry, 116, pp. 491-499.
Chang, M., and Gossard, D.C., 1998, “Computational Method for Diagnosis of
Variation-Related Assembly Problem,” International Journal of Production Research, 36, pp. 2985-2995.
Chen, J.S., Yuan, J.X., Ni, J., and Wu, S.M., 1993, “Real-Time Compensation for
Time-Variant Volumetric Errors on a Machining Center,” ASME Transactions, Journal of Engineering for Industry, 115, pp. 472-479.
Chou, Y-C., Chandru, V., and Barash, M., 1989, “A Mathematical Approach to
Automatic Configuration of Machining Fixtures: Analysis and Synthesis,” ASME Transactions, Journal of Engineering for Industry, 111, pp. 299-306.
Choudhuri, S.A. and De Meter, E.C., 1999, “Tolerance Analysis of Machining
Fixture Locators,” ASME Transactions, Journal of Manufacturing Science and Engineering, 121, pp. 273-281.
Del Castillo, E., 1996, “A Multivariate Self-Tuning Controller for Run-to-Run
Process Control under Shift and Trend Disturbances,” IIE Transactions, 28, pp. 22-28. Del Castillo, E. and Hurwitz, A., 1997, “Run-to-Run Process Control: Literature
Review and Extensions,” Journal of Quality Technology, 29, pp. 184-196. Ding, Y., Ceglarek, D., and Shi, J., 2002, “Fault Diagnosis of Multistage
Manufacturing Processes by Using State Space Approach”, ASME Transactions, Journal of Manufacturing Science and Engineering, 124, pp. 313-322.
Ding, Y., Jin, J., Ceglarek, D., and Shi, J., 2005, “Process-Oriented Tolerancing
for Multi-Station Assembly Systems”, IIE Transactions, 37, pp. 493-508. Ding, Y., Shi, J., and Ceglarek, D., 2002, “Diagnosability Analysis of Multistage
Manufacturing Processes”, ASME Transactions, Journal of Dynamics Systems, Measurement, and Control, 124, pp. 1-13.
Djurdjanovic, D. and Ni, J., 2001, “Linear State Space Modeling of Dimensional
Machining Errors,” NAMRI/SME, XXIX, pp. 541-548. Donmez, M.A., Blomquist, D.S., Hocken, R.J., Liu, C.R., and Barash, M.M.,
1986, “A General Methodology for Machine Tool Accuracy Enhancement by Error Compensation,” Precision Engineering, 8, pp. 187-196.

110
Ehmann, K.F., Kapoor, S.G., DeVor, R.E., and Lazogluo, 1991, “Machining Process Modeling: A Review,” ASME Transactions, Journal of Manufacturing Science and Engineering, 119, pp. 655-663.
English, J.R. and Case, K.E., 1990, “Control Charts Applied as Filtering Devices
within a Feedback Loop,” IIE Transactions, 26, pp. 255-269. Ferreira, P.M. and Liu, C.R., 1986, “A Contribution to the Analysis and
Compensation of the Geometric Error of a Machining Center,” Annals of the CIRP, 35, pp. 259-262.
Frey, D.D., Otto, K.N., and Pflager, W., 1997, “Swept Envelopes of Cutting Tools
in Integrated Machine and Workpiece Error Budgeting,” Annals of the CIRP, 46, pp. 475-480.
Harris, T.J. and Ross, W.H., 1991, “Statistical Process Control Procedures for
Correlated Observations,” Canadian Journal of Chemical Engineering, 69, pp. 48-57. Hu, S.J., 1997, “Stream of Variation Theory for Automotive Body Assembly”,
Annals of the CIRP, 46/1, pp. 1-6. Hu, S.J. and Wu, S.M., 1992, “Identifying Root Cause of Variation in Automobile
Body Assembly Using Principal Component Analysis,” Transactions of NAMRI, XX, pp. 311-316.
Huang, Q. and Shi, J., 2004, “Stream of Variation Modeling of Serial-Parallel
Multistage Manufacturing Systems With Coupled Process Routes,” ASME Transactions, Journal of Manufacturing Science and Engineering, 126, pp. 611-618.
Huang, Q. and Shi, J., 2004, “Variation Transmission Analysis and Diagnosis of
Multi-Operational Machining Processes,” IIE Transactions on Quality and Reliability, 36, pp. 807-815.
Huang, Q., Shi, J., and Yuan, J., 2003, “Part Dimensional Error and Its
Propagation Modeling in Multi-Operational Machining Process,” ASME Transactions, Journal of Manufacturing Science and Engineering, 125, pp. 255-262.
Huang, Q., Zhou, S., and Shi, J., 2002, “Diagnosis of Multi-Operational
Machining Processes through Process Analysis,” Robotics and Computer-Integrated Manufacturing, 18, pp. 233-239.
Huang, Y. and Liang, S.Y., 2005, “Modeling of Cutting Forces under Hard
Turning Conditions Considering Tool Wear Effect,” ASME Transactions, Journal of Manufacturing Science and Engineering, 127, pp. 262-270.

111
Jin, J. and Shi, J., 1999, “State Space Modeling of Sheet Metal Assembly for Dimensional Control”, ASME Transactions, Journal of Manufacturing Science and Engineering, 121, pp. 756-762.
Kapoor, S.G., DeVor, R.E., Zhu, R., Gajjela, R., Parakkal, G., and Smithey, D.,
1998, “Development of Mechanistic Models for the Prediction of Machining Performance: Model-Building Methodology,” Journal of Machining Science and Technology, 2, pp. 215-238.
Kline, W.A., Devor, R.E., and Shareef, I., 1982, “Prediction of Surface Accuracy
in End Milling,” ASME Transactions, Journal of Engineering for Industry, 104, pp. 272-278.
Kurtoglu, A., 1990, “The Accuracy Improvement of Machine Tools,” Annals of
CIRP, 39, pp. 417-419. Lawless, J.F., Mackay, R.J., and Robinson, J.A., 1999, “Analysis of Variation
Transmission in Manufacturing Process-Part I,” Journal of Quality Technology, 31, pp. 131-142.
Li, H. and Shin, Y.C., 2006, “A Comprehensive Dynamic End Milling Simulation
Model,” ASME Transactions, Journal of Manufacturing Science and Engineering, 128, pp. 86-95.
Li, Z. and Zhou, S., 2006, “Robust Method of Multiple Variation Sources
Identification in Manufacturing Processes for Quality Improvement,” ASME Transactions, Journal of Manufacturing Science and Engineering, 128, pp. 326-336.
Liu, X., Soshi, M., Sahasrabudhe, A., Yamazaki, K., and Mori, M., 2006, “A
Geometrical Simulation System of Ball End Finish Milling Process and Its Application for the Prediction of Surface Micro Features,” ASME Transactions, Journal of Manufacturing Science and Engineering, 128, pp. 74-85.
MacGregor, J.F., 1988, “Online-line Statistical Process Control,” Chemical
Engineering Process, 10, pp. 21-31. MacGregor, J.F., 1991, “Discussion of Some Statistical Process Control Methods
for Autocorrelated Data by D.C. Montgomery and C.M. Mastrangelo,” Journal of Quality Technology, 23, pp. 198-199.
MacGregor, J.F. and Harris, T.J., 1990, “Discussion of Exponentially Weighted
Moving Average Control Schemes: Properties and Enhancements,” Technometrics, 32, pp. 1-29.

112
Mann, B.P, Young, K.A., Schmitz, T.L., and Dilley, D.N., 2005, “Simultaneous Stability and Surface Location Error Predictions in Milling,” ASME Transactions, Journal of Manufacturing Science and Engineering, 127, pp. 446-453.
Mantripragada, R. and Whitney, D.E., 1999, “Modeling and Controlling Variation
Propagation in Mechanical Assemblies Using State Transition Models,” IEEE Transaction on Robotics and Automation, 15, pp. 124-140.
Marin, R.A. and Ferreira, P., 2001, “Kinematic Analysis and Synthesis of
Deterministic 3-2-1 Locator Schemes for Machining Fixtures,” ASME Transactions, Journal of Manufacturing Science and Engineering, 123, pp. 708-719.
Marin, R. and Ferreira, P., 2003, “Analysis of Influence of Fixture Locator Errors
on the Compliance of the Work Part Features to Geometric Tolerance Specification,” ASME Transactions, Journal of Manufacturing Science and Engineering, 125, pp. 609-616.
Martinsen, K., 1993, “Vectorial Tolerancing for All Types of Surfaces,” ASME
Advances in Design Automation, 2, pp. 187-198. Messina, W.S., Montgomery, D.C., Keats, J.B., and Runger, G.C., 1996,
“Strategies for Statistical Monitoring of Integral Control for the Continuous Process Industries,” Statistical Applications in Process Control, pp. 193-215.
Moriwaki, T. and Shamoto, E., “Analysis of Thermal Deformation of an
Ultraprecision Air Spindle System,” Annals of CIRP, 37, pp. 315-319. Mozumder, P.K., Saxena, S., and Collins, D.J., 1994, “A Monitor Wafer Based
Controller for Semiconductor Processes,” IEEE Transactions on Semiconductor Manufacturing, 7, pp. 400-410.
Rong, Q., Ceglarek, D., and Shi, J., 2000, “Dimensional Fault Diagnosis for
Compliant Beam Structure Assemblies,” ASME Transactions, Journal of Manufacturing Science and Engineering, 122, pp. 773-780.
Rong, Y. and Bai, Y., 1996, “Machining Accuracy Analysis for Computer-aided
Fixture Design Verification,” ASME Transactions, Journal of Manufacturing Science and Engineering, 118, pp. 289-299.
Sachs, E., Hu, A., and Ingolfsson, A., 1995, “Run-by-Run Process Control:
Combining SPC and Feedback Control,” IEEE Transactions on Semiconductor Manufacturing, 8, pp. 26-43.
Schultschik, R., 1977, “The Components of the Volumetric Accuracy,” Annals of
CIRP, 26, pp. 223-228.

113
Shawki, G.S.A. and Abdel-Aal, M.M., 1965, “Effect of Fixture Rigidity of and Wear on Dimensional Accuracy,” International Journal of Machine Tool Design and Research, 5, pp. 183-202.
Smith, S. and Tlusty, J., 1991, “An Overview of Modeling and Simulation of the
Milling Process,” ASME Transactions, Journal of Engineering for Industry, 113, pp. 169-175.
Soons, J. A., Theuws, F.C., and Schellekens, P.H., 1992, “Modeling the Errors of
Multi-Axis Machines: a General Methodology,” Precision Engineering, 14, pp. 5-19. Sutherland, J.W. and DeVor, R.E., 1986, “An Improved Method for Cutting Force
and Surface Error Prediction in Flexible End Milling Systems,” ASME Transactions, Journal of Engineering for Industry, 108, pp. 269-279.
Tsung, F., 2000, “Statistical Monitoring and Diagnosis of Automatic Controlled
Processes Using Dynamic PCA”, International Journal of Production Research, 38, pp. 625-637.
Tsung, F. and Shi, J., 1999, “Integrated Design of Run-to-Run PID Controller and
SPC Monitoring for Process Disturbance Rejection,” IIE Transactions, 31, pp. 517-527. Tsung, F., Shi, J., and Wu, C.F.J., 1999, “Joint Monitoring of PID-Controlled
Processes,” Journal of Quality Technology, 31, pp. 275-285. Tucker, W.T., Faltin, F.W., and Vander Wiel, S.A., 1993, “Algorithmic Statistical
Process Control: An Elaboration,” Technometrics, 35, pp. 363-375. Vander Wiel, S.A., Tucker, W.T., Faltin, F.W., and Doganaksoy, N., 1992,
“Algorithmic Statistical Process Control: Concepts and Application,” Technometrics, 34, pp. 286-297.
Venugopal, R. and Barash, M, 1986, “Thermal Effects on the Accuracy of
Numerically Controlled Machine Tools,” Annals of CIRP, 35, pp. 255-258. Wang, H., Huang, Q., and Katz, R., 2005, “Multi-Operational Machining
Processes Modeling for Sequential Root Cause Identification and Measurement Reduction,” ASME Transactions, Journal of Manufacturing Science and Engineering, 127, pp. 512-521.
Wang, H. and Huang, Q., 2006, “Error Cancellation Modeling and Its Application
in Machining Process Control,” IIE Transactions on Quality and Reliability, 38, pp. 379-388.

114
Wang, H. and Huang, Q., 2007, “Using Error Equivalence Concept to Automatically Adjust Discrete Manufacturing Processes for Dimensional Variation Reduction,” ASME Transactions, Journal of Manufacturing Science and Engineering, 129, pp. 644-652.
Wang, M.Y., 2000, “Automated Fixture Layout Design for 3D Workpieces,”
IEEE Transactions on Robotics and Automation, 16, pp. 839-846. Wang, Y. and Nagarkar, S.R., 1999, “Locator and Sensor Placement for
Automated Coordinate Checking Fixtures,” ASME Transactions, Journal of Manufacturing Science and Engineering, 121, pp. 709-719.
Weill, R., Darel, I., and Laloum, M., 1991, “The Influence of Fixture Positioning
Errors on the Geometric Accuracy of Mechanical Parts,” Proceedings of CIRP Conference on PE & ME, pp. 215-225.
Wu, D.W. and Liu, C.R., 1985, “An Analytical Model of Cutting Dynamics, Part
1: Model Building,” ASME Transactions, Journal of Engineering for Industry, 107, pp. 107-111.
Yang, H. and Ni, J., 2003, “Dynamic Modeling for Machine Tool Thermal Error
Compensation, ASME Transactions,” ASME Transactions, Journal of Manufacturing Science and Engineering, 125, pp. 245-254.
Zhou, S., Ding, Y., Chen, Y., and Shi, J., 2003, “Diagnosability Study of
Multistage Manufacturing Processes Based on Linear Mixed-Effects Models,” Technometrics, 45, pp. 312-325.
Zhou, S., Huang, Q., and Shi, J., 2003, “State Space Modeling for Dimensional
Monitoring of Multistage Machining Process Using Differential Motion Vector,” IEEE Transactions on Robotics and Automation, 19, pp. 296-309.

115
Appendices
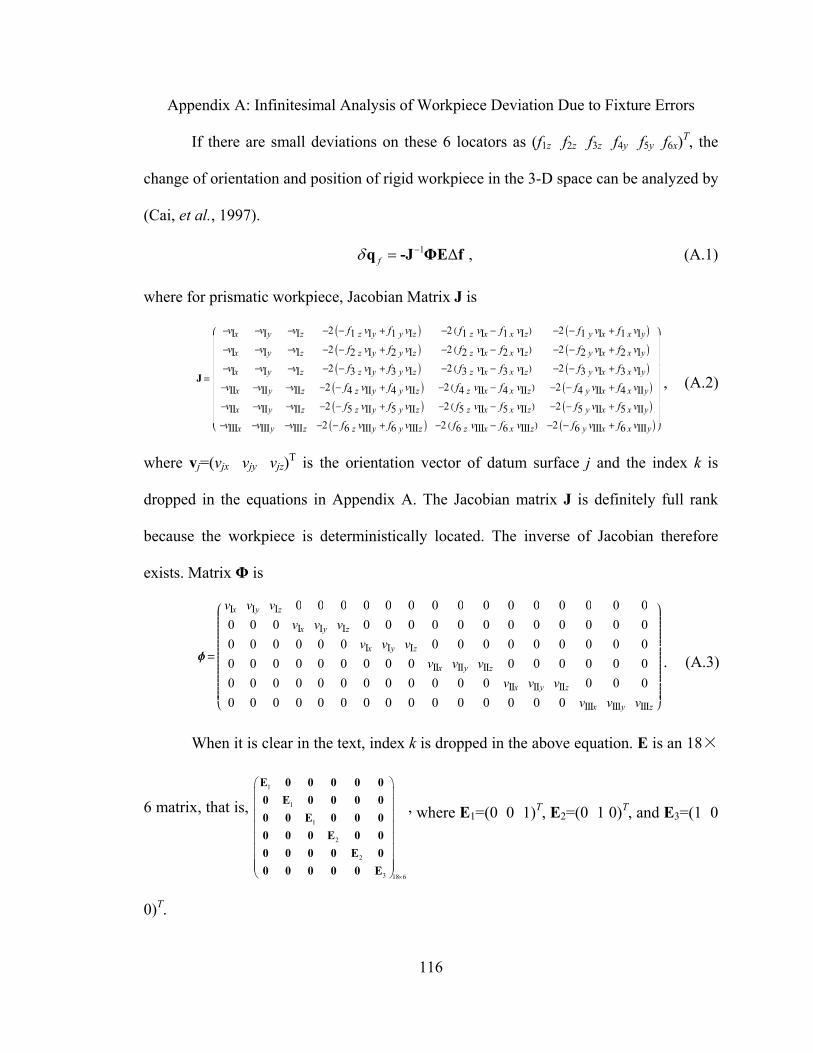
116
Appendix A: Infinitesimal Analysis of Workpiece Deviation Due to Fixture Errors
If there are small deviations on these 6 locators as (f1z f2z f3z f4y f5y f6x)T, the
change of orientation and position of rigid workpiece in the 3-D space can be analyzed by
(Cai, et al., 1997).
1 Δfδ −=q -J ΦE f , (A.1)
where for prismatic workpiece, Jacobian Matrix J is
J =
i
k
-vIx -vIy -vIz -2 I- f1 z vIy + f1 y vIz M -2 H f1 z vIx - f1 x vIzL -2 I- f1 y vIx + f1 x vIy M-vIx -vIy -vIz -2 I- f2 z vIy + f2 y vIz M -2 H f2 z vIx - f2 x vIzL -2 I- f2 y vIx + f2 x vIy M-vIx -vIy -vIz -2 I- f3 z vIy + f3 y vIz M -2 H f3 z vIx - f3 x vIzL -2 I- f3 y vIx + f3 x vIy M
-vIIx -vIIy -vIIz -2 I- f4 z vIIy + f4 y vIIz M -2 H f4 z vIIx - f4 x vIIzL -2 I- f4 y vIIx + f4 x vIIy M-vIIx -vIIy -vIIz -2 I- f5 z vIIy + f5 y vIIz M -2 H f5 z vIIx - f5 x vIIzL -2 I- f5 y vIIx + f5 x vIIy M-vIIIx -vIIIy -vIIIz -2 I- f6 z vIIIy + f6 y vIIIz M -2 H f6 z vIIIx - f6 x vIIIzL -2 I- f6 y vIIIx + f6 x vIIIy M
y
{
where vj=(vjx vjy vjz)T is the orientation vector of datum surface j and the index k is
dropped in the equations in Appendix A. The Jacobian matrix J is definitely full rank
because the workpiece is deterministically located. The inverse of Jacobian therefore
exists. Matrix Φ is
f=
i
k
jjjjjjjjjjjjjjjjjjjjjjj
vIx vIy vIz 0 0 0 0 0 0 0 0 0 0 0 0 0 0 00 0 0 vIx vIy vIz 0 0 0 0 0 0 0 0 0 0 0 00 0 0 0 0 0 vIx vIy vIz 0 0 0 0 0 0 0 0 00 0 0 0 0 0 0 0 0 vIIx vIIy vIIz 0 0 0 0 0 00 0 0 0 0 0 0 0 0 0 0 0 vIIx vIIy vIIz 0 0 00 0 0 0 0 0 0 0 0 0 0 0 0 0 0 vIIIx vIIIy vIIIz
y
{
zzzzzzzzzzzzzzzzzzzzzzz
When it is clear in the text, index k is dropped in the above equation. E is an 18×
6 matrix, that is, 1
1
1
2
2
3 18 6×
⎛ ⎞⎜ ⎟⎜ ⎟⎜ ⎟⎜ ⎟⎜ ⎟⎜ ⎟⎜ ⎟⎜ ⎟⎝ ⎠
E 0 0 0 0 00 E 0 0 0 00 0 E 0 0 00 0 0 E 0 00 0 0 0 E 00 0 0 0 0 E
, where E1=(0 0 1)T, E2=(0 1 0)T, and E3=(1 0
0)T.
(A.2)
(A.3) .
,

117
Appendix B: Proof for Proposition in Chapter 2
Proof. If the variables u1, u2, ..., um can be grouped to Eq. (2.25), we can expand Eqs.
(2.24) and (2.25) and make them equal. Then we get kjpi=gij. Substituting it into Γ yields
1 1 2 1 1
1 2 2 2 2
1 2
...
...=
......
m
m
n n m n
k p k p k pk p k p k p
k p k p k p
⎛ ⎞⎜ ⎟⎜ ⎟⎜ ⎟⎜ ⎟⎝ ⎠
Γ whose rank is not larger than 1. On the other hand, if
rank(H) is less than 1, there exists at most one row that is linearly independent. The
conclusion is obvious.

118
Appendix C: Proof for Corollary in Chapter 2
Proof. This can be proved by substituting Eq. (2.4) into the expression
( ) ( )-1 -1 -1 1 01 1T TT F F F F T
j P d f M m M P j−X = H H H H H H H X and conducting a lengthy
computation. It can be found that equalities among the coefficient matrices are
determined by the symmetry of matrix -1 -1 1 1F Fd f M m M
− −H H H H H . Since Hd, Hf, and Hm are
skew-symmetric, -1 -1 1 1F Fd f M m M
− −H H H H H is also skew-symmetric if FHM=I8 × 8. Non-
identity matrix FHM can affect the symmetry of -1 -1 1 1F Fd f M m M
− −H H H H H , which yields
different coefficient matrices for Δd, Δf, and Δm. Therefore, the MCS and the FCS must
coincide with each other for the proposed grouping method.

119
Appendix D: Determine Difference Order for D(q)
Table A.1 First Order Difference
Sensor 1 Sensor 2 Sensor 3 Sensor 4 Sensor 5 Sensor 6
Mean Segment 1 0.046 0.257 0.111 0.107 0.089 -0.003 Segment 2 0.042 0.078 0.072 0.004 0.053 0.018
Variance Segment 1 0.007 0.126 0.080 0.035 0.045 0.007 Segment 2 0.007 0.137 0.056 0.030 0.038 0.006
Table A.1 First Order Difference (Continued) Sensor 7 Sensor 8 Sensor 9 Sensor 10 Sensor 11 Thermal Error
Mean Segment 1 0.194 0.059 0.030 0.039 0.000 0.481 Segment 2 0.049 0.025 0.027 0.023 0.019 0.378
Variance Segment 1 0.140 0.001 0.003 0.009 0.005 9.053 Segment 2 0.106 0.001 0.003 0.015 0.004 9.191
Table A.2 Second Order Difference Sensor 1 Sensor 2 Sensor 3 Sensor 4 Sensor 5 Sensor 6
Mean Segment 1 -0.0041 -0.0093 0.0003 -0.0079 -0.0025 0.0069 Segment 2 -0.0003 -0.0003 -0.0054 0.0042 -0.008 -0.0013
Variance Segment 1 0.0019 0.04 0.0764 0.043 0.0306 0.005 Segment 2 0.0031 0.0353 0.0425 0.0331 0.0161 0.0051
Table A.2 Second Order Difference (Continued) Sensor 7 Sensor 8 Sensor 9 Sensor 10 Sensor 11 Thermal Error
Mean Segment 1 -0.0317 0.0002 0.0024 0.0019 0.0066 -0.1921 Segment 2 0.0107 -0.0008 -0.0007 -0.0018 -0.001 0.0716
Variance Segment 1 0.1275 0.0006 0.0003 0.0056 0.0018 7.6983 Segment 2 0.0763 0.001 0.0004 0.0045 0.0018 5.9466

120
Appendix E: Screened Variables
Table A.3 Screened Variables With Autoregressive Terms No. Predictor B VIP No. Predictor B VIP 1 (1-q-1)s1
(t-4) -0.01305 0.86065 16 (1-q-1)s8(t-1) -0.09953 1.16198
2 (1-q-1)s4(t-4) -0.03241 0.81609 17 (1-q-1)s10
(t-1) 0.02845 0.928293 (1-q-1)s5
(t-4) -0.00634 0.83828 18 (1-q-1)s1(t) 0.08247 1.59173
4 (1-q-1)s8(t-4) 0.09179 0.86482 19 (1-q-1)s2
(t) -0.02080 0.835985 (1-q-1)s10
(t-4) -0.02364 0.80570 20 (1-q-1)s3(t) -0.06807 2.47004
6 (1-q-1)s3(t-3) -0.34848 0.80145 21 (1-q-1)s4
(t) 0.05154 2.250597 (1-q-1)s3
(t-2) 0.07769 0.95171 22 (1-q-1)s5(t) -0.13403 1.91569
8 (1-q-1)s4(t-2) -0.27098 0.90617 23 (1-q-1)s6
(t) -0.10494 1.222569 (1-q-1)s7
(t-2) 0.56576 1.18210 24 (1-q-1)s7(t) 0.74162 2.85025
10 (1-q-1)s1(t-1) -0.07559 0.87789 25 (1-q-1)s8
(t) -0.09977 1.8695711 (1-q-1)s3
(t-1) -0.37920 1.63392 26 (1-q-1)s10(t) 0.05774 1.22009
12 (1-q-1)s4(t-1) -0.21441 1.51635 27 (1-q-1)s11
(t) -0.05022 1.0620413 (1-q-1)s5
(t-1) -0.04998 1.05582 28 (1-q-1)δ(t-2) -0.20495 1.0759414 (1-q-1)s6
(t-1) -0.49069 0.93271 29 (1-q-1)δ(t-1) -0.66046 1.8082715 (1-q-1)s7
(t-1) 0.38506 1.79123
Table A.4 Screened Variables Without Autoregressive Terms No. Predictor B VIP No. Predictor B VIP 1 (1-q-1)s1
(t-4) 0.07546 0.87825 13 (1-q-1)s8(t-1) 0.01998 1.16039
2 (1-q-1)s5(t-4) -0.14213 0.84481 14 (1-q-1)s10
(t-1) -0.06269 0.914003 (1-q-1)s8
(t-4) 0.06449 0.86229 15 (1-q-1)s1(t) 0.05278 1.61400
4 (1-q-1)s3(t-2) 0.13863 0.94842 16 (1-q-1)s2
(t) 0.07197 0.839515 (1-q-1)s4
(t-2) -0.20317 0.88582 17 (1-q-1)s3(t) -0.13796 2.45840
6 (1-q-1)s7(t-2) 0.37119 1.21801 18 (1-q-1)s4
(t) -0.02998 2.244747 (1-q-1)s1
(t-1) -0.09405 0.85471 19 (1-q-1)s5(t) -0.04362 1.94720
8 (1-q-1)s3(t-1) -0.28725 1.64462 20 (1-q-1)s6
(t) -0.24511 1.220099 (1-q-1)s4
(t-1) -0.22753 1.54242 21 (1-q-1)s7(t) 0.75227 2.84803
10 (1-q-1)s5(t-1) 0.00147 1.06443 22 (1-q-1)s8
(t) -0.13120 1.8807211 (1-q-1)s6
(t-1) -0.59538 0.92221 23 (1-q-1)s10(t) 0.24731 1.23607
12 (1-q-1)s7(t-1) -0.03143 1.80960 24 (1-q-1)s11
(t) -0.03777 1.06831

121
Appendix F: Results of Partial Least Square Estimation
Table A.5 Percentage of Variance Explained by Latent Variables Number of
Latent Variables Model Effects (%) Dependent Variables (%)
Current Total Current Total 1 15.5917 15.5917 76.1821 76.18212 20.1072 35.6989 7.7077 83.88983 9.3684 45.0672 6.9591 90.84894 12.616 57.6833 1.4366 92.28555 13.0862 70.7695 1.3161 93.60166 7.6245 78.394 0.8509 94.45257 2.5189 80.913 1.3834 95.8368 5.0934 86.0064 0.2656 96.10169 0.9476 86.954 0.595 96.696610 0.9948 87.9488 0.395 97.0916
Table A.6 Regression Coefficient B No. Predictor B No. Predictor B
1 (1-q-1)s1(t-4) -0.00295 13 (1-q-1)s8
(t-1) -0.03124
2 (1-q-1)s5(t-4) -0.07369 14 (1-q-1)s10
(t-1) 0.05272
3 (1-q-1)s8(t-4) 0.04627 15 (1-q-1)s1
(t) 0.09544
4 (1-q-1)s3(t-2) -0.02239 16 (1-q-1)s2
(t) 0.03551
5 (1-q-1)s4(t-2) -0.14135 17 (1-q-1)s3
(t) -0.25085
6 (1-q-1)s7(t-2) 0.19833 18 (1-q-1)s4
(t) -0.07654
7 (1-q-1)s1(t-1) -0.06708 19 (1-q-1)s5
(t) -0.14277
8 (1-q-1)s3(t-1) -0.00332 20 (1-q-1)s6
(t) -0.03152
9 (1-q-1)s4(t-1) -0.13779 21 (1-q-1)s7
(t) 0.63287
10 (1-q-1)s5(t-1) 0.00365 22 (1-q-1)s8
(t) -0.15118
11 (1-q-1)s6(t-1) 0.05853 23 (1-q-1)s10
(t) -0.02636
12 (1-q-1)s7(t-1) 0.13353 24 (1-q-1)s11
(t) -0.00588

122
Appendix F: Results of Partial Least Square Estimation (Continued)
Table A.7 Matrix W(PTW)-1 0.0981 0.1184 -0.2937 -0.0671 0.1614 0.0115 -0.1211 -0.1543 -0.2777 0.0853 0.1030 -0.3320 -0.1636 -0.0416 -0.2867 -0.2415 0.0031 -0.1945 0.0915 0.1248 -0.3311 -0.1683 0.0010 -0.1158 0.1513 0.4230 0.1306 -0.0976 0.2586 -0.1109 -0.2005 -0.1183 0.1166 -0.0912 -0.0588 0.2703 0.0797 -0.2724 -0.1579 -0.0732 -0.2737 -0.7027 0.0143 0.1231 0.1023 0.1446 -0.1463 0.0200 0.4585 0.4373 0.2628 0.3876 0.0295 -0.0456 -0.0982 0.2468 -0.1376 -0.0260 -0.0408 -0.0275 -0.0757 -0.3548 -0.7202 -0.2310 0.1041 0.1130 0.2678 -0.0693 -0.0939 0.1550 -0.0113 -0.2258 0.2093 -0.1019 -0.3140 -0.4380 -0.1832 -0.2984 -0.2134 -0.1396 0.1070 -0.1242 0.2688 -0.0965 -0.1842 -0.1653 -0.0548 0.0829 0.2448 0.3003 -0.0906 0.1443 0.3645 0.0643 0.1818 -0.0501 -0.0926 0.1017 -0.2684 0.2656 0.0230 -0.1141 0.1265 0.4077 0.4207 -0.0419 -0.3707 -0.1089 -0.1548 0.2160 0.0510 0.1519 -0.1224 -0.2794 -0.0759 -0.1968 0.1371 -0.0765 0.2734 0.3562 0.2578 0.2401 -0.2263 -0.4808 -0.1649 -0.0098 -0.2389 0.0403 -0.1355 0.1708 0.3586 0.5769 0.3515 0.1920 0.0056 -0.1083 0.0747 -0.1138 -0.0946 0.0687 -0.2293 0.3266 0.3766 0.5756 -0.3585 -0.3941 -0.3279 0.0025 0.0572 0.0339 -0.1391 -0.1223 -0.0245 0.3242 0.3285 0.0280 -0.2948 -0.5396 -0.7230 -0.1123 -0.5779 -0.4749 -0.2946 -0.0201 -0.1390 -0.0745 -0.2116 -0.2126 0.1252 0.0170 0.1537 -0.1731 -0.1173 0.0282 -0.2887 0.1699 0.2162 0.4279 0.0117 0.0748 0.3942 0.5384 0.4333 0.6301 0.6588 0.7654 0.4969 0.3907 0.4897 -0.2819 -0.1268 -0.1118 0.1892 0.1004 -0.0881 -0.1786 -0.3599 -0.0845 -0.1728 0.0233 0.1074 -0.0166 0.2916 -0.0056 -0.0537 -0.1426 -0.0017 -0.1526 -0.0162 0.1654 -0.1552 0.2400 0.1773 0.2017 -0.0706 -0.2082
Table A.8 Scores for Points 10, 33, and 56
t10T 1.4300 4.4685 -0.5961 0.6465 -0.1329 -0.7059 1.2548 -0.1687 -0.3506
t33T 1.3451 4.3501 0.7506 0.1393 -0.6887 -0.9764 0.0422 0.1284 -1.2530
t56T -3.3721 -5.3679 -1.2482 -1.0136 1.3881 2.7800 1.5272 -0.9628 0.1017

About the Author
Hui Wang received a Bachelor’s Degree in Mechanical Engineering from
Shanghai Jiao Tong University, Shanghai, China in 2001, and an M.S.E. in Mechanical
Engineering at the University of Michigan, Ann Arbor in 2003. He is currently a Ph.D.
student in the department of Industrial and Management Systems Engineering at the
University of South Florida, Tampa.
While in the Ph.D. program at the University of South Florida, Hui Wang focuses
on the research of modeling and quality control for manufacturing processes including
traditional discrete manufacturing and micro/nano manufacturing. Currently, he has four
publications in ASME Transactions, Journal of Manufacturing Science and Engineering,
IIE Transactions on Quality and Reliability, and Journal of Manufacturing Systems. He
also made paper presentations at annual meetings of ASME, IERC, and INFORMS. He is
a member of INFORMS and IIE.
Related Documents