Appendix B Statistical Tables Relating to Employment, Production, and Purchasing Power CONTENTS National income or expenditure: Pago B-l. Gross national product or expenditure, 1929-52 139 B-2. Gross national product or expenditure in 1951 prices, 1929-52 140 B-3. Gross national product or expenditure in 1939 prices, 1929-51 142 B-4. Personal consumption expenditures, 1929—52 143 B~5. Gross private domestic investment, 1929-52 144 B-6. National income by distributive shares, 1929-52 145 B-7. Personal income, 1929-52 146 B-8. Relation of national income and personal income, 1929-52 147 B-9. Disposition of personal income, 1929-52 148 B-10. Total and per capita disposable personal income in current and 1951 prices, 1929-52 149 Employment and wages: B—11. Labor force, employment, and unemployment, 1929—52 150 B-l 2. Number of wage and salary workers in nonagricultural establishments, 1929-52 151 B-l 3. Average weekly hours in selected industries, 1929-52 152 B-l4. Average hourly earnings in selected industries, 1929-52 153 B-l 5. Average gross weekly earnings in selected industries, 1929—52 ........ 154 Production and business activity: B—16. Indexes of industrial and agricultural production, 1929—52 155 B-17. New construction activity, 1929-52 156 B—18. Business expenditures for new plant and equipment, 1929—52 157 B—19. Inventories and sales in manufacturing and trade, 1939-52 158 B-20. Sales, stocks, orders, and receipts at 296 department stores, 1939-52.. 159 Prices: B-21. Wholesale price index, 1929-52 160 B-22. Consumers' price index, 1929-52 162 B-23. Indexes of prices received and prices paid by farmers, and parity ratio, 1929-52 163 B-24. Indexes of wholesale prices and cost of living in the United States and foreign countries, selected dates since June 1950 164 137 Digitized for FRASER http://fraser.stlouisfed.org/ Federal Reserve Bank of St. Louis

Welcome message from author
This document is posted to help you gain knowledge. Please leave a comment to let me know what you think about it! Share it to your friends and learn new things together.
Transcript

Appendix B
Statistical Tables Relating to Employment,Production, and Purchasing Power
CONTENTS
National income or expenditure: PagoB-l. Gross national product or expenditure, 1929-52 139B-2. Gross national product or expenditure in 1951 prices, 1929-52 140B-3. Gross national product or expenditure in 1939 prices, 1929-51 142B-4. Personal consumption expenditures, 1929—52 143B~5. Gross private domestic investment, 1929-52 144B-6. National income by distributive shares, 1929-52 145B-7. Personal income, 1929-52 146B-8. Relation of national income and personal income, 1929-52 147B-9. Disposition of personal income, 1929-52 148B-10. Total and per capita disposable personal income in current and 1951
prices, 1929-52 149Employment and wages:
B—11. Labor force, employment, and unemployment, 1929—52 150B-l 2. Number of wage and salary workers in nonagricultural establishments,
1929-52 151B-l 3. Average weekly hours in selected industries, 1929-52 152B-l4. Average hourly earnings in selected industries, 1929-52 153B-l 5. Average gross weekly earnings in selected industries, 1929—52 . . . . . . . . 154
Production and business activity:B—16. Indexes of industrial and agricultural production, 1929—52 155B-17. New construction activity, 1929-52 156B—18. Business expenditures for new plant and equipment, 1929—52 157B—19. Inventories and sales in manufacturing and trade, 1939-52 158B-20. Sales, stocks, orders, and receipts at 296 department stores, 1939-52.. 159
Prices:B-21. Wholesale price index, 1929-52 160B-22. Consumers' price index, 1929-52 162B-23. Indexes of prices received and prices paid by farmers, and parity
ratio, 1929-52 163B-24. Indexes of wholesale prices and cost of living in the United States and
foreign countries, selected dates since June 1950 164
137
Digitized for FRASER http://fraser.stlouisfed.org/ Federal Reserve Bank of St. Louis

Credit, m©ney supply, and Federal finance: PageB-25. Consumer credit outstanding, 1929-52 165B-26. Loans and investments of all commercial banks, 1929-52 166B-27. Deposits and currency, 1929-52 167B-28. Estimated ownership of Federal obligations, 1939-52 168B-29. U. S. Government debt—volume and kind of obligations, 1929-52. . . 169B-30. Bond yields and interest rates, 1929-52 170B-31. Government cash receipts from and payments to the public, calendar
years, 1943-52 171Corporate profits and finance:
B-32. Profits before and after tax, all private corporations, 1929-52 172B-33. Sales and profits of large manufacturing corporations, 1939-52 173B-34. Relation of profits before and after taxes to stockholders' equity, private
manufacturing corporations, by industry group, 1947-49 averageand 1950-51 174
B-35. Relation of profits before and after taxes to sales, private manufactur-ing corporations, by industry group, 1947-49 average and 1950-51.. 175
B-36. Relation of profits before and after taxes to stockholders' equity and tosales, all private manufacturing corporations, by asset size class,1947-49 average and 1950-51 176
B-37. Sources and uses of corporate funds, 1946-52 177International transactions:
B-38. International transactions of the United States, 1949-52 178B-39. United States exports and imports of goods and services, by area,
1949-52 179B—40. U. S. Government grants, other unilateral transfers, and loans to for-
eign countries, 1949-52 180B—41. United States merchandise exports, including reexports, by area,
1936-38 quarterly average and 1947-52 181B—42. Indexes of quantity and unit value of United States domestic mer-
chandise exports, by economic class, 1936-38 quarterly averageand 1947-52 182
B-43. United States general merchandise imports, by area, 1936-38 quar-terly average and 1947-52 183
B—44. Indexes of quantity and unit value of United States merchandise im-ports for consumption, by economic class, 1936-38 quarterly aver-age and 1947-52 184
Summary:B—45. Changes in selected economic series since 1939 and 1951 185
138
Digitized for FRASER http://fraser.stlouisfed.org/ Federal Reserve Bank of St. Louis

TABLE B—1.—Gross national product or expenditure, 1929—52
[Billions of dollars]
Period
1929 . ..
19301931 .. .. .1932 _ ._.19331934 .
193519361937 -.19381939
19401941194219431944
19451946194719481949
1950 .1951
1951: First halfSecond half
1952: First half •
1951: First quarterSecond quarter...Third quarter....Fourth quarter..
1952: First quarterSecond quarter •_
Grossna-
tionalprod-uct
103.8
90.975.958.355.864.9
72.282.590.284.791.3
101.4126.4161.6194.3213.7
215.2211.1233 3259.0258.2
284.2329.2
Per-sonalcon-
sump-tionex-
pendi-tures i
78.8
70.861.249.246.351.9
56.262.567.164.567.5
72.182.391.2
102.2111.6
123.1146.9165.6177.9180.6
194.3208.0
Gross private domesticinvestment 2
1fr
15.8
10.25.4.9
1.32.8
6.18.3
11.46.39.9
13.918.310.95.77.7
10.728.730.242.733.5
50.358.5
Construction
3£
7.8
5.63.61.71.11.4
1.92.83.73.34.9
5.66.84.02.52.8
3.910.313.917.717.2
22.923.3
^x-S
«i
•81sl«
2.8
1.41.2.5.3.4
.71.11.41.62.7
3.03.41.8l:l1.14.06.38.68.3
12.611.0
10
5.0
4.22.41.2.8
1.0
1.21.72.31.82.2
112.21.52.0
2.86.37.69.19.0
10.312.3
JS,a
llo 33 &
T3 0»0
Hi
6.4
4.93.21.81.82.5
3.44.55.44.04.6
6.17.74.94.15.7
7.512.317.119.918.7
22.024.9
"§8pQ'EoBIf1-9!sza
1.6
-.3-1.4-2.6-1.6-1.1
.91.02.3
-1.0.4
2.33.92.1-.9-.8
-.76.1-.85.0
-2.5
5.510.3
Netfor-eignin-
vest-ment
0.8
.7
.2
.2
.2
.4
-.1— .1
.11.1.9
1.51.1
— 2-2.2-2.1
-1.44.68.91.9.5
-2.3.2
Government purchases ofgoods and services
3§
8.5
9.29.28.18.09.8
9.911.711.612.813.1
13.924.759.788.696.5
82.830.928.636.643.6
41.962.6
Federal *
5g1.3
1.41.51.52.03.0
2.94.84.65.35.2
6.216.952.081.289.0
74.820.915.821.125.4
22.240.9
8-—. >»
•2 I"cS£
(fi)
(8)
38)s)«(s)0)(*)1.2
2.213.849.479.787.5
73. 818.512.015.518.9
18.336.7
fe50
(5)(5)(6)(s)(5)(5)(5)(s)
83.9
4.03.22.71.51.6
1.02.53.85.86.6
3.94.2
•d§1CQ
7.2
7.87.76.65.96.8
7.06.97.07.57.9
7.87.87.77.47.5
8.010.012.815.618.2
19.721.7
Seasonally adjusted annual rates
324.4334.0
341.2
319.6329. 3330.9337.1
339.4343.0
207.5208.4
214.1
210.5204.5206.4210.5
213. 2215.0
62.554.6
49.0
59.865.256.252.9
50.048.0
24.122.4
23.6
24.723.522.422.4
23.723.5
11.810.1
11.0
12.810.99.9
10.3
11.010.9
12.212.3
12.6
11.912.612.512.1
12.712.6
25.024.8
25.8
24.825.324.924.7
25.726.0
13.37.4
-.4
10.316.38.95.8
.6-1.6
-1.41.8
1.4
-2.7-.21.12.6
1.91.0
55.869.2
76.7
51.959.867.371.2
74.479.0
34.647.2
53.6
30.838.345.548.9
51.256.0
30.942.4
48.2
27.334.541.143.8
46.050.5
3.64.8
5.3
3.53.74.55.1
6.25.5
21.422.0
23.1
21.121.621.722.3
23.223.0
1 See appendix table B-4 for major components.2 See appendix table B-5 for more detail and explanation of components.3 Net of Government sales, which have be^n deducted from the national security expenditures.4 For 1947-52 "national security" expenditures include the following: military services, international
security, and foreign relations, development and control of atomic energy, promotion of merchant marine,promotion of defense production and economic stabilization, and civil defense. (See The Budget of theUnited States Government for the Fiscal Year Ending June 30, 1953, for items included in each of theseclassifications.) Prior to 1947, the expenditure? are based on items formerly clarified as "war" by theBureau of the Budget and Treasury Department. For all years, the expenditures exclude Governmentsales and have been adjusted to the concept of purchases of goods and services.
• Not available.< Estimates based on imcomplete data; second quarter by Council of Economic Advisers.NOTE.—The figures beginning with 1949 are based on the revised serias of national income and product
of the Department of Commerce. For detail, see the Survey of Current Business, July 1952.Detail will not necessarily add to totals because of rounding.
Source: Department of Commerce (except as noted).
209722—52- -10 139
Digitized for FRASER http://fraser.stlouisfed.org/ Federal Reserve Bank of St. Louis

TABLE B-2.—Gross national product or expenditure in 1951 prices, 1929-52
[Billions of dollars, 1951 prices]
Period
1929
19301931193219331934
1935.19361937 ...19381939
1940 _19411942 _ . ..19431944
19451946194719481949_
19501951. .
1951: First halfSecond half _._
1952: First half «_
1951: First quarterSecond quarterThird quarterFourth quarter ,
1952: First quarter... _Second quarter *
Totalgross
nationalproduct
168.1
152.2140.7119.1117.9131.4
143. 2163.6171.2164.4179.8
197.4229.3260.4293.4316.3
307.2272.6272. 3281.0281.6
303.3329.2
Personal consumptionexpenditures
Total
119.1
111.9108.198.397.3
103.2
109.7121.0125.2123.1130.3
137.9148.6146. 5:
150.4156.4
166.8185.2189.9193.3198. 4
208.7208.0
Dur-able
goods
16.4
13.110.98.07.89.1
11.113.614.311.813.6
15.718.211.610.19.4
10.821.125.125.626.2
31.527.1
Non-dur-able
goods
62.9
59.959.554.454.158.3
61.968.871.372.276.4
80.386.889.492.396.4
103. 6108.5107.2107.7109.7
111.7113.5
Serv-ices
39.8
38.937.735.935.435.8
36.738.639.639.140.3
41.943.645.548.050.6
52.455.657.660.062.5
65.567.3
Gross private domestic investment
Total
32.6
22.213.62.93.77.3
13.919.523.713.621.6
29.336.319.811.213.4
16.842.240.247.438.1
54.458.5
New construction
Total
18.5
13.89.75.43.64.1
5.57.99.58.3
12.3
13.715.48.44.75.0
6.615.217.320.019.7
24.623.3
Eesi-den-tial
(non-farm)
(4)
(4)(<)(*)(4)(<)
(4)(4)(«)(«)6.8
7.37.93.61.71.4
1.86.07.89.69.4
13.511.0
Other
(4)
(4)(4)(*)(4)(4)
(4)(4)(4)(4)5.5
6.47.54.83.03.6
4.89.29.5
10.410.3
11.112.3
Pro-ducers'durableequip-ment
11.1
8.86.13.63.74.8
6.68.8
10.07.38.5
11.013.28.26.79.4
12.218.121.723.221.0
24.124.9
Changein
busi-ness
inven-tories
3.0
-.4-2.2-6.1-3,6-1.6
1.82.84.2
-2.0.8
4.67.73.2
-i!o-2.0
8.91.24.2
-2.6
5.710.3
Seasonally adjusted annual rates
325.6333.0
336.0
321.3329.9331. 7334. 3
334.6337.3
208.6207.4
211.2
212.2204.9206.6208.3
210.4211.9
29.025.2
25.0
31.626.425.525.0
24.825.2
112.6114.6
117.9
113.8111.3113.7115.5
117.8118.0
67.067.6
68.2
66.867.267.467.8
67.868.7
62.854.4
47.7
60.265.356.252.6
49.046.4
24.222.4
23.1
24.923.522.422.3
23.322.9
11.910.0
10.8
12.910.99.9
10.2
10.810.7
12.312.3
12.4
12.012.612.512.1
12.512.2
25.224.6
25.4
25.025.424.924.4
25.325.5
13.47.4
-.8
10.316.48.95.9
.4-2.0
See footnotes at end of table.
I4O
Digitized for FRASER http://fraser.stlouisfed.org/ Federal Reserve Bank of St. Louis

TABLE B-2.—Gross national product or expenditure in 1951 prices, 1929-52J—Continued
[Billions of dollars, 19511prices]
Period
1929
1930 _1931193219331934
1935 _19361937 _19381939
1940. _.._1941194219431944
1945 .._ .1946194719481949
19501951
1951: First halfSecond half....
1952: First half « . ..
1951: First quarterSecond quarterThird quarterFourth quarter
1952: First quarter .Second quarter « _ _ .
Netforeigninvest-ment
-0.7
-.9-1.3-1.3-1.7-.9
-2.4-2.6-2.2
.1-.4
.3-1.3-3.2-7.6-8.0
-7.82.87.3
-1.3-2.9
-4.3.2
Government purchases of goods and services
Total
17.1
19.020.319.218.621.8
22.025.724.527.628.3
29.945.797.3
139.4154.5
131.442.434.941.648.0
44.562.6
Federal »
Total
2.8
3.23.43.64.96.7
6.510.59.6
11.511.3
13.329.982.9
126.3141.7
118.427.718.523.828.0
23.640.9
Nationalsecurity *
(*)
(«)(4)(<)(4)(4)
(4)(*)(4)(4)
2.6
4.724.478.8
124.0139.3
116.824.514.117.520.8
19.436.7
Other
(«)
(4)(«)(«)(*)(4)
(*)(«)(4)(*)
8.7
8.65.54.12.32.4
1.63.24.46.37.2
4.24.2
Stateandlocal
14.3
15.816.915.613.715.1
15.515.214.916.117.0
16.615.814.413.112.8
13.014.716.417.820.0
20.921.7
Seasonally adjusted annual rates
-1.6fc 2.0
1.3
-3.0-.21.52.5
1.7.9
55. 969.2
75.8
51.959.967.470.9
73.578. Ij
34.647.1
53.2
30.938.345.548.7
50.855.5
31.042.4
47.8
27.434.541.143.6
45.750.0
3.64.8
5.3
3.53.84.45.1
5.15.5
21.322.0
22.6
21.021.621.922.2
22.722.6
1 These estimates represent a rough conversion of the Department of Commerce series in 1939 prices. (Seeappendix table B-.3) This was done by major components, using the implicit price indexes for the year1951 as a base. Although it would have been preferable to redeflate the series by minor components, thiswould not substantially change the results except possibly for the period of World War II, and for the serieson change in business inventories.
* Net of Government sales, which have been deducted from the national security expenditures.3 See appendix table B-l, footnote 4.* Not available.« Estimates based on incomplete data.
NOTE.—Detail will not necessarily add to totals because of rounding.
Source: Council of Economic Advisers.
141
Digitized for FRASER http://fraser.stlouisfed.org/ Federal Reserve Bank of St. Louis

TABLE B-3.—Gross national product or expenditure in 1939 prices, 1929-511
[Billions of dollars, 1939 prices]
Period
1929
1930193119321933 . .1934
19351936193719381939.
19401941194219431944
1945- _ _ -1946194719481949
1950 ...1951
Totalgrossna-
tionalprod-uct
85.9
78.172.361.961.567.9
73.983.987.984.091.3 i
100.0115.5129.7145.7156.9
153.4138.4138.6143.5144.0
154.8167.3
Personal consumptionexpenditures
Total
62.2
58.656.651.851.154.0
57.262.865.063.967.5
71.376.675.878.081.1
86.395.798.3
100.3103.2
108.5108.4
Dur-able
goods
8.0
6.45.33.93.84.4
5.46.87.05.76.7
7.78.95.75.04.6
5.310.412.312.612.9
15.413.3
Non-dur-able
goods
29.1
27.727.525.224.927.0
28.631.832.933.435.3
37.140.141.342.644.5
47.950.249.549.750.7
51.652.4
Serv-ices
25.1
24.523.922.722.422.6
23.224.425.124.825.5
26.527.628.830.432.0
33.235.236.438.039.6
41.542.6
Gross private domesticinvestment
Total
14.9
10.15.91.11.63.5
6.79.3
11.46.39.9
13.717.19.35.46.6
8.320.319.322.718.0
25.828.0
Newcon-
struc-tion
7.4
5.43.82.11.51.7
2.23.13.83.34.9
5.46.13.31.92.0
2.66.06.98.07.9
9.89.2
Pro-duc-ers'dur-able
equip-ment
6.1
4.83.31.92.02.7
3.64.85.53.94.6
6.07.24.43.65.1
6.79.9
11.812.611.4
13.113.6
Changein
busi-ness
inven-tories
1.5
-.2-1.1-3.0-1.8-.8
.91.42.1
-1.0.4
2.33.81.6
-'.5
-1.04.4.6
2.1-1.3
2.85.1
Netfor-eignin-
vest-ment
0.8
.6
.3
.2
.1
.3
-.1-.2
.11.0.9
1.2.7
-.4-2.1-2.2
-1.82.74.81.4.6
.02.0
Governmentpurchases of goods
and services
Total
7.9
8.79.48.98.7
10.1
10.111.911.412.713.1
13.821.145.064.371.3
60.619.616.119.222.2
20.628.9
Fed-eral
1.3
1.51.61.72.33.1
3.04.94.45.35.2
6.113.838.358.265.4
54.612.88.5
10.912.9
10.918.9
Stateandlocal
6.6
7.37.87.26.47.0
7.17.16.97.47.9
7.77.36.76.16.0
6.06.87.68.29.3
9.710.1
Grosspri-vate
prod-uct 2
81.5
73.567.757.456.562.0
67.676.480.976.483.7
92.1106.2116.5125. 3133.0
129.7125.6128.8133.7133. 7
144.3154. 0
1 See Survey of Current Business, January 1951, and the National Income Supplement to the Survey ofCurrent Business, 1951, for explanation of conversion of estimates in current prices to those in 1939 prices.
* Total gross national product less compensation of general government employees.NOTE.—Detail will not necessarily add to totals because of rounding.Source: Department of Commerce.
142
Digitized for FRASER http://fraser.stlouisfed.org/ Federal Reserve Bank of St. Louis

TABLE B-4.—Personal consumption expenditures, 1929-52
[Billions of dollars]
Period
1929 .._
1930 -1931193219331934
193519361937 _ _19381939
19401941194219431944
1945 _ _ _ .194619471948 -1949
10501951
1951: First halfSecond half _.
1952: First half*
1951: First QuarterSecond quarter _Third QuarterFourth quarter.
1952: First quarterSecond quarter * _ _ _
Totalex-
pendi-tures
78.8
70.861.249.246.351.9
58.262.567.164.567.5
72.182.391.2
102.2111.6
123.1146.9165.6177.9180.fi
194.3208.0
Durable goods
Total
9.4
7.35.63.73.54.3
5.26.47.05.86.7
7.99.87.16.87.1
8.516.621.422.923.8
29.227.1
Auto-mo-bilesand
parts
3.2
2.21.6.9
1.01.4
1.92.32.41.62.1
2.73.3.7.8.9
1.14.26.67.59.4
12.310.7
Other
6.1
5.14.02.82.52.9
3.34.14.64.14.6
5.16.46.46.06.2
7.412.414.815.414.5
16.916.4
Nondurable goods
Total
37.7
34.129.022.722.326.7
29.432.935.234.035.3
37.644.052.961.067.1
74.985.895.1
100.999.2
102.8113.5
Food*
19.7
18.114.811.411.514.3
16.318.520.019.019.3
20.724.430.535.338.9
43.050.356.659.758.9
61.469.2
Cloth-ing 2
9.2
7.96.85.04.65.6
5.96.56.76.67.0
7.48.8
11.013.715.3
17.118.619.120.119.0
18.920.3
Other
8.9
8.17.46.46.26.9
7.27.98.68.48.9
9.510.811.411.912.9
14.816.919.421.121.4
22.524.1
Services
Total
31.7
29.526.622.820.620.9
21.723.324.924.725.5
26.628.531.234.437.4
39.744.549.154.157.5
62.467.3
Hous-ing a
11.4
11.010.29.07.87.5
7.67.98.48.78.9
9.29.9
10.611.111.7
12.213.014.616.518.1
19.921.8
Other
20.2
18.51Q.413.812.713.4
14.115.416.516.016.5
17.418.720.623.325.7
27.531.434.537.739.4
42.545.6
Seasonally adjusted annual rates
207.5208.4
214.1
210.5204.5206.4210.5
213.2215.0
28.825.4
25.4
31.326.325.525.3
25.225.5
11.89.7
10.0
12.611.09.99.5
9.610.4
17.115.7
15.4
18.815.415.615.8
15.615.1
112.3114.7
118.2
113.3111.3113.2116.2
118.0118. 5
68. 470.0
72.0
68.568.269.570.4
71.872.2
20.220.4
20.6
20.719.720.020.7
20.620.6
23.824.4
25.6
24.123.423.725.1
25.625.7
66.468.3
70.5
65.966.967.669.0
70.071.0
21.222.2
23.1
21.021.522.022.5
22.923.3
45.146.1
47.4
44.945.345.646.5
47.147.7
1 Includes alcoholic beverages.2 Includes shoes and standard clothing issued to military personnel.8 Includes imputed rental value of owner-occupied dwellings.« Estimates based on incomplete data; second quarter by Council of Economic Advisers.NOTE.—The figures beginning with 1949 are based on the revised series of national income and product
of the Department of Commerce. For detail, see the Survey of Current Business, July 1952.Detail will not necessarily add to totals because of rounding.
Source: Department of Commerce (except as noted).
143
Digitized for FRASER http://fraser.stlouisfed.org/ Federal Reserve Bank of St. Louis

TABLE B-5.—Gross private domestic investment, 1929-52
[Billions of dollars]
Period
i929
1930193119321Q331934
1935 - -1936193719°»81939 - -
19401941194219431944
19451946194719481949
19501951
1951:First halfSecond half
1952:First half «
1951:First quarterSecond quarter. .Third quarter-.Fourth quarter.
1952:First quarterSecond quarter8.
Totalgrosspri-vate
domes-tic
nvest-ment
15.8
10.25.4.9
1.32.8
6.18.3
11.46.39.9
13.918.310.95.77.7
10.728.730.242.733.5
50.3.'58. 5
Nonfann producers'plant and equipment
Total i
9.8
7.64.62.52.33.1
3.85.26.64.75.7
7.49.35.84.66.3
8.715.520.323.421.7
25.429.6
Equip-ment2
5.6
4.32.81.61.62.2
2.93.94.73.44.0
5.36.64.13.54.7
6.310.714.616.715.3
18.420. 8,
Con-struc-tion i 3
4.2
3.41.81.0.7.9
1.01.31.91.41.7
2.12.71.71.11.6
2.44.85.76.76.4
7.08.8
Farm equipment andconstruction
Total 4
1.1
.9
.5
.3
.3
.4
.6
.81.0.8.8
1.01.31.0.9
1.2
1.42.43.84.64.7
5.45.9
Equip-ment
0.8
.7
.4
.3
.3
.3
.5
.6
.8,6.6
.81.0.7.6.9
1.11.62.53.23.4
3.64.1
Con-struc-tion
0.3
.2
.1
.1
.1
.2
.2
.2
.2
.2
.3
.3
.3
.3
.3
.91.31.41.3
1.81.8
Resi-dential
con-struc-tion(non-
farm)^
2.8
1.41.2.5.3.4
.71.11.41.52.7
3.03.41.81.0.8
1.14.06.38.68.3
12.611.0
Otherpri-vatecon-
struc-tion8
0.5
.5
.4
.2
.1
.1
.1
.1
.2
.2
.2
.2
.3
.1
.1
o
'.71.01.3
1.51.7
Net change inbusiness inventories
Total
1.6
-.3-1.4-2.6-1.6-1.1
.91.02.3
— 1 0.4
2.33.92.1-.9
o
-.76.1-.85.0
-2.5
5.510.3
Non-farmafter
revalu-ation
adjust-ment
1.8
—1.7-2.6-1.3
.2
.42.11.8
— 1 1.3
2.03.4.8
-.5— 3
-.66.31.43.7
-1.6
4.69.4
Farm
-0,3
— 23
— 3-L3
.5-1.1
.5I
.1
.2
.51 3
-.4
i—'.2
-2.21.3-.9
.9
.9
Seasonally adjusted annual rates
62.554.6
49.0
59.865.256.252.9
50.048.0
29.330.0
31.0
29.129.530.029.9
30.931.1
i
20.621.1
21.8
20.720.621.021.2
21.621.9
8.68.8
9.2
8.48.99.08.7
9.39.2
6.25.5
5.8
5.96.65.75.3
5.85.8
4.43.7
4.1
4.14.83.93.5
4.14.1
1.81.8
1.7
1.81.81.81.8
1.71.7
11.810.1
11.0
12.810.99.9
10.3
11.010.9
1.81.6
1.7
1.71.91.71.6
1.71.7
13.37.4
A
10.316.38.95.8
.6-1.5
12.16.7
-1.3
9.015.28.25.2
—.1-2.5
1.2.6
.8
1.31.1.7.6
.7
1 Items for 1945 and earlier years are not comparable with those for later years, nor with figures shown inappendix table B-17. Items for all years are not comparable with those shown in appendix table B-18,principally because the latter exclude certain equipment and construction outlays charged to currentexpense.2 Total producers' durable equipment less "farm machinery and equipment" and farmers' purchases of"tractors" and "business motor vehicles." These figures assume that farmers purchase 85 and 15 percent,respectively, of all tractors and motor vehicles used for productive purposes.3 Industrial buildings, public utilities, gas- and oil-well drilling, warehouses, office and loft buildings, stores,restaurants, and garages. Includes hotel construction prior to 1946 only.
* Farm construction (residential and nonresidential) plus "farm machinery and equipment" and farmers'purchases of "tractors" and "business motor vehicles." (See footnote 2.)
* Includes construction of hotels, tourist cabins, motor courts, and dormitories since 1946 only.6 Includes religious, educational, social and recreational, hospital and institutional, miscellaneous non-residential, and all other private.7 Less than 50 million dollars.8 Estimates based on incomplete data; second quarter by Council of Economic Advisers.
NOTE.—The figures beginning with 1949 are based on the revised series of national income and product ofthe Department of Commerce. For detail, see the Survey of Current Business, July 1952.
Detail will not necessarily add to totals because of rounding.Source: Department of Commerce (except as noted).
144
Digitized for FRASER http://fraser.stlouisfed.org/ Federal Reserve Bank of St. Louis

TABLE B-6.—National income by distributive shares, 1929-52
[Billions of dollars]
Period
1929 -
193019311932 --19331934 _
19351936 .1937193g _.1939
19401941 _1942 -1943 .1944
1945 _ _194(3194719481949 _ _
19501951 _
1951- First halfSecond half
1952- First half •
1951* First quarterSecond quarter _ _ _ _ _Third quarterFourth quarter.
1952: First quarter _Second quarter 5 _ _ _
Totalna-
tionalin-
come1
87.4
75.058.941.739.648.6
56.864.773.667.472.5
81.3103.8137.1169.7183.8
182.7180.3198.7223.5216.3
239.2277.6
Com-pen-
sationof em-ploy-ees 2
50.8
46.539.530.829.334.1
37.142.747.744.747.8
51.864.384.9
109.2121.2
123.0117.1128.0140.2139.9
153.4178.9
Business and pro-fessional incomeand inventory
valuationadjustment
Total
8.3
7.05.33.22.94.3
5.06.16.66.36.8
7.79.6
12.615.017.2
18.720.619.822.121.6
23.726.2
In-come
ofunin-corpo-ratedenter-prises
8.1
6.34.72.93.44.3
5.06.26.76.16.9
7.810.212.915.117.2
18.822.421.322.521.0
24.926.6
In-ven-toryvalu-ationad-
just-ment
0.1
.8
.6
.3-.5-.1
-.1
'^-.2
-.1-.6-.4-.2-.1
-.1-1.8-1.5-.4
.6
-1.2A
In-come
offarmpro-prie-tors
5.7
3.92.91.72.32.3
4.93.95.64.44.5
4.96.9
10.511.811.8
12.514.815.617.712.8
13.315.6
Rent-al in-come
ofper-sons
5.8
4.83.62.52.02.1
2.32.73.13.33.5
3.64.35.46.16.5
6.36.67.17.57.7
8.28.9
Corporate profitsand inventory
valuationadjustment
Total
10.3
6.61.6
-2.0-2.0
1.1
3.04.96.24.35.8
9.214.619.924.324.0
19.218.324.731.729.2
34.841.6
Cor-porateprofitsbeforetax a
9.8
3.3-.8
-3.0.2
1.7
3.25.76.23.36.5
9.317.221.125.124.3
19.723.530.533.827.1
39.642.9
In-ven-toryvalu-ationad-
just-ment
0.5
3.32.41.0
-2.1-.6
9-!7(4)1.0-.7
i-2^6-1.2-.8-.3
-.6-5.2-5.8-2.1
2.1
-4.8-1.3
Netin-
terest
6.5
6.25.95.45.04.8
4.54.54.44.34.2
4.14.13.93.43.1
3.02.93.54.35.0
5.86.4
Seasonally adjusted annual rates
272.2282.9
287.4
269.6274.8280.2285.6
«287.2287.5
175.6182.2
186.5
172.9178.2181.0183.4
186.5186.5
26.126.3
27.4
26.226.026.026.6
27.327.6
27.625.6
27.4
29.026.225.225.9
27.527.2
-1.5.8
.1
-2.8-.2
.8
.7
o'.4
14.816.4
15.0
15.114.415.817.0
15.414.6
8.59.2
9.4
8.58.59.19.4
9.49.4
41.042.2
42.2
40.741.241.942.5
•41. 942.5
46.739.0
41.2
50.143.338.639.5
»42.040.5
-5.83.1
1.0
-9.4-2.1
3.23.0
i2.'o
6.46.6
6.8
6.36.46.56.6
6.76.9
1 National income is the total net income earned in production by individuals and businesses. The con-cept of national income currently used differs from the concept of gross national product in that it excludesdepreciation charges and other allowances for business and institutional consumption of durable capitalgoods, and indirect business taxes.
2 Includes wage and salary receipts and other labor income (see appendix table B-7), and employer andemployee contributions for social insurance (see appendix table B-8).
See appendix table B-32 for corporate tax liability (Federal and State income and excess profits taxes)and corporate profits after tax.
* Less than 50 million dollars.s Estimates based on incomplete data; corporate profits and total national income for first quarter and all
items for second quarter by Council of Economic Advisers.
NOTE.—The figures beginning with 1949 are based on the revised series of national income and product ofthe Department of Commerce. For detail, see the Survey of Current Business, July 1952.
Detail will not necessarily add to totals because of rounding.
Source: Department of Commerce (except as noted).
Digitized for FRASER http://fraser.stlouisfed.org/ Federal Reserve Bank of St. Louis

TABLE B-7.—Personal income, 1929-52
[Billions>f^dollars]
Period
1929
193019311932.1933 ._ .1934
1935 _19361937. .1938 _1939
194019411942. .19431944
19451946194719481949
19501951
1951: First halfSecond half _
1952: First half »
1951: First quarterSecond quarter...Third quarterFourth quarter. ..
1952: First quarterSecond quarter *--
Totalpersonalincome
85.1
76.264.849.346.653.2
59.968.474.068.372.6
78.395.3
122.7150.3165.9
171.9177.7191.0209.5205.9
226.3254.1
Salaries,wages,
and otherlabor
income *
50.5
46.339.230.529.033.8
36.842.145.942.845.7
49.561.581.4
104.5116.2
116.9111.1122.3134.9134.2
146.5170.7
Proprie-tors'and
rentalincome 2
19.7
15.711.87.47.28.7
12.112.615.414.014.7
16.320.828.432.835.5
37.542.042.447.342.1
45. 250.6
Dividendsand
personalinterestincome 3
13.3
12.611.19.18.28.6
8.610.110.38.79.2
9.49.99.7
10.010.6
11.413.214.516.017.1
19.520.4
Transferpayments
1.5
1.52.72.22.12.2
2.43.52.42.83.0
3.13.13.23.03.6
6.211.411.811.312.4
15.112.4
Nonagri-culturalpersonalincome 4
76.8
70.060.146.243.049.5
53.462.866.562.166.3
71.586.1
109.4135.2150.5
155. 7158.8170. 8187.1188.7
208.5233. 6
Agri-culturalincome
8.3
6.24.73.13.63.7
6.55.67.56.26.3
6.89.2
13.315.115.4
16.218.920.222.417.2
17.820.5
Seasonally adjusted annual rates
249.0259.0
263.5
240.2251.9256. 1262.0
263.0264.0
167.4174.0
178.2
164.5170.2172. 2175.7
178.1178.3
49.452.0
51.8
49.749.050.853.1
52.151.6
20.020.7
21.0
19.720.320.620.8
20.521.5
12.312.4
12.5
12.212.412.512.4
12.512.5
229.7237.5
243.4
226.6232.8235. 3239.8
242.6244.3
19.421.5
20.0
19.619.120.822.2
20.419.7
1 Differs from "compensation of employees" in appendix table B-6, in that it excludes employer andemployee contributions to social insurance. Includes wage and salary receipts and other labor income-compensation for injuries, employer contributions to private pension and welfare funds, pay of militaryreservists not on full-time active duty (pay for full-time active duty included in military wages and salaries),directors' fees, jury and witness fees, compensation of prison inmates, Government payments to enemyprisoners of war, marriage fees to justices of the peace, and merchant marine war-risk life and injury claims.
2 See appendix table B 6 for major components.* See appendix table B-32 for dividend payments.< Nonagricultural income is personal income exclusive of net income of unincorporated farm enterprises,
farm wages, agricultural net rents, agricultural net interest, and net dividends paid by agricultural cor-porations.
• Estimates based on incomplete data; second quarter by Council of Economic Advisers.NOTE.—The figures beginning with 1949 are based on the revised series of national income and product of
the Department of Commerce. For detail, see the Survey of Current Business, July 1952.Detail will not necessarily add to totals because of rounding.Source: Department of Commerce (except as noted).
146
Digitized for FRASER http://fraser.stlouisfed.org/ Federal Reserve Bank of St. Louis

TABLE B-8.—Relation of national income and personal income., 1929—52
[Billions of dollars]
Period
1929
19301931193219331934 _
19351936193719381939
1940194119421943 _ _ _ _ _1944
194519461947 _ _19481949 .-
1950 - - .1951
1951: First half.Second half
1952: First half »
1951: First quarter.Second quarterThird quarter. _._.Fourth quarter
1952: First quarterSecond quarter * _ _
Nationalincome
87.4
75.058.941.739.648.6
56.864.773.667.472.5
81.3103.8137.1169.7183.8
182.7180.3198.7223.5216.3
239. 2277. 6
Less:
Corpo-rate
profitsand in-
ven-toryvalu-ation
adjust-ment
10.3
6.61.6
-2.0-2.0
1.1
3.04.96.24.35.8
9.214.619.924.324.0
19.218.324.731 729.2
34.841.6
Contri-butions
tosocialinsur-ance
0.2
.3
.330
.3
.3
.61.82.02 1
2.32.83.54.55.2
6.16.05.75 25.7
6.98.2
Excessof
wage• ac-crualsoverdis-
burse-ments
0.2— . 2
0)0)0)0)0)
0)0)
Plus:
Gov-ern-
menttrans-
ferpay-
ments
0.9
1.02.01.41.51.6
1.82.91.92.42.5
2.72.62.72.53.1
5.610.911.110.511.6
14.311.5
Netinter-
estpaidby
gov-ern-
ment
1.0
1.01.11.11.21.2
1.11.11.21.21.2
1.31.31.52.12.8
3.74.44.44.54.6
4.74.9
Divi-dends
5.8
5.54.12.62 i£ 6
2.94.64.73.23.8
4.04.54.34.54.7
4.75.86.67.27.5
9.09.0
Busi-ness
trans-fer
pay-ments
0.6
.5
.6
.7
.7
.6
.6
.6
.6
.4
.5
.4
.5
.5
.5
.5
.5
.6
.7
.7
.8
.8
.9
Equals:Per-sonal
income
85.1
76.264.849.346.653.2
59.968.474.068.372.6
78.395.3
122.7150. 3165.9
171.9177.7191.0209.5205.9
226.3254.1
Seasonally adjusted annual rates
272.2282. 9
287.4
269. 6274.8280.2285.6
2287.2287.5
41.042.2
42,2
40.741.241.942.5
2 41. 942.5
8.28.2
8.4
8.18.28.18.3
8.98.5
-0.1.1
-.1.]
-.2.8
—.6
.1-.3
11.411.6
11.6
11.311.611.611.5
11.711.6
4.85.0
5.0
4.84.94.95.0
5.05.0
8.89.2
9.2
8.69.09.29.3
8.99.6
0.9.9
.9
.9
.9
.9
.9
.9
.9
249.0259. 0
263.5
246.2251.9256.1262.0
263.0264. 0
1 Less than 50 million dollars.2 Estimates basedfon incomplete data; corporate profits and total national income for first quarter and
all items for second quarter by Council of Economic Advisers.NOTE.—The figures beginning with 1949 are based on the revised series of national income and product of
the Department of Commerce. For detail, see the Survey of Current Business, July 1952.Detail will not necessarily add to totals because of rounding.
Source: Department of Commerce (except as noted).
147
Digitized for FRASER http://fraser.stlouisfed.org/ Federal Reserve Bank of St. Louis

TABLE B-9.—Disposition oj personal income, 1929-52
[Billions of dollars]
Period
1929 ._..
1930 ...193119321933 _ _ _ _1934 _
19351936193719381939
1940194119421943 _1944
1945... .1946 .194719481949 _
1950....1951
1951: First half .Second half.. ....
1952: First half i ...
1951: First quarterSecond quarterThird quarterFourth quarter.
1952: First quarter. _.Second quarter J
Personalincome
85.1
76.264.849.346.653.2
59.968.474.068.372.6
78.395.3
122.7150.3165.9
171.9177.7191.0209.5205.9
226.3254.1
Less:Personaltax andnontax
payments
2.6
2.51.91.51.51.6
1.92.32.92.92.4
2.63.36.0
17.818.9
20.918.821.521.118.6
20.829.1
Equals:Dispos-
ablepersonalincome
82.5
73. 7::63.047.845.251.6
58.066.171.165.570.2
75.792.0
116.7132.4147.0
151.1158.9169.5188.4187.2
205. 5225.0
Less:Personal
con-sumptionexpendi-
tures
78.8
70.861.249.246.351.9
56.262.567.164.567.5
72.182.391.2
102.2111.6
123.1146.9165.6177. 9180.6
194.3208.0
Equals:Personal
netsaving
3.7
2.91.8
-1.4-1.2
2
1.83.63.91.02.7
3.79.8
25.630.235.4
28.012.03.9
10. 56.7
11.217.0
Netsaving aspercentof dis-
posablepersonalincome
4.5
3.92.9
-2.9-2.7-.4
3.15.45.51.53.8
4.910.721.922.824.1
18.57.62.35.63.6
5.57.6
Seasonally adjusted annual rates
249.0259.0
263.5
246.2251.9256.1262.0
263. 0264.0
28.429.7
32. 5
28.228.729.030.4
32.532.5
220.6229.3
231.0
218.0223.2227.1231.5
230.5231. 5
207.5208.4
214.1
210.5204.5206.4210.5
213.2215.0
13.120.9
16.9
7.518.720.721.1
17.316.5
5.99.1
7.3
3.48.49.19.1
7.57.1
i Estimates based on incomplete data; second quarter by Council of Economic Advisers.
NOTE.—The figures beginning with 1919 are based on the revised series of nationa income and product ofthe Department of Commerce. For detail, see the Survey of Current Business, July 1952.
Detail will not necessarily add to totals because of rounding.
Source: Department of Commerce (except as noted).
148
Digitized for FRASER http://fraser.stlouisfed.org/ Federal Reserve Bank of St. Louis

TABLE B-10.—Total and per capita disposable personal income in current and 1951 prices, 1929-52
Period
1929
1930 _ -1931 ._.19321933 _1934
1935193619371938 _1939
1940 _ _1941194219431944
1945194619471948 . -1949
19501951
1951- First half -Second half
1952: First half 3 -
1951' First quarterSecond quarter _ _Third quarterFourth quarter
1952: First quarter _ _ _Second quarter 3
Total disposable personalincome (billions of dollars)
Currentprices
82.5
73.763.047.845.251.6
58.066.171.165.570.2
75.792.0
116.7132.4147.0
151.1158.9169.5188.4187.2
205.5225.0
1951prices 1
124.6
116.4111.395.495.0
102.6
113.3127.9132.6125.0135.5
144.7166.1187.3194.7205.9
204.7200.4194.4204.8205.7
220.7225. 0
Per capita disposable per-sonaljncomej(dollars)
Currentprices
678
599508383360408
456516552505536
573690866968
1,062
,080,124,176,285,255
1, 3551,458
1951prices *
1,024
946898764756811
891998
1,030964
1,035
1,0961,2451,3901,4241,487
1,463134171,3491,3971,379
1, 4551,458
Seasonally adjusted annual rates
220.6229.3
231.0
218.0223.2227.1231.5
230. 5231. 5
221.7228.2
227.8
219. 8223.6227.3229.0
227.5228.1
1,4351,478
1,477
1,4211,4491,4631,489
1,4771,477
1,4421,471
1,456
1, 4321,4521,4691,473
1,4581,455
Population(thousands) 2
121, 770
123, 077124, 040124, 840125, 579126, 374
127, 250128, 053128. 825129, 825130, 880
132. 114133, 377134, 831136, 719138, 390
139, 934141, 398144, 129146, 621149, 149
151, 689154, 353
153, 699155, 107
156, 405
153, 396154, Oil154,724155,466
156, 098156, 700
* Dollar estimates in current prices divided by an over-all implicit price index for personal consumptionexpenditures. This price index was based on Department of Commerce data shifted from a 1939 base.
2 Provisional intercensal estimates of the population of continental United States including armed forcesoverseas, taking into account the final 1950 census total population count. Annual data are as of July 1;quarterly and semiannual data as of middle of period.
3 Estimates based on incomplete data; second quarter by Council of Economic Advisers.NOTE.—The figures beginning with 1949 are based on the revised series of national income arid product of
the Department of Commerce. For detail, see the Survey of Current Business, July 1952.Detail will not necessarily add to totals because of rounding.Sources: Department of Commerce and Council of Economic Advisers.
Digitized for FRASER http://fraser.stlouisfed.org/ Federal Reserve Bank of St. Louis

TABLE JB-11.—Labor force, employment, and unemployment, 7929-52
Period
Monthly average:1929
1930193119321933 -.1934
19351936193719381939 . .
194019411942...19431944
194519461947 .19481949
19501951
1951: First half..Second half
1952: First b-ilf
1951* J^rnifirvFebruaryMarch _AnrilMav- -JuneJulyAujrustSeptember ._ _ _ .OctoberNovemberDecember . _
1952: JanuaryFebruaryMarchApril . .MavJune
Totallaborforce
(includ-ing
armedforces) *
Armedforces '
Civilian labor force
Totalcivilianlaborforce
Employment 2
Total Agri-cultural
Ncnagri-cultural
Unem-ploy-ment
Thousands of persons, 14 years of age and over
49, 440
50, 08050, G8051, 25051, 84052, 490
53, 14053, 74054, 32054, 95055, 600
56, 03057, 38060, 23064, 41065, 890
65, 14060, 82061, 60862, 74863, 571
64, 59965, 832
64, 94866, 717
(3)
63, 75963, 8f>864, 95664, 57765, 72866, SOO67, 47767. 37166. 39666, 66266, 42265, 973
(3)(3)(3)(3)(3)(3)
260
2602GO250250260
270300320340370
3901,4703,8208,870
11, 260
11, 2803,3001,4401,3061,466
1. 5002,948
2,6943,204
(3)
2,2452. 5552, 6312, 7882,9253,0173,0953, 1633.2103,2103,2583, ?85
(3)(3)
§i8)
49, ISO
49, 82050, 42051,00051, 59052,230
52, 87053, 44054, 00054, 61055, 230
55, 64055, 91056. 41055, 54054,630
53, SCO57, 52060, 16861, 44262, 105
63. 09962, 884
62, 2f,463, 513
62, 341
61, 51461, 31362, 32561, 78962, 80363, 78364,38264, 20863, 18G63, 45263,16462, 688
61, 78061,83861, 51861, 74462, 77864,390
47, 630
45, 48042, 400S8, 94038, 76040, 890
42, 26044. 41046, 30044, 22045, 750
47, 52050, 35053, 75054, 47053, 960
52, 82055, 25058, 02759, 37858, 710
59, 95761, 005
60, 189Cl, 820
60, 512
59, 01058, 90500. 17960, 04461, 19361,80362. 52662, 63061, 58061,83661, 33661, 014
59. 72659, 75259, 71460,13261, 17662, 572
10, 450
10, 34010, 29010, 17010, 0909,900
10, 11010. 0009,8209,6909,610
9,5409,1009,2509,0808, 950
8.5808, 3208,2667,9738,026
7,5077,054
6, 7147,365
6,634
6,0185,9306,3936, 6457, 4408, 0357,9087,6887. 52r,7, 6687,0226,378
6.1866,0646.0126.4126,9608,170
37, 180
35, 14032, 11028, 77028, 67030, 990
32, 15034, 41036,48034, 53036, 140
37, 98041, 25044, 50045, 39045, 010
44, 24046, 93049, 76151, 40550, 684
52, 45053, 951
53, 44654, 455
53, 878
52, 99352, 97653, 78553, 40053, 75353, 76854. 61854, 94254, 05454, 16854, 31454, 636
53, 54053, 68853, 70253, 72054, 21854, 402
1,550
4, 3408,020
12, 06012,83011,340
10, 6109,0307,700
10, 3909,480
8,1205,5602,6601,070
670
1,0402,2702,1422,0643,395
3, 1421,879
2,0651, 693
1, 829
2, 5032, 4072,1471,7441,6091, 9801,8501, 5781,6061, 6161,8281,674
2.0542,0861.8041,6121,6021,818
Unem-ploy-ment
as per-cent oftotal
civilianlaborforce
3.2
8.715.923.624.921.7
20.116.914.319.017.2
14.69.94.71.91.2
1.93.93.63.45.5
5.03.0
3.32.7
2.9
4.13.93.42.82.63.12.92.52.52.52.92.7
3.33.42.92.62.62.8
1 Data for 1940-51 exclude about 150,000 members of the armed forces who were outside the continentalUnited States in 1940 and who were therefore not enumerated in the 1940 census. This figure is deductedby the Census Bureau from its current estimates for comparability with 1940 data.
3 Includes part-time workers and those who had jobs but were not at work for such reasons as vacation;illness, bad weather, temporary lay-off, and industrial disputes.
3 Not available.
NOTE.—Labor force data are based on a survey made during the week which includes the 8th of themonth.
Detail will not necessarily add to totals because of rounding.
Sources: Department of Labor (1929-39) and Department of Commerce (1940-52).
150
Digitized for FRASER http://fraser.stlouisfed.org/ Federal Reserve Bank of St. Louis

TABLE B-l 2.—Number of wage and salary workers in nonagricultural establishments, 1929-52l
[Thousand's of employees}
Period
Monthly average:1929
19301931 . . .193219331934 ---
1935193619371938 .1939
19401941 _ .1942...19431944
19451946 .194719481949 .
19501951
1951: First halfSecond half
1952: First half < _ _ . „
1951: JanuaryFebruaryMarchAprilMayJuneJulyAugust .SeptemberOctober _ _NovemberDecember
195?: JanuaryFebruary „_MarchApril *May*June *
Totalwageand
salarywork-
ers
31,041
29, 14326, 38323, 37723. 46625, 699
26, 79228, 80230, 71828, 90230, 287
32, 03138, 15439, 69742, 04241, 480
40, 06941,41243. 37144, 20143,006
44, 12446, 401
45, 88046, 921
46, 119
45, 24645, 39045, 85045, 99846, 22646, 56746, 43246, 72446, 95646, 90246, 85247, 663
45, 91345, 89946, 00146, 25846, 32046, 322
Manufacturing
Total
10, 534
9,4018,0216,7977,2588,346
8,9079,653
10, 6069, 253
10,078
10, 78012, 97415, 05117, 38117, 111
15, 30214, 46115, 24715, 28614, 146
14, 88415, 931
15, 92515, 938
15, 733
15, 78415, 97816, 02215, 95515, 85315, 95615, 81316, 00816, 03915, 96515, 89015, 913
15,77615,85915, 86915, 78415, 67115,440 '
Dur-able
goods
(3)
(3)(')(3)(3)(3)
0)(3)(3)(3)
4,683
5, 3376,9458,804
11,077.10, 858
9, 0797,7398,3738,3157,465
8,0088,926
8,9278,925
8,954
8,7428,8778, 9699, 0038,9758,9988,8398,8788,9138,9428,9769,000
8, 9469,0109,0359,0459,0068,682
Non-dura-ble
goods
(3)
(3)(3)(3)(3)C)
(3)(3)
85, 394
5, 4436,0286,2476,3046, 253
6,2226, 7226, 8746,9706,681
6,8767,005
6,9977,013
6,779
7,0427,1017,0536,9526, 8786,9586,9747,1307,1267,0236,9146,913
6, 8306, 8496, 8346,7396,6656,758
Min-ing
1,078
1,000864722735S74
888937
1,006882845
9169479839178S3
826852943981932
904920
923916
895
932930924911915927906922917917917916
909902904897894882
Con-tractcon-
struc-tion
1, 497
1,3721,214
970809862
9121,1451,1121,0551, 150
1, 2941,7902,1701,5671,094
1, 1321,6611,9822,1652,155
2,3182.569
2, 4322,707
2,418
2,2812,2282,3262,4712,5982,6862, 7542,8092,7682,7612,6332,518
2,3162,3082,2962,4102,517 !2,661 1
Trans-porta-tionand
publicutili-ties
3,907
3. 6753, 2-132, 8042, 6592,736
2,7712, 9563,1142,8402, 912
3, 0133, 2483, 4333, 6193, 793
3,8724, 0234. 1224 1513,979
4,0104,144
4,1164,173
4,123
4,0724,0824,1124, 1324,1374,1614, 1764,1904,1784,1664,1654,161
4, 1034,1114,1184,0984, 1384,170
Trade2
6, 401
6,0645,5314,9074,9995,552
5, 6926, 0766, 5436, 4536,612
6, 9407,4157, 3337, 1897,260
7, 5228, 6029, 1'Jo9,4919, 433
9, 5249,804
9, 6509,958
9,730
9, 5929,5549,7139,6279,6839,7329,6679, 6419,7819, 893
10, 10910, 660
9, 7200, 6439,6689,8179, 7449,787
Fi-nance
1, 431
1,3981,3331,2701,2251,247
1,2621,3131,3551,3-171,382
1,4191,4621,4401,4011,374
1, 3941. 5S61,6411,7161,783
1,8121, 883
1, 8591,906
1,943
1,8311,8391,8541,8651,8741,8931,9081,9141,8931,8981,9071,912
1, 9091,9191,9371, 9531,9591,978
Serv-ice2
3,127
3,0842, 9132,6822,6142,784
2,8833,0603,2333,1963, 321
3,4773,7053,8573, 9193, 934
4, 0554, 6214, 7864,7994, 782
4, 7614,759
4, 7294, 788
4,734
4,6684, 6574, 6824,7454,7894, 8354,8524,8394, 8314,7704, 7344,702
4,6714, 6674,6814, 7484,7954,839
Gov-ern-
ment,(Fed-eral,
State,and
local)
3, 066
3,1493,2643,2253, 1673,298
3, 4773.6623,7493,8763, 987
4,1924,6225,4316, 0496,026
5, 9675, 6075, 4545,6135, 811
5,9106,390
6, 2466,535
6,544
6,0886,1226.2176,2926, 3776, 3776,3586,4016,5446,5326,4976,881
6. 5096, 4906,5286,5516, 6026, 585
3 Includes all full- and part-time wage and salary workers in nonagricultural establishments who workedduring or received pay for any part of the pay period ending nearest the 15th of the month. Excludesproprietors, self-employed persons, domestic servants, and personnel of the armed forces. Not comparablewith estimates of nonagricultural employment of the civilian labor force reported by the Department ofCommerce (appendix table B-ll) which include proprietors, self-employed persons, and domestic servants,which count persons as employed when they are not at work because of industrial disputes, bad weather, ortemporary lay-offs, and which are based on an enumeration of population, whereas the estimates in thistable are based on reports from employing establishments.
2 Data for the trade and service divisions, beginning with 1939, are not strictly comparable with data shownfor earlier years because of the shift of the automotive repair service industry from the trade to the servicedivision.
3 Not available.* Estimates based on incomplete data.
NOTE.-—Adjustments have been made to levels indicated by data of unemployment insurance agenciesand the Bureau of Old-Age and Survivors Insurance through 1947, and have been carried forward from1947 bench mark levels, thereby providing consistent series.
Detail will not necessarily add to totals because of rounding.
Source: Department of Labor.
Digitized for FRASER http://fraser.stlouisfed.org/ Federal Reserve Bank of St. Louis

TABLE B-13.—Average weekly hours in selected industries, 1929-52
Period
Monthly average:1929
1930-1931193219331934
1935. .._19361937 ._19381939
19401941194219431944
19451946194719481949
19501951
1951: First halfSecond half...
1952: First half 4-._-
1951' JanuaryFebruaryMarchAprilMay . __ _JuneJulyAugustSeptemberOctoberNovemberDecember
1952: JanuaryFebruaryMarchApril *May 4 _ _June 4
Manufacturing
Total
44.2
42.140.538.338.134.6
36.639.238.635.637.7
3S.140.642.944.945.2
43.440.440.440.139.2
40.540.7
40.940.6
40.4
41.040.941.141.040.740.740.240.340.640.540.541.2
40.840.740.739.840.240. 4
Durablegoods
0)
0)(032.634.833.9
37.341.040.035.038.0
39.342.145.146.646.6
44.140.240.640.539.5
41.241.7
41.841.5
41.4
41.541.641.942.041.841.840.941.341.641.741.542.2
41.841.741.740.841.141.1
Non-durable
goods
(0
0)(041.940.035.1
36.137.737.436.137.4
3/.038.940.342.543.1
42.340.540.139.638.8
39.739.5
39.839.3
39.2
40.240.040.039.739.339.439.339.139.438.939.239.9
39.539.539.338.438.939.4
Bitumi-nouscoal
mining
38.4
33.528.327.229.527.0
26.428.827.923.527.1
28.131.132.936.643.4
42.341.640.738.032.6
35.035.2
34.635.8
33.9
37.634.133.633.933.334.832.734.936.536.336.238.4
38. 535.935.429.730.20)
Build-ingcon-
struc-tion
0)
(')0)0)(028.9
30.132.833.432.132.6
33.134.836.438.439.6
39.038.137.6
337.336.7
3P>. 337.3
36.637.8
37.6
36.735.335.836.837.537.738.138.238.238. 536.437.7
37.537.936.937.738.20)
Class Irail-
roads
44.8
43.141.138.938.840.4
41.142.543.242.543.4
44.045.646.948.749.1
48.545.946.346.143.5
40.841.0
41.340.6
(')
42.141.141.940.641.041.140.142.139.142.040.839.5
41.642.740.20)(0C1)
Tele-phone
C)
(0(0(')
8838.838.939.1
39.540.140.541.942.3
(2)39. 437.439.238.5
38.939.1
39.039.2
38.0
38.939.238.988.739.039.439.839.239.439.139.238.8
38.738.538.535.139.00)
Whole-sale
trade
0)
0)
80)(0
(')0)0)(00)0)0)(00)0)
C1)0)41.040.940.7
40.7'40.7
40.640.8
40.4
40.840.040.640.640.640.740.740.740.940.840.841.1
40.740.440.440.140.3(0
Retailtrade
(excepteatingand
drink-ing
places)
0)(0(0(0
880)0)0)
0)0)0)0)(')
0)0)40.340.340.4
40.540.1
40.040.2
39.8
40.340.139.739.939.840.440.840.840.039.839.440.1
39.839.839.839.839.70)
Hotels(year-
round)
0)
0)0)0)(')0)0)0)0)0)0)
C1)0)0)ro0)
0)0)
45.244.344.2
43.943.2
43.343.1
42.6
43.443.243.343.343.443.443.443.342.942.943.143.2
42.842.842.542.642.3
0)
1 Not available.2 Average for year not available because new series was started in April 1945. Beginning with June 1949
data relate to norisupervisory employees only.3 Not strictly comparable with previous data.4 Estimates based on incomplete data.
NOTE.—Data are for production workers in manufacturing and mining, hourly-rated employees in rail-roads, construction workers in building construction, and for nonsupervisory employees hi other industries.Data are for payroll periods ending closest to the middle of the month except in railroads where monthlydata are used.
The half-year data are straight arithmetic averages of the monthly figures and not strictly comparablewith the annual averages which have been weighted by data on employment.
Source: Department of Labor.
'52
Digitized for FRASER http://fraser.stlouisfed.org/ Federal Reserve Bank of St. Louis
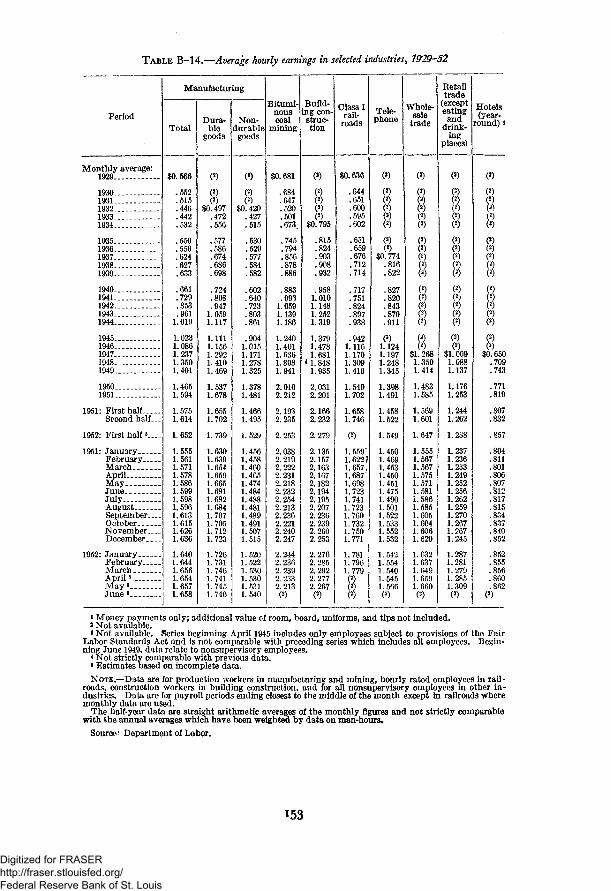
TABLE B-14.—Average hourly earnings in selected industries, 1929-52
Period
Monthly average:1929 - -
19301931193219331934
19351936193719381939
19401941194219431944
19451946194719481949
19501951
1951: First half—Second half...-
1952: First half «....
1951: JanuaryFebruaryMarch ._AprilMay _JuneJulyAugustSeptemberOctoberNovemberDecember
1952: JanuaryFebruaryMarch _ _AprilsMay 5 -- .June 5
Manufacturing
Total
$0.566
.552
.515
.446
.442
.532
.550
.556
.624
.627.633
.661
.729.853.961
1.019
1. 0231.0861.2371.3501.401
1.4651.594
1.5751.614
1.652
1. 5551.5611.5711.5781.5861.5991.5981.5961.6131.6151.6261.636
1.6401.6441.6561.6541. 6571.658
Dura-ble
goods
(2)
(2)(2)
$0. 497.472.556
.577
.586
.674
.686
.698
.724
.808
.9471. 0591.117
1. Ill1.1561.2921.4101.469
1.5371.678
1. 6551.702
1.739
1.6301.6391.6541.6591.6651.6811.6821.6841.7071. 7051.7121.723
1.7261.7311.746.741
1.745.746
Non-durable
goods
(2)
(2)(2)
$0. 420.427.515
.530
.529
.577
.584
.582
.602
.640
.723
.803
.861
.9041.0151. 1711.2781.325
1.3781.481
1.4661.495
1.529
1.4561.4581.4601.4651,4741.4841.4881.4811.4891.4911.5071.515
1.5201.5221.5301.5301. 5311.540
Bitumi-nouscoal
mining
$0. 681
.684
.647
.520
.501
.673^
.745
.794
.856
.878
.886
.883
.9931.0591.1391.186
1.2401.4011. 6361.8981.941
2.0102.212
2.1932.235
2.253
2.0382.2192.2222. 2312.2182. 2322.2542.2132.2362.2212.2402.247
2. 2442. 2362.2392.2332.213(2)
Build-ing con-struc-tion
(2)
(2)(2)
8$0.795
.815
.824
.903
.908
.932
.9581.0101.1481.2521.319
1.3791.4781.681
< 1. 8481.935
2,0312.201
2.1662.232
2.279
2.1352.1572.1632.1672.1822.1942.1952. 2072.2362. 2392.2602.253
2.2762.2852.2922.2772.267(2)
Class Irail-
roads
$0.636
.644
.651
.600
.595
.602
.651
.659
.676
.712
.714
.717
.751
.824
.897
.938
.9421.1161.1701.3091.419
1.5491.702
1.6581.746
(2)
1. 559"1.622!1.657,1.6871.6981.7231.7411.7231.7601.7321.7501.771
1.7811.7961.779(2)(2)(2)
Tele-phone
(2)
(2)(2)(2)(2)(2)
(2)(2)
$0. 774.816.822
.827
.820
.843
.870
.911
(3)1.1241.1971.2481.345
1.3981.491
1.4581.522
1.549
1.4501.4691.4531.4501.4511. 4751.4901. 5011.5221. 5331.5521.532
1.5421.5541.5401.5451.566(2)
Whole-sale
trade
(2)
(2)(2)(2)(2)(2)
(2)(2)(2)(2)(2)
(2)(2)(2)(2)(2)
(2)(2)
$1. 2681.3591.414
1.4831.585
1.5691.601
1.647
1.5551.5671.5671.5751.5711. 581.586.585.605.604.606.620
1.6321.6371.6491. 6591.660(2)
Eetailtrade
(excepteatingand
drink-ing
places)
(2)
00(2)(2)(2)(2)
8(2)(2)(2)
(2)(2>(2)(2)(2)
(2)(2)
$1. 0091.0881.137
1.1761.253
1.2441.262
1.288
1.237.236.233.249.252.256.262.259.270.267.267.245
.287
.281
.279
.285
.309(2)
Hotels(year-
round) i
(2)
(2)(2)(2)(2)(2)
8(2)(2)(2)
(2)(2)
§(2)
(2)(2)
$0.650.709.743
.771
.819
.807
.832
.857
.804
.811
.801
.806
.807
.812
.817
.815
.834
.837
.840
.852
.852
.855
.856
.860
.862(2)
i Money payments only; additional value of room, board, uniforms, and tips not included,a Not available.3 Not available. Series beginning April 1945 includes only employees subject to provisions of the Fair
Labor Standards Act and is not comparable with preceding series which includes all employees. Begin-ning June 1949, data relate to nonsupervisory employees.
4 Not strictly comparable with previous data.« Estimates based on incomplete data.
NOTE.—Data are for production workers in manufacturing and mining, hourly rated employees in rail-roads, construction workers in building construction, and for all nonsupervisory employees hi other in-dustries. Data are for payroll periods ending closest to the middle of the month except in railroads wheremonthly data are used.
The half-year data are straight arithmetic averages of the monthly figures and not strictly comparablewith the annual averages which have been weighted by data on man-hours.
Source. Department of Labor.
153
Digitized for FRASER http://fraser.stlouisfed.org/ Federal Reserve Bank of St. Louis

TABLE B—15.—Average gross weekly earnings in selected industries, 1929—52
Period
Monthly average:1929
19301931193219331934 _
19351936193719381939
19401941194219431944
194519461947 ..19481949
19501951
1951: First halfSecond half. __
1952: First half « _ . _ _
1951: January _FebruaryMarch _AprilMayJuneJulyAugustSeptemberOctoberNovemberDecember
1952: JanuaryFebruaryMarchApril"........May *.June '
Manufacturing
Total
$25. 03
23.2520.8717.0516. 7318.40
20.1321.7824.0522.3023.86
25.2029.5836.6543.1446. 08
44.3943.8249.9754. 1454.92
59. 3364.88
64.4265.45
66. 77
63.7663.8464.5764.7064.5565. 0864.2464.3265.4965.4165.8567.40
66. 9166.9167.4065.8366. 6166.98
Dura-ble
goods
$27. 22
24.7721.2816.2116.4318.87
21.5224.0426.9124.0126.50
28.4434.0442.7349.3052.07
49.0546. 4952. 4657. 1158. 03
63.3269.97
69.1170.70
71.94
67.6568. 1869.3069.6869.6070.2768.7969.5571.0171.1071.0572.71
72.1572.1872.8171.0371.7271.76
Non-durablegoods
$22. 93
21.8420.5017.5716.8918.05
19.1119.9421.5321.0521.78
22.2724.9229.1334. 1237.12
38. 2941. 1446.9650. 6151.41
54.7158.50
58.3058.76
59.88
58.5358.3258.4058. 1657.9358.4758.4857.9158.6758.0059. 0760.45
60. 0460. 1260. 1358. 7559.5660.68
Bitumi-nouscoal
mining
$25. 72
22.2117.6913.9114.4718.10
19. 5822.7123.8420.8023.88
24.7130. 8635.0241.6251.27
52. 2558.0366.5972.1263.28
70.3577. 86
75.6980.09
75.81
76.6375. 67 '74. 6675. 6373. 8677. 6773.7177. 2381.6180.6281.0986.28
8«. 3980. 2779. 2666.3266.83(2)
Build-ing con-struc-tion
(2)
(2)(2)(2)(2)
$22. 97
24.5127. 0130.1429.1930.39
31.7035.1441.8048.1352.18
53.7366.2463.30
* 68. 8570.95
73.7382.10
79.3784.46
85. 79
78.3576.1477.4479.7581.8382, 7183. 6384.3185.4286.2082.2684.94
85.3586. GO84. 5785.8486.60(2)
Class Irail-
roads
$28. 49
27. 7626.7623. 3423.0924.32
26.7628.0129.2030.2630.99
31.5534.2538. 6543.6846.06
45. 6951. 2254.1760. 3461. 73
63.2069.78
68.4470.88
(2)
65. 6366. 6669.4368. 4969.6270.8269.8172.5468.8272.7471.4069.95
74.0970, 6971. 62(2)(2)(2)
Tele-phone
(2)
8(2)(2)(2)
(2)(2)
$29. 8131.5331.94
32.4432.7433.9736.3038.39
(3)44.0444.7748.9251.78
54.3858.30
56. 8959. 72
58. 82
56. 4157.5856. 5256.1256. 5958. 1259. 3058.8459. 9759.9460.8459.44
59. 6859. 8359. 2954.2361.07(2)
Whole-sale
trade
(2)
8(2)
88(2)(2)(2)
(2)(2)(2)(2)(2)
(2)(2)
$51.9955.5857. 55
00.3664. 51
63.7965.37
66. 52
63. 4463.6263.6263.9563.7864. 3564. 5564.5165.6465.4465.5266.58
66.4266. 1366.6266. 5366.90(2)
Retailtrade
(excepteatingand
drink-ing
places)
(2)
(2)(2)(2)(2)'(2)
(2)(2)(2)(2)(2)
(2)(2)(2)(2)(2)(2)(2)
$40. 6643.8545. 93
47.6350.25
49.8050.66
51.24
49.8549.5648.9549.8449.8350.7451.4951.3750.8050.4349.9249.92
51.2250. 9850.9051.1451.97(2)
Hotels(year-
round) l
(2)
(2)(2)(2)(2)(3)
(2)(2)(2)(2)(2)
00(2)(2)(2)(2)
(2)(2)$29. 3631.4132.84
33.8535.38
34. 9835.91
36.51
34.8935.0434.6834.9035.0235.2435.4635.2935.7835.9136.2036.81
36. 4736. f>936.3836. 6436. 46(2)
1 Money payments only; additional value of room, board, uniforms, and tips not included.2 Not available.3 Not available. Series beginning April 1945 includes only employees subject to provisions of the Fair
Labor Standards Act and is not comparable with preceding series which includes all employees. Begin-ning June 1949, data relate to nonsupervisory employees.
4 Not strictly comparable with previous data.8 Estimates based on incomplete data.
NOTE.—Data arc for production workers in manufacturing and mining, hourly rated employees in rail-roads, construction workers in building construction, and for all nonsupervisory employees in other indus-tries. Data are for payroll periods ending closest to the middle of the month except in railroads wheremonthly data are used.
The half-year data are straight arithmetic averages of the monthly figures and not strictly comparablewith the annual averages which have been weighted by data on man-hours.
Source: Department of Labor.
Digitized for FRASER http://fraser.stlouisfed.org/ Federal Reserve Bank of St. Louis

TABLE B—16.—Indexes of industrial and agricultural production, 1929—52
[1935-39=100]
Period 1
1929
19301931 .19321933 _1934
193519361937 _ _19381939 .
19401941194219431944 . - -
19451946 --19471948 - -1949
19501951 _ _
1951: First halfSecond half
1952: First half3
1951: JanuaryFebruary . _-MarchAprilMay. . _JuneJulyAugustSeptemberOctoberNovember _ _December
1952: January. ._ __FebruaryMarchAprilMay3
June 3 - -
Industrial production
Total
110
9175586975
8710311389
109
125162199239235
203170187192176
200220
Manufactures
Total
110
9074576874
8710411387
109
126168212258252
214177194198183
209229
Durable
132
9867415465
8310812278
109
139201279360353
274192220225202
237273
Nondurable
93
8479707981
9010010695
109
115142158176171
166165172177168
187194
Minerals
107
9380677680
8699
11297
106
117125129132140
137134149155135
148164
Adjusted for seasonal variation
222217
216
221221222223222221212217218218219218
221222221216214202
232226
226
231232234234233231222226228226228228
231232231225223212
274273
275
268271277279276274265267271274277282
282284284277276246
199189
186
201201199198198197187193192188188185
189190188183180184
162166
162
164158158164165165156165167174170163
167167164166161145
Agricul-tural pro-duction 2
97
951041019379H9685
108105106
110114128125130
129134129141140
136139
8<«)
8(4)(*)
8I(4)(<)
(4)(4)(*)(4)(4)(4)
1 For industrial production, average of monthly indexes is used for year or half year.2 Index of volume of farm production for human use. New census data may result in some downward
revision for the years 1945-49.3 Estimates based on incomplete data.4 Because of the extreme seasonal nature of agricultural crop production, only an annual index has been
computed.Sources: Board of Governors of the Federal Reserve System and Department of Agriculture.
209722—52 155
Digitized for FRASER http://fraser.stlouisfed.org/ Federal Reserve Bank of St. Louis

TABLE B-17.—New construction activity, 1929-52
[Value put in place, millions of dollars]
Period
1929
193019311932 . .1933 _1934
193519361937 .19381939-.
19401941194219431944
194519461947.19481949
19501951
1951 f First halfSecond half—
1952: First half
1951: January.FebruaryMarchAprilMayJuneJulyAugustSeptemberOctoberNovemberDecember
1952: JanuaryFebruaryMarchApril-MayJune
Totalnewcon-
struc-tion
10, 793
8,7416,4273,5382,8793,720
4,2326,4976,9996,9808,198
8,68211,95714, 0758,3015,259
5,63312,00016, 68921, 67822, 789
28, 74931, 025
Private construction
Totalpri-
vate1
8,307
5,8833,7681,6761,2311,509
1,9992,9813,9033,5604,389
5,0546,2063,4151,9792,186
3,2359,638
13, 25616,86316, 384
21, 61021,684
Resi-den-tial
build-ing
(non-farm)
3,625
2,0751,565
630470625
1,0101,5651,8751,9902,680
2,9853,5101,715
885815
1,1004,0156,3108,5808,267
12, 60010, 973
Non-resi-den-tial
build-ing
(non-farm)
2,694
2,0031,099
502406456
472713
1,085764786
1,0251,482
635233351
1,0203,3413,1423,6213,228
3,7775,152
Otherpri-
vate8
1,988
1,8051,104
544355428
517703943806923
1,0441,2141,065
8611,020
1,1152,2823,8044,6524,889
5,2335,559
Public construction
Totalpublic
2,486
2,8582,6591,8621,6482,211
2,2333,5163,0963,4203,809
3,6285,751
10,6606,3223,073
2,3982,3623,4334,8256,405
7,1399,341
Mili-taryand
naval
19
2940343647
37293762
125
3851,6205,0162,550
837
690188204158137
1771,019
Non-resi-den-tial
build-ing
659
660612415230363
32S701550672970
6151,6463,6852.0101,361
937354599
1,3012,068
2,4023,471
High-way
1,266
1,5161, 355
958847
1,000
8451. 3621.2261,4211, 381
1,3021,066
734446362
398895
1,4511,7742,131
2.3812.400
Otherpublic*
542
653652455535801
1,0231,4241,2831,2651,333
1,3261,4191,2251,316
513
373925
1,1791,5922,069
2,1792,451
Seasonally adjusted annual rates
31, 50030, 550
32,960
30, 76831, 52432, 72432, 24431, 12830. 61230,02430, 06030, 27630, 73230, 92431, 284
31,30832, 91634, 24833, 73232, 88032, 676
22, 57820,790
21, 770
22, 57223,52023,61622, 84821, 72021, 19220.98820, 68820, 66420,78420,80820,808
20,86821, 75623,04022, 30821, 56421, 084
11,85010,096
10, 944
12,40813, 04412, 90011,90410,64410,20010, 0089,7449,852
10,26010,36810, 344
10, 04410, 81212, 13211. 44810, 80010,428
5,2245,080
5,052
4,7165,0045,2205,4245,5445,4365,4245,3645,1964.9084,8004,788
5,0525,1845,1725,1125,0044,788
5,5045,614
5,774
5,4486,4725,4965, 5205, 5325,5565,5565,5805,6165,6165,6405,676
5,7725,7605,7365,7485,7605,868
8,9229,760
11, 190
8,1968,0049,1089,3969,4089,4209, 0369,3729,6129,948
10, 11610, 476
10,44011,16011, 20811, 42411,31611, 592
7041,334
1,824
396492648792888
1,008984
1,1281,2841,4641,5481,596
1,6801,6801,8121,8001,9322,040
3,3423,600
3,970
3,1203,0963,3123,4563,5283,5403,3723,4443,4923,5763,8043,912
3,8523,8283,8404,0084,0924,200
2,4382,362
2,778
2.3042, 1722. 7362. 0042.4362.3762,3522,4842,4482,4242.1602,304
2,2083,0002.9402, 9522,7002,868
2,4382,464
2,618
2,3762,2442.4122,5442,5562.4962,3282,3162. 3882.4842,6042,664
2,7002,6522,6162,6642,5922,484
1 Excludes construction expenditures for crude petroleum and natural-gas drilling, and therefore does notagree with the new construction expenditures included in the gross national product.a Includes public utility, farm, and other private construction not separately shown.3 Includes residential, sewer and water, miscellaneous public service enterprises, conservation and de-velopment, and all other public construction not separately shown.
Sources: Department of Commerce and Department of Labor.
156
Digitized for FRASER http://fraser.stlouisfed.org/ Federal Reserve Bank of St. Louis

TABLE B-18.—Business expenditures for new plant and equipment, 192£h52
[Millions of dollars]
Period
1929
19301931 _ ___193219331934
1935193519371938 - . . .1939
1940 _1941194219431944
1945194619471948 . . .1949
1950 .1951
1951: First halfSecond half
1952: First half ».
1951: First quarter __Second quarterThird quarterFourth quarter _ _
1952: First quarterSocond quarter 5Third quarter s
Total i
9,165
7,6104,7122,6082,1373,080
3,7385,0776,7304,5205,213
6,4908,1906,1104,5305,210
7,40512, 92217, 42620, 03218, 021
17, 83223, 290
Manufacturing and mining
Total
3,596
2,5411,435
930992
1, 460
1,7902,4503,3301,8302,323
3,1404,0803,1702,6102,890
4,4267,3479,3969,9367,887
8,17511, 926
Manu-factur-
ing
(3)
(3)
88(3)(3)(3)(3)1,943
2,5803,4002, 7BO2,2502,390
3,9836,7908,7039,1347,149
7,49111, 130
Mining
(3)
(3)(3)(3)
888380
560680410360500
443557693802738
684798
Transportation
Rail-road
840
865350164101218
166305525238280
4405605404RO580
552573903
1,3191,350
1,1361,541
Other
(4)
(4)(«)(4)(4)(4)
(«)(4)(4)(4)
280
390340260190280
321659798700525
437511
Electricand gasutilities
(«)
(4)(*)(4)(4)(4)
f4)(4)(4)(4)
480
550710680540490
6301, 0451,8972, 0833,140
3.1673,577
Com-mercial
andmiscel-
laneous *
4,729
4,2042.9171,5141,0441,402
1,7822,3212,8752, 4521,850
1,9802,4001,470
730970
1,4773,2984,4295.3945,119
4,9175. 735
Annual rates, not adjusted for seasonal variation
21, 55225, 032
23,816
19, 45223, 65223, 37626, 688
22, 20825, 42424, 672
10, 68413, 172
12, 796
9,34812. 02012, 16014, 184
11, 72013, 87213, 216
9,91212,352
11, 986
8,61611, 20811, 36413, 340
10. 96813, 00412, 348
772820
810
732812796844
752868868
1,4301,652
1,564
1,2121,6481,5081,796
1,5041,6241,560
522500
590
500544480520
536644480
3,2923,862
3,390
3 0123,5723,7323,992
3, 0443,7364,144
5,6245,846
5,476
5,3805,8685, 4966,196
5,4045. ,5485,272
1 Excludes agriculture and outlays charged to current account.2 Commercial and miscellaneous include tiade, service, finance, and communication for all years shown.
Prior to 1939, miscellaneous also included transportation other than railroad, and electric and gas utilitieswhich are not available separately for these years.
3 Not available separately for years prior to 1939.* Included in commercial and miscellaneous prior to 1939.5 Estimates for second and third quarters of 1952 are based on anticipated capital expenditures reported
in May.
NOTE.—These figures do not agree with those shown in column 2 of appendix table B-5 and included inthe gross national product estimates of the Department of Commerce, principally because the latter covercertain equipment and construction outlays charged to current expense. Figures for 1929-44 (except manu-facturing for 1939) are Federal Reserve Board estimates based on Securities and Exchange Commissionand other data.
Detail will not necessarily add to totals because of rounding.
Sources: Securities and Exchange Commission and Department of Commerce (except as noted).
Digitized for FRASER http://fraser.stlouisfed.org/ Federal Reserve Bank of St. Louis

TABLE B-19.—Inventories and sales in manufacturing and trade, 1939-52
[Adjusted for seasonal variation]
Period
1939
19401941194219431944
19451946194719481949 - -
19501951 _..
1951: First half....Second half.
1952: First half 4..
1951: JanuaryFebruary. ..MarchAprilMayJuneJulyAugustSeptember..OctoberNovember.-December...
1952: JanuaryFebruaryMarch *April*.May4
Total manufactur-ing and trade
Millionsof
dollars
In-ven-
tories '
20,051
22, 17628,78031, 09131, 34331, 059
30, 89342, 94250, 60555, 64/50, 921
60, 43470, 107
69, 44270, 107
69, 996
62, 05063, 41665, 24067, 36168, 98169, 44270, 26870. 12469, 96570, 06869, 99170, 107
70, 21969, 89969, 97270,18569, 996
Sales 2
10, 803
12, 13415,81118, 62421, 92023,785
23, 85227, 15133, 15736, 43834,467
39, 10943, 455
44, 36242, 544
44, 272
45,91444, 80444, 22243, 44844, 72843, 05241,69142, 93041, 21544, 17543, 64841, 609
43, 98945, 14442, 62744, 80744, 532
Ratioofin-
ven-tories
tosales 3
1.77
1.731.601.661.401.33
1.301.351.441.471. 55
1.371.56
1.491.65
1.58
1.351.421.481.551.541.611.691.631.701.591.601.68
1.601.551.641.571.57
Manufacturing
Millionsof
dollars
In-ven-
tories i
11,465
12, 81916, 96019, 28720, 09819, 507
18, 38024, 49828, 92031,73428, 690
33, 25342, 014
39, 00942, 014
42, 458
34, 12034, 65735, 55736, 90838, 06839, 00939, 90840, 62141,13241, 42441, 67642, 014
42, 20642, 19242, 33242, 51342, 458
Sales 2
5,112
5,8598,172
10, 43012, 82013, 782
12, 87312, 61715,91817, 63016, 339
19, 06422, 036
22, 57921, 492
22, 845
22, 56022, 26122, 60522, 47923, 43422,13321, 24921, 67720, 59122, 46322, 21420, 761
22, 48423,33421,91423,32423,007
Ratioofin-
ven-tories
tosales 3
2.12
2.071.801.78.52.45
.48
.68
.73
.731.85
1.561.76
1.611.91
1.85
1.51.56.57.64.62.76.88.87.00.84.88.02
.88
.81
.93
.82
.85
Wholesale trade
Millionsof
dollars
In-ven-
tories 1
3,052
3,2384,0443,7813,6843,912
4,5556,5927,6258,0857,729
9,38810, 000
10, 15110, 000
9,478
9,4759,7159,940
10, 10710, 27010, 15110,31510, 07410, 07210, 09910, 03510, 000
9,9529,7269,7539,6629,478
Sales 2
2,187
2,4103,0333,4263,8304,152
4,4765,9937,2727,9317,235
8, 0658,897
9,0368,701
8,622
9,7619,2228,9848,6848,8838,6798, 3848,8248, 3669,1618,9428,630
8,8558,9488,3148,7728,422
Ratioofin-
ven-tories
tosales 3
1.35
1.301.211.19.97.94
.91
.921.02.99
1.07
1.021.12
1.101.16
1.13
.971.051.111.161.161.171.231.141.201.101.121.17
1.121.091.171.101.13
Retail trade
Millionsof
dollars
In-ven-
tories *
5,534
6,1197,7768,0237,5617,640
7,94811, 85214, 06015, 82814, 502
17, 79318, 093
20, 28218, 093
18,060
18, 45519, 04419, 74320, 34620, 64320, 28220, 04519, 42918,76118, 54518, 28018, 093
18, 06117, 98017,88718, 01018,060
Sales 2
3,504
3,8654,6064,7685,2705,851
6,5038,5419,967
10, 87710, 893
11, 97412, 549
12, 74712, 351
12, 805
13, 59313, 32112, 63312, 28512, 41112, 24012, 05812, 42912, 25812, 55112, 49212, 318
12, 65012, 86212,39912, 71113, 103
Ratioofin-
ven-tories
tosales 3
1.53
1.491.491.761.421.32
1.211.151.281.401.41
1.321.54
1.551.53
1.41
1.361.431.561.661.661.661.661.561.531.481.461.47
1.431.401.441.421.38
1 Book value, end of period.» Monthly average shown for year and half-year and total for month.«For annual and semiannual periods, ratio of average end-of-month inventories to average monthly
sales; for monthly data, ratio of end-of-month inventories to sales for month.< Estimates based on incomplete data.
NOTE.—The inventory figures in this table do not agree with the estimates of "change in businessinventories" included in the gross national product since they cover only manufacturing and trade ratherthan all business, and show inventories in terms of current book value without adjustment for revaluation.
Source: Department of Commerce.
158
Digitized for FRASER http://fraser.stlouisfed.org/ Federal Reserve Bank of St. Louis

TABLE B-20.—Sales, stocks, orders, and receipts at 296 department stores, 1939-52
Period
Monthly average:1939
194019411942 ..1943 .1944
19451946194719481949
1950 .. .-. .-1951
1951: First halfSecond half
1952: First half 3
1951: JanuaryFebruaryMarchAprilMay .JuneJulyAugustSeptemberOctoberNovemberDecember
1952: JanuaryFebruaryMarchAprilMay
Reported data(millions of dollars) »
Sales(total formonth)
129
136156179204227
255318337352333
347358
324391
313
o37284348312339326257309343388442608
291271317340345
Stocks(end ofmonth)
344
353419599509535
563715826912862
9421,113
1,1391,087
987
9881,0871,2161,2391,1921,1121, 0691,1061,1171,1521,147
929
910956
1, 0271,0361,007
Out-standing
orders(end ofmonth)
(2)
108194263530560
729909552465350
466425
467384
324
662654467337293386434395404408373292
379386332274251
Derived data(millions of dollars) *
Receipts(total
formonth)
130
137165182203226
256344338356331
361355
350361
328
368383477335292246214346354423437390
272317388349316
Neworders
(total formonth)
(2)
(2)170192223236
269327336335331
370345
346345
320
618375290205248339262307363427402309
359324334291293
Ratio
Stocksto sales
2.67
2.602.693.352.502.36
2.212.252.452.592.59
2.713.11
3.522.78
3.15
2 933'. 833.493.973.523.414.163.583.262.972.601. 53
3.133.533.243.052.92]
Out-standingordersto sales
(2)
0.791.241.472.602.47
2.862.861.641.321.05
1.341.19
1.44.98
1.04
1.962.301.341.08.86
1.181.691.281.181.05.84.48
1.301.421.05.81.73
Out-standingorders
to stocks
(2)
0.31.46.44
1.041.05
1.291.27.67.51.41
.49
.38
.41
.35
.33
.67
.60
.38
.27
.25
.35
.41
.36
.36
.35
.33
.31
.42
.40
.32
.26
.25
1 Not adjusted for seasonal variation.2 Not available.3 Averages of data through May.
NOTE.—These figures are not estimates for all department stores hi the United States. Figures for sales,stocks, and outstanding orders are based on actual reports from the 296 stores. Receipts of goods are derivedfrom the reported figures on sales and stocks. New orders are derived from estimates of receipts and reportedfigures on outstanding orders.
Semiannual and annual data on receipts and new orders cannot be derived directly from the monthlyaverages of sales, stocks, and outstanding orders.
Source: Board of Governors of the Federal Reserve System.
209722r—52 159
Digitized for FRASER http://fraser.stlouisfed.org/ Federal Reserve Bank of St. Louis

TABLEp-21.—Wholesale pricejndexyrJQ29-52
[1947-49=100]
,^Period j
1929
1930 _1931 _193219331934
193519361937 -_19381939
19401941 _ -194219431944 _
1945 ._ --1946194719481949
19501951
1951: First half ..._Second half
1952- First half «
1951: January _FebruaryMarchApriL— _MayJune • _ - _July .AugustSeptember _OctoberNovember _December
1952: JanuaryFebruary _ . _MarchApril _MayJune2
Allcom-modi-ties
61.9
56.147.442.142.848.7
52.052.556.151.150.1
51. l,i56.864.2^67.067.6«*3fc.68.878. 7,^96.4
104.499.2
103.1114.8
115.9113.7
112.1
115.0116.5116.5116.3115.9115.1114.2113.7113.4113.7113.6113.5
113.0112.5112.3111.8111.6111.3
Farmprod-ucts
58.6
49.336.226.928.736.5
44.045.248.338.336.5
37.846.059.268.568.9
71.683.2
100.0107.392.8
97.5113.4
115.7111.0
108.3
112.3117.2117.6117.5115.7113.9111.1110.4109.9111.5112.0111.3
110.0107.8108.2108.7107.9107.3
Pro-cessedfoods
0)
0)
88C1)0)0)
80)0)C1)0)(»)0)0)98.2
106.195.7
99.8111.4
111. 8111.0
109.0
110.2112.9112.0111.8112.3111.3110.7111.2110.9111.6111.0110.7
110.1109.5109.2103.0108.6108.7
All [commodities other than farm productsand foods
Total
65.5
60.953.650.250.956.0
55.756.961.058.458.1
59.463.768.369.370.4
71.378.395.3
103.4101.3
105.0115.9
116.9114.8
113.5
116.6117.2117.3117.1116.8116.2115.7114.9114.8114.6114.5114.6
114.3114.2113.8113.3113.0112.6
Textileprod-
j uctsand
apparel
C1)
?0
?80)C1)0)
(»)0)0)0)0)
0)0)100.1104.495.5
99.2110.6
114.9106.3
100.7
114.6115.7115.9115.5114.8112.9111.6108.5105.9103.9103.9104.0
103.3102.1100.699.999.399.0
Chemi-calsand
alliedprod-ucts
C1)
C1)
88880)0)0)C1)0)C)0)0)101.4103.894.8
96.3110.0
111.5108.6
105.2
111.4112.6111.8111.5111.3110.2108.8108.5108.7103.8108.6103.4
106.7105.9105.4104.8104.3104.3
Rubberand
prod-cuts
0)
0)0)0)C1)0)
C1)0)0)
88(»)0)0)
0)0)99.0
102.198.9
120.5148.0
151.5144.5
140.6
153.0152.5152.3151.5151.3148.3144.3144.3144.7144.7144.6144.3
144.1143.1142.0140.6140.4133.6
Lumberand
woodprod-ucts
,(1)
0)
$')»)0
30)0)
80)
0)0)
93.7107.299.2
113.9123.9
126.0121.8
120.4
125.5126.4126.6126.6126.1124.6123.5122.3121.6121.7121.1120.3
120.1120.3120.5120.9120.7119.9
See footnotes at end of table.
160
Digitized for FRASER http://fraser.stlouisfed.org/ Federal Reserve Bank of St. Louis

TABLE B-21.—Wholesale price index, 1929-52— Continued
[1947-49=100]
Period
1929
19301931193219331934
19351936 -19371938 . - -1939
194019411942 _ _19431944
1945 _ _ _1946194719481949
19501951
1951: First half.. ...Second half. _
1952: First half 2. _.
1951: JanuaryFebruaryMarch.. _AprilMayJuneJulyAugustSeptember _ _ _OctoberNovember...December
1952: JanuaryFebruaryMarchAprilMayJune 3
All commodities other than farm products and foods (continued)
Hides,skins,and
leatherprod-ucts
59.3
54.446.839.744.047.1
48.751.956.950.552.0
54.858.964.063.963.4
64.274.6
101.0102.196.9
104.6120.3
126.6114.0
97.4
127.3127.7126.9126.5126.2124.7122.3118.0118.0113.6107.0105.1
102.299.598.094.194.795.9
Fuel,power,
andlight-ing
mate-rials
70.2
66.557.259.556.162.0
62.264.565.764.761.8
60.764.566.468.470.3
71.176.290.9
107.1101.9
103.0106.7
106.7106.8
106.7
106.4107.4107.3106.5106.2106.3106.5106. 3106.7106.8106.9107.4
107.4107.2107.4106.3106.0106.0
Pulp,paper,and
alliedprod-ucts
0)
0)0)0)(00)
0)0)(00)0)
0)C1)C1)0)(0
0)0)98.6
102.998.5
100.9119.6
120.1119.1
117.5
120.1120.5120. 3119.7119.8120.2120.2119.5119.4118.8118.4118.4
118.2118.3117,7117.4116.9116. 7
Metalsand
metalprod-ucts
(9
0)0)0)0)(0
0)0)0)
880)0)0)
(90)91.3
103.9104.8
110.3122.8
123.4122.3
122.2
124.0123. 7123.2123. 3123.2122.7122.3122.2122.1122.4122.5122.5
122.4122.6122.6122. 5121.8121.1
Mach-ineryand
motiveprod-ucts
0)
000')
0)
0)0)0)0)0)
0)C1)C1)0)0)
0)0)92.5
100.9106.6
108.6119.0
118.2119.8
121.6
117.3117.7118. 6118.6118.6118.6118.8118.9119.4120.2120.5120.7
120.8122.0121.8121.6121.6121.5
Furn-itureand
otherhouse-holddura-bles
(0
0)0)(l)C1)0)
0)0)0)0)0)
0)C1)C1)0)0)
0)0)95.6
101.4103. 1
105.3114.1
114.9113.2
112.0
114.2114.6115. 1115.4115.3115.0114.4113.5113.1112.8112.7112.7
112.3112.4111.9112.1111.7111.6
Non-metal-
licminer-als—struc-tural
0)
0)0)0)0)0)0)1)1)00
0)
80)C1)
(90)93.9
101.7104.4
106.9113.6
113.6113.5
113.0
113.6113.7113.7113.7113.6113.6113.6113.6113. 6113.6113.6112.8
112.9112.9112.9112.8112.9113.8
Tobaccomanu-
facturesand
bottledbever-ages
0)
(l)0)0)0)0)0)0)0)0)0)0)C1)
80)
0)0)98.0
100.4101.6
102. 4108.1
108.4107.8
.110. 4
108.4108.4108.4108.4108.4108.4107.9107.8107.8107.5107.5108. 1
108.1110.8110.8110.8110.8110.8
Miscel-laneous
0)
80)0)0)
0)C1)0)0)0)(')0)0)C1)0)
0)(!)100.8103.198.1
96.6104.9
103.7106.2
109.6
102.6103.9104.2105.7103. 0102.8103.7102.6105. 1106.9108,9109.8
111.1111.4109.2109.5108.4108.1
1 Not available.2 Preliminary.
NOTE.—Revised index. For description of the revision, see The Monthly Labor Review, February 1952.
Source: Department of Labor.
161
Digitized for FRASER http://fraser.stlouisfed.org/ Federal Reserve Bank of St. Louis

TABLE B-22.—Consumers' price index, 1929-52
For moderate-income families in large cities
[1935-39=100]
Period
Monthly average:1929
1930 . - _ -193119321933 _ -1934
1935 _ - -19361937 -19381939
19401941194219431944
19451946 . _ - .194719481949 _ . .
1950 . - -1951__.
1951: First half .Second half
1952* First half 1
1951* January 15February 15March 15April 15May 15June 15July 15August 15.- ._ _ . . .Septarnhp.r 1 5October 15November 15December 15
1952' January 15February 15 _ ._March 15April 15 .May 15June 15
Allitems
122 5
119.4108.797.692.495.7
98.199.1
102.7100.899.4
100.2105.2116 6123.7125.7
128.6139.5159. 6171 9170.2
171 9185.6
184.2187 1
188 5
181 5183.8184.5184 6185.4185.2185 5185. 5186 6187.4188.6189.1
189 1187.9188.0188.7189.0
(2)
Food
132.5
126.0103.986.584.193.7
100.4101.3105.397.895.2
96.6105.5123.9138.0136.1
139.1159.6193.8210 2201.9
204.5227.4
225.7229 1
230 0
221 9226.0226.2225.7227.4226.9227 7227.0227.3229.2231.4232.2
232 4227.5227.6230.0230.8
3 231 6
Apparel
115.3
112.7102.690.887.996.1
96.897.6
102.8102.2100.5
101.7106.3124.2129.7138.8
145.9160.2185. 8198 0190.1
187.7204.5
202.5206.5
203 5
198 5202.0203.1203 6204.0204.0203 3203.6209 0208.9207.6206.8
204 6204.3203.5202.7202.3
(2)
Rent
141.4
137.5130.3116.9100.794.4
94.296.4
100.9104.1104.3
104.6106.4108 8108.7109.1
109.5110.1113.6121.2126.4
131.0136.2
134.7137.8
140.5
133.2134.0134.7135 1135.4135.7136 2136.8137 5138.2138.9139.2
139 7140.2140.5140.8141.3(2)
Fuel,elec-
tricity,and re-friger-ation
112.5
111.4108.9103.4100.0101.4
100.7100.2100.299.999.0
99.7102.2105.4107.7109.8
110.3112.4121.1133.9137.5
140.6144.1
143.8144.5
145.1
143.3143.9144.2144.0143.6143.6144 0144.2144 4144.6144 8144.9
145 0145.3145.3145 3144.6(2)
House-furnish-
ings
111.7
108.998.085.484.292.8
94.896.3
104.3103.3101.3
100.5107.3122 2125 6136.4
145.8159.2184.4195 8189.0
190.2210.9
210.8211.0
207 4
207.4209.7210.7211 8212.6212.5212 4210.8211 1210.4210 8210.2
209 1208.6207. 6206 2205.4(2)
Miscel-laneous
104 6
105.1104.1101 798.497.9
98.198.7
101.0101.5100.7
101 1104.0110 9115 8121.3
124 1128 8139.9149 9154 6
156.5165.4
164.0166 8
170 6
162 1163. 2164.3164 6165.0164.8165 0165.4166 0166.6168 4169.1
169 6170.2170.7171 1171.4(2)
* Averages of data through May, except for food.2 Not available,aEstimated.Source: Department of Labor.
l62
Digitized for FRASER http://fraser.stlouisfed.org/ Federal Reserve Bank of St. Louis

TABLE B--23.---Indexes ojprices received and prices paidjby farmers, and parity ratio, 7929-52
[1910-14=100]
Period
Monthly average:1929
19301931193219331934
19351936193719381939
19401941194219431944
19451946194719481949
19501951
1951: First halfSecond half _ _ _
1952: First half—-._
1951: January 15February 15.-.March 15April 15May 15June 15July 15August 15September 15..October 15November 15..December 15..
1952: January 15February 15___March 15April 15May 15June 15
Pricesreceived
by farmers
148
12587657090
1091141229795
100123158
21922196
22062234
275285249
256302
296
292
300313311309305301294292291296301305
300289288290293292
Parity index(prices paid,
interest,taxes, and
wage rates)
160
151130112109120
124124131124122
124132151170182
189207239259250
255281
279283
272276280283282282282282282283284284
287288288289289
Parityratio J
92
8367586475
9293
8193
105113108
109113115110100
100107
110105
101
110113111109108107104104103105106107
105100100100101
3 102
1 Ratio of prices received by farmers to parity index.2 Includes wartime subsidy payments paid on beef cattle, sheep, lambs, milk, and butterfat between
October 1943 and June 1946.3 Estimates based on incomplete data.Source: Department of Agriculture.
163
Digitized for FRASER http://fraser.stlouisfed.org/ Federal Reserve Bank of St. Louis

TABLE B-24.—Indexes of wholesale prices and cost of living in the United States and foreigncountries, selected dates since June 1950
[June 1950=100]
Country
United States
Africa and Near East:Algeria . . _Egypt-, .IranIraqIsrael ^ .LebanonMoroccoTunisia. _ .Union of South Africa _
Western European countries:Austria _ .BelgiumDenmarkFrance.. _ __Germany (Federal Republic) _GreeceIreland _ItalyNetherlandsNorway _ _ _PortugalSpain _ _Sweden.. .SwitzerlandTurkeyUnited Kingdom
Latin America:Argentina,.Brazil .Chile - ._Costa RicaCuba __Dominican Republic .. ...El SalvadorGuatemalaMexico.-NicaraguaParaguayPeruVenezuela-.. _ ..
Pacific and Far East:Australia _India_.IndochinaJapanNew Zealand ._PhilippinesThailand
Other:CanadaFinland _ _
Wholesale prices
Decem-ber 1951
113
132114123118131135141129125
163131135147128134'124|116127132115139143116115129
(4)13114794
(4)111109103132144
^106
132109126155122108114
113155
Latestdata
111
0)115122117175127143
0)127
163125131142127133123113125132115136144113115128
(%14993
«L109104133139161126108
13693
129153126104115
110145
Date
June 1952
COMarch 1952April 1952March 1952March 1952April 1952February 1952
(J)April 1952
May 1952March 1952April 1952April 1952March 1952April 1952March 195April 1952March 1952May 1952April 1952March 1952March 1952April 1952April 1952May 1952
(4)April 1952February 1952February 1952
(4)April 1952January 1952April 1952April 1952March 1952June 1951February 1952March 1952
March 1952May 1952March 1952April 1952February 1952May 1952February 1952
March 1952May 1952
Cost of living
Deceni-er 1951
111
127113109117120114127123111
150114
2117134113121
3111113110122101111123108102114
165111137108112112
(4)103122
2 140•120
115100
C133106126131
•118108107
115121
Latestdata
111
C1)112117118149114132127114
14911311713811512411211311112598
110125107104118
0)121
0)106115111
(4)10612713921311599
136111134134119106107
113122
Date
May 1952
0)March 1952April 1952March 1952March 1952April 1952March 1952February 1952April 1952
April 1952April 1952April 1952February 1952May 1952April 1952February 1952March 1952February 1952March 1952April 1952March 1952March 1952April 1952March 1952May 1952
March 1952C1)
February 1952March 1952April 1952
(4)April 1952February 1952March 1952March 1952.February 1952March 1952
First quarter 1952April 1952March 1952January 1952.First quarter 1952April 1952December 1951
May 1952April 1952
CData not available after December 1951.2 January 1952.»November 1951.4 Not available.• July 1951.* Fourth quarter 1951.NOTE.—The components of the indexes are not always the same for each country.Source: International Monetary Fund.
164
Digitized for FRASER http://fraser.stlouisfed.org/ Federal Reserve Bank of St. Louis

TABLE B-25.—Consumer credit outstanding, 1929-52
[Millions of dollars]
End of period
1929
19301931193219331934 .
19351936193719381939
19401941194219431944 . .
194519461947 ..-19481949
19501951
1951: JanuaryFebruaryMarchAprilMayJuneJuly .AugustSeptemberOctober-NovemberDecember..
1952: JanuaryFebruaryMarchApril ._MayJune 3_,
Totalconsume
creditout-
standing
6,252
5,5704,6363,4933,4393,846
4,7735,9336,5136,1287,031
8,1638,8265,6924,6004,976
5,62718, 677*
11, 862114,366'16, 809J
20, 09720, 644
19, 93719, 53319, 37919, 12619, 20719, 25619, 13219, 26219, 36219, 58519, 98920,644
20, 12619, 71719, 56019, 78420, 25820,700
Instalment credit
Totalinstal-mentcredit
3,158
2,6882,2041,5181,5881,860
2,6223,5183,9603,5954,424
5,4175,8873, 0482,0012,061
2, 3644,000;6,4348,600
10, 890
13, 45913, 510
13, 25213, 07312, 97612,90412, 92012, 95512,90313, 04513, 16713, 19613, 27113, 510
13, 31413, 18513, 15613, 32013, 76714,100
Sale credit
Total
2,515
2,0321,595
9991,1221,317
1,8052,4362,7522,3132,792
3,4503,7441,617
882891
9421,6483,0864,5286,240
7,9047,546
7,6947,5217,3687,2707,2487,2347,1737,2477,3277,3557,4007,546
7,3227,1587,0477,1097,3937,600
Auto-mobile
salecredit
1,318
928637322459576
9401,2891,384
9701,267
1,7291,942
482175200
227544
1,1511,9613.144
4,1264,039
4,0563,9903,9463,9343,9804,0414,0614,1384,1754,1344,1004,039
3,9623,9273,8913,9544,1474,300
Othersale
credit
1,197
1,104958677663741
8651,1471,3681,3431,525
1,7211,8021,135
707691
7151,1041,9352,5673,096
3,7783,507
3,6383,5313,4223,3363,2683,1933,1123,1093,1523,2213,3003,507
3,3603,2313,1563,1553,2463,300
Loans '
643
656609519466543
8171,0821,2081,2821,632
1,9672,1431,4311, 1191,170
1,4222,3523,3484,0724,650
5,5555,964
5,5585,5525,6085,6345,6725,7215,7305,7985,8405,8415,8716,964
5,9926,0276,1096,2116,3746,500
Chargeaccounts
1,749
1,6111,3811,1141,0811,203
1,2921,4191,4591,4871,544
1,6501,7641, 5131,4981,758
1,9813,0543,6123,8543,909
4,2394,587
4,2484,0103,9383,7443,7933,8043,7433,7243,6963,8684,1904,587
4,2533,9673,8553,9133,9254,000
Otherconsumer
credit 2
1,345
1,2711,051
861770783
859996
1,0941,0461,063
1,0961,1751,1311,1011,157
1,2821,6231, 8161,9122,010
2,3992,547
2,4372,4502,4652,4782,4942,4972,4862,4932,4992,5212,5282,547
2,5592,5652,5492,5512,5662,600
1 Includes repair and modernization loans insured by Federal Housing Administration.8 Includes loans by pawnbrokers, service credit, and unclassified single-payment loans under $3,000 madeby commercial banks.3 Estimates based on incomplete data; by Council of Economic Advisers.
NOTE.—Detail will not necessarily add to totals because of rounding.Source: Board of Governors of the Federal Keserve System (except as noted).
165
Digitized for FRASER http://fraser.stlouisfed.org/ Federal Reserve Bank of St. Louis

TABLE B—26.—Loans and investments of all commercial banks, 1929-52 x
[Billions of dollars]
End of period 2
1929— June 5_
1930— Junes1931— June 5
1932— June s
1933— June « . _ _1934 — June s
19351936193719381939 , .
1940 . . .1941194219431944
1945 . .1946 .1947194S1949 . . .
19501951 ..
1951: January _.FebruaryMarchAprilMayJuneJulyAugust _ . __SeptemberOctoberNovemberDecember .
1952: JanuaryFebruaryMarchAprilMayJune7 --.
Totalloansand
invest-ments
49.4
48.944.936.130.432.7
36.139.638.438.740.7
43.950.767.485.1
105. 5
124.0114.0116.3114.3120.2
126.7132.6
125.1125.0125.7125.4125.1126.0126.1127.0128.6130.5131.9132.6
132.8132.2132.5132.3133.1134.8
Loans
Total 3
35.7
34.529.221.816.315.7
15.216.417.216.417.2
18.821.719.219.121.6
26.131.138.142.543.0
52.257.7
52.753.554.454.454.554.854.655.256.056.857.357.7
57.557.657.858.258.559.4
Commercialand indus-trial loans 4
(6)
(6)
{?(8)C5)
(6)(6)(6)
5.76.4
7.39.37.97.98.0
9.614.218.218.917.1
21.925.9
22.323.123.723.6
• 23.523.723.423.924.525.025.325.9
25.625.625.825.224.925.2
Investments
Total
13.7
14.415.714.314.017.0
20.923.121.222.323.4
25.129.048.266.083.9
97.982.978.271.877.2
74.474.9
72.471.571.371.070.671.271.571.872.673.774.674.9
75.374.674.774.174.575.4
If. S. Gov-ernment
obligations
4.9
5.06.06.27.5
10.3
13.815.314.215.116.3
17.821.841.459.877.6
90.674.869.262.667.0
62.061.5
60.059.158.858.558.158.558.759.159.760.961.661.5
62.061.361.160.460.761.5
Othersecurities
8.7
9.49.78.16.56.7
7.17.97.07.27. 1
7.47.26.86.16.3
7.38.19.09.2
10.2
12.413.3
12.412.412.612.612.512.712.812.712.912.913.013.3
13.313.413.613.713.813.9
* Excludes mutual savings banks.3 June and December figures are for call dates,
month.Other monthly data are for the last Wednesday of the
3 Data are shown net. Includes commercial and industrial loans, agricultural loans, loans on securities,real estate loans, loans to banks, and "other loans," some of which represent consumer credit.
* Beginning with 1948, data are shown gross, i. e., before deduction of valuation reserves, instead of net asfor previous years. Prior to June 1947 and for months other than June and December, data are estimated onthe basis of reported data for all insured commercial banks and for weekly reporting member banks.
5 June data are used because complete end-of-year data are not available prior to 1935 for U. S. Govern-ment obligations and other securities,
aNot available.* Estimates based on incomplete data; by Council of Economic Advisers.
NOTE.—Detail will not necessarily add to totals because of rounding.
Source: Board of Governors of the];Federal Reserve System (except as noted).
166
Digitized for FRASER http://fraser.stlouisfed.org/ Federal Reserve Bank of St. Louis

TABLE B-27.—Deposits and currency, 1929-52
[Millions of dollars]
End of period 1
1929
193019311932 . . . . . . .1933—1934
19351936193719381939...
1940- _ .194119421943 .1944
19451946 _ .1947 _19481949. . . . .
19501951...
1951: JanuaryFebruaryMarchAprilMay^JuneJulyAugustSeptember .OctoberNovember ._December... ..
1952: JanuaryFebruaryMarchAprilMay_ _ _ _ _ _June 6
Totaldeposits
andcurrency
54,742
53,57248, 37945, 37042, 55148, 106
52,72657, 59556, 78159, 87864, 733
71, 12979,098
100, 500123, 391151, 428
176, 378167, 500172, 330172, 693173,851
180, 574189,846
178, 800178, 900179, 900179, 800179, 100181, 333180, 800181,600183, 800185, 800187, 100189, 846
188, 200188, 000188, 700188, 700189, 300191, 300
U. S.Govern-
mentdeposits 2
187
324518516
1,0191,836
1,4531,235
9661,8121,480
1,1212,7629,201
11, 00321, 203
25, 5853,4962,3223,5744,070
3,6573,862
3,6004,7007,4006,5005,4006,6495,0004,6005, 9004,2004,4003,862
3,0004,6005,8004,9004,9006,000
Total excluding U. S. Government deposits(privately-held money supply) 3
Total
54, 555
53,24847, 86144, 85441, 53246, 270
51, 27356, 36055, 81558,06663, 253
70,00876, 33691, 299
112, 388130, 225
150,793164, 004170, 008169, 119169, 781
176, 917185,984
175, 200174, 200172, 500173, 300173, 700174, 684175, 800177, 000177,900181, 600182, 700185, 984
185, 200183, 400182, 900183, 800184, 400185, 300
Currencyoutsidebanks
3,557
3,6054,4704,6694,7824,655
4,9175,5165,6385,7756,401
7,3259,615
13, 94618, 83723, 505
26, 49026,73026, 47626, 07925, 415
25, 39826, 303
24, 60024,60024, 40024,60024,90025, 77625, 10025, 30025, 40025, 70025, 80026, 303
25, 60025,60025, 70025, 90026, 00026, 100
Demanddeposits
adjusted *
22, 809
20, 96717, 41215, 72815, 03518, 459
22, 11525, 48323, 95925,98629, 793
34,94538, 99248, 92260, 80366,930
75, 85183, 31487, 12185, 52085, 750
92, 27298, 234
91, 60090, 60089,00089, 50089, 50088,96090, 70091, 40092, 00095,00096, 30098, 234
97, 90095, 70094, 80095, 10095, 30095, 800
Timedeposits 5
28, 189
28, 67625, 97924, 45721,71523, 156
24, 24125, 36126, 21826, 30527, 059
27, 73827, 72928, 43132, 74839, 790
48, 45253, 96056, 41157, 52058, 616
59, 24761, 447
59, 00059, 00059, 10059, 20059, 30059, 94860, 10060, 40060, 50060, 90060, 60061, 447
61, 70062, 00062, 50062, 80063, 00063, 300
1 June and December figures are for call dates. Other monthly data are for the last Wednesday of themonth.
2 Includes U. S. Government deposits at Federal Reserve banks and commercial and savings banks, and,beginning with 1938, includes U. S. Treasurer's time deposits, open account.
3 Includes deposits and currency held by State and local governments.4 Includes demand deposits, other than interbank and U. S. Government, less cash items in process of
collection.s Includes deposits in commercial banks, mutual savings banks, and Postal Savings System, but excludes
interbank deposits.6 Estimates based on incomplete data; by Council of Economic Advisers.NOTE.—Detail will not necessarily add to totals because of rounding.Source: Board of Governors of the Federal Reserve System (except as noted).
167
Digitized for FRASER http://fraser.stlouisfed.org/ Federal Reserve Bank of St. Louis

TABLE B-28.—Estimated ownership of Federal obligations, 1939-52
[Billions of dollars—par values i]
End of period
1939
1940194119421943 . _ -1944
194519461947 .-19481949
19501951
1951' JanuaryFebruaryMarch _AprilMay _- _ _ _JuneJulyAugustSeptemberOctober _ _NovemberDecember
1952: JanuaryFebruaryMarch -AprilMay 'June 7
Gross public debt and guaranteed issues 3
Total
47.6
50. Q64.3
112.5170.1232.1
278.7259.5257.0252.9257.2
256.7259.5
256.1256.0255.0254.7255.1255.3255.7256.7257.4258. 3259.6259.5
259.8260.4258.1258. 3200. 0259.2
Held byU. S.
Govern-ment
invest-ment
accounts
6.5
7.69.5
12.216.921.7
27.030.934.437.339.4
39.242.3
39.639.739.839.940.341.041.041.542.042.042.242.3
42.742.943.043.243.744.4
Held by others
Totalheld byothers
41.1
43.354.7
100.2153.2210.5
251.6228.6222.6215.5217.8
217.5217.2
216.6216.2215.2214.9214.8214.3214.6215.2215.4216.4217.4217.2
217.1217.5215.1215.1216.2214.8
Stateand localgovern-ments 3
0.4
,5.7
1.02.14.3
6.56.37.37.98.1
8.89.5
8.99.09.19.29.39.49.49.59.49.59.59.5
9.79.79.89.99.9
10.0
Com-mercialbanks *
15.9
17.321.441.159.977.7
90.874.568.762.566.8
61.861.6
59.958.957.858.457.858.458.758.859.560.761.461.6
62.161.360.260.561.161.7
FederalReservebanks
2.5
2.22.36.2
11.518.8
24.323.322.623.318.9
20.823.8
21.521.922.922.722.523.023.123.123.723.623.223.8
22.722.522.522.422.322.9
Nonbankprivatecorpora-tions andassocia-tions 5
12.2
12.816.828.242.056.8
66.260.358.656.758.3
61.258.8
61.762.061.660.661.059.559.660.059.359.159.758.8
58.960.258.758.759.456.7
Indi-viduals 6
10.1
10.613.623.737.652.9
63.964.165.565.165.7
64.963.6
64.664.563.963.964.264.063.863.763.463.563.768.6
63.763.963.963.763.663.5
1 United States savings bonds, series A-D, E, F, and J, are included at current redemption values.2 Excludes guaranteed securities held by the Treasury.3 Includes trust, sinking, and investment funds of State and local governments and their agencies, and
Territories and possessions.* Includes commercial banks, trust companies, and stock savings banks in the United States and in Terri-
tories and possessions; excludes securities held in trust departments.«Includes insurance companies, mutual savings banks, savings and loan associations, nonprofit institu-
tions, corporate pension trust funds, dealers and brokers, and investments of foreign balances and inter-national accounts in this country. Beginning with December 1946, the foreign accounts include invest-ments by the International Bank for Reconstruction and Development and the International MonetaryFund in special noninterest-bearing notes issued by the U. S. Government. Beginning with June 30,1947,includes holdings of Federal land banks.
«Includes partnerships and personal trust accounts.* Estimates based on incomplete data; by Council of Economic Advisers.
NOTE.—Detail will not necessarily add to totals because of rounding.Source: Treasury Department (except as noted).
168
Digitized for FRASER http://fraser.stlouisfed.org/ Federal Reserve Bank of St. Louis

TABLE B-29.—U. S. Government debt—volume and kind of obligations, 1929-52
[Billions of dollars]
End of period
1929
19301931193219331934
19351936 _.193719381939 _
19401941 _194219431944
1945 _194619471948 . _1949
19501951 ___
1951: January _FebruaryMarch _ _ _AprilMayJuneJulyAugust _ -_ _ _SeptemberOctoberNovemberDecember
1952: January _ _ .FebruaryMarchAprilMayJune
Grosspublic
debt andguar-
anteedissues *
16.3
16.017.820.824.031.5
35.139.141.944.447.6
50.964.3
112.5170.1232.1
278. 7259.5257. 0252.9257. 2
256.7259.5
256.1256. 0255.0254.7255.1255 3255.7256. 7257. 4258. 3259. 6259.5
259.8260. 4258.1258. 3260.0259. 2
Interest-bearing public debt
Marketable publicissues
Short-term
issues 2
3.3
2.92.85.97.5
11.1
14.212.512.59.87.7
7.58.0
27.047.169.9
78.257.147.745.950.2
58.365.6
57.457.457.457.457.458.960.360.861.963. 564.565.6
65. 665.664.464.865.664.6
Treasurybonds
11.3
11.313.513.414.715.4
14.319.520.524.026.9
28.033.449.367.991.6
120.4119.3117.9111.4104.8
94.076.9
94.094.094.080.580.578.878.878,878.178.178.176.9
76.976.976.876.876.875.7
Nonmarketable public issues
UnitedStates
savingsbonds
0.2.5
1.01.42.2
3.26.1
15.027.440.4
48.249.852.155.156.7
58.057.6
58.057.857.857.757.657.657.557.557.557.557.657.6
57.757.757.757.657.657.7
Treasurytax andsavingsnotes
2.56.48.69.8
8.25.75.44.67.6
8.67.5
8.78.78.38.18.27.87.98.07.87.77.77.5
7.58.06.97.17.56.6
Invest-ment
bonds 3
1.01.01.0
1.013.0
1.01.01.0
14.514.514.513.513.513.513.013.013.0
13.013.013.012.512.514.0
Specialissues *
0.6
.8
.4
.4
.4
.6
.7
.62.23.24.2
5.47.09.0
12.716.3
20.024.629.031.733.9
33.735.9
34.033.933.533.634.034.734.735.135.635.635.93 5 9
36.236. 436.536.737,237.7
1 Total includes non-interest-bearing debt, fully guaranteed securities (except those held by the Treasury),Postal Savings bonds, prewar bonds, adjusted service bonds, depositary bonds, and Armed Forces Leavebonds, not shown separately.
2 Includes bills, certificates of indebtedness, and notes.3 Includes Series A bonds and beginning in April 1951 Series B convertible bonds.* Issued to U. S. Government investment accounts. These accounts also held 6.6 billion dollars of public
marketable and nomnarketable issues on June 30, 1952.
Source: Treasury Department.
Digitized for FRASER http://fraser.stlouisfed.org/ Federal Reserve Bank of St. Louis

TABLE B-30.—Bond yields and interest rales, 1929-52
[Percent per annum]
Period
1929
19301931193219331934
19351936 --193719381939
1940 ?_ .19411942.1943 _1944
19451946194719481949
1950 _ _ _ -1951
1951: First halfSecond half
1952: First half
1951: First quarterSecond quarter . -Third quarterFourth quarter. .
1952: First quarterSecond quarter..
U. S. Governmentsecurity yields
3-monthTreasury
bills i
(4)
(4)1.402.879.515.256
.137
.143
.447
.053
.023
.014
.103
.326
.373
.375
.375
.375
.5941.0401.102
1.2181.552
1.4661.638
1.659
1.4001.5321.6281.649
1.6401.678
9-12monthissues 2
(•)
(5)(5)(5)(5)(5)
(5)(5)(5)(5)(5)
(5)(5)(5)
.75
.79
.81
.82
.881.141.14
1.261.73
1.731.72
1.69
1.621.841.721.73
1.711.67
Taxablebonds 3
(6)
(6)(6)(6)(6)(6)
(8)(6)(6)(6)(6)
(6)(6)2.462.472.48
2.372.192.252.442.31
2.322.57
2.522.62
2.66
2.422.612.592.68
2.722.61
CorporateAaa
bonds(Moody's)
4.73
4.554.585.014.494.00
3.603.243.263.193.01
2.842.772.832.732.72
2.622.532.612.822.66
2.622.86
2.802.92
2.94
2.702.902.892.95
2.962.93
Average ofrates
charged bybanks on
short-termloans— se-
lected cities
(7)
(7)
8(7)(7)
(7)(7)(7)(7)
2.1
2.12.02.22.62.4
2.22.12.12.52.7
2.73.1
3.043.16
3.48
3.023.073.063.27
3.453.51
Primecom-
mercialpaper
4-6months
5.85
3.592.642.731.731.02
.76
.75
.94
.81
.59
.56
.54
.66
.69
.73
.75
.811.031. 441.48
1.452.17
2.082.26
2.35
1.962.202.252.26
2.382.32
Bankersaccep-tances,90 days
5.03
2.481.571.28.63.25
.13
.16
.43
.44
.44
.44
.44
.44
.44
.44
.44
.61
.871.111.12
1.151.60
1.571.64
1.75
1.511.631.631.65
1.751.75
FederalReserveBank
discountrate
5.16
3.042.112.822.561.54
1.501.501.331.001.00
1.001.00
81.008 1.008 1.00
81.0081.00
1.001.341.50
1.591.75
1.751.75
1.75
1.751.751.751.75
1.751.75
1 Rate on new issues within period. Issues were tax-exempt prior to March 1,1941, and fully taxable there -after. Series includes issues with maturities of more than 3 months in period, 1934-37.
2 Includes certificates of indebtedness and selected note and bond issues.315 years and over prior to April 1952; 12 years and over beginning in April 1952.* Treasury bills were first issued in December 1929 and were issued irregularly in 1930.' Not available before August 1942.6 Bonds in this classification were first issued in March 1941.7 Not available on same basis as for 1939 on.8 From October 30, 1942, to April 24, 1946, a preferential rate of 0.50 percent was in effect for advances se-
cured by Government securities maturing or callable in 1 year or less.
NOTE.—Yields and rates computed for New York City, except for average of rates charged on short-termloans.
Sources: Treasury Department, Moody's Investors Service, and Board of Governors of the FederalReserve System.
170
Digitized for FRASER http://fraser.stlouisfed.org/ Federal Reserve Bank of St. Louis

TABLE B--31.—Government cash receipts from and payments to the public, calendar years, 1943—52
[Billions of dollars]
Calendar year
1943 . _ _1944 _ .
1945- -1946.... __ . .194719481949
1950.1951
1951: January- June. _.July-December _
1952: January- June 3_.
Cashreceipts
47.457.9
59.853.057.560.057.9
60.879.2
42.536.7
52.2
Total
Cashpay-
ments
96.1102.0
93.951.051.052.360.2
61.378.4
35.642.8
46.3
Excess ofreceipts(+)orpay-
ments (—)
-48.7-44.0
—34.1+2.0+6.5+7.7-2.3
—.5+.8
+6.9-6.1
+5.9
Cashreceipts
37.948.1
49.441.444.344.941.3
42.459.3
32.526.8
41.2
Federa
Cashpay-
ments
89.094.8
86.141.438.636.942.6
42.058.0
25.732.3
35.6
1
Excess ofreceipts(+)orpay-
ments (—)
-51.1—46.7
-36.7(2)+5.7+8.0-1.2
+.4+1.2
+6.8-5.6
+5.7
St
Cashreceipts
9.69.8
10.311.613.215.116.6
18.219.9
10.09.9
10.9
State and local 1
Cashpay-
ments
7.17.2
7.89.6
12.415.417.6
19.420.3
10.4
10.7
Excess ofreceipts(+)orpay-
ments (—)
+2.5+2.6
+2.6+1.9+.8-.3
-1.0
-1.2-.4
+.1
+.2
1 Based on the national income and product statistics of the Department of Commerce, adjusted to acash basis.
2 Less than 50 million dollars.3 Estimates based on incomplete data; by Council of Economic Advisers.
NOTE.—Detail will not necessarily add to totals because of rounding.
Sources: Treasury Department (except as noted).
171
Digitized for FRASER http://fraser.stlouisfed.org/ Federal Reserve Bank of St. Louis

TABLE B-32.—Profits before and after tax, all private corporations., 1929-52
[Billions of dollars]
Period
1929
1930 _ . . .1931 .19321933 .1934
19351930193719381939 _
19401941194219431944
19451946194719481949 ..
1950 -1951
1951: First half - .Second half
1952: First half 3. _
1951: First quarter .Second quarterThird quarterFourth quarter
1952' First quarter 3
Second quarter 3
Corporateprofitsbefore
tax
9.8
3.3-.8
-3.0.2
1.7
3.25.76.23.36.5
9.317.221.125.124.3
19.723.530.533.827.1
39.642.9
Corporatetax
liability l
1.4
.8
.5
.4
.5
.7
1.01.41.51.01.5
2.97.8
11.714.413.5
11.29.6
11.913.010.8
18.424.2
Corporate profits after tax
Total
8.4
2.5-1.3-3.4
4.i!o2.34.34.72.35,0
6.49.49.4
10.610.8
8.513.918.520.716.3
21.218.7
Dividendpayments
5.8
5.54.12.62.12.6
2.94.64.73.23.8
4.04.54.34.54.7
4.75.86.67.27.5
9.09.0
Undis-tributedprofits
2.6
-3.0-5.4-6.0-2,4-1.6
-.6-.3
(2)Q
l.*2
2.44.95.16.26.1
3.88.1
12.013.58.8
12.39.6
Seasonally adjusted annual rates
46.739.0
41.2
50.143.338.639. 5
42.040.5
26.422.0
23.8
28.424.521.822.2
24.223.3
20.217.1
17.5
21.718.816.917.3
17.817.2
8.89.2
9.2
8.69.09.29.3
8.99.6
11.47.8
8.2
13.19.87.78.0
8.97.6
1 Federal and State corporate income and excess profits taxes.2 Minus 8 million dollars.8 Estimates based on incomplete data; by Council of Economic Advisers.NOTE.—No allowance has been made for inventory valuation adjustment. See appendix table B-6 for
profits before tax and inventory valuation adjustment. The figures beginning with 1949 are based on therevised series of national income and product of the Department of Commerce, For detail, see the Surveyof Current Business, July 1952.
Detail will not necessarily add to totals because of rounding.Source: Department of Commerce (except as noted).
172
Digitized for FRASER http://fraser.stlouisfed.org/ Federal Reserve Bank of St. Louis

TABLE B—33.—Sales and profits of large manufacturing corporations, 1939—52
[Millions of dollars]
Period
1939
19401941194219431944
194519461947-19481949
19501951
1951: First half 2Second half 2 _
1951: First quarter 2Second quarter 2
Third quarter 2
Fourth quarter 2
1952: First quarter 3
Durable goods industries(106 corporations)!
Sales
6,743
8,74612, 80215, 37120, 64122,090
18, 16212, 37619, 48423, 56623, 885
29, 34133, 696
Profits
Before taxes
733
1,2272,1762,3302,3912,192
1,290608
2,3113,1053,191
5,1925,374
After taxes
597
830982783755726
574295
1,3541,8351,887
2,5422,000
Nondurable goods industries(94 corporations) 1
Sales
3, 878.
4,2955,5406,4707.671^331
8,4388,997
11, 38513, 44112, 853
14, 77717, 371
Profits
Before taxes
478
622989
1,0791,3021,346
1,1391,4301,7932,2121,847
2,7023,184
After taxes
402
446541441509532
558911
1,1701.477i;213
1,5131,411
Totals for period not adjusted for seasonal variation
17, 12116, 575
8,3628,7598,0038,572
8,443
2,7872,587
1,3821,4051,1911,396
1,234
1,007993
510497428565
445
8,6378,735
4,3494,2884,2944,441
4,355
1,6691,514
855814773741
709
710702
368342334368
312
* See Federal Reserve Bulletin for similar data for the following industry groups: Primary metals andproducts, machinery, automobiles and equipment, foods and kindred products, chemicals and alliedproducts, and petroleum refining.
2 Certain tax accruals for the first 6 months of 1950 and 1951, required by subsequent increases in Federalincome tax rates and charged by many companies against third quarter profits, have been redistributed tothe first and second quarters. Available information does not permit a similar redistribution of accrualscharged against fourth quarter 1950 profits to cover 1950 liability for excess profits taxes.
3 Estimates based on incomplete data.
NOTE.—Detail will not necessarily add to totals because of rounding.
Source: Compiled by the Board of Governors of the Federal Reserve System and based on publishedreports of various industrial corporations.
Digitized for FRASER http://fraser.stlouisfed.org/ Federal Reserve Bank of St. Louis

TABLE B—34.—Relation of profits before and after taxes to stockholders' equity', private manu-facturing corporations, by industry group, 1947—49 average and 1950-51
Industry group
All private manufacturing corporations-
FoodTobacco manufactures _ .Textile-mill products . _ _Apparel and finished textilesLumber and wood products
Furniture and fixturesPaper and allied productsPrinting and publishing (except newspapers) _Chemicals and allied productsPetroleum refining
Products of petroleum and coal (except petro-leum refining)
Rubber productsLeather and leather products _. _Stone, clay, and glass products _ .Primary nonferrous metal industries
Primary iron and steel industriesFabricated metal products. . .Machinery (except electrical) _Electrical machineryTransportation equipment (except motor
vehicles)
Motor vehicles and partsInstruments; photographic and optical goods;
watches and clocksMiscellaneous manufacturing (including
ordnance)
Ratio of profits (annual rate) to stockholders equity
1947-49average 1950
1951
Total Firstquarter
Secondquarter
Thirdquarter
Fourthquarter
Before Federal taxes
23.2
23.619.624.821.626.0
23.626.023.624.0
i 20.4
(2)19.617.622.818.4
20.024.424.026.8
10.4
34.4
22.0
19.2
28.0
22.421.222.818.029.6
27.228.420.032.4
i 19.2
(2)30.819.233.225.6
28.429.226.041.6
18.8
53.2
30.8
22.8
27.9
18.321.517.412.125.1
25.535.723.132.322.1
27.536.713.832.128.1
32.731.031.937.5
22.6
40.0
31.0
24.9
32.8
20.820.429.622.034.0
34.444.021.640.823.2
26.043.222.436.432.0
34.837.634.847.2
19.6
46.0
33.6
34.8
30.4
18.420.423.211.231.6
28.842.826.832.423.0
34.041.217.639.232.8
35.633.634.834.4
25.2
44.0
33.6
26.0
25.5
18.922.511.811.520.6
22.232.625.431.222.8
27.531.316.933.224.2
29.727.228.128.6
18.3
34.0
30.0
17.3
25.8
17.023.79.16.4
16.4
17.427.522.228.022.8
24.535.81.0
23.826.8
32.126.132.743.3
29.4
37.6
31.7
21.8
All private manufacturing corporations
FoodTobacco manufacturesTextile-mill productsApparel and finished textiles.Lumber and wood products..
Furniture and fixturesPaper and allied productsPrinting and publishing (except newspapers).Chemicals and allied productsPetroleum refining
Products of petroleum and coal (except petro-leum refining)
Rubber productsLeather and leather products.Stone, clay, and glass productsPrimary nonferrous metal industries
Primary iron and steel industriesFabricated metal products. __Machinery (except electrical)Electrical machineryTransportation equipment (except motor
vehicles)
Motor vehicles and. partsInstruments; photographic and optical j;oods;
watches and clocks .1Miscellaneous manufacturing (including
ordnance)
After Federal taxes
14.4
14.012.014.812.416.8
14.016.014.414.8
115.2
(2)11.210.414.011.6
12.014.814.416.0
6.0
19.6
13.6
11.2
15.6
12.411.612.810.017.6
15.216.411.618.0
114.0
(2)16.810.817.615.2
14.416.014.020.8
10.0
25.2
16.8
12.4
12.2
8.79.48.05.3
13.2
10.614.110.512.914.7
11.514.55.3
13.213.3
11.813.212.714.1
9. 7
14.3
12.2
11.1
14.8
10.09.6
14.411.617.2
16.018.410.017.214.5
11.418.810.816.016.0
13.617.615.218.4
9. 2
17.2
14.4
16.4
13.6
9.210.X)10.84.4
16.0
11.617.613.614.015.1
14.015.67.2
16.814.8
13.614.414.814.0
11. 6
17.2
14.0
10.0
10.4
8.89.24.84.8
10.6
9.812.412.410.714.6
10.812.26.5
12.010.4
8.511.210.48.6
8.0
10.6
10.4
6.7
11.2
7.69.44.11.89.9
5.19.97.8
11.316.4
10.813.1
-2.010.413.9
11.710.211.316.9
11.2
13.1
12.1
10.4
1 Petroleum refining and products of petroleum and coal combined.* Not available.Sources: Federal Trade Commission and Securities and Exchange Commission.
174
Digitized for FRASER http://fraser.stlouisfed.org/ Federal Reserve Bank of St. Louis

TABLE B-35.—Relation of profits before and after taxes to sales, private manufacturing corpora-tions, by industry group, 1947-49 average and 1950—51
Industry group
All private manufacturing corporations_
FoodTobacco manufacturesTextile-mill productsApparel and finished textiles .Lumber and wood products
Furniture and fixturesPaper and allied productsPa.per and allied productsPrinting and publishing (except newspapers) _Chemicals and allied products _Petroleum refining
Products of petroleum and coal (except petro-leum refining)
Rubber products _ _Leather and leather productsStone, clay, and glass productsPrimary nonferrous metal industries. .
Primary iron and steel industries .. ..Fabricated metal products ..Machinery (except electrical)Electrical machineryTransportation equipment (except motor
vehicles)
Motor vehicles and partsInstruments; photographic and optical goods;
watches and clocks _Miscellaneous manufacturing (including
ordnance) .
All private manufacturing corporations .
FoodTobacco manufacturesTextile-mill productsApparel and finished textilesLumber and wood products _ ._.
Furniture and fixturesPaper and allied productsPrinting and publishing (except newspapers).Chemicals arid allied productsPetroleum refining
Products of petroleum and coal (except petro-leum refining). _ . _._
Rubber productsLeather and leather productsStone, clay, and glass productsPrimary nonferrous metal industries
Primary iron and steel industriesFabricated metal productsMachinery (except electrical)Electrical machinery _. .Transportation equipment (except motor
vehicles).. _
Motor vehicles and partsInstruments; photographic and optical goods;
watches and clocksMiscellaneous manufacturing (including
ordnance)--
Profits in cents per dollar of sales
1947-49average 1950
1951
Total Firstquarter
Secondquarter
Thirdquarter
Fourthquarter
Before Federal taxes
10.5
6.17.8
11.65.6
14.4
8.414.0
8.613.8
114.7
(?.75.7
13.713.4
11.510.86.59.9
5.5
12.2
12.2
8.9
12.8
6.19.0
10.55.0
15.9
9.015.4
7.918.8
114.9
(2)10.66.5
18.817.3
15.512.413.314.3
8.9
17.5
15.9
10.4
12.2
4.98.88.33.3
13.9
8.717.7
9.018.116.9
11.211.64.7
18.217.5
15.912.614,113.2
7.8
13.5
15.0
10.9
13.5
5.49.1
11.95.4
17.7
10.519.8
8.320.916.7
11.313.06.9
19.718.2
16.514.515.015.1
7.9
14.0
16.0
13.8
12.8
4.98.3
10.23.2
16.1
9.419.6
9.917.517.3
13.012.25.9
20.119.3
16.613.114.512.2
8.2
13.8
15.6
11.3
11.5
4.98.96.03.0
11.5
8.916.8
9.618.017.2
10.610.05.7
18.616.2
14.911.613.111.1
6.7
12.4
14.8
8.6
11.0
4.39.04.41.79.8
5.914.2
8.115.916.4
9.911.1
.314.216.3
15.510.913.614.1
8.0
13.5
13.7
9.3
After Federal taxes
6.5
3.64.86.93.39.2
4.98.65.28.6
Ul.l
(»)4.33.38.48.3
6.96.63.96.0
3.2
7.0
7.5
5.2
7.1
3.44.95.82.89.4
5.18.84.5
10.3110.7
(«)5.83.7
10.110.2
7.96.87.37.2
4.7
8.3
8.6
5.6
5.4
2.33.93.81.47.3
3.67.04.17.2
11.2
4.74.61.87.58.3
5.75.35.65.0
3.3
4.8
5.9
4.9
6.1
2.64.35.72.89.1
4.98.33.98.8
10.5
5.05.73.38.59.0
6.46.76.65.9
3.7
5.2
6.9
6.6
5.8
2.54.14.71.38.2
3.87.95.07.4
11.4
5.34.72.48.58.7
6.45.66.25.0
3.7
5.4
6.4
4.9
4.7
2.33.62.41.35.9
3.96.44.76.2
11.0
4.23.92.26.87.0
4.34.84.83.3
2.9
3.8
5.2
3.3
4.8
1.93.62.0.5
5.9
1.75.12.86.4
11.8
4.44.0-.76.28.5
5.74.34.75.5
3.1
4.7
5.2
4.5
1 Petroleum refining and products of petroleum and coal combined.2 Not available.Sources: Federal Trade Commission and Securities and Exchange Commission.
209722—52 13 I 75
Digitized for FRASER http://fraser.stlouisfed.org/ Federal Reserve Bank of St. Louis

TABLE B-36.—Relation of profits before and after taxes to stockholders' equity and to sales, allprivate manufacturing corporations, by asset size class, 1947-49 average and 1950-51
Asset size class (thousands of dollars)
All asset sizes .
tinder 250250 to 9991,000 to 4,999 .5 000 to 99 999100,000 and over . - .
All asset sizes. _ .- -
Under 250250 to 999 . .I,000to4,9995,000 to 99,999100,000 and over - - -
All asset "sizes
Under 250250 to 9991,000 to 4,9995,000 to 99,999100,000 and over
All asset sizes -
Under 250250 to 999 .1,000 to 4,9995,000 to 99,999100,000 and over
1947-49average 1950
1951
Total Firstquarter
Secondquarter
Thirdquarter
Fourthquarter
Ratio of profits before Federal taxes (annual rate) to stock-holders' equity
23.2
16.822.423.624.022.4
28.0
17.223.625.227.629.6
27.9
17.223.525.628.228.8
32.8
23.628.833.234.432.0
30.4
22.428.030.432.030.0
25.6
17.421.322.625.426.8
25.8
5.414.818.625.728.9
Profits before Federal taxes in cents per dollar of sales
10.5
4.57.28.8
10.812.2
12.8
4.37.99.6
12.515.5
12 2
4.07.38.9
12.014.6
13.5
5.48.8
10.913.815.4
12.8
5.28.5
10.112.914.8
11.5
4.27.08.2
11.014.0
11.0
1.34.76.3
10.614.3
Ratio of profits after Federal taxes (annual rate) to stock-holders' equity
14.4
9.612.814.014.814.4
15.6
10.413.214.015.216.4
12.2
8.910.410.811.813.0
14.8
14.414.815.615.214.4
13.6
13.613.213.214.014.0
10.4
9.19.78.8
10.011.0
11.2
-1.43.66.3
10.413.8
Profits after Federal taxes in cents per dollar of sales
6.5
2.64.25.26.67.8
7.1
2.64.45.26.98.6
5.4
2.13.23.75.06.6
6.1
3.34.5.5.26.07.0
5.8
3.24.04.45.66.8
4.7
2.23.23.24.35.8
4.8
-0.31.12.14.36.9
^Sources: Federal Trade Commission and Securities and Exchange Commission.
175
Digitized for FRASER http://fraser.stlouisfed.org/ Federal Reserve Bank of St. Louis

TABLE B-37.—Sources and uses of corporate funds, 1946-52l
[Billions of dollars]
Source or use of funds
Uses:Plant and equipment outlaysInventories (change in book value) _ _Change in customer net receivables 4-Cash and U. S. Government secu-
ritiesOther current assets . .
Total uses
Sources:Internal:
Retained profits and depletionallowances
Depreciation allowances
Total internal sources
External:Change in Federal income tax
liabilityOther current liabilities.Change in bank loans and mort-
gage loans _ _ „ .Net new issues
Total external sources
Total sources
Discrepancy (uses less sources)
1946
12.411.2
.8
-4.7—.7
19.0
7.64.3
11.9
-1.62.1
4.32.3
7.1
19.0
,0
1947
16.27.13.0
1.2— . 1
27.4
11.65.2
16.8
2.31.0
3.24.4
10.9
27.7
—.3
1948
18.04.22.9
1.0(*)
26.1
12.86.2
19.0
.8
.3
1.75.9
8.7
27.7
—1.6
1949
16.1-3.6
2.1
3.4o
17.8
8.07.2
15.2
-2.3.3
-1.24.9
1.7
16.9
.9
1950
16.68.04.0
4.7.3
33.6
11.67.8
19.4
7.41.5
3.33.7
15.9
35.3
-1.7
Total
21.610.2
.2
2.3.4
34.7
9.08.8
17.8
5.6.8
5.06.4
17.8
35.6
-.9
1951
Firsthalf 2
9.58.3.2
.1
.3
18.4
5.64.2
9.8
1.9.4
2.73.3
8.3
18.1
.3
Secondhalf 2
12.11.9
(5)
2.2.1
16.3
3.44.6
8.0
3.7.4
2.33.1
9.5
17.5
-1.2
1952,first
half 2 3
10.5.5.5
-3.0.5
9.0
4.05.0
9.0
-4.5.5
.04.0
.0
9.0
.0
1 Excludes banks and insurance companies.2 Not adjusted for seasonal variation.3 Estimates based on incomplete data; by Council of Economic Advisers.* Receivables are net of payables which therefore are not shown separately.5 Less than 50 million dollars.
Source: Department of Commerce based on Securities and Exchange Commission and other financialdata (except as noted).
177
Digitized for FRASER http://fraser.stlouisfed.org/ Federal Reserve Bank of St. Louis

TABLE B-38.—International transactions of the United States, 1949-52
[Millions of dollars]
Type of transaction
Exports of goods and serv-ices:
Recorded goodsOther goods 2 - -_
Total goodsServicesIncome on invest-
ments
Total exports
Imports of goods and serv-ices:
Recorded goodsOther goods 2
Total goods - - - -ServicesIncome on invest-
ments . - - - - - -
Total imports
Surplus of exports of goodsand services:
Recorded goodsOther goods 2 ._.
Total goodsServices _ _Income on invest-
ments
Total surplus ofexports- - -
Means of financing sur-plus of exports of goodsand services:
Liquidation of goldand dollar assets byforeign countriesand by internationalinstitutions
U. S. Governmentsources (net): 3
Grants and otherunilateral trans-fers
Long- and short-term loans
U. S. private sources(net):
RemittancesLong- and short-
term capital
Total means offinancing
Errors and omissions
1949
12, 052285
12, 3372,232
1,405
15, 974
6 622444
7,0662 184
353
9,603
5 430—159
5 27148
1 052
6 371
57
5,321
647
522
609
7,156
-785
1950
10, 275383
10,6582,024
1,743
14, 425
8 852463
9,3152 376
437
12,128
1 423-80
1 343—352
1 306
2,297
—3 629
4,120
164
481
1,317
2,453
-156
Total
15, 020466
15, 4862,741
1,992
20, 219
10, 964704
11,6683 047
398
15, 113
4 056—238
3 818—306
1 594
5 106
—442
4,501
163
412
1,066
5,700
-594
Firstquarter
3 33569
3,404567
396
4,367
3 035179
3,214601
99
3,914
300-110
190—34
297
453
—892
1,031
61
109
237
546
-93
1951
Secondquarter
4,01984
4,103715
467
5, 285
2,981151
3,132705
98
3,935
1,038—67
97110
369
1,350
—149
1,252
80
99
312
1,594
-244
Thirdquarter
3,691158
3,849739
459
5,047
2,496181
2,677904
90
3, 671
1,195-23
1,172-165
369
1,376
294
1,128
34
90
3
1, 549
-173
Fourthquarter
3,976154
4,130720
670
5,520
2,453192
2,645837
111
3,593
1,523-38
1,485-117
559
1,927
305
1,090
-12
114
514
2,011
-84
19
Firstquarter
3,996159
4,155721
418
5,294
2, 776189
2,965850
94
3,909
1,220-30
1,190-129
324
1,385
372
822
133
95
233
1,655
-270
52
Secondquarter l
4,10080
4,180735
485
5,400
2,700200
2,900945
95
3,940
1,400-120
1,280-210
390
1,460
-300
1,170
150
90
350
1,460
1 Estimates based on incomplete data; second quarter by Council of Economic Advisers.2 Includes goods sold to or bought from other countries that have not been shipped from or into the
United States customs area, and other adjustments.3 For detail, see appendix table B-40.
Source: Department of Commerce (except as noted).
178
Digitized for FRASER http://fraser.stlouisfed.org/ Federal Reserve Bank of St. Louis

TABLE B—39.—United States exports and imports of goods and services, by area, 1949-52
[Billions of dollars, annual rates]
Area
Exports of goods and services: 2
OEEG countries 3
OEEC dependencies 3 _ ~Europe, except OEEC
countriesCanada . _ _ _ _Latin- American republics. .Other 5
Total exports
Imports of goods and services: 2
OEEC countries 3
OEEC dependencies 3
Europe, except OEECcountries -
CanadaLatin- American republics- .Other s
Total imports _
Surplus of exports of goods andservices: 2
OEEC countries 3OEEC dependencies 3
Europe, except OEECcountries -
CanadaLatin- American republics. .Other 5
Total surplus of exports..
ADDENDUM
Exports of goods and servicesto sterling area 6
Imports of goods and servicesfrom sterling area ..
Surplus of exports tosterling area 6
1949
5.39.90
.212.593.663.21
15.97
2.22.71
.182.012.941.54
9.60
3.17.19
.03
.58
.721.67
6.37
2.52
1.73
.79
1950
4.43.58
.182.733.922.59
14.42
2.69.89
.232.443.562.32
12.13
1.73-.31
-.04.29.36.27
2.30
1.95
2.27
-.32
1951
Total
6.52.68
.333.485.154.06
20.22
3.521.20
.242.794.123.25
15.11
3.00-.52
.09
.691.03.81
5.11
3.17
2.92
.25
Firstquarter
5.46.52
.303.194.573.44
17.47
3.381.30
.262.474.933.31
15.66
2.08-.78
.04
.72-.36
.13
1.83
2.32
2.96
-.64
Secondquarter
7.04.67
.393.915.074.06
21.14
3.631.20
.262.784.203.66
15. 74
3.41-.53
.131.13.87.40
5.40
2.88
3.44
-.56
Thirdquarter
6.46.76
.313.375.343.96
20.19
3.611.16
.183.003.513.22
14.68
2.85-.40
.13
.371.83.74
5.52
3.20
2.92
.28
Fourthquarter
7.13.76
.343.445.634.78
22.08
3.451.14
.262.903.832.79
14.37
3.6837
.07
.541.801.99
7.71
4.27
2.34
1.94
1952
Firstquarter
6.90.76
.323.345.334.52
21.18
3.541.60
.202.624.323.35
15.64
3.36-.84
.11
.721.011.17
5.54
3.71
2.87
.84
Secondquarter!
88(4)(*)21.60
(*)<<)
(«)(*)(4)(4)
15.76
(4)(«)
(*)(4)(4)(4)
5.84
(*)
(*)
(4)
1 Estimates based on incomplete data; second quarter by Council of Economic Advisers.2 Includes income on investments.3 "OEEC countries" are those which are members of the Organization for European Economic Coopera-
tion. They are the countries which participated in the European Recovery Program prior to its ter-mination.
4 Not available.s Includes international institutions.* In 1950-52, includes "special category" exports sold for cash, but excludes all transactions under the
Mutual Defense Assistance Program.NOTE.—Detail will not necessarily add to totals because of rounding.
Source: Department of Commerce (except as noted).
179
Digitized for FRASER http://fraser.stlouisfed.org/ Federal Reserve Bank of St. Louis

TABLE B-40.—U. S. Government grants, other unilateral transfers, and loans to foreign countries,7949-52
[Millions of dollars]
Type of aid
Unilateral payments:Military aid pro-
grams:Mutual Defense
Assistance andMutual Secu-rity Programs. -.
Greek-Turkishaid
Chinese aidE conomic aid pro-
grams:EGA, Mutual
Defense Assist-ance, and Mu-tual SecurityPrograms
EuropeOther areas. ..
Army CivilianSupply Pro-gram 3_.
Philippine Reha-bilitation Act...
International Ref-ugee Organiza-tion and otherUnited Nationsrelief organiza-tions -. .
Technical assist-ance
Interim aid andPost-UNRRA..
Other transfers
Total unilateralpayments _
Less: Unilateral re-ceipts
Equals: Net uni-lateral payments.
Long-term loans and in-vestments:
European RecoveryProgram
Export-Import Bankloans
Surp lus p rope r tycredits, includingship sales ...
Raw-material creditsto occupied areas-..
United Nations build-ing loan._.
Other
Total long-termloans and invest-ments
Less: Repayments.. .
Equals: Net long-term loans and in-vestments
Short-term loans (net)
Total net unilateralpayments, loansand investments . _
1949
17144
3 8223 730
92
1 082
203
104
30
2127
5 585
264
5,321
428
163
30
26
2012
679205
474
173
5,968
1950
616
625
2,8332,719
114
500
166
84
29
100
4,295
175
4, 120
163
193
2
28
226
414287
127
37
4,284
Total
1,481
82
2,6432,490
153
336
12
39
48
109
4,678
177
4,501
209
222
136
450310
140
23
4,664
Firstuarter
305
2
652628
26
78
5
14
5
23
1,084
53
1,031
39
83
32
12759
68
-7
1,092
1951
Seconduarter
414
22
699679
20
138
4
3
11
24
1,297
45
1,252
25
81
42
11247
65
15
1,332
Thirduarter
428
3
61958039
78
2
4
8
29
1,171
43
1,128
70
30
41
10588
17
17
1,162
Fourthuarter
334
1
67360568
42
1
18
24
33
1,126
36
1,090
75
28
21
106116
— 10
—2
1,078
195
Firstuarter
410
33930534
22
1
19
21
33
845
23
822
80
121
21
20464
140
—7
955
2
Secondquarter 1
(2)
W(Z\
mh)(2)
M
(2)
M
(?)
(2)
(2)
(2)
1,170
(?)
(2)
(2)(2)
(2)
(2)
150
1,320
1 Estimates based on incomplete data; second quarter by Council of Economic Advisers.2 Not available.3 Includes disbursements in Germany administered by EGA from funds appropriated under the Army
Civilian Supply Program.Source: Department of Commerce (except as noted).
180
Digitized for FRASER http://fraser.stlouisfed.org/ Federal Reserve Bank of St. Louis

TABLE B-41.—United States merchandise exports, including reexports, by area, 1936-38 quarterlyaverage and 1947—52
Period
Quarterly average:1936-381947 _ _..19481949_ .195031951 3 - -
1950: First quarter 3...Second quarter 3.Third quarter 3. .Fourth quarter 3_
1951: First quarter 3 _._Second quarter 3_Third quarters..Fourth quarter 3_
1952: First quarter 3.. _Second quarter. .
Quarterly average:1936-3819471948194919503 ___19513
1950: First quarter 3 _ _ _Second quarter 3_Third quarter 3. _Fourth quarter 3_
1951: First quarter 8...Second quarter 3.Third quarter 3_ .Fourth quarter 3_
1952: First quarter 8 _ > _
Total ex-ports in-cluding
reexportsCanada
OtherWesternHemi-sphere
OEEOcoun-tries i
OtherEurope Asia a
Australiaand
OceaniaAfrica
Millions of dollars
7423,8353, 1&33,0132,5693,755
2,3652,5102,4512,949
3,3354,0193,6913,976
3,996« 4, 100
H5528486490499647
389519505583
623756605603
623(5)
1361,017
841725691943
614647706796
866958978969
986(5)
2821,3241,0461,019
698955
724728583756
8131,027
8691,111
1,045«
3111849413469
31333734
64816269
51(s)
122562507534360545
381367332361
469549517644
646(5)
238038493361
32343038
44456888
73(5)
3220519615586
145
788578
102
120155173132
175(*)
Percentage of total
100100100100100100
100100100100
100100100100
100
15.513.815.416.319.417.2
16.420.720.619.8
18.718.816.415.2
15.6
18.326.526.624.126.925.1
26.025.828.827.0
26.023.826.524.4
24.7
38.034.533. 133.827.225.4
30.629.023.825.6
24.425.623.527.9
26.2
4.23.11.51.41.31.8
1.31.31.51.2
1.92.01.71.7
1.3
16.414.716.017.714.014.5
16.114.613.512.2
14.113.714.016.2
16.2
3.12.11.21.61.31.6
1.41.41.21.3
1.31.11.82.2
1.8
4.35.36.25.13.33.9
3.33.43.23.5
3.63.94.73.3
4.4
1 "OEEO countries" are those which are members of the Organization for European Economic Coopera-tion. They are the countries which participated in the European Recovery Program prior to its termina-tion. Turkey is included with OEEC countries and excluded from Asia. Exports from Germany are in-cluded with those of OEEC countries and, in the postwar period, relate almost wholly to exports from thethree western zones.
2 Excludes Turkey, which is included with OEEC countries.3 Data by area exclude, while total exports include, "special category" exports. For this reason, exports
by area will not add to total exports in these periods. "Special category" exports are those of military orpotential military significance, and are not published in this area classification for security reasons. SeeForeign Trade Statistics Notes, January 1952, Bureau of the Census, for further detail.
* Estimate based on incomplete data; by Council of Economic Advisers,s Not available.NOTE.—Data in this table cover all merchandise shipped from the United States customs area to foreign
countries, including, in postwar years, both commercial transactions and goods financed by the UnitedStates through the various aid and relief programs and the Mutual Security Program. Shipments toUnited States armed forces abroad for their own use are excluded.
Detail will not necessarily add to totals because of rounding. See also footnote 3.Source: Department of Commerce (except as noted).
181
Digitized for FRASER http://fraser.stlouisfed.org/ Federal Reserve Bank of St. Louis

TABLE B-42.—Indexes of quantity and unit value of United States domestic merchandise exports,by economic class, 7936-38 quarterly average and 7947-52
[1936-38=100]
Period
Quarterly average:1936-38194719481949 _._19501951
1950* First quarterSecond quarterThird quarterFourth quarter
1951 : First quarterSecond quarterThird quarterFourth quarter
1952: First quarterSecond quarter
Quarterly average:1936-381947 .1948—194919501951.
1950: First quarterSecond quarterThird quarterFourth quarter
1951: First quarter.Second quarterThird quarter . ...Fourth quarter
1952: First quarter .Second quarter
Totaldomesticexports
Crudematerials
Crudefoodstuffs i
Manu-factured
foodstuffs i
Semi-manu-
factures
Finishedmanu-
factures
Quantity indexes
100275214219193247
181194184209
223258243264
2622 267
100123100126128142
125143112128
112126117220
157(3)
100397362435287475
284270264325
4565R3434422
548(3)
100478350297237264
213250224230
242263265266
265(3)
100203144150127153
121126125135
131157165160
162(3)
100332257250225298
207220220251
278319304291
309(3)
Unit value indexes
100188200186180206
177175180191
202210206204
2072208
100195223212220260
206212226245
263275249246
255(3)
100248255225193215
196190192196
203219221219
230(3)
100218223177151189
151142162169
188206194183
178(3)
100169184174170209
164166168184
203212211211
208(3)
100182193184179199
179175177187
195201200200
201(3)
1 Export indexes of crude and manufactured foodstuffs in some periods, particularly those of unit valueduring 1950, are influenced by sales of large quantities of food products at prices considerably below marketquotations. Such exports include sales from Government-owned surplus and shipments on which subsidieswere paid by the Department of Agriculture.
2 Estimates based on incomplete data; by Council of Economic Advisers.a Not available.NOTE.—The indexes of quantity are a measure of the volume of trade after the influence on value of changes
in average prices has been eliminated. The indexes of unit value provide a measure of change in the aver-age prices at which trade transactions are reported in official foreign trade statistics, including change inaverage prices that result from changes in the commodity composition of trade.
Source: Department of Commerce (except as noted).
182
Digitized for FRASER http://fraser.stlouisfed.org/ Federal Reserve Bank of St. Louis

TABLE B-43.—United States general merchandise imports, by areay 1936-38 quarterly average and1947-52
Period
Quarterly average:1936-38 - - .1947.19481949 --19501951
1950: First quarterSecond quarterThird quarterFourth quarter
1951: First quarter-Second quarterThird quarterFourth quarter..
1952: First quarter _Second quarter
Quarterly average:1936-3819471948 _194919501951 .. . _ _.
1950: First quarterSecond quarter .Third quarterFourth quarter
1951: First quarterSecond quarter _Third quarterFourth quarter
1952: First quarter
Totalgeneralimports
CanadaOther
WesternHemi-sphere
OEECcoun-tries i
OtherEurope Asia 2
Australiaand
OceaniaAfrica
Millions of dollars
6221,4391,7811,6562,2132,741
1,8891,9312,3882,645
3, 0352,9812,4962,453
2, 7763 2, 700
88282398388490569
404478504575
529585553608
560(4)
143568627611776887
727645913818
1,086894737833
943(«)
152174244211315478
240243323455
514515457426
454(4)
304549354752
45454950
63574046
45(4)
183249324296409495
302363417555
592544482364
502(4)
1039413152
113
49524760
8318412064
60(4)
17829884
123147
122103136132
169201106113
213(4)
Percentage of total
100100100100100100
100100100100
100100100100
100
14.119.622.323.422.120.8
21.424.821.121.7
17.419.622.224.8
20.2
23.039.535.236.935.132.4
38.533.438. 230.9
35.830.029.534.0
34.0
24.412.113.712.714.217.4
12.712.613.517.2
16.917.218. 317.4
16.4
4.83.12.82.12.11.9
2.42.32.11.9
2.11.91.61.9
1.6
29.417.318.217.918.518.1
16.018.817.521.0
19.518.319.314.8
18.1
1.62.72.31.92.34.1
2.62.72.02.3
2.76.24.82.6
2.2
2.75.75.55.15.65.4
6.55.35.75.0
5.66.74.34.6
7.7
1 " OEEC countries" are those which are members of the Organization for European Economic Coopera-tion. They are the countries which participated in the European Recovery Program prior to its termination. Turkey is included with OEEC countries and excluded from Asia. Imports from Germany areincluded with those of OEEC countries and, in the postwar period, relate almost wholly to imports from thethree western zones.
2 Excludes Turkey, which is included with OEEC countries.s Estimate based on incomplete data; by Council of Economic Advisers.* Not available.
NOTE.—Data in this table cover all merchandise received in the United States customs area from foreigncountries. General imports include merchandise entered immediately upon arrival into merchandisingchannels, plus entries into bonded customs warehouses.
Detail will not necessarily add to totals because of rounding.
Source: Department of Commerce (except as noted).
183
Digitized for FRASER http://fraser.stlouisfed.org/ Federal Reserve Bank of St. Louis

TABLE B-44.—Indexes of quantity and unit value of United States merchandise imports for con-sumption, by economic class, 1936-38 quarterly average and 1947-52
[1936-38=100]
Period
Quarterly average:1936-3819471948194919501951
1950: First quarterSecond quarterThird quarter . . _Fourth quarter
1951: First quarterSecond quarter. _ ...Third quarterFourth quarter
1 952: First quarterSecond quarter
Quarterly average:1936-38194719481949 .19501951
1950' First quarterSecond quarterThird quarterFourth quarter
1951: First quarterSecond quarter _Third quarterFourth quarter __ _ _-
1952* First quarterSecond quarter
Totalimports forconsump-
tion
Crudematerials
Crudefoodstuffs
Manufac-tured food-
stuffs
Semimanu-factures
Finishedmanufac-
tures
Quantity indexes
100108123120146144
137136154158
163147131136
151U48
100129139125152142
152140155161
161144137125
1530)
10096
109119113118
12194
125111
14910892
125
137(2)
100839197
117122
98113143113
1271291121111
121(2)
100130149143219200
189213220247
227215182178
191(2)
10084
103101125135
107119125147
141141126131
138(2)
Unit value indexes
100213235224243305
223229248270
295313312299
3001295
100180203195214312
185194215255
302340316288
288(2)
100311343330454512
410433485491
508521516505
508(2)
100208212202203221
199199203210
214224225221
216(2)
100191217198193244
176179197220
234242250249
253(2)
100245266258252296
245248253262
278288313307
303(2)
* Estimates based on incomplete data; by Council of Economic Advisers.*Not available.NOTE.—The indexes of quantity are a measure of the volume of trade after the influence on value of
changes in average prices has been eliminated. The indexes of unit value provide a measure of change inthe average prices at which trade transactions are reported in official foreign trade statistics, includingchanges in average prices that result from changes in the commodity composition of trade.
Source: Department of Commerce (except as noted).
184
Digitized for FRASER http://fraser.stlouisfed.org/ Federal Reserve Bank of St. Louis

TABLE :B-45. Changes in selected economic series since 1939 and 1951
Source:Appen-
dixtableNo.
B-l
B-3
B-6
B-9
B-10
B-ll
B-l 5
B-16
B-17
B-18
B-19
B-21
B-22
Economic series
Gross national productPersonal consumption expendituresGross private domestic investment-Government purchases of goods and
services
Gross national product in 1951 prices .Personal consumption expendituresGross private domestic investment .Government purchases of goods and
services _ _ _ _
National income .Compensation of employees
Personal income — -Disposable personal incomePersonal net saving
Per capita disposable]personal income:Current prices1951 prices
Labor force, including armed forcesCivilian labor force
EmploymentAgriculturalNonagricultural .
Unemployment . . _
Average gross weekly earnings:Manufacturing _
Durable goodsNondurable goods
Building construction
Industrial productionDurable •mannfa.ctnrp'.sN ondur able manufacturesMinerals ,
Agricultural production
New construct! on _ _Private
Residential (nonfarm)N onresidential _Other private
Public. . . .
Business expenditures for plant and equip-ment
Manufacturing _ _
Inventories, end of periodManufacturing _ _ _ _ _ _Wholesale tradeRetail trade
Sales _M anuf actur ing . _Wholesale trade....Retail trade
Consumers' price index: All items _FoodApparel - . _ -Rent. -- _ -_Housefurnishings .
Wholesale price index: All commoditiesFarm productsProcessed foodsOther than farm products and foods
1939=100
1951
Total
361308591
478
183160271
221
383374
350321630
272141
11811413373
14920
272264269270
202250178155131
378494409655602245
447573
350366328327402431407358
187239203131208
229311
(*)199
Firsthalf
355307631
426
181160291
198
375367
343314485
268139
117113132
7014822
270261268261
204251183153
(3)
384514442665596234
413510
346340333366411442413364
185237201129208
231317
(3)201
Secondhalf
366309552
528
185159252
245
390381
357327774
276142
120115135
7715118
274267270278
199250173157
(3)
373474377646608256
480636
350366328327394420398352
188241205132208
227304
(3)198
1952,firsthalf 2
374317495
585
187162221
268
396390
363329626
276141
(3)113132= 6914919
280271275282
198252171153
(3)
402496408643626294
457617
349370311326410447394365
190242202135205
224297
(3)195
Percentagechange *
1951,first
half to1952,firsthalf 2
5.23.2
-21.6
37.5
3.21.2
-24. 0
35.6
5.66.2
5.84.7
29.0
2.91.0
(3)
'.5-1.6
.8-11.4
3.64.12.78.1
-2.7.4
-6.5.0
(3)
4.6-3.6-7.6-3.3
4.925.4
10.520.9
.88.8
-6.6-11.0
-.21.2
-4.6.5
2.31.9.5
4.31 6
-3.3-6.4-2.5-2.9
1951,secondhalf to1952,firsthalf 2
2.22.7
-10.3
10.8
.91.8
-12.3
9.5
1.62.4
1.7.7
-19.1
-.1-1.0
(3)-1.8-2.1-9.9-1.1
8.0
2.01.81.91.6
-.5.7
-1.6-2.4(3)
7.94.78.4-.62.9
14.7
-4.9-3.0
— 2i!i
-5.2-.24.16.3-.93.7
.7
.4-1.5
2.0-1.7
-1.4-2.4-1.8-1.1
See footnotes at end of table.
185
Digitized for FRASER http://fraser.stlouisfed.org/ Federal Reserve Bank of St. Louis

TABLE B-45. Changes in selected economic series since 1939 and 1951—Continued
Source:Appen-
dixtableNo.
B-23
B-25
B-26
B-28
B-32
B-41
B-43
Economic series
Prices received by farmersParity index (prices paid, interest, taxes,
and wage rates)
Consumer credit outstanding - .Instalment credit
Loans and investments of all commercialbanks
Loans _ _ _ _ _ _ _ _ _ _Investments in U. S. Government obli-
gations
Gross public debt and guaranteed issues
Corporate profits:Profits before taxProfits after t a x - _ _ _ _ _ _ _
Dividend pavments ._Undistributed profits
Merchandise exports, including reexports
General merchandise imports _ _ _ _ _ _
1939=100
1951
Total
318
230
294305
326335
377
545
660374237800
<506
4441
Firsthalf
322
229
274293
310319
359
536
718404232950
M96
4484
Secondhalf
312
232
294305
326335
377
545
600342242650
<517
4 398
1952,firsthalf 2
307
236
294319
331345
377
545
634350242683
4546
4440
Percentagechange l
1951,first
half to1952,firsthalf 2
-4.6
3.2
7.58.8
7.08.4
5.1
1.5
-11.8-13.4
4.5-28.1
10.1
-9.0
1951,secondhalf to1952,firsthalf 2
-1.4
1.8
.34.4
1.72.9
.0
-.1
5.62.3.0
5.1
5.6
10.7
1 Changes are computed from data as reported and therefore may differ slightly from changes computedfrom the indexes shown here.
2 Estimates based on incomplete data.3 Not available.41936-38 average=100.
186
Digitized for FRASER http://fraser.stlouisfed.org/ Federal Reserve Bank of St. Louis
Related Documents