ICARUS 73, 279-293 (1988) Equation of State of Ammonia-Water Liquid: Derivation and Planetological Applications1 S. K. CROFT, J. I. LUNINE, AND J. KARGEL Lunar and Planetary Laboratory, University of Arizona, Tucson, Arizona 85721 Received May 4. 1987; revised August 31. 1987 An equation of state for ammonia-water liquid has been calculated by least-squares fit for the following range of parameters: 0 to 100 wt% NHs, 170 to 300”K, and 0 to 10 kh. Measured and calculated liquid densities were used in conjunction with solid density and thermodynamic measurements to estimate the thermal expansion and density at 1 bar for the solid phases of ammonia dihydrate, ammonia monohydrate, and ammonia hemihy- drate between 0°K and their respective melting points. The peritectic ammonia-water liquid near pure ammonia dihydrate in composition was found to have a density of about 0.946 g/cm3 and to be approximately neutrally buoyant relative to the corresponding solid phases. This implies that igneous activity involving ammonia-water liquids on icy satellites mav be both extrusive and intrusive in nature, possibly giving rise to a wide variety of morphologic and tectonic forms. B 1988 Academic Press, Inc. INTRODUCTION The ammonia hydrates are plausible con- stituents of the icy satellites and comets, comprising as much as 10% of the total mass (Lewis 1972). They are of particular interest because the presence of ammonia in water ice lowers the melting point of a peritectic mixture (-33% by mass NHj) to about 175°K (Rollet and Vuillard 1956). This melting temperature is low enough to be reached in the interiors of icy satellites only 500 to 1000 km in radius by radioactive heating alone, possibly accounting for the resurfacing observed on the satellites of Saturn and Uranus in this size range. In addition, the potentially significant mass fraction of ammonia hydrates in the interi- ors of the icy satellites indicates that infor- mation concerning the densities of these compounds at various temperatures and pressures is necessary for construction of accurate models of the satellites’ interiors. Unfortunately, many of the physical prop- ’ Contribution No. 87-13 of the Theoretical Astro- physics Program, University of Arizona. erties of the ammonia hydrates and their associated liquids are poorly determined. We have therefore assembled the data available in the literature and initiated ex- perimental and theoretical studies to derive the desired physical properties as far as is feasible. In this report, we present an equa- tion of state (EOS) for ammonia-water liq- uid to determine liquid density as a function of composition, temperature, and pressure. We then apply our EOS (1) to obtain esti- mates of the densities of the ammonia hy- drate solids at 1 bar as functions of temper- ature and (2) to begin investigation of the dynamics of ammonia-water volcanism on the icy satellites. THE LIQUID NHj-HZ0 EQUATION OF STATE Data. Density measurements over the full range (0.0 to 1.0) of the mass fraction X of NH3 in water solution between tempera- tures of 260 and 300°K were adopted from the international critical tables edited by Gillespie (1928). Density values for pure liquid NH3 between 190 and 290°K were taken from Haar and Gallagher (1978). These data are shown in Fig. 1. Measure- 279 0019-1035188 $3.00 Copyright 0 1988 by Academic Press, Inc. All rights of reproduction in any form reserved.

Welcome message from author
This document is posted to help you gain knowledge. Please leave a comment to let me know what you think about it! Share it to your friends and learn new things together.
Transcript
ICARUS 73, 279-293 (1988)
Equation of State of Ammonia-Water Liquid: Derivation and
Planetological Applications1
S. K. CROFT, J. I. LUNINE, AND J. KARGEL
Lunar and Planetary Laboratory, University of Arizona, Tucson, Arizona 85721
Received May 4. 1987; revised August 31. 1987
An equation of state for ammonia-water liquid has been calculated by least-squares fit for the following range of parameters: 0 to 100 wt% NHs, 170 to 300”K, and 0 to 10 kh. Measured and calculated liquid densities were used in conjunction with solid density and thermodynamic measurements to estimate the thermal expansion and density at 1 bar for the solid phases of ammonia dihydrate, ammonia monohydrate, and ammonia hemihy- drate between 0°K and their respective melting points. The peritectic ammonia-water liquid near pure ammonia dihydrate in composition was found to have a density of about 0.946 g/cm3 and to be approximately neutrally buoyant relative to the corresponding solid phases. This implies that igneous activity involving ammonia-water liquids on icy satellites mav be both extrusive and intrusive in nature, possibly giving rise to a wide variety of morphologic and tectonic forms. B 1988 Academic Press, Inc.
INTRODUCTION
The ammonia hydrates are plausible con- stituents of the icy satellites and comets, comprising as much as 10% of the total mass (Lewis 1972). They are of particular interest because the presence of ammonia in water ice lowers the melting point of a peritectic mixture (-33% by mass NHj) to about 175°K (Rollet and Vuillard 1956). This melting temperature is low enough to be reached in the interiors of icy satellites only 500 to 1000 km in radius by radioactive heating alone, possibly accounting for the resurfacing observed on the satellites of Saturn and Uranus in this size range. In addition, the potentially significant mass fraction of ammonia hydrates in the interi- ors of the icy satellites indicates that infor- mation concerning the densities of these compounds at various temperatures and pressures is necessary for construction of accurate models of the satellites’ interiors. Unfortunately, many of the physical prop-
’ Contribution No. 87-13 of the Theoretical Astro- physics Program, University of Arizona.
erties of the ammonia hydrates and their associated liquids are poorly determined. We have therefore assembled the data available in the literature and initiated ex- perimental and theoretical studies to derive the desired physical properties as far as is feasible. In this report, we present an equa- tion of state (EOS) for ammonia-water liq- uid to determine liquid density as a function of composition, temperature, and pressure. We then apply our EOS (1) to obtain esti- mates of the densities of the ammonia hy- drate solids at 1 bar as functions of temper- ature and (2) to begin investigation of the dynamics of ammonia-water volcanism on the icy satellites.
THE LIQUID NHj-HZ0 EQUATION OF STATE
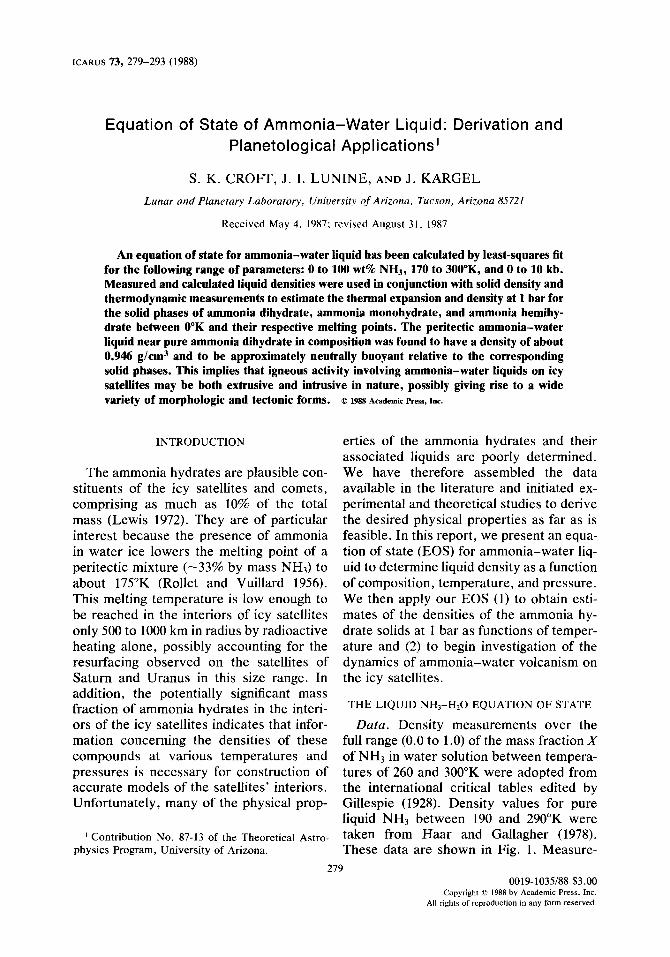
Data. Density measurements over the full range (0.0 to 1.0) of the mass fraction X of NH3 in water solution between tempera- tures of 260 and 300°K were adopted from the international critical tables edited by Gillespie (1928). Density values for pure liquid NH3 between 190 and 290°K were taken from Haar and Gallagher (1978). These data are shown in Fig. 1. Measure-
279 0019-1035188 $3.00
Copyright 0 1988 by Academic Press, Inc.
All rights of reproduction in any form reserved.
+ Haor 8 Gallagher 119781
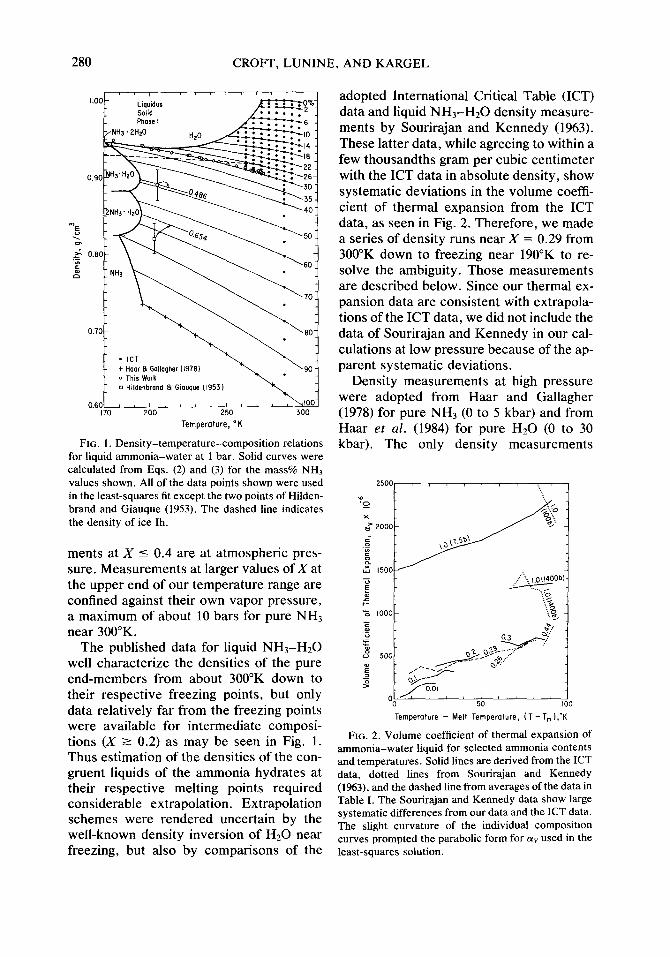
adopted International Critical Table (ICT) data and liquid NH3-HZ0 density measure- ments by Sourirajan and Kennedy (1963). These latter data, while agreeing to within a few thousandths gram per cubic centimeter with the ICT data in absolute density, show systematic deviations in the volume coeffi- cient of thermal expansion from the ICT data, as seen in Fig. 2. Therefore, we made a series of density runs near X = 0.29 from 300°K down to freezing near 190°K to re- solve the ambiguity. Those measurements are described below. Since our thermal ex- pansion data are consistent with extrapola- tions of the ICT data, we did not include the data of Sourirajan and Kennedy in our cal- culations at low pressure because of the ap- parent systematic deviations.
0 Hildenbrond 8 Glouque (19531
250
Temperature, “K
FIG. 1. Density-temperature-composition relations for liquid ammonia-water at 1 bar. Solid curves were calculated from Eqs. (2) and (3) for the mass% NH3 values shown. All of the data points shown were used in the least-squares fit except the two points of Hilden- brand and Giauque (1953). The dashed line indicates the density of ice Ih.
ments at X 5 0.4 are at atmospheric pres- sure. Measurements at larger values of X at the upper end of our temperature range are confined against their own vapor pressure, a maximum of about 10 bars for pure NH3 near 300°K.
Density measurements at high pressure were adopted from Haar and Gallagher (1978) for pure NH3 (0 to 5 kbar) and from Haar et al. (1984) for pure HZ0 (0 to 30 kbar). The only density measurements
2500, , 1 , / , , , ., ,
Temperature - Melt Temperature, (T - T, ),‘K
The published data for liquid NHj-Hz0 well characterize the densities of the pure end-members from about 300°K down to their respective freezing points, but only data relatively far from the freezing points were available for intermediate composi- tions (X 2 0.2) as may be seen in Fig. 1. Thus estimation of the densities of the con- gruent liquids of the ammonia hydrates at their respective melting points required considerable extrapolation. Extrapolation schemes were rendered uncertain by the well-known density inversion of Hz0 near freezing, but also by comparisons of the least-squares solution.
FIG. 2. Volume coefficient of thermal expansion of ammonia-water liquid for selected ammonia contents and temperatures. Solid lines are derived from the ICT data, dotted lines from Sourirajan and Kennedy (1%3), and the dashed line from averages of the data in Table I. The Sourirajan and Kennedy data show large systematic differences from our data and the ICT data. The slight curvature of the individual composition curves prompted the parabolic form for cyy used in the
280 CROFT, LUNINE, AND KARGEL
AMMONIA-WATER LIQUID 281
above ambient pressure at intermediate compositions are those of Sourirajan and Kennedy (1963) (0 to 1.4 kbar). As men- tioned above, Sourirajan and Kennedy’s absolute densities agree within a few 1Oths of a percent with densities from our other data sources. Also, the derived bulk moduli match those derived from the data of Haar and Gallagher (1978) and Haar et al. (1984) for the pure end-members to within a few percent. Thus the data of Sourirajan and Kennedy (1963) are used in the construc- tion of the EOS at high pressure and inter- mediate compositions.
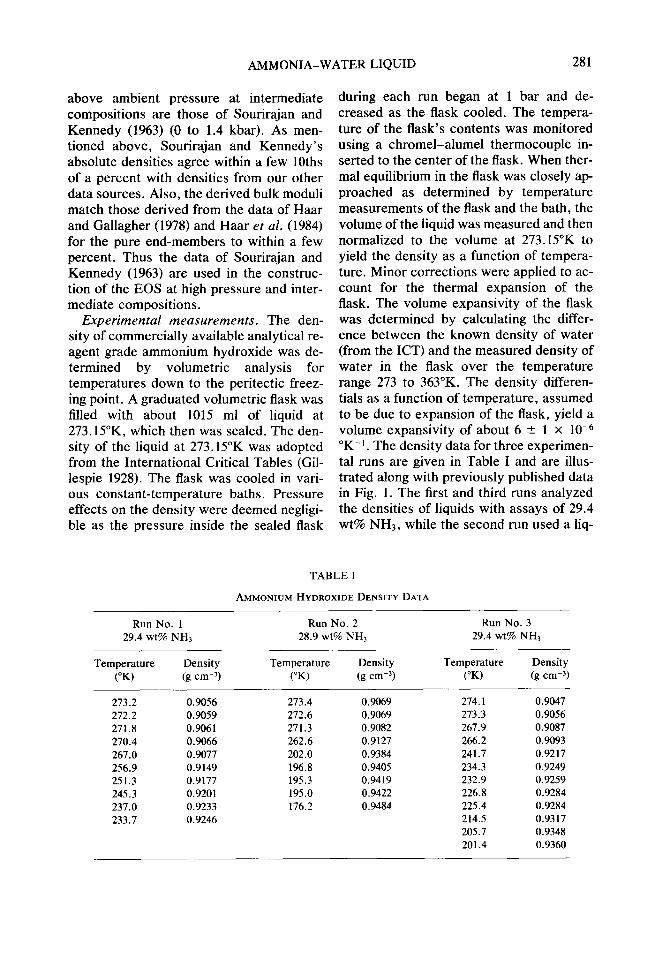
Experimental measurements. The den- sity of commercially available analytical re- agent grade ammonium hydroxide was de- termined by volumetric analysis for temperatures down to the peritectic freez- ing point. A graduated volumetric flask was filled with about 1015 ml of liquid at 273.15”K, which then was sealed. The den- sity of the liquid at 273.15”K was adopted from the International Critical Tables (Gil- lespie 1928). The flask was cooled in vari- ous constant-temperature baths. Pressure effects on the density were deemed negligi- ble as the pressure inside the sealed flask
during each run began at 1 bar and de- creased as the flask cooled. The tempera- ture of the flask’s contents was monitored using a chrome]-alumel thermocouple in- serted to the center of the flask. When ther- mal equilibrium in the flask was closely ap- proached as determined by temperature measurements of the flask and the bath, the volume of the liquid was measured and then normalized to the volume at 273.15”K to yield the density as a function of tempera- ture. Minor corrections were applied to ac- count for the thermal expansion of the flask. The volume expansivity of the flask was determined by calculating the differ- ence between the known density of water (from the ICT) and the measured density of water in the flask over the temperature range 273 to 363°K. The density differen- tials as a function of temperature, assumed to be due to expansion of the flask, yield a volume expansivity of about 6 + 1 x lO-(j “K-i. The density data for three experimen- tal runs are given in Table I and are illus- trated along with previously published data in Fig. 1. The first and third runs analyzed the densities of liquids with assays of 29.4 wt% NH,, while the second run used a liq-
TABLE I
AMMONIUM HYDROXIDE DENSITY DATA
Run No. 1 Run No. 2 29.4 wt% NH, 28.9 wt% NH,
Temperature Density Temperature Density (“W (g cm-? (“W k cm-3)
Run No. 3 29.4 wt% NH,
Temperature Density (“RI (g cm-‘)
273.2 0.9056 272.2 0.9059 271.8 0.9061 270.4 0.9066 267.0 0.9077 256.9 0.9149 251.3 0.9177 245.3 0.9201 237.0 0.9233 233.7 0.9246
273.4 0.9069 272.6 0.9069 271.3 0.9082 262.6 0.9127 202.0 0.9384 196.8 0.9405 195.3 0.9419 195.0 0.9422 176.2 0.9484
274.1 0.9047 273.3 0.9056 267.9 0.9087 266.2 0.9093 241.7 0.9217 234.3 0.9249 232.9 0.9259 226.8 0.9284 225.4 0.9284 214.5 0.9317 205.7 0.9348 201.4 0.9360
282 CROFT, LUNINE, AND KARGEL
uid with 28.9 wt% NH3. The formal uncer- tainty in the densities from all sources is 7 X 10m4 g cm- 3 at the lower temperatures and somewhat less at higher temperatures.
Form of EOS. An equation of state of the following form was adopted:
p = p,(T,) exp[ - 1: (Y” dT}[$$ + l]“K’,
(1)
where p,(T,) is a reference density at an ar- bitrary reference temperature T,, CY~ is the volume coefficient of thermal expansion, KC, and K& are, respectively, the bulk mod- ulus and pressure derivative of the bulk modulus, T is temperature, and P is pres- sure. The portion of Eq. (1) in square brackets is the pressure term in the Murnaghan equation of state (Murnaghan 1944) obtained by integrating the relation K = Ko + K&P. The term in the exponen- tial is simply the integral form of the defini- tion of the volume coefficient of thermal ex- pansion, CQ = -llp(&laT).
RESULTS
Equation of state. The numerical fit to Eq. (1) was done in two nearly independent steps: (1) a fit to p,(T,) and the exponential thermal expansion term using only low- pressure density data and (2) a subsequent fit to the pressure term using bulk moduli derived from the high-pressure density data.
The low-pressure fit was obtained by least-squares (Bevington 1969) using 182 low-pressure points (Fig. 1). The derived expressions are
p(T, X, P = 0) = p,(288.15”K) exp{al(T - 288.15)
+ aJ2 [(T - T,)* - (288.15 - T”J2]
+ ax/3 [(T - T,,J3 - (288.15 - T,,J3, (2a)
where
p,(288.15”K) = 0.9991 - 0.4336X
+ 0.3303X2 + 0.2833X3 - 1.9716X4
+ 2.1396X5 - 0.7294X” (2b)
a, = -1.0 x lO+(-92.88
+ 1371.05x + 185.91X2) (2c)
a2 = -1.0 x lo-y14.51
- 47.50X + 42.35X2) (2d)
a3 = - 1.0 x 10⁻⁶(-0.0764
+ 0.3118X - 0.2465X2), (2e)
and the melting point, T,,,, fit piece-wise to the five sections of the NH3-Hz0 liquidus (data from Rollet and Vuillard 1956, Gilles- pie 1928):
for X 5 0.329, T,,,
= 273.15 - 53.07X - 1651.4X2
+ 11,842X3 - 46,269X4 + 56,695X5 (3a)
0.329 < X I 0.353, T, = 184.7 - 29.17X
(3b)
0.353 < X % 0.572, T,
= 248.07 - 1789.77X + 8585.6X2
- 14479X3 + 8064X4 (3~)
0.572 < X 5 0.803, T,
= -1435.42 + 7867.6X - 14,140X2
+ 1 1,357X3 - 3524X4 (3d)
0.803 < X I 1.0, T,,, = 172.44 - 239.48X
+ 504.3X2 - 241.7X3. (3e)
The liquidus solid phase for each expres- sion is, in order of increasing X: Hz0 (Eq. (3a)), NH3 * 2H20 (Eq. (3b)), NH3 . Hz0 (Eq. (3c)), 2NH3 . H20 (Eq. (3d)), and NH3 (Eq. (3e)). Liquidus liquid phase densities and density isograms for selected composi- tions computed from Eq. (2) are shown in Fig. 1.
The fit to the pressure term in Eq. (1) was obtained by determining expressions for the bulk modulus, KO, and its pressure deriva- tive, K&. Because of the independence of the three data sets utilized, the fit consists of three parts: independent fits to KO and K& for each of the pure end-members and an interpolation formula for intermediate compositions.
The expressions for NH3 were obtained by least-squares fit to 70 density points se-
AMMONIA-WATER LIQUID 283
lected from Haar and Gallagher (1978) in the range of 195 to 400°K in temperature and 0 to 5 kbar in pressure, including the 11 low-pressure points indicated by crosses in Fig. 1. The results are
K. = 48.503 exp(-1.0134
x 10m3 T’.3M7)kbar (4a)
K& = 4.0858 x lOI T-6.6o83 + 4.1831.
(4b)
The expressions for Hz0 were obtained by least-squares fit to 50 density points se- lected from Haar et d. (1984) in the range of 273 to 400°K in temperature and 0 to 10 kbar in pressure, including points equiva- lent to the 6 points for pure H20 at 1 bar in Fig. 1. The results are
K. = -73.184 + 0.5910T
- 9.139 x 1O-4 T2 (4~)
Kb = 39.999 - 0.2058T
+ 3.111 x 1O-4 T2 (4d)
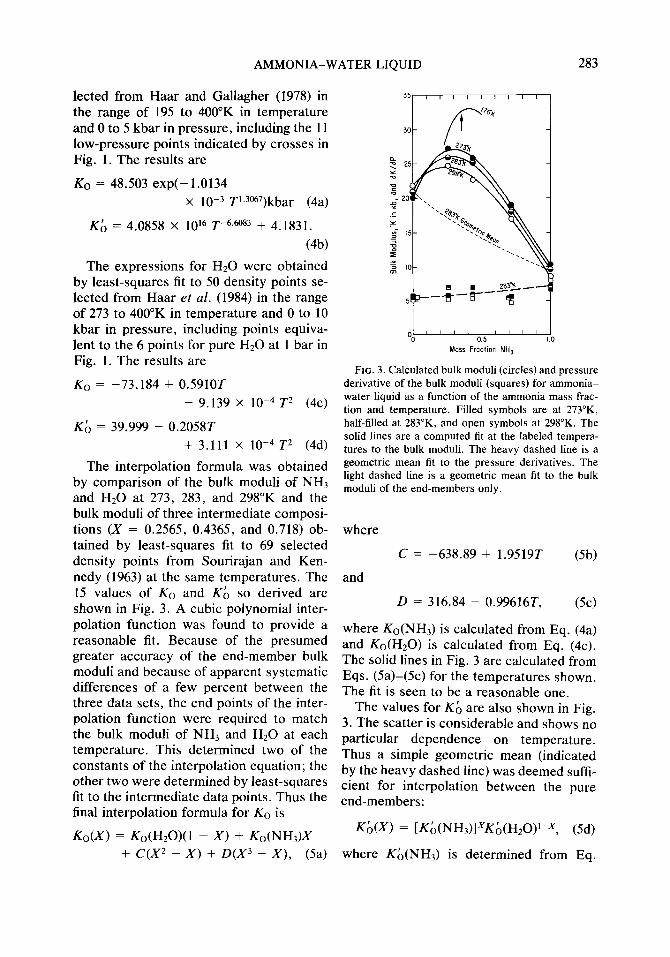
The interpolation formula was obtained by comparison of the bulk moduli of NH3 and H20 at 273, 283, and 298°K and the bulk moduli of three intermediate composi- tions (X = 0.2565, 0.4365, and 0.718) ob- tained by least-squares fit to 69 selected density points from Sourirajan and Ken- nedy (1963) at the same temperatures. The 15 values of KCJ and Kb so derived are shown in Fig. 3. A cubic polynomial inter- polation function was found to provide a reasonable fit. Because of the presumed greater accuracy of the end-member bulk moduli and because of apparent systematic differences of a few percent between the three data sets, the end points of the inter- polation function were required to match the bulk moduli of NH3 and H20 at each temperature. This determined two of the constants of the interpolation equation; the other two were determined by least-squares fit to the intermediate data points. Thus the final interpolation formula for K. is
Ko(X) = Ko(H20)(1 - X) + Ko(NH3)X + C(X2 - X) + D(X3 - X), (5a)
I I! 11 11 1 ” OO
I 0.5 1.0
Mass Froclion NH,
FIG. 3. Calculated bulk moduli (circles) and pressure derivative of the bulk moduli (squares) for ammonia- water liquid as a function of the ammonia mass frac- tion and temperature. Filled symbols are at 273”K, half-tilled at 283”K, and open symbols at 298°K. The solid lines are a computed fit at the labeled tempera- tures to the bulk moduli. The heavy dashed line is a geometric mean fit to the pressure derivatives. The light dashed line is a geometric mean fit to the bulk moduli of the end-members only.
where
C = -638.89 + 1.9519T (5b)
and
D = 316.84 - 0.99616T, (5c)
where Ko(NH3) is calculated from Eq. (4a) and Ko(H20) is calculated from Eq. (4~). The solid lines in Fig. 3 are calculated from Eqs. (Sa)-(5c) for the temperatures shown. The fit is seen to be a reasonable one.
The values for Kb are also shown in Fig. 3. The scatter is considerable and shows no particular dependence on temperature. Thus a simple geometric mean (indicated by the heavy dashed line) was deemed suffi- cient for interpolation between the pure end-members:
K&(X) = [Kb(NH3)1XK6(H20)1-X, (5d)
where Kb(NH3) is determined from Eq.
284 CROFT, LUNINE, AND KARGEL
(4b) and Ko(H,O) is determined from Eq. (4d).
The equation of state of NH3-HZ0 liquid as expressed by Eqs. (2) through (5) is ad- mittedly a complex numerical recipe. The behavior modeled, however, is also com- plex. Our equation of state is comparable in complexity to the equation of state for pure NH3 developed by Mills et al. (1984) and utilizes similar parameterizations. The forms and P, T, or X dependencies of our parameterizations were determined solely by empirical analysis of the data and their peculiarities. A good example of these is the dependency of bulk modulus on com- position and temperature illustrated in Fig. 3. Other parameterizations, such as that of Edwards et al. (1978) for the activity coeffi- cient of ammonia-water liquid, were not used because they could not fit the data. Similarly, the number of significant figures retained in the empirical constants are the same as in the EOS of Mills et al. (1984) and are required for computation to match the accuracy of our data, which are given to four and five significant figures. Empirical parameterizations are used because deriva- tion of the physical behavior of ammonia- water liquid from first principles, e.g., mo- lecular dynamics, is a substantial challenge not within the scope of this paper. Simpler versions of our EOS were tried, including fewer terms in p,(TJ, constant and linear expressions in T for (Ye, and fewer terms in the KO interpolation function, but the fits were markedly inferior to the current form. The liquidus temperature relations were convolved primarily because the inversion of the density curves at the water-rich end of the low-pressure data in Fig. 1 is related to the proximity of freezing. Normalization to the freezing curve yielded the approxi- mate superposition of (Ye for the various compositions seen in Fig. 2, resulting in fairly simple expressions for (Ye. Different convolutions are possible, but would al- most certainly be of comparable complexity to obtain comparable accuracy.
The uncertainties in the densities com-
puted from the EOS vary in different re- gions of P-X-T space. The formal RMS un- certainty in the low-pressure calculation is only 0.0004 g/cm3. Thus the fit is very good in the regions where data exist. The reliabil- ity of the interpolation into the large area in Fig. 1 where virtually no data exist is obvi- ously problematical. The only measure- ments made prior to this report in the mid-range of ammonia content at low tem- peratures are the two points of Hildenbrand and Giauque (1953) shown in Fig. 1. The compositions for these two measurements are stoichiometric ammonia monohydrate and ammonia hemihydrate. The corre- sponding composition density curves calcu- lated from Eqs. (2) and (3) are indicated by the arrows. The monohydrate point is well fit, but the calculated hemihydrate curve falls outside the experimental error bars. Hildenbrand and Giauque stated that their measurements were “rough,” but the dis- crepancy remains. We note, however, the similar slopes of our data near X = 0.29 and that of the pure ammonia curve that bracket the region in question. If the hemihydrate point is correct, then a large negative anom- aly in the thermal expansion must develop for X between 0.3 and 0.6 that then be- comes strongly positive for X above 0.7 to match the observed pure ammonia curve. We deem this unlikely and suggest that the hemihydrate point is in error.
The formal errors in expressions for KO and K& for NH3 and HZ0 are all at the 5% level. The uncertainty in the interpolation for intermediate values of X are seen in Fig. 3 to be near 5% also. For NH3 this trans- lates into a formal rms error of 0.004 g/cm3 for the 70 high-pressure points. Thus where high-pressure data exist, the uncertainties in the densities are near 1%. The validity of extrapolation beyond the range of the data is difficult to assess because the derived equations are empirical interpolation func- tions. For example, the bulk modulus of the dihydrate congruent liquid near its freezing point is of interest. The arc in Fig. 3 labeled 176°K is an extrapolation calculated from
AMMONIA-WATER LIQUID 285
Eqs. 4 and 5. The computed arc is not in- consistent with a visual extrapolation of the existing data. The arrow indicates the dihy- drate composition. The inferred bulk modu- lus of 32 kbar is similar to the measured KO for liquid NH3 at its freezing point of 37 kbar and that for liquid Hz0 of 20 kbar. Thus the extrapolated liquid dihydrate bulk modulus is not unreasonable. However, di- rect measurements should eventually be made.
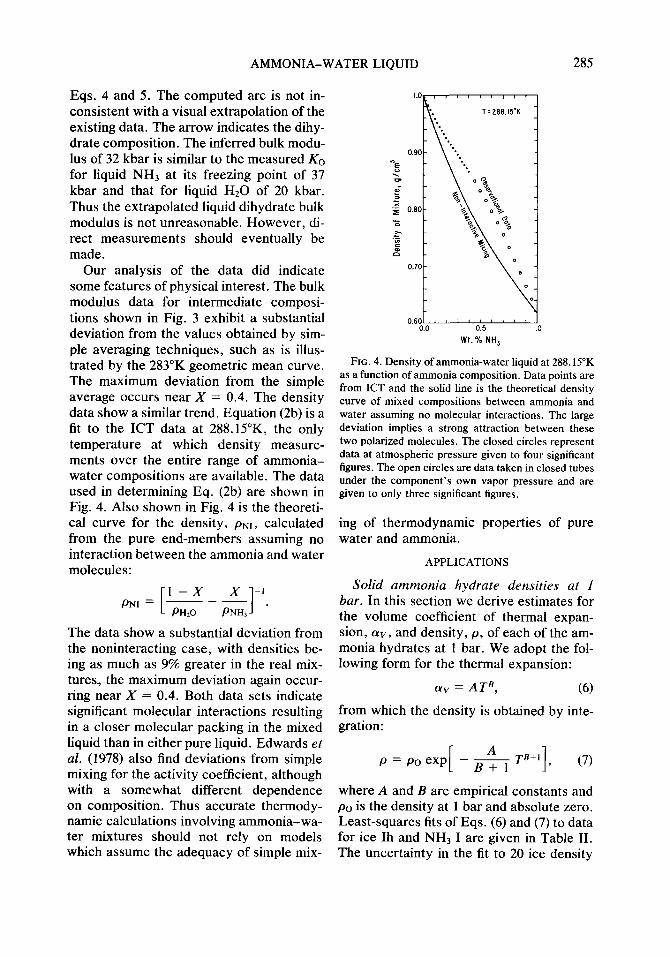
Our analysis of the data did indicate some features of physical interest. The bulk modulus data for intermediate composi- tions shown in Fig. 3 exhibit a substantial deviation from the values obtained by sim- ple averaging techniques, such as is illus- trated by the 283°K geometric mean curve. The maximum deviation from the simple average occurs near X = 0.4. The density data show a similar trend. Equation (2b) is a fit to the ICT data at 288.15”K, the only temperature at which density measure- ments over the entire range of ammonia- water compositions are available. The data used in determining Eq. (2b) are shown in Fig. 4. Also shown in Fig. 4 is the theoreti- Cal curve for the density, PNI, calculated from the pure end-members assuming no interaction between the ammonia and water molecules:
PNI = [ I-X x -1
---
PHlO I PNH, .
The data show a substantial deviation from the noninteracting case, with densities be- ing as much as 9% greater in the real mix- tures, the maximum deviation again occur- ring near X = 0.4. Both data sets indicate significant molecular interactions resulting in a closer molecular packing in the mixed liquid than in either pure liquid. Edwards et al. (1978) also find deviations from simple mixing for the activity coefficient, although with a somewhat different dependence on composition. Thus accurate thermody- namic calculations involving ammonia-wa- ter mixtures should not rely on models which assume the adequacy of simple mix-
FIG. 4. Density of ammonia-water liquid at 288.15”K as a function of ammonia composition. Data points are from ICT and the solid line is the theoretical density curve of mixed compositions between ammonia and water assuming no molecular interactions. The large deviation implies a strong attraction between these two polarized molecules. The closed circles represent data at atmospheric pressure given to four significant figures. The open circles are data taken in closed tubes under the component’s own vapor pressure and are given to only three significant figures.
ing of thermodynamic properties of pure water and ammonia.
APPLICATIONS
Solid ammonia hydrate densities at 1 bar. In this section we derive estimates for the volume coefficient of thermal expan- sion, (Ye, and density, p, of each of the am- monia hydrates at 1 bar. We adopt the fol- lowing form for the thermal expansion:
(Ye = ATB, (6)
from which the density is obtained by inte- gration:
c A P = PO exp -- TB+l 1 B+l ’ (7)
where A and B are empirical constants and po is the density at 1 bar and absolute zero. Least-squares fits of Eqs. (6) and (7) to data for ice Ih and NH3 I are given in Table II. The uncertainty in the fit to 20 ice density
286 CROFT, LUNINE, AND KARGEL
TABLE II
EQUATIONS FOR DENSITY AND THERMAL EXPANSION OF THE NH,-H20 SOLIDS
A. Volume coefficient of thermal expansion: cyv = ATB
Compound A B Notes
Hz0 2.437 x lo+ 1.582 Derived, 20 data points
NH3 . 2H20 2.239 x lo-’ 1.375 Adopted NH3 . Hz0 2.239 x lo-’ 1.375 Derived, 2
data points 2NH, . Hz0 2.239 x lo-’ 1.375 Adopted NH3 0.93235 x 10m6 1.2207 Derived, 25
data points B. Density at 1 bar:
P = PO exp [ - (&) TB+‘] Compound PO A/(B + 1) Bfl
Hz0 0.9338 k 0.0008 9.438 x 1O-9 2.582 NH3 2Hz0 0.9826 2 0.0062 9.427 x 1O-8 2.375 NH3 . Hz0 0.9588 k 0.0031 9.427 x lo-* 2.375 2NHj . Hz0 0.9364 k 0.0100 9.427 x IO-* 2.375 NH3 0.8659 -+ 0.0020 4.198 x lo-’ 2.2207
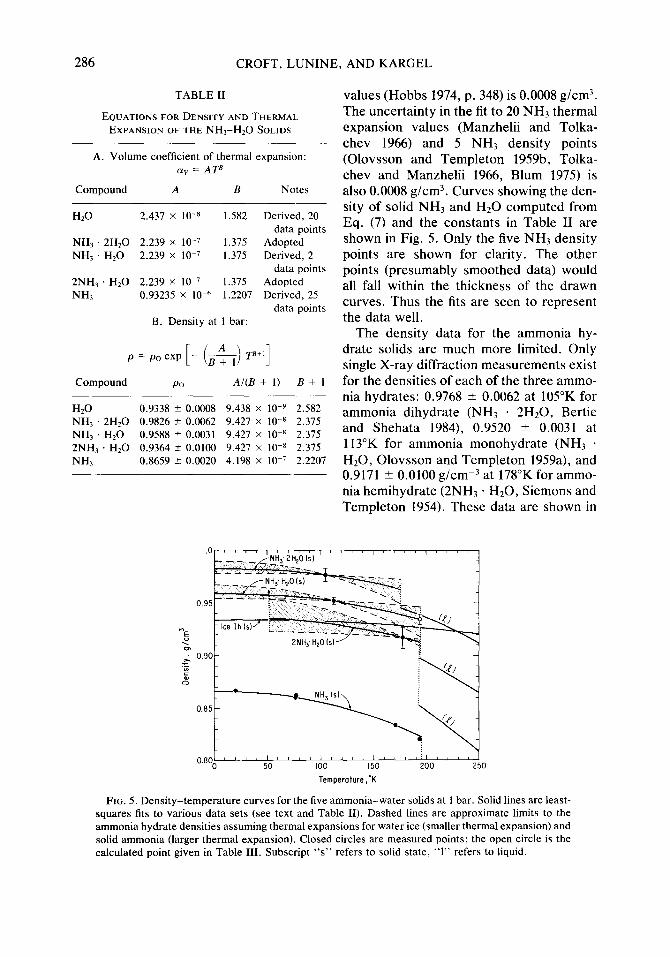
values (Hobbs 1974, p. 348) is 0.0008 g/cm3. The uncertainty in the fit to 20 NH3 thermal expansion values (Manzhelii and Tolka- chev 1966) and 5 NH3 density points (Olovsson and Templeton 1959b, Tolka- chev and Manzhelii 1966, Blum 1975) is also 0.0008 g/cm’. Curves showing the den- sity of solid NH3 and Hz0 computed from Eq. (7) and the constants in Table II are shown in Fig. 5. Only the five NH3 density points are shown for clarity. The other points (presumably smoothed data) would all fall within the thickness of the drawn curves. Thus the fits are seen to represent the data well.
The density data for the ammonia hy- drate solids are much more limited. Only single X-ray diffraction measurements exist for the densities of each of the three ammo- nia hydrates: 0.9768 + 0.0062 at 105°K for ammonia dihydrate (NH3 * 2H20, Bertie and Shehata 1984), 0.9520 + 0.0031 at 113°K for ammonia monohydrate (NH3 . H20, Olovsson and Templeton 1959a), and 0.9171 ? 0.0100 g/cme3 at 178°K for ammo- nia hemihydrate (2NH3 * H20, Siemons and Templeton 1954). These data are shown in
0.801 5 ’ ’ h t ’ h ’ c ‘:I c t ’ 0 50 100 150 200 250 Temperature,'K
FIG. 5. Density-temperature curves for the five ammonia-water solids at 1 bar. Solid lines are least- squares fits to various data sets (see text and Table II). Dashed lines are approximate limits to the ammonia hydrate densities assuming thermal expansions for water ice (smaller thermal expansion) and solid ammonia (larger thermal expansion). Closed circles are measured points; the open circle is the calculated point given in Table III. Subscript “s” refers to solid state, “1” refers to liquid.
AMMONIA-WATER LIQUID 287
TABLE III
AMMONIA-WATER HYDRATE PHASE CHANGE SUMMARY
Compound HzG NH, . 2HZO NH, . Hz0 2NH, Hz0 NH,
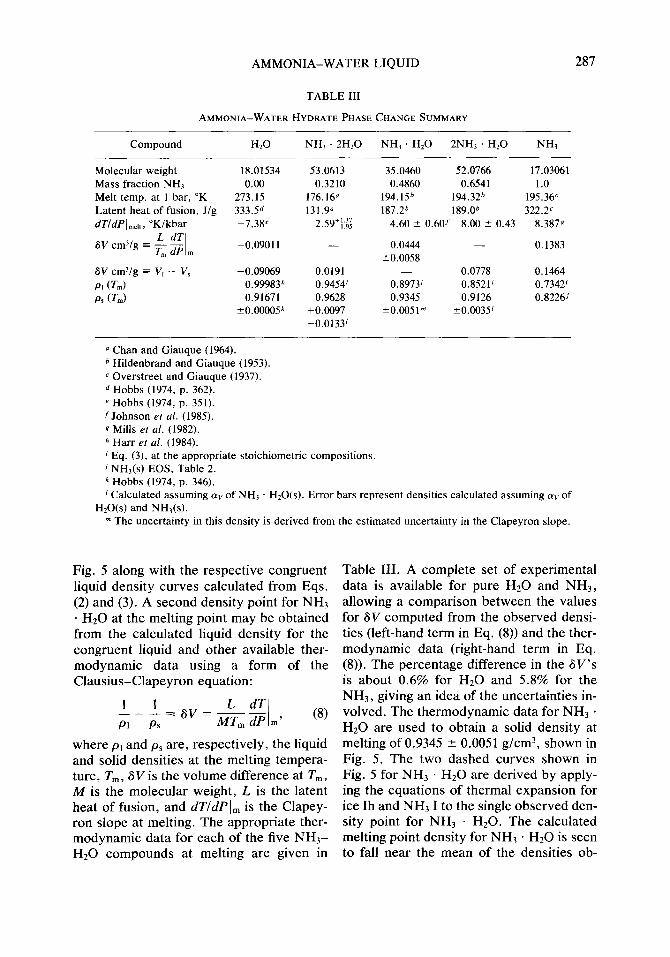
Molecular weight 18.01534 53.0613 35.0460 52.0766 17.03061 Mass fraction NH3 0.00 0.3210 0.4860 0.6541 1.0 Melt temp. at 1 bar, “K 273.15 176.16” 194.15b 194.32* 195.36’ Latent heat of fusion, J/g 333.5d 131.9” 187.2b 189.0b 322.2c dT/dP(,,t,, “Kikbar -7.38’ 2.59’;.;: 4.60 + 0.60/ 8.00 -+ 0.43 8.3879
6V cmy/g = 4 $ -0.09011 - 0.0444 - 0.1383 m m fO.0058
6V cm3/g = V, - V, -0.09069 0.0191 - 0.0778 0.1464 PI (TnJ 0.99983h 0.9454’ 0.8973’ 0.8521’ 0.7342’ ps (Tm) 0.91671 0.9628 0.9345 0.9126 0.8226’
~0.00005~ +0.0097 ?0.0051” +0.0035’ -0.0133’
L1 Chan and Giauque (1964). b Hildenbrand and Giauque (1953). c Overstreet and Giauque (1937). d Hobbs (1974, p. 362). e Hobbs (1974, p. 351). f Johnson et a!. (1985). g Mills et al. (1982). h Hat-r et al. (1984). i Eq. (3), at the appropriate stoichiometric compositions. j NHl(s) EOS, Table 2. k Hobbs (1974, p. 346). ’ Calculated assuming av of NH3 H,O(s). Error bars represent densities calculated assuming oy of
H,O(s) and NH,(s). m The uncertainty in this density is derived from the estimated uncertainty in the Clapeyron slope.
Fig. 5 along with the respective congruent liquid density curves calculated from Eqs. (2) and (3). A second density point for NH3 . Hz0 at the melting point may be obtained from the calculated liquid density for the congruent liquid and other available ther- modynamic data using a form of the Clausius-Clapeyron equation:
1 1 L dT
m - Ps -_ - = 6V = MT, dP m, (8)
where pl and ps are, respectively, the liquid and solid densities at the melting tempera- ture, T,,,, SV is the volume difference at T,, M is the molecular weight, L is the latent heat of fusion, and dTldPI, is the Clapey- ron slope at melting. The appropriate ther- modynamic data for each of the five NHj- Hz0 compounds at melting are given in
Table III. A complete set of experimental data is available for pure Hz0 and NHj, allowing a comparison between the values for 6V computed from the observed densi- ties (left-hand term in Eq. (8)) and the ther- modynamic data (right-hand term in Eq. (8)). The percentage difference in the 6V’s is about 0.6% for Hz0 and 5.8% for the NH3, giving an idea of the uncertainties in- volved. The thermodynamic data for NH3 * Hz0 are used to obtain a solid density at melting of 0.9345 k 0.0051 g/cm3, shown in Fig. 5. The two dashed curves shown in Fig. 5 for NH3 . Hz0 are derived by apply- ing the equations of thermal expansion for ice Ih and NH3 I to the single observed den- sity point for NH3 . HzO. The calculated melting point density for NH3 . Hz0 is seen to fall near the mean of the densities ob-
288 CROFT. LUNINE. AND KARGEL
tained by extrapolation using the HZ0 and NH3 ice thermal expansions. Thus the ther- mal expansion of NH3 * H20, intermediate between that of solid Hz0 and NH,, ap- pears to approximate the behavior of a sim- ple mixture. However, the uncertainty in our calculated value is -30% of the differ- ence between the two dashed curves at melting; thus deviations from simple mixing on the order of the deviation in the density data (Fig. 4) may be found by future direct measurements of ov for NH3 * H20. The two monohydrate density values allow computation of two of the three constants in Eqs. (6) and (7), given the third. Lacking the data for a more precise interpolation, we adopt a geometric mean for the expo- nent B for NH3 . HZ0 in Eq. (6) between the B values for ice Ih and NH3 and derive A and po from the density data. The results are given in Table II, and shown by the solid line in Fig. 5.
A similar procedure cannot be carried out for the dihydrate and monohydrate be- cause their Clapeyron slopes at atmo- spheric pressure have not been directly measured (although a slope for the dihy- drate using high-pressure data has been es- timated; see below). We therefore adopt the thermal expansion derived for NH3 . HZ0 for the other two ammonia hydrates, as indicated in Table II, and derive po for each from the observed densities. The re- sulting density curves are shown in Fig. 5, bracketed in each case by dashed curves representing extrapolations obtained by adopting the ice Ih and NH3 I thermal ex- pansions, which should in each case repre- sent reasonable uncertainty limits. The hemihydrate curve cuts off at 54°K because of a solid-state phase change indicated at that temperature in the heat capacity data of Hildenbrand and Giauque (1953) similar to low-temperature phase changes seen in solid CH4, Nz, and CO. Estimates for the Clapeyron slopes at 1 bar for the dihydrate and hemihydrate may now be obtained by working back from the adopted solid den- sity curves, the calculated liquid density
curves, and the thermodynamic data in Ta- ble III. This we have done, with the results given in Table III. The upper and lower un- certainties in the slopes are derived, re- spectively, from the solid densities calcu- lated from the ice Ih and NH3 I thermal expansions.
We emphasize that the Clapeyron slopes for the dihydrate and hemihydrate in Table III are based entirely on the thermody- namic data in the table and on the solid and liquid densities at atmospheric pressure computed from the equations derived in this report. However, a Clapeyron slope of =lS”K/kbar is derived for the dihydrate from the melting point at one bar and the melting point near 8 kbar inferred by John- son et al. (1985) and Johnson and Nicol (1987). This is substantially larger than the =2”K/kbar determined here. We maintain that the slope inferred from the high-pres- sure data cannot apply down to atmo- spheric pressure, because, given the ther- modynamic data in Table III and the experimentally determined densities of a near-dihydrate liquid, a Clapeyron slope of 15”K/kbar yields a solid density for the di- hydrate at one atmosphere and 176°K of 1.05 g/cm3, a density clearly incompatible with the X-ray diffraction density of the di- hydrate found by Bertie and Shehata (1984) seen in Fig. 5. We therefore suggest that the dihydrate phase inferred by Johnson et al. (1985) is not the same as that seen at 1 bar, but may be a high-pressure phase discussed in detail in the next section.
The calculated di- and hemihydrate Cla- peyron slopes are shown in Fig. 6 along with the measured slopes of the monohy- drate Hz0 and NH3 as a function of the ammonia mass fraction. We note that the slopes exhibit a consistent functional de- pendence on the ammonia mass fraction, a property possibly shared by the MgO-SiOz system (Deer et al. 1971, p. 199, Bottinga and Richet 1978, Cox et al. 1979, Chapt. 3), a system which bears several other striking similarities to the NH3-HZ0 system.
We recognize the large uncertainties in
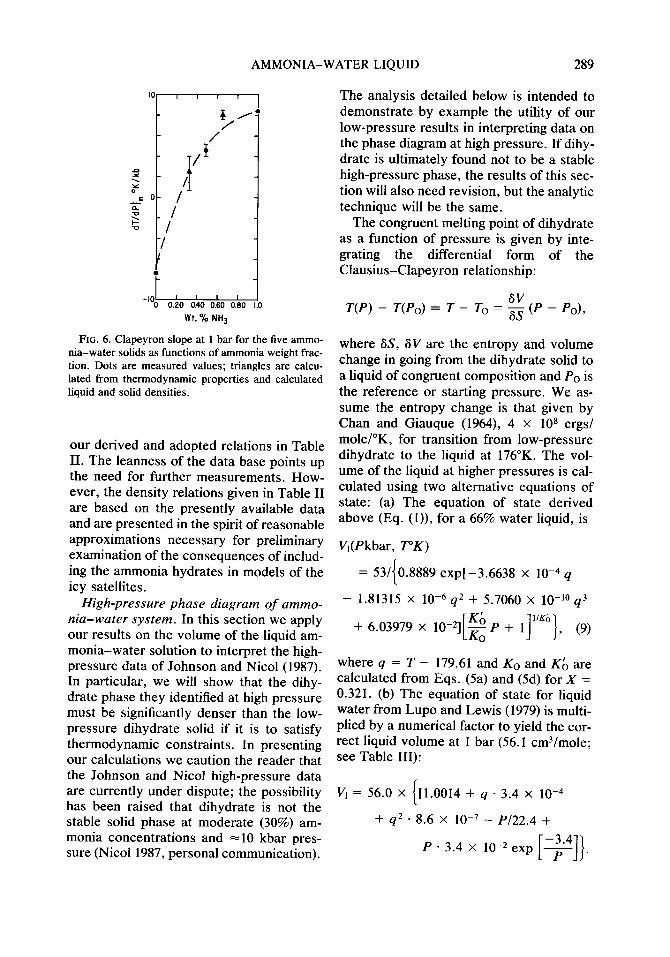
AMMONIA-WATER LIQUID 289
-lo0 0.20 I 0?10 I 0.60 I 0.60 I I.0
Wt. % NH,
FIG. 6. Clapeyron slope at 1 bar for the five ammo- nia-water solids as functions of ammonia weight frac- tion. Dots are measured values; triangles are calcu- lated from thermodynamic properties and calculated liquid and solid densities.
our derived and adopted relations in Table II. The leanness of the data base points up the need for further measurements. How- ever, the density relations given in Table II are based on the presently available data and are presented in the spirit of reasonable approximations necessary for preliminary examination of the consequences of includ- ing the ammonia hydrates in models of the icy satellites.
High-pressure phase diagram of ammo- nia-water system. In this section we apply our results on the volume of the liquid am- monia-water solution to interpret the high- pressure data of Johnson and Nicol (1987). In particular, we will show that the dihy- drate phase they identified at high pressure must be significantly denser than the low- pressure dihydrate solid if it is to satisfy thermodynamic constraints. In presenting our calculations we caution the reader that the Johnson and Nicol high-pressure data are currently under dispute; the possibility has been raised that dihydrate is not the stable solid phase at moderate (30%) am- monia concentrations and ~10 kbar pres- sure (Nicol 1987, personal communication).
The analysis detailed below is intended to demonstrate by example the utility of our low-pressure results in interpreting data on the phase diagram at high pressure. If dihy- drate is ultimately found not to be a stable high-pressure phase, the results of this sec- tion will also need revision, but the analytic technique will be the same.
The congruent melting point of dihydrate as a function of pressure is given by inte- grating the differential form of the Clausius-Clapeyron relationship:
T(P) - T(Po) = T - TO = g (P - PO),
where 6S, 6V are the entropy and volume change in going from the dihydrate solid to a liquid of congruent composition and PO is the reference or starting pressure. We as- sume the entropy change is that given by Chan and Giauque (1964), 4 x IO8 ergs/ mole/OK, for transition from low-pressure dihydrate to the liquid at 176°K. The vol- ume of the liquid at higher pressures is cal- culated using two alternative equations of state: (a) The equation of state derived above (Eq. (l)), for a 66% water liquid, is
Vl(Pkbar, T”K)
= 53/(0.8889 exp[-3.6638 x 1O-4 q
- 1.81315 x lo+ q2 + 5.7060 x 10⁻¹⁰ q3
+ 6.03979 x 10⁻²,[z P + l]“Kb}, (9)
where q = T - 179.61 and KO and Kb are calculated from Eqs. (5a) and (5d) for X = 0.321. (b) The equation of state for liquid water from Lupo and Lewis (1979) is multi- plied by a numerical factor to yield the cor- rect liquid volume at 1 bar (56.1 cm3/mole; see Table III):
V, = 56.0 x [1.0014 + q . 3.4 x 1O-4 {
+ q2 - 8.6 x lo-’ - P/22.4 +
-3.4 P. 3.4 X low2 exp 7
[ II .
290 CROFT, LUNINE, AND KARGEL
The volume of the dihydrate solid is pa- rameterized in the form
v, = vo exp(-KP + aq),
where K = compressibility, (Y = thermal ex- pansion coefficient, and V. = volume of the solid at 1 bar. Initially, the compressibility and thermal expansion coefficients were treated as constant adjustable parameters; as explained below, better results are ob- tained with CY a function of temperature and K a function of pressure.
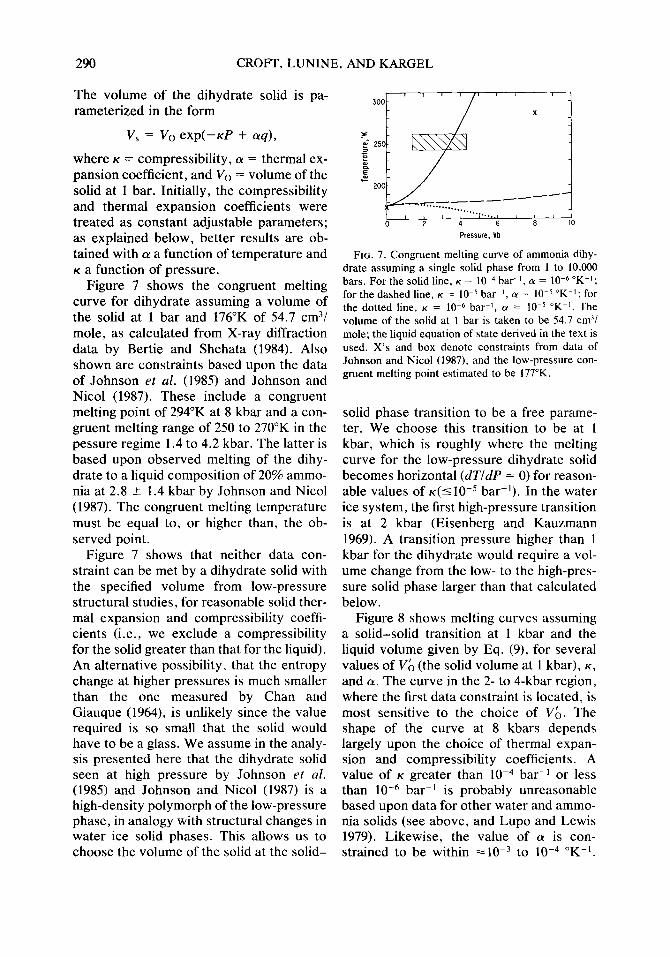
Figure 7 shows the congruent melting curve for dihydrate assuming a volume of the solid at 1 bar and 176°K of 54.7 cm3/ mole, as calculated from X-ray diffraction data by Bertie and Shehata (1984). Also shown are constraints based upon the data of Johnson et al. (1985) and Johnson and Nicol (1987). These include a congruent melting point of 294°K at 8 kbar and a con- gruent melting range of 250 to 270°K in the pessure regime 1.4 to 4.2 kbar. The latter is based upon observed melting of the dihy- drate to a liquid composition of 20% ammo- nia at 2.8 + 1.4 kbar by Johnson and Nicol (1987). The congruent melting temperature must be equal to, or higher than, the ob- served point.
Figure 7 shows that neither data con- straint can be met by a dihydrate solid with the specified volume from low-pressure structural studies, for reasonable solid ther- mal expansion and compressibility coeffi- cients (i.e., we exclude a compressibility for the solid greater than that for the liquid). An alternative possibility, that the entropy change at higher pressures is much smaller than the one measured by Chan and Giauque (1964), is unlikely since the value required is so small that the solid would have to be a glass. We assume in the analy- sis presented here that the dihydrate solid seen at high pressure by Johnson et al. (1985) and Johnson and Nicol (1987) is a high-density polymorph of the low-pressure phase, in analogy with structural changes in water ice solid phases. This allows us to choose the volume of the solid at the solid-
300 x
0 2 4 6 8 Pressure, kb
FIG. 7. Congruent melting curve of ammonia dihy- drate assuming a single solid phase from 1 to 10,000 bars. For the solid line, K = 10m4 bar-‘, a = 10e6 “K-l; for the dashed line, K = lO-5 bar’, 01 = lO-5 “Km’; for the dotted line, K = 10-e bar-l, Q = 10e5 “Km’. The volume of the solid at 1 bar is taken to be 54.7 cm31 mole; the liquid equation of state derived in the text is used. X’s and box denote constraints from data of Johnson and Nicol (1987), and the low-pressure con- gruent melting point estimated to be 177°K.
solid phase transition to be a free parame- ter. We choose this transition to be at 1 kbar, which is roughly where the melting curve for the low-pressure dihydrate solid becomes horizontal (dT/dP = 0) for reason- able values of ~(510~~ bar-‘). In the water ice system, the first high-pressure transition is at 2 kbar (Eisenberg and Kauzmann 1969). A transition pressure higher than 1 kbar for the dihydrate would require a vol- ume change from the low- to the high-pres- sure solid phase larger than that calculated below.
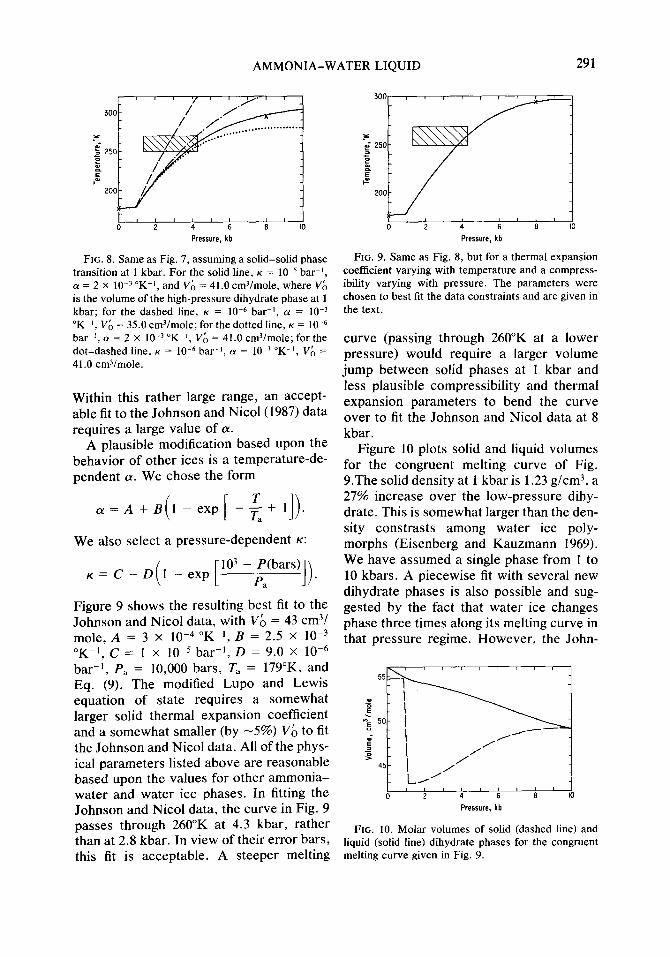
Figure 8 shows melting curves assuming a solid-solid transition at 1 kbar and the liquid volume given by Eq. (9), for several values of Vb (the solid volume at 1 kbar), K,
and (Y. The curve in the 2- to 4-kbar region, where the first data constraint is located, is most sensitive to the choice of Vb. The shape of the curve at 8 kbars depends largely upon the choice of thermal expan- sion and compressibility coefficients. A value of K greater than 1O-4 bar-l or less than 10m6 bar’ is probably unreasonable based upon data for other water and ammo- nia solids (see above, and Lupo and Lewis 1979). Likewise, the value of (Y is con- strained to be within -10m3 to 10m4 “K-l.
AMMONIA-WATER LIQUID 291
0 2 4 6 8 IO
Pressure, kb
FIG. 8. Same as Fig. 7, assuming a solid-solid phase transition at 1 kbar. For the solid line, K = 10m5 bar’, a = 2 x lOA “K-t, and VA = 41.0 cm3/mole, where V& is the volume of the high-pressure dihydrate phase at 1 kbar; for the dashed line, K = 10m6 bar-t, (Y = lo-) “K-l, Vb = 35.0 cm3/mole; for the dotted line, K = 10e6 bar’, a = 2 x 10d3 OK-‘, V& = 41.0 cm3/mole; for the dot-dashed line, K = 1O-6 bat-t, (Y = lo-’ “K-l, V& = 41.0 cm3/mole.
Within this rather large range, an accept- able fit to the Johnson and Nicol(l987) data requires a large value of ff.
A plausible modification based upon the behavior of other ices is a temperature-de- pendent (Y. We chose the form
(Y = A + B(1 - exp [ - $ + 11).
We also select a pressure-dependent K:
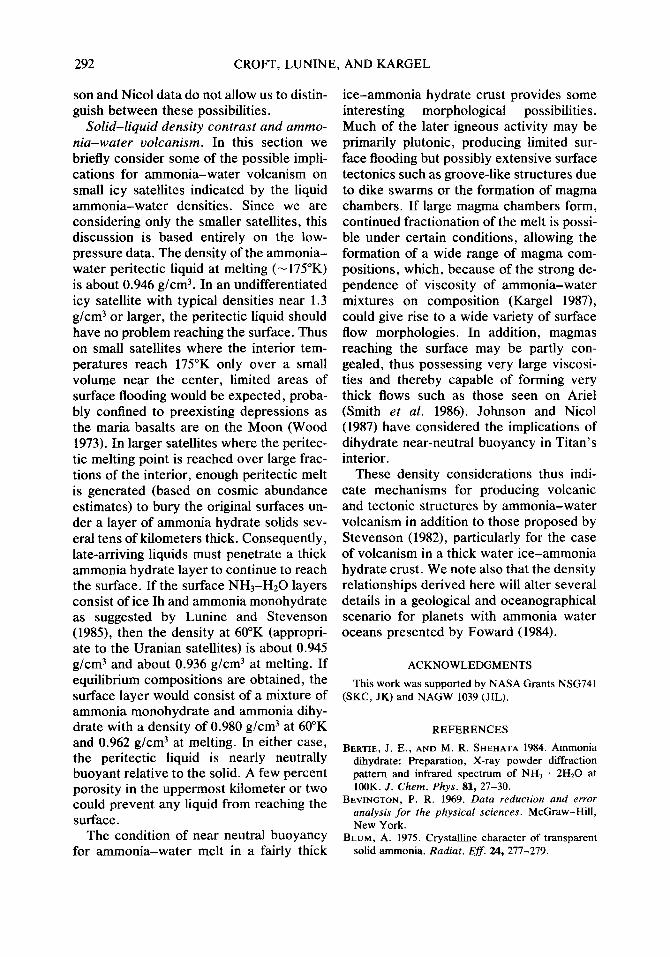
K = c - ~(1 - exp [lo3 -p%(bars)]). Figure 9 shows the resulting best fit to the Johnson and Nicol data, with Vb = 43 cm3/ mole, A = 3 x 10P4 “K-i, B = 2.5 X 10m3 OK-i, C = 1 x 10-j bar-‘, D = 9.0 X 10m6 bar-‘, P, = 10,000 bars, T, = 179”K, and Eq. (9). The modified Lupo and Lewis equation of state requires a somewhat larger solid thermal expansion coefficient and a somewhat smaller (by -5%) Vb to fit the Johnson and Nicol data. All of the phys- ical parameters listed above are reasonable based upon the values for other ammonia- water and water ice phases. In fitting the Johnson and Nicol data, the curve in Fig. 9 passes through 260°K at 4.3 kbar, rather than at 2.8 kbar. In view of their error bars, this fit is acceptable. A steeper melting
0 2 4 6 8 IO Pressure, kb
FIG. 9. Same as Fig. 8, but for a thermal expansion coefficient varying with temperature and a compress- ibility varying with pressure. The parameters were chosen to best fit the data constraints and are given in the text.
curve (passing through 260°K at a lower pressure) would require a larger volume jump between solid phases at 1 kbar and less plausible compressibility and thermal expansion parameters to bend the curve over to fit the Johnson and Nicol data at 8 kbar.
Figure 10 plots solid and liquid volumes for the congruent melting curve of Fig. 9.The solid density at 1 kbar is 1.23 g/cm3, a 27% increase over the low-pressure dihy- drate. This is somewhat larger than the den- sity constrasts among water ice poly- morphs (Eisenberg and Kauzmann 1969). We have assumed a single phase from 1 to 10 kbars. A piecewise fit with several new dihydrate phases is also possible and sug- gested by the fact that water ice changes phase three times along its melting curve in that pressure regime. However, the John-
Pressure. kb
FIG. 10. Molar volumes of solid (dashed line) and liquid (solid line) dihydrate phases for the congruent melting curve given in Fig. 9.
CROFT, LUNINE, AND KARGEL
son and Nicol data do not allow us to distin- guish between these possibilities.
Solid-liquid density contrast and ammo- nia-water volcanism. In this section we briefly consider some of the possible impli- cations for ammonia-water volcanism on small icy satellites indicated by the liquid ammonia-water densities. Since we are considering only the smaller satellites, this discussion is based entirely on the low- pressure data. The density of the ammonia- water peritectic liquid at melting (-175°K) is about 0.946 g/cm3. In an undifferentiated icy satellite with typical densities near 1.3 g/cm3 or larger, the peritectic liquid should have no problem reaching the surface. Thus on small satellites where the interior tem- peratures reach 175°K only over a small volume near the center, limited areas of surface flooding would be expected, proba- bly confined to preexisting depressions as the maria basalts are on the Moon (Wood 1973). In larger satellites where the peritec- tic melting point is reached over large frac- tions of the interior, enough peritectic melt is generated (based on cosmic abundance estimates) to bury the original surfaces un- der a layer of ammonia hydrate solids sev- eral tens of kilometers thick. Consequently, late-arriving liquids must penetrate a thick ammonia hydrate layer to continue to reach the surface. If the surface NH3-Hz0 layers consist of ice Ih and ammonia monohydrate as suggested by Lunine and Stevenson (1985), then the density at 60°K (appropri- ate to the Uranian satellites) is about 0.945 g/cm3 and about 0.936 g/cm3 at melting. If equilibrium compositions are obtained, the surface layer would consist of a mixture of ammonia monohydrate and ammonia dihy- drate with a density of 0.980 g/cm3 at 60°K and 0.962 g/cm3 at melting. In either case, the peritectic liquid is nearly neutrally buoyant relative to the solid. A few percent porosity in the uppermost kilometer or two could prevent any liquid from reaching the surface.
The condition of near neutral buoyancy for ammonia-water melt in a fairly thick
ice-ammonia hydrate crust provides some interesting morphological possibilities. Much of the later igneous activity may be primarily plutonic, producing limited sur- face flooding but possibly extensive surface tectonics such as groove-like structures due to dike swarms or the formation of magma chambers. If large magma chambers form, continued fractionation of the melt is possi- ble under certain conditions, allowing the formation of a wide range of magma com- positions, which, because of the strong de- pendence of viscosity of ammonia-water mixtures on composition (Kargel 1987), could give rise to a wide variety of surface flow morphologies. In addition, magmas reaching the surface may be partly con- gealed, thus possessing very large viscosi- ties and thereby capable of forming very thick flows such as those seen on Ariel (Smith et al. 1986). Johnson and Nicol (1987) have considered the implications of dihydrate near-neutral buoyancy in Titan’s interior.
These density considerations thus indi- cate mechanisms for producing volcanic and tectonic structures by ammonia-water volcanism in addition to those proposed by Stevenson (1982), particularly for the case of volcanism in a thick water ice-ammonia hydrate crust. We note also that the density relationships derived here will alter several details in a geological and oceanographical scenario for planets with ammonia water oceans presented by Foward (1984).
ACKNOWLEDGMENTS
This work was supported by NASA Grants NSG741
(SKC, JK) and NAGW 1039 (JIL).
REFERENCES
BERTIE, J. E., AND M. R. SHEHATA 1984. Ammonia dihydrate: Preparation, X-ray powder diffraction pattern and infrared spectrum of NH3 2HzO at 1OOK. J. Chem. Phys. 81, 27-30.
BEVINGTON, P. R. 1969. Data reduction and error analysis for the physical sciences. McGraw-Hill, New York.
BLUM, A. 1975. Crystalline character of transparent solid ammonia. Radiat. Eff. 24, 277-279.
AMMONIA-WATER LIQUID 293
BO~INGA, Y., AND P. RICHET 1978. Thermodynam- ics of liquid silicates, a preliminary report. Earth Planet. Sci. Lett. 40, 382-400.
CHAN, J. P., AND W. F. GIAUQUE 1964. The entropy of NH3 2H20 heat capacity from 15 to 300K. J. Phys. Chem. 68, 3053-3057 (Erratum, 3912).
Cox, K. G., J. D. BELL, AND R. J. PANKHURST 1979. The Interpretation of Igneous Rocks. Allen & Un- win, London.
DEER, W. A., R. A. HOWIE, AND J. ZUSSMAN 1971. Rock Forming Minerals, Framework Silicates, Vol. 4. Longman, London.
DORSEY, N. E. 1940. Properties of Ordinary Water- Substance. Reinhold, New York.
EDWARDS, T. J., J. NEWMAN, AND J. M. PRAUSNITZ 1978. Thermodynamics of vapor-liquid equilibria for the ammonia-water system. Znd. Eng. Chem.
Fundam. 17, 264-269. EISENBERG, D., AND W. KAUZMANN 1969. The Struc-
ture and Properties of Water. Oxford Univ. Press, London/New York.
FOWARD, R. L. 1984. The Flight of the Dragonfly. Simon & Schuster, New York.
GILLESPIE, L. J. (Ed.) 1928. Density and thermal ex- pansion of aqueous solutions of inorganic sub- stances and strong electrolytes. In International Critical Tables, Vol. 3, p. 59.
HAAR, L., AND J. S. GALLAGHER 1978. Thermody- namic properties of ammonia. J. Phys. Chem. Ref. Data 7, 635-792.
HAAR, L., J. S. GALLAGHER, AND G. S. KELL 1984. NBS/NRC Steam Tables. Hemisphere Pub., Wash- ington , DC.
HILDENBRAND, D. L., AND W. F. GIAUQUE 1953. Ammonium oxide and ammonium hydroxide. Heat capacities and thermodynamic properties from 15 to 300”. J. Amer. Chem. Sot. 75, 2811-2818.
HOBBS, P. V. 1974. Ice Physics. Oxford Univ. Press (Clarendon), London/New York.
JOHNSON, M. L., AND M. NICOL 1987. The ammonia- water phase diagram and its implications for icy sat- ellites. .Z. Geophys. Res. 92, 6339-6349.
JOHNSON, M. L., A. SCHWAKE, AND M. NICOL 1985. Partial phase diagram for the system NH3-H20: The water-rich region. In Ices in the Solar Sys- tem (J. Klinger et al., Eds.), p. 39-47. Reidel, Dordrecht.
KARGEL, J. S. 1987. Density and viscosity measure- ments of ammonia-water liquids. Lunar Planet. Sci. XVZZZ, 475-476. The Lunar and Planetary Institute, Houston.
LEWIS, J. S. 1972. Low temperature condensation from the solar nebula. Icarus 16, 241-252.
LUNINE, J. I., AND D. J. STEVENSON 1985. Thermody- namics of clathrate hydrate at low and high pres- sures with application to the outer Solar System. Astrophys. J. Suppl. Ser. 58, 493-531.
LUPO, M. J., AND J. S. LEWIS 1979. Mass-radius rela- tionships in icy satellites. Icarus 40, 157-170.
MANZHELII, V. G., AND A. M. TOLKACHEV 1966. Thermal expansion of crystalline ammonia. Sov. Phys. Solid State 8, 827-830.
MILLS, R. L., D. H. LIEBENBERG, AND PH. PRUZAN 1982. Phase diagram and transition properties of condensed ammonia to 1Okb. J. Phys. Chem. 86, 5219-5222.
MILLS, R. L., D. H. LIEBENBERG, R. LESAR, AND PH. PRUZAN 1984. Equation of state of fluid NH3 from P- V-T and ultrasound measurements to 12 kb. In High Pressure in Science and Technology, Proc. 9th AZRAPTZnt. High Press. Conf. (C. Homan, R. K. MacCrone, and E. Whalley, Eds.), Part 2, pp. 43- 50. North-Holland, New York.
MURNAGHAN, E. D. 1944. The compressibility of me- dia under extreme pressures. Proc. Natl. Acad. Sci. 30, 244-247.
OLOVSSON, I., AND D. H. TEMPLETON 1959a. The crystal structure of ammonia monohydrate. Acta Crystall. 12, 827-832.
OLOVSSON, I., AND D. H. TEMPLETON 1959b. X-ray study of solid ammonia. Acta Crystall. 12, 832-836.
OVERSTREET, R. AND W. F. GIAUQUE 1937. Ammo- nia. The heat capacity and vapor pressure of solid and liquid. Heat of vaporization. The entropy values from thermal and spectral data. J. Amer. Chem. Sot. 59, 254-259.
ROLLET, A.-P., AND G. VUILLAIUI 1956. Sur un novel hydrate de l’ammoniac. C.R. Acad. Sci. Paris 243, 383-386.
SIEMONS, W. J., AND D. H. TEMPLETON 1954. The crystal structure of ammonium oxide. Acta Crystall. 7, 194-198.
SMITH, B. A., AND THE VOYAGER IMAGING TEAM 1986. Voyager 2 in the Uranian system: Imaging sci- ence results. Science 233, 43-64.
SOURIRAJAN, S., AND G. C. KENNEDY 1963. Specific volumes of liquid ammonia-water mixtures in the temperature range 0” to 25” and pressure range 100 to 1400 bars. J. Geophys. Res. 68, 4149-4155.
STEVENSON, J. D. 1982. Volcanism and igneous pro- cesses in small icy satellites. Nature 298, 142-144.
TOLKACHEV, A. M., AND V. G. MANZHELII 1966. Density of solidified gases. Sov. Phys. Solid State 7, 1711-1713.
WOOD, J. A. 1973. Bombardment as a cause of the lunar asymmetry. Moon 8, 73-103.
Related Documents