Integrated Estimates of Capital Stocks and Services for the United Kingdom: 1950-2013 Nicholas Oulton (London School of Economics, UK) Gavin Wallis (Bank of England) Paper Prepared for the IARIW 33 rd General Conference Rotterdam, the Netherlands, August 24-30, 2014 Session 7D Time: Friday, August 29, Morning

Welcome message from author
This document is posted to help you gain knowledge. Please leave a comment to let me know what you think about it! Share it to your friends and learn new things together.
Transcript

Integrated Estimates of Capital Stocks and Services for the United Kingdom: 1950-2013
Nicholas Oulton (London School of Economics, UK)
Gavin Wallis (Bank of England)
Paper Prepared for the IARIW 33rd
General Conference
Rotterdam, the Netherlands, August 24-30, 2014
Session 7D
Time: Friday, August 29, Morning

Equation Chapter 1 Section 1
Integrated Estimates of Capital Stocks and Services
for the United Kingdom: 1950-2013
Nicholas Oulton
London School of Economics
and
Gavin Wallis
Bank of England
July 2014
To be presented to the 33rd
General Conference of the International Association
for Research in Income and Wealth, Rotterdam, August 24-30, 2014
Emails

1
Table of Contents Abstract 2
1. Introduction 3
1.1 Previous work 4
1.2 Plan of the paper 5
2. Methodology 5
2.1 Stocks and services 5
2.2 Endogenous versus exogenous measures of the rate of return 7
3. Results 9
3.1 Data 9
3.2 Stocks compared to services: the ex post method 11
3.3 The hybrid method 12
3.4 Capital intensity before and after the Great Recession 12
3.5 Is depreciation rising in importance? 13
4. Conclusions 14
TABLES 16
CHARTS 20
APPENDIX TABLES 26
References 34
2
Abstract
This paper presents estimates of capital stocks and capital services for the United Kingdom, 1950-
2013, for the whole economy and for the market sector. Our estimates cover eight asset types
(structures, machinery, vehicles, computers, purchased software, own-account software, mineral
exploration and artistic originals) and also a ninth, R&D, from 1981 to 2012. We compare the effect
on the estimates of capital services of using either an exogenous (ex post) rate of return or an
endogenous one. The latter uses a model which allows for ex ante risk: firms’ expectations may not
be satisfied so the realised rate of return may not be equalised across assets. We see how much the
inclusion of R&D matters. We also look at what has happened to capital intensity (capital services
per hour worked) in the Great Recession, a period when labour productivity fell in the UK. And we
consider the evolution of the aggregate depreciation rate and of capital consumption as a proportion
of GDP.
JEL codes: E22, E23, D24, O47
Key words: capital services, capital stocks, rate of return, ex post, hybrid

3
1. Introduction
This paper presents estimates of fixed capital stocks and capital services for the United Kingdom,
1950-2013, for the whole economy and the market sector.1 Our estimates cover 8 asset types
(structures, machinery, vehicles, computers, purchased software, own-account software, mineral
exploration and artistic originals) and also R&D. We compare the effect on the estimates of capital
services of using either an exogenous (ex post) rate of return or an endogenous one. The latter uses
a model which allows for ex ante risk: firms’ expectations may not be satisfied so the realised rate
of return may not be equalised across assets (Oulton 2007). We see how much the inclusion of
R&D matters. We also look at what has happened to capital intensity (capital services per hour
worked) in the Great Recession, a period when labour productivity fell in the UK. And we consider
the evolution of the aggregate depreciation rate and of capital consumption as a proportion of GDP.
Capital services are the relevant measure for growth accounting and productivity analysis. But
capital stocks are also relevant in other contexts. The ratio of capital stock to the value of output is
an important magnitude in growth theory. Any trends in this ratio may indicate that the economy is
not in long run equilibrium. And this ratio may also be relevant for the study of wealth inequality.
Our estimates of capital services are based on a version of the standard methodology as laid down
in the OECD’s Measuring Capital manual (OECD 2009). This methodology goes back to Griliches
and Jorgenson (1967), Christensen and Jorgenson (1969), Hall and Jorgenson (1967) and Jorgenson
(1989); see also Diewert 1980 and 2001). We estimate capital stocks by the Perpetual Inventory
Method (PIM). We assume geometric depreciation. The depreciation rates which are based mainly
on Fraumeni (1997) differ across assets and industry but for each asset the rate is constant over
time. The aggregate capital stock is estimated as a chained volume index of the individual asset
stocks. The weights are the shares of each asset in the total value of all assets. Aggregate capital
services are estimated as a different chained volume index of the asset stocks. Now the weights are
the shares in nominal profit (gross operating surplus) attributable to each asset; these shares derive
from the rental prices which are calculated using the Hall-Jorgenson cost-of-capital formula
(Jorgenson 1989; Hall and Jorgenson 1967). Capital services are referred to as the Volume Index of
Capital Services (VICS) in the OECD Capital Manual (OECD 2009).
1 Our framework enables us to estimate capital stocks and services for 19 industry groups but we
do not present these more detailed results here.

4
Our stocks and services estimates are for the period 1950-2013. These are based on investment data
by asset and industry for 1948-2013. For R&D we have investment only from 1981 to 2012. Our
data allow us to distinguish nine types of fixed asset. Since our focus is on productivity analysis we
do not consider dwellings. In estimating the rate of return we would have liked to have included
inventories since firms presumably expect inventories to “pay their way”, i.e. to yield a profit which
at least covers their costs. At the moment we have not been able to do this as the relevant series on
inventory stocks is not long enough. However we hope to remedy this in future work. We also
exclude land and other natural assets due to data limitations.2
1.1 Previous work
In the UK official estimates of capital stocks go back to Redfern (1955) and Dean (1964). But until
comparatively recently there were no official estimates of capital services. Unofficial estimates of
capital services appeared in Oulton and O’Mahony (1994) for 128 industries within manufacturing
(for three asset types: plant & machinery, buildings and vehicles). Oulton (2001) and Oulton and
Srinivasan (2003) produced annual estimates of capital services and stocks for the whole economy
incorporating explicit allowance for ICT assets. More recent estimates of capital services for the
UK appear in the EU KLEMS database which again makes special provision for ICT (O’Mahony
and Timmer 2009).
The UK’s Office for National Statistics (ONS) produces estimates of capital stocks, e.g. Vaze et al.
(2003). But they were withdrawn from publication in 2011 after ONS quality assurance checks
raised issues with the quality of the data. Since then the ONS have conducted an extensive period of
development work and quality assurance. The ONS published it latest capital stock estimates in July
2014;3 these cover just the period 1997 to 2012. The ONS has also regularly produced estimates of
capital services since 2005, always characterised as “experimental”. The most recent
2 The value of land bundled together with that of structures is included in the balance sheets which
form part of the UK National Accounts. But the structures part of this is estimated by a different
method from that used here (and also in official estimates of the stock of structures), namely the
PIM applied to gross investment in structures. While it would be possible to develop consistent
estimates of the aggregate value of land in the UK, it would be difficult to break this down by
industry. 3 www.ons.gov.uk/ons/rel/cap-stock/capital-stock--capital-consumption/capital-stocks-and-
consumption-of-fixed-capital--2012/stb-caps-stock.html
5
comprehensive set is in Appleton and Wallis (2011).4 However the assumptions employed for
services are not consistent with those the ONS uses used for stocks, e.g. the depreciation
assumptions differ as do some of the price indices, e.g. for ICT assets.
There is therefore scope for a paper which (a) uses a consistent framework for stocks and services
(broadly in line with the recommendations of the OED’s Capital Manual); (b) makes proper
allowance for ICT assets, including using defensible price indices to deflate nominal investment in
ICT; (c) takes account of the recent Eurostat requirement (following the adoption of SNA 2008) to
incorporate R&D into the National Accounts as a form of investment;5 and (d) uses the most up-to-
date data available (annual investment data up to and including 2013).
1.2 Plan of the paper
In section 2 we set out our methodology more formally. We also discuss here the difference
between endogenous and exogenous rates of return. Section 3 presents the results. We consider
here how much difference the choice of rate of return makes. We also look at the impact of
including R&D as an additional asset (R&D is due to be incorporated into the UK National
Accounts later in 2014). And we examine the behaviour of capital intensity (capital services per
hour worked), particularly since the Great Recession began in 2008, a period in which labour
productivity fell and has yet to fully recover. Section 4 concludes.
2. Methodology
2.1 Stocks and services
Let ijtA represent the stock of the i-th asset ( 1,...,i N ) in the j-th industry ( 1,...,j M ) at the end
of year t. Let id be the geometric rate of depreciation applicable to the i-th asset. This rate is
assumed to be the same for all industries and constant over time. And let ijtI be gross investment in
the i-th asset by the j-th industry in year t. Then the stock grows over time in accordance with:
4 In January 2014 the ONS released multifactor productivity estimates which included indicative
estimates of capital services growth http://www.ons.gov.uk/ons/rel/icp/multi-factor-productivity--
experimental-/indicative-estimates-to-2012/art-indicative-estimates-to-2012.html 5 Estimates of capital services which include a wider range of intangible assets, not just software
and R&D, are in Goodridge et al. (2013).

6
, 1(1 )ijt ijt i ij tA I d A (1)
Starting stocks in year 0, 0ijA are assumed known. The growth rate of the aggregate capital stock in
the j-th industry is calculated as a Törnqvist index of the growth rates of the individual assets:
, 1 , 11
ln( / ) ln( / )i N A
jt j t t ijt ij tiA A w A A
(2)
where the weights are
, 1
1( )
2
A A A
ijt ijt ij tw w w
and
1
A
ijt ijtA
ijt i N A
ijt ijti
p Aw
p A
Here A
ijtp is the price of a unit of capital of the i-th type (the asset price). The level of the real capital
stock in some reference year is the nominal value of the stock in that year. The level in all other
years is derived by applying the growth rates from equation (2) to the reference year level.
The capital services delivered by any asset during year t are assumed to be proportional to the stock
of that asset at the end of year 1t with the constant of proportionality normalised to equal 1:
, 1, 1,..., ; 1,...,ijt ij tK A i N j M (3)
Aggregate capital services in the j-th industry are calculated as a Törnqvist index of the capital
services delivered by each asset; the weights are the shares in industry profit attributable to each
asset, K
ijtw :
, 1 , 11
ln( / ) ln( / )i N K
jt j t ijt ijt ij tiK K w K K
(4)
Here
, 1
1( )
2
K K K
ijt ijt ij tw w w
and
1
K
ijt ijtK
ijt i N K
ijt ijti
p Kw
p K
(5)
and by definition the value of capital services equals profit or gross operating surplus (GOS)
1
i N K
ijt ijt jtip K GOS
(6)
The K
ijtp are the rental prices (user costs), given by the Hall-Jorgenson formula (Hall and Jorgenson
1967):

7
, 1(1 )K A
ijt ijt jt i ijt ijt ij tp T r d p (7)
where ijtT is the tax factor; jtr is the nominal rate of return in the j-th industry which is assumed to
be the same for all assets (more on this below); and ijt is the rate of growth of the i-th asset price:
, 1 , 1( ) /A A A
ijt ijt ij t ij tp p p
The level of real capital services in some reference year is the nominal value of profit in that year.
The level in all other years is derived by applying the growth rates from equation (4) to the
reference year level.
Törnqvist indices are commonly used in the growth accounting literature. But in official statistics in
Europe chained Laspeyres indices are generally mandated. So we present results on the latter basis
too. Using chained Laspeyres the growth rate of capital stocks is given by
, 1 1 , 11/ ( / )
i N A
jt j t t ijt ij tiA A w A A
(8)
And that of capital services is given by
, 1 1 , 11/ ( / )
i N K
jt j t ijt ijt ij tiK K w K K
(9)
2.2 Endogenous versus exogenous measures of the rate of return
Under the endogenous (ex post) approach we calculate the average rate of return from equation (6)
and then plug this rate into equation (7) to estimate the rental price weights. The capital gain or loss
term jt is taken to be the actual rate of growth of the asset price. This in effect assumes a world of
perfect certainty in which the firm succeeds in equalising the rate of return across all assets in every
time period ( , alljt tr r j ) and in which expectations of capital gain or loss are always realised. This
is obviously implausible. In addition the approach often leads to empirical difficulties. Rental prices
are frequently negative which makes no sense economically.6 These then have to be smoothed
away, sometimes by omitting the capital gains term altogether, which is obviously ad hoc. On the
other hand this approach has the advantage of consistency with the national accounts: the sum of the
earnings of all assets equals Gross Operating Surplus, in accordance with SNA 2008.
6 In a study covering 14 countries and 10 industries over 1971-2005 Oulton and Rincon-Aznar
(2012) found that 746, out of a possible total of 27,930 rental prices, or 2.6%, were negative using
the ex post method.
8
An alternative is the exogenous approach. Here we take a rate of return from financial data, e.g. an
average of the realised rate of return on equities and the yield on corporate bonds. This still leaves
the problem of actual versus expected capital gains. And consistency with the National Accounts is
now lost since the earnings of all assets no longer add up to Gross Operating Surplus.
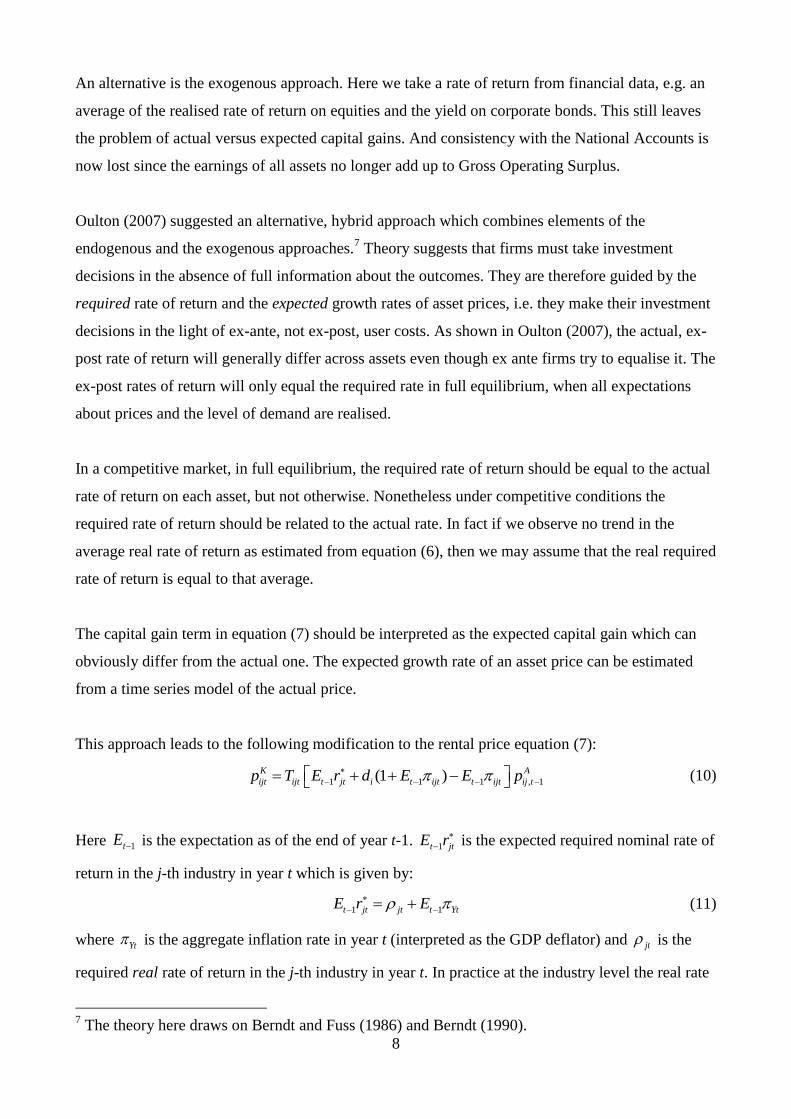
Oulton (2007) suggested an alternative, hybrid approach which combines elements of the
endogenous and the exogenous approaches.7 Theory suggests that firms must take investment
decisions in the absence of full information about the outcomes. They are therefore guided by the
required rate of return and the expected growth rates of asset prices, i.e. they make their investment
decisions in the light of ex-ante, not ex-post, user costs. As shown in Oulton (2007), the actual, ex-
post rate of return will generally differ across assets even though ex ante firms try to equalise it. The
ex-post rates of return will only equal the required rate in full equilibrium, when all expectations
about prices and the level of demand are realised.
In a competitive market, in full equilibrium, the required rate of return should be equal to the actual
rate of return on each asset, but not otherwise. Nonetheless under competitive conditions the
required rate of return should be related to the actual rate. In fact if we observe no trend in the
average real rate of return as estimated from equation (6), then we may assume that the real required
rate of return is equal to that average.
The capital gain term in equation (7) should be interpreted as the expected capital gain which can
obviously differ from the actual one. The expected growth rate of an asset price can be estimated
from a time series model of the actual price.
This approach leads to the following modification to the rental price equation (7):
1 1 1 , 1(1 )K A
ijt ijt t jt i t ijt t ijt ij tp T E r d E E p
(10)
Here 1tE is the expectation as of the end of year t-1. 1t jtE r is the expected required nominal rate of
return in the j-th industry in year t which is given by:
1 1t jt jt t YtE r E
(11)
where Yt is the aggregate inflation rate in year t (interpreted as the GDP deflator) and jt is the
required real rate of return in the j-th industry in year t. In practice at the industry level the real rate
7 The theory here draws on Berndt and Fuss (1986) and Berndt (1990).

9
of return often takes on highly implausible values, being persistently very high or very low. So it is
impossible to estimate required real rates from actual real rates. But for the whole economy or the
market sector the actual real rate of return is much more plausible and is generally stationary
(Oulton and Rincon 2012). This suggests using the same required real rate in all industries, namely
the time average of the observed aggregate real rate of return:
1( )
T
jt t Yttr
(12)
where tr is the aggregate nominal rate of return, calculated from an aggregate version of equation
(6) and (7). Putting equations (10), (11) and (12) together, we get that
1 1 1 , 1(1 ) ( )K A
ijt ijt i t ijt t ijt t Yt ij tp T d E E E p (13)
Consistency with the National Accounts is not assured under this approach since the estimated
returns to each asset no longer add up to Gross Operating Surplus. However, Oulton (2007) showed
that consistency can easily be restored. Under a certain assumption the rental price estimated by this
method is proportional to the true one (which equals the marginal product of the asset) and the
factor of proportionality is the same for each asset.8 So the weights based on equation (13) are
correct under the hybrid method and consistency with the National Accounts is restored by grossing
up the return to each asset by a common factor so the total equals Gross Operating Surplus.9
3. Results
3.1 Data
Our estimates require (a) a time series of current and constant price investment series by industry
and asset; (b) starting stocks; (c) depreciation rates by industry and asset; (d) gross operating
surplus; and (e) tax-adjustment factors.
Investment data from 1997 onwards is taken directly from the regular ONS business investment
release10
and supplemented with ad hoc releases on software, artistic originals and mineral
8 The assumption is that the firm’s production function is CES. Oulton (2007) also considers the
possibility that the production function is translog and gives some reason for thinking that
proportionality of rental prices to marginal products will continue to hold approximately. 9 Erumban (2008) and Inklaar (2008) have applied the hybrid approach of Oulton (2007) to EU
KLEMS data. 10
http://www.ons.gov.uk/ons/rel/bus-invest/business-investment/index.html
10
exploration.11
All pre-1997 data is taken from the 2003 release of the investment data underlying
previous ONS capital stock estimates.12
The pre-1997 data available in this release has not been
subject to revision because the new methodology for estimating GFCF has only been implemented
from 1997 onwards. And in practice, there is no reason to think it needs to be revised unless there
are significant ESA related changes. The dataset includes both current and constant price
investment at 42 industry and 4 asset level. In order to join this data to the latest estimates it is first
transformed from SIC03 to SIC07 and then aggregated to the 19 industry level. The SIC conversion
was done using turnover weights. This is the same approach the ONS tend to use. The asset split of
the data is expanded using information from historic supple-use tables.13
The data are then spliced
together with the latest estimates from 1997 onwards to give a consistent time series for the period
1948 to 2013. Implied deflators are calculated from the final time series of current and constant
price investment.
To get the PIM rolling we needed a starting stock for each asset. Starting stocks are based on the
dataset underlying Wallis (2009) which is fully consistent with historic ONS capital stock data.
These starting stocks include the official estimates of the one-off loss of capital associated with the
Second World War (Dean 1964).
Depreciation rates are the same as those used historically for official capital services estimates and
vary by both asset and industry. No additional allowance is made for the effect of premature
scrapping. Table 1 shows how depreciation rates vary by asset, with the range representing the
industry variation.
Because dwellings are not modelled as part of the productive capital stock, they do not form part of
the input into production, so the portion of the operating surplus attributable to dwellings has been
deducted from total UK gross operating surplus. We then add 20% of mixed income, which is our
estimate of the part of mixed income which represents a return to capital rather than labour. For the
ex post method, profit and therefore rates of return are measured at the whole economy level. For
the estimates that include R&D we have to adjust operating surplus for the treatment of R&D as an
asset rather than as intermediate consumption. To do so we simply add nominal R&D investment to
gross operating surplus.
11
http://www.ons.gov.uk/ons/about-ons/business-transparency/freedom-of-information/what-can-i-
request/published-ad-hoc-data/index.html 12
http://www.ons.gov.uk/ons/publications/re-reference-tables.html?edition=tcm%3A77-31299 13
For example, in the historical investment dataset computer hardware and computer software are
not separately identified from the rest of plant and machinery.

11
Tax adjustment factors are from Wallis (2012) and vary by asset but not by industry.
Our estimates are for 19 industry groups and for two aggregates, the market sector and the whole
economy. The industry groups are sections A-S of the Standard Industrial Classification 2007
(SIC07).14
The whole economy comprises sections A-S. The market sector is defined by dropping
sections O, P and Q.
3.2 Stocks compared to services: the ex post method
Table 2 shows average annual growth rates over 1950-2012 and for various sub-periods for the
VICS and the capital stock. These results are for the whole economy and use the ex post method
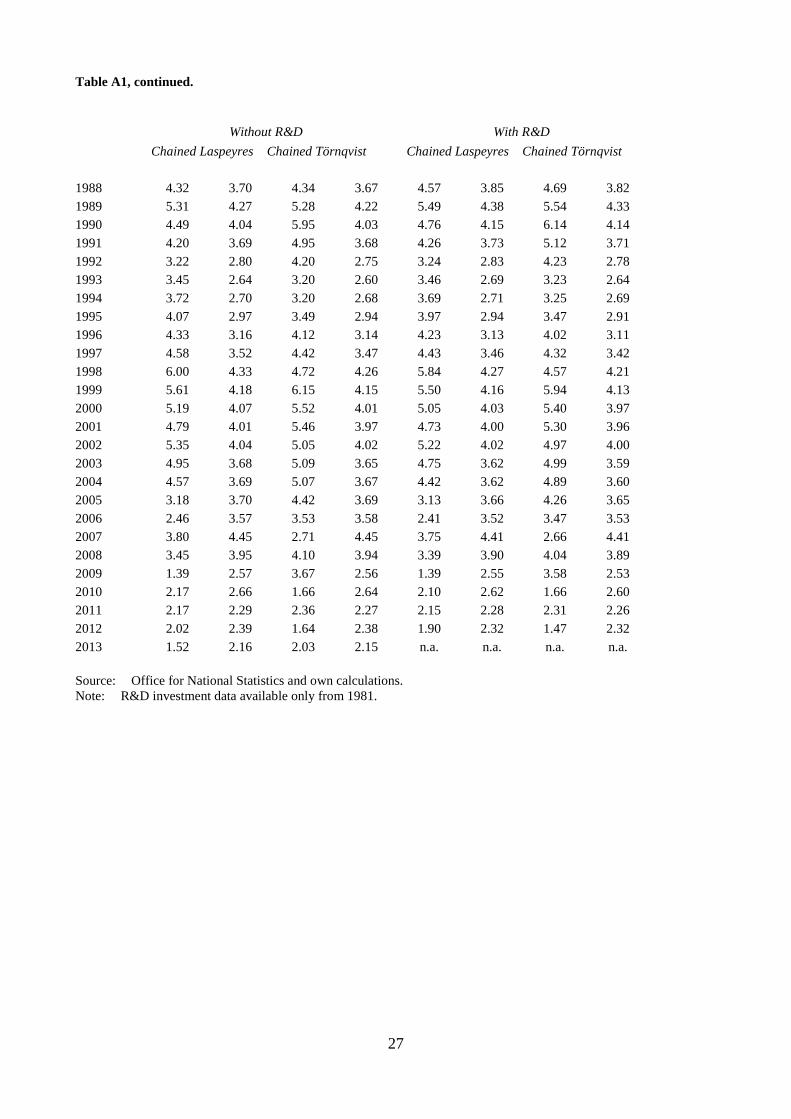
(annual growth rates are in Appendix Table A1). We show growth rates for the VICS and the
capital stock, with and without R&D, and for two index numbers, chained Laspeyres and chained
Törnqvist. The VICS has grown more rapidly than the capital stock over the whole period and
within each sub-period. On the chained Törnqvist measure the difference is about half a percent per
year, 1950-2012; relative to 1950 an index of the VICS is 37% higher in 2012 than an index of the
capital stock. The growth of the VICS has slowed down between the first and second halves of the
whole period, particularly since 2000; the latter period is of course affected by the Great Recession
which commenced in early 2008. Using a chained Törnqvist rather than a chained Laspeyres index
has quite a pronounced effect on the growth rate of the VICS, less on that of the capital stock: using
the Törnqvist raises the VICS growth rate by about 0.2 per cent per year. Finally, the inclusion of
R&D raises the growth rate of the VICS by about 0.2 per cent per year from about 1979 onwards.
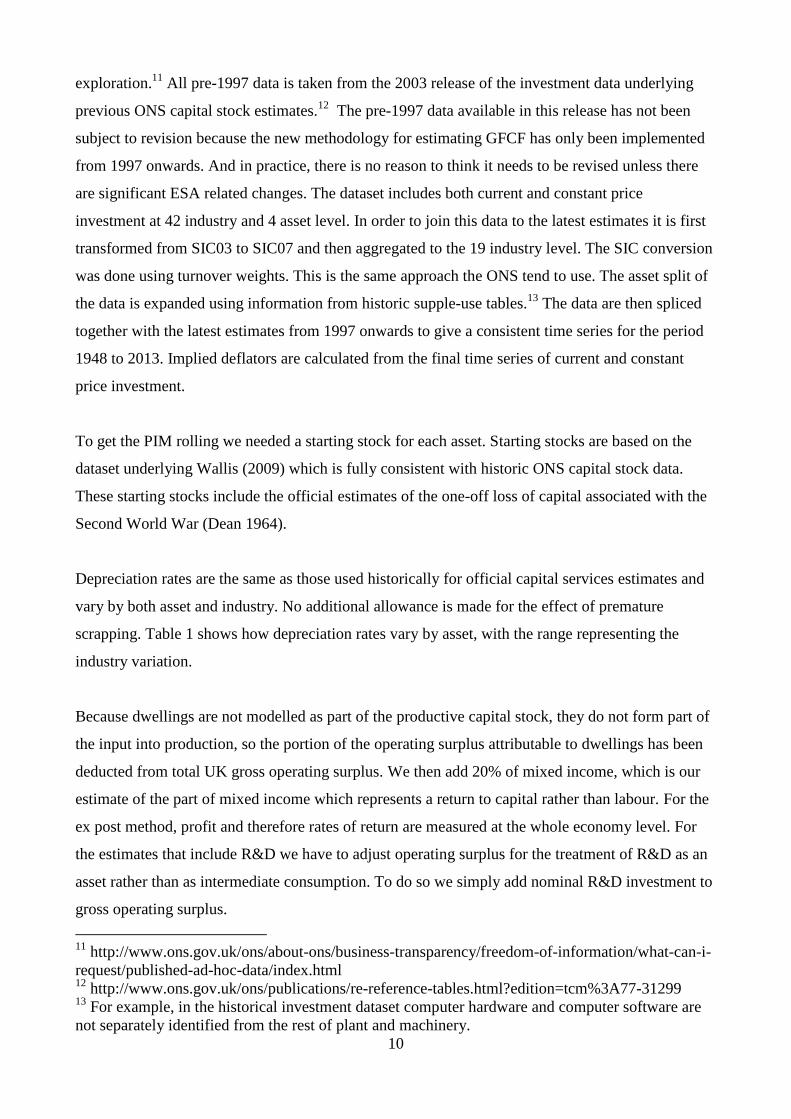
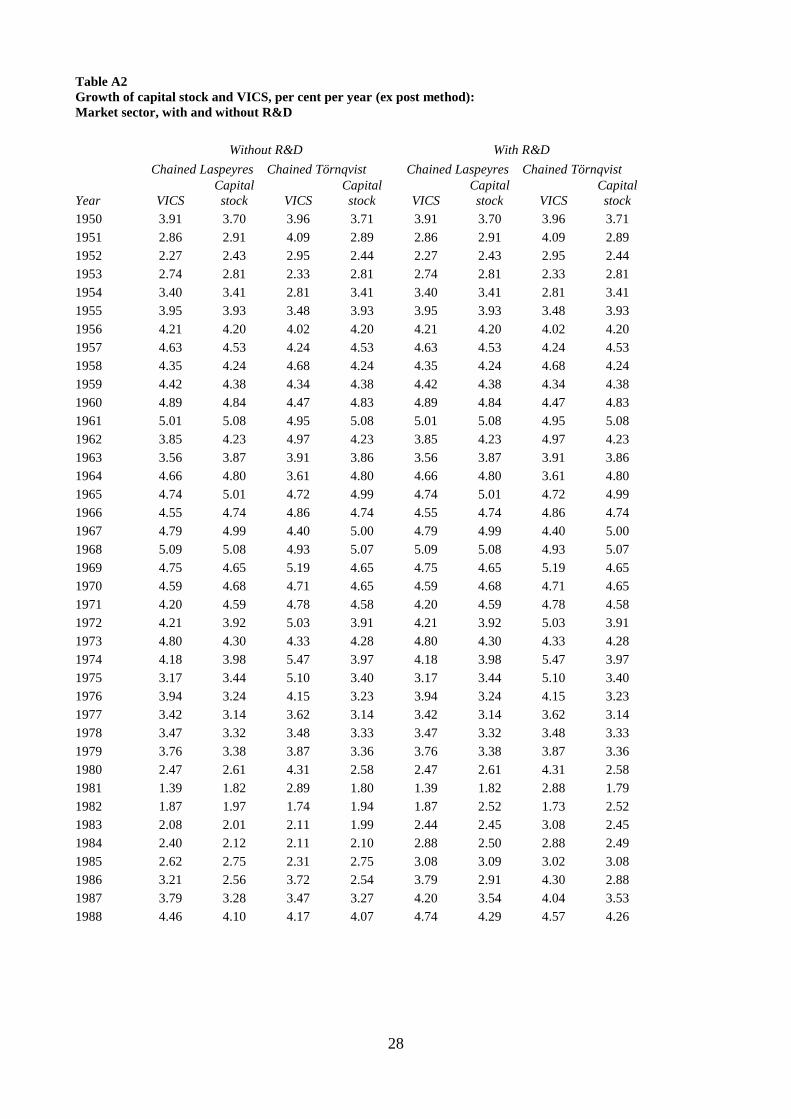
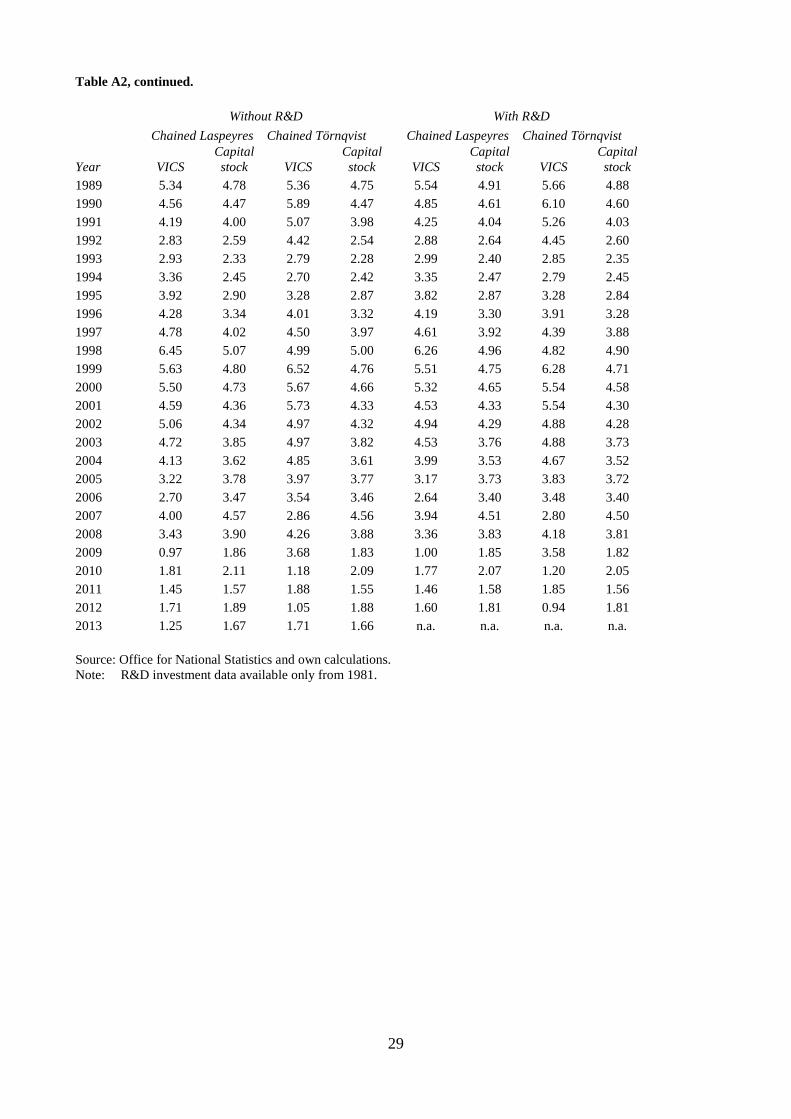
Table 3 shows comparable results for the market sector (i.e. after excluding Public Administration
and defence, Education, and Health), using again the ex post method (annual growth rates are in
Appendix Table A2). Both the VICS and the stock grow a bit faster than in the whole economy. The
difference is about 0.1 per cent per year for the VICS and 0.2 per cent per year for the stock.
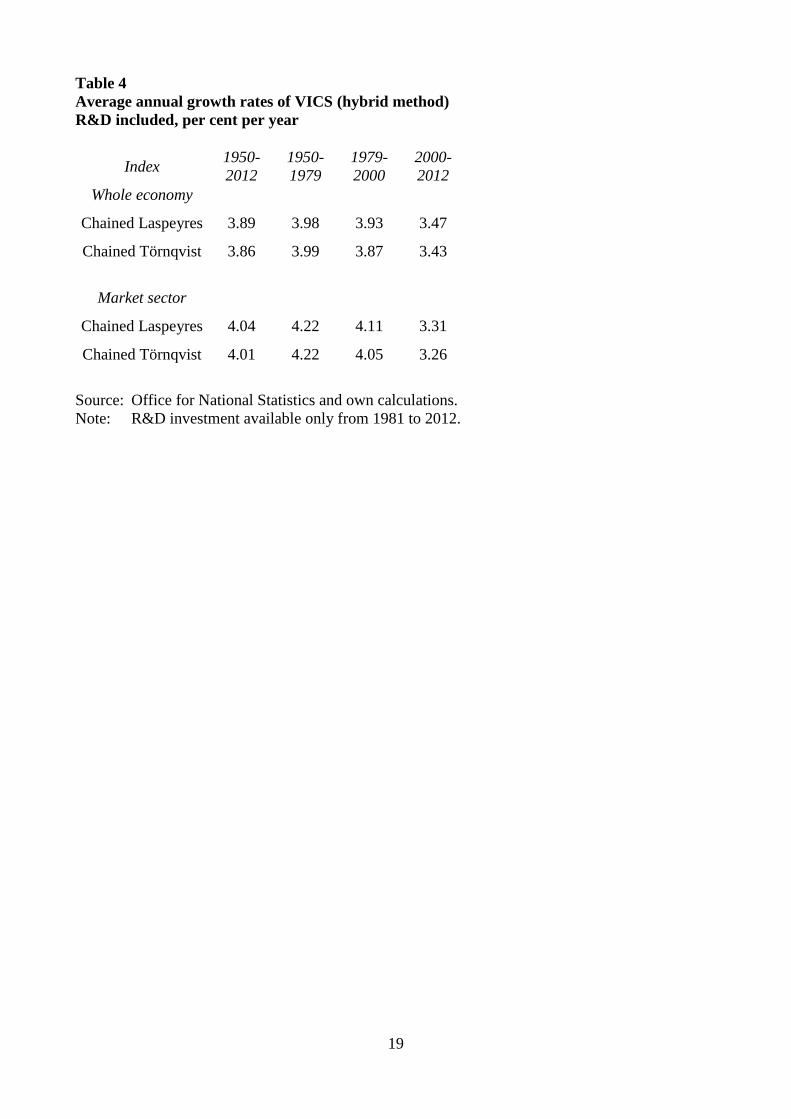
Charts 1 and 2 show the two measures of capital for the whole economy over the whole span 1950-
2012, with R&D included, using the chained Törnqvist index. Chart 2 does the same for the market
sector. The picture is similar in both. The more rapid growth of the VICS in the period from the
1970s up to around the mid-2000s is apparent. Since the Great Recession began this pattern has
reversed, with the stock now growing more rapidly than the VICS.
14
In this paper we do not show the detailed results for the 19 industry groups.

12
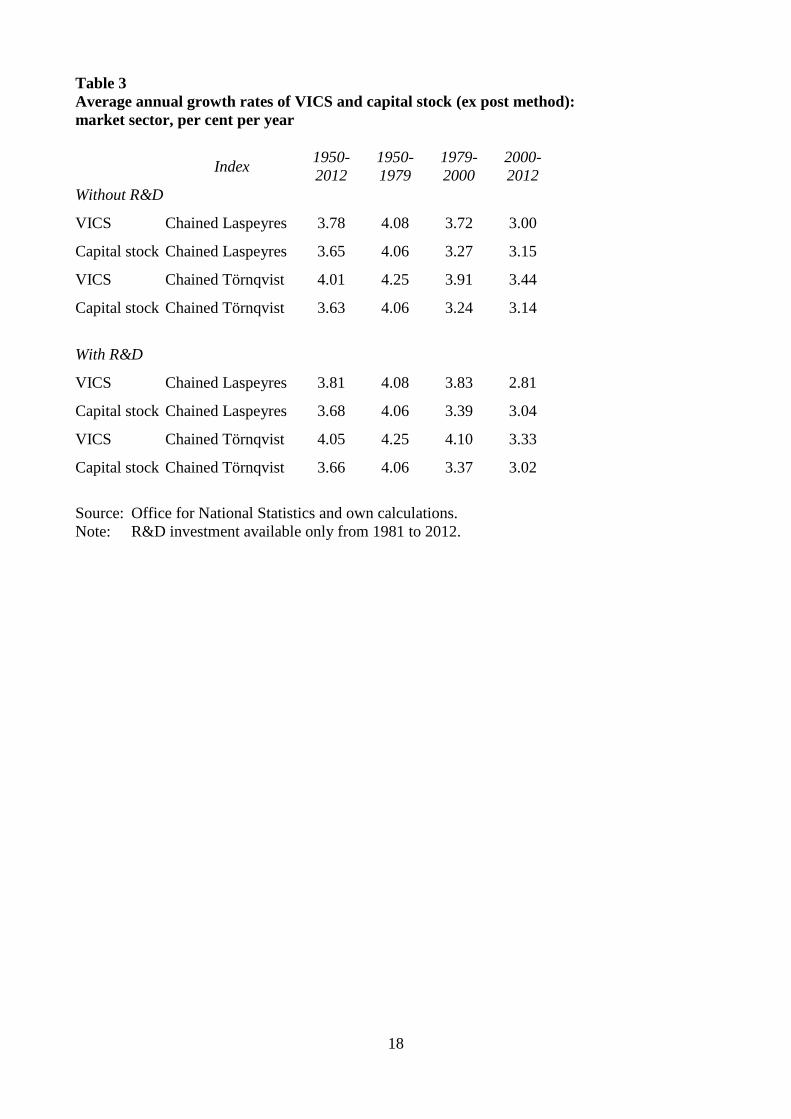
3.3 The hybrid method
To implement the hybrid method we need an estimate of the required real rate of return. Chart 3
shows the actual real rate of return (the nominal rate minus the growth rate of the GDP deflator at
basic prices) in the UK market sector as a whole from 1950-2013. Initially the rate falls but from
about 1965 onwards it appears to fluctuate around a stable mean. We therefore take the time
average, 1965-2013, of the actual rate as our estimate of the required real rate. We use this value,
7.28% per year, for both the market sector and for the whole economy estimates. The growth of the
relative price of each asset was well fitted by an AR(1) model. We therefore take the one-step ahead
forecast from this model as our estimate of the expected growth rate of the relative price of each
asset. The growth of the GDP deflator was also well fitted by an AR(1) model. So we use the one-
step ahead forecast from this model as our estimate of the expected growth rate of the GDP deflator.
When rental prices are estimated in this way it turns out than none of them are negative. By
contrast, under the ex post method 27 rental prices were found to be negative in the market sector;
these were removed by applying a three-year moving average to the ex post rate of return.
The overall pattern of the VICS since 1950 as measured by the hybrid method appears in Chart 4
(whole economy) and Chart 5 (market sector). There is very little difference between the Laspeyres
and the Törnqvist indices. The average annual growth rates of the VICS as estimated by the hybrid
method, with R&D included, are shown in Table 4. We can note that the chained Laspeyres index
and the chained Törnqvist indices are virtually identical, the opposite pattern to that found for the ex
post method (compare Tables 2 and 3).
The ex post and the hybrid methods are compared directly in Charts 6 and 7. Clearly their paths are
very similar, though the VICS grows a little more slowly on the hybrid measure: for the whole
economy the difference is about 0.1 % per year over the whole period, which cumulates to about a
6% difference in the levels in 2012.
3.4 Capital intensity before and after the Great Recession
Between the peak in 2008Q1 and the trough of the recession in 2009Q3, UK labour productivity
(GDP per hour worked) fell by about 4.5%. Though the UK economy is now recovering and GDP
has passed its previous peak level, labour productivity has stagnated. And at the time of writing it is

13
some 15% below what one would have expected based on its previous trend. There have been many
explanations offered for this most unusual behaviour (Oulton 2013) but one possibility is that
capital intensity (capital services per hour worked) fell during the recession and the subsequent
slump. Certainly investment in the market sector fell but this does not necessarily mean that capital
services fell, still less that capital intensity fell.
Chart 8 and Appendix Table A4 show capital intensity in the UK market sector from 1999 onwards;
here the numerator is the hybrid measure of capital services with R&D included and the
denominator is total hours worked in the market sector. We can see that capital intensity actually
rose after the start of the Great Recession in early 2008. It is true that capital intensity has been flat
since 2009 but it is currently about 10% higher than it was at the pre-recession peak. So it seems
that we must seek elsewhere for an explanation of the UK’s labour productivity puzzle. Our PIM
allows for asset sales but does not allow for actual scrapping. If this has been an important factor in
the Great Recession then our estimates of capital services and stocks are overstated. However, there
is no direct evidence in favour of scrapping in the UK. And in the only case where we have
alternative estimates of a stock from tax records, namely vehicles, the evidence goes the other way:
the average age of vehicles has risen. Theoretically the effect of a recession on capital stocks is
ambiguous. Firms in difficulties may scrap assets prematurely but other firms may replace their
assets less frequently so that asset lives get extended. Separate from the issue of the size of the
capital stock is its degree of utilisation. Unfortunately we have no good measure of this either in the
UK.
3.5 Is depreciation rising in importance?
The last twenty five years or so have seen a shift in the composition of investment towards assets
such as computers and software with shorter lives and therefore higher depreciation rates. Does this
mean that the aggregate (average) depreciation rate is rising? If so, this would have implications for
welfare which is more closely related to net domestic product than to gross domestic product. Chart
9 shows the aggregate depreciation rate, computed as total depreciation divided by the aggregate
value of the capital stock, all in current prices. We see that the average depreciation rate rose
steadily from 1950 when it was 4.16% before peaking at 6.23% in 1995. Thereafter it has fallen
steadily to 4.94% in 2012. So the intuition that the depreciation rate should have risen steadily turns
out to be wrong. This is partly because price effects offset quantity effects — the volume of ICT

14
capital has risen rapidly but this has been counteracted by falling ICT prices. Also, investment in
ICT is lower now than in the 1990s.15
Depreciation as a proportion of GDP (both in current prices) shows a similar hump-shaped pattern,
rising from just over 7% in 1950 to peak at just over 12% in 1990; it currently stands at a shade
under 9%. (Chart 9 and Appendix Table A4). In comparing depreciation as a proportion of GDP
with the depreciation rate (depreciation as a proportion of the capital stock) the missing factor is the
capital-output ratio (the capital stock as a ratio to GDP, both in current prices). This ratio appears in
Chart 10 and Appendix Table A4. The capital–output ratio averages about 2 over the whole period
but again shows a hump-shaped patter, peaking at 2.67 in 1981 before declining to1.79 (virtually
the same as in 1950) on the eve of the Great Recession in 2007. The steady decline from 1981 to
2007 is interesting in the light of the claim in Piketty (2014) that the wealth-income ratio has risen
and will likely continue to do so in countries like the UK. In fact the opposite has occurred. Of
course, Piketty’s argument relates to total wealth which includes land, dwellings and net foreign
assets as well as reproducible fixed capital, the assets measured here. But if it is true that there has
been a rising wealth-income ratio in the UK it must be because of increases in the assets omitted
from our estimates, which would be an interesting conclusion in itself.
4. Conclusions
This paper has presented integrated measures of capital stocks and capital services for the UK from
1950 to 2013, for both the market sector and the whole economy. By “integrated” we mean that a
common dataset and a common set of assumptions (e.g. about depreciation rates and asset lives) is
used for the estimates of both stocks and services. So though the concepts of capital stocks and
capital services differ, as is now well understood, the estimates of the two concepts are consistent
with one another.
The main findings are as follows:
1. Aggregate capital services (the VICS) have grown consistently faster than the aggregate
capital stock over the 62 year period 1950-2012, by about 0.5 per cent per year.
2. Adding R&D to the assets covered raises the average growth rate of the VICS by about
0.1% since 1979.
15
There has also been a recent and unexplained downward revision in nominal computer
investment.

15
3. The hybrid method produces slightly slower growth of the VICS than does the ex post one.
However it must be recalled that to get the ex post method to work at all a certain amount of
smoothing is necessary. The hybrid method can be seen as giving a theoretical justification
for smoothing which otherwise would be quite ad hoc.
4. The aggregate depreciation rate increased from 1950 till 1995. But thereafter it has declined.
5. Depreciation (capital consumption) as a proportion of GDP shows a hump-shaped pattern. It
has been declining since 1990. So the gap between NDP and GDP has been falling in recent
years.
6. The capital-output ratio (measured in current prices) also shows a hump-shaped pattern,
peaking in 1981. Thereafter it has declined steadily right up to the start of the Great
Recession in 2008.
7. Finally, capital intensity (capital services per hour worked) continued to rise for some time
after the Great Recession began. In 2013 it was about 10% higher than at the peak of the
boom in 2007.

16
TABLES
Table 1
Depreciation rate ranges by asset type
Asset type Depreciation rate
range
Structures 0.01 to 0.05
Machinery 0.06 to 0.17
Vehicles 0.19
Computer 0.40
Own-account software 0.40
Purchased software 0.40
Mineral exploration 0.20
Artistic originals 0.13
R&D 0.20

17
Table 2
Average annual growth rates of VICS and capital stock (ex post method):
whole economy, per cent per year
Index 1950-
2012
1950-
1979
1979-
2000
2000-
2012
Without R&D
VICS Chained Laspeyres 3.72 3.85 3.74 3.22
Capital stock Chained Laspeyres 3.44 3.73 3.05 3.32
VICS Chained Törnqvist 3.92 4.00 3.92 3.60
Capital stock Chained Törnqvist 3.43 3.72 3.03 3.31
With R&D
VICS Chained Laspeyres 3.73 3.85 3.83 3.02
Capital stock Chained Laspeyres 3.47 3.73 3.15 3.23
VICS Chained Törnqvist 3.96 4.00 4.09 3.48
Capital stock Chained Törnqvist 3.45 3.72 3.12 3.22
Source: Office for National Statistics and own calculations.
Note: R&D investment available only from 1981 to 2012.
18
Table 3
Average annual growth rates of VICS and capital stock (ex post method):
market sector, per cent per year
Index 1950-
2012
1950-
1979
1979-
2000
2000-
2012
Without R&D
VICS Chained Laspeyres 3.78 4.08 3.72 3.00
Capital stock Chained Laspeyres 3.65 4.06 3.27 3.15
VICS Chained Törnqvist 4.01 4.25 3.91 3.44
Capital stock Chained Törnqvist 3.63 4.06 3.24 3.14
With R&D
VICS Chained Laspeyres 3.81 4.08 3.83 2.81
Capital stock Chained Laspeyres 3.68 4.06 3.39 3.04
VICS Chained Törnqvist 4.05 4.25 4.10 3.33
Capital stock Chained Törnqvist 3.66 4.06 3.37 3.02
Source: Office for National Statistics and own calculations.
Note: R&D investment available only from 1981 to 2012.
19
Table 4
Average annual growth rates of VICS (hybrid method)
R&D included, per cent per year
Index 1950-
2012
1950-
1979
1979-
2000
2000-
2012
Whole economy
Chained Laspeyres 3.89 3.98 3.93 3.47
Chained Törnqvist 3.86 3.99 3.87 3.43
Market sector
Chained Laspeyres 4.04 4.22 4.11 3.31
Chained Törnqvist 4.01 4.22 4.05 3.26
Source: Office for National Statistics and own calculations.
Note: R&D investment available only from 1981 to 2012.
20
CHARTS
Chart 1
Chart 2
1
2
3
4
5
6
1950 1955 1960 1965 1970 1975 1980 1985 1990 1995 2000 2005 2010
VICS (Törnqvist) Capital stock (Törnqvist)
Note: R&D included
growth rates, % p.a., market sector, 1950-2012
Capital stocks and capital services in the UK (ex post method)
1
2
3
4
5
6
1950 1955 1960 1965 1970 1975 1980 1985 1990 1995 2000 2005 2010
VICS (Törnqvist) Capital stock (Törnqvist)
Note: R&D included
growth rates, % p.a., whole economy, 1950-2012
Capital stocks and capital services in the UK (ex post method)

21
Chart 3
0
.1
.2
.3
Rea
l ra
te o
f re
turn
1950 1955 1960 1965 1970 1975 1980 1985 1990 1995 2000 2005 2010
Note: R&D included
% p.a., market sector, 1950-2012
Real rate of return in the UK

22
Chart 4
Chart 5
1
2
3
4
5
6
1950 1955 1960 1965 1970 1975 1980 1985 1990 1995 2000 2005 2010
VICS (Laspeyres) VICS (Törnqvist)
Note: R&D included
growth rates, % p.a., whole economy, 1950-2012
Capital services in the UK (hybrid method)
1
2
3
4
5
6
1950 1955 1960 1965 1970 1975 1980 1985 1990 1995 2000 2005 2010
VICS (Laspeyres) VICS (Törnqvist)
Note: R&D included
growth rates, % p.a., market sector, 1950-2012
Capital services in the UK (hybrid method)

23
Chart 6
Chart 7
1
2
3
4
5
6
1950 1955 1960 1965 1970 1975 1980 1985 1990 1995 2000 2005 2010
Hybrid Ex post
Note: R&D included. Chained Törnqvist indices.
Hybrid and ex post estimates of VICS comparedmarket sector, per cent per year
1
2
3
4
5
6
1950 1955 1960 1965 1970 1975 1980 1985 1990 1995 2000 2005 2010
Hybrid Ex post
Note: R&D included. Chained Törnqvist indices.
Hybrid and ex post estimates of VICS comparedwhole economy, per cent per year

24
Chart 8
100
110
120
130
140
150
Capital in
tensity
1999 2000 2001 2002 2003 2004 2005 2006 2007 2008 2009 2010 2011 2012Note: R&D included
Capital intensity in the UK market sectorlog scale, 1999=100

25
Chart 9
Chart 10
2
4
6
8
10
12
1950 1955 1960 1965 1970 1975 1980 1985 1990 1995 2000 2005 2010
Capital consumption, % of GDP Depreciation rate, %
Note: R&D included. Depreciation, net assets and GDP in current prices.
% of GDP and % of net assets, whole economy, 1950-2012
Capital consumption and depreciation rate in the UK
1.8
2
2.2
2.4
2.6
Capital-outp
ut ra
tio
1950 1955 1960 1965 1970 1975 1980 1985 1990 1995 2000 2005 2010Note: R&D included. Capital (net assets) and GDP in current prices.
whole economy, 1950-2012
Capital-output ratio in the UK

26
APPENDIX TABLES
Table A1
Growth of capital stock and VICS, per cent per year (ex post method):
Whole economy, with and without R&D
Without R&D With R&D
Chained Laspeyres Chained Törnqvist Chained Laspeyres Chained Törnqvist
Year VICS
Capital
stock VICS
Capital
stock VICS
Capital
stock VICS
Capital
stock
1950 3.15 2.79 3.13 2.80 3.15 2.79 3.13 2.80
1951 2.33 2.38 3.51 2.37 2.33 2.38 3.51 2.37
1952 2.08 2.05 2.65 2.06 2.08 2.05 2.65 2.06
1953 2.35 2.39 1.99 2.39 2.35 2.39 1.99 2.39
1954 2.82 2.82 2.45 2.82 2.82 2.82 2.45 2.82
1955 3.31 3.19 3.02 3.19 3.31 3.19 3.02 3.19
1956 3.66 3.47 3.45 3.47 3.66 3.47 3.45 3.47
1957 3.98 3.73 3.66 3.73 3.98 3.73 3.66 3.73
1958 3.83 3.65 3.97 3.66 3.83 3.65 3.97 3.66
1959 3.61 3.50 3.81 3.50 3.61 3.50 3.81 3.50
1960 4.36 4.26 3.75 4.25 4.36 4.26 3.75 4.25
1961 4.64 4.57 4.51 4.57 4.64 4.57 4.51 4.57
1962 3.78 4.11 4.57 4.11 3.78 4.11 4.57 4.11
1963 3.60 3.84 3.86 3.84 3.60 3.84 3.86 3.84
1964 4.65 4.70 3.65 4.70 4.65 4.70 3.65 4.70
1965 4.60 4.79 4.62 4.78 4.60 4.79 4.62 4.78
1966 4.29 4.58 4.64 4.58 4.29 4.58 4.64 4.58
1967 4.82 4.96 4.32 4.96 4.82 4.96 4.32 4.96
1968 5.15 5.10 4.95 5.09 5.15 5.10 4.95 5.09
1969 4.79 4.66 5.28 4.65 4.79 4.66 5.28 4.65
1970 4.69 4.73 4.75 4.71 4.69 4.73 4.75 4.71
1971 4.36 4.62 4.85 4.62 4.36 4.62 4.85 4.62
1972 4.39 4.05 5.17 4.04 4.39 4.05 5.17 4.04
1973 4.91 4.34 4.53 4.33 4.91 4.34 4.53 4.33
1974 4.35 3.82 5.47 3.80 4.35 3.82 5.47 3.80
1975 3.42 3.26 5.21 3.23 3.42 3.26 5.21 3.23
1976 4.13 3.07 4.14 3.07 4.13 3.07 4.14 3.07
1977 3.07 2.75 3.43 2.75 3.07 2.75 3.43 2.75
1978 2.91 2.80 3.08 2.81 2.91 2.80 3.08 2.81
1979 3.40 2.85 3.52 2.83 3.40 2.85 3.52 2.83
1980 2.43 2.27 4.10 2.24 2.43 2.27 4.09 2.24
1981 1.36 1.62 2.77 1.61 1.36 1.62 2.76 1.60
1982 1.84 1.86 1.60 1.84 1.83 2.27 1.59 2.28
1983 2.02 1.93 2.04 1.92 2.32 2.26 2.85 2.26
1984 2.33 2.04 2.07 2.03 2.73 2.33 2.75 2.32
1985 2.53 2.59 2.27 2.58 2.94 2.84 2.92 2.83
1986 3.60 2.65 3.87 2.63 4.11 2.91 4.41 2.89
1987 3.95 3.13 3.99 3.11 4.31 3.32 4.49 3.31
27
Table A1, continued.
Without R&D With R&D
Chained Laspeyres Chained Törnqvist Chained Laspeyres Chained Törnqvist
1988 4.32 3.70 4.34 3.67 4.57 3.85 4.69 3.82
1989 5.31 4.27 5.28 4.22 5.49 4.38 5.54 4.33
1990 4.49 4.04 5.95 4.03 4.76 4.15 6.14 4.14
1991 4.20 3.69 4.95 3.68 4.26 3.73 5.12 3.71
1992 3.22 2.80 4.20 2.75 3.24 2.83 4.23 2.78
1993 3.45 2.64 3.20 2.60 3.46 2.69 3.23 2.64
1994 3.72 2.70 3.20 2.68 3.69 2.71 3.25 2.69
1995 4.07 2.97 3.49 2.94 3.97 2.94 3.47 2.91
1996 4.33 3.16 4.12 3.14 4.23 3.13 4.02 3.11
1997 4.58 3.52 4.42 3.47 4.43 3.46 4.32 3.42
1998 6.00 4.33 4.72 4.26 5.84 4.27 4.57 4.21
1999 5.61 4.18 6.15 4.15 5.50 4.16 5.94 4.13
2000 5.19 4.07 5.52 4.01 5.05 4.03 5.40 3.97
2001 4.79 4.01 5.46 3.97 4.73 4.00 5.30 3.96
2002 5.35 4.04 5.05 4.02 5.22 4.02 4.97 4.00
2003 4.95 3.68 5.09 3.65 4.75 3.62 4.99 3.59
2004 4.57 3.69 5.07 3.67 4.42 3.62 4.89 3.60
2005 3.18 3.70 4.42 3.69 3.13 3.66 4.26 3.65
2006 2.46 3.57 3.53 3.58 2.41 3.52 3.47 3.53
2007 3.80 4.45 2.71 4.45 3.75 4.41 2.66 4.41
2008 3.45 3.95 4.10 3.94 3.39 3.90 4.04 3.89
2009 1.39 2.57 3.67 2.56 1.39 2.55 3.58 2.53
2010 2.17 2.66 1.66 2.64 2.10 2.62 1.66 2.60
2011 2.17 2.29 2.36 2.27 2.15 2.28 2.31 2.26
2012 2.02 2.39 1.64 2.38 1.90 2.32 1.47 2.32
2013 1.52 2.16 2.03 2.15 n.a. n.a. n.a. n.a.
Source: Office for National Statistics and own calculations.
Note: R&D investment data available only from 1981.
28
Table A2
Growth of capital stock and VICS, per cent per year (ex post method):
Market sector, with and without R&D
Without R&D With R&D
Chained Laspeyres Chained Törnqvist Chained Laspeyres Chained Törnqvist
Year VICS
Capital
stock VICS
Capital
stock VICS
Capital
stock VICS
Capital
stock
1950 3.91 3.70 3.96 3.71 3.91 3.70 3.96 3.71
1951 2.86 2.91 4.09 2.89 2.86 2.91 4.09 2.89
1952 2.27 2.43 2.95 2.44 2.27 2.43 2.95 2.44
1953 2.74 2.81 2.33 2.81 2.74 2.81 2.33 2.81
1954 3.40 3.41 2.81 3.41 3.40 3.41 2.81 3.41
1955 3.95 3.93 3.48 3.93 3.95 3.93 3.48 3.93
1956 4.21 4.20 4.02 4.20 4.21 4.20 4.02 4.20
1957 4.63 4.53 4.24 4.53 4.63 4.53 4.24 4.53
1958 4.35 4.24 4.68 4.24 4.35 4.24 4.68 4.24
1959 4.42 4.38 4.34 4.38 4.42 4.38 4.34 4.38
1960 4.89 4.84 4.47 4.83 4.89 4.84 4.47 4.83
1961 5.01 5.08 4.95 5.08 5.01 5.08 4.95 5.08
1962 3.85 4.23 4.97 4.23 3.85 4.23 4.97 4.23
1963 3.56 3.87 3.91 3.86 3.56 3.87 3.91 3.86
1964 4.66 4.80 3.61 4.80 4.66 4.80 3.61 4.80
1965 4.74 5.01 4.72 4.99 4.74 5.01 4.72 4.99
1966 4.55 4.74 4.86 4.74 4.55 4.74 4.86 4.74
1967 4.79 4.99 4.40 5.00 4.79 4.99 4.40 5.00
1968 5.09 5.08 4.93 5.07 5.09 5.08 4.93 5.07
1969 4.75 4.65 5.19 4.65 4.75 4.65 5.19 4.65
1970 4.59 4.68 4.71 4.65 4.59 4.68 4.71 4.65
1971 4.20 4.59 4.78 4.58 4.20 4.59 4.78 4.58
1972 4.21 3.92 5.03 3.91 4.21 3.92 5.03 3.91
1973 4.80 4.30 4.33 4.28 4.80 4.30 4.33 4.28
1974 4.18 3.98 5.47 3.97 4.18 3.98 5.47 3.97
1975 3.17 3.44 5.10 3.40 3.17 3.44 5.10 3.40
1976 3.94 3.24 4.15 3.23 3.94 3.24 4.15 3.23
1977 3.42 3.14 3.62 3.14 3.42 3.14 3.62 3.14
1978 3.47 3.32 3.48 3.33 3.47 3.32 3.48 3.33
1979 3.76 3.38 3.87 3.36 3.76 3.38 3.87 3.36
1980 2.47 2.61 4.31 2.58 2.47 2.61 4.31 2.58
1981 1.39 1.82 2.89 1.80 1.39 1.82 2.88 1.79
1982 1.87 1.97 1.74 1.94 1.87 2.52 1.73 2.52
1983 2.08 2.01 2.11 1.99 2.44 2.45 3.08 2.45
1984 2.40 2.12 2.11 2.10 2.88 2.50 2.88 2.49
1985 2.62 2.75 2.31 2.75 3.08 3.09 3.02 3.08
1986 3.21 2.56 3.72 2.54 3.79 2.91 4.30 2.88
1987 3.79 3.28 3.47 3.27 4.20 3.54 4.04 3.53
1988 4.46 4.10 4.17 4.07 4.74 4.29 4.57 4.26
29
Table A2, continued.
Without R&D With R&D
Chained Laspeyres Chained Törnqvist Chained Laspeyres Chained Törnqvist
Year VICS
Capital
stock VICS
Capital
stock VICS
Capital
stock VICS
Capital
stock
1989 5.34 4.78 5.36 4.75 5.54 4.91 5.66 4.88
1990 4.56 4.47 5.89 4.47 4.85 4.61 6.10 4.60
1991 4.19 4.00 5.07 3.98 4.25 4.04 5.26 4.03
1992 2.83 2.59 4.42 2.54 2.88 2.64 4.45 2.60
1993 2.93 2.33 2.79 2.28 2.99 2.40 2.85 2.35
1994 3.36 2.45 2.70 2.42 3.35 2.47 2.79 2.45
1995 3.92 2.90 3.28 2.87 3.82 2.87 3.28 2.84
1996 4.28 3.34 4.01 3.32 4.19 3.30 3.91 3.28
1997 4.78 4.02 4.50 3.97 4.61 3.92 4.39 3.88
1998 6.45 5.07 4.99 5.00 6.26 4.96 4.82 4.90
1999 5.63 4.80 6.52 4.76 5.51 4.75 6.28 4.71
2000 5.50 4.73 5.67 4.66 5.32 4.65 5.54 4.58
2001 4.59 4.36 5.73 4.33 4.53 4.33 5.54 4.30
2002 5.06 4.34 4.97 4.32 4.94 4.29 4.88 4.28
2003 4.72 3.85 4.97 3.82 4.53 3.76 4.88 3.73
2004 4.13 3.62 4.85 3.61 3.99 3.53 4.67 3.52
2005 3.22 3.78 3.97 3.77 3.17 3.73 3.83 3.72
2006 2.70 3.47 3.54 3.46 2.64 3.40 3.48 3.40
2007 4.00 4.57 2.86 4.56 3.94 4.51 2.80 4.50
2008 3.43 3.90 4.26 3.88 3.36 3.83 4.18 3.81
2009 0.97 1.86 3.68 1.83 1.00 1.85 3.58 1.82
2010 1.81 2.11 1.18 2.09 1.77 2.07 1.20 2.05
2011 1.45 1.57 1.88 1.55 1.46 1.58 1.85 1.56
2012 1.71 1.89 1.05 1.88 1.60 1.81 0.94 1.81
2013 1.25 1.67 1.71 1.66 n.a. n.a. n.a. n.a.
Source: Office for National Statistics and own calculations.
Note: R&D investment data available only from 1981.

30
Table A3
Growth of VICS, per cent per year, R&D included (hybrid method):
Whole economy Market sector
Year
Chained
Laspeyres
Chained
Törnqvist Chained
Laspeyres
Chained
Törnqvist 1950 3.69 3.59 4.55 4.47
1951 3.43 3.57 4.23 4.34
1952 2.66 2.81 2.97 3.04
1953 2.19 2.10 2.26 2.23
1954 2.52 2.50 2.80 2.80
1955 3.00 3.04 3.49 3.51
1956 3.49 3.64 4.08 4.12
1957 3.99 3.88 4.33 4.30
1958 4.18 4.16 4.80 4.80
1959 3.97 3.93 4.46 4.44
1960 3.77 3.79 4.50 4.50
1961 4.53 4.60 4.99 5.01
1962 4.65 4.62 4.91 4.89
1963 3.76 3.78 3.68 3.70
1964 3.62 3.60 3.49 3.45
1965 4.69 4.67 4.65 4.65
1966 4.68 4.67 4.74 4.74
1967 4.41 4.38 4.43 4.38
1968 4.98 4.99 4.92 4.94
1969 5.21 5.23 5.14 5.17
1970 4.74 4.72 4.70 4.68
1971 4.75 4.74 4.68 4.67
1972 5.06 5.04 5.05 5.02
1973 4.48 4.47 4.44 4.42
1974 5.08 5.25 5.13 5.28
1975 4.55 4.54 4.63 4.63
1976 3.49 3.52 3.54 3.62
1977 3.52 3.40 3.68 3.57
1978 3.10 3.06 3.53 3.49
1979 3.13 3.21 3.69 3.76
1980 3.47 3.55 3.99 4.03
1981 2.65 2.60 2.83 2.75
1982 1.39 1.40 1.41 1.44
1983 2.76 2.68 3.05 2.95
1984 2.57 2.58 2.77 2.79
1985 2.75 2.73 2.99 2.96
1986 4.05 4.05 4.33 4.30
1987 4.34 4.33 4.20 4.16
1988 4.69 4.54 4.78 4.65
1989 5.09 5.13 5.48 5.51
1990 5.88 5.94 6.24 6.16
1991 5.21 5.02 5.29 5.20
1992 4.24 4.16 4.43 4.39
1993 2.95 2.90 2.65 2.59
1994 3.06 2.98 2.72 2.64
1995 3.34 3.31 3.26 3.23
1996 4.10 4.04 4.24 4.14
1997 4.45 4.29 4.71 4.56
1998 4.51 4.40 4.96 4.86
1999 5.72 5.58 6.42 6.24

31
Table A3, continued.
2000 5.31 5.16 5.67 5.54
2001 4.96 4.78 5.47 5.26
2002 4.80 4.71 4.85 4.82
2003 4.84 4.76 4.88 4.83
2004 4.61 4.57 4.64 4.60
2005 4.29 4.24 3.97 3.92
2006 3.49 3.48 3.45 3.44
2007 2.70 2.72 2.70 2.71
2008 4.04 4.02 4.10 4.08
2009 3.54 3.54 3.41 3.41
2010 1.59 1.58 0.89 0.88
2011 2.28 2.31 1.77 1.78
2012 1.97 1.84 1.22 1.09
Source: Office for National Statistics and own calculations.
Note: R&D investment data available only from 1981-2012.

32
Table A4
Capital consumption, depreciation rate, capital-output ratio, and
capital intensity(whole economy, R&D included)
Capital con-
sumption
Depreciation
rate
Capital-
output ratio
Capital
intensity
year % of GDP % Ratio 1999=100
1950 7.08 4.16 1.78 n.a.
1951 7.28 4.53 1.87 n.a.
1952 7.59 4.42 1.91 n.a.
1953 7.34 4.13 1.80 n.a.
1954 7.19 4.24 1.75 n.a.
1955 7.36 4.51 1.79 n.a.
1956 7.59 4.57 1.82 n.a.
1957 7.82 4.55 1.84 n.a.
1958 7.99 4.53 1.85 n.a.
1959 7.86 4.48 1.78 n.a.
1960 7.80 4.69 1.77 n.a.
1961 7.99 4.78 1.81 n.a.
1962 8.08 4.67 1.84 n.a.
1963 8.00 4.61 1.87 n.a.
1964 7.88 4.57 1.85 n.a.
1965 8.01 4.66 1.85 n.a.
1966 8.19 4.70 1.90 n.a.
1967 8.05 4.50 1.88 n.a.
1968 8.10 4.64 1.89 n.a.
1969 8.27 4.69 1.94 n.a.
1970 8.58 4.87 1.98 n.a.
1971 8.88 5.04 2.03 n.a.
1972 8.88 4.93 2.06 n.a.
1973 9.02 5.07 2.16 n.a.
1974 9.75 5.15 2.45 n.a.
1975 9.91 5.11 2.48 n.a.
1976 10.24 4.85 2.47 n.a.
1977 10.40 4.88 2.39 n.a.
1978 10.36 5.01 2.35 n.a.
1979 10.55 5.23 2.42 n.a.
1980 10.89 5.22 2.62 n.a.
1981 11.22 4.73 2.67 n.a.
1982 11.30 4.59 2.54 n.a.
1983 11.07 4.77 2.39 n.a.
1984 11.43 5.10 2.34 n.a.
1985 11.54 5.40 2.30 n.a.
1986 11.80 5.49 2.30 n.a.
1987 11.79 5.65 2.24 n.a.
1988 11.57 5.78 2.20 n.a.
1989 11.91 5.97 2.29 n.a.
1990 12.03 5.72 2.29 n.a.
1991 11.96 5.46 2.20 n.a.
1992 11.35 5.39 2.03 n.a.
1993 11.21 5.83 1.93 n.a.
1994 11.32 6.22 1.92 n.a.
1995 11.33 6.23 1.93 n.a.
1996 11.24 6.21 1.89 n.a.
1997 10.82 6.06 1.83 n.a.
1998 10.66 6.13 1.81 n.a.
1999 10.71 6.21 1.83 100.0

33
Table A4, continued.
2000 10.49 6.02 1.83 105.5
2001 10.25 5.89 1.82 110.1
2002 10.15 5.85 1.82 116.3
2003 9.90 5.79 1.77 122.0
2004 9.70 5.78 1.78 126.8
2005 9.47 5.61 1.79 130.5
2006 9.10 5.38 1.79 133.8
2007 8.85 5.22 1.79 135.9
2008 8.98 5.18 1.83 140.7
2009 9.43 5.03 1.96 151.4
2010 9.31 4.93 1.90 151.4
2011 9.30 5.02 1.93 152.6
2012 9.39 4.94 1.95 150.5
Source: Office for National Statistics and own calculations.
Note: R&D investment data available only from 1981-2012.
Key: Capital consumption: aggregate depreciation as % of GDP at basic prices, current prices, whole economy.
Depreciation rate: aggregate depreciation as % of aggregate net stock of capital, %, whole economy.
Capital-output ratio: ratio of aggregate net stock of capital to GDP at basic prices, current prices,
whole economy.
Capital intensity: aggregate capital services (hybrid method) divided by aggregate hours worked,
market sector, 1999=100.0.

34
References
Appleton, J. and G. Wallis (2011). “Volume of capital services: new annual and quarterly estimates
for 1950 to 2009”. Economic & Labour Market Review, Vol. 5, No. 5, pp 46-66.
Berndt, E.R. (1990), “Comments on Hulten”, in E.R Berndt and J. Triplett, eds., Fifty Years of
Economic Measurement, Chicago University Press, Chicago and London.
Berndt, E.R. and M.A. Fuss (1986), “Productivity measurement with adjustments for variations in
capacity utilisation and other forms of temporary equilibrium”, Journal of Econometrics, vol. 33,
pages 7-29.
Christensen, L. and D.W. Jorgenson (1969), “The measurement of U.S. real capital input, 1929-
1967”, Review of Income and Wealth, series 15, no. 4 (December), pages 293-320.
Dean, G. (1964), ‘The stock of fixed assets in the United Kingdom in 1961’, Journal of the Royal
Statistical Society, Series A, Vol. 127, pages 327-52.
Diewert, W.E. (1980), ‘Aggregation problems in the measurement of capital’, in Usher, D (ed), The
measurement of capital, Studies in Income and Wealth No. 45, pages 433-528, Chicago: The
University of Chicago Press.
Diewert, W.E. (2001), ‘Measuring the price and quantity of capital services under alternative
assumptions’, Department of Economics, University of British Columbia, Discussion Paper no.
01-24.
Erumban, A. A. (2008). “Rental prices, rates of return, capital aggregation and productivity:
evidence from EU and US”, CESifo Economic Studies , 54(3), pp. 499-533.
Fraumeni, B.M. (1997). ‘The measurement of depreciation in the U.S. national income and product
accounts’, Survey of Current Business, (July), pages 7-23.
Goodridge, P, J Haskel and G Wallis (2013). “Can intangible investment explain the UK
productivity puzzle?” National Institute Economic Review, No. 224 (May), pages R48-R58.
Griliches, Z. and D. W. Jorgenson (1967). “The explanation of productivity change”. Review of
Economic Studies, 34, 249-283. Reprinted in D.W. Jorgenson, Productivity: Volume 1: Postwar
U.S. Economic Growth. Cambridge, MA: The MIT Press.
Hall, R.E. and D.W. Jorgenson (1967), “Tax policy and investment behaviour”, American
Economic Review, 57, pages 391-414.
Inklaar, R. (2008). “The sensitivity of capital services measurement: measure all assets and the cost
of capital”. EU KLEMS Working Paper no. 26.
Jorgenson, D.W. (1989), “Capital as a factor of production”, in D.W. Jorgenson, and R. Landau,
eds., Technology and Capital Formation, The MIT Press, Cambridge, MA.

35
Jorgenson, D.W., F.M. Gollop and B.M. Fraumeni (1987), Productivity and U.S. Economic
Growth, Harvard University Press, Cambridge, MA.
OECD (2001), OECD Productivity Manual: A Guide to the Measurement of Industry-Level and
Aggregate Productivity Growth, Paris: OECD.
OECD (2009), Measuring Capital: OECD Manual 2009: 2nd
Edition, OECD, Paris. Available at
http://www.oecd.org/dataoecd/16/16/43734711.pdf.
O’Mahony, M. and M.P. Timmer (2009), ‘Output, Input and Productivity Measures at the Industry
Level: the EU KLEMS Database’, The Economic Journal, 119 (June), F374-F403.
Oulton, N (2001), ‘Measuring capital services in the United Kingdom’, Bank of England Quarterly
Bulletin, Autumn, pages 295-309.
Oulton, N. (2007), “Ex post versus ex ante measures of the user cost of capital”, Review of Income
and Wealth, Series 53, No. 2 (June), pages 295-317.
Oulton, N. (2013), “Medium and long run prospects for UK growth in the aftermath of the financial
crisis”. Centre for Economic Performance, Occasional Paper No. 37, October 2013, and Centre
for Macroeconomics Discussion Paper No. CFMDP2013-7, December 2013.
http://cep.lse.ac.uk/pubs/download/occasional/op037.pdf
Oulton, N. and S. Srinivasan (2003), ‘Capital stocks, capital services, and depreciation: an
integrated framework’, Bank of England Working Paper no. 192. Available at
http://www.bankofengland.co.uk/workingpapers/wp192.pdf.
Oulton, N. and A. Rincon-Aznar (2012), “Rates of return and alternative measures of capital input:
14 countries and 10 branches, 1971-2005”. In Industrial Productivity in Europe: Growth and
Crisis, edited by Matilde Mas amd Robert Stehrer, Edward Elgar.
Piketty, T. (2014). Capital in the Twenty First Century. Cambridge, MA: The Bellknap Press of
Harvard University Press.
Redfern, P (1955), ‘Net investment in fixed assets in the United Kingdom, 1938-55’, Journal of the
Royal Statistical Society, Series A, Vol. 118, pages 141-82.
Schreyer, P. (2002), “Computer price indices and international growth and productivity
comparisons”, Review of Income and Wealth, 48(1), 15-31.
Vaze, P., I. Hill, A. Evans, N. Giritli and J. Foroma (2003), “Capital Stocks, Capital Consumption
and Non-Financial Balance Sheets”. Office for National Statistics. Available at
capital_stocks_tcm77-237435.pdf.
Wallis, G. (2009). Capital services growth in the UK: 1950 to 2006. Oxford Bulletin of Economics
and Statistics, 71(6), December, pages 799-819.
Wallis, G. (2012) “Essays in Understanding Investment”. Available at http://discovery.ucl.ac.uk/
1369637/1/GW_Thesis.pdf.
Related Documents