Equation Chapter 2 Section 1 MASTER THESIS Structural Design and Analysis of a Solar Array Substrate for a GEO Satellite Ömer ŞAFAK SUPERVISED BY José Ignacio Velasco Gürbüz Gülersoy Universitat Politècnica de Catalunya Master in Aerospace Science & Technology May 2013

Welcome message from author
This document is posted to help you gain knowledge. Please leave a comment to let me know what you think about it! Share it to your friends and learn new things together.
Transcript

Equation Chapter 2 Section 1
MASTER THESIS
Structural Design and Analysis of a Solar Array Substrate for a GEO
Satellite
Ömer ŞAFAK
SUPERVISED BY
José Ignacio Velasco Gürbüz Gülersoy
Universitat Politècnica de Catalunya
Master in Aerospace Science & Technology
May 2013

This Page Intentionally Left Blank
Structural Design and Analysis of a Solar Array Substrate for a GEO Satellite
BY
Omer SAFAK
DIPLOMA THESIS FOR DEGREE
Master in Aerospace Science and Technology
AT
Universitat Politècnica de Catalunya
SUPERVISED BY:
José Ignacio Velasco Catalan Center of Plastics
Department of Materials Science and Metallurgical Engineering
Gürbüz Gülersoy BİLUZAY Space Technologies Research Center
Mechanical Design Manager Production Manager

I hereby declare that all information in this document has been obtained and presented in accordance with academic rules and ethical conduct. I also declare that, as required by these rules and conduct, I have fully cited and referenced all material and results that are not original to this work.
Name, Last name: Ömer ŞAFAK
Signature :

ABSTRACT The aim of this thesis is the design of solar array substrate for a geostationary satellite. The design of deployable solar array substrate is realized based on the requirements which are provided by BILUZAY (Bilkent University Space Technologies Research Centre). This array is going to empower a telecommunication satellite which will be operating in a geostationary orbit during 15 years. The main work presented in this thesis consists of two principal directions: solar cell array area dimensioning and structural design and analysis of its substrate under launch loads. First of all, based on the power requirements of the satellite, total area of the solar array is calculated considering eclipse time, worst case scenarios for voltage and power output. Later on based on total solar array area; rigid solar panels are dimensioned according to the solar cells in parallel and series considering spacecraft constraints. Two different geometries are formed considering different number of solar panels in each case. According to the bus voltage and power output, number of solar cells which are connected in parallel and series are calculated for each panel. Solar panel deployment mechanism solutions are evaluated according to their advantages and disadvantages. A trade-off analysis between proven deployment mechanism solutions is performed to be able to choose best convenient mechanism. Structural design and analysis these two geometries for the solar array substrate is performed in detail. Array substrate structure i.e. sandwich structures along with face materials mainly carbon fiber reinforced and core materials such as honeycombs, foams are profoundly evaluated. Several candidate materials for the core and face of the substrate are selected to be employed in finite element analysis in order to obtain best performance materials that will minimize the mass of the array. Due to the fact that the structure shall be stiff enough to fulfill the natural frequency constrain of the launch vehicle and survive under harsh launch loads, selection criterion of the materials is driven by high specific stiffness. Finite element model of the candidate substrate geometries in stowed configuration are created in Msc Patran employing shell elements. Material properties for the honeycomb structure are defined considering sandwich theory. The influences of the face, core materials and thicknesses, ply orientations, restrain locations are valued during numerous frequency analyses in order to obtain best performance materials and configurations considering thermal properties and operating conditions. Ultimate dimensions for the core and face thicknesses are obtained with selected materials and verified that these frequencies are higher enough to prevent resonance coupling with the components they are attached. These geometries are assessed in static analysis by applying launch induced loads i.e. inertial loads. These are obtained by combining random vibration loads which are converted into static load factors, and steady state acceleration loads. Results of these analyses with stress levels in the face and core materials are plotted for both geometries. According to the material strength limits, margin of safety is .calculated for each case and failed materials are eliminated. Tradeoff between two geometries is performed and best geometry is selected considering total array mass and deployment issues. Keywords: Solar array substrate, sandwich structures, CFRP, FEA, frequency,


ACKNOWLEDGEMENTS First of all, I would like express my very great appreciation to my supervisor Prof. José Ignacio Velasco for his valuable and constructive suggestions and enthusiastic encouragement during planning and development of this research. His willingness to give his time so generously has been very much appreciated. In addition, his teaching course of Composite Materials for Aerospace Applications, and laboratory sessions with Edgar Alan Franco was more than helpful and it is my initial reference for composite materials. I would like to thank to Gürbüz Gülersoy, production and mechanical design manager at Bilkent University Space Technologies Research Center (BILUZAY), for giving me the chance to work on this topic and helping me on the design isssues whenever I needed. Without his trust in me, I wouldn’t be working on this topic. Special thanks should be given to Msc. Mechanical Engineer İbrahim Uçar, for all his advice, help and his valuable support on this work. His friendly attitude and patience have always been a good motivation for me. I would like thank our MAST coordinator Ass. Prof. Ricardo Gonzalez Cinca. All his efforts to arrange CNES and ESA Aerospace Seminars broadened my horizons and increased my curiosity on space. I also would like to thank all MAST professors of the courses I have taken such as Aerospace Materials, Space Systems Engineering, Numerical Methods... etc for their valuable teaching and knowledge that I have acquired, pave the way in my desired carrier. Finally, I would like express the profound gratitude from my deep heart to my beloved parents, my sister and my brother in law and my brother for their continuous support and love. Last but not the least, I would like to thank to my girlfriend and her family for their support and being my second family.

This Page Intentionally Left Blank

Table of Contents
ABSTRACT ............................................................................................................... 5
ACKNOWLEDGEMENTS .......................................................................................... 1
TABLE OF CONTENTS ............................................................................................. 1
CHAPTER 1 INTRODUCTION .................................................................................. 1
1.1. State of Art Solar Arrays .............................................................................................................. 2
1.2. Space Program of Turkey ............................................................................................................ 4
1.3. Motivation...................................................................................................................................... 5
1.4. Design Specification of the Satellite .......................................................................................... 5
1.5. Scope and Aim of the Thesis ...................................................................................................... 6
CHAPTER 2 DESIGN OF THE SOLAR CELL ARRAY ............................................. 8
2.1. Introduction................................................................................................................................... 8
2.2. Orbit and Its Environmental Conditions .................................................................................... 9
2.3. Eclipse Time ............................................................................................................................... 10
2.4. Solar Cell Types ......................................................................................................................... 12 2.4.1. Silicon Solar Cells ........................................................................................................... 12 2.4.2. Multi Junction Solar Cells ................................................................................................ 13 2.4.3. Selection of Solar Cell Type ............................................................................................ 13
2.5. Solar Array Configurations ....................................................................................................... 14 2.5.1. Rigid Planar Arrays ......................................................................................................... 15 2.5.2. Flexible Planar Array ....................................................................................................... 15 2.5.3. Flexible Thin Film Array ................................................................................................... 16 2.5.4. Array Configuration Selection ......................................................................................... 16
2.6. Solar Cell Array Sizing ............................................................................................................... 16 2.6.1. Preliminary Design of the Solar Array ............................................................................. 17 2.6.2. Detailed Design of the Solar Array .................................................................................. 19 2.6.3. Final Design of the Solar Array ....................................................................................... 21
2.7. Deployment of the Array/Panels ............................................................................................... 24 2.7.1. Evaluation of Solar Panel Deployment ............................................................................ 24 2.7.2. HDRM (Hold Down Release Mechanism) Selection ....................................................... 26 2.7.3. Actuation Mechanism Selection ...................................................................................... 27
CHAPTER 3 DESIGN AND ANALYSIS OF THE SOLAR PANEL SUBSTRATE ... 30
3.1. Design Philosophy ..................................................................................................................... 30
3.2. Design criteria for the Substrate Structure ............................................................................. 31
3.3. Dimensioning of Solar Panel Substrate Geometries .............................................................. 33
3.4. Selection of Material for the Solar Array Substrate ................................................................ 40 3.4.1. Sandwich Structures and Sandwich Theory ................................................................... 41 3.4.2. Core Materials ................................................................................................................. 44 3.4.3. Facing Material Selection ................................................................................................ 54

3.4.4. Film Adhesives and Surfacing of the Sandwich Structure .............................................. 59
3.5. Finite Element Analysis (FEA) of Solar Panel Substrates ..................................................... 61 3.5.1. Finite Element Model of the Solar Panel Substrate ........................................................ 63 3.5.2. Frequency Analysis of Solar Array Substrate ................................................................. 66 3.5.3. Static Analysis of Solar Array Substrate Geometries ...................................................... 81
3.6. Evaluation of the Geometries.................................................................................................... 90
CHAPTER 4 CONCLUSIONS ................................................................................. 93
4.1. General Conclusions ................................................................................................................. 93
4.2. Future Work ................................................................................................................................ 95
CHAPTER 5 BIBLIOGRAPHY ................................................................................ 96

This Page Intentionally Left Blank

List of Figures Figure 1-1 Solar array designs of Spacebus’ future missions [6] ........................................... 3
Figure 1-2 GPM’s state of art solar array [7] .......................................................................... 4
Figure 1-3 Conceptual Design of the Satellite [10] ................................................................ 6
Figure 2-1 A rigid type solar panel and properties of its substrate. The substrate is a sandwich structure composed of carbon fibers and honeycomb core. [12] ............................ 9
Figure 2-2 Geostationary Orbit [15] ..................................................................................... 10
Figure 2-3 Geometry of maximum eclipse calculation for circular orbits [17] ....................... 11
Figure 2-4 Eclipse period in geostationary orbit [18] ............................................................ 11
Figure 2-5 A silicon cell [21] ................................................................................................ 12
Figure 2-6 Triple-junction solar cell assembly with its interconnects, bypass diode and coverglass [22] .................................................................................................................... 13
Figure 2-7 Solar Array Wing Types a) Fixed Wing b) Body Mounted c) Rotating wings [24]14
Figure 2-8 Deployable Solar Array concepts [25] ................................................................ 15
Figure 2-9 Solar cell minimum and maximum operational power points [32] ....................... 22
Figure 2-10 Solar Panel HDRM/ restrain Unit a) Magnetic Housing b)Assembly of the unit with hold down bushing and fixation nut [36] ...................................................................... 27
Figure 2-11 Torsion spring driven hinge [37] ...................................................................... 29
Figure 2-12 Detailed evaluation of the restrain and deployment mechanisms ..................... 29
Figure 3-1 Phases of dimensioning a structural component [39] ......................................... 31
Figure 3-2 Dimensions of the selected solar cell, 3G30G [42] ............................................. 33
Figure 3-3 Minimum solar cell area required on a solar panel substrate .............................. 35
Figure 3-4 Solar Panel Geometry-1 (Case-1) ...................................................................... 37
Figure 3-5 Solar Panel substrate Geometry-2 (Case-2) ...................................................... 37
Figure 3-6 a) Formosat solar cell layout for on a solar panel substrate [43] ........................ 38
Figure 3-7 b) Gokturk 2 solar cell layout on a solar panel substrate [43] ............................ 39
Figure 3-8 Complete Assembly of Satellite .......................................................................... 39
Figure 3-9 Sandwich Panel and I beam representation [45] ................................................ 41
Figure 3-10 Conventional sandwich structure construction for aerospace applications a) Honeycomb panel and prepreg skins [50] b) Hexagonal cell of honeycomb structure [48] .. 45
Figure 3-11 Expansion Process of Honeycomb Manufacturing [51] .................................. 45
Figure 3-12 Corrugated Process of Honeycomb Structure [51] ........................................... 46
Figure 3-13 Honeycomb cell shapes and fundamental axes definitions a) Hexagonal Core b) OX core [52] ........................................................................................................................ 46
Figure 3-14 Core thickness correction factor [54] ................................................................ 47
Figure 3-15 Honeycomb cells with holes on free cell walls for venting a) Drilled holes b) Slotted [55] .......................................................................................................................... 47
Figure 3-16 Aluminum metal foam and its properties [56] ................................................... 51

Figure 3-17 Honeycomb materials vs. specific stiffness’, (CES EDUPACK software plot). Al 5056 in red; Foams in olive; Aramid Paper in blue; Para-aramid Paper in yellow; Glass Fiber in black;............................................................................................................................... 52
Figure 3-18 Weight gain of carbon fiber reinforced material (M74) with epoxy and Cyanate ester resins; 50% of relative humidity Cyanate ester have lower weight gain due to moisture absorb [62] .......................................................................................................................... 56
Figure 3-19 Specific Stiffness diagram for facing materials. The line with aim 3 shows the materials with higher specific stiffness (CES edupack plot) ................................................. 57
Figure 3-20 Specific strength versus specific modulus of fibers. High specific modulus carbon fibers, which are at the right side of the graph, are the main interest. [59] ............... 58
Figure 3-21 Hexcel calculator for cured ply thickness and density. Cyanate resin with ultra high modulus fibers are utilized [64] .................................................................................... 59
Figure 3-22 Flow chart for the design of solar panel substrate using Finite Element Analysis ........................................................................................................................................... 62
Figure 3-23 Element axis directions [69] ............................................................................. 64
Figure 3-24 Finite Element Model of the Solar Panel-1. Z axis is the 0º ply angle ............... 64
Figure 3-25 Carbon honeycomb frequency analysis results. Left figure shows the first lateral mode while right figure shows the first axial mode of the structure ...................................... 69
Figure 3-26 Solar Panel-1,Al-5056-50-3 core material and 1mm face sheet, M55J. 1st lateral Mode , @ 61 Hz .................................................................................................................. 71
Figure 3-27 Solar Panel-1,Al-5056-50-3 core material and 1mm face sheet, M55J. 1st axial Mode , @ 92 Hz .................................................................................................................. 71
Figure 3-28 Solar Panel-1, Al-5056-50-3 core material and 1mm face sheet,. HexPly 954-6/ K13C2U prepreg. 1st lateral Mode , @ 56 Hz ...................................................................... 73
Figure 3-29 Solar Panel-1, Al-5056-50-3 core material and 1mm face sheet,. HexPly 954-6/ K13C2U prepreg. 1st axial Mode , @ 90 Hz ......................................................................... 73
Figure 3-30 Influence of stacking sequence of a laminate on the natural frequency [73] ..... 74
Figure 3-31 Hold Down release Mechanism attachment points for previous model. The thin lines are at equal distance from the middle line of the panels. a) first lateral mode, bending in x axis b) First axial mode, bending in z axis .................................................................... 76
Figure 3-32 Analysis results of the panel substrate without restrain mechanism. Bending lines are very close to the previous analysis. a) First lateral mode, bending in x axis b) First axial mode, bending in z axis .............................................................................................. 76
Figure 3-33 New hdrm attachment point, 0.65*L, results. First lateral frequency at 74 Hz, .. 77
Figure 3-34 New hdrm attachment point, 0.65*L, results. First axial mode at 96 Hz ............ 78
Figure 3-35 Coefficient of thermal expansion for various fiber angles. [0º/±60º] provides vey low longitudinal and transversal values [60] ........................................................................ 79
Figure 3-36 Solar Panel Geometry-1, Al-5056-16-9 core material and 1mm face sheet. HexPly 954-6/ K13C2U prepreg. a) First lateral mode at 72.82 Hz b) First axial mode at 98.2 Hz. ...................................................................................................................................... 80
Figure 3-37 Solar Panel Geometry-2, Al-5056-32-5 core material and 1mm face sheet. HexPly 954-6/ K13C2U prepreg. a) First lateral mode at 76 Hz b) First axial mode at 102 Hz. ...................................................................................................................................... 81
Figure 3-38 Steady state acceleration of Ariane 5 launch vehicle [70] ................................. 82

Figure 3-39 PSD function versus Frequency [78] ................................................................ 83
Figure 3-40 Maximum shear stress for the load case 17 of Al 50-3 core material. The maximum shear stress is 0.436 MPa .................................................................................. 87
Figure 3-41 Load case 17 result. Maximum shear stresses at core is 0.34 MPa and it is higher than material strength limit. ...................................................................................... 88
Figure 3-42 Maximum Von Mises stress value for the load case 17 of the face material. The maximum stress is 54.6 MPa .............................................................................................. 88
Figure 3-43 Solar panel substrate geometry-2 static analysis result for load case 17. Maximum shear stress on the core, 4.04*10-1 MPa, is indicated. ........................................ 90
Figure 3-44 Solar array substrate geometry-1, selected components and layout ................ 91

This Page Intentionally Left Blank

List of tables Table 2-1 Space solar array technologies and characteristics at the Beginning of Life (BOL) [11] ........................................................................................................................................ 8
Table 2-2 Solar cells and comparisons their efficiencies (BOL area power density W/m2, specific weight W/kg, normalized cost) [23] ......................................................................... 14
Table 2-3 Design requirements for the array sizing ............................................................. 17
Table 2-4 TJ 3G30C solar cell desing and mechanical data [20] ......................................... 17
Table 2-5 TJ 3G30C solar cell electrical data Spectrum: AMO Solar constant = 1367 W/m2; T = 28 °C [27] ...................................................................................................................... 18
Table 2-6 TJ 3G30C temperature gradients at the BOL and after radiation degradation [27] ........................................................................................................................................... 18
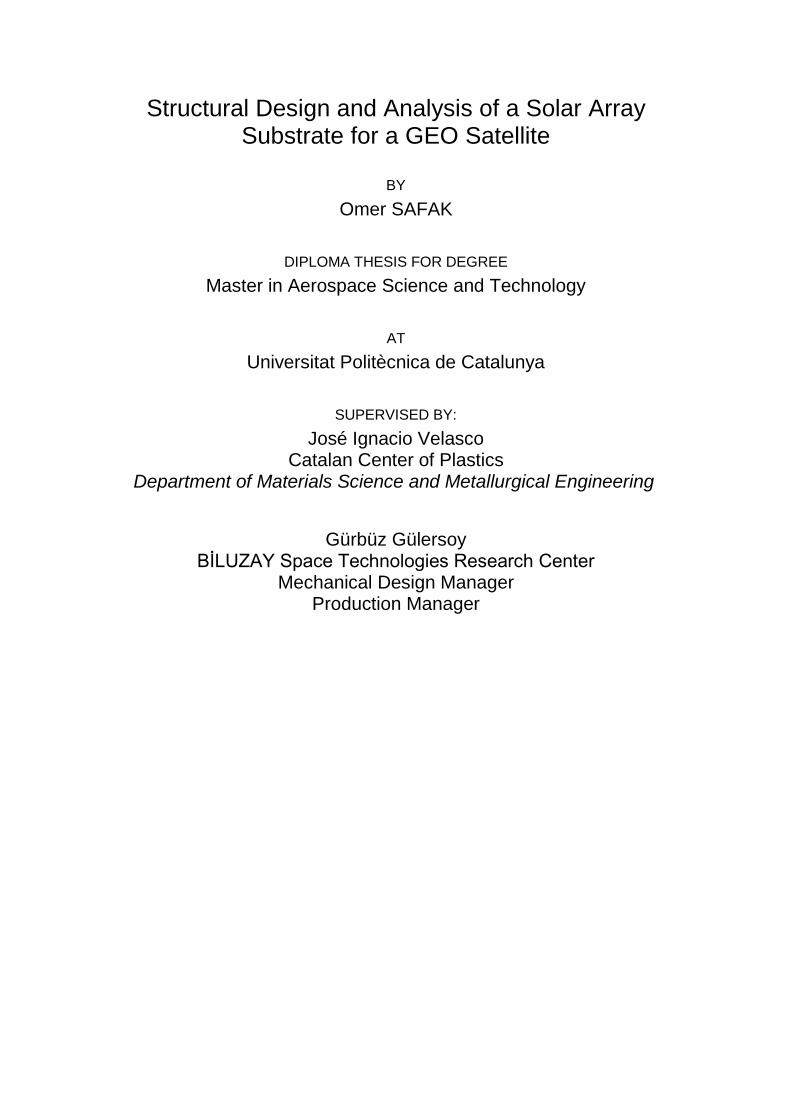
Table 2-7 Solar cell efficiency comparisons under Geo conditions (60ºC) [23] .................... 24
Table 2-8 Thales Alenia Solar Array Deployment Mechanisms Properties [37] ................... 27
Table 3-1 Design parameters for the solar panel geometries .............................................. 33
Table 3-2 Possible solar panel number and panel area ....................................................... 34
Table 3-3 Different solar panel geometry dimensions. A trade is shown with number of panels vs panel area ........................................................................................................... 36
Table 3-4 Solar panel substrate candidate geometries and their dimensions ...................... 38
Table 3-5 Material Indexes for specific objectives in a substrate design [43] ....................... 40
Table 3-6 An example of structural efficiency of sandwich structure in terms of weight and stiffness [44] ........................................................................................................................ 41
Table 3-7 General attributes of honeycomb core materials [59] .......................................... 49
Table 3-8 Properties of Duocel SiC Foam [60] .................................................................... 51
Table 3-9 Aluminum Honeycomb core material candidates. Different cell sizes and densities are considered [60] ............................................................................................................. 53
Table 3-10 Candidate non-metallic honeycombs materials and mechanical properties. Almost the same density configurations are chosen to ease comparison of the materials. [60] ........................................................................................................................................... 53
Table 3-11 Mechanical properties of Rohacell PMI foams [60] ............................................ 54
Table 3-12 Solar panel substrate materials based on the critical requirements [62] ............ 55
Table 3-13 HexPly® 954-6 Curing Cyanate Resin, and Unidirectional HM Fibers (Fiber Volume is 60% ) [62] ........................................................................................................... 58
Table 3-14 Aluminum Honeycomb core candidate material and its mechanical properties for FEA (Al 5056 130-3 designation indicates density and cell size respectively) ..................... 65
Table 3-15 Non metallic honeycomb core candidate materials and mechanical properties 65
Table 3-16 Face sheet candidate materials and mechanical properties for FEA(CFRP Prepreg) (2D orthotropic) .................................................................................................... 66
Table 3-17 Natural Frequency requirements during launch [70] .......................................... 66
Table 3-18 Solar panel stiffness requirements calculation ................................................... 67
Table 3-19 Solar panel-1 laminate structure and ply configuration in the FEA ..................... 68

Table 3-20 Results of frequency analyses of different core materials with same face sheet materials and core thickness. Cost estimations are taken from CES Edupack material database. ............................................................................................................................ 69
Table 3-21 Thermal properties of core materials. Coefficient of thermal expansion and thermal conductivity in the thickness direction of the cell [56] .............................................. 70
Table 3-22 Result of natural frequency analyses of Aluminum honeycombs with different cell sizes and densities. Lowest density exhibits the maximum performance............................. 70
Table 3-23 Solar Panel Model-1. Results of frequency analysis with different face sheet materials having the same core material. Best performance material is at the top of the list 72
Table 3-24 Natural frequency results for different stacking sequence of laminates ............. 74
Table 3-25 Natural frequencies of the substrate with different cured ply thickness of the same material (0.18 mm and 0.06 mm) ............................................................................... 75
Table 3-26 Analyses results for different HDRM attachment locations; L is the half length of an edge of solar panel substrate. ........................................................................................ 77
Table 3-27 Solar panel substrate geometry-1 dynamic analysis results and final thickness values ................................................................................................................................. 80
Table 3-28 Solar panel substrate geometry-2 frequency analysis results and final thickness values for both materials ..................................................................................................... 81
Table 3-29 ESA specification for random vibrations during launch [73]] .............................. 83
Table 3-30 Recommended uncertainty factors for combining different loads into static load factor [79] ............................................................................................................................ 84
Table 3-31 Total static load factors for substrate geometry-1 (combining random and quasi-static load factors in g’s) ...................................................................................................... 85
Table 3-32 Total static load factors for substrate geometry-2 (combining random and quasi-static load factors in g’s) ...................................................................................................... 85
Table 3-33 Static analysis load cases and resultant maximum Von Mises Stress values on the surface and core of solar panel substrate geometry-1 ................................................... 86
Table 3-34 Shear strengths and margin of safety of the aluminum core materials after employing correction factor of 0.87. Margin of safety for only Al 50-3 is positive. ................ 87
Table 3-35 Static analysis results for important load cases of solar panel substrate geometry-2 .......................................................................................................................... 89
Table 3-36 Shear strengths and margin of safety of the aluminum core materials after employing correction factor of 0.92. Margin of safety for only Al 50-3 is positive. ................ 89
Table 3-37 Final configuration of the substrate geometries and its properties ..................... 90
Table 3-38 Tradeoff between two geometries. Total solar array mass for each geometry is calculated. Geometry-1 is more advantageous. .................................................................. 91
Table 3-39 Geometry -1 solar array substrate ply layout ..................................................... 92

This Page Intentionally Left Blank

Introduction 1
Chapter 1
INTRODUCTION Photovoltaic energy production by means of solar cells has been widely used in space applications since the middle of 20th century. Vanguard 1, which was launched into orbit on 1958, is the world’s first solar powered satellite ever having 108 silicon solar cells mounted on its body. More than 50 years ago, it accomplished a record proving that solar cells could be used in space mission during several years. After this achievement, photovoltaic solar arrays have been the primary power source for a majority of spacecraft orbiting around the Earth. Historically, the early satellites needed only few watts to several hundred watts of power and the size of the arrays were limited due to the fact that they were body-mounted. Silicon solar cells were mounted on honeycomb panels and these panels were assembled and fixed on the satellite body. The honeycomb structure was dominant and mostly it was made of aluminum core and aluminum facing skins. [1] Development of communication satellites and their higher power requirements brought up the idea of deployable solar panels for their large arrays. These panels were stowed during launch and once in the orbit they were deployed with the help of release and deployment mechanisms. However, the power needs of several kW arrays require design constraints such as being cost effective, small in size, having low mass and low volume in order to mount on launch vehicle fairings. Along with these developments in solar array technology, rigid panels have been continuously used on many spacecraft requiring up to several tens of kilowatts of power. This technology was an evolution of body mounted arrays due their deployment capability and intensively used to empower communication satellites which are considered the most mature of space applications. There are very important consequences and spin offs of high power satellites in our life providing higher quality of life in such applications as navigation, high speed telecommunication, internet… etc. thanks to solar arrays onboard which consist of several rigid panels meeting high power requirements of these satellites. In accordance with the technological developments in solar cells, innovative and high performance materials and structures have been the focus of aerospace applications. The need of high power solar arrays resulted in the need of structures that are as light as possible while having high stiffness and strength. This required structurally efficient constructions which can be obtained by utilizing most efficient materials and optimizing geometry of the structure. Fiber Reinforced Polymer (FRP) composites are some of the most useful materials available to design high performance structures for such applications. Since the early 1950s when they first employed in rocket nozzles, pressure tanks and solid motor cases, the use of composite materials has been steadily increasing. [2]. Additionally, composite materials bring on the advantage of tailoring the mechanical properties to find an efficient structural design by altering orientations, number and stacking sequence of

2 Structural Design and Analysis of a Solar Array Substrate for a GEO Satellite
ply that make up the laminate. All these design aspects along with stress analysis of composite laminates is commonly implemented by use of computer programs. [3]. On the other hand, ideas for optimizing geometry of a structure influenced design of sandwich structures employing manmade cellular materials as core materials. These structures are mainly consists of a pair of thin, stiff facing materials and a thicker lightweight core, bonded together with adhesives. Thus, sandwich panels became popular in applications where weight must be kept at minimum whilst providing high stiffness and strength. In the design of rigid solar panels, aluminum honeycomb has been dominating the core material since the first applications while the facing skins were also made of aluminum materials. Use of composite laminates for the facing sheet of sandwich panels were not possible until the developments in composite materials that provides high stiffness to weight ratio and low outgassing properties with lowered manufacturing costs were achieved. In the late 1970s, the first sandwich structure utilized for solar panels were composed of Kevlar fiber with epoxy resin and Nomex honeycomb core providing good thermal and electrical insulation. [4] Today, there are vast variety of product for core and facing sheet of sandwich structures such as foams (PMI, metallic, SiC) for the design of rigid solar array substrates.
1.1. State of Art Solar Arrays
During the last two decades, there have been significant developments on solar cell and solar array technology in order to meet high power demands of large satellites mainly for communication. These power requirements have already been reached to 15-20 kW levels that enable new generation communications. Today, various types of solar cells with different materials, sizes, designs, configurations and sufficiently enough array structures are available. Nevertheless, this wide range of solar cell and array systems brings the challenge with itself giving the spacecraft designer large trade-offs to select optimum choice of solar cell/array technology for a specific application. The increase in sizes and thus inertia in controlling the array resulted in more fuel and mass requirements for attitude control system and pave the way for development of more efficient solar cells. Since 1990s, investigations on higher efficiency and more resistance to radiation introduced a new type of solar cell, multijunction (MJ) solar cell. Today, state of art space solar cells are triple junction III-V. [5] Their higher efficiency around 30% and resistance to radiation degradations contributed to realization of telecommunication satellites requiring more than 10 kW end-of-life (EOL) power with their high power to mass ratio solar arrays composed of rigid sandwich panels. Present state of art spacecraft array technology has been widely on rigid solar arrays made of sandwich structures. This type of array is very dominant among the telecommunication satellites as well as others which require several tens of kilowatts power. The sandwich structure consists of a core and face material. Therefore, design optimizations are needed in order to find optimum geometry, number of panels and thickness without compromising functional capability of solar array. On

Introduction 3
the other hand, if it is another solar array technology such as flexible planar array technology, increased deployment mechanism weights are to be traded. Consequently, rigid solar panels become more dominant bringing simple deployment and increased reliability thanks to its structure. Thales Alenia Space has been developing a new generation of high-power ultra-lightweight solar arrays for telecommunication satellites funded by ESA’s Advanced Research in Telecommunications (ARTES) programme. For the Spacebus 4000 platform, the solar array have been developed with a 15.8 kW EOL power capacity. The structure exhibits excellent mechanical and thermal behavior thanks to its design. This technology deploys modular panels using patented frictionless hinges named ADELE. The rigid solar panels are made of aluminum honeycomb core and carbon fiber reinforced face skins. [6] The array consists of 4 panels in each wing but in the near future it will consist of 7 panels in each wing. The solar array of Spacebus at present and the future arrays are given in Figure 1.1. It is seen in this figure that the future designs will have more panels that could deploy laterally thanks to frictionless hinges.
Figure 1-1 Solar array designs of Spacebus’ future missions [6]
Another state of art solar array design is from the Global Precipitation Measurement (GPM) mission which is an international network of satellites that provides observation of rain and snow. [7] The array consists of two wing along the +Y and –Y axis each having 4 panels hinged together at two points. (Figure 1.2) However, thanks to electric motor powered hinges; -Y wing has a specific angle different than conventional cases being inclined almost 45º. In addition, the booms of each wing are extendable tubes and automatically locked at the final position after released from satellite body. The rigid solar panels are made of aluminum honeycomb core and carbon fiber reinforced facesheets. The hold down and release mechanism hole can be seen on the panels each having four pcs. The net solar cell area is 26,5 m2

4 Structural Design and Analysis of a Solar Array Substrate for a GEO Satellite
Figure 1-2 GPM’s state of art solar array [7]
It is seen that today and for the near future, most of the telecommunication satellite’s state of art solar array designs are almost dominated by rigid solar panels. Briefly, these panels are composed of sandwich structure with honeycomb core intensively utilizing aluminum material and facesheets which are made of carbon fiber laminates. The sandwich structure weight saving are achieved utilizing more hold down release mechanisms, high efficient solar cells and high strength composite materials. In this work, all these aspects mentioned above considering stowing and deployment of panels are taken into account and evaluated profoundly.
1.2. Space Program of Turkey
Turkey’s satellite history dates back to TURKSAT 1B in 1994 after the launch failure of TURKSAT 1 A. It was developed by Aerospatiale and put into GEO orbit and positioned to 42ºE. Since then, other communication satellites had been injected into orbit such as TURKSAT 2A and 3A which are already in use. A conjoint program was carried out between TUBITAK UZAY (Space Technologies Research Institute) and SSTL in UK to develop and manufacture of a small satellite for remote sensing which is called BILSAT. Besides, the required infrastructures to build small satellites and ground station were also established and two payloads were designed and manufactured by TUBITAK UZAY staff. RASAT is the next remote-sensing satellite which was designed and manufactured in Turkey. It has high resolution optical imaging system and new modules. The project provided improvement of the know-how from design phase to in-orbit commissioning phase and of development of space qualified systems using current technologies. Another important accomplishment is the Gokturk-2 satellite which was launched on 2013. It is an earth observation satellite designed and developed by TUBITAK and it

Introduction 5
has an improved high resolution imagery providing 2.5 m of resolution at panchromatic. [8] TURKSAT 4A, TURKSAT 4B and GOKTURK 1 is under development with different contractors and TURKSAT 5A and GOKTURK 3 is being developed with local contractors. Besides these satellites, a space program is established and important goals have been set on future communication satellites.
1.3. Motivation
Due to increased power requirements of satellites especially telecommunication satellites in Geo orbit, solar array sizes have been increased bringing on development of light weight rigid panels which provide high power-to-weight ratios thanks its robust sandwich structure. Therefore, design of solar array along with its substrate is becoming more challenging due to selection of array configuration assessing solar cell types; stow, restrain and deployment of its panels. Furthermore, a great importance lays on the structural design of panels in order to best meet the design requirements. This mostly depends on analyzing and optimizing the substrate through minimization of weight without compromising its functional capability, integrity of solar cells along with the survivability of the structure under launch loads which is crucial for the structure. Consequently, it is critical to perform static and dynamic analyses during the design of solar panels utilizing software packages for finite element modeling and analysis of the structure in order to realize light weight and robust structure. In this thesis, a design of such solar array substrate, which will produce power for a telecommunication satellite to be injected into GEO orbit, is realized considering new materials, cost efficiency and reliability.
1.4. Design Specification of the Satellite
This section is dedicated to detail the design specification of the solar array along with the satellite considering mission requirements and spacecraft requirements. A conceptual model of the telecommunication satellite is provided by BilUzay. According to the mission requirements, the telecommunication satellite shall contain:
a. A Ku Band Transponder for TV Satellite Broadcast b. A Ku Band Transponder for Telephone lines c. An X-Band Transponder for Military Communications d. A EHF Band onboard processing Military Transponder
Life of the satellite shall be more than 12 years of operation. Satellite shall be positioned at 42º East Longitude at 36.000 km distance from the sea surface at equators plane. The satellite shall give service to all Europe, Central Asia, Middle East and North Africa. Satellite shall be Geosynchronous to earth.

6 Structural Design and Analysis of a Solar Array Substrate for a GEO Satellite
According to the power requirement of the satellite, the maximum power required is 7200 watts. Satellite should be able to deliver this power to transponders. Power bus is 100 V DC. The output efficiency of solar cells are to be higher than 20 %. Number of solar cells is to be calculated from the charging need of batteries. Battery capacity is related to the day-night durations of the satellite. Battery capacity is calculated as end of life capacity.
Solar panel dimensions shall be less than 280 cm x 340 cm. Number of panels needed are calculated from the capacity needed. Deployment mechanisms shall be able to work in a temperature range of -150ºC to +100ºC and deployment mechanism parts shall be manufactured with anti-galling materials. The mass and geometry of the whole spacecraft are defined as:
- WxHxD: 230 cm x 340cm x 280 cm - Wet weight of the satellite: 3200 kg - Estimated mass of the power subsystem: 250 kg - 450 kg [9])
The conceptual design of the satellite given by Biluzay is presented in Figure 1.3. It consists of high gain antennas, transponders, UHF antennas. It is seen that, the solar array consists of 6 solar panels opened in the +Y and –Y axis.
Figure 1-3 Conceptual Design of the Satellite [10]
1.5. Scope and Aim of the Thesis
This thesis covers the structural design and analysis of a solar array substrate for a telecommunication satellite which will be operating in Geostationary Earth Orbit. The

Introduction 7
array consists of rigid panels and attached together with hinges. The main objectives of this work are:
Calculation of the total solar array required along with number of solar cells connected in series and parallel according to the power requirement of the satellite.
Selection of stowing (restrain) and deployment mechanism considering design requirements and operational conditions.
Design of solar array substrate employing sandwich structure and forming different geometries for the analysis.
Evaluation of several candidate materials for the core and face of the sandwich structure.
Finite element modeling of the sandwich structure by using sandwich theory.
Finite element analysis of the sandwich structure under launch induced loads mainly steady state (quasi static) accelerations and random vibration loads. .
The remainder of this thesis is structured as follows: Chapter 2 is dedicated for the design of the solar array. Several computations are made in order to calculate power output from single cell. All the necessary steps are included to calculate total solar array area. Eclipse time and orbital parameters are discussed in order to calculate battery capacity that will empower the satellite under shadow. Solar panel dimensions and number of cells are calculated depending on the bus voltage. Number of cells is equally shared between panels.The actuation mechanisms and hold down release mechanisms are evaluated; advantages and disadvantages of these mechanisms are traded in order to select the best convenient mechanism in agreement with design constraints. Integration of these mechanisms on the solar panels is discussed and their consequential effects on the panel design are assessed. Chapter 3 is dedicated to solar panel substrate design and finite element analyses of the sandwich structure. Design criteria, design loads are determined. Sandwich structure and its mechanical properties are explained. Material selection for the core and facesheets are discussed profoundly and candidate materials are selected. Design loads are determined and static load factors are calculated combining launch induced loads such as steady state acceleration load factor and random vibration load factor. An approach for the Finite Element model of the sandwich structure is utilized and the model is created applying boundary conditions in Msc Patran which is Finite Element Analysis package software. Core thickness and facing skin thicknesses of the substrate is estimated and frequency analysis is iteratively performed in order to obtain the geometry that fulfills the minimum natural frequency constrain of the panels. Later on, load factors are updated with the calculated mass and frequencies of the structure and the geometry is evaluated in static analysis to verify that the material will not fail under these loads. Furthermore, other material candidates are evaluated and number of the hold down release mechanism points (restrain) is discussed. Final design of the substrate is concluded with the optimum geometry and materials that provide positive margin of safety.

8 Structural Design and Analysis of a Solar Array Substrate for a GEO Satellite
Chapter 2
DESIGN of THE SOLAR CELL ARRAY
2.1. Introduction
Solar cell array design has been evolving since the Vanguard 1, which is the first satellite that operated successfully in space with its on board solar cell array consisting of six solar panels mounted on its body providing less than 1 W of power. Early researches for mass saving resulted in different type of solar cells such as thin film solar cells and blanket type solar array technology. These thin film solar cells have an advantage of low manufacturing costs for large arrays while having very low efficiencies. The arrays contain a blanket in a roll-up configuration and the arrays are deployed by an extendable boom such as in Hubble Space Telescope. Nevertheless, due to thermal cycles several problems encountered and they were needed to be changed with rigid panels which provide higher reliability. Space solar cell array technology developments are generally aimed to meet the power requirements of satellites. Today, there are several types of solar array system based on different solar cell type mounted on various types of substrate materials. The design issues are mostly tradeoffs among weight, area, cost, volume etc. considering the mission life and other specific requirements. An ideal solar array system for a spacecraft should maximize performance while minimizing cost. Therefore, these factors are generally traded against one another in order to choose a system that best meets the mission requirements. The most important characteristics of solar arrays required for space applications are high specific power (W/kg), low stowed volume (W/m3), low cost ($/W) and high reliability. These characteristics for common type solar arrays are given in Table 2.1. It is seen that the triple junction rigid panel arrays exhibit good performance with highest cell efficiency and reasonably low cost per watts of energy output. Table 2-1 Space solar array technologies and characteristics at the Beginning of Life (BOL) [11]
Technology Cell
efficiency
Specific Power BOL
[W/kg]
Cost [$K/W]
Area per power
[m2 /kW]
High Efficiency silicon (HES) rigid panel array
19% 58.5 0.5-1.5 4.45
HES flexible array 19% 114 1.0-2.0 5.12 Triple Junction Gas rigid
panel array 30% 70 0.5-1.5 3.12
CIGS thin film array 11% 275 0.1-0.3 7.37

Design of the Solar Cell Array 9
A typical solar cell array, which consists of rigid solar panels, is presented in Figure 2.1. The substrate is a honeycomb with carbon fiber prepregs. In the center of the substrate it is seen a hole where the hold down release mechanisms are attached.
Parameter Characteristics
Nº of Panels 3
Nº Strings / Array 3
Nº Cells / String 20
Solar Cell Type GaAs Triple unction
Cell/ Substrate insulation Kapton, 50 μm
Substrate Facesheet mat. Carbon fibre M55J, 2*0.5 mm
Substrate core Al Honeycomb
Output power / Panel 240 W, @ EOL, 25ºC
Figure 2-1 A rigid type solar panel and properties of its substrate. The substrate is a sandwich structure composed of carbon fibers and honeycomb core. [12]
In this chapter, solar cell array area calculation is performed in detail considering power requirements of the satellite. The factors that affect the solar array size such as eclipse time, radiation degradation of solar cells are evaluated. Later on, solar array sizing is performed with guides of space handbooks. [13]
2.2. Orbit and Its Environmental Conditions
Geostationary orbit is the special case of geosynchronous orbit (GSO) with zero inclination (i=0) and eccentricity (e=0). It is synchronous with respect to earth and stay in the equatorial orbit. It has a period of one sidereal day which is 23h 56 minutes. There are three conditions which lead to geostationary satellites. Lifetime expectancy of these satellites is around 15 years.
The satellite should be placed 37,786 km (approximated to 36,000 kms) above the surface of the earth. (see figure 2.2)
These satellites must travel in the rotational speed of earth, and in the direction of motion of earth, that is eastward.
Geostationary satellite and geosynchronous satellite are often used interchangeably but essentially, geostationary is termed as near circular orbits with inclinations less than 5º as there are multiple factors which make these satellites shift from the ideal geostationary condition such as gravitational pull from Moon and Sun. [14]

10 Structural Design and Analysis of a Solar Array Substrate for a GEO Satellite
Figure 2-2 Geostationary Orbit [15]
The environmental conditions in GEO are important to long‐life telecommunication Satellites and during operation in GEO would encounter:
Temperature changes: generally ‐150°C to +120°C and 1 cycle/day.
Vacuum: in the range of 10‐9 torr to 10‐10 torr
Radiation: Trapped Van Allen belts, galactic radiation, particle radiation from solar flares, but very little ultraviolet [16]
2.3. Eclipse Time
The calculation of the fraction of time that a spacecraft is in sunlight and in eclipse is a fundamental importance to the design of both thermal system and power system. This contributes directly to the array sizing, the number of battery discharge cycles and thus battery lifetime. The maximum eclipse time can be calculated from below formulas. By utilizing these equations given below, eclipse period is calculated as 69 minutes.
(
) (2-1)
(2-2)
(
) (2-3)
Where:
h is orbit altitude, km
α is shadow region half-angle, deg
Tn maximum eclipse time, minutes

Design of the Solar Cell Array 11
Figure 2-3 Geometry of maximum eclipse calculation for circular orbits [17]
For the verification of the total eclipse time, TURKSAT 2A specifications are used and the total time of eclipse for the satellite is calculated with Java Satellite Tracker software. According to the orbital parameters, the maximum eclipse period is extracted from the software and it is seen that the value is 72 minutes. In geostationary orbit, these eclipses last for almost 45 days and twice per year as presented in Figure 2.3). For the power calculation of the battery 72 minutes will be used.
Figure 2-4 Eclipse period in geostationary orbit [18]
.

12 Structural Design and Analysis of a Solar Array Substrate for a GEO Satellite
2.4. Solar Cell Types
Solar cells are usually made of silicon which is a semiconductor material that means they can conduct electricity under some conditions but not others. When light strikes the cell, some part of it is absorbed within the semiconductor material by transferring the energy. This energy leads some electrons loose and allows them to flow. This flow of electrons is a current when the bottom and top of the PV cell is connected with a metal. Typical solar cell types at interest are:
Silicon solar cells,
Multijunction solar cells Multijunction solar cells are the state of art technology and most efficient types. Nevertheless, these solar cell types are assessed in the following sub-sections.
2.4.1. Silicon Solar Cells
Silicon solar cells are historically the oldest type which is cheaper compared to other types. The first spacecraft to use solar panels was the Vanguard 1 satellite, launched by the US in 1958. They have good radiation resistance and can be very cheap. At operating temperature, a silicon solar cell will degrade about 25% over 10 years in GEO orbit and their efficiencies are around 12-15%. [19]. In order to improve the energy to weight ratio, modern solar cells are manufactured using thin layers. This also increased the radiation efficiency. Thin films solar cells were first used in Hubble Space Telescope. These Si high efficiency solar cells have around 16-18 % of efficiency. [20]
Figure 2-5 A silicon cell [21]
Thin film solar cells are manufactured by depositing one or more thin layers of photovoltaic materials on a substrate. Thus, the thickness of layers varies between nanometers to micrometers. The main advantage of thin film solar cells are that they

Design of the Solar Cell Array 13
have very less production costs compared to silicon cells. These solar cells are employed in roll out solar array type.
2.4.2. Multi Junction Solar Cells
High-efficiency multi junction cells were originally developed for special applications such as satellites and space exploration. A triple-junction solar cell consists of the semiconductors: GaAs, Ge, and GaInP2. GaAs based multi junction devices are the most efficient solar cells to date. Current triple junction solar cells provide an efficiency of 30% in AMO and higher levels of radiation resistance. They are commercially available as dual junction and triple junction. Although triple junction solar cells are the state of art technology and have been dominating the market, these cells are traded in the next section. Figure 2.6 shows a triple junction solar cell assembly (CIC) which is comprised of Solar Cell+ Interconnects+ Coverglass+ Bypass diode. The coverglass protects the cell from cosmic radiation. The interconnects allow for series connection of CIC’s.
Figure 2-6 Triple-junction solar cell assembly with its interconnects, bypass diode and coverglass [22]
2.4.3. Selection of Solar Cell Type
The design requirement states that the output efficiency of solar cells shall be more than 20%. In this case, the dual junction and triple junction solar cells are only candidates to be traded. Commercially available multijunction solar cells are given in Table 2.2:
Table 2.2 shows the comparision of solar cells in specific power, weight and cost of bare cells on the panel level. It is clearly seen that, triple junction solar (3J) cells provide more specific power with a lighter structure. Although the cost of 3J solar cells are higher, due to higher efficiency and reduced total area size, the final cost

14 Structural Design and Analysis of a Solar Array Substrate for a GEO Satellite
contribution is less than dual junction cells (2J). Therefore, 30% Triple Junction GaAs junction solar cells are chosen for the design of solar cell array. Table 2-2 Solar cells and comparisons their efficiencies (BOL area power density W/m2, specific weight W/kg, normalized cost) [23]
Solar Cell Technology W/m2 W/Kg Normalized Cost ($/W)
High Efficiency Si 169 676 1.00 2J 271 319 1.38 3J 306 360 1.22
2.5. Solar Array Configurations
The power requirement for a satellite depends on the specific mission. In this aspect, it is possible to say that every mission has its own design. Thus, the working mechanisms and design aspects of a mission would not be the same for another mission. In the latest missions, the power requirements are increasing for satellites, though leading to higher solar array sizes providing tens of kW energy. Therefore, for a specific mission, solar array options would be studied and a proper type must be chosen within the constraint of the mission. According to the wing type, solar arrays are categorized as body mounted fixed wing and rotating wing solar arrays. These configurations are presented in Figure 2.7. Fixed wings solar array type is sun pointing and while rotating wings is earth pointing satellites.
Figure 2-7 Solar Array Wing Types a) Fixed Wing b) Body Mounted c) Rotating wings [24]

Design of the Solar Cell Array 15
Rotating wing type array configuration are frequently employed in high power satellites. In addition, these arrays are deployable due to dimensional constrains of launch vehicles. These deployable arrays are as shown in Figure 2.8:
1. Rigid Planar Arrays 2. Flexible Planar Arrays 3. Flexible Thin Film Arrays
Among telecommunication satellites, rigid arrays are most dominant as mentioned before. However, all these array types are explained respectively.
Figure 2-8 Deployable Solar Array concepts [25]
2.5.1. Rigid Planar Arrays
Rigid arrays have been commonly used due to their simple and reliable construction. They incorporate large number of panels which are hinged together. Each solar panel consists of a rigid substrate where solar cells and their associated electrical sub components are welded or soldered. The rigid substrate is commonly made of a lightweight core (mostly Al honeycomb) and thin face sheets which are bonded both on top and bottom sides of this core. [13] Rigid planar arrays are mostly attached to the spacecraft by a yoke structure and then are unfolded through a series of hinged panels.
2.5.2. Flexible Planar Array
Flexible planar array is a lightweight thin film made of composite materials. Flexible solar cell blanket designs use stiff frames to support flexible substrate on which solar cells are fixed. This stiff structure supports and deploys the solar cell blanket. This

16 Structural Design and Analysis of a Solar Array Substrate for a GEO Satellite
type of array deployment is via flex rollout mechanisms [26]. However, this type of array can be advantageous for very high power requirements that rigid panels would be extremely heavy.
2.5.3. Flexible Thin Film Array
Flexible thin film array consists of numerous thin film solar cell modules as individual solar panels and interconnected together to form a solar array. Thin film solar cell modules are directly deposited on flexible, thin, lightweight composite substrates using automated thin film deposition techniques. The main advantage of linear array is its structural simplicity and simple repetitive blanket geometry. Shape memory alloys are used for hinges, deployment systems and solar array drives. [26]
2.5.4. Array Configuration Selection
For the design solar array, rigid planar arrays are chosen. One of the main reasons to choose this configuration is that more efficient solar cells can be used. Therefore, less solar area is required. Besides, flexible solar arrays have some difficulties due to thermal problems such as in Hubble Space Telescope. Flexible thin film arrays are mainly used for larger power requirements. Therefore, it is not considered. Considering the energy amount and the need to be earth pointing, rotating wings type are more suitable. Thanks to slip rings, which enables power and cable transfer from a rotating part to non-rotating part, rotating wings are intensively used for telecommunication satellites.
2.6. Solar Cell Array Sizing
Reliable and continuous operation of the power system is essential to the achievement of a spacecraft mission successfully. Therefore, solar array and its components such as solar panels must be designed and fabricated with reliability which can be accomplished through understanding the power system and its basic components and its operating environment. This section details the solar array design in preliminary and detailed levels in order to calculate the required total solar array area. In each level of the design, fundamental calculations are performed moderately and assuming some parameters. The final array size is to be used in panel and substrate design.

Design of the Solar Cell Array 17
2.6.1. Preliminary Design of the Solar Array
First of all, the design of solar array initiated with the preliminary design phase by establishing design requirements of the array in order to fulfill the satellite’s power requirements. These requirements are listed in Table 2.3. Table 2-3 Design requirements for the array sizing
Specification Datas
Mission - Communication equipment to be earth pointing Orbit - Geostationary Power level - 7200 W EOL Mission life - 15 years Bus voltage - 100 V Operating Temperatures - -150ºC / +100ºC Area estimation - 275 W/m2 Array configuration - Rigid fold-out Dimension constraints - Less than 2.8 m x 3.4 m (for each panel) Solar cell - TJ Solar Cell 3G30C
The selected solar cell 3G30C, is an InGaP/GaAs/Ge on Ge substrate triple junction solar cell with an efficiency class of 30%. The cell has an improved grid-design and is equipped with an integrated bypass diode, which protects the adjacent cell in the string. The mechanical data of the solar cell is given in Table 2.4: Table 2-4 TJ 3G30C solar cell desing and mechanical data [20]
Base Material GaInP/GaAs/Ge on Ge substrate
AR-coating TiOx/Al2O3
Dimensions 40 x 80 mm ± 0.1 mm
Cell Area 30.18 cm2
Average Weight ≤ 86 mg/cm2
Thickness (without contacts) 150 ± 20 μm
Contact Metallization Thickness (Ag/Au) 4 – 10 μm
Grid Design Grid system with 3 contact pads
The electrical data of the solar cell along with Beginning of Life (BOL) and 1*10-15 MeV equivalent radiation degradation are listed in Table 2.5. In addition, temperature directly affects the properties of the solar cells such that the voltage and current outputs varies with temperature. The temperature gradients of the solar cell along with Beginning of Life (BOL) and 1*10-15 radiation degradation damages are listed in Table 2.6.

18 Structural Design and Analysis of a Solar Array Substrate for a GEO Satellite
Table 2-5 TJ 3G30C solar cell electrical data Spectrum: AMO Solar constant = 1367 W/m2; T = 28 °C [27]
BOL 1E15 (radiation)
Average Open Circuit Voc [mV] 2700 2522
Average Short Circuit Isc [mA] 520.2 501.9
Voltage at max. Power Vmp [mV] 2411 2246
Current at max. Power Imp [mA] 504.4 486.6
Average Efficiency ŋbare (1367 W/m2) [%] 29.5 26.5 Table 2-6 TJ 3G30C temperature gradients at the BOL and after radiation degradation [27]
BOL 1*10-15
Open Circuit Voltage ΔVoc /ΔT↑ [mV/°C] - 6.0 - 6.3
Short Circuit Current ΔIsc /ΔT↑ [mA/°C] 0.32 0.39
Voltage at max. Power ΔVmp/ΔT↑ [mV/°C] - 6.1 - 6.4
Current at max. Power ΔImp/ΔT↑ [mA/°C] 0.28 0.29
The solar array power requirement and battery capacity requirement are determined from energy balance of the spacecraft. All the energy consumed by the spacecraft during day or night must be generated by the solar panels during daylight period of the orbit. Without loses, the total energy balance equals to: [28]
(2-4)
where;
Psa is average output from solar array over daylight, W
Td is period in sunlight, h
Te is period without solar energy, h
Pe is average power consumed during eclipse, W
Pd is average power consumed during daylight, W Besides this, solar array must also supply the energy due to all type of loses. Including these loss factors, the equation becomes: [28]
(2-5)
where,
Xe is the energy efficiency from solar array through battery to loads
Xd is the energy efficiency from solar array to loads For a Direct Energy Transfer method these values are estimated as: [28]

Design of the Solar Cell Array 19
Xe=0.65 and Xd=0.85
Practically most of the high power communication satellites with high bus voltages are using this topology. Therefore, this topology is utilized for the calculations. Using the formulas above, the total power required for the satellite is:
. Psa is the total power that must be generated by the solar array. In the following section, detailed design of the array is performed including various factors such solar intensity, angle etc. which impacts the power output from one cell.
2.6.2. Detailed Design of the Solar Array
Following the preliminary calculated power, in the next phase of the design, power output for one cell is calculated. Array sizing is strongly impacted by the operational temperature for the hot case at the end of life. Under these conditions, solar array voltage must be equal or higher than required voltage. First of all, one would need to calculate the required parameters for the formula of the power output from one cell: [29]
(2-6)
where;
is initial power output at normal sun incidence is effective solar intensity is solar cell radiation factor
is operating temperature degradation factor
miscellaneous assembly factor
shadowing factor blocking diode and wiring loss configuration factor (1 for flat panels) Calculation of every parameter is performed in order to determine the power output from one cell. First of all, solar constant factor is calculated as: [29]
( ⁄ ) (2-7)

20 Structural Design and Analysis of a Solar Array Substrate for a GEO Satellite
( ⁄ )
(2-8)
where, S sunlight intensity D array sun distance (AU)
solar cell cover factor angle of incidence For the lowest illumination level near summer solstice, the values of solar constant at
summer solstice, ⁄ and for the annual mean, ⁄ are determined [29]. Angle of incidence normal to the panel surface is important and this angle is calculated taking into account summer solstice as the worst case:
Hence, the solar constant factor becomes:
Due to the fact that solar cell output power depends on the operating temperatures, voltage output is to be correlated according to the temperature gradients as these values are tested at 28ºC. Maximum operating temperature for solar array is considered as +100ºC [30]. Voltage output adjusted according to this temperature variation utilizing Vmp temperature coefficient from Table 2.6 (under 1x10-15 1-MeV electron equivalent radiation):
( ) (2-9)
The solar cell power output degradation ratio due to temperature is calculated from the voltage drop. It is assumed 5 % of design margin for unknown errors and degradation factors:
For use of slip rings in the orientation linkage, following voltage drops are added on the bus voltage due to blocking diode and wire loss:

Design of the Solar Cell Array 21
Once all the required parameters are obtained, power output from one cell is calculated utilizing Equation 2.6:
Total required power is then divided by a solar power output from one cell, number of solar cells are:
According to the number of solar cells, a packing factor is assumed as 0.9 in order to calculate total solar array area. Multiplying number of solar cells by the area of a single solar cell which is 30.18 cm2 (Table 2.3), the total solar array area is:
The result obtained is the required total solar array that will generate the satellite’s power. However, a final design phase is required in order to optimize the array size with respect to number of cells in series and parallel in order to fulfill required bus voltage output at the worst scenario. This is performed in the following subsection.
2.6.3. Final Design of the Solar Array
Solar array and consequently solar panel sizing is strongly impacted by predicted operational temperature at the end-of-life (EOL), because this represents the lowest voltage. On the other hand, minimum available solar array power occurs at the end of life in cold case i.e. when the solar intensity is at minimum level. Figure 2.9 shows the minimum and maximum power conditions for a solar cell in terms of hot and cold cases. According to this figure two cases are important for solar array design: [31].
Case 1: EOL, when solar intensity is at maximum level. This determines the required cells in series (a string). This string has to provide enough voltage under this case.
Case 2: EOL minimum power point when solar intensity is at minimum level. This determines the solar array size.

22 Structural Design and Analysis of a Solar Array Substrate for a GEO Satellite
Figure 2-9 Solar cell minimum and maximum operational power points [32]
Considering Case 1, under these conditions bus voltage must be equal or exceed the required level including losses. Solar cells that are connected in series must provide enough voltage at this worst case scenario. Maximum operating temperature is considered as 100ºC [31]. Therefore, after radiation degradation at 1E15 1-MeV electrons/cm2, the values for maximum power point voltage is 2.246 V and temperature coefficient -6.4mV/ºC is taken from Table 2.4. Solar cell voltage after radiation (at EOL) at maximum temperature:
( )
( )
Loss factor due to voltage drops, diodes and wiring are estimated 5% of the bus voltage. Number of cells connected in series that will form a string to provide required bus voltage is then equals to:
Considering Case 2, the minimum available solar array power condition, which determines the size of the solar array, occurs at end-of-life (EOL) at that time of the year when solar intensity is at minimum. This happens after summer solstice. Lowest current is obtained in this period of the year. The temperature is estimated as 80ºC. After radiation degradation, maximum current from one cell is 0.487 A. Maximum current at this temperature taking into account for the maximum distance loss at the current density by a factor of 0.965:
( )

Design of the Solar Cell Array 23
The solar cell string voltage under these conditions is calculated adjusting voltage to this temperature:
( )
:
The power from one string is simply multiplication of the string voltage by the aforementioned current and loss factor due sun angle:
The total number of strings required is calculated by dividing solar array power by power of a string including a loss factor 0.92 due to converter: [33]
( )
For array design, if a packaging factor of 0.9 is assumed for the spaces between cells, stay out areas for hinges, mechanisms and other areas where cells cannot be placed. Total substrate area will be:
To verify the design comparing the result with other arrays, specific power can be calculated as below:
For the design of the solar array, it is better practice to compare results with the known array size or more specifically solar array figure of merits. There are various figures of merit that can be considered in developing a solar array. Table 2.7 provides representative values in order to compare array with respect to specific weight (W/kg), specific power (W/m2) and cost ($/W). This table is a guide for comparing the calculated dimensions of the array in general terms. The specific power obtained in this design, 223 W/m2 is lower than the value listed in Table 2.6 for triple junction solar cells 275 W/m2. The difference of power output is mostly due to the operating temperature of the given sample which is 60ºC. However, the output power ratios are not so different such that the calculated solar array size is in the reasonable range.
24 Structural Design and Analysis of a Solar Array Substrate for a GEO Satellite
Table 2-7 Solar cell efficiency comparisons under Geo conditions (60ºC) [23]
Solar Cell Technology
EOL Efficiency @
28ºC (%)
EOL Efficiency on
orbit (%)
Specific Power W/m2
GEO Conditions (60ºC) -1 MeV, 5E14 e/cm2
High Efficiency Si
14.1 12.5 150
2J 20.9 20.0 240 3J 23.9 22.6 275
The simplified design method followed in this work needs to be refined using energy balance incorporating solar array and battery models with panel thermal and orbital information for Sun-angle variations on the panels during various periods in the orbit. However, this issue is beyond the purpose of this work. Here, it is intended to calculate the total solar area in order to progress with solar panel substrate design. Additionally, utilizing loss factors, error margins, sun-angle, voltage and current adjustments, it is aimed to best converge the result of the total area. As a conclusion, the array size calculated is utilized in the substrate design.
2.7. Deployment of the Array/Panels
In the design and sizing of solar array which consists of rigid panels, selection of the required mechanisms that will deploy these panels is an important factor and generally it is a conjoint process with solar panel substrate design. Although the scope of this work doesn’t include a design of deployment mechanism, a deployment mechanism selection and trade off study is necessary in order to progress the sizing and design of the panels. Therefore, this section is dedicated to the selection of deployment mechanism that will hold the panels stowed during launch and once in orbit, it will fully deploy the panels and lock them in the desired position. Solar panel and deployment mechanism design requirements and operating conditions determine the criterion for the selection of the suitable mechanisms. A trade off study is carried out at the end of the section and features of selected components are explained.
2.7.1. Evaluation of Solar Panel Deployment
For most space missions, there are three main mechanisms that stand out as the most important and necessary for spacecraft functionality. These mechanisms are:
Payload release mechanism
Solar array deployment mechanism
Antenna deployment mechanism

Design of the Solar Cell Array 25
Payload release mechanism controls the release of a spacecraft from the launch vehicle. These mechanisms mainly include use of an explosive bolt with a spring or more common electric signal release mechanism with spring system. Antenna and solar array deployment mechanisms have similarities such as hinges and hold down release components. However, due to the size of solar panels, their deployment mechanisms have different aspects. Deployment sequence of solar panels can be mainly divided into two categories. Primary one is a Hold-down and Release Mechanism (HDRM). HDRMs are standard components for a spacecraft to be able to achieve its mission. Separable parts, movable payload items, deployable appendages would be secured during flight and release depending on purpose. HDRMs for spacecraft applications are composed of two elements: [34]
Hold Down Preloading Assembly (bolt, nut, threaded rod, cam/lever, cable rope) provides a preload that will secure structure during flight.
Hold Down Release Actuator will release preload upon a command of electronic
In order to evaluate these technologies i.e. devices, design requirement and operation conditions of the satellite needs to be clarified. These requirements are:
Operating temperatures between -150ºC and + 100ºC
Anti-galling materials shall be used for manufacturing. Provide anti-gall surface treatments to prevent damage in assembly/disassembly/adjustment operations. Provide anti-gall treatment for titanium parts and fasteners.
Space heritage
Pyrotechnically actuated devices, motor driven devices or other suitable techniques may be used to retain deployable panels in the stowed position.
In order to maximize the reliability of selection, several documents on deployment mechanism designs such NASA and ESA technical reports were investigated. A special interest was given on “lessons learned” sections in these documents. A summary of these important design aspects are: [35]
Maximum utilization of rolling surfaces, as opposed sliding motion should be used
Lubricating or separation of all moving surfaces either by suitable aerospace grease or dry lubricant coating should be used. No exceptions are allowed, even for lightly loaded “friction compatible” surfaces
Smooth and polished mating surface are preferred.
Dissimilar material mating surface should have low mutual solid solubility, or at least one of the two should have a heavy dissimilar coating (e.g nitride, carbide or oxide)
After clarifying the selection criterions, the available technologies are gathered focusing on the solutions for rigid panels.

26 Structural Design and Analysis of a Solar Array Substrate for a GEO Satellite
2.7.2. HDRM (Hold Down Release Mechanism) Selection
HDRMs or restrain of solar panels rely on different technologies. ESA suggesting technologies along with allowable operating temperatures are: [35]
Pyrotechnic devices (release nuts/bolt cutter, separation nut, cutters, wire cutter, cable cutter )
Split spool devices (Fusible wire, SMA wires)
Solenoid actuated nuts,
SMA triggered nuts (-60°C /+70°C)
SMA actuators (pin pullers/pushers) with range of (-60°C /+70°C )
Paraffin actuators (pin pullers/pushers) with range of (-60°C /+80°C )
Electro-magnetic /solenoid pin pullers/ pushers with range of (-60°C /+80°C )
Electromagnets/magnetic clamps
Thermal cutters/knife Considering design criteria, most of these mechanisms such as shape memory alloy (SMA), paraffin actuators, electro-magnetic pin pullers/pushers are not suitable due to the limited operating temperature. Although, pyrotechnic devices are not strictly limited in operating temperatures, due to potential space debris problems, they are not considered. Additionally, thermal cutters/knifes potentially can lead to space debris although they have a vast space heritage. Besides, the hook mechanism that releases the panels is complicated. However, electromagnets/magnetic clamps have been widely used in the latest satellites and don’t lead to space debris. Besides, release time can be controlled and release shocks are very low. High release shocks can lead problems in the attitude control system of the satellite. Therefore, it is seen that, magnetic clamp type restrain mechanism is the most suitable option. Detailed evaluation of these mechanisms is provided in Figure 2.12. A possible commercially available product is investigated and selected considering these aspects. Figure 2.10 shows non-explosive, easy resettable low shock release unit which can be actuated multiple times without any refurbishment (100 % reusable) The current design is able to release a tensile load of 16 kN at a weight of approx. 750 grams. The core of the low shock release unit (LSRU) is a roller screw comprising a threaded spindle engaged with a nut. The thread of the spindle is a non-self-locking multiple thread. Engaged with the corresponding roller nut, a small axial force applied to the spindle induces a rotation of the nut. [36] The total release actuation comprises the following sequence: One or both magnetic actuators release the spring loaded locking lever. The spring force disengages its locking nose from the gap in the roller screw housing. The tensile load on the spindle induces the rotation of the unlocked roller nut, disengaging the spindle. (Figure 2.10) Solar array substrates have inserts or holes, in the lcoations where these HRDMs are attached to the solar panels. Therefore, the solar cells in the vicinity of these holes should be moved aside, in a way that the solar power output will not affected. The radius of the holes will be the same as the HD bushings.

Design of the Solar Cell Array 27
Figure 2-10 Solar Panel HDRM/ restrain Unit a) Magnetic Housing b)Assembly of the unit
with hold down bushing and fixation nut [36]
2.7.3. Actuation Mechanism Selection
The second part of the deployment is the actuation of the panels after release. This can be realized in several methods such as springs, spin of satellite, electric motor. Due to the fact that assembly of a solar array consists of rigid panels that are interconnected to each other by hinges, generally, the actuation is through these hinges. Conventional actuation mechanisms available for rigid panels are given in Table 2.8. Table 2-8 Thales Alenia Solar Array Deployment Mechanisms Properties [37]
Torsion Spring
Elastic Hinge “ADELE” Shape Memory
Alloy
Mass 210 250 1,170 <100 g
Deployment angle 180 0 to 180 to 180 to 180 º
Reproducibility in deployed configuration
± 0.5 ± 0.3 º
Stiffness in deployed configuration…
bending >2000 800 ±5 2800 ±9 Nm/rd
torsional 100 2000 ±9 Nm/rd
Operational temperature
-180/+120 -80/+80 -80/65 -80/+80
Motor torque From 1 to 6 ≥0.2 Nm

28 Structural Design and Analysis of a Solar Array Substrate for a GEO Satellite
Figure 2.12 shows the evaluation of other possible options for the deployment of panels along with restrain mechanisms. Properties of these mechanisms are rated from 0-3 favoring the better features rating higher in the aspects of simplicity, reliability, temperature limits, lower space debris risk, space heritage etc. At the end of the row of each mechanism, these rating values are summed providing a criterion for the selection. Considering Figure 2.12 and Table 2.8, the only and best option for the actuation of panels is decided as the torsion spring from Thales Alenia Company as it is shown in Figure 2.11. It provides a wide range of working temperatures and enough motor torque to unfold the solar panels (up to 6 Nm). These torsion springs would be employed between rigid solar panels at two points. Most of the telecommunication satellites have been employing this type of actuator due to their ease of use and flexibility. For instance, ADELE hinge is being used for the lateral unfold of the panels in Spacebus platforms. In this case, it is not suitable due to temperature limits. According to the Figure 2.12, electric motors could also be considered between hinges. However, the reliability of motor is less and they bring more complexity to the design. Hence, torsion spring are chosen for the deployment of panels. The structure of the torsion spring is presented in Figure 2.11. As a conclusion of the selection of the deployment mechanisms, considering Figure 2.12, among the actuation mechanisms a torsion spring system and among the hold down release mechanisms, magnetic clamp system are the most convenient according to the design requirements. Based on the selected items, restrain and actuation of the panels in term of deployment sequence would be as follows:
The solar panels on each wing would be stowed together and attached to the satellite wall with a magnetic clamp (HDRM). The magnetic clamp would hold the panels together and release on orbit with a command. These magnetic clamps retains low shock
Panels will be attached together with hinges that will enable a rotational movement. Inner panels will move 180º.
Torsion springs would move the panels until the angle between each panel 180º. Torque ratio, which is the ratio of available torque divided by maximum resistive torque, shall be at least 4.
Wet lubricant or aerospace grease would be used between surfaces to avoid stiction. In this case a Molybdenum Disulphide will not be suitable due to the fact that it has a tendency to absorb water which can freeze later and jam hinges.
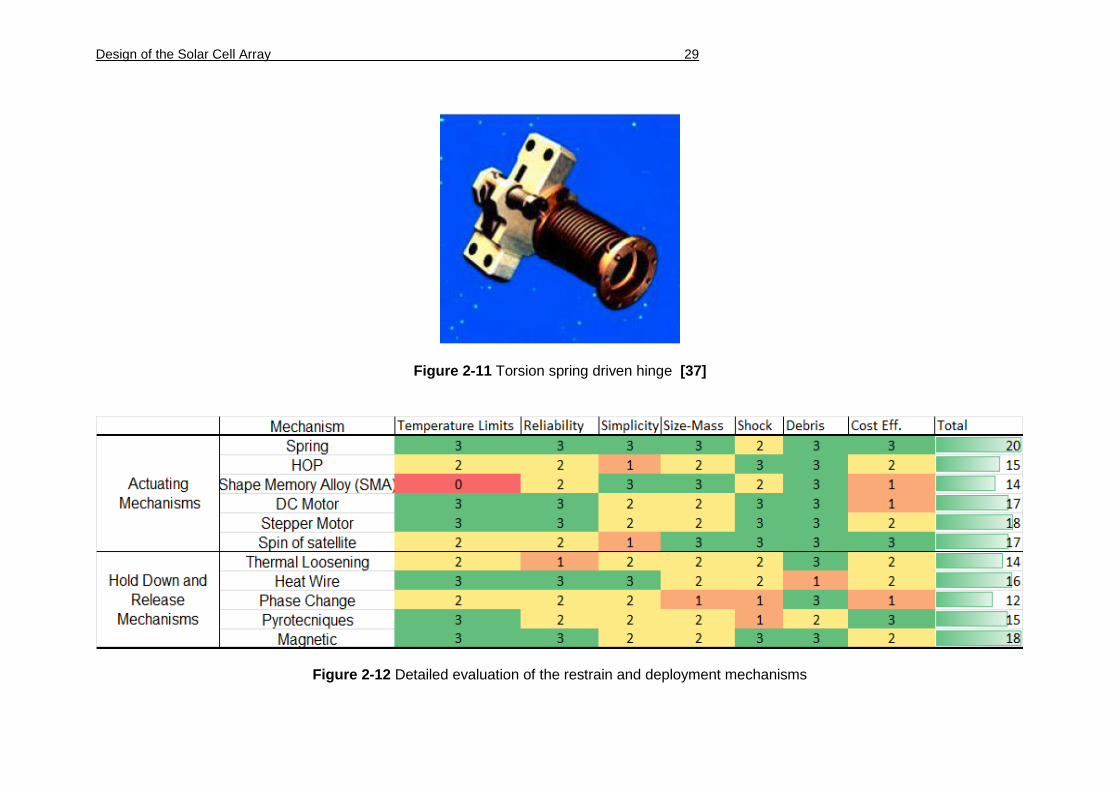
Design of the Solar Cell Array 29
Figure 2-11 Torsion spring driven hinge [37]
Figure 2-12 Detailed evaluation of the restrain and deployment mechanisms
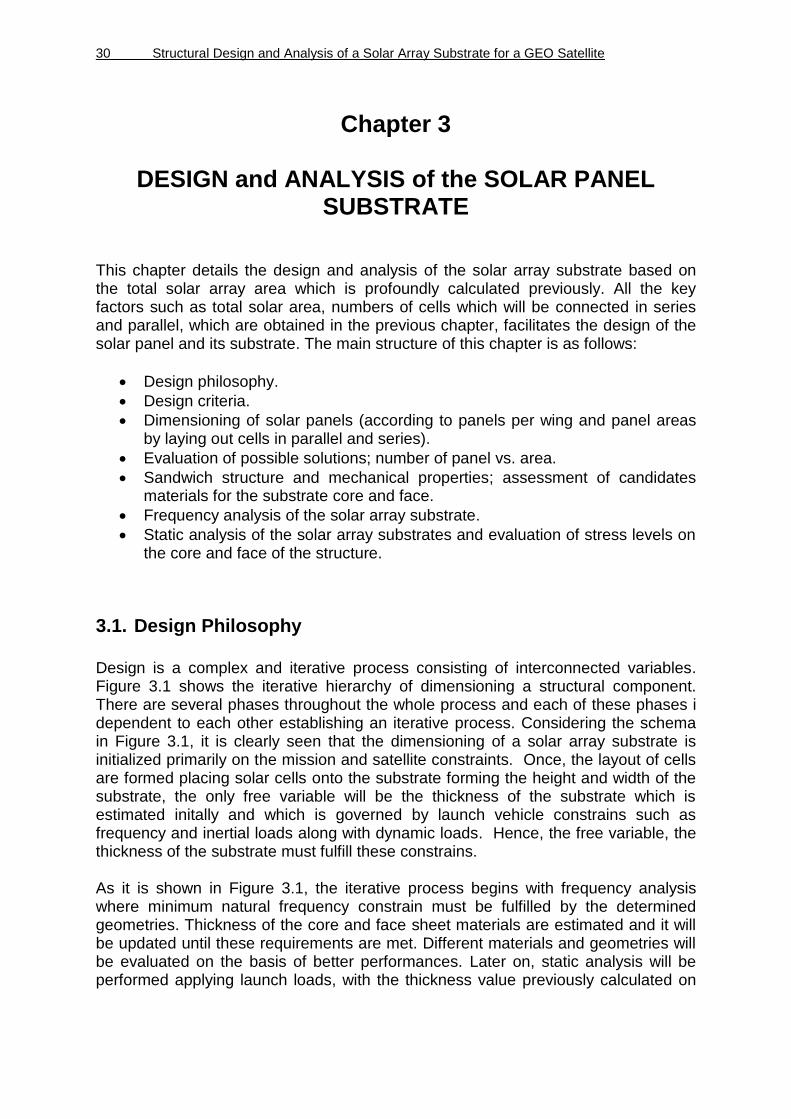
30 Structural Design and Analysis of a Solar Array Substrate for a GEO Satellite
Chapter 3
DESIGN and ANALYSIS of the SOLAR PANEL SUBSTRATE
This chapter details the design and analysis of the solar array substrate based on the total solar array area which is profoundly calculated previously. All the key factors such as total solar area, numbers of cells which will be connected in series and parallel, which are obtained in the previous chapter, facilitates the design of the solar panel and its substrate. The main structure of this chapter is as follows:
Design philosophy.
Design criteria.
Dimensioning of solar panels (according to panels per wing and panel areas by laying out cells in parallel and series).
Evaluation of possible solutions; number of panel vs. area.
Sandwich structure and mechanical properties; assessment of candidates materials for the substrate core and face.
Frequency analysis of the solar array substrate.
Static analysis of the solar array substrates and evaluation of stress levels on the core and face of the structure.
3.1. Design Philosophy
Design is a complex and iterative process consisting of interconnected variables. Figure 3.1 shows the iterative hierarchy of dimensioning a structural component. There are several phases throughout the whole process and each of these phases i dependent to each other establishing an iterative process. Considering the schema in Figure 3.1, it is clearly seen that the dimensioning of a solar array substrate is initialized primarily on the mission and satellite constraints. Once, the layout of cells are formed placing solar cells onto the substrate forming the height and width of the substrate, the only free variable will be the thickness of the substrate which is estimated initally and which is governed by launch vehicle constrains such as frequency and inertial loads along with dynamic loads. Hence, the free variable, the thickness of the substrate must fulfill these constrains. As it is shown in Figure 3.1, the iterative process begins with frequency analysis where minimum natural frequency constrain must be fulfilled by the determined geometries. Thickness of the core and face sheet materials are estimated and it will be updated until these requirements are met. Different materials and geometries will be evaluated on the basis of better performances. Later on, static analysis will be performed applying launch loads, with the thickness value previously calculated on

Design and Analysis of the Solar Array Substrate 31
modal analysis section. If the stress results of design loads are higher than material limits, the thickness will be increased until a positive factor of safety is obtained.
Figure 3-1 Phases of dimensioning a structural component [39]
In this chapter, the primary aim is configuring different solar panel dimensions based on the solar cell layout and later on, utilizing these dimensions to obtain a thickness value that will minimize the mass of the panels. These geometries will be analyzed under launch induced loads in order to verify thickness. The steps that will be followed are summarized as follows:
i. Identification of design requirements for solar array substrate ii. Solar panel dimensioning according to the solar cell layout iii. Evaluation of sandwich structure and its mechanical properties iv. Determination of candidate material for sandwich core and face sheets v. Dynamic analysis utilizing FEA (Evaluating different geometries, core and
facing materials and orientations and their effects on the natural frequencies of the substrate)
vi. Determining launch loads and combining them into static load factors vii. Static analysis utilizing FEA and verifying stresses and failure of candidate
materials viii. Design review, selection of optimum geometry that minimizes mass and
provides higher reliability
3.2. Design criteria for the Substrate Structure
A standard explanation for a structure is that a set of mechanical components or assemblies designed to sustain loads or pressures, provide stiffness or stability. The total structure of a satellite can be divided into three parts: [40]

32 Structural Design and Analysis of a Solar Array Substrate for a GEO Satellite
1. Primary structure: Mechanical parts that holds the subsystem together and resists and supports most critical load conditions. The backbone of the system.
2. Secondary structure: Mechanical parts needed by each subsystem. These are appendages and support structures (such as solar arrays, antennas, fuel tanks)
3. Tertiary structure: Less essential mounting hardware (brackets, component housing connecter panels)
. According to this classification of spacecraft structures, solar array substrates are in the secondary structure group. Their main purpose is to provide space or area for solar cells, maintain their integrity under launch loads and in orbit. The functions of solar array substrate are:
To guarantee the necessary strength to survive all phases of the satellite life (in particular the most critical: e.g. the launch) without failures.
To keep the structural stiffness in certain limits to guarantee the operational functionality of the overall system and avoid coupled resonant responses. [33]
To provide the support to the solar cells, maintain their integrity and safety of wiring connections
Especially high dimensional stability on the surface for low distortions due to thermal gradients
Since the mass is very crucial in a mission, the substrate should be optimized with respect to it both in terms of material and in terms of the optimal structural geometries. Structural problems have direct impact on other subsystems such as damages on solar cells interconnections due to high elongations on the surface. In fact every component of a satellite needs to withstand the mission environment and a structural failure could occur in a component of the system and might be critical for the success of the mission. For the design of solar panel substrate, the following structural design guides are considered: [40]
a. The structural design shall lead to an item that is proven to be strong and stiff enough for the intended purpose throughout its intended life time;
b. The structural materials used shall have known, reliable and reproducible properties and shall have proven resistance to the environmental factors;
c. The structural materials shall not be hazardous to the operators, crew or mission;
d. The structure mass shall be minimized; e. The structure shall be cost effectively manufactured, by methods that do not
alter the designed characteristics (mechanical or environmental resistance)in an unknown way, and by methods proven to be reliable and repeatable;
Additionally, operating temperatures for the satellite’s solar array is defined between -150ºC to +100ºC. Therefore, substrate shall have a small coefficient of thermal expansion which will reduce the thermal elongations under these temperature deviations. This is crucial for the integrity of the solar cells and thus sake of the power generation. Furthermore, the due to vacuum condition in space, composite materials must be vacuum compatible to prevent outgassing of absorbed water and/or materials constituents which could change the material’s properties and

Design and Analysis of the Solar Array Substrate 33
performance. Composite materials such as carbon-epoxy are commonly used in space applications due to their high stiffness to weight ratio and low thermal coefficients. For the outgassing problem, they need to be hold in long thermal vacuum and then covered with special tape or coating to prevent re-absorption of volatile substances. Radiation environment can be dangerous in many aspects such as degradation of coatings and various polymeric materials In the GEO orbit, a low shielded component which is directly exposed to space may accumulate more dose than the limit leading the end or malfunctioning of panels. Therefore, proper radiation resistant shield shall be considered for the solar panel substrate facing, especially if polymer materials are employed which could lose around 50-60 % of their shear strength after large doses of radiation [41].
3.3. Dimensioning of Solar Panel Substrate Geometries
Since the number of cells in parallel and series and total solar area are already calculated previously, the next step is dimensioning of solar panel geometries. These parameters are summarized in Table 3.1. The geometry of the solar cell 3G30C from the manufacturer’s data sheet is shown in Figure 3.2. These dimensions, 40 mm and 80 mm, are employed in dimensioning the geometry of a solar panel. Table 3-1 Design parameters for the solar panel geometries
Property Data
Solar Area 40.56 m2
Number of cells in series (a string) / panel 59 Number of strings (parallel) 205 Dimensions of a single solar cell size 40 cm x 80 cm Area of a single solar cell 30.18 cm2
Maximum panel dimensions 2.8 m x 3.4 m
Figure 3-2 Dimensions of the selected solar cell, 3G30G [42]

34 Structural Design and Analysis of a Solar Array Substrate for a GEO Satellite
Since the solar array consists of two wings, total solar area is intuitively divided by two, creating two equal areas for both sides of the wing. Solar area of one wing is then calculated as:
It is very practical to have similar panel sizes for the ease and cost of manufacturing of solar panels. However, if number of panel increases, the inertia of the solar panels will increase and more energy will be required for attitude control system. Additionally, more panels will bring on more deployment costs due to more hinge, harness and connection. Furthermore, the volume of stowed panels will proportionally increase with every additional panel created. A typical value of a solar panel area for a large satellite is around 8 m2. Besides, due to the geometric constrain of the solar panel sizes, the maximum area allowed for a panel is 2.8 m x 3.4 m which is 9.52 m2. Considering these aspects, solar panel area and panel sizes that are appropriate are created in Table 3.2. These panel values are explored in the following step where solar cells in series and parallel are layout on a panel substrate. Table 3-2 Possible solar panel number and panel area
Wing area (m2)
Number of panels per wing
Panel Area (m2)
Dimensions of a Square Panel (m)
20,28 2 10,14 3,18 x 3,18
20,28 3 6,76 2,60 x 2,60
20,28 4 5,07 2,25 x 2,25
20,28 5 4,06 2,01 x 2,01
In the next phase, detailed sizing of solar panels is performed taking into consideration of wiring and interconnections gaps of solar cells. In order to find specific dimensions of a panel, minimum required solar cell area layout is created as in Figure 3.3. where;
( ) (3-1)
( ) (3-2)
Number of solar cells in series (one string)
Number of solar cells in parallel (number of strings) Solar cell width Solar Cell length
End contact bar width End contact cell gap

Design and Analysis of the Solar Array Substrate 35
Figure 3-3 Minimum solar cell area required on a solar panel substrate
Solar cell sizes are taken from the manufacturer’s data sheet as shown in Figure 3.2. Remainders of these values are estimated as below providing enough gaps for wiring, interconnectors and hinges. [29]
Once these values are determined, the primary step is keeping the bus voltage the same in every panel. This states that the number of solar cells in series must be the same in every panel, therefore, number of cells will be the same, 59, in every panel and number of strings will vary depending on the number of panels. Utilizing Formula 3.1 and 3.2, and various dimensions and configurations are created in Table 3.3 by altering free variables such as M, A, and B and layout direction of the solar cells. N is not a free variable. However, M is dependent on the number of panels. For that reason, total number of cells in parallel, 205, is divided by total number of panels. If the value is not an integer, the value is rounded up to a bigger number. In Table 3.3, possible panel dimensions are created in the form of AxB values. Considering solar panel dimension criterion that maximum dimensions shall be less than 2.80 m x 3.40 m., 2 panels per wing option is eliminated due to A, 4.262 m is not acceptable. Additionally, when there are 5 panels per wing, the deployment of cost will increase dramatically, and it will bring on more complexity on the deployment leading a less reliable system. Therefore, this option is also eliminated in

36 Structural Design and Analysis of a Solar Array Substrate for a GEO Satellite
the Table 3.3. As a summary, case 1 and 2 are remained as possible candidates. These geometries are evaluated in the FEA section and depend on the results optimum geometry is selected.
Table 3-3 Different solar panel geometry dimensions. A trade is shown with number of panels vs panel area
Case Number of
panels per wing)
N (cells in series)
M (cells in parallel)
A (mm) B(mm) Panel Area (m2)
Total solar cell array area (m2)
4 2 59 52 4262 2476 10,55 42,21
1 3 59 35 2868 2476 7,10 42,61
2 4 59 27 2130 2476 5,48 42,19
3 5 59 21 1720 2476 4,26 42,59
On the other hand, these dimensions tend to change due to the selected deployment mechanism. Hold down and release mechanism may require more space than the present spacing. Therefore, 3D model of the panels are created in the in order to demonstrate the actual layout of solar cells and final solar panel dimensions. The purpose of the 3D model of a solar panel assembly is to demonstrate and verify the required solar panel dimensions. Solar cells are placed on the solar panel substrates with respect to the gaps defined in Figure 3.3. Later on, spaces for hinges and enough gaps from the edges are formed. For the Case-1, where there are 3 solar panels in each wing of the solar array, the model of the solar panel is created in Figure 3.4 with its new dimensions. Holes for the restrain mechanism points are also extracted. Hence, the new dimensions of the case 1 are 2550 mm x 3050 mm. This model will be evaluated in the FEA analysis. The Case-2, where there are 4 panels per wing is created in Figure 3.5. The holes for the restrain mechanisms (hdrm) are extracted and hinge locations on the substrate are indicated. For the both panel cases (geometries), the hrdm holes locations are at equal distance from the edges. The circumference of these pins is chosen in a way that they will be at the center of 2 adjacent solar cells. This will provide enough space for the assembly of panels and hold down pins. For both cases, the improved dimensions are aimed to provide enough spaces for displaced solar cells, hinge connections in both sides and for handling of the panels. These improved dimensions, number of panels, solar cells are summarized in Table 3.4.

Design and Analysis of the Solar Array Substrate 37
Figure 3-4 Solar Panel Geometry-1 (Case-1)
Figure 3-5 Solar Panel substrate Geometry-2 (Case-2)
Hinges
Hinges

38 Structural Design and Analysis of a Solar Array Substrate for a GEO Satellite
Table 3.4 shows that, the increase in the number of panels, lead to a slightly higher total solar area. When there are 4 panels in each wing, the total solar area gets almost 1m2 larger. Increase in the total solar area consequently would lead an increase in the total solar array mass. However, since the thicknesses of the panels are not decided yet, the smaller panel size could be possible have less thickness and therefore less mass. For this reason, these two models are examined in FEA section, in order to compare the ultimate performance of these panel geometries. Table 3-4 Solar panel substrate candidate geometries and their dimensions
Geometry Number of
panels per wing
N (cells in series)
M (cells in parallel)
A (mm)
B (mm)
Panel Area (m2)
Total solar array area
(m2)
1 3 59 35 3050 2550 7.78 46.66
2 4 59 27 2350 2550 5,99 47,94
In Table 3.4, it can be derived that the filling factor was not enough. The new dimensions employ a filling factor of 0.82 which is lower than the primary estimation, 0.9. Therefore, leaving more reasonable spaces for hinges and hdrm pin attachments clearances, increased the filling factor leading a lower figure of merit. In Figure 3.6, solar cell panel layouts of Formosat and Gokturk 2 are given in order to provide example designs of solar panel substrates. In these layouts, it can be seen the displaced solar cells due to hdrm holes and gaps for hinges. Besides, it shows that how the design of solar panel substrate can change depend on the mission, satellite and deployment constraints. It is clearly seen that presented layout of solar panel examples which are already operating, are optimized such that unnecessary areas on the substrate where there are no solar cells and/or mechanism, are extracted in order to save mass.
Figure 3-6 a) Formosat solar cell layout for on a solar panel substrate [43]

Design and Analysis of the Solar Array Substrate 39
Figure 3-7 b) Gokturk 2 solar cell layout on a solar panel substrate [43]
In addition to the models of the solar panels, the conceptual assembly of the satellite including solar panels and hdrm attachment points is created in Figure 3.8. UHF antennas are in opened position with green color. Solar panels on the +Y axis are in stowed position.
Figure 3-8 Complete Assembly of Satellite
The Finite element analysis will be focused on the verification of these stowed panels under launch induced loads. Therefore, two models that are detailed in Table 3.4 will be utilized in FEA and final geometries will be determined in FEA section.
UHF Antennas (Opened)
HDRMs (4 units)
Solar Panels (Stowed)

40 Structural Design and Analysis of a Solar Array Substrate for a GEO Satellite
3.4. Selection of Material for the Solar Array Substrate
The selection of materials for space applications is dependent on many factors such as mass, stiffness, strength and stability. For the design of solar panel substrates, main design objectives are minimizing mass under design constrains such as vibration, inertial loads and dimensional stability under high temperature changes which requires low coefficient of thermal expansion. This could be achieved by maximizing material indexes while minimizing mass. For this reason, material indexes with specific objectives for panel design are given in Table 3.5 to determine the criterion for selection of materials for the solar array substrate. It is clearly seen in Table 3.5 that for a design of solar panel substrate with minimum mass objective, high specific stiffness and strength must be maximized. Besides, due to acoustic loads during launch, and high temperature cycles in orbit; good thermal and acoustical insulation properties are required. Most large area array substrate designs are particularly stiffness critical. Array stiffness is a major concern during both launch phase and orbital phase. Therefore, strength of the structure is not the dominant factor in substrate design. It has been common to design light-weight solar array substrate such that its natural frequencies are substantially higher than the launch vehicle. This can be accomplished in most cases by employing high modulus materials. For these reasons, materials with
higher specific stiffness i.e. maximizing E1/3 / ρ, are in the primary interest. Table 3-5 Material Indexes for specific objectives in a substrate design [43]
Function Constraints Objective Maximize
Panel
Length and width are fixed variable.
& Thickness is free
variable
Stiffness-limited design at minimum mass
E1/3 / ρ
Vibration-limited design at minimum mass
E1/3 / ρ
Strength-limited design at minimum mass
σf ½ /ρ
The best structure that can fulfill these requirements is a sandwich construction with different core and face sheet materials enhancing the structure’s mechanical properties. For that reason sandwich constructions are almost entirely employed in solar panel design due to their following contributions on the design:
High mass savings
High specific stiffness
Sound damping properties
Good thermal and acoustical insulation properties

Design and Analysis of the Solar Array Substrate 41
The crucial advantage of sandwich structure is increasing the stiffness of the structure without a significant increase in weight. The adhesive between core and facing sheet rigidly joins the sandwich components and allows them to act as one unit with a high torsional and bending rigidity. The striking example can be seen as in Table 3.6, that how the stiffness is multiplied without significant increase in weight. Table 3-6 An example of structural efficiency of sandwich structure in terms of weight and stiffness [44]
Relative Bending Stiffness 1 7 37 Relative Bending Strength 1 3.5 9.2 Relative Weight 1 1.03 1.06
As a conclusion, taking into considerations aforementioned aspects on required material properties, sandwich structures are considered as the main motive of this work for the design of solar array substrate. In the following subsections, the candidate materials for the construction of the sandwich structure are determined considering aforementioned factors.
3.4.1. Sandwich Structures and Sandwich Theory
Sandwich structures have been widely used for aerospace structures due their lightweight, high specific bending stiffness and strength and good energy absorbing capacity. Sandwich structures mainly, consist of three layers such as facing sheet, core and adhesive bond. The outer face sheets carry the axial loads, bending moments, in plane shears while the core carries normal flexural shears such as in I-beam. Figure 3.9 shows the I-beam representation of sandwich structures.
Figure 3-9 Sandwich Panel and I beam representation [45]

42 Structural Design and Analysis of a Solar Array Substrate for a GEO Satellite
Proper design and analysis of sandwich structures demands a deep understanding of the mechanical behavior of both the skin and the core. The skins are relatively simple in case of use of composite laminates as their methods based on laminate theory. However, when it is about the core, mechanical modeling of the core, particularly for honeycombs, is less straight-forward. Since sandwich structures are frequently employed in designs, several works have been carried out for better understanding of the mechanical behaviors of sandwich structures including optimal design maps utilizing three point bending tests. An important work was carried out by Gibson and Ashby giving a thorough overview of the literature on cellular materials [46]. Moreover, considerable effort has been devoted on analysis of sandwich panels and modeling the panel as a beam assuming that the skins are thin relative to core and presented by Allen [47]. An important study on the equivalent analysis of sandwich plates for satellites structures utilizing finite elements analysis have been recently performed by Li-juan et al [48]. Thanks to these contributions on sandwich structures, it is more straight-forward to estimate the behavior of the sandwich core with finite element methods. It is well known that for the analysis and design of the sandwich structures, engineering constants such as Young’s modulus, poison ratio, shear moduli etc. are required. As aforementioned, there are several methods to obtain the equivalent parameters of a honeycomb sandwich plate and the conventional methods utilize sandwich theory, honeycomb plate theory or equivalent plate theory. Sandwich theory is commonly used to describe the behavior of a beam, plate or shell which consists of three layers being two face sheets and one core. Additionally, it provides the equivalent parameters of the honeycomb core which is a great advantage to model all the layers in Msc. Patran finite element analysis tool. In sandwich theory, it is assumed that the core can resist transverse shear deformation and has some in-plane stiffness. Under this assumption, honeycomb core can be regarded as orthotropic layer/ laminate. For the hexagonal honeycomb, equivalent elastic constants are: [48]
√ (
)
(3-3)
√
(
)
(3-4)
√
(3-5)
√
(3-6)
(3-7)

Design and Analysis of the Solar Array Substrate 43
where;
is Young’s moduli and is shear moldui of the material of the core,(aluminum). is the length of the honeycomb cell. is the thickness of the honeycomb cell.
is the technology corrected coefficient whose value is about between 0.4 and 0.6. Applying these equations, it is possible to calculate required engineering values to model the honeycomb plate and perform a finite element analysis based on these values. In addition, the results of these formulas above exhibit common behaviors such that are very small values. Therefore, these values would be
considered 1 during analysis. The reasons of choosing sandwich theory rather than honeycomb plate theory and/or equivalent plate theory, are: [48]
Sandwich theory provides the equivalent parameters of the honeycomb material whereas the other theories equalize the whole honeycomb structure to a conventional plate. This is very practical in the sense of modeling the sandwich structure for FEA in Msc Patran, because core materials with different core thickness and cell thickness can be modeled as orthotropic lamina along with CFRP face sheets.
Required engineering constants solely for the core material can be calculated which enables modeling of different materials.
There are proven examples based on this theory in FEA tools and tests for the design and analysis of satellite structures.
In the FEA tool software, MSC PATRAN, material property of the whole sandwich structure can be established by laying-up top and bottom surface layers and honeycomb core with equivalent parameters obtained.
There are various design aspects for sandwich structures. Major design aspects that should be evaluated during the design are: [49]
The core shall have adequate strength to carry the general shear forces and the local shear forces introduced via the inserts.
The core shall have adequate strength and stiffness properties to prevent local and global buckling
The diameter of the cells (in case of honeycomb core) shall be selected to prevent buckling of the unsupported face sheet.
The sandwich construction shall have good overall stiffness properties. Design of sandwich structure is a challenging process due to three layers that it consists. The thicknesses of these parameters have different impact on the strength and excessive thickness values can lead significantly increased panel weights. Considering these reasons one can minimize mass of the sandwich by optimizing the ratio between core height hc (m) and face sheet thickness tf (m). Ignoring the mass of adhesive, the minimum mass against bending stiffness and strength are derived as: [49]

44 Structural Design and Analysis of a Solar Array Substrate for a GEO Satellite
Bending stiffness:
(3.8)
Strength criterion:
(3.9)
where,
= density of core material (kg/m3) = density of face sheet material (kg/m3)
= face sheet thickness (m)
= core thickness (m) Using these equations and assuming a CFRP face sheet with 1 mm thickness, the core thickness would be calculated as 50 mm for the bending stiffness and 25 mm for the strength criteria. Therefore, these equations are practical in estimating the initial thickness of core and facing sheets. Bending stiffness is an important factor for both design aspects such as deflections under loading and high stiffness values which increases the primary natural frequency of a component. Additionally, bending and shear stiffness of sandwich panel is defined as: [45]
( ) (3-8)
( ) (3-9)
Where, is length of the panel and is the bending stiffness of the panel, is the transverse modulus of the panel. In these equations, it is clearly seen that, the bending stiffness of a sandwich panel is square times proportional with the height of the panel. Therefore, increasing the distance between core and face sheets have the major effect on stiffness. For the shear stiffness, transverse modulus plays the major factor on increasing transverse or shear stiffness.
3.4.2. Core Materials
There are various materials commercially available for the core material of a sandwich structure. Most frequently used core materials for spacecraft applications are divided into two main groups such as honeycombs and foams.
3.4.2.1. Honeycomb Materials
The honeycomb core materials can be metallic such as aluminum or non-metallic materials such as fibre reinforced plastics from carbon, aramid, fiber glass.

Design and Analysis of the Solar Array Substrate 45
Honeycomb materials of titanium, stainless steel and other types are not frequently used in aerospace applications. Figure 3.10 shows a sandwich panel which is conventionally used in aerospace applications made of prepreg facing skin and aluminum honeycomb.
Figure 3-10 Conventional sandwich structure construction for aerospace applications a) Honeycomb panel and prepreg skins [50] b) Hexagonal cell of honeycomb structure [48]
Honeycomb sandwich panel is very popular in aviation and aerospace applications because of its simple production and higher efficiency in stiffness and shear strength. Standard hexagonal honeycomb structure is the most common cellular honeycomb configuration and is available in all metallic and non-metallic materials aforementioned. The honeycomb core is frequently manufactured by expansion method. In this process, the sheet layers of substrate material are stacked with adhesive lines printed on them. Then these adhesive lines are cured and Later on are expanded to form honeycomb structure. The process is summarized in Figure 3-11.
Figure 3-11 Expansion Process of Honeycomb Manufacturing [51]
Another method for manufacturing honeycomb core is corrugated process which is used to produce products in higher density range. Adhesive is applied to corrugated

46 Structural Design and Analysis of a Solar Array Substrate for a GEO Satellite
nodes and these corrugated sheets are stacked into blocks. Corrugated process is
represented in Figure 3.12. Non‐metallic, fibre‐reinforced plastic honeycombs are manufactured by impregnating a prefabricated cell‐shaped fabric in a resin bath.
Figure 3-12 Corrugated Process of Honeycomb Structure [51]
Honeycomb structures are supplied in different cell shapes such as hexagonal, OX, flexcore. Among these, hexagonal shapes are the most common cell shape providing minimum density for a given amount of material. However, OX core is a modified hexagonal honeycomb that has been over expanded in the W direction, providing a rectangular cell configuration that increases W shear properties and decreases L shear properties when compared to hexagonal honeycomb.
Figure 3-13 Honeycomb cell shapes and fundamental axes definitions a) Hexagonal Core
b) OX core [52]
The mechanical properties of honeycomb core materials are strongly influenced by the characteristics of the materials from which they are manufactured as well as the honeycomb geometry. For instance honeycomb shear strength varies significantly with core thickness depending upon the test method, skin thickness and many other factors. Generally, the measured honeycomb shear strength decreases significantly with increasing core thickness. Therefore, in aerospace applications, aluminum honeycomb cores are tested at 0.62 in (15.5 mm) core thickness and non-metallic cores are tested at 0.5 in (12.2 mm). These variations are corrected by employing shear strength versus core thickness graph shown in Figure 3.14. Shear strength of

Design and Analysis of the Solar Array Substrate 47
metallic and non-metallic materials with different core thickness are corrected according to this graph.
Figure 3-14 Core thickness correction factor [54]
In some space applications, honeycomb cells are vented through drilling or slotting to allow entrapped air to escape. Additionally, due to vacuum conditions in space, outgassing of air that was present when the facings are bonded build-up pressure that would peel the facing causing the sandwich panel to fail. Therefore, perforated cells are chosen for the design of solar panel substrate. The free cells are drilled or slotted causing no significant decrease in core properties. This is summarized in Figure 3.15.
Figure 3-15 Honeycomb cells with holes on free cell walls for venting a) Drilled holes b) Slotted [55]

48 Structural Design and Analysis of a Solar Array Substrate for a GEO Satellite
Aluminum Honeycomb 3.4.2.1.1.
Despite the competition with other materials, aluminum alloys represents more than 70% of the materials used in aerospace applications. They exhibit very high specific stiffness, good heat transfer and electromagnetic shielding. Aluminum honeycomb materials 5052 and 5056 materials provide the maximum specific stiffness (shear modulus), and strength among the other honeycomb materials. They possess very high performance-to-cost ratios. The density ranges of aluminum honeycomb materials are from 16 kg/m3 to 192 kg/m3. Operating temperature of Al 5056 reaches 200ºC and the cost of Al 5056 honeycomb is between16-26 eur/kg. When it is used for panel substrate, an additional layer has to be applied for the insulation of the panel and cells. [56] Aluminum honeycomb materials with different cell size and densities are considered among the candidate materials.
Glass Fibre-Reinforced Plastic Honeycomb 3.4.2.1.2.
This family of materials presents relatively high specific strength and stiffness and particularly utilized in antennae and nose radomes where electrical sensitivity is important. Very specific application is a matrix that retains the ablative materials for heat shielding applications such as in Gemini and Apollo re-entry vehicles. The density ranges of these honeycomb materials varies from 32 kg/m3 to 192 kg/m3 and the costs are 70-128 eur/kg [56]. More recent development, HFT, is fiberglass reinforced honeycomb, which is
composed of ±45ºC bias weave dipped in a phenolic resin, exhibits better shear properties than conventional HFP fiberglass and Nomex aramid-fiber paper. This material is considered among the candidate materials.
Aramid Fiber Paper Honeycomb 3.4.2.1.3.
Aramid fiber reinforced honeycombs from para-aramid substrates are three types. A well-known type of fibre-impregnated honeycomb is made of Nomex® paper and dip-coated with phenolic or other resins. It is an aramid fiber based fabric expanded in the same way as aluminum. The mechanical properties of the material as a core are lower than aluminum, especially in modulus. Nomex (HRH-10 and HRH-310) are commonly used in aircraft structures such as aircraft floorings. These honeycombs cores are available in densities 32-192 kg/m3 Besides the Nomex honeycombs, Kevlar 49 fabric impregnated with an epoxy resin is frequently utilized in applications where low dielectric properties are important to allow transmission of RF signals such as in antenna reflectors. Currently, to decrease the moisture intake of Kevlar, Cyanate resins have been employed for honeycombs. These type honeycombs provide excellent thermal stability and lower

Design and Analysis of the Solar Array Substrate 49
coefficient of thermal expansions (CTE) with a penalty of high costs due to manufacturing and production difficulties [57]. KOREX is a recently available honeycomb which is made from KOREX aramid-fiber paper. KOREX honeycomb offers improved strength-to-weight ratios and/or lower moisture absorption than traditional Nomex honeycomb of a similar configuration with very high costs [58]. All aramid type honeycombs are considered among the candidate materials.
Carbon Honeycomb 3.4.2.1.4.
These honeycombs are used for specialized applications, usually when precise
dimensional‐stability is the major factor. Although characteristic features of carbon honeycombs presents excellent properties for a panel substrate such as low density, low CTE and high thermal conductivity, they are not frequently employed due to very high costs compared to aluminum and Kevlar materials. General attributes of abovementioned honeycomb materials are summarized in Table 3.7. Table 3-7 General attributes of honeycomb core materials [59]
Honeycomb Core Material
Positive Attributes Negative Attributes
Aluminum (5052,5056)
Best strength to weight ratio
Good heat transfer
Electromagnetic shielding
Relatively low cost
Galvanic corrosion with carbon/graphite materials
Aramid
Good flammibilty resistance
Good fire retardance
Good insulation properties
Lightweight
Low compression and shear properties
Picks-up higher degree of moisture
Inconsistent bonding properties
Glass
Low dielectric properties
Good insulation
Good formability
Heaviest of fiber reinforced materials
Carbon
Good dimensional stability
Excellent high temperature properties
Very high stiffness
Very low CTE
Very expensive
50 Structural Design and Analysis of a Solar Array Substrate for a GEO Satellite
3.4.2.2. Foams
Foams have been extensively used as a structural core, and recent developments of high density and high quality foams of various compositions have a major impact on sandwich designs. Although cellular foams often exhibit lower stiffness to weight ratios, they have some advantageous features such as higher damping properties than honeycombs, ease of manufacturing, shaping and bonding. Among the foams frequently used in spacecraft applications are Polymethacrylimide foams, polyvinylchloride foams, and special silicon carbide (SiC) foams.
Polymethacrylimide Foams (PMI) 3.4.2.2.1.
PMI foams present very good mechanical properties among the available polymer cellular foams but with highest price penalty. These foams are traded under the name Rohacell. They exhibit high temperature resistance, thus enabling manufacturing with prepregs up to 180ºC. The cell structure is very fine with closed cells and densities ranging from 30 kg/m3 to 300 kg/m3. [60] PMI foams are considered among the candidate core materials.
Polyvinylchloride Foam (PVC) 3.4.2.2.2.
PVC foams are used in various sandwich structures for aerospace applications. Available densities are from 30 kg/m3 to 400 kg/m3. Cross linked PVC foam type is more rigid, has higher stiffness-to-weight ratio whereas linear PVC type exhibits ductility and softens at elevated temperatures. The cost of PVC is lower than PMI, nevertheless, temperature resistance is usually limited up to 90ºC. Therefore it is not an adequate core material for this design. [60]
Silicon Carbide Foams (SiC) 3.4.2.2.3.
Silicon carbide foams are porous, open-celled structures made from ceramic ligaments providing uniform characteristics thorough the material. It is also lightweight, strong, thermal shock resistant and both electrically and thermally conductive. They can endure very high temperatures, up to 2200ºC, so that potential applications are frequently heat exchangers, heat shielding and space mirrors. Properties of example SiC foam from Duocel are given in Table 3.9. Due to its higher density range, it is not considered among the candidate core materials.

Design and Analysis of the Solar Array Substrate 51
Table 3-8 Properties of Duocel SiC Foam [60]
Properties Unit Duocel
Density kg/m3. 480
Compressive Stren. MPa 1.38
Tensile Strength MPa 2.76
Shear Strenght MPa 0.69
Elastic Modulus GPa 2.76
Shear Modulus GPa 0.77
Thermal Conductivity W/m ºC 5.28
CTE 10-6/ºC 2.2
Metallic Foams 3.4.2.2.4.
Metal foams have low densities with good shear and fracture strength and are ideal for sandwich construction. They can be used for energy absorption and for
lightweight structural applications such as impact‐absorbing systems due to their ability to absorb large amounts of energy at almost constant pressure. Open cell
foams have large accessible surface areas and high cell‐wall conduction giving excellent heat transfer ability. The acoustic properties of metallic foams mean that they can be used in many places where sound absorption is essential. Figure 3.16 shows an aluminum foam core material from Alporas and its properties.
Properties Unit Al Foam (Alporas)
Density kg/m3 2000-2500
Compressive Stren.
MPa 1.3-1.7
Tensile Strength MPa 1.6-1.9
Shear Strenght MPa 0.69
Elastic Modulus GPa 0.4-1
Shear Modulus GPa 0.3-0.35
Thermal Conductivity
W/m ºC
28-35
CTE 10-6/ºC 18-20
Figure 3-16 Aluminum metal foam and its properties [56]

52 Structural Design and Analysis of a Solar Array Substrate for a GEO Satellite
3.4.2.3. Selection of Candidate Core Materials
The properties of primary interest for core materials used in sandwich structures of a solar panel substrate are:
low density,
high shear modulus,
high thermal conductivity
low coefficient of thermal expansion
cost efficiency High temperature gradients due to daylight to/from shadow (eclipse) could lead to high thermal distortions in the structure. Therefore, high thermal conductivity is important to dissipate heat rapidly. On the other hand, low coefficient of thermal expansion is vital to prevent high elongations/contractions under these temperature changes. Due to the fact that thermal properties of the materials are not in the focus of this work, candidate materials are chosen according to the higher specific stiffness criteria. According to the result of natural frequency analyses, these materials are evaluated considering these thermal properties and cost. For the selection process, Ashby charts are utilized in CES EduPack software. Honeycomb and foam materials according to shear modulus and density are plotted in Figure 3.17. In this figure, material groups are plotted with different colors such as Al 5056 in red color, aramid papers in blue and yellow. It is clearly seen in Figure 3.17 that, aluminum honeycombs cores have higher specific shear modulus. Aramid paper honeycombs and PMI foams have also moderately high specific modulus.
Figure 3-17 Honeycomb materials vs. specific stiffness’, (CES EDUPACK software plot). Al 5056 in red; Foams in olive; Aramid Paper in blue; Para-aramid Paper in yellow; Glass Fiber
in black;

Design and Analysis of the Solar Array Substrate 53
Al 5056 honeycomb materials with different cell size and densities are presented in Table 3.9. It is seen that, when the cell size increases, the density decreases; when the density is higher, mechanical properties are higher. The material designation such as in 1/8-5056-.001P-4.5 represents the honeycomb properties; 1/8 is the cell size in inches, .001 is the nominal foil thickness, P indicates perforated cells and 4.5 is pounds per cubic foot (pcf). Table 3-9 Aluminum Honeycomb core material candidates. Different cell sizes and densities are considered [60]
Compression Plate Shear
Aluminum Honeycomb
Stren. Modu. L direction W direction
(kg/m3)
(mm)
(Mpa)
(Mpa)
(Mpa)
(Mpa)
(Mpa)
(Mpa)
Al 1/8-5056-.002P-8.1
130 3 14 2997 6.5 985 3.85 351
Al 1/8-5056-.001P- 4.5
72 3 4.7 1275 3.0 483 1.7 193
Al 1/8-5056-.0007P-3.1
50 3 2.8 669 1.8 310 1 138
Al 3/16-5056 - .00015P-2.0
32 5 1.1 310 0.96 345 0.58 186
Al 3/8-5056-.0007P-1
16 9 0.34 103 0.41 103 0.24 62
Table 3-10 Candidate non-metallic honeycombs materials and mechanical properties. Almost the same density configurations are chosen to ease comparison of the materials. [60]
Honeycomb Material
Compression Plate Shear Stren. Modu. L direction W direction
(kg/m3)
(mm)
(Mpa)
(Mpa)
(Mpa)
(Mpa)
(Mpa)
(Mpa)
UCF 126-3/8-2.0
(±45º YSH50A) 37 9 1.19 117 1.04 276 0.59 165
HFT-3/16-2.0 (FiberGlass
fabric) 32 5 1,16 116 0,79 103 0,41 103
HRH-10-3/16/2.0 Nomex Paper
32 5 1.2 75 0.7 29 0.4 19
HRH-49-1/4-2.1 (Kevlar 49)
34 6.5 0,89 171 0,58 18 0,27 9
Korex-3/16-2.0 (Korex Ara.
paper) 32 5 1.1 178 0,58 82 0,48 34

54 Structural Design and Analysis of a Solar Array Substrate for a GEO Satellite
Among non-metallic honeycombs, carbon honeycombs are the most convenient material type due to very low CTE and high thermal conductivity. However, fiberglass and aramid (Nomex and Korex) honeycombs are also considered for the analysis section. Selected non-metallic honeycombs and properties are given in Table 3.10. For the evaluation of these honeycombs, the same densities are considered for ease of comparison. PMI foams are also considered among the candidate core materials. Foams exhibits almost isotropic behavior. The mechanical properties of these candidate materials are listed in Table 3.11. Table 3-11 Mechanical properties of Rohacell PMI foams [60]
Properties Unit Rohacell 51 WF Rohacell 71 WF
Density kg/m3. 52 75
Compressive Stren. MPa 0.8 1.7
Tensile Strength MPa 1.6 2.2
Shear Strenght MPa 0.8 1.3
Elastic Modulus MPa 75 105
Shear Modulus MPa 0.8 42
These core materials are employed in the FEA of the sandwich panel structure and according to the results obtained, the best convenient material and cell size are chosen among the results which provides enough stiffness and strength while minimizing the mass in these analyses.
3.4.3. Facing Material Selection
The primary function of the face sheets in a sandwich structure is to provide required bending and in-plane shear stiffness and carry bending and in-plane shear loads. In the aerospace field, prepregs which are composed of unidirectional fibers are commonly employed for the facing sheet due to their specific stiffness, low CTE and space heritage. In the early panel structures, aluminum material was widely used until the developments of composite materials find first application. Today, in most of the missions, fiber reinforced composite materials have been used for the facing of the sandwich panels. The primary advantage of these materials is their enhanced mechanical properties which can be tailored by changing orientation of fibers, number of plies etc. in order to have greater stiffness and strength. In addition, other advantage of composite materials is to help in minimizing weight which can be around 60% in place of aluminum material. Furthermore, carbon fiber reinforced composite materials have very low coefficient thermal expansion (CTE) which will be a vital advantage for the solar panel’s dimensional stability for solar cell integrity. Solar cell solders and interconnectors would not be subjected to high displacements due to thermal distortions. Generally, the CTE of CFRPs are between -1 and +1 ppm/ºC, thus with a resin system having positive CTE, a near zero CTE could be achieved [61]. For the solar panel substrates, material selection according to critical design requirements from Handbook of Composite materials are listed in Table 3.10.

Design and Analysis of the Solar Array Substrate 55
In this table it is seen that CFRP materials are always placed primarily among possible candidates and superior advantages in less moisture take up, thermal conductivity and costs compared to Kevlar, which is aramid fiber. Kevlar is the only choice when the RF signal transmissibility is the main concern of the design requirement. Table 3-12 Solar panel substrate materials based on the critical requirements [62]
Critical Requirement Solar Panel Substrate Material (face and core
Mass CFRP, Kevlar Dynamic Stability CFRP, Kevlar, Aluminum Thermal Stability CFRP, Kevlar Dynamic Loads (in g‘s) CFRP, Kevlar, Aluminum Temperature extremes CFRP, Kevlar, Aluminum Hygrostability CFRP, Aluminum High thermal conductivity CFRP, Aluminum RF transmissibility Kevlar
Type of Carbon Fibers 3.4.3.1.1.
Carbon fiber reinforcements are mainly based on PAN and pitch productions. PAN based fibers such as M55J, IM-7, T300 are commonly used and present good-to-excellent strength and high stiffness. On the other hand, pitch based carbon fibers have extremely high stiffness, low to negative CTE and therefore particularly used in aerospace structures. Both types of carbon fibers are considered for the design. Unidirectional forms are considered due to increased performance in the fiber directions.
Type of Resins 3.4.3.1.2.
The polymer matrices for CFRPs widely used in aerospace structures are thermoset resins such as Epoxies (EP), Cyanate Esters (CE), and Bismaleimides (BMI). Epoxies provide strength, durability and chemical resistance to a composite. But, they are prone to moisture pick-up during manufacturing process. Bismaleimides are mostly employed in high temperature applications in aircraft and missiles. However, they exhibit higher moisture absorption and lower toughness compared to epoxies and Cyanate esters. Cyanate esters are the most widely used resin in sandwich structures due to excellent strength and toughness, allowing very low moisture absorption and superior electrical properties. There are already space qualified Cyanate ester resin such as RS-3 from YLA Company, and being utilized in satellite, missiles and dielectric structures. Therefore for the facing material Cyanate ester carbon fiber reinforcements are considered. The moisture absorption ratios of different resins are shown in Figure 3.14. It is clearly seen that Cyanate esters resin have the lowest moisture absorption. [62]

56 Structural Design and Analysis of a Solar Array Substrate for a GEO Satellite
Figure 3-18 Weight gain of carbon fiber reinforced material (M74) with epoxy and Cyanate ester resins; 50% of relative humidity Cyanate ester have lower weight gain due to moisture
absorb [62]
Prepregs forms for resin and fiber 3.4.3.1.3.
The technological developments in fiber matrix systems facilitate the composite material manufacturing and lead to use of prepregs. A prepreg consists of a combination of matrix or resin and fiber reinforcement and ready to use. The forms of fabrics are available in unidirectional, woven and tape prepregs providing many options in terms of design and manufacture of composite structure. Whilst the uses of dry fibers and impregnation have cost advantages, there are various advantages of prepregs particularly for manufacture of advance composites. Some of these advantages are:
Improvement of laminate properties by better dispersion
Increase curing pressure reduces voids and improve fiber wetting
Head curing provides more time for proper laydown of fibers and for the resin to move and degas before cure.
For these advantages, prepregs are considered for manufacturing the facing laminates of the sandwich structure.
Selection of Face Materials 3.4.3.1.4.
After defining the fundamentals of CFRPs, Ashby charts are utilized in order to trade between available materials. Materials indexes according to design requirements are formed in CES Edupack software within its Aerospace Materials database and the candidate materials are obtained according to material indexes indicated before. As
the facing materials should maximize the specific stiffness, E1/3 / ρ, the line having

Design and Analysis of the Solar Array Substrate 57
the aim 3 is drawn as in Figure 3.18. The materials which are above this line are marked.
Figure 3-19 Specific Stiffness diagram for facing materials. The line with aim 3 shows the materials with higher specific stiffness (CES edupack plot)
According to the Figure 3.19 above, Cynate ester/HM carbon fiber lamina provides the highest specific stiffness. Additionally, Epoxy/HS carbon fiber lamina is the second material with highest shiftiness. However, Ashby charts provide the materials and their ranges rather than specific commercially available materials. Following the same path for the selection, ESA suggested materials are investigated and CFRP materials chart that are employed in the space mission is provided in Figure 3.20. This chart presents the fibers according to the specific strength and specific stiffness. Based on the Figure 3.20, high specific modulus carbon fibers are on the right side of the graphic. These fibers are ultra-high modulus fibers such as K1100, K13C2U, YS95A, M60J and M55J. Therefore, composite manufacturers and their prepregs are investigated based on these carbon fibers. Hexcel has several prepregs tailored for space applications such as HexPly® 8552, M18, 954-3 and 954-6. M18 and 8552 are epoxy based prepregs whilst 954-3 and 954-6 are the Cyanate ester prepregs. HexPly 954-6 is curing toughened Cyanate resin with excellent resistance to moisture absorption, outgassing and microcraking. Typical applications of this prepreg include primary and secondary space structures such as solar arrays, antennae and any other applications where light weight, dielectric and low outgassing properties are required. It can be impregnated with various fibers. The mechanical properties of prepreg HexPly® 954-6 Cyanate resin with different unidirectional fibers are given in Table 3.11: [62]

58 Structural Design and Analysis of a Solar Array Substrate for a GEO Satellite
Figure 3-20 Specific strength versus specific modulus of fibers. High specific modulus carbon fibers, which are at the right side of the graph, are the main interest. [59]
According to the properties of these prepregs mentioned above, 954-6 Cyanate ester resin with pitch fiber K13, and PAN fiber M55J carbon fibers are one step ahead due to their critical advantages related with solar panel substrate design such as dimensional stability, good surface finish and low outgassing. Nevertheless, all prepregs are considered as candidate materials for the sandwich panel facings. Table 3-13 HexPly® 954-6 Curing Cyanate Resin, and Unidirectional HM Fibers (Fiber
Volume is 60% ) [62]
Cured ply thickness and density of these prepregs are calculated from the manufacturer’s calculator tool. For the matrix 954-6, ultra high modulus fibers are chosen with a fiber volume ratio of %60. The cured ply thickness is obtained 0.14 mm and density 1.57 g/cm3. Additionally, for 72.9 g/cm2 fiber areal weight, the cured
Fibers M40J M55J K13C2U Unit
0º Tensile Strength 2365 2165 1799 MPa 0º Tensile Modulus 196 321 556 GPa 90º Tensile Strength 72 40 19 MPa 90º Tensile Modulus 7.6 6.2 4.8 GPa 0º Compress. Strength 2000 896 365 MPa 0º Compress. Modulus 222 300 558 GPa Shear Strength 99 70 44 MPa Shear Modulus 4.6 4.7 4.1 GPa
Area of interest

Design and Analysis of the Solar Array Substrate 59
ply thickness is calculated 0.06 mm and composite density 1.65 g/cm3 as specified in military standards for composite materials [63]. Both cure ply thicknesses are evaluated in finite element analysis section and the results are evaluated.
Figure 3-21 Hexcel calculator for cured ply thickness and density. Cyanate resin with ultra high modulus fibers are utilized [64]
These selected facing materials are evaluated in the FEA section. First of all, M55J prepreg is used primarily for calculations, and other candidates materials are evaluated with following analyses.
3.4.4. Film Adhesives and Surfacing of the Sandwich Structure
Adhesive bonding is a reliable, proven and widely established method for joining metals, plastics, composites and many other substrates. Adhesive bonding has several advantages such as:
No need for holes or distorted parts such as in welding and ensures even distribution of the stresses which leads to improved fatigue performance.
Saves weight
Allows assembly of different materials
Electrically insulating
Adhesive bonding can be in film form and ready to use after curing with pressure. They ensure an optimum and controlled weight of adhesive containing exact proportions of resin and hardener. In addition, film adhesives are particularly useful for bonding large areas and especially useful in the fabrication of sandwich panels.

60 Structural Design and Analysis of a Solar Array Substrate for a GEO Satellite
Epoxy, bismaleimide (BMI), phenolic, polyimide and cyanate ester-based adhesives are suitable for composite-to-composite, composite-to-metal and metal-to-metal bonding. Film adhesives are commonly two types being unsupported and supported. Unsupported adhesives consist of only thin sheet of adhesive. This type of adhesives is often hard to handle and may lead to bonding problems. Whereas, supported adhesives are applied to a thin fibrous carrier to improve handling and bondline control. Additionally, they reduce the galvanic effects such for mixed metal and carbon fiber bonded assemblies [65]. Different materials are cured simultaneously to form a laminate or assembly. The adhesive is selected to have a cure schedule which matches as closely as possible that of the matrix resin of the
composite. Co‐curing of assemblies using film adhesives is usually conducted in an autoclave. Cyanate ester based film adhesives are suitable for the bonding of honeycomb and facing considering that the facing laminate 954-6 is Cyanate ester prepreg would facilitate co-curing of the facing laminates and film adhesives. For this reason RS-4 type Cyanate ester film is chosen for the bonding of honeycomb and facing laminate. RS-4A is a poly-cyanate film adhesive that provides maximum compatibility and adhesive performance for core/face skin structures. It has been evaluated and qualified in the areas of satellite, airframe/missile, and sandwich structures: [66]
Very low outgassing
Simple 350°f “epoxylike” processing
Low shrinkage during cure
Autoclave and compression moldable
Excellent balance of mechanical properties
Low moisture absorption
Low microcracking from -175°c to +175°c
Good hot/wet performance
Low modulus loss after radiation
Low dielectric constant RS-4A film adhesive has a areal weight of 293 g/m2 and provides the shear strength 14.5 MPa. This value is higher than 6.5 MPa which is the low limit for sandwich panels. Another important issue is the back and front surfaces of substrates in space environment. For the front surface of the substrate where the solar cells are mounted, Kapton film is considered to provide electrical insulation with the solar cells. Kapton is polyimide film that provides excellent dimensional stability and adhesion with its electrical and physical properties over a wide range of temperatures. Kapton films with a thickness of 0.05 mm is commonly applied on the front face of solar panel substrates. For instance, Kapton HPP ST polyimide film can be used and can be co-cured with the face laminate. The rear surface of the substrate is commonly covered with aluminized Kapton for thermal protection of the substrate. These film adhesives aforementioned are off-the-shelf products and have already been conventionally used in several missions with success. Nevertheless, these adhesive might be adapted profoundly in terms of thermal and electrical analysis of the substrates which is not the focus of this work.

Design and Analysis of the Solar Array Substrate 61
3.5. Finite Element Analysis (FEA) of Solar Panel Substrates
Finite element analysis software tools such as NASTRAN, PATRAN, ABAQUS, ANSYS etc, are commonly used in various fields to model a structure and examine its behavior under various static and dynamic load conditions. For the finite element analysis approach, a structure is modeled as a number of smaller or differential elements. After boundary conditions and loads are applied to the structure, with the help solvers the results are obtained. In this thesis, finite element model of the solar panel substrate is created using Msc Patran and analysis are solved with Msc Nastran. Basic computations of sandwich structure can be practically solved by hand calculations. However, for more sophisticated analysis of a structure, considering panel to be subjected to a combination of loads, finite element analysis is required. There are various loads that should be considered for the design of a solar panel substrate. These loads are not equally important and they mostly depend on the structure as panels, instruments. The most important ones are as follows: [67]
Natural frequencies
Steady-state acceleration
Sine excitation
Random excitation
Acoustic noise
Transient loads
Shock loads
Temperature differences
Natural frequency constrains, steady state accelerations and random loads determine the design of secondary structure such as solar panel substrates. In this work, the main objective is to perform the design of solar panel substrates considering launch induced loads. Therefore, primarily, first of all frequency analysis is performed in order to find the thicknesses of the substrates that will ensure that first frequencies are higher than launch vehicle constraints. Later on, static analysis is performed by applying launch loads i.e inertial loads to ensure these stresses do not lead the failure of the material. The methodology of the FEA is summarized in the Figure 3.22:
1. Panel length and width are known for the two solar panel model.
a. For solar panel geometry-1, : L=3050 mm, W=2550mm b. For solar panel geometry-2, : L=3050 mm, W=2550mm
2. For the geometry-1, thickness of panel core and facing skins are estimated in
order to start the calculations.
a. Assumed that, thickness of core=25 mm, thickness of face skin=1mm,
3. Dynamic analysis will be performed for candidate materials to select core and face materials in term of performance. Performance of the materials on

62 Structural Design and Analysis of a Solar Array Substrate for a GEO Satellite
natural frequency of the substrate will be evaluated with different fiber orientations and fiber thicknesses. Best performance materials will be defined and other candidate materials will be eliminated.
Figure 3-22 Flow chart for the design of solar panel substrate using Finite Element Analysis
4. Dynamic analysis will be performed with these thickness values and materials.
a. If the first frequency constrains are not fulfilled, the thickness of the core will be increased as it has more effect on bending stiffness. Later on, face skin can be also be increased for tailoring the results. Until the frequency constrains met, these analysis is continued.
5. Dynamic analysis of geometry-2 will be performed with the best performance
materials and core and facing thickness will be obtained.
6. In the next step, static analysis will be performed with the obtained thickness values by applying load cases to these two structures as inertial loads. For this, total mass will be calculated from thickness values and random vibration

Design and Analysis of the Solar Array Substrate 63
load factors table will be updated according to this mass and calculated frequencies.
7. Stress values obtained in static analysis will be compared with material strengths limits. Materials with positive margin safety will be selected as the design materials.
3.5.1. Finite Element Model of the Solar Panel Substrate
The modeling methodology for honeycomb solar panel substrate is selected as 2-D shell element due to the fact that 3D model would require more computing time and also due to the fact that the student license of Msc Patran software is limited with few number of elements. [68] For the shell element, honeycomb core and facing skin materials can be defined as orthotropic due to the mathematical representations. However, these material definitions require elasticity modulus, shear modulus which are dependent on the fiber orientation. Although, FEA of sandwich panels are complicated and requires more computing time, an approach is considered for the modeling of the large structure. In this approach, it is considered that shear forces normal to the panel will be carried by the core while bending moments and in-plane forces on the panel will be carried as membrane forces in the facing skin. For many practical cases, where the span of the panel is large compared to its thickness, shear deflection will be negligible. In these cases, it is possible to obtain reasonable results by modeling the structure using composite shell elements. Additionally, this method is based on sandwich theory. As explained previously, sandwich theory is appropriate to calculate the equivalent parameters of the core material. Performing several calculations utilizing equations 3.3-3.7, showed that the honeycomb material have very low stiffness in x and y directions. Besides, shear modulus in xy equals to almost zero. For that reason, when defining the material properties of honeycomb core the following points are taken into consideration at the: [69]
(A very small value may be necessary to avoid singularity)
and
More precisely, honeycomb core material will be defined as 3D orthotropic material and the carbon fiber reinforced face skin materials will be defined as 2D orthotropic. Both materials will be stackup in laminate and the laminate will be defined as shell element which represents the mathematical model of the solar panel plate. The axis of the honeycomb core is shown in Figure 3.23.

64 Structural Design and Analysis of a Solar Array Substrate for a GEO Satellite
Figure 3-23 Element axis directions [69]
According to this approach taken from design and analysis guide for sandwich structures which is explained previously, several analyses are performed in order to compare the FEA result with the known results which are obtained by testing. The comparisons were successful and very small errors, 0.1%, are obtained. This shows the liability and safety of modeling the honeycomb structure according to the simplistic approach. The solar panel substrate is modeled as 2D shell. The holes, where hdrm pins will be attached to hold the solar panels together during launch, are fixed in six degree of freedom. The purpose of fixing is to represent the panel’s behavior in stowed position when hdrm pins are attached. The same model will be used for dynamic and static analysis. The geometry is meshed with quad4 elements having 4 nodes and 3402 elements are created. Figure 3.22 shows the FE model of the substrate geometry-1 in Msc Patran.
Figure 3-24 Finite Element Model of the Solar Panel-1. Z axis is the 0º ply angle
The panel is fixed at 4 points where hold down and release pins are attached.
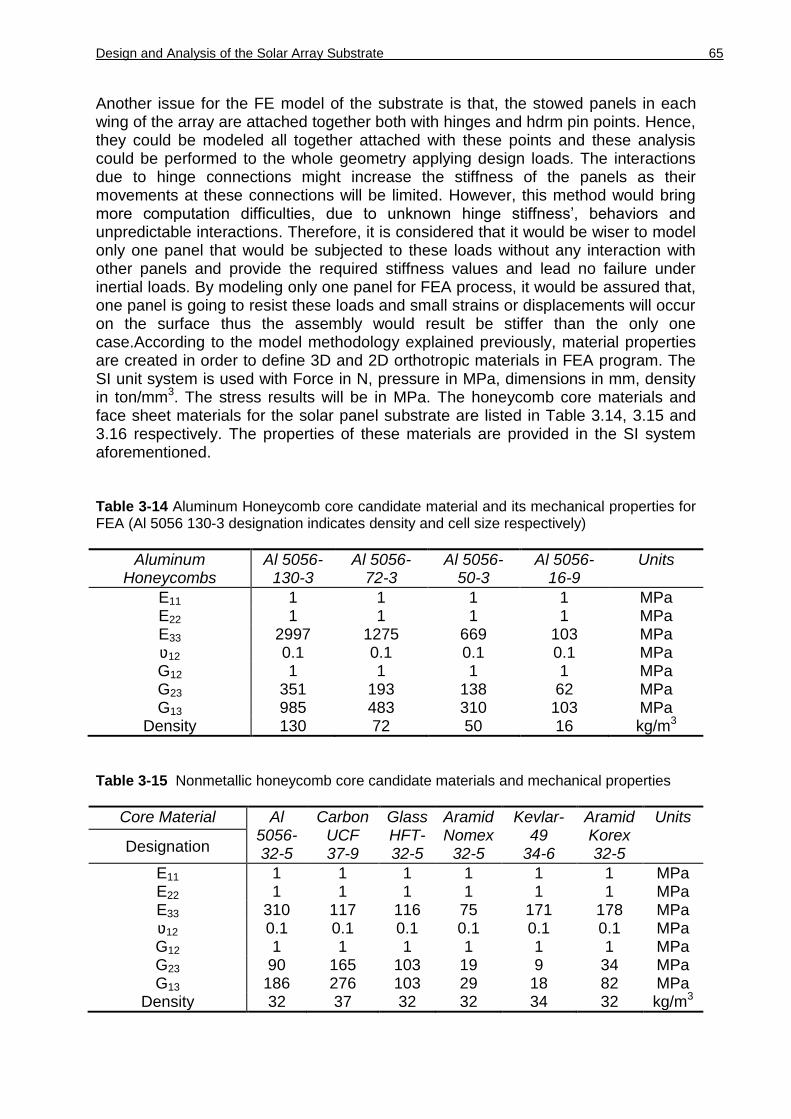
Design and Analysis of the Solar Array Substrate 65
Another issue for the FE model of the substrate is that, the stowed panels in each wing of the array are attached together both with hinges and hdrm pin points. Hence, they could be modeled all together attached with these points and these analysis could be performed to the whole geometry applying design loads. The interactions due to hinge connections might increase the stiffness of the panels as their movements at these connections will be limited. However, this method would bring more computation difficulties, due to unknown hinge stiffness’, behaviors and unpredictable interactions. Therefore, it is considered that it would be wiser to model only one panel that would be subjected to these loads without any interaction with other panels and provide the required stiffness values and lead no failure under inertial loads. By modeling only one panel for FEA process, it would be assured that, one panel is going to resist these loads and small strains or displacements will occur on the surface thus the assembly would result be stiffer than the only one case.According to the model methodology explained previously, material properties are created in order to define 3D and 2D orthotropic materials in FEA program. The SI unit system is used with Force in N, pressure in MPa, dimensions in mm, density in ton/mm3. The stress results will be in MPa. The honeycomb core materials and face sheet materials for the solar panel substrate are listed in Table 3.14, 3.15 and 3.16 respectively. The properties of these materials are provided in the SI system aforementioned. Table 3-14 Aluminum Honeycomb core candidate material and its mechanical properties for FEA (Al 5056 130-3 designation indicates density and cell size respectively)
Aluminum Honeycombs
Al 5056-130-3
Al 5056-72-3
Al 5056-50-3
Al 5056-16-9
Units
E11 1 1 1 1 MPa E22 1 1 1 1 MPa E33 2997 1275 669 103 MPa ʋ12 0.1 0.1 0.1 0.1 MPa G12 1 1 1 1 MPa G23 351 193 138 62 MPa G13 985 483 310 103 MPa
Density 130 72 50 16 kg/m3
Table 3-15 Nonmetallic honeycomb core candidate materials and mechanical properties
Core Material Al 5056-32-5
Carbon UCF 37-9
Glass HFT-32-5
Aramid Nomex
32-5
Kevlar-49
34-6
Aramid Korex 32-5
Units
Designation
E11 1 1 1 1 1 1 MPa E22 1 1 1 1 1 1 MPa E33 310 117 116 75 171 178 MPa ʋ12 0.1 0.1 0.1 0.1 0.1 0.1 MPa G12 1 1 1 1 1 1 MPa G23 90 165 103 19 9 34 MPa G13 186 276 103 29 18 82 MPa
Density 32 37 32 32 34 32 kg/m3

66 Structural Design and Analysis of a Solar Array Substrate for a GEO Satellite
Table 3-16 Face sheet candidate materials and mechanical properties for FEA(CFRP Prepreg) (2D orthotropic)
3.5.2. Frequency Analysis of Solar Array Substrate
Frequency analysis of the panel substrate is performed both to determine the natural frequencies and modes of the solar panel substrate. These frequencies are the values at which a structure would vibrate if it is first excited by a transient load and then allowed to oscillate freely. These vibrations and corresponding values for common shapes such as beams, plates, shells etc. can be found in various engineering books. However, these formulas -in this case for a plate which represents the solar array substrate- present simple boundary conditions such as simply supported free and/or clamped edges. More accurate determination of natural frequencies and modes shapes to fulfill the design requirements, could only be realized by utilizing other methods such as finite element analysis. These natural frequencies are a design constraint and dependent on the stiffness of the structure along with employed materials and mass. Therefore, this section covers the frequency analysis of substrate geometries to ensure the natural frequency constrain by evaluating the effective materials for the core and face; ply thickness; fiber orientation; and thermal considerations. Primarily, the minimum natural frequency requirements for a structure are calculated. These requirements imply that the fundamental frequencies of the structures or spacecraft in all directions should be larger than the lowest frequency of the launch vehicle. Thus, the structure will be dynamically uncoupled from the launch vehicle and will behave rigid. That’s the key factor for the design. In Table 3.17, several launch vehicles and their minimum natural frequency constrains for a spacecraft is listed. Table 3-17 Natural Frequency requirements during launch [70]
Launch Vehicle Required Lowest Natural Frequency (Hz)
Direction Launch Direction Lateral STS
DELTA 6925/7925 ARIANE 5 <=4500 kg > 4500 kg
13 35
31 27
13 15
9-10
Fibers HexPly 954-6/ M55J
HexPly 954-6/ M40J
HexPly 954-6/ K13C2U
Unit
E11 321*103 196*103 556*103 MPa
E22 6.2*103 7.6*103 4.8*103 MPa
ʋ12 0.3 0.3 0.3 -
G12 4.7*103 4.6*103 4.1*103 MPa
Density 1570 1570 1570 kg/m3

Design and Analysis of the Solar Array Substrate 67
For the component stiffness requirement, octave rule should be applied to minimize dynamic interaction between the component and mounting structure. The primary goal is to minimize the dynamic interaction between the interacting elements (that is, between the component natural frequency and the natural frequency of the mounting structure).This rule states that: [70]
- Component natural frequency ≥ 2 x Natural frequency of the mounting or support structure.
Using this basic relationship between interacting elements, one item will be isolated dynamically from other item and any input loading will not be amplified. Therefore, the stiffness required for the solar panels must be twice of the primary structure. Due to the fact that the primary structure natural frequency constrains will be as in Table 3.17, the secondary structure frequency constrains can be identified as multiplying these limits by a factor of safety to be in the reliable part of the mission. In addition, although finite element methods provide good results, a factor of safety should be used due approximations and errors of mathematical representation of panel substrates in FEA. These stiffness requirements are shown in Table 3.18: Table 3-18 Solar panel stiffness requirements calculation
Primary Structure (Factor of safety included)
Secondary Structure (solar panels.)hz
Lateral frequency req. 10*1.5=15 ≥30 Axial frequency req. 31*1.5=46 ≥90
For the stiffness requirement calculations, Ariane 5 launcher constrains are taken into account. It is clear that, selection of another launch vehicle could demand different values. Nevertheless, these values between different launchers, which are employed in GEO missions, slightly differ each other causing no significant variations in stiffness requirements such as Delta and Ariane 5. Due to the fact that there are several candidate materials for both solar panel substrates, core materials, face sheet material, stacking orientation of laminates and restrain mechanism attachment locations are primarily evaluated and configurations that have best performances are selected for the following analyses of solar panel substrates models. For the evaluation of these parameters on the natural frequency of the substrate is performed utilizing the Solar Panel-1 geometry. The FE model of the Solar Panel-1 is created in Msc Patran software by stacking the plies in a simple configuration such as [0º/90º] for the initial phase. For the initial estimation, 4 CFRP plies are considered having total 0.56 mm thickness. The core thickness is utilized as 25 mm as estimated in previous section. The stacking of the panel in the FEA program is created in Table 3.19. This configuration is utilized in the following sections in order to decide the best configuration. The following sections cover the evaluation of each factor on natural frequency of the substrate with the help of FEA package. These analyses are

68 Structural Design and Analysis of a Solar Array Substrate for a GEO Satellite
focused on the effect of core material, face sheet material, orientation of fibers and restrain attachment locations. Table 3-19 Solar panel-1 laminate structure and ply configuration in the FEA
Thickness (mm)
Angle Material Ply ID
0.14 0º ||||||||||||||||||||||||| M55J 9
0.14 90º \\\\\\\\\\\\\\\\\\\\\\\\ M55J 8
0.14 0º ||||||||||||||||||||||||| M55J 7
0.14 90º \\\\\\\\\\\\\\\\\\\\\\\\ M55J 6
25 0º ||||||||||||||||||||||||| Al 5056 5
0.14 90º \\\\\\\\\\\\\\\\\\\\\\\\ M55J 4
0.14 0º ||||||||||||||||||||||||| M55J 3
0.14 90º \\\\\\\\\\\\\\\\\\\\\\\\ M55J 2
0.14 0º ||||||||||||||||||||||||| M55J 1
3.5.2.1. Effect of the core material on the natural frequencies of the substrate
The effect of the core material on the natural frequencies of the substrate is assessed by employing several different core materials having the almost same density and performing analyses with these pair of materials. In these analyses, the face sheet material and core thickness are the same for all the materials. However, Kevlar-49 and Rohacell are heavier due to the little difference in the density. The results are listed in Table 3.20. . In table 3.20, it is clearly seen that, UCF carbon honeycomb exhibits the highest performance. The natural frequencies in the axial and lateral directions of the carbon honeycomb are presented at Figure 3.25. Nevertheless aluminum and HFT fiberglass honeycombs provide almost the same natural frequencies few Hz smaller than UCF. Therefore, it is possible to derive that there is no weight advantage of employing carbon honeycomb with a great cost penalty. According to the results above, aluminum honeycomb provides very high natural frequencies with maximum cost efficiency. However, before determining the best performance core material, it is good practice to review the thermal properties of these materials. These properties are listed in Table 3.20.

Design and Analysis of the Solar Array Substrate 69
Table 3-20 Results of frequency analyses of different core materials with same face sheet materials and core thickness. Cost estimations are taken from CES Edupack material database.
Core Mat. Face Mat.
(mm)
(mm)
Mass (kg)
1st lateral Frequency
(Hz)
1st axial frequency
(Hz)
Relative cost
estimation (eur/kg)
UCF-37-9 (carbon)
M55J 40 1.12 36.3 65.6 99.1 80
Al 5056- 32-5
(Aluminum) M55J 40 1.12 36.3 64.1 96.7 16-26
HFT-32-3 (FiberGlass
fabric) M55J 40 1.12 36.3 63.2 96.1 60-80
Korex-32-5 (Korex Ara.
paper) M55J 40 1.12 36.3 58 90.5 60-80
HRH 10-32-5 (Nomex
Paper) M55J 40 1.12 36.3 48.8 84.4 25-35
HRH 49-34-6.5
(Kevlar 49) M55J 40 1.12 36.6 39 73 50-80
Rohacell 51 WF
(PMI foam) M55J 40 1.12 42.55 24 29 40-90
Figure 3-25 Carbon honeycomb frequency analysis results. Left figure shows the first lateral mode while right figure shows the first axial mode of the structure

70 Structural Design and Analysis of a Solar Array Substrate for a GEO Satellite
Best convenient core material for a solar panel substrate shall have low CTE and high thermal conductivity while minimizing the cost. Due to the fact that solar panel core material doesn’t require very strict dimensional tolerances such as in antennas or mirrors, Aluminum core is selected because of providing moderately high thermal properties at minimum cost and mass. As seen in Table 3.20, carbon honeycomb provides excellent thermal properties that would create an unnecessarily dimensional stability with a great cost. In the case of Aluminum, elongations due to thermal gradients, such as 0.0048 mm/mm ºC for 200ºC of temperature change, are in the acceptable range. Therefore, more dimensional stability is considered for the skin materials. Table 3-21 Thermal properties of core materials. Coefficient of thermal expansion and thermal conductivity in the thickness direction of the cell [56]
Core Material Coefficient of Thermal Expansion (10-6 /ºC)
Thermal Conductivity (W/m ºC)
Al 5056 24-30 1-1.21
HFT Fiberglass 7-14 0.036-0.045
HRH-10 Nomex 33-36 0.0261-0.0289
HRH-49 Kevlar 4-8 0.025-0.031
UFC-Carbon 2-3.6 80
Rohacell 33-36 0.027-0.03
3.5.2.2. Effect of the core material density on the natural frequencies of the substrate
In the following step, different Aluminum honeycombs varying in cell size and densities are evaluated by employing frequency analysis with the same face material. The results are listed in Table 3.22. Table 3-22 Result of natural frequency analyses of Aluminum honeycombs with different cell sizes and densities. Lowest density exhibits the maximum performance.
Core Mat. Face Mat.
(mm)
(mm)
1st axial Frequency
(Hz)
1st lateral frequency
(Hz)
Mass (kg)
Al 5056-130-3
M55J 55 1.12 59 92.3 81.9
Al 5056-72-3 M55J 45 1.12 62 93 51.57
Al 5056-50-3 M55J 40 1.12 60 91 41.83
Al 5056-32-5 M55J 40 1.12 64.1 96.7 36.3
Al 5056-16-9 M55J 35 1.12 70 92 30.73
Table 3.22 shows that the core materials, which are denser or having higher density, have lower first frequencies, such that Al-5056-16-9 having the lowest density fulfills

Design and Analysis of the Solar Array Substrate 71
the frequency constrains with much less mass being almost 30 kg. This result is convenient with the main natural frequency equation which basically equals to square root of the ratio of stiffness to mass. For that reason, natural frequency of an object is inversely proportional to its mass, giving higher frequencies for smaller mass. For the A5-5056-50-3 core material and M55J face sheet material, the frequency results are plotted in Figure 3.26 and 3.27. These figures show the first axial and lateral frequencies (modes) of the solar panel substrate. First lateral mode occurs in the bending around x-axis. Although the minimum frequency requirement in lateral mode is 30 Hz, the substrate has much stiff behavior in this axis having 62 Hz. For the axial frequencies the minimum frequency constrain, 92 Hz, is met as the substrate’s first axial mode is 93 Hz.
Figure 3-26 Solar Panel-1,Al-5056-50-3 core material and 1mm face sheet, M55J. 1st lateral Mode , @ 61 Hz
Figure 3-27 Solar Panel-1,Al-5056-50-3 core material and 1mm face sheet, M55J. 1st axial Mode , @ 92 Hz
1st lateral mode, Bending in x-axis > 30 Hz
1st axial mode, Bending in z-axis > 90 Hz
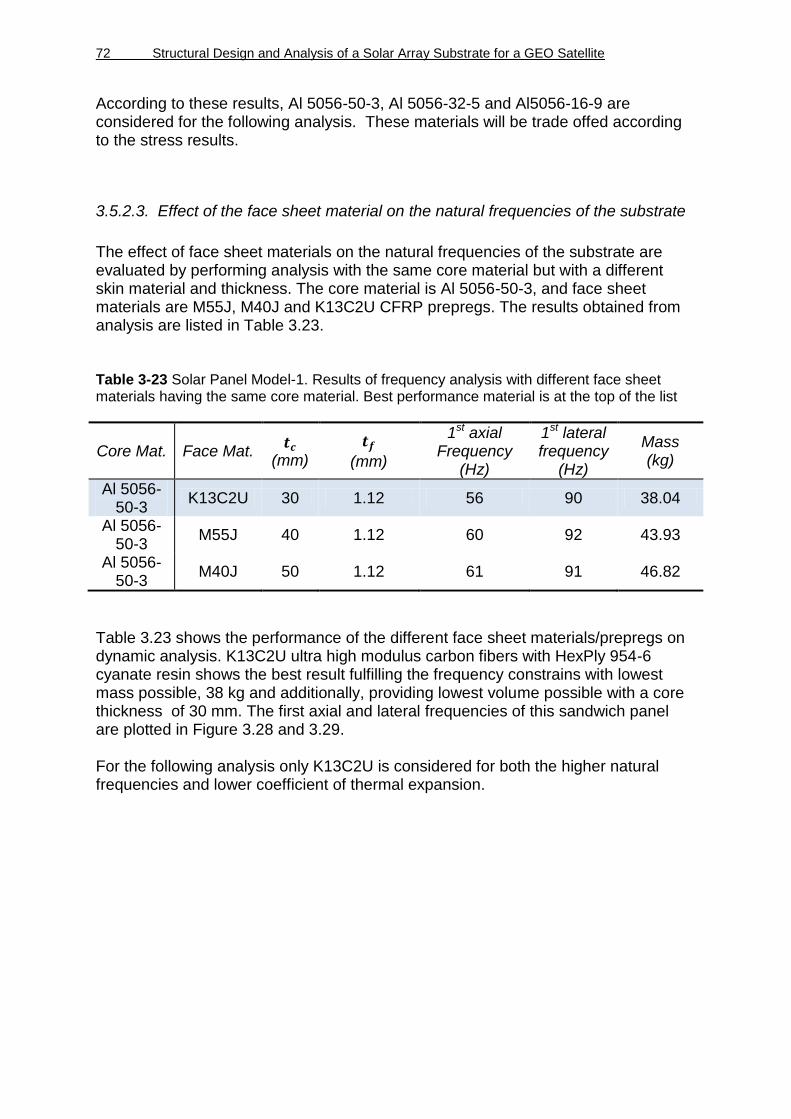
72 Structural Design and Analysis of a Solar Array Substrate for a GEO Satellite
According to these results, Al 5056-50-3, Al 5056-32-5 and Al5056-16-9 are considered for the following analysis. These materials will be trade offed according to the stress results.
3.5.2.3. Effect of the face sheet material on the natural frequencies of the substrate
The effect of face sheet materials on the natural frequencies of the substrate are evaluated by performing analysis with the same core material but with a different skin material and thickness. The core material is Al 5056-50-3, and face sheet materials are M55J, M40J and K13C2U CFRP prepregs. The results obtained from analysis are listed in Table 3.23. Table 3-23 Solar Panel Model-1. Results of frequency analysis with different face sheet materials having the same core material. Best performance material is at the top of the list
Core Mat. Face Mat.
(mm)
(mm)
1st axial Frequency
(Hz)
1st lateral frequency
(Hz)
Mass (kg)
Al 5056-50-3
K13C2U 30 1.12 56 90 38.04
Al 5056-50-3
M55J 40 1.12 60 92 43.93
Al 5056-50-3
M40J 50 1.12 61 91 46.82
Table 3.23 shows the performance of the different face sheet materials/prepregs on dynamic analysis. K13C2U ultra high modulus carbon fibers with HexPly 954-6 cyanate resin shows the best result fulfilling the frequency constrains with lowest mass possible, 38 kg and additionally, providing lowest volume possible with a core thickness of 30 mm. The first axial and lateral frequencies of this sandwich panel are plotted in Figure 3.28 and 3.29. For the following analysis only K13C2U is considered for both the higher natural frequencies and lower coefficient of thermal expansion.

Design and Analysis of the Solar Array Substrate 73
Figure 3-28 Solar Panel-1, Al-5056-50-3 core material and 1mm face sheet,. HexPly 954-6/ K13C2U prepreg. 1st lateral Mode , @ 56 Hz
Figure 3-29 Solar Panel-1, Al-5056-50-3 core material and 1mm face sheet,. HexPly 954-6/ K13C2U prepreg. 1st axial Mode , @ 90 Hz
3.5.2.4. Effect of the lay-up of plies on dynamic behavior of the substrate
During the analysis performed previously, the orientation of the plies were in 0º and 90º configuration. The effect of ply stacking on natural frequencies of the substrate is assessed utilizing the same core material and face sheet material but each time altering stacking sequence. For these analyses, the core material Al 5056-50-3 and the face sheet material 954-6/K13C2U are employed. The orientations are selected
as [0º/90º], [45º/-45º], [60º/0/-60º] and [0º/90º/±45º]. The results are presented in Table 3.23

74 Structural Design and Analysis of a Solar Array Substrate for a GEO Satellite
Table 3-24 Natural frequency results for different stacking sequence of laminates
Face Mat.
Laminate orientation
(mm)
(mm)
1st axial Frequenc
y (Hz)
1st lateral frequency
(Hz)
K13C2U 0º/90º 35 8 73 98.5 K13C2U 45º/-45º 35 8 54 77 K13C2U 60º/0º/-60º 35 9 52 89 K13C2U /0º/90º/45º/-45º 35 8 53 92
Table 3.23 shows the change of axial and lateral frequencies depending on the laminate stacking. It is noticed that the 0º/90º configuration provides the best results compared to other configurations. This can be explained by the fact that the fibers oriented 0º, increase efficiently to bending modes. Additionally, the results of these analyses have similarities compared with other works performed on this subject. The result of such work which is about the influence of laminate stacking on natural frequencies of a composite beam is shown in Figure 3.30. This figure shows the same tendency of the effect of stacking on vibration modes of a beam. It is clear seen that 0º/90º stacking configuration has particularly greater natural frequencies compared to other configurations [73].
Figure 3-30 Influence of stacking sequence of a laminate on the natural frequency [73]
The evaluation of the effect of laminate stacking based on FEA analysis and other works show that the initial selected configuration 0º/90º is provides higher natural frequencies. However, the differences between natural frequencies are not very significant. Therefore, final orientations of fibers are chosen after evaluating the structure’s thermal properties.

Design and Analysis of the Solar Array Substrate 75
3.5.2.5. Effect of cured ply thickness on the natural frequencies of the substrate
The nominal cured ply thickness of K13C2U/954-6 prepreg was calculated as 0.14 mm with a fiber areal weight ratio of 170 g/cm2. However, the effect of the cured ply thickness and thus number of plies are evaluated by a thinner lamina with a cured ply thickness of 0.06 mm. This cured ply thickness value is a commonly utilized for advance composite materials analysis. Therefore, its effect is evaluated and the results of dynamic analysis are listed in Table 3.20. In this table, it is clearly seen that when thinner cured ply is employed, number of plies must be higher to obtain same thickness. In total, thinner ply exhibits almost the same natural frequency on the first lateral mode while the first axial mode frequency is slightly lower and with a slight penalty of mass. This small increase in the mass is not significant in terms of increase in the natural frequencies. Therefore, ply thickness will be evaluated considering thermal characteristics of the laminate. Table 3-25 Natural frequencies of the substrate with different cured ply thickness of the same material (0.18 mm and 0.06 mm)
Core Mat.
Face Mat. (mm)
nº ply*
(mm)
1st axial Frequency
(Hz)
1st lateral frequency
(Hz)
Mass (kg)
Al 5056-50-3
K13C2U 35 8*0.14=1.12 62 101 39.99
Al 5056-50-3
K13C2U 35 21*0.06=1.12 63 98 41.33
3.5.2.6. Effect of restrain (hdrm) locations on the natural frequencies of the substrate
Hold down release mechanism (hdrm) or restrain mechanism is responsible of holding the panels together and attaching them to the satellite wall. Another important consideration of these mechanisms are that they are aimed decrease the global buckling of panels under launch loads i.e. inertial loads and increase their natural frequencies and stiffness in both axes. During the previously performed analysis, the restrain points or hdrm points were at equal distance from the edges i.e. the edges were divided by 4 equal pieces and the intersection of these middle points were chosen the attachment points. This is summarized in below Figure. 3.31 The solar panel substrate model-1 is analyzed without these attachment points and first axial and lateral modes are plotted in figure 3.32. The frequencies in both axes are very close to the results with the hdrm analysis. Additionally, it is seen from the analysis result in Figure 3.32 that the bending lines of the plate in both axes are very close to these attachment points.
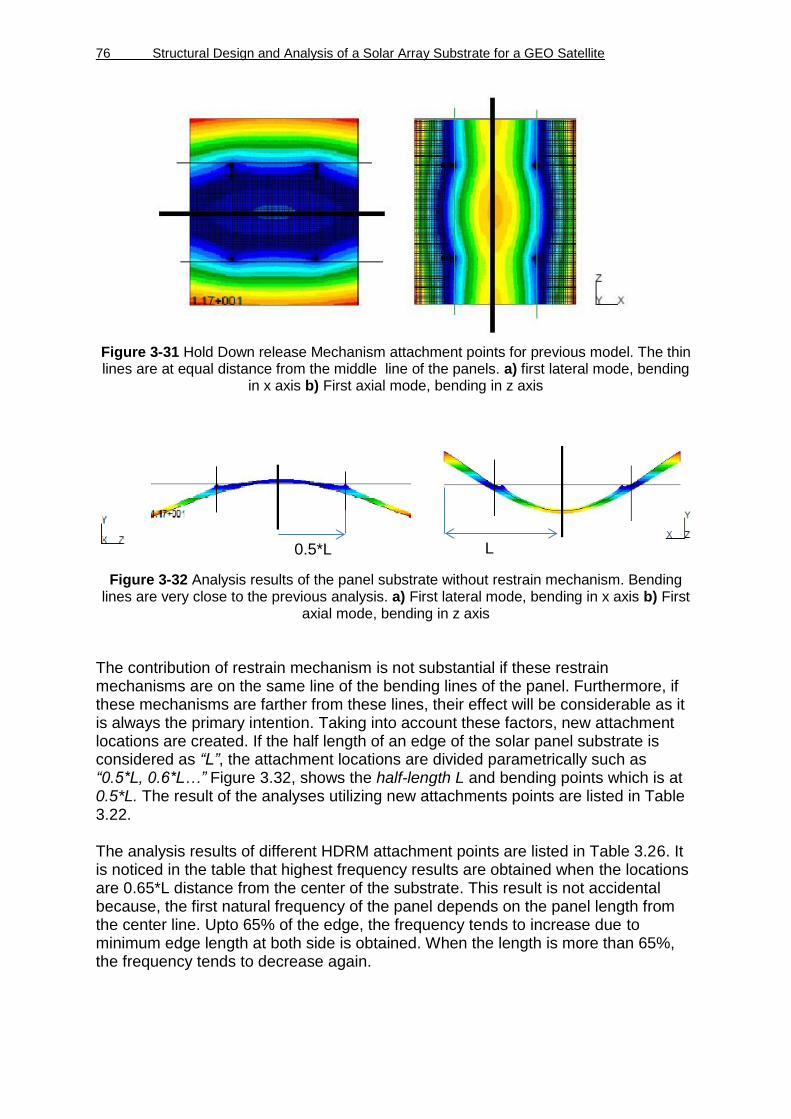
76 Structural Design and Analysis of a Solar Array Substrate for a GEO Satellite
Figure 3-31 Hold Down release Mechanism attachment points for previous model. The thin lines are at equal distance from the middle line of the panels. a) first lateral mode, bending
in x axis b) First axial mode, bending in z axis
Figure 3-32 Analysis results of the panel substrate without restrain mechanism. Bending lines are very close to the previous analysis. a) First lateral mode, bending in x axis b) First
axial mode, bending in z axis
The contribution of restrain mechanism is not substantial if these restrain mechanisms are on the same line of the bending lines of the panel. Furthermore, if these mechanisms are farther from these lines, their effect will be considerable as it is always the primary intention. Taking into account these factors, new attachment locations are created. If the half length of an edge of the solar panel substrate is considered as “L”, the attachment locations are divided parametrically such as “0.5*L, 0.6*L…” Figure 3.32, shows the half-length L and bending points which is at 0.5*L. The result of the analyses utilizing new attachments points are listed in Table 3.22. The analysis results of different HDRM attachment points are listed in Table 3.26. It is noticed in the table that highest frequency results are obtained when the locations are 0.65*L distance from the center of the substrate. This result is not accidental because, the first natural frequency of the panel depends on the panel length from the center line. Upto 65% of the edge, the frequency tends to increase due to minimum edge length at both side is obtained. When the length is more than 65%, the frequency tends to decrease again.
L 0.5*L

Design and Analysis of the Solar Array Substrate 77
Table 3-26 Analyses results for different HDRM attachment locations; L is the half length of an edge of solar panel substrate.
Core Mat.
Face Mat.
(mm)
(mm)
HDRM location
(L)
1st axial Frequency
(Hz)
1st lateral frequency
(Hz)
Al 5056-50-3
K13C2U 30 1.08 0.4*L 52 80
Al 5056-50-3
K13C2U 30 1.08 0.5*L 56 89
Al 5056-50-3
K13C2U 30 1.08 0.6*L 70 91
Al 5056-50-3
K13C2U 30 1.08 0.65*L 74 96
Al 5056-50-3
K13C2U 30 1.08 0.7*L 71 88
Al 5056-50-3
K13C2U 30 1.08 0.75*L 65 81
The new location of the hdrm attachment points are chosen according to the Table 3.23. This change of location leads to an increase of 10% in the fundamental frequencies and thus in the core thickness which is expected to be 5 mm less than primary case. The results of these analyses are plotted in Figure 3.33 and 3.34. The first lateral mode is 74 Hz and the first axial mode is at 96 Hz. The optimum hdrm attachment points will be utilized on the following analysis. As it is dimensionless, the new locations will be at 65% of the half of the edge of each solar panel substrate.
Figure 3-33 New hdrm attachment point, 0.65*L, results. First lateral frequency at 74 Hz,

78 Structural Design and Analysis of a Solar Array Substrate for a GEO Satellite
Figure 3-34 New hdrm attachment point, 0.65*L, results. First axial mode at 96 Hz
3.5.2.7. Thermal considerations of the structure based on stacking sequence and ply thickness
Dimensional stability is important for the solar panel substrate as it is for many spacecraft structures that experiences temperature changes in their service. Although solar panel substrates does not demand very high dimensional stability and precise dimensions such as reflector, antennas, optical equipment, a special attention must be paid during the design of substrates. Therefore, this subsection is dedicated to evaluate the thermal characteristics of the structure depending on the ply thickness and stacking of plies. Thermal expansion characteristics of carbon fibers can be summarized as having longitudinal CTE varies between negative to zero and in the transverse direction having a positive CTE in the transverse direction. The majority of the dimensionally stable structure materials are chosen among ultra-high modulus carbon fibers and Cyanate resins which have very low moisture absorption. Also maintaining the symmetric geometry i.e. balanced, symmetric laminates, and sandwich constructions along with minimizing CTE differences between adjacent materials are common approach for dimensional stability. Whilst, a zero CTE value is desirable in design, it is not usually feasible to produce a laminate or it demands complex 3D thermo-elastic analysis during design. For this reason, it is considered to define a consistent CTE behavior for the sandwich structure. Multidirectional lay-up can provide a low CTE and decrease the inter-laminar stresses during thermal changes. The effect of lay-up for carbon/epoxy laminate is shown in Figure 3.32. The lowercase letters a, b, c, d, e indicates the percentage of
0º and ±θº angles.

Design and Analysis of the Solar Array Substrate 79
Figure 3-35 Coefficient of thermal expansion for various fiber angles. [0º/±60º] provides vey low longitudinal and transversal values [60]
Figure 3.32 shows that 40% of º0 and 60% of ±θº plies with θ angle ranging from 60º to 80º provide almost very low CTE in longitudinal and transverse directions. Therefore for the stacking-up of plies, the configuration of [60º/0º/-60º] is considered due to thermal advantages. Additionally, this configuration doesn’t have a significant negative effect on the natural frequencies as evaluated previously. Cured ply thickness is also an important factor for the in service conditions of the solar panel substrate. During eclipses, rapid temperature changes between -150ºC to 100ºC are expected in GEO orbit. This will cause thermal cycles of the substrate under these thermal gradients. An experimental study conducted by NASA to determine the effects of ply thickness in composite laminates and changes in the coefficient of thermal expansion (CTE) is examined. According to this study, after a few thermal cycles, laminates with thick-plies cracked, resulting in large changes in CTE. On the other hand, CTE`s of the thin-ply laminates were less affected during thermal cycles [74]. Therefore, thinner cured ply thickness is selected for the following analysis.
3.5.2.8. Solar Panel Substrate Geometry-1 Frequency Analysis
The solar panel substrate geometry-1 was formed in the Section 3.3 and the dimensions of the geometry were 3050 mm x 2550 mm. After evaluating and selecting best performance materials and configurations, frequency analysis of the geometry-1 is performed. The material for the face is HexPly 954-6 cynate resin with high modulus carbon fibers K13C2U. The core materials are Al 5056-50-3, Al 5056-32-5 and Al 5056-16-9 are utilized for the analyses. The fiber orientation is [60º/0º/-60º]. The results obtained are listed in 3.27.

80 Structural Design and Analysis of a Solar Array Substrate for a GEO Satellite
Table 3-27 Solar panel substrate geometry-1 dynamic analysis results and final thickness values
Core Mat.
Face Mat. (mm)
(mm)
1st axial Frequency
(Hz)
1st lateral frequency
(Hz)
Mass (kg)
Al 5056-50-3
K13C2U 30 1.08 67.4 91.87 39.39
Al 5056-32-5
K13C2U 30 1.08 71.77 98 35.19
Al 5056-16-9
K13C2U 30 1.08 72.8 98.2 31.45
In table 3.27 it is seen that, Al 5056-16-9 provides better performance with less substrate mass. However, both configurations are evaluated in the static analysis section due to the lower shear strength of Al 5056-16-9 material. The natural frequency analysis results for Al 5056-50-3 are plotted in Figure 3.36.
Figure 3-36 Solar Panel Geometry-1, Al-5056-16-9 core material and 1mm face sheet. HexPly 954-6/ K13C2U prepreg. a) First lateral mode at 72.82 Hz b) First axial mode at
98.2 Hz.
3.5.2.9. Solar Panel Substrate Geometry-2 Frequency Analysis
The solar panel substrate geometry-2 dimensions were determined previously as 2350 mm x 2550 mm. The material for the face is HexPly 954-6 cynate resin with high modulus carbon fibers K13C2U. The core materials are Al 5056-50-3, Al 5056-32-5 and Al 5056-16-9 are utilized for the analyses The fiber orientation is [60º/0º/-60º] and new restrain points are applied to the FE model. The analysis results are provided in Table 3.8
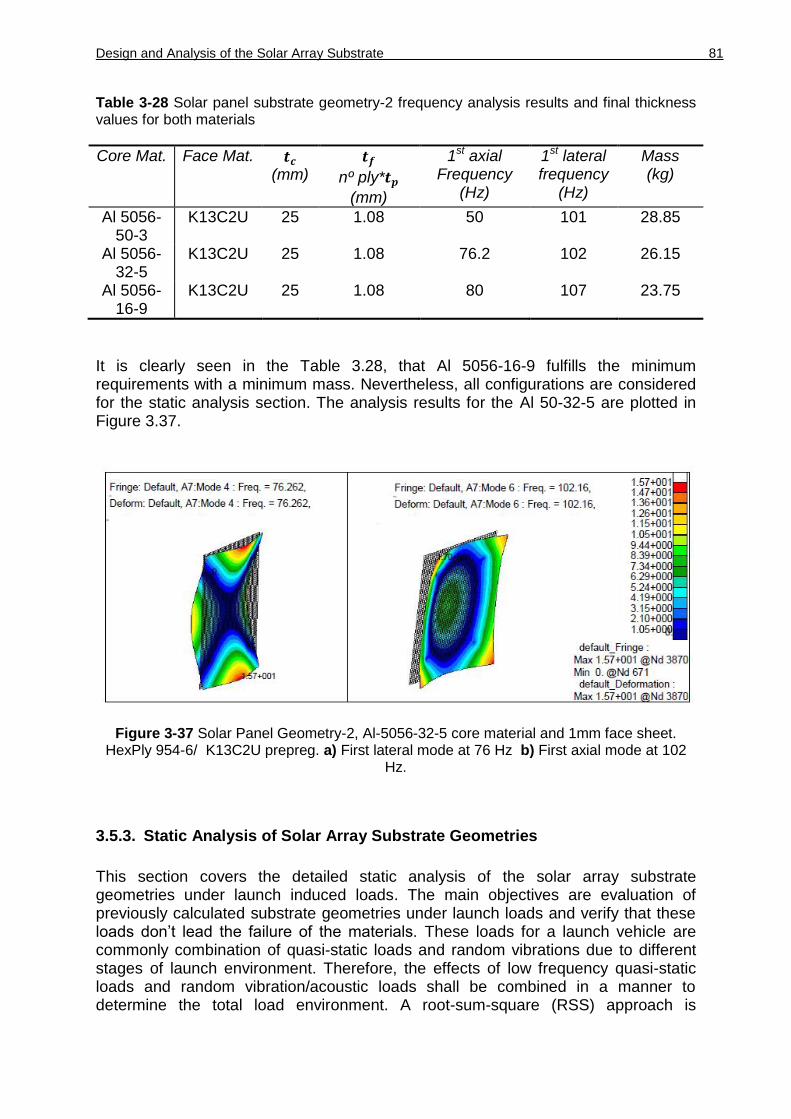
Design and Analysis of the Solar Array Substrate 81
Table 3-28 Solar panel substrate geometry-2 frequency analysis results and final thickness values for both materials
Core Mat. Face Mat. (mm)
nº ply*
(mm)
1st axial Frequency
(Hz)
1st lateral frequency
(Hz)
Mass (kg)
Al 5056-50-3
K13C2U 25 1.08 50 101 28.85
Al 5056-32-5
K13C2U 25 1.08 76.2 102 26.15
Al 5056-16-9
K13C2U 25 1.08 80 107 23.75
It is clearly seen in the Table 3.28, that Al 5056-16-9 fulfills the minimum requirements with a minimum mass. Nevertheless, all configurations are considered for the static analysis section. The analysis results for the Al 50-32-5 are plotted in Figure 3.37.
Figure 3-37 Solar Panel Geometry-2, Al-5056-32-5 core material and 1mm face sheet. HexPly 954-6/ K13C2U prepreg. a) First lateral mode at 76 Hz b) First axial mode at 102
Hz.
3.5.3. Static Analysis of Solar Array Substrate Geometries
This section covers the detailed static analysis of the solar array substrate geometries under launch induced loads. The main objectives are evaluation of previously calculated substrate geometries under launch loads and verify that these loads don’t lead the failure of the materials. These loads for a launch vehicle are commonly combination of quasi-static loads and random vibrations due to different stages of launch environment. Therefore, the effects of low frequency quasi-static loads and random vibration/acoustic loads shall be combined in a manner to determine the total load environment. A root-sum-square (RSS) approach is

82 Structural Design and Analysis of a Solar Array Substrate for a GEO Satellite
acceptable for combining the maximum low frequency and maximum random vibration loads by root sum squaring. The root sum squared values are then applied in all axes simultaneously [75].
3.5.3.1. Static Load Factor Calculations
Launch phase is pretty harsh on the structures which are mounted on the shroud of a launch vehicle. The main events and subsequent loads that occur during launch of a satellite are as follows: [9]
High vibrations due to engine start-up,
Lateral loads due to the wind gust and steering
Axial loads during the acceleration of the vehicle
Transient shocks due to stage separations and fairing jettison For famous launch vehicles, the flight history can be found which is established according to the measurements carried out utilizing transducers and sensors and they have the actual and quite precise flight data in comparison with similar launchers. Figure 3.38 shows plot of the steady state accelerations of Ariane-5 launch vehicle versus time. The maximum axial acceleration is approximately 4.5 g’s at the final stage of solid boosters.
Figure 3-38 Steady state acceleration of Ariane 5 launch vehicle [70]
Quasi-static load factors due to steady state accelerations are identified from user manual. As specified in the Ariane 5 manual, steady state accelerations are:
Maximum axial acceleration: 4,5g
Maximum lateral acceleration: 2.0g

Design and Analysis of the Solar Array Substrate 83
Maximum acceleration factors in axial and lateral directions, including the sinusoidal accelerations are then calculated. These accelerations in the lateral and axial directions are as follows:
These accelerations are considered to be quasi-static. In the static analysis of the solar panel substrate these loads are applied on the structure after combining with random vibration load factors (RVLF). RVLFs do not apply to large mass items due to the fact that they will not respond to random vibrations. These load factors shall be calculated for lower mass items such as solar panels due to the fact that they are more fragile under these loads [77]. The random vibrations specification of ESA is given in Table 3.29. Table 3-29 ESA specification for random vibrations during launch [73]]
Frequency Domain [Hz] PSD [g2/Hz]
20-100 3 db/oct 100-400 0.05*(m+20)/(m+1) 400-2000 -3db/oct
According to the ESA specification, the power spectral density are drawn as in Figure 3.35. The root mean square of acceleration is calculated using power spectral density (PSD) spectrum which is the total area under the graph:
Figure 3-39 PSD function versus Frequency [78]
According to the PSD graph in Figure 3.35, W2 and W3 PSD values can be calculated by employing the mass of the solar panel substrate-1 as 37 kg and substrate-2 as 25. Also for the frequency range upto 100 Hz, which is the frequency range for solar panel substrate, PSD values can be estimated by interpolation. The
W2 and W3 values utilizing Table 3.24 are calculated as . At this moment, random vibration load factor (RVLF) should be superimposed with quasi-static and transient loads. In Table 3.30, the combination method of different launch induced loads are formulized in terms of different axis and load cases:

84 Structural Design and Analysis of a Solar Array Substrate for a GEO Satellite
Table 3-30 Recommended uncertainty factors for combining different loads into static load factor [79]
Case Axial Lateral (axis 1) Lateral (axis 2)
1 ± [ (SAx2+RVLF2
Ax ]0.5 ±SLat1 ±SLat2
2
±SAx ± [SLat12+RVLF2
Lat1]0.5 ±SLat2
3 ±SAx ±SLat1 ± [SLat12+RVLF2
Lat1]0.5
where, Si is the launch steady state (quasi-static) load factors in the given axes (aforementioned values); RVLFi acceptance level random vibration load factor from Mile’s equation; In Table 3.30, steady state accelerations, S, are already calculated previously. According to these aspects, one has to calculate response of an item to a specific random vibration input i.e. estimating the loads due to random vibrations of the vehicle during launch. This can be done using miller equation: [80]
√
(3-19)
where;
is estimated response in g’s in the x axis, is the frequency of substrate in the x axis, is the amplification factor, is power spectrum density input in g2/Hz, σ is the statistical value for uncertainty, In Miller equation, 3.19, sigma value is chosen as 3 which gives an order of estimation of 99.74% certainty. Using a amplification factor of 10, which is a common value for design, RVLF lateral and axial load factors are calculated by utilizing natural frequencies and mass values from Table 3.22 and 3.23 for both substrate geometries. Calculated random vibration load factors are then combined with quasi static accelerations utilizing aforementioned method. Table 3.31 and 3.32 shows the resultant total load factors. It is seen that solar array substrate geometry-2 is subjected to slightly higher loads. These load cases are applied to both geometries in the following section and stress levels on the core material and face material are listed.

Design and Analysis of the Solar Array Substrate 85
Table 3-31 Total static load factors for substrate geometry-1 (combining random and quasi-static load factors in g’s)
Case Axial (g’s) Lateral axis 1 (g’s) Lateral axis 2 (g’s)
1
± 31.6 (26.6+5)
±2.8 ±2.8
2
±5 ± 20.5
(18.7+2.8)
±2.8
3 ±5 ±2.8 ± 20.5
(18.7+2.8)
Table 3-32 Total static load factors for substrate geometry-2 (combining random and quasi-static load factors in g’s)
Case Axial(g’s) Lateral axis 1 (g’s) Lateral axis 2 (g’s)
1
± 33.5 (28.8+5)
±2.8 ±2.8
2
±5 ±21.7
(19.9+2.8)
±2.8
3 ±5 ±2.8 ± 21.7
(19.9+2.8)
3.5.3.2. Static Analysis of Solar Array Substrate Geometry-1
The same finite element model of the solar panel substrate geometry-1 is utilized in Msc. Patran. There would be 24 load cases in total when the negative and positive acceleration signs are taken into account. Static analyses are performed applying these 24 load cases given in Table 3.33. The resultant von misses stresses at face and shear stresses at core are presented in the table for all the candidate core materials. In Table 3.3 shear stress values are more important for the selection of core material. It is clearly seen that maximum shear stress for three core materials occurs in load case 17, and these are 0.43, 0.38 and 0.34 MPa respectively. Due to the fact that, launch loads are derived from information in the user’s manual, past experience or additional documents where uncertainties occur, factors of safety must be used in order to make a reliable design. The aim is to establish a sufficient design margin without making ultra-safe approaches. In the computation of safety margins the following minimum factors of safety shall be used for the core materials: [81]
S yield stress factor of safety 1,25
S ultimate stress factor of safety 1,5
S minimum fatigue factor (cycles) 4

86 Structural Design and Analysis of a Solar Array Substrate for a GEO Satellite
Table 3-33 Static analysis load cases and resultant maximum Von Mises Stress values on the surface and core of solar panel substrate geometry-1
Load Case
Z axis (g’s)
X axis (g’s)
Y axis (g’s)
K13C2U/954-6/AL 50-3
K13C2U/954-6/ AL 32-5
K13C2U/954-6/AL 16-9
Ma
x.
Von
Mis
es
Str
ess
(MP
a)
Ma
x S
hea
r
(MP
a)
Ma
x.
Von
Mis
es
Str
ess
(MP
a)
Ma
x S
hea
r
(MP
a)
Ma
x.
Von
Mis
es
Str
ess
(MP
a)
Ma
x S
hea
r
(MP
a)
Face Core Face Core Face Core
1 31.6 2.8 2.8 25.9 0.1 23.1 0.05 21.2 0.06
2 31.6 2.8 - 2.8 22.7 0.1 20.3 0.05 18.7 0.06
3 31.6 -2.8 2.8 22.7 0.1 20.3 0.05 21.2 0.06
4 31.6 -2.8 -2.8 22.7 0.1 20.3 0.05 18.7 0.06
5 - 31.6 2.8 2.8 22.7 0.1 20.3 0.05 18.7 0.06
6 - 31.6 2.8 -2.8 22.7 0.1 20.3 0.05 18.7 0.06
7 - 31.6 -2.8 2.8 25.9 0.1 23.1 0.05 21.2 0.06
8 - 31.6 -2.8 -2.8 25.9 0.1 23.1 0.05 21.2 0.06
9 5 20.5 2.8 21.4 0.1 19.2 0.05 17.7 0.06
10 5 20.5 -2.8 21.4 0.1 19.2 0.05 17.7 0.06
11 5 -20.5 2.8 17.7 0.1 15.8 0.05 14.8 0.06
12 5 -20.5 -2.8 17.7 0.1 15.8 0.05 14.8 0.06
13 -5 20.5 2.8 17.7 0.1 15.8 0.05 14.8 0.06
14 -5 20.5 -2.8 17.7 0.1 15.8 0.05 14.8 0.06
15 -5 -20.5 2.8 21.4 0.1 19.2 0.05 17.7 0.06
16 -5 -20.5 -2.8 20.8 0.1 19.2 0.05 17.2 0.06
17 5 2.8 20.5 54.6 0.43 49.0 0.38 45.7 0.34
18 5 2.8 -20.5 54.6 0.43 49.0 0.38 45.7 0.34
19 5 -2.8 20.5 51.9 0.43 46.6 0.38 43.6 0.34
20 5 -2.8 -20.5 51.9 0.43 46.6 0.38 43.6 0.34
21 -5 2.8 20.5 51.9 0.43 46.6 0.38 43.6 0.34
22 -5 2.8 -20.5 51.9 0.43 46.6 0.38 43.6 0.34
23 -5 -2.8 20.5 54.6 0.43 46.6 0.38 43.6 0.34
24 -5 -2.8 -20.5 54.6 0.43 46.6 0.38 43.6 0.34
Margin of safety is defined as the amount of margin that exists above the material allowable for the applied loading condition with the factor of safety included. [72]
( )
( ) (3-10)

Design and Analysis of the Solar Array Substrate 87
Margin of safety calculations are typically made for material yield and ultimate strength conditions and it must be higher than zero for these conditions. Margin of safety and shear strength values are given in Table 3.34 for the three aluminum core materials with correction factor of 0.87 according to 30 mm (1.22 in) thickness values from Figure 3.14. The margin of safety is calculated according to the shear strength in W direction which exhibits the minimum strength. Table 3-34 Shear strengths and margin of safety of the aluminum core materials after employing correction factor of 0.87. Margin of safety for only Al 50-3 is positive.
Core Materials
(kg/m3)
(mm)
(Mpa)
(Mpa) Max shear
stress (MPa)
Margin of Safety
Al 50-3 50 3 1,57 0,87 0.43 0,35
Al 32-5 32 5 0,84 0,50 0.38 -0,11
Al 16-9 16 9 0,36 0,21 0.34 -0,59
Table 3.34 shows that only Al 50-3 core material provides a positive safety of margin whilst the other two materials fail under these load conditions. The static analysis result for the load case 17, where highest stresses occur, is plotted in Figure 3.40 for Al 50-3 core material and maximum shear stress is indicated. Therefore, this core material is chosen for the substrate geometry-1.
Figure 3-40 Maximum shear stress for the load case 17 of Al 50-3 core material. The maximum shear stress is 0.436 MPa
Al 16-9 material shear strength is already less than 0.34 and therefore it would fail under these load conditions. The load case 17 results for the core material Al 16-9 are plotted in Figure 3.39. It is clearly seen the resultant maximum shear stress value 3.48e-1 MPa is higher than the materials shear strength in w direction. Therefore, this material can’t be employed in the sandwich structure. It is also seen

88 Structural Design and Analysis of a Solar Array Substrate for a GEO Satellite
that maximum stress values occur around the hold down release mechanism attachments holes. These locations are stress concentration points for the structure.
Figure 3-41 Load case 17 result. Maximum shear stresses at core is 0.34 MPa and it is higher than material strength limit.
Maximum Von Mises stress value for the load case 17 of the substrate face material is plotted in Figure 3.41. The stress value is 54.6 Mpa
Figure 3-42 Maximum Von Mises stress value for the load case 17 of the face material. The maximum stress is 54.6 MPa
For the face material, failure criteria is much more complex. Although, the stress levels of the above load cases are reasonably low when considered the strength of the CFRP materials, in Msc. Patran Tsai-Wu failure criteria is employed over the results obtained and positive factor of margins are obtained.

Design and Analysis of the Solar Array Substrate 89
3.5.3.3. Static Analysis of Solar Array Substrate Geometry-2
Solar panel substrate geometry-2 is utilized in Msc. Patran for the static analysis. Static analyses are performed applying the highest load cases as occurred in previous analyses. For three different material pairs these results are provided in Table 3.35. The resultant von misses stresses at face and maximum shear stresses at the core are presented in the Table 3.35 for the all different core materials. Table 3-35 Static analysis results for important load cases of solar panel substrate geometry-2
Load case
Z axis (g’s)
X axis (g’s)
Y axis (g’s)
K13C2U/954-6/AL 50-3
K13C2U/954-6/ AL 32-5
K13C2U/954-6/AL 16-9
M
ax.
Von
Mis
es
Str
ess
(MP
a)
Ma
x S
hea
r
(MP
a)
Ma
x.
Von
Mis
es
Str
ess
(MP
a)
Ma
x S
hea
r
(MP
a)
Ma
x.
Von
Mis
es
Str
ess
(MP
a)
Ma
x S
hea
r
(MP
a)
Face Core Face Core Face Core
1 33.5 2.8 2.8 22.3 0.052 20.2 0.047 18.4 0.043 17 5 2.8 21.7 57.6 0.41 52.3 0.37 47.3 0.33 23 -5 -2.8 21.7 57.6 0.41 52.3 0.37 47.3 0.33 24 -5 -2.8 -21.7 57.6 0.41 52.3 0.37 47.3 0.33
The shear strength of the core materials are corrected by a factor of 0.92 according to the test result correction factor. The actual shear strength of these materials, maximum stress levels and margin of safety are formed in Table 3.36. Table 3-36 Shear strengths and margin of safety of the aluminum core materials after employing correction factor of 0.92. Margin of safety for only Al 50-3 is positive.
Core Materials
(kg/m3)
(mm)
(Mpa)
(Mpa) Max shear
stress (MPa)
Margin of Safety
Al 50-3 50 3 1,67 0,93 0.41 0,51
Al 32-5 32 5 0,89 0,54 0.37 -0,03
Al 16-9 16 9 0,38 0,22 0.33 -0,55
Table 3.36 presents the margin of safety for the solar panel substrate geometry-2 core materials under static loads. Al 50-3 core material is the only material with a positive safety of margin. Therefore, for the geometry-2 this material is chosen. The

90 Structural Design and Analysis of a Solar Array Substrate for a GEO Satellite
static analysis result for the load case 17 is plotted in Figure 3.43 and maximum shear stress on the core is indicated.
Figure 3-43 Solar panel substrate geometry-2 static analysis result for load case 17. Maximum shear stress on the core, 4.04*10-1 MPa, is indicated.
3.6. Evaluation of the Geometries
In the previous sections, both dynamic and static analyses are performed with two geometries utilizing candidate materials. According to the results of these analyses final materials for the core and face are determined. These materials and properties are summarized in Table 3-37. Table 3-37 Final configuration of the substrate geometries and its properties
Substrate Geometry
Core Material
Face Material
(mm)
(mm
Mass/Panel (kg)
Geometry - 1
Al 5056-50-3 K13C2U 30 1.08 39.39
Geometry - 2
Al 5056-50-3 K13C2U 25 1.08 28.85
Solar panel substrate geometry-2 is lighter than solar panel substrate geometry-1 with a 11 kg of difference. Although this is an advantage in mass saving, total array has to be evaluated due to fact that the number of panels differ in each case. In addition, even though number of hold down release mechanisms is the same in each geometry, the additional mass due to these mechanisms has to be added on the total solar array mass. This trade is performed in table 3.38 and total mass of the array in each case is calculated.
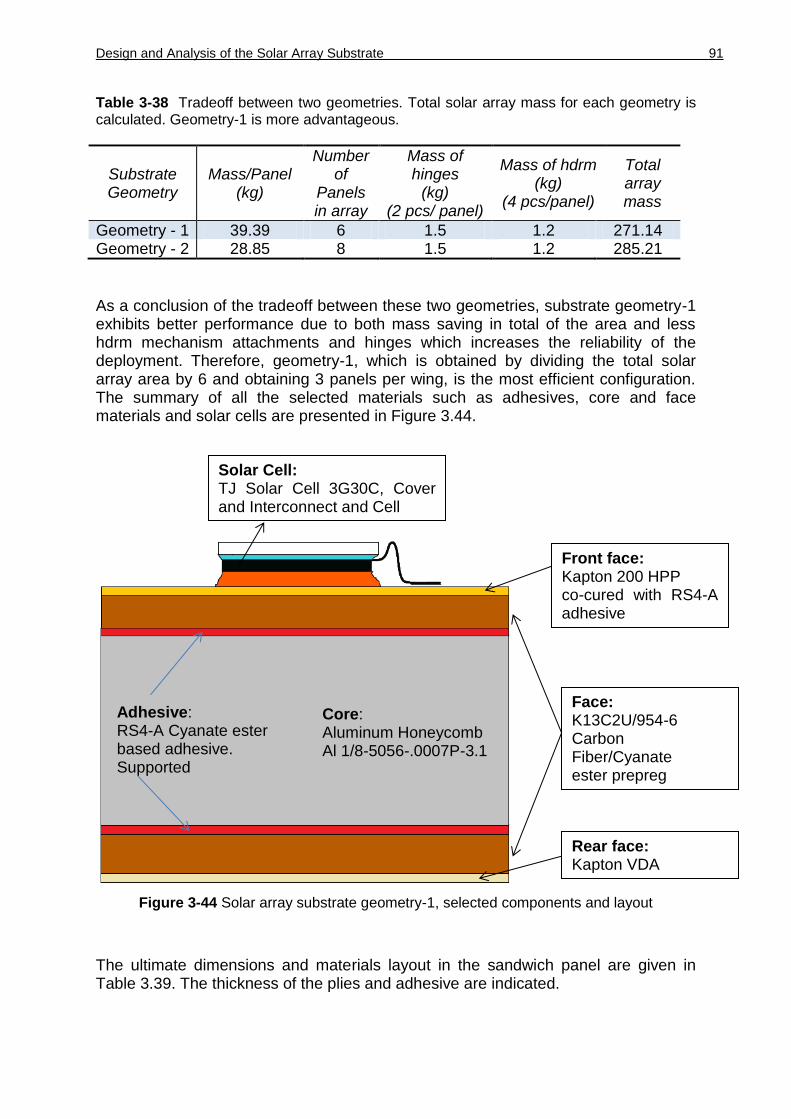
Design and Analysis of the Solar Array Substrate 91
Table 3-38 Tradeoff between two geometries. Total solar array mass for each geometry is calculated. Geometry-1 is more advantageous.
Substrate Geometry
Mass/Panel (kg)
Number of
Panels in array
Mass of hinges
(kg) (2 pcs/ panel)
Mass of hdrm (kg)
(4 pcs/panel)
Total array mass
Geometry - 1 39.39 6 1.5 1.2 271.14 Geometry - 2 28.85 8 1.5 1.2 285.21
As a conclusion of the tradeoff between these two geometries, substrate geometry-1 exhibits better performance due to both mass saving in total of the area and less hdrm mechanism attachments and hinges which increases the reliability of the deployment. Therefore, geometry-1, which is obtained by dividing the total solar array area by 6 and obtaining 3 panels per wing, is the most efficient configuration. The summary of all the selected materials such as adhesives, core and face materials and solar cells are presented in Figure 3.44.
Figure 3-44 Solar array substrate geometry-1, selected components and layout
The ultimate dimensions and materials layout in the sandwich panel are given in Table 3.39. The thickness of the plies and adhesive are indicated.
Core: Aluminum Honeycomb Al 1/8-5056-.0007P-3.1
Face: K13C2U/954-6 Carbon Fiber/Cyanate ester prepreg
Adhesive: RS4-A Cyanate ester based adhesive. Supported
Front face: Kapton 200 HPP co-cured with RS4-A adhesive
Solar Cell: TJ Solar Cell 3G30C, Cover and Interconnect and Cell
Rear face: Kapton VDA

92 Structural Design and Analysis of a Solar Array Substrate for a GEO Satellite
Table 3-39 Geometry -1 solar array substrate ply layout
Ply No Type of Ply Ply Angle Ply Thickness (mm)
1 Kapton, 200 HPP-ST N/A 0.051
2 RS4-A Adhesive N/A 0.051
3 K13/954-6 60º 0.06
4 K13/954-6 0º 0.06
5 K13/954-6 -60º 0.06
6 K13/954-6 -60º 0.06
7 K13/954-6 0º 0.06
8 K13/954-6 60º 0.06
9 K13/954-6 60º 0.06
10 K13/954-6 0º 0.06
11 K13/954-6 -60º 0.06
12 K13/954-6 -60 0.06
13 K13/954-6 0º 0.06
14 K13/954-6 60º 0.06
15 K13/954-6 60º 0.06
16 K13/954-6 0º 0.06
17 K13/954-6 -60º 0.06
18 K13/954-6 -60º 0.06
19 K13/954-6 0º 0.06
20 K13/954-6 60º 0.06
21 RS4-A Adhesive N/A 0.051
22 Al 1/8-5056-.0007P-3.1 N/A 30
23 RS4-A N/A 0.051
24 K13/954-6 60º 0.051
25 K13/954-6 0º 0.051
26 K13/954-6 -60º 0.06
27 K13/954-6 -60º 0.06
28 K13/954-6 0º 0.06
29 K13/954-6 60º 0.06
30 K13/954-6 60º 0.06
31 K13/954-6 0º 0.06
32 K13/954-6 -60º 0.06
33 K13/954-6 -60 0.06
34 K13/954-6 0º 0.06
35 K13/954-6 60º 0.06
36 K13/954-6 60º 0.06
37 K13/954-6 0º 0.06
38 K13/954-6 -60º 0.06
39 K13/954-6 -60º 0.06
40 K13/954-6 0º 0.06
41 K13/954-6 60º 0.06
42 RS4-A Adhesive N/A 0.06
43 Kapton VDA N/A 0.051

Conclusion 93
Chapter 4 CONCLUSIONS
4.1. General Conclusions
In the scope of this master thesis, design and analysis of a solar array substrate for a geostationary telecommunication satellite is performed. First of all, according to the design requirements which were provided by Biluzay, total solar array area was calculated taking into account power requirement in eclipse time, radiation losses and temperature effects on the solar cell output. Worst case temperatures are predicted and employed for the calculation of voltage and current changes for maximum power point at these cases. Number of solar cells in parallel and series are calculated to achieve bus voltage and required power output. Additionally, utilizing loss factors, error margins, worst sun-angle, voltage and current adjustments, it is aimed to best converge the result of the total area. Deployment of the panels was also evaluated by trading several mechanisms commercially available. Hold down release mechanism which is based on the idea of a magnetic clamp is selected due to low shock release and very low space debris. Actuation mechanisms that are the torsion spring driven hinges were carefully chosen considering the output torque and allowable operating temperatures. In the design and analysis of solar array substrate chapter, design methodology was profoundly described. Design criteria for the array substrate are established considering conventional spacecraft structures and particular requirements for the operation and objective of the structure. Dimensioning of the solar panels is performed trading panel area versus acceptable panel sizes and thus two different solar panel geometries are formed. For each geometry, number of panels in the array was different such that for larger dimensions; fewer panels were required in the array. A careful attention was paid to the sandwich structures and candidate materials for the face and core of the panels. Metallic i.e. aluminum and non-metallic honeycombs such as carbon, Nomex, Korex, fiberglass along with PMI foams were selected and their influence on the natural frequency of the substrate was examined utilizing finite element methods. The same density core materials were applied to the substrate core by employing an approach which is based on the sandwich theory. The result of these analyses presented that carbon, fiberglass and aluminum honeycombs core materials have very similar results. At this point, cost efficiency and thermal characteristics expectation of the core were taken into account and Aluminum material was chosen due to highest cost efficiency and high specific shear modulus. Carbon and fiberglass honeycombs exhibit no particular advantage on mass saving and on the contrary with a cost penalty. Additionally, PMI foams exhibit very low performance. Among the face materials K13 ultra high modulus pitch fiber with Cyanate resin prepreg were selected due to its higher performance on the natural frequencies and low outgassing and moisture absorption pick-up. Different cured ply thickness and stacking up of plies are employed and results of natural frequencies are evaluated, but due to the fact that, the face sheet of the sandwich panels shall have low coefficient of thermal expansion, these parameters are determined according to the thermal properties. Thus lay-up orientation was selected

94 Structural Design and Analysis of a Solar Array Substrate for a GEO Satellite
as [60º/0º/-60º] which provides thermally stable structure. Furthermore, the optimum locations for the hold down release mechanisms are evaluated with several analyses altering these points and 65% of the semi-edge distance was chosen due to highest frequency results. Once best performance materials and configurations were determined, solar array substrate geometry-1 and geometry-2 were analyzed and optimum core and face thicknesses were obtained. For the core materials, three aluminum core materials with different densities and cell sizes were considered. In the following steps, these geometries are evaluated under launch induced loads which are essentially inertial “g” loads. Primarily, steady state accelerations of a launch vehicle were taken into account. These accelerations are always considered as quasi-static load factors. Later on, random vibration load factors were calculated by employing Mile’s equation on the ESA random vibrations specifications. The resultant random vibration load factors are combined with aforementioned static load factors and 24 load cases were created taking into account acceleration directions. These load cases were then applied to the geometry-1 and geometry-2 and Von Mises stress values on the face and maximum shear stress values on core of different material pairs were listed. According to the strength limit of these materials, factor of safety 1.5 applied and margin of safety for the maximum stress levels were calculated. For both geometries, Al 5056-50-3 core materials were the only group that have positive margin of safety. Al 5056-16-9 core materials did have less shear strength than the resultant stress. Thus, they were too weak to be used under these loads. An important aspect that should be mentioned is that the hdrm or restrains points or locations of the panels require special attention as they are stress concentration regions. For the final section of the design, array properties for both geometries were compared considering number of panels, array weight, and additional deployment weights due to hinges and hold down release mechanisms. The result of the comparison shows that maximizing panel dimensions would result in less total solar array weight and deployment of panels would be more reliable due to less actuation mechanisms, restrain mechanisms and total stowed panel volume. Therefore, smaller panels sizes don’t bring any weight advantage. Due to the fact that the design of solar array substrate are high specific stiffness driven, solar panels with larger dimensions can be stowed and protected with restrain mechanisms such that any buckling or failure of the material would not occur. Furthermore, fewer panels per wing would bring in more reliability on the deployment of panels because increased mechanisms and attachments points would enlarge risk of failure. Thus, the design of a solar array substrate and panels for a high powered telecommunication satellite would mainly intensify this philosophy, achieving total solar array with less rigid panels by higher dimensions and less deployment mechanisms. In the scope of this work, the design and analysis of the substrate is focused on the launch induced loads and also thermal issues during operation and thermal properties of the structure are evaluated during material selection and analyses. However, thermal design of solar arrays requires very profound knowledge and experience and must carried out by special attention which is beyond the limit of this work. For that reason, taking into account materials with low coefficient of thermal

Conclusion 95
expansions and stacking orientation of plies to obtain thermally stable structure could enhance the thermal characteristic of the substrate. Furthermore, this approach would bring in more approximate and realistic results to the ones that would be obtained after thermal analysis of the satellite and its components. As a conclusion, taking into account all the considerations, the design and analysis of a solar array substrate was performed profoundly by considering several factors such as various materials for the sandwich structure of the panels, different geometries for panels, optimum restrain attachment points and in service conditions of the array. The final design is a light weight, robust, cost efficient and that would survive under launch induced loads which are steady state accelerations and random vibration load factors. A great importance was given on orbit environment such as low vacuum, outgassing of materials and in service temperatures, with an aim of to realize more realistic design.
4.2. Future Work
Throughout the design and analysis of solar array substrate, various issues have been noticed and encountered which are related with this study. These aspects are concluded in future work. First of all, the solar array design could be enhanced with more sophisticated analysis of the satellite such using energy balance incorporating solar array and battery models with panel thermal and orbital information for Sun-angle variations on the panels during various periods in the orbit. Furthermore, thermal analysis of the satellite and its solar array would provide more specific temperatures and thus solar cell performance at these temperatures which could change the total solar array area. Detailed design of deployment mechanisms would be very helpful for the spaces that are dedicated for the hinge connections and excessive dimensioning of panels would be prevented. Secondly, thermal and thermo-elastic analysis would be required for the solar array substrate particularly face sheet which is CFRP material and its thermal properties are strictly depends on the fiber orientation, fibre volume and moisture take-up. For this analysis more accurate representation of the sandwich structure is needed. In addition, when the core is bonded between face sheets it has some influence on the
in‐plane stiffness, which is usually neglected in the simple sandwich models. Furthermore, temperature gradients should be examined that would occur in the plane of the structure as well although the thickness of the sandwich assembly which is dependent on the equivalent thermal conductivity and radiative heat exchange. Last but not the least, more accurate FEA of the substrate structure could be performed by modeling the core with 3D solid elements having homogenized core material properties; face sheet with shell elements and adhesive as an additional layer. The use of such detailed models for larger structures such as an entire solar panel usually time, cost and resource prohibitive. Therefore, simpler approaches are employed frequently and then the structure is tested for qualification.

96 Structural Design and Analysis of a Solar Array Substrate for a GEO Satellite
Chapter 5 BIBLIOGRAPHY
[1] Cnes, "Today’s Technologies", Available: http://www.cnes.fr/web/CNES-en/1107-todays-technologies.php. [Accessed 03 03 2013].
[2] International Guide to Products and Services for the Composite Industry, “Space Systems 3A”, Available: www.compositesworld.com.
[3] "R.T. Haftka, Z. Gurdal and M. P. Kamat, “Elements of Structural Optimization”, Kluwer Academic Publishers, Boston, USA, (2009).
[4] "International Guide to Products and Services for the Composite Industry," [Online]. Available: www.compositesworld.com.
[5] R. R. Sheila Bailey, “Space Solar Cells and Arrays”, 2009, pp. 50-60.
[6] "Powerig Future- A new generation of High Performance Solar Arrays, " ESA Bulletin 131, p. 5, 2007.
[7] "GPM Solar Array Assembly," NASA, 18 10 2011. [Online]. Available: http://pmm.nasa.gov/node/448. [Accessed February 2013].
[8] Tubitak Uzay, “Uzay Uygulamalari”, 2011, Ankara, Available: http://www.uzay.tubitak.gov.tr/tubitakUzay/en/projects/spaceApplications.php. [Accessed 06 03 2013].
[9] V. L. Pisacane, Fundamentals of Space Systems, 2nd edition, p. 480. Oxford University Press, (2005).
[10] Biluzay, “Bilkent University Space Technologies Research Center (BILUZAY)”, Available: http://www.biluzay.bilkent.edu.tr/ .
[11] "Bailey S, Raffaelle R. , “Solar Cell and Array Technology for Future Space Science Missions”, Internal, John Wiley, (2003)
[12] Spacetech, “Sp5 Solar Generator Design and Properties", (2011) Available: http://www.spacetech-i.com/s5p-solar-generator.html. [Accessed March 2013].
[13] Rauschenbach H. S., “Solar Cell Array Design Handbook”, pp 130-100. (1976)
[14] C. D. Brown, “Elements of Spacecraft Design”, p. 326, AIAA Education Seris, (2002).
[15] ESOA, European Satellite Operators'Association,”Satellite Orbits” Available: http://www.esoa.net/Orbits.htm. [Accessed 03 03 2013].
[16] ECSS - European Coorperation for Space Standardization, “Structural Materials Handbook -Part 2: Design Calculation Methods And General Design Aspects”, p. 299. ESA-ESTEC, Noordwijk, Netherlands, (2011).
[17] V. L. Pisacane, “Fundamentals of Space Systems”, p. 330. 2nd edition, Oxford University Press, (2005).
[18] C. D. Brown, “Elements of Spacecraft Design”, p. 326, AIAA Education Series, (2002).
[19] Bailey S, Flood D, Prog. Photovolt. 6, 1–14 (1998).
[20] Wijker J. J., “Spacecraft Structures”, Dutch Space BV, Springer, Leiden, p. 120,

Bibliography 97
Netherlands, (2008)
[21] Wikipedia, “Solar Cells” Available: http://en.wikipedia.org/wiki/Solar_cell.
[22] Spectrolab, “Solar Cell Data Sheet-XTJ”, Available: http://www.spectrolab.com/DataSheets/cells/PV%20XTJ%20Cell%205-20-10.pdf.
[23] Fatemi N. S., “Solar Array Trades Between Very High-Efficiency Multi-Junction And Si Space Solar Cells”, 28th IEEE PVSC, Alaska, (2006)
[24] H.J. de Graaf, "Electric Power Subsystems In Satellites", Ducth Space, Symposium on Advanced Battery Technology in Automotive and Aerospace, Helmond, (2010).
[25] C. D. Brown, “Elements of Spacecraft Design”, p. 349, AIAA Education Series, (2002).
[26] Reddy M. R, “Space Solar Cells – Tradeoff Analysis”, Elsevier, Bangalore, India, (2002).
[27] Azur Space GMBH, “Space Solar Cells”, Available: http://azurspace.de/index.php/en/products/products-space/space-solar-cells. [Accessed March 2013].
[28] Larson W. J., Wertz J. R., “Space Mission Analysis and Design”, 3rd ed., Chapter 10-11., Microcosm, (1999)
[29] Rauschenbach H. S., “Solar Cell Array Design Handbook”, pp 350-320. (1976)
[30] ECSS- European Coorperation for Space Standardization, “Space Engineering-Testing, ECSS-E-10-03A”, ESA-ESTEC, Noordwijk, Netherlands, (2002)
[31] V. L. Pisacane, “Fundamentals of Space Systems”, Oxford University Press, 2nd edition, p. 416, (2009).
[32] C. D. Brown, “Elements of Spacecraft Design”, p. 342, AIAA Education Series, (2002).
[33] V. L. Pisacane, “Fundamentals of Space Systems”, p. 346. 2nd edition, Oxford University Press, (2005).
[34] European Space Agency, “Hold-Down and Separation Systems”, accessed on 4 September 2012, last update 19 January 2011, available on: http://www.esa.int/TEC/mechanisms/SEM9T0DR5GG_0.html
[35] E. H. M. Devine, "Space Mechanisms Lessons Learned Study," Available: http://www.grc.nasa.gov/WWW/spacemech/vol1.html. [Accessed 12 December 2012].
[36] C. Z. Jens Müller, "Low Shock Release Unit – Easy Resettable And 100 % Reusable" Astrium GmbH, Munich, (2008).
[37] T. A. Space, "Solar Array Deployment Mechanisms" Thales Alenia Space, France, Touluse, (2004).
[38] Wijker J. J., “Spacecraft Structures”, p. 106,Dutch Space BV, Springer, Leiden, Netherlands, (2008).
[39] P. Gaudenzi, "ESA SME Initiative Training Course - Space Structures," ESA SME.
[40] Griffin M. D., French J. R., “Space Vehicle Design”, Reston, pp. 80-60 (2004).
[41] AzurSpace GMBH,” TJ Solar Cell 3G30C - Advanced Date sheet”.
[42] "Formosat-5 Solar Generator," Spacetech, [Online]. Available: http://www.spacetech-i.com/Formosat-5-solar-generator.html.

98 Structural Design and Analysis of a Solar Array Substrate for a GEO Satellite
[Accessed 12 March 2013].
[43] M. Ashby, “Materials Selection in Mechanical Design”, 2nd ed., p. 310, Butterworth-Heinemann,Oxford, (1999).
[44] Hexcel Composites, Hexweb TM, Datasheet “Honeycomb Sandwich Design Technolgy”, (2005)
[45] Hexcel Composites, Hexweb TM, Datasheet “Honeycomb Attributes and Properties”, (2008)
[46] Gibson L. J., Ashby M. F., “Cellular Solids: Structure and Properties”,pp 210, Cambridge University, (1999)
[47] Allen H. G., “Analysis and Design of Structural Sandwich Panel”, Pergamon press, (1985)
[48] Juan L., Yang-bao W, "The Equivalent Analysis of Honeycomb Sandwich Plates for Satellite Structure," Shanghai Jiaotong Univ, (2005).
[49] Wijker J. J., “Spacecraft Structures”, Dutch Space BV, Springer, Leiden, p. 159, Netherlands, (2008)
[50] P. Gaudenzi, "ESA SME Initiative Training Course – Composite Materials" ESA SME
[51] Hexcel Composites, Hexweb TM, Datasheet “Honeycomb Attributes and Properties”, p. 12 (2008).
[52] Hexcel Composites, Hexweb TM, Datasheet “Honeycomb Attributes and Properties”, p. 20, (2008).
[53] Hexcel Composites, Hexweb TM, Datasheet “Honeycomb Attributes and Properties”, p. 13, (2008).
[54] T. Bitzer, “Honeycomb Technology: Materials, Design, Manufacturing, Applications and Testing”, p. 78, Springer, (1997).
[55] "CES EDUPACK 2012 Material Universe software," Composites,foams, hoenycombs database.
[56] International Guide to Products and Services for the Composite Industry, “Space Systems 3B”, Available: www.compositesworld.com.
[57] Peter S. T., “Handbook of Composite Materials”, p. 271, 2nd edition, Springer, (1997).
[58] ASM Handbook, “Composites Lightweight Structural Cores”, Vol. 21, pp. 180-183, ASM International, (2001)..
[59] ECSS - European Coorperation for Space Standardization, “Structural materials handbook -Part 3: Load transfer and design of joints and design of structures”, p. 192. ESA-ESTEC, Noordwijk, Netherlands, (2011).
[60] Designing-for-dimensional-stability-in-space, "Composites World," [Online]. Available: http://www.compositesworld.com/articles/design ing-for-dimensional-stability-in-space. [Accessed 22 May 2013].
[61] Peter S. T., “Handbook of Composite Materials”, p. 1009, 2nd edition, Springer, (1997).
[62] Hexcel Product Data “Hexply 954-6 curing cyanate matrix”, avalaible: http://www.hexcel.com/Resources/DataSheets/Prepreg-Data-Sheets/954_6_us.pdf
[63] MIL-HDBK-17-2F, “Composite Materials Handbook: Polymer Matrix Composites

Bibliography 99
Materials Properties”, Vol 2., p. 314, (1999)
[64] Hexcelc Calculator for Cure Ply Thickness," .Available: http://www.hexcel.com/resources/calculator.
[65] ECSS - European Coorperation for Space Standardization, “Adhesive Bonding”, p. 250. ESA-ESTEC, Noordwijk, Netherlands, (2011).
[66] Tencate RS3 Data sheet," [Online]. Available: http://www.tencate.com/TenCate/Aerospace_ composites/documents/T CAC%20USA%20docs/TCAC%20USA%20Datasheets/DataSheet/RS-3 _TB_DS_Web.pdf. [Accessed 25 May 2013].
[67] Wijker J. J., “Spacecraft Structures”, p. 258, Dutch Space BV, Springer, Leiden, Netherlands, (2008).
[68] S. Ontac, "Structural Finite Element Analysis of Stiffened and Honeycomb Panels of the RASAT Satellite," IEEE, p. 5, 2007.
[69] Hexcel Composites, Hexweb TM, Datasheet “Honeycomb Sandwich Design Technolgy”, p. 18, (2005)
[70] V. L. Pisacane, “Fundamentals of Space Systems”, p. 487. 2nd edition, Oxford University Press, (2005).
Related Documents