Episodic euxinia in the Changhsingian (late Permian) of South China: Evidence from framboidal pyrite and geochemical data Hengye Wei a,b, ⁎, Thomas J. Algeo b, ⁎⁎, Hao Yu c , Jiangguo Wang c , Chuan Guo c , Guo Shi a a College of Earth Science, East China Institute of Technology, Nanchang, Jiangxi Province, 330013, China b Department of Geology, University of Cincinnati, Cincinnati, OH 45221, USA c Key Laboratory of Petroleum Resources Research, Institute of Geology and Geophysics, Chinese Academy of Sciences, Beijing 100029, China abstract article info Article history: Received 6 September 2014 Received in revised form 23 November 2014 Accepted 24 November 2014 Available online 12 February 2015 Editor: J. Knight Keywords: Trace metals Organic carbon isotopes Sulfur isotopes Redox proxies Mass extinction Permian–Triassic boundary A multiproxy study of a new Upper Permian–Lower Triassic section (Xiaojiaba) in Sichuan Province, China, documents large changes in marine productivity, redox conditions and detrital input prior to the latest Permian mass extinction. Marine productivity, as proxied by total organic carbon content (TOC), biogenic SiO 2 , and excess barium, displays a long-term decline through most of the Changhsingian stage (late late Permian), culminating in very low values around the Permian–Triassic boundary. Concurrently, redox proxies including pyrite framboid, δ 34 S py , Mo auth and U auth , and C org /P document a shift from suboxic to dysoxic/oxic conditions that was interrupted by several episodes of benthic euxinia, and detrital siliciclastic proxies (Al, Hf, Nb, and REEs) suggest an increased flux of weathered material from land areas. The long-term changes in productivity, redox conditions, and terrigenous detrital fluxes were probably caused by a regional sea-level fall across the South China Craton. On the other hand, the brief euxinic episodes occurring during the late Permian had oceanographic causes, probably related to the transient upward expansion of the chemocline at the top of the oceanic oxygen-minimum zone. These euxinic episodes may have been harbingers of the more widespread anoxia that developed concurrently with the latest Permian mass extinction and that may have played a major role in triggering the largest biotic crisis of the Phanerozoic. © 2015 Elsevier B.V. All rights reserved. 1. Introduction The latest Permian mass extinction (LPME) was the largest biotic crisis in Earth's history, with a ~90% species-level loss of diversity among marine invertebrates (Erwin et al., 2002; Alroy et al., 2008). The causes of this extinction event were complex, but an important factor is thought to have been an abrupt expansion of oceanic anoxia and photic zone euxinia (Wignall and Hallam, 1992; Wignall et al., 1995; Knoll et al., 1996, 2007; Wignall and Twitchett, 1996; Hotinski et al., 2001; Grice et al., 2005; Huey and Ward, 2005; Kump et al., 2005; Gorjan et al., 2007; Cao et al., 2009; Brennecka et al., 2011; Kaiho et al., 2012; Dustira et al., 2013; Takahashi et al., 2014). Some studies have claimed that the onset of widespread oceanic anoxia (‘superanoxia’) started during the early Wuchiapingian (Isozaki, 1997; Kato et al., 2002), whereas other studies have proposed a later onset, e.g., during the late Wuchiapingian or early Changhsingian (Nielsen and Shen, 2004; Wignall et al., 2010). The timing and extent of oceanic anoxia during the late Permian and early Triassic remain uncertain (Dustira et al., 2013) and are in need of further investigation. Here, we present an analysis of marine productivity, redox conditions, and terrigenous detrital fluxes at Xiaojiaba, a new Permian–Triassic (P–Tr) boundary section located in Sichuan Province, South China (Fig. 1a). In this study, we utilize total organic carbon (TOC), biogenic silica (SiO 2(bio) ), and excess Ba (Ba xs ) as proxies for marine productivity; the morphology, sulfur concentration (S py ) and isotopic composition (δ 34 S py ) of pyrite, organic carbon: phosphorus ratio (C org /P), and authigenic Mo and U concentrations (Mo auth and U auth ) as proxies for marine redox conditions; and Al, Hf, Nb and rare earth element (REE) concentrations as proxies for terrigenous detrital inputs. These analyses provide new insights into changes in redox conditions and their under- lying controls during the late Permian prior to the LPME. 2. Geological background 2.1. Paleogeographic setting The study area was on the northern (paleo-western) margin of the South China Craton, a microcontinent that was located in the tropics during the late Permian (Fig. 1b). The Xiaojiaba and Chaotian sections described below were located within the Guangwang Basin, one of Sedimentary Geology 319 (2015) 78–97 ⁎ Correspondence to: H. Wei, College of Earth Science, East China Institute of Technology, Nanchang, Jiangxi Province, 330013, China. ⁎⁎ Corresponding author. E-mail addresses: [email protected], [email protected] (H. Wei), [email protected] (T.J. Algeo). http://dx.doi.org/10.1016/j.sedgeo.2014.11.008 0037-0738/© 2015 Elsevier B.V. All rights reserved. Contents lists available at ScienceDirect Sedimentary Geology journal homepage: www.elsevier.com/locate/sedgeo

Welcome message from author
This document is posted to help you gain knowledge. Please leave a comment to let me know what you think about it! Share it to your friends and learn new things together.
Transcript
Sedimentary Geology 319 (2015) 78–97
Contents lists available at ScienceDirect
Sedimentary Geology
j ourna l homepage: www.e lsev ie r .com/ locate /sedgeo
Episodic euxinia in the Changhsingian (late Permian) of South China:Evidence from framboidal pyrite and geochemical data
Hengye Wei a,b,⁎, Thomas J. Algeo b,⁎⁎, Hao Yu c, Jiangguo Wang c, Chuan Guo c, Guo Shi a
a College of Earth Science, East China Institute of Technology, Nanchang, Jiangxi Province, 330013, Chinab Department of Geology, University of Cincinnati, Cincinnati, OH 45221, USAc Key Laboratory of Petroleum Resources Research, Institute of Geology and Geophysics, Chinese Academy of Sciences, Beijing 100029, China
⁎ Correspondence to: H. Wei, College of Earth SciTechnology, Nanchang, Jiangxi Province, 330013, China.⁎⁎ Corresponding author.
E-mail addresses: [email protected], [email protected]@ucmail.uc.edu (T.J. Algeo).
http://dx.doi.org/10.1016/j.sedgeo.2014.11.0080037-0738/© 2015 Elsevier B.V. All rights reserved.
a b s t r a c t
a r t i c l e i n f oArticle history:Received 6 September 2014Received in revised form 23 November 2014Accepted 24 November 2014Available online 12 February 2015
Editor: J. Knight
Keywords:Trace metalsOrganic carbon isotopesSulfur isotopesRedox proxiesMass extinctionPermian–Triassic boundary
A multiproxy study of a new Upper Permian–Lower Triassic section (Xiaojiaba) in Sichuan Province, China,documents large changes in marine productivity, redox conditions and detrital input prior to the latest Permianmass extinction.Marine productivity, as proxied by total organic carbon content (TOC), biogenic SiO2, and excessbarium, displays a long-termdecline throughmost of the Changhsingian stage (late late Permian), culminating invery low values around the Permian–Triassic boundary. Concurrently, redox proxies including pyrite framboid,δ34Spy,Moauth andUauth, and Corg/P document a shift from suboxic to dysoxic/oxic conditions thatwas interruptedby several episodes of benthic euxinia, and detrital siliciclastic proxies (Al, Hf, Nb, and REEs) suggest an increasedflux of weathered material from land areas. The long-term changes in productivity, redox conditions, andterrigenous detrital fluxes were probably caused by a regional sea-level fall across the South China Craton. Onthe other hand, the brief euxinic episodes occurring during the late Permian had oceanographic causes, probablyrelated to the transient upward expansion of the chemocline at the top of the oceanic oxygen-minimum zone.These euxinic episodes may have been harbingers of the more widespread anoxia that developed concurrentlywith the latest Permian mass extinction and that may have played a major role in triggering the largest bioticcrisis of the Phanerozoic.
© 2015 Elsevier B.V. All rights reserved.
1. Introduction
The latest Permian mass extinction (LPME) was the largest bioticcrisis in Earth's history, with a ~90% species-level loss of diversityamong marine invertebrates (Erwin et al., 2002; Alroy et al., 2008).The causes of this extinction event were complex, but an importantfactor is thought to have been an abrupt expansion of oceanic anoxiaand photic zone euxinia (Wignall and Hallam, 1992; Wignall et al.,1995; Knoll et al., 1996, 2007; Wignall and Twitchett, 1996; Hotinskiet al., 2001; Grice et al., 2005; Huey and Ward, 2005; Kump et al.,2005; Gorjan et al., 2007; Cao et al., 2009; Brennecka et al., 2011;Kaiho et al., 2012; Dustira et al., 2013; Takahashi et al., 2014). Somestudies have claimed that the onset of widespread oceanic anoxia(‘superanoxia’) started during the early Wuchiapingian (Isozaki, 1997;Kato et al., 2002), whereas other studies have proposed a later onset,e.g., during the late Wuchiapingian or early Changhsingian (Nielsenand Shen, 2004; Wignall et al., 2010). The timing and extent of oceanic
ence, East China Institute of
(H. Wei),
anoxia during the late Permian and early Triassic remain uncertain(Dustira et al., 2013) and are in need of further investigation.
Here, we present an analysis ofmarine productivity, redox conditions,and terrigenous detrital fluxes at Xiaojiaba, a new Permian–Triassic(P–Tr) boundary section located in Sichuan Province, South China(Fig. 1a). In this study, we utilize total organic carbon (TOC), biogenicsilica (SiO2(bio)), and excess Ba (Baxs) as proxies formarine productivity;the morphology, sulfur concentration (Spy) and isotopic composition(δ34Spy) of pyrite, organic carbon: phosphorus ratio (Corg/P), andauthigenic Mo and U concentrations (Moauth and Uauth) as proxies formarine redox conditions; and Al, Hf, Nb and rare earth element (REE)concentrations as proxies for terrigenous detrital inputs. These analysesprovide new insights into changes in redox conditions and their under-lying controls during the late Permian prior to the LPME.
2. Geological background
2.1. Paleogeographic setting
The study area was on the northern (paleo-western) margin of theSouth China Craton, a microcontinent that was located in the tropicsduring the late Permian (Fig. 1b). The Xiaojiaba and Chaotian sectionsdescribed below were located within the Guangwang Basin, one of
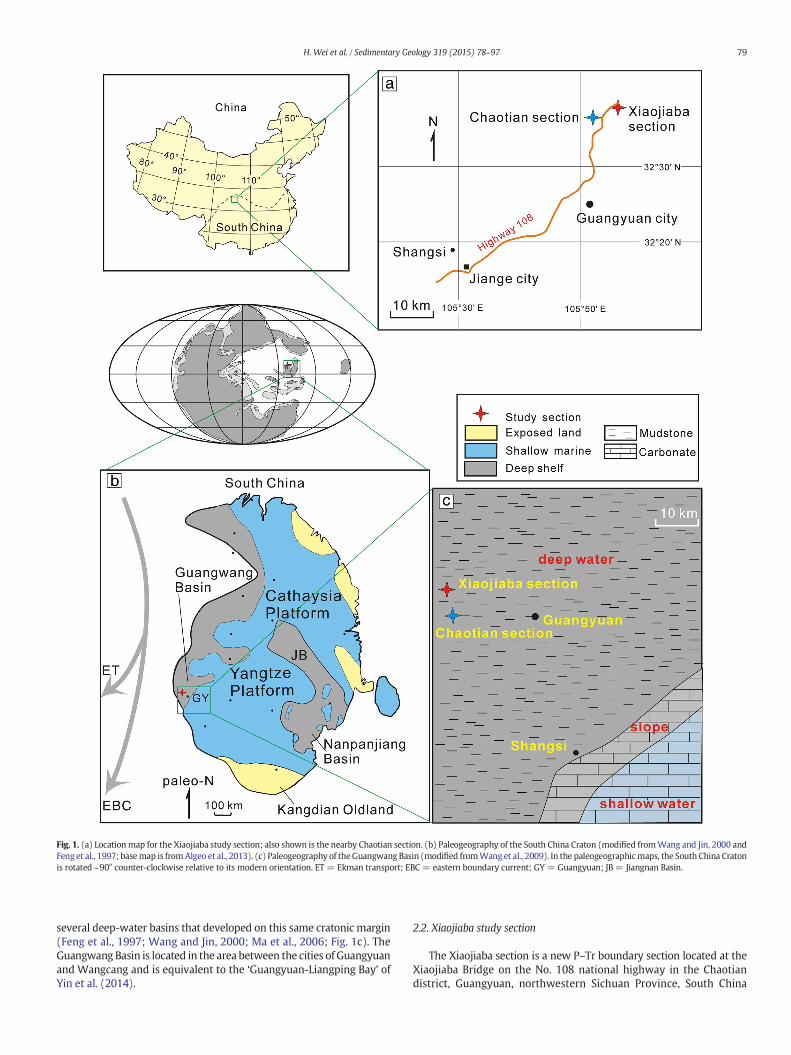
Fig. 1. (a) Locationmap for the Xiaojiaba study section; also shown is the nearby Chaotian section. (b) Paleogeography of the South China Craton (modified fromWang and Jin, 2000 andFeng et al., 1997; basemap is fromAlgeo et al., 2013). (c) Paleogeography of theGuangwang Basin (modified fromWang et al., 2009). In the paleogeographicmaps, the South China Cratonis rotated ~90° counter-clockwise relative to its modern orientation. ET = Ekman transport; EBC = eastern boundary current; GY = Guangyuan; JB = Jiangnan Basin.
79H. Wei et al. / Sedimentary Geology 319 (2015) 78–97
several deep-water basins that developed on this same cratonic margin(Feng et al., 1997; Wang and Jin, 2000; Ma et al., 2006; Fig. 1c). TheGuangwang Basin is located in the area between the cities of Guangyuanand Wangcang and is equivalent to the ‘Guangyuan-Liangping Bay’ ofYin et al. (2014).
2.2. Xiaojiaba study section
The Xiaojiaba section is a new P–Tr boundary section located at theXiaojiaba Bridge on the No. 108 national highway in the Chaotiandistrict, Guangyuan, northwestern Sichuan Province, South China

80 H. Wei et al. / Sedimentary Geology 319 (2015) 78–97
(32°38.25′ N, 105°53.35′ E) (see also Wei et al., 2012a) (Fig. 1a). It wasdeposited in a deep-shelf environment, about 45 km from a slope on thepaleowestern margin of the Yangtze Platform (Fig. 1c).
The upper Permian Wuchiaping and Dalong formations andthe lower Triassic Feixianguan Formation exhibit nearly completeexposure in outcrop (Fig. 2). The 13-m-thick Wuchiaping Formation(Wuchiapingian stage) consists of intercalated gray to dark-gray, thin-bedded nodular chert and thin- to medium-bedded lime mudstone.The 15-m-thick Dalong Formation consists of dark, weakly bioturbated,thin-bedded radiolarian muddy chert in the lower and middle parts,and of thin- to medium-bedded mudstone, siliceous limestone, andnodular limestone in the upper part (Fig. 2). The siliceous and nodularlimestone succession contains abundant fossils, including brachiopods,gastropods, and ammonoids. Although a few volcanic tuffs are foundin the lower andmiddle parts of this formation, the upper part containsa large number of such layers. The Dalong Formation is thought tospan the upper Wuchiapingian to uppermost Changhsingian stages,terminating at the stratigraphic level of the LPME (Fig. 2).
The base of the Feixianguan Formation consists about 0.8 m of dark-gray calcareous shale with several thin-bedded gray muddy limestoneinterlayers. This P–Tr boundary interval contains two N5-cm-thick anda number of N0.5-cm-thick volcanic tuff layers (at ~15 m, Fig. 2),suggesting frequent, large volcanic eruptions. The two thicker tuff layersare sometimes referred to as the “boundary clays” and are a distinctivefeature of the P–Tr boundary in sections across South China (Yin et al.,1992; Peng et al., 2001). Overlying these tuffs are thin-bedded muddylimestone, thin- to medium-bedded lime mudstone, and thick-beddedlime mudstone. No fossils have been found in the lower FeixianguanFormation based on field and thin-section observations (Fig. 2).
For ease of reference, we have defined four stratigraphic intervals inthe Dalong and lower Feixianguan formations based on lithologic andgeochemical characteristics of the study section (Fig. 2; see Section 4).Interval I, at 0 to 8.7m, is characterized by black thin-bedded radiolariancherts showing little chemostratigraphic variation, representing arelatively stable deepwater environment. Interval II, at 8.7 to 12.5 m,is characterized by an upward gradation from fossil-poor mudstonewith limestone interbeds in the lower part to fossil-rich siliceous lime-stones in the upper part, and by incipient shifts in the profiles ofδ34Spy, δ13Corg, and biogenic SiO2. Interval III, at 12.5 to 14.5m, is charac-terized by thin- to medium-bedded nodular limestone, low TOC, andlarge fluctuations in the profiles of δ34Spy, δ13Corg, and biogenic SiO2.This unit may represent an unstable shallow-water environment.Interval IV, at 14.5 to 16.2 m (spanning the LPME horizon and P–Trboundary), is characterized by mixed shale-limestone deposition andloss of most benthic faunal components.
2.3. Chaotian P–Tr boundary section
We compare our results for Xiaojiaba to those for the previouslystudied Chaotian section, which is located only 4.5 km southwest ofXiaojiaba (Fig. 1a). Chaotian also represents a deep-shelf environment(Ji et al., 2007; Saitoh et al., 2013; Fig. 1b), although water depthswere probably slightly less than for Xiaojiaba. As at Xiaojiaba, frequentash layers in this section provide evidence of significant volcanic activitywell before the LPME. Planktic, nektic, and benthic organisms disap-peared at the top of the Dalong Formation (correlative with theLPME), recording the effects of strong environmental stresses (Isozakiet al., 2007). The conodont and ammonoid biostratigraphy of theChanghsingian stage is well constrained at Chaotian (Isozaki et al.,2007; Ji et al., 2007).
2.4. Correlations and biostratigraphic framework
Although the Xiaojiaba section has not received any biostratigraphicstudy to date, its proximity to the Chaotian section permits detailedlithostratigraphic correlations and, thus, transfer of biostratigraphic
information (Fig. 3). These two sections show similar lithologic changesin vertical profile, displaying an abrupt transition from shallow-water limestone in the upper Wuchiaping Formation to deep-water mudstone, or chert in the basal Dalong Formation and anabrupt transition from limestone in the upper Dalong Formation tothe dark-gray calcareous shale in the lower Feixianguan Formation(Fig. 3).
Earlier biostratigraphic studies have defined ammonoid andconodont zones in the Chaotian section (Isozaki et al., 2007; Ji et al.,2007), in which the stratigraphic positions of the Wuchiapingian–Changhsingian (W–C) and P–Tr boundaries are well-constrained. TheW–C boundary is marked by the appearance of the ammonoids ofPseudostephanites and Tapashanites (Isozaki et al., 2007). The correlativelevel at Xiaojiaba is at ~2.8 m in Interval I (Fig. 3). The stratigraphicintervals corresponding to the Changhsingian conodont zones Clarkinayini, C. changxingensis, C. subcarinata, and C. orientalis are thus readilyestimated for the Chaotian section (Fig. 3). The P–Tr boundary,which is characterized by the first appearance of Hindeodus parvus(Yin et al., 2001), is located in the ~1-m-thick shale at the base of theFeixianguan Formation at both Chaotian and Xiaojiaba (Isozaki et al.,2007) (Fig. 3).
3. Methods
Fifty-six samples were collected in the Xiaojiaba section at an aver-age stratigraphic spacing of ~0.3 m. Care was exercised to collect freshsamples without veins, roots, or strongly weathered surfaces. Sampleswere powdered in an agate ball mill.
Twenty-six thin sections were selected and cut for petrographicanalysis, which included examination of sediment fabric, bioturbationintensity, and fossil distribution. Pyritewas extractedusing the chromiumreductionmethodof Canfield et al. (1986). For eachpowdered sample, a 2to 8-g split was treated with 1 M CrCl2 solution and 6 N HCl + 10 mlalcohol. The evolved hydrogen sulfide was immediately purged byN2 flow to a trap containing a zinc acetate solution, to which 2%AgNO3 + 6 N NH4OH were added to precipitate Ag2S. The Ag2S precip-itate was then filtered, rinsed, dried, and weighed. The reproducibilityof replicate analyses was generally better than 1%. Pyrite sulfur (Spy)is calculated by stoichiometry from the extracted Ag2S. The dried Ag2Swas mixed with V2O5 and pure quartz sand and then converted to SO2
by combustion with copper turnings at 1050 °C. The sulfur isotopiccomposition of the purified SO2 was analyzed using a Finnigan Delta-Smass spectrometer at the Institute of Geology and Geophysics, ChineseAcademy of Sciences in Beijing. Sulfur isotopic ratios are expressedusing standard δ-notation relative to the Cañon Diablo Troilite (CDT)standard. Analytical precision is better than ±0.2‰.
Sample splits (0.3 to 5 g) for bulk δ13Corg analysis were treated with6 N HCl for 24 h to remove carbonate. The solution was then retreatedwith excess 6 N HCl and allowed to sit for 6 h to make sure that allcarbonate was dissolved. About 30–100 mg of decalcified sample and1 g of CuO wire were placed in a quartz tube and combusted at 500 °Cfor 1 h and at 850 °C for 3 h. The carbon isotope ratio of the generatedCO2 was measured in a Finnigan MAT-252 mass spectrometer at theInstitute of Geology and Geophysics, Chinese Academy of Sciences inBeijing. The carbon isotopic ratio is reported in standard δ notationrelative to the Vienna Peedee Belemnite (VPDB) standard. Analyticalprecision is better than ±0.1‰.
Sample splits (200mg) for total organic carbon (TOC) analysis werefirstly treated with 10% HCl at 60 °C to remove carbonate, and thenwashed with distilled water to remove HCl. Afterwards, the sampleswere dried overnight at 50 °C and then measured using a LECOCS-400 analyzer in the Research Institute of Petroleum Explorationand Development in Beijing. The standard deviation of TOC measure-ments is lower than ±0.10%.
Sample splits (0.5 g) for major-element analysis were fused to glasspellets and analyzed using a Phillips PW 1500 X-ray fluorescence

Fig. 2. Lithologic log and fossil distributions at Xiaojiaba. Volcanic tuffs (star symbols) are found mostly just below the P–Tr boundary, between 11 and 16 m (i.e., the interval shown inphoto at upper right). The spindle diagrams represent fossil abundance (not species diversity); the horizontal scales show relative variationwithin each biotic group but are not equivalentbetween groups. Intervals I–IV are discussed in the text.
81H. Wei et al. / Sedimentary Geology 319 (2015) 78–97
spectrometer at the Institute of Geology and Geophysics, ChineseAcademy of Sciences in Beijing. The precision of the major-elementconcentration data is better than ±3% of reported values.
Trace elements and rare earth elements (REEs) were measuredby inductively coupled plasma mass spectrometry (ICP-MS) with aFinnigan MAT Element II mass spectrometer at the Institute of Geology
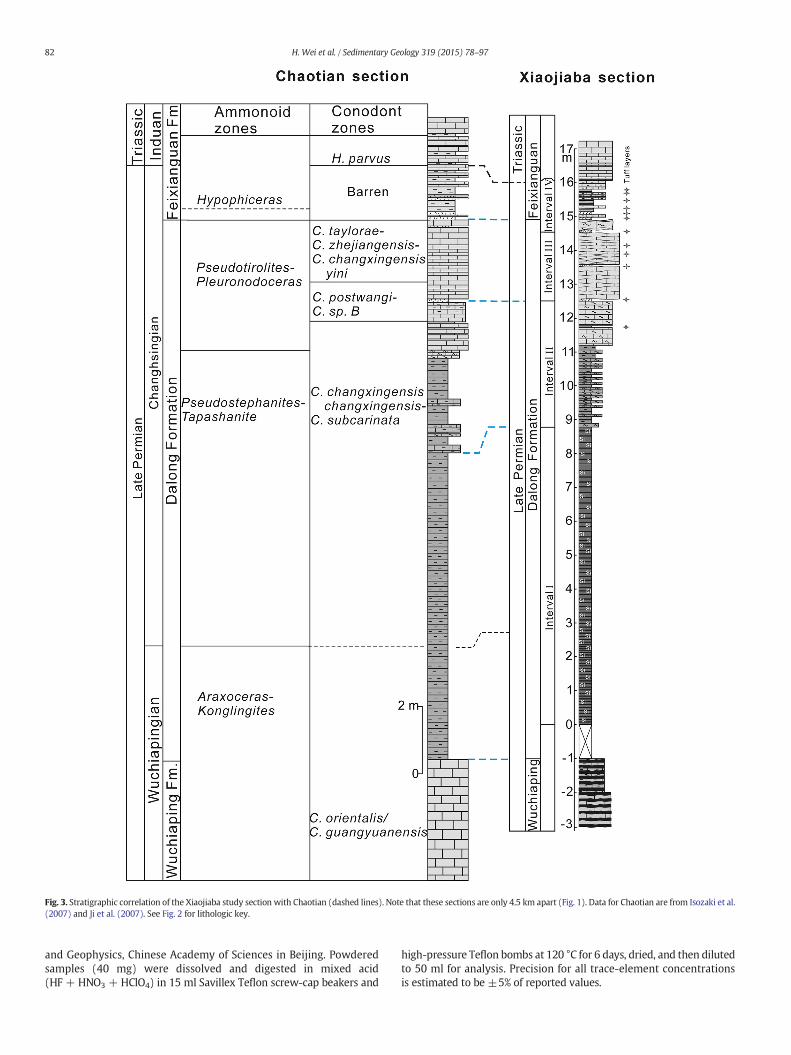
Fig. 3. Stratigraphic correlation of the Xiaojiaba study section with Chaotian (dashed lines). Note that these sections are only 4.5 km apart (Fig. 1). Data for Chaotian are from Isozaki et al.(2007) and Ji et al. (2007). See Fig. 2 for lithologic key.
82 H. Wei et al. / Sedimentary Geology 319 (2015) 78–97
and Geophysics, Chinese Academy of Sciences in Beijing. Powderedsamples (40 mg) were dissolved and digested in mixed acid(HF + HNO3 + HClO4) in 15 ml Savillex Teflon screw-cap beakers and
high-pressure Teflon bombs at 120 °C for 6 days, dried, and then dilutedto 50 ml for analysis. Precision for all trace-element concentrationsis estimated to be ±5% of reported values.

83H. Wei et al. / Sedimentary Geology 319 (2015) 78–97
The authigenic fraction (Xauth) of the elements Mo and U (cf.,Tribovillard et al., 2006) was calculated as:
Xauth ¼ X½ �– Al½ � � X=Al½ �detrital ð1Þ
where the detrital X/Al ratio was based on average upper crustalconcentrations of Mo (1.5 ppm), U (2.8 ppm), and Al (8.04%)(McLennan, 2001).
Biogenic chert (SiO2(bio)) was calculated as:
SiO2 bioð Þ ¼ SiO2 totalð Þ– m� K2O� 2:36ð Þ– Al2O3–m� K2Oð Þ � 1:18ð Þ ð2Þ
where m is the slope of the Al2O3–K2O regression, and the coefficientsrepresent the weight ratios of SiO2/Al2O3 (2.36) and 2 × SiO2/Al2O3
(1.18). These weight ratios pertain to clay minerals of stoichiometriccomposition having TOTO and TOT structures (i.e., illite and chlorite),respectively (cf., Algeo et al., 2007). Eq. (2) subtracts the amount ofSiO2 present in TOTO clay minerals (based on total K2O concentration)and in TOT clay minerals (based on excess Al2O3 not resident in TOTOclay minerals) from total SiO2. It assumes that non-clay SiO2 wasderived from biosilica sources as opposed to detrital quartz grains.
Excess barium (Baxs) was calculated as:
Baxs ¼ Ba–Al� 50 ð3Þ
where the constant 50 represents the estimated Ba/Al ratio of thedetrital fraction (units in ppm/% or 10-4) (Fig. 4). This estimate isbased on a regression of Ba versus Al for the Xiaojiaba study section.
In contrast to most REEs, which have a fixed 3+ valence, europium(Eu) can switch between valences of 2+ and 3+ (Elderfield andGreaves, 1982). It is therefore sensitive to environmental redoxconditions and can become fractionated from other REEs. Deviationsof europium relative to its neighbors (the Eu anomaly, or Eu/Eu*)were quantified as:
Eu=Eu� ¼ 3� Eu= 2� Smþ Gdð Þ: ð4Þ
All REE concentrations were normalized to Post-Archean AverageShale (PAAS) (Taylor and McLennan, 1985; McLennan, 2001).
For measurement of pyrite framboid sizes, 25 samples from thelimestone of upper Dalong Formation and lower Feixianguan Formationaround the P–Tr boundary were selected for preparation as thinsections. Pyrite framboid diameters were measured using a FEI NovaNanoSEM 450 scanning electron microscope (SEM) equipped withsecondary electron energy dispersive X-ray (EDX) analysis located atthe East China Institute of Technology in Nanchang, China. Only normalpyrite framboids and infilled framboids were measured, with at least100 size measurements per sample. Because the polished surface of
Fig. 4. Ba versus Al for Xiaojiaba. The line represents the inferred detrital Ba/Al ratio of 50.The sample points above this line contain excess Ba of possible biogenic origin.
the thin section represents a random cut through an ensemble ofspheres of non-uniform sizes, the measured size distributions are onlyan approximation of actual framboid sizes (Wilkin et al., 1996) althoughprobably within ~10% of actual size (Cashman and Ferry, 1988).
4. Results
4.1. TOC, SiO2(bio), and Baxs
TOC content at Xiaojiaba ranges from 0.02% to 2.44%, with anaverage of 0.52% (Table 1). A relatively steady decline to nearly zero isobserved upsection from Interval I to Interval IV (Fig. 5).
Biogenic silica (SiO2(bio)) content ranges from 2.8% to 89.1%, with anaverage of 46.2% (Table 1, Fig. 5). SiO2(bio) is nearly uniform (75–85%) inInterval I, before declining in Interval II to lower values (20–25%) inInterval III. The upper part of Interval III and Interval IV show a modestrebound in SiO2(bio) to 40–50%. Biogenic silica shows a strong exponen-tial relationship to TOC (r2 = 0.54), suggesting a common controlrelated to primary productivity in the study area (Fig. 6a).
Excess barium (Baxs) content ranges from 0 to 739 ppm, with anaverage of 192 ppm (Table 2). Baxs peaks at N600 ppm in the lowerpart of Interval I and then declines somewhat irregularly upsection,reaching near-zero values in the upper part of Interval II and in IntervalsIII and IV (Fig. 5). Baxs shows a modest correlation with SiO2(bio) (r2 =0.30), suggesting a common control related to primary productivity inthe study area (Fig. 6b).
4.2. Spy and δ34Spy
Pyrite sulfur (Spy) content ranges from 0.03% to 1.07%, with anaverage of 0.31% (Table 1, Fig. 7). Spy profile shows a general declineupsection interrupted by several peaks that coincide with thicker tufflayers. Dark muddy cherts in the lower part of the Dalong Formationcontain higher Spy content, whereas gray limestones in the upper partof the Dalong Formation contain much lower Spy content.
δ34Spy ranges from−43.4‰ to +5.0‰, with an average of−26.4‰(Table 1). Intervals I and II exhibit relatively light values (−40‰ to−25‰), although with a trend toward heavier values in the upperpart of Interval II (Fig. 7). Intervals III and IV are characterized bymuch heavier δ34Spy, from−20‰ to +10‰, with occasional extremelynegative values from −43.4‰ to−28.7‰ (Fig. 7).
Spy shows a strong correlation with δ34Spy (r2 = 0.71; Fig. 8a). Thisrelationship follows an exponential pattern, with a rapid shift towardheavier δ34Spy as Spy approaches 0%, and a slow shift toward lighterδ34Spy as Spy increases above 0.2%. The δ34Spy values of the low- andhigh-Spy endmembers are approximately+5‰ and−40‰, respectively.These results are very similar to those for the P–Tr boundary section atNhi Tao, Vietnam, which yielded δ34Spy values of +10‰ and −45‰for low- and high-Spy endmembers, respectively (Algeo et al., 2008;Fig. 8b).
4.3. Moauth,, Uauth, Corg/P ratio, Fe2O3/Al2O3, REE, Hf, Nb and δ13Corg
Authigenic molybdenum (Moauth) content ranges from 0 to80.7 ppm, with an average of 13.1 ppm (Fig. 7). However, most Moauthvalues are lower than 30 ppm, with only a few samples exhibitingpronounced enrichment. The highest values are found in Interval I,and the Moauth profile exhibits an irregular decline upsection throughIntervals II to IV. Authigenic uranium (Uauth) content ranges from 0 to15.9 ppm, with an average of 5.5 ppm (Fig. 9). Uauth values fluctuatebetween 5 and 15 ppm through Intervals I and II, before declining tovalues uniformly b5 ppm in Intervals III and IV. Total Mo and U concen-trations are only marginally greater than Moauth and Uauth (Table 2),indicating that the detrital fraction of these trace elements is minor.
Phosphorus (P) content ranges from 0.02 to 0.78%, with an averageof 0.13% (Table 1). The molar Corg/P ratio ranges from b1 to 253, with
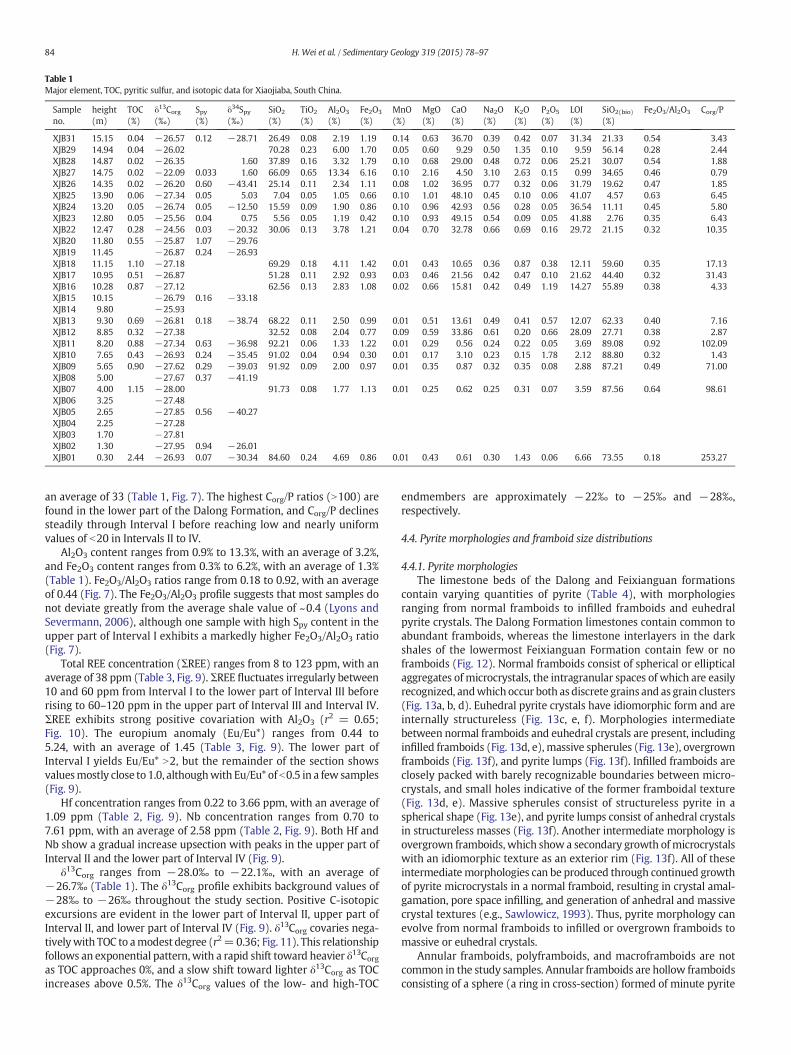
Table 1Major element, TOC, pyritic sulfur, and isotopic data for Xiaojiaba, South China.
Sampleno.
height(m)
TOC(%)
δ13Corg
(‰)Spy(%)
δ34Spy(‰)
SiO2
(%)TiO2
(%)Al2O3
(%)Fe2O3
(%)MnO(%)
MgO(%)
CaO(%)
Na2O(%)
K2O(%)
P2O5
(%)LOI(%)
SiO2(bio)
(%)Fe2O3/Al2O3 Corg/P
XJB31 15.15 0.04 −26.57 0.12 −28.71 26.49 0.08 2.19 1.19 0.14 0.63 36.70 0.39 0.42 0.07 31.34 21.33 0.54 3.43XJB29 14.94 0.04 −26.02 70.28 0.23 6.00 1.70 0.05 0.60 9.29 0.50 1.35 0.10 9.59 56.14 0.28 2.44XJB28 14.87 0.02 −26.35 1.60 37.89 0.16 3.32 1.79 0.10 0.68 29.00 0.48 0.72 0.06 25.21 30.07 0.54 1.88XJB27 14.75 0.02 −22.09 0.033 1.60 66.09 0.65 13.34 6.16 0.10 2.16 4.50 3.10 2.63 0.15 0.99 34.65 0.46 0.79XJB26 14.35 0.02 −26.20 0.60 −43.41 25.14 0.11 2.34 1.11 0.08 1.02 36.95 0.77 0.32 0.06 31.79 19.62 0.47 1.85XJB25 13.90 0.06 −27.34 0.05 5.03 7.04 0.05 1.05 0.66 0.10 1.01 48.10 0.45 0.10 0.06 41.07 4.57 0.63 6.45XJB24 13.20 0.05 −26.74 0.05 −12.50 15.59 0.09 1.90 0.86 0.10 0.96 42.93 0.56 0.28 0.05 36.54 11.11 0.45 5.80XJB23 12.80 0.05 −25.56 0.04 0.75 5.56 0.05 1.19 0.42 0.10 0.93 49.15 0.54 0.09 0.05 41.88 2.76 0.35 6.43XJB22 12.47 0.28 −24.56 0.03 −20.32 30.06 0.13 3.78 1.21 0.04 0.70 32.78 0.66 0.69 0.16 29.72 21.15 0.32 10.35XJB20 11.80 0.55 −25.87 1.07 −29.76XJB19 11.45 −26.87 0.24 −26.93XJB18 11.15 1.10 −27.18 69.29 0.18 4.11 1.42 0.01 0.43 10.65 0.36 0.87 0.38 12.11 59.60 0.35 17.13XJB17 10.95 0.51 −26.87 51.28 0.11 2.92 0.93 0.03 0.46 21.56 0.42 0.47 0.10 21.62 44.40 0.32 31.43XJB16 10.28 0.87 −27.12 62.56 0.13 2.83 1.08 0.02 0.66 15.81 0.42 0.49 1.19 14.27 55.89 0.38 4.33XJB15 10.15 −26.79 0.16 −33.18XJB14 9.80 −25.93XJB13 9.30 0.69 −26.81 0.18 −38.74 68.22 0.11 2.50 0.99 0.01 0.51 13.61 0.49 0.41 0.57 12.07 62.33 0.40 7.16XJB12 8.85 0.32 −27.38 32.52 0.08 2.04 0.77 0.09 0.59 33.86 0.61 0.20 0.66 28.09 27.71 0.38 2.87XJB11 8.20 0.88 −27.34 0.63 −36.98 92.21 0.06 1.33 1.22 0.01 0.29 0.56 0.24 0.22 0.05 3.69 89.08 0.92 102.09XJB10 7.65 0.43 −26.93 0.24 −35.45 91.02 0.04 0.94 0.30 0.01 0.17 3.10 0.23 0.15 1.78 2.12 88.80 0.32 1.43XJB09 5.65 0.90 −27.62 0.29 −39.03 91.92 0.09 2.00 0.97 0.01 0.35 0.87 0.32 0.35 0.08 2.88 87.21 0.49 71.00XJB08 5.00 −27.67 0.37 −41.19XJB07 4.00 1.15 −28.00 91.73 0.08 1.77 1.13 0.01 0.25 0.62 0.25 0.31 0.07 3.59 87.56 0.64 98.61XJB06 3.25 −27.48XJB05 2.65 −27.85 0.56 −40.27XJB04 2.25 −27.28XJB03 1.70 −27.81XJB02 1.30 −27.95 0.94 −26.01XJB01 0.30 2.44 −26.93 0.07 −30.34 84.60 0.24 4.69 0.86 0.01 0.43 0.61 0.30 1.43 0.06 6.66 73.55 0.18 253.27
84 H. Wei et al. / Sedimentary Geology 319 (2015) 78–97
an average of 33 (Table 1, Fig. 7). The highest Corg/P ratios (N100) arefound in the lower part of the Dalong Formation, and Corg/P declinessteadily through Interval I before reaching low and nearly uniformvalues of b20 in Intervals II to IV.
Al2O3 content ranges from 0.9% to 13.3%, with an average of 3.2%,and Fe2O3 content ranges from 0.3% to 6.2%, with an average of 1.3%(Table 1). Fe2O3/Al2O3 ratios range from 0.18 to 0.92, with an averageof 0.44 (Fig. 7). The Fe2O3/Al2O3 profile suggests that most samples donot deviate greatly from the average shale value of ~0.4 (Lyons andSevermann, 2006), although one sample with high Spy content in theupper part of Interval I exhibits a markedly higher Fe2O3/Al2O3 ratio(Fig. 7).
Total REE concentration (ΣREE) ranges from 8 to 123 ppm, with anaverage of 38 ppm (Table 3, Fig. 9). ΣREE fluctuates irregularly between10 and 60 ppm from Interval I to the lower part of Interval III beforerising to 60–120 ppm in the upper part of Interval III and Interval IV.ΣREE exhibits strong positive covariation with Al2O3 (r2 = 0.65;Fig. 10). The europium anomaly (Eu/Eu*) ranges from 0.44 to5.24, with an average of 1.45 (Table 3, Fig. 9). The lower part ofInterval I yields Eu/Eu* N2, but the remainder of the section showsvaluesmostly close to 1.0, althoughwith Eu/Eu* of b0.5 in a few samples(Fig. 9).
Hf concentration ranges from 0.22 to 3.66 ppm, with an average of1.09 ppm (Table 2, Fig. 9). Nb concentration ranges from 0.70 to7.61 ppm, with an average of 2.58 ppm (Table 2, Fig. 9). Both Hf andNb show a gradual increase upsection with peaks in the upper part ofInterval II and the lower part of Interval IV (Fig. 9).
δ13Corg ranges from −28.0‰ to −22.1‰, with an average of−26.7‰ (Table 1). The δ13Corg profile exhibits background values of−28‰ to −26‰ throughout the study section. Positive C-isotopicexcursions are evident in the lower part of Interval II, upper part ofInterval II, and lower part of Interval IV (Fig. 9). δ13Corg covaries nega-tivelywith TOC to amodest degree (r2=0.36; Fig. 11). This relationshipfollows an exponential pattern,with a rapid shift toward heavier δ13Corgas TOC approaches 0%, and a slow shift toward lighter δ13Corg as TOCincreases above 0.5%. The δ13Corg values of the low- and high-TOC
endmembers are approximately −22‰ to −25‰ and −28‰,respectively.
4.4. Pyrite morphologies and framboid size distributions
4.4.1. Pyrite morphologiesThe limestone beds of the Dalong and Feixianguan formations
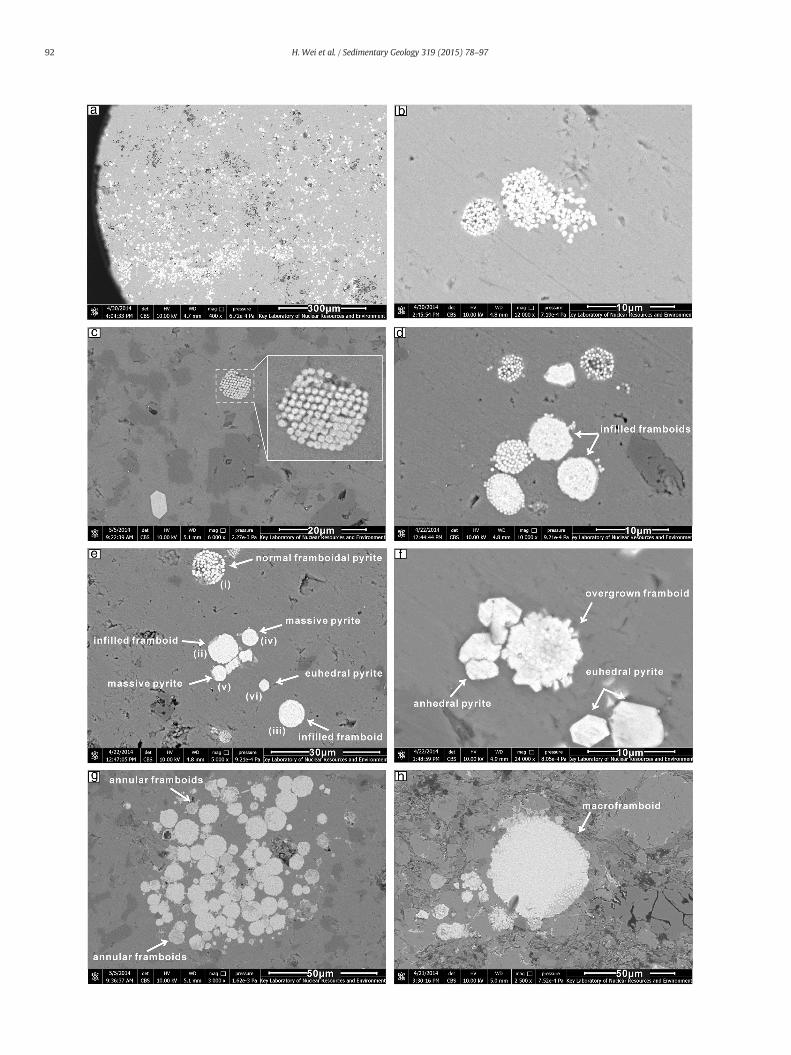
contain varying quantities of pyrite (Table 4), with morphologiesranging from normal framboids to infilled framboids and euhedralpyrite crystals. The Dalong Formation limestones contain common toabundant framboids, whereas the limestone interlayers in the darkshales of the lowermost Feixianguan Formation contain few or noframboids (Fig. 12). Normal framboids consist of spherical or ellipticalaggregates of microcrystals, the intragranular spaces of which are easilyrecognized, andwhich occur both as discrete grains and as grain clusters(Fig. 13a, b, d). Euhedral pyrite crystals have idiomorphic form and areinternally structureless (Fig. 13c, e, f). Morphologies intermediatebetween normal framboids and euhedral crystals are present, includinginfilled framboids (Fig. 13d, e), massive spherules (Fig. 13e), overgrownframboids (Fig. 13f), and pyrite lumps (Fig. 13f). Infilled framboids areclosely packed with barely recognizable boundaries between micro-crystals, and small holes indicative of the former framboidal texture(Fig. 13d, e). Massive spherules consist of structureless pyrite in aspherical shape (Fig. 13e), and pyrite lumps consist of anhedral crystalsin structureless masses (Fig. 13f). Another intermediate morphology isovergrown framboids, which show a secondary growth ofmicrocrystalswith an idiomorphic texture as an exterior rim (Fig. 13f). All of theseintermediatemorphologies can be produced through continued growthof pyrite microcrystals in a normal framboid, resulting in crystal amal-gamation, pore space infilling, and generation of anhedral and massivecrystal textures (e.g., Sawlowicz, 1993). Thus, pyrite morphology canevolve from normal framboids to infilled or overgrown framboids tomassive or euhedral crystals.
Annular framboids, polyframboids, and macroframboids are notcommon in the study samples. Annular framboids are hollow framboidsconsisting of a sphere (a ring in cross-section) formed of minute pyrite

Fig. 5. Chemostratigraphic profiles of TOC, SiO2(bio), and Baxs for Xiaojiaba.
85H. Wei et al. / Sedimentary Geology 319 (2015) 78–97
grains (Sawlowicz, 1993; Fig. 13g). The annular form of framboids canbe a first step in the growth of a normal framboid (Kizilshtein andMinaeva, 1972). Their occurrence in the Xiaojiaba section may indicatelow availability of dissolved iron or sulfide (e.g., Papunen, 1966; Love,
1967; Kosacz and Sawlowicz, 1983). Polyframboids consist of multiple,conjoined framboids of different sizes (Fig. 13g). Development ofpolyframboids occurs through similar processes as normal framboids,although the size of polyframboids (up to 90 μm in diameter) reflects
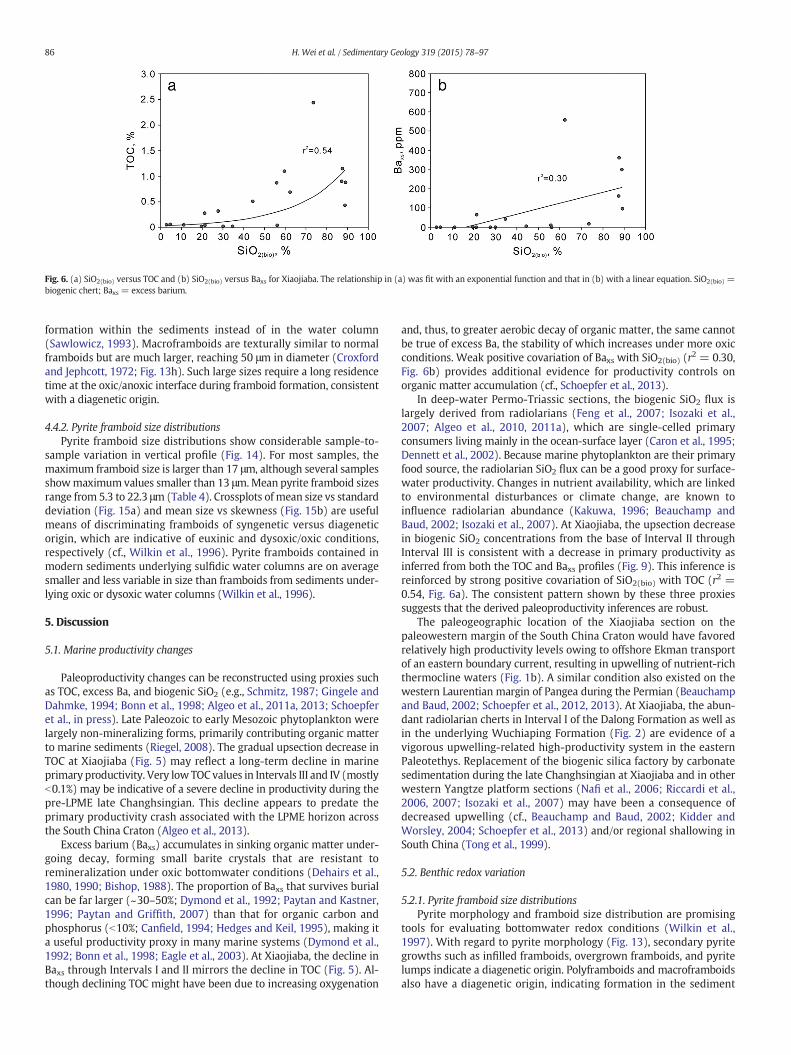
Fig. 6. (a) SiO2(bio) versus TOC and (b) SiO2(bio) versus Baxs for Xiaojiaba. The relationship in (a) was fit with an exponential function and that in (b) with a linear equation. SiO2(bio) =biogenic chert; Baxs = excess barium.
86 H. Wei et al. / Sedimentary Geology 319 (2015) 78–97
formation within the sediments instead of in the water column(Sawlowicz, 1993). Macroframboids are texturally similar to normalframboids but are much larger, reaching 50 μm in diameter (Croxfordand Jephcott, 1972; Fig. 13h). Such large sizes require a long residencetime at the oxic/anoxic interface during framboid formation, consistentwith a diagenetic origin.
4.4.2. Pyrite framboid size distributionsPyrite framboid size distributions show considerable sample-to-
sample variation in vertical profile (Fig. 14). For most samples, themaximum framboid size is larger than 17 μm, although several samplesshowmaximum values smaller than 13 μm.Mean pyrite framboid sizesrange from 5.3 to 22.3 μm (Table 4). Crossplots of mean size vs standarddeviation (Fig. 15a) and mean size vs skewness (Fig. 15b) are usefulmeans of discriminating framboids of syngenetic versus diageneticorigin, which are indicative of euxinic and dysoxic/oxic conditions,respectively (cf., Wilkin et al., 1996). Pyrite framboids contained inmodern sediments underlying sulfidic water columns are on averagesmaller and less variable in size than framboids from sediments under-lying oxic or dysoxic water columns (Wilkin et al., 1996).
5. Discussion
5.1. Marine productivity changes
Paleoproductivity changes can be reconstructed using proxies suchas TOC, excess Ba, and biogenic SiO2 (e.g., Schmitz, 1987; Gingele andDahmke, 1994; Bonn et al., 1998; Algeo et al., 2011a, 2013; Schoepferet al., in press). Late Paleozoic to early Mesozoic phytoplankton werelargely non-mineralizing forms, primarily contributing organic matterto marine sediments (Riegel, 2008). The gradual upsection decrease inTOC at Xiaojiaba (Fig. 5) may reflect a long-term decline in marineprimary productivity. Very low TOC values in Intervals III and IV (mostlyb0.1%) may be indicative of a severe decline in productivity during thepre-LPME late Changhsingian. This decline appears to predate theprimary productivity crash associated with the LPME horizon acrossthe South China Craton (Algeo et al., 2013).
Excess barium (Baxs) accumulates in sinking organic matter under-going decay, forming small barite crystals that are resistant toremineralization under oxic bottomwater conditions (Dehairs et al.,1980, 1990; Bishop, 1988). The proportion of Baxs that survives burialcan be far larger (~30–50%; Dymond et al., 1992; Paytan and Kastner,1996; Paytan and Griffith, 2007) than that for organic carbon andphosphorus (b10%; Canfield, 1994; Hedges and Keil, 1995), making ita useful productivity proxy in many marine systems (Dymond et al.,1992; Bonn et al., 1998; Eagle et al., 2003). At Xiaojiaba, the decline inBaxs through Intervals I and II mirrors the decline in TOC (Fig. 5). Al-though declining TOC might have been due to increasing oxygenation
and, thus, to greater aerobic decay of organic matter, the same cannotbe true of excess Ba, the stability of which increases under more oxicconditions. Weak positive covariation of Baxs with SiO2(bio) (r2 = 0.30,Fig. 6b) provides additional evidence for productivity controls onorganic matter accumulation (cf., Schoepfer et al., 2013).
In deep-water Permo-Triassic sections, the biogenic SiO2 flux islargely derived from radiolarians (Feng et al., 2007; Isozaki et al.,2007; Algeo et al., 2010, 2011a), which are single-celled primaryconsumers living mainly in the ocean-surface layer (Caron et al., 1995;Dennett et al., 2002). Because marine phytoplankton are their primaryfood source, the radiolarian SiO2 flux can be a good proxy for surface-water productivity. Changes in nutrient availability, which are linkedto environmental disturbances or climate change, are known toinfluence radiolarian abundance (Kakuwa, 1996; Beauchamp andBaud, 2002; Isozaki et al., 2007). At Xiaojiaba, the upsection decreasein biogenic SiO2 concentrations from the base of Interval II throughInterval III is consistent with a decrease in primary productivity asinferred from both the TOC and Baxs profiles (Fig. 9). This inference isreinforced by strong positive covariation of SiO2(bio) with TOC (r2 =0.54, Fig. 6a). The consistent pattern shown by these three proxiessuggests that the derived paleoproductivity inferences are robust.
The paleogeographic location of the Xiaojiaba section on thepaleowestern margin of the South China Craton would have favoredrelatively high productivity levels owing to offshore Ekman transportof an eastern boundary current, resulting in upwelling of nutrient-richthermocline waters (Fig. 1b). A similar condition also existed on thewestern Laurentian margin of Pangea during the Permian (Beauchampand Baud, 2002; Schoepfer et al., 2012, 2013). At Xiaojiaba, the abun-dant radiolarian cherts in Interval I of the Dalong Formation as well asin the underlying Wuchiaping Formation (Fig. 2) are evidence of avigorous upwelling-related high-productivity system in the easternPaleotethys. Replacement of the biogenic silica factory by carbonatesedimentation during the late Changhsingian at Xiaojiaba and in otherwestern Yangtze platform sections (Nafi et al., 2006; Riccardi et al.,2006, 2007; Isozaki et al., 2007) may have been a consequence ofdecreased upwelling (cf., Beauchamp and Baud, 2002; Kidder andWorsley, 2004; Schoepfer et al., 2013) and/or regional shallowing inSouth China (Tong et al., 1999).
5.2. Benthic redox variation
5.2.1. Pyrite framboid size distributionsPyrite morphology and framboid size distribution are promising
tools for evaluating bottomwater redox conditions (Wilkin et al.,1997). With regard to pyrite morphology (Fig. 13), secondary pyritegrowths such as infilled framboids, overgrown framboids, and pyritelumps indicate a diagenetic origin. Polyframboids and macroframboidsalso have a diagenetic origin, indicating formation in the sediment

Table 2Trace element data for Xiaojiaba, South China.
Sample no. Li(ppm)
Sc(ppm)
V(ppm)
Cr(ppm)
Co(ppm)
Ni(ppm)
Cu(ppm)
Zn(ppm)
Rb(ppm)
Sr(ppm)
Mo(ppm)
Cd(ppm)
Ba(ppm)
Pb(ppm)
Th(ppm)
U(ppm)
Zr(ppm)
Hf(ppm)
Nb(ppm)
Moauth(ppm)
Uauth
(ppm)Baxs(ppm)
XJB31 11.4 2.3 21 12 2.12 16.5 16 24 18.8 775 0.06 0.52 122 6.31 1.67 3.45 39 0.86 3.1 0 3.02 64XJB29 35.2 5.02 42 27 5.11 41 47 62 61.5 203 0.66 0.85 146 9.68 5.61 3.26 128 2.81 7.61 0 2.07 0XJB28 23.9 3.09 38 26 5.53 30.1 25 48 31.8 335 2.27 0.41 81 6.33 2.46 2.09 50 1.28 3.29 1.83 1.43 0XJB27 17.1 18.2 144 28 15.3 6.3 18 52 100 192 0.47 0.15 396 11.8 13.2 1.79 106 3.66 6.53 0 0 43XJB26 6.11 2.22 20 14 3.58 17.1 27 20 11.4 632 2.15 0.16 37 6.04 1.58 3.7 36 0.85 2.79 1.84 3.24 0XJB25 2.7 0.89 16 8 2.12 16.3 7 13 2.2 883 0.18 0.14 20 2.55 0.7 4.97 10 0.24 0.704 0.04 4.76 0XJB24 5.51 2.21 22 13 4.18 23.1 17 24 9.8 450 0.73 0.44 31 2.6 1.34 3.08 20 0.48 1.55 0.48 2.7 0XJB23 3.69 0.91 21 11 2.87 20.3 10 15 2 534 0.41 0.17 16 1.53 0.55 3.18 11 0.22 0.723 0.25 2.94 0XJB22 16.1 2.94 75 27 11.3 29.7 101 49 29.3 1720 1.41 0.69 74 7.01 2.31 8.42 62 1.62 3.96 0.91 7.67 0XJB18 33.2 3.91 265 53 13.5 63.8 138 68 35.7 1041 9.42 17.2 109 9.44 3.2 14.1 73 1.71 3.88 8.88 13.28 0XJB17 19.2 3.11 85 33 5.43 63 73 81 19.6 572 3.09 10.5 81 8.39 2.23 6.09 56 1.38 3.76 2.7 5.51 4XJB16 21.6 2.87 115 49 4.78 52.6 82 129 19.7 746 4.98 6.05 85 8.03 2 16.5 52 1 2.48 4.61 15.94 10XJB13 33.1 2.75 85 46 5.04 41.7 51 47 16 663 6.38 2.87 626 7.36 1.81 8.11 40 0.91 2.26 6.05 7.61 560XJB12 9.52 1.76 47 22 2.9 48.2 38 41 6.1 727 2.81 6.58 40 5.12 1.32 8.31 35 0.74 2.22 2.54 7.91 0XJB11 16.1 1.05 365 40 5.09 53.7 28 33 6.7 71 80.9 3.97 131 4.04 0.88 8.61 25 0.47 1.18 80.72 8.35 96XJB10 22.7 0.66 76 28 2.2 18.7 24 19 3.8 321 3.71 1.12 326 4.61 0.52 10.8 42 0.46 1.74 3.59 10.61 301XJB09 23.1 1.11 225 45 4.07 39.2 40 28 9.8 81 15.7 4.56 216 4.23 1.25 4.64 42 0.81 1.47 15.44 4.24 163XJB08 37.8 1.06 136 195 3.91 39.3 45 21 8.1 75 9.41 6.76 291 1.6 0.98 1.97 29 0.71 1.22 9.05 1.88 291XJB07 21.3 1.29 329 69 4.41 71.6 42 48 8.7 42 71.5 16.9 409 4.59 0.93 1.38 37 0.73 1.32 71.27 1.03 362XJB06 31.3 1.31 232 164 3.99 42.4 38 38 10.2 133 21.1 7.09 510 2.45 1.03 15.2 34 0.65 1.4 20.29 14.48 510XJB05 34.5 1.99 306 249 5.8 51.3 37 33 9.8 90 25.7 8.32 599 2.61 0.82 1.96 41 0.82 1.82 24.71 1.87 599XJB04 20.3 0.96 151 118 2.98 32.6 28 22 7.5 99 15.6 7.86 739 2.7 0.97 5.94 26 0.69 1.16 15 5.66 739XJB03 24.7 1.3 259 271 4.94 46.4 30 29 6.7 85 21.8 8.84 624 2.29 0.72 1.57 41 0.73 1.55 20.96 1.5 624XJB02 25.6 1.36 266 222 4.15 36.1 25 28 9.5 90 26.8 7.59 416 2.63 0.9 3.17 31 0.72 1.36 25.77 3.02 416XJB01 31.1 4.18 202 147 0.92 41.3 31 14 49.9 112 5.78 14.4 142 31.5 3.67 6.04 105 2.67 5.54 5.16 5.11 18
87H.W
eietal./Sedimentary
Geology
319(2015)
78–97

Fig. 7. Chemostratigraphic profiles of pyrite sulfur (Spy), δ34Spy, authigenic Mo (Moauth) and U (Uauth), Corg/P, and Fe2O3/Al2O3 for Xiaojiaba.
88 H. Wei et al. / Sedimentary Geology 319 (2015) 78–97
instead of in the water column. Such morphologies tend to form insediments overlain by dysoxic/oxic watermasses (e.g., Raiswell andBerner, 1985). With regard to framboid size distributions (Figs. 14,15), largermeandiameters (~ N 6 μm) andwider variation of framboidal
Fig. 8. δ34Spy versus Spy for (a) Xiaojiaba (this study) and (b) Nhi Tao, Vietnam (Algeo et al., 2008mixing ratios of syngenetic-to-authigenic pyrite, with endmember compositions of ~−45‰ fo
diameters (with maximum diameters ~ N 18 μm) suggest a diageneticorigin and dysoxic/oxic water-column conditions (Wilkin et al., 1996,1997;Wilkin andArthur, 2001;Wei et al., 2012b). Sampleswith smallermean diameters (~b6 μm), narrower size distributions (standard
). Both datasets were fit with 2nd-order polynomial equations; 1:1, 4:1, and 9:1 representr the syngenetic fraction and ~ +10‰ for the diagenetic fraction.
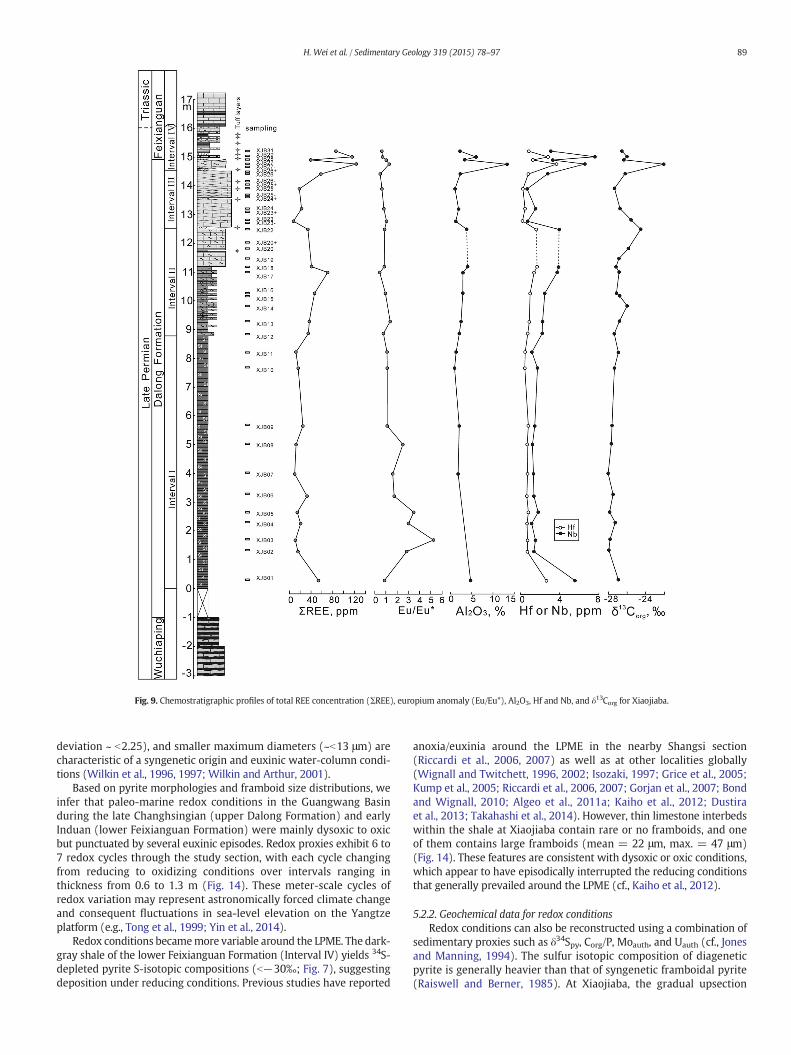
Fig. 9. Chemostratigraphic profiles of total REE concentration (ΣREE), europium anomaly (Eu/Eu*), Al2O3, Hf and Nb, and δ13Corg for Xiaojiaba.
89H. Wei et al. / Sedimentary Geology 319 (2015) 78–97
deviation ~ b2.25), and smaller maximum diameters (~b13 μm) arecharacteristic of a syngenetic origin and euxinic water-column condi-tions (Wilkin et al., 1996, 1997; Wilkin and Arthur, 2001).
Based on pyrite morphologies and framboid size distributions, weinfer that paleo-marine redox conditions in the Guangwang Basinduring the late Changhsingian (upper Dalong Formation) and earlyInduan (lower Feixianguan Formation) were mainly dysoxic to oxicbut punctuated by several euxinic episodes. Redox proxies exhibit 6 to7 redox cycles through the study section, with each cycle changingfrom reducing to oxidizing conditions over intervals ranging inthickness from 0.6 to 1.3 m (Fig. 14). These meter-scale cycles ofredox variation may represent astronomically forced climate changeand consequent fluctuations in sea-level elevation on the Yangtzeplatform (e.g., Tong et al., 1999; Yin et al., 2014).
Redox conditions becamemore variable around the LPME. The dark-gray shale of the lower Feixianguan Formation (Interval IV) yields 34S-depleted pyrite S-isotopic compositions (b−30‰; Fig. 7), suggestingdeposition under reducing conditions. Previous studies have reported
anoxia/euxinia around the LPME in the nearby Shangsi section(Riccardi et al., 2006, 2007) as well as at other localities globally(Wignall and Twitchett, 1996, 2002; Isozaki, 1997; Grice et al., 2005;Kump et al., 2005; Riccardi et al., 2006, 2007; Gorjan et al., 2007; Bondand Wignall, 2010; Algeo et al., 2011a; Kaiho et al., 2012; Dustiraet al., 2013; Takahashi et al., 2014). However, thin limestone interbedswithin the shale at Xiaojiaba contain rare or no framboids, and oneof them contains large framboids (mean = 22 μm, max. = 47 μm)(Fig. 14). These features are consistent with dysoxic or oxic conditions,which appear to have episodically interrupted the reducing conditionsthat generally prevailed around the LPME (cf., Kaiho et al., 2012).
5.2.2. Geochemical data for redox conditionsRedox conditions can also be reconstructed using a combination of
sedimentary proxies such as δ34Spy, Corg/P, Moauth, and Uauth (cf., Jonesand Manning, 1994). The sulfur isotopic composition of diageneticpyrite is generally heavier than that of syngenetic framboidal pyrite(Raiswell and Berner, 1985). At Xiaojiaba, the gradual upsection

Table 3REE data for Xiaojiaba, South China.
Sample La(ppm)
Ce(ppm)
Pr(ppm)
Nd(ppm)
Sm(ppm)
Eu(ppm)
Gd(ppm)
Tb(ppm)
Dy(ppm)
Ho(ppm)
Er(ppm)
Tm(ppm)
Yb(ppm)
Lu(ppm)
Y(ppm)
ΣREE(ppm)
Eu/Eu*
XJB31 18.50 26.50 3.25 12.80 2.95 0.46 3.76 0.82 5.35 1.23 4.05 0.74 4.61 0.78 43.10 85.79 0.63XJB29 22.20 41.20 4.97 19.70 4.29 0.67 4.72 0.99 5.77 1.18 3.90 0.70 4.59 0.77 37.60 115.65 0.69XJB28 8.90 16.10 1.66 6.18 1.13 0.24 1.07 0.19 1.20 0.25 0.85 0.13 0.91 0.14 10.60 38.95 1.02XJB27 25.20 48.00 5.43 20.70 4.28 1.14 4.04 0.81 4.86 1.00 3.20 0.53 3.46 0.55 30.00 123.20 1.29XJB26 12.40 22.00 2.27 8.55 1.74 0.21 2.17 0.43 2.79 0.61 1.97 0.34 2.26 0.38 20.60 58.11 0.49XJB25 4.49 6.83 0.68 2.66 0.57 0.09 0.78 0.17 0.92 0.18 0.55 0.07 0.48 0.08 8.26 18.54 0.63XJB24 4.88 9.50 0.98 3.63 0.73 0.13 0.72 0.14 0.74 0.13 0.43 0.07 0.45 0.07 5.10 22.60 0.81XJB23 1.66 3.23 0.35 1.27 0.25 0.05 0.20 0.04 0.24 0.05 0.18 0.02 0.17 0.04 1.88 7.74 1.04XJB22 7.26 13.50 1.43 5.61 1.06 0.20 1.11 0.19 1.23 0.28 0.99 0.18 1.15 0.22 12.10 34.41 0.87XJB18 8.41 16.80 1.84 6.97 1.30 0.24 1.32 0.25 1.44 0.29 0.96 0.14 0.91 0.15 9.76 41.02 0.84XJB17 13.00 26.50 3.07 11.90 2.74 0.26 2.79 0.57 3.54 0.68 2.14 0.36 2.49 0.40 19.20 70.44 0.44XJB16 10.50 17.90 1.92 7.34 1.40 0.30 1.57 0.31 1.94 0.41 1.27 0.18 1.28 0.21 15.80 46.53 0.94XJB13 7.90 13.60 1.56 6.17 1.27 0.39 1.38 0.27 1.57 0.32 0.97 0.14 0.98 0.15 11.10 36.67 1.37XJB12 7.26 11.80 1.41 5.49 1.18 0.21 1.36 0.30 1.91 0.40 1.32 0.22 1.42 0.23 15.80 34.50 0.76XJB11 2.61 4.30 0.56 2.17 0.45 0.12 0.55 0.09 0.51 0.11 0.35 0.06 0.38 0.05 3.74 12.31 1.08XJB10 3.10 4.11 0.57 2.48 0.67 0.18 0.82 0.17 1.13 0.27 1.05 0.18 1.33 0.22 12.90 16.27 1.11XJB09 5.75 9.90 1.11 4.18 0.83 0.19 0.81 0.14 0.84 0.15 0.49 0.07 0.43 0.07 5.17 24.97 1.10XJB08 2.54 4.96 0.62 2.24 0.55 0.23 0.33 0.05 0.35 0.07 0.19 0.04 0.30 0.04 2.15 12.49 2.50XJB07 2.41 1.82 0.60 2.53 0.54 0.17 0.47 0.09 0.49 0.11 0.38 0.06 0.40 0.08 4.25 10.15 1.60XJB06 6.96 8.77 1.27 5.87 1.51 0.63 1.89 0.34 2.18 0.46 1.35 0.20 1.17 0.18 19.80 32.79 1.73XJB05 3.17 5.03 0.67 2.34 0.62 0.45 0.61 0.08 0.50 0.11 0.32 0.07 0.43 0.10 3.72 14.50 3.46XJB04 4.48 6.19 0.93 3.77 0.86 0.58 0.94 0.17 0.97 0.22 0.57 0.09 0.67 0.11 7.03 20.53 3.00XJB03 2.45 3.73 0.46 1.95 0.38 0.51 0.53 0.07 0.46 0.10 0.34 0.05 0.39 0.06 4.15 11.48 5.24XJB02 3.46 5.60 0.71 2.82 0.67 0.38 0.59 0.12 0.64 0.13 0.39 0.07 0.48 0.07 4.71 16.12 2.84XJB01 12.50 20.50 2.56 9.74 1.66 0.27 1.28 0.25 1.57 0.32 1.21 0.21 1.50 0.26 11.20 53.83 0.86
90 H. Wei et al. / Sedimentary Geology 319 (2015) 78–97
increase in δ34Spy (Fig. 7) suggests an oxidizing trend. In Interval III,heavy δ34Spy values (N0‰) correlate with an abundance of euhedral py-rite (maximum diameter ~20 μm), which is also indicative of dysoxic/oxic conditions. The lightest δ34Spy values (~−40‰) correlate with thegreatest abundance of framboids, reflecting episodic development ofeuxinic conditions.
Covariation of δ34Spy with Spy exhibits a pattern indicative of mixingof two different pyrite fractions (Fig. 8a). An almost identical patternwas reported for a Permian–Triassic boundary section by Algeo et al.(2008), who inferred mixing of a small but ubiquitous fraction of34S-enriched diagenetic pyrite with a variable but generally largerfraction of 34S-depleted syngenetic pyrite (Fig. 8b). In both cases, theendmember compositions are about +10‰ for the diageneticendmember and −45‰ for the syngenetic endmember. The strongcorrelation of δ34Spy values with framboid abundance provides furtherevidence that the intervalswith low δ34Spywere deposited under reduc-ing conditions.
Fe2O3/Al2O3 ratios can serve as a redox proxy because “excess Fe”above background detrital levels is added when syngenetic pyriteforms under euxinic conditions (Lyons et al., 2003; Lyons andSevermann, 2006). The average upper crustal Fe2O3/Al2O3 ratio is 0.38
Fig. 10. ΣREE versus Al2O3 for Xiaojiaba.
(Taylor andMcLennan, 1985;McLennan, 2001), but backgrounddetritalsiliciclastic ratios can vary within the range of ~0.3–0.5 owing to localinfluences. At Xiaojiaba, most Fe2O3/Al2O3 ratios are close to averagecrustal values, implying a lack of euxinic conditions, although a fewsamples in Interval I yield ratios up to 0.92 (Fig. 7), suggesting transienteuxinic episodes.
Sedimentary Corg/P represents an environmental redox proxy owingto differential rates of remineralization and/or retention of organiccarbon and phosphorus under oxic versus anoxic conditions (Algeoand Ingall, 2007). For sediments in which organic matter is derivedfrom marine phytoplankton, the initial molar (C/P)org ratio is ~106:1(Redfield, 1958; Redfield et al., 1963). Sedimentary Corg/P ratios trendlower in oxic facies because organic carbon is lost to aerobic decaywhereas remineralized P is adsorbed onto Fe-oxyhydroxides and thusretained in the sediment (Föllmi, 1996; Slomp et al., 1996; Ingall andJahnke, 1997). In contrast, sedimentary Corg:P ratios trend higher in
Fig. 11. δ13Corg versus TOC for Xiaojiaba. The dataset was fit with a 2nd-order polynomialequation.

Table 4Results from SEM pyrite framboid analysis from Xiaojiaba section, South China. Rare = b30 (framboids counted per sample); occasional = 30–49; common 50–98; abundant 99 andabove.
Sample Height from the base (m) Number of framboids Relative abundance Standard deviation (μm) Skewness Mean (μm) MFD (μm)
XJB37 17.11 72 Common 3.56 3.05 6.57 26.91XJB36 16.97 80 Common 2.38 0.66 6.39 13.59XJB35 16.29 152 Abundant 3.48 0.74 8.74 22.37XJB34 15.90 32 Occasional 12.19 0.11 22.28 47.38XJB33 15.46 1 Rare 11XJB32 15.37 0 No framboidXJB31+ 15.17 0 No framboidXJB29 14.94 0 No framboidXJB28 14.87 101 Abundant 3.45 1.24 7.63 18.33XJB27 14.75 101 Abundant 4.37 0.70 8.30 19.52XJB27− 14.59 100 Abundant 3.64 1.54 6.47 18.75XJB26+ 14.45 129 Abundant 2.23 0.33 5.94 12.57XJB26 14.35 83 Common 4.60 1.39 8.22 22.47XJB26− 14.10 81 Common 3.49 2.01 7.59 23.52XJB25+ 13.99 132 Abundant 3.16 4.40 6.88 32.91XJB25− 13.53 89 Common 3.43 1.61 6.50 20.07XJB24+ 13.47 101 Abundant 1.93 0.29 5.31 10.67XJB24 13.20 78 Common 3.10 1.41 6.64 19.41XJB23+ 13.10 70 Common 3.25 1.25 6.92 17.45XJB23− 12.75 208 Abundant 2.19 0.67 5.52 13.78XJB22 12.47 102 Abundant 3.05 1.48 6.84 18.25XJB20+ 12.00 185 Abundant 3.72 3.13 6.10 24.80XJB20 11.80 185 Abundant 2.51 1.80 6.28 16.86XJB19 11.45 162 Abundant 2.57 1.68 6.43 17.66XJB18 11.15 144 Abundant 3.19 0.73 7.86 20.87
MFD = maximum framboid diameter.
Fig. 12. Relative abundances of framboids near the P–Tr boundary. Note that the pair of volcanic tuffs at the Dalong–Feixianguan formation contact is equivalent to the ‘boundary clay’ atMeishan (Beds 25 and 28) and elsewhere across the South China Craton (cf., Peng et al., 2001).
91H. Wei et al. / Sedimentary Geology 319 (2015) 78–97
anoxic facies because P-bearing compounds decay preferentially andthe remineralized P is not retained in the sediment. Based on data inAlgeo and Ingall (2007), Corg/P ratios of N200 imply anoxia in lowerInterval I, ~100 imply suboxic conditions in mid-Interval I, and 30–50
Fig. 13. Scanning electron microscope (SEM) photomicrographs showing different pyrit(b) Magnification of detail in (a) showing framboidal pyrite and loose aggregation of pyrite mbox showing ordered arrangement of pyrite microcrystals); sample XJB25+. (d) Normal framtexture; sample XJB20+. (e) Normal framboids (i), infilled framboids (ii–iii), massive pyrite (a sequence from (i) to (vi). (f) Euhedral pyrite, anhedral pyrite, and overgrown frambo(g) Polyframboids and annular framboids; sample XJB25+. (h) Macroframboids, which are tex
imply oxic conditions in upper Interval I through Interval IV (Fig. 7).This pattern is consistentwith other proxies documenting a progressiveshift toward less reducing conditions upsection, although the absoluteredox levels inferred at a given stratigraphic level are more oxidizing
e morphologies. (a) Abundant pyrite framboids (bright crystals); sample XJB23−.icrocrystals. (c) Framboidal and euhedral pyrite (note the magnified image in the whiteboids and infilled framboids, the latter showing small holes reflecting relict framboidal
iv–v), and euhedral pyrite (vi); sample XJB20+. Pyrite morphologies generally evolve inidal pyrite, the latter showing an outer rim of idiomorphic crystals; sample XJB20.turally similar to normal framboids but much larger (~50 μm); sample XJB19.
92 H. Wei et al. / Sedimentary Geology 319 (2015) 78–97
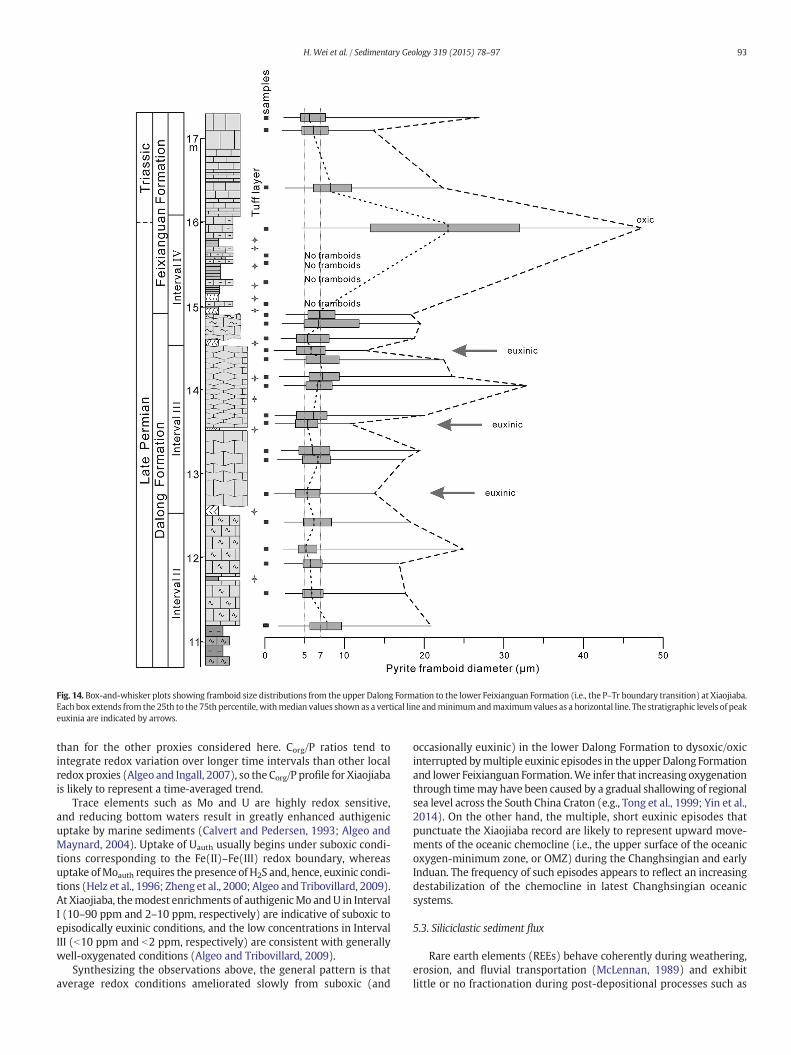
Fig. 14. Box-and-whisker plots showing framboid size distributions from the upper Dalong Formation to the lower Feixianguan Formation (i.e., the P–Tr boundary transition) at Xiaojiaba.Each box extends from the 25th to the 75th percentile, withmedian values shown as a vertical line andminimumandmaximumvalues as a horizontal line. The stratigraphic levels of peakeuxinia are indicated by arrows.
93H. Wei et al. / Sedimentary Geology 319 (2015) 78–97
than for the other proxies considered here. Corg/P ratios tend tointegrate redox variation over longer time intervals than other localredox proxies (Algeo and Ingall, 2007), so the Corg/P profile for Xiaojiabais likely to represent a time-averaged trend.
Trace elements such as Mo and U are highly redox sensitive,and reducing bottom waters result in greatly enhanced authigenicuptake by marine sediments (Calvert and Pedersen, 1993; Algeo andMaynard, 2004). Uptake of Uauth usually begins under suboxic condi-tions corresponding to the Fe(II)–Fe(III) redox boundary, whereasuptake ofMoauth requires the presence of H2S and, hence, euxinic condi-tions (Helz et al., 1996; Zheng et al., 2000; Algeo and Tribovillard, 2009).At Xiaojiaba, themodest enrichments of authigenicMo andU in IntervalI (10–90 ppm and 2–10 ppm, respectively) are indicative of suboxic toepisodically euxinic conditions, and the low concentrations in IntervalIII (b10 ppm and b2 ppm, respectively) are consistent with generallywell-oxygenated conditions (Algeo and Tribovillard, 2009).
Synthesizing the observations above, the general pattern is thataverage redox conditions ameliorated slowly from suboxic (and
occasionally euxinic) in the lower Dalong Formation to dysoxic/oxicinterrupted bymultiple euxinic episodes in the upper Dalong Formationand lower Feixianguan Formation.We infer that increasing oxygenationthrough timemay have been caused by a gradual shallowing of regionalsea level across the South China Craton (e.g., Tong et al., 1999; Yin et al.,2014). On the other hand, the multiple, short euxinic episodes thatpunctuate the Xiaojiaba record are likely to represent upward move-ments of the oceanic chemocline (i.e., the upper surface of the oceanicoxygen-minimum zone, or OMZ) during the Changhsingian and earlyInduan. The frequency of such episodes appears to reflect an increasingdestabilization of the chemocline in latest Changhsingian oceanicsystems.
5.3. Siliciclastic sediment flux
Rare earth elements (REEs) behave coherently during weathering,erosion, and fluvial transportation (McLennan, 1989) and exhibitlittle or no fractionation during post-depositional processes such as
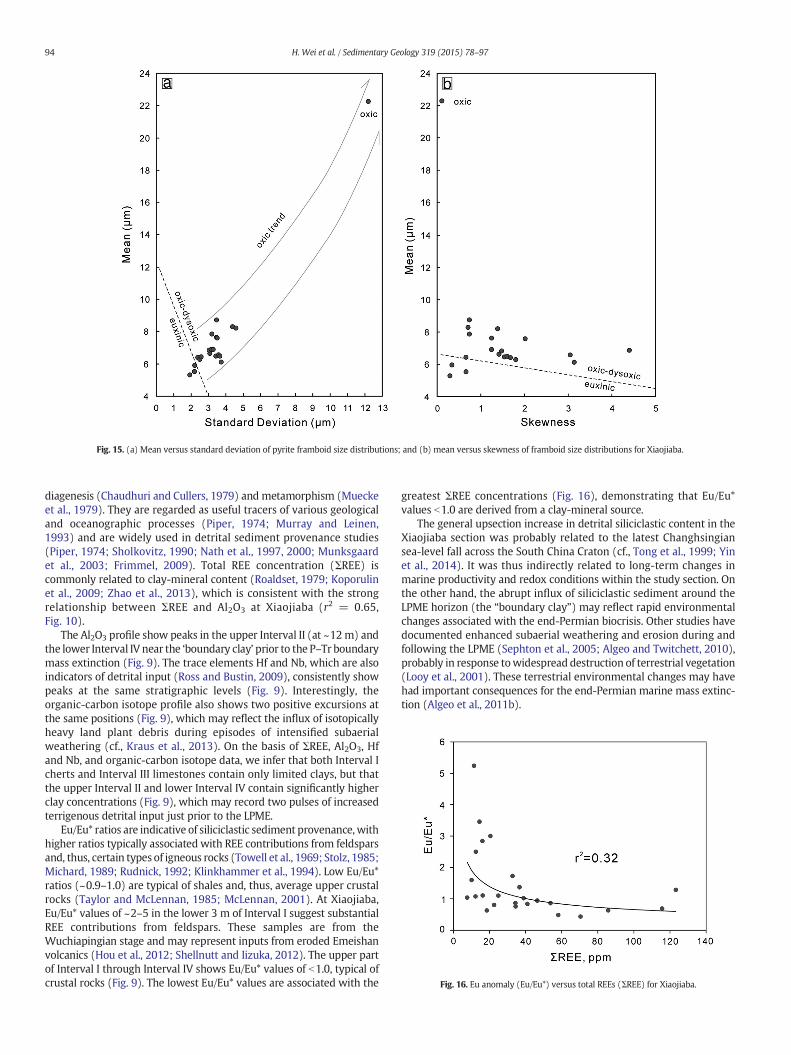
Fig. 15. (a) Mean versus standard deviation of pyrite framboid size distributions; and (b) mean versus skewness of framboid size distributions for Xiaojiaba.
Fig. 16. Eu anomaly (Eu/Eu*) versus total REEs (ΣREE) for Xiaojiaba.
94 H. Wei et al. / Sedimentary Geology 319 (2015) 78–97
diagenesis (Chaudhuri and Cullers, 1979) and metamorphism (Mueckeet al., 1979). They are regarded as useful tracers of various geologicaland oceanographic processes (Piper, 1974; Murray and Leinen,1993) and are widely used in detrital sediment provenance studies(Piper, 1974; Sholkovitz, 1990; Nath et al., 1997, 2000; Munksgaardet al., 2003; Frimmel, 2009). Total REE concentration (ΣREE) iscommonly related to clay-mineral content (Roaldset, 1979; Koporulinet al., 2009; Zhao et al., 2013), which is consistent with the strongrelationship between ΣREE and Al2O3 at Xiaojiaba (r2 = 0.65,Fig. 10).
The Al2O3 profile show peaks in the upper Interval II (at ~12m) andthe lower Interval IV near the ‘boundary clay’ prior to the P–Tr boundarymass extinction (Fig. 9). The trace elements Hf and Nb, which are alsoindicators of detrital input (Ross and Bustin, 2009), consistently showpeaks at the same stratigraphic levels (Fig. 9). Interestingly, theorganic-carbon isotope profile also shows two positive excursions atthe same positions (Fig. 9), which may reflect the influx of isotopicallyheavy land plant debris during episodes of intensified subaerialweathering (cf., Kraus et al., 2013). On the basis of ΣREE, Al2O3, Hfand Nb, and organic-carbon isotope data, we infer that both Interval Icherts and Interval III limestones contain only limited clays, but thatthe upper Interval II and lower Interval IV contain significantly higherclay concentrations (Fig. 9), which may record two pulses of increasedterrigenous detrital input just prior to the LPME.
Eu/Eu* ratios are indicative of siliciclastic sediment provenance,withhigher ratios typically associated with REE contributions from feldsparsand, thus, certain types of igneous rocks (Towell et al., 1969; Stolz, 1985;Michard, 1989; Rudnick, 1992; Klinkhammer et al., 1994). Low Eu/Eu*ratios (~0.9–1.0) are typical of shales and, thus, average upper crustalrocks (Taylor and McLennan, 1985; McLennan, 2001). At Xiaojiaba,Eu/Eu* values of ~2–5 in the lower 3 m of Interval I suggest substantialREE contributions from feldspars. These samples are from theWuchiapingian stage and may represent inputs from eroded Emeishanvolcanics (Hou et al., 2012; Shellnutt and Iizuka, 2012). The upper partof Interval I through Interval IV shows Eu/Eu* values of b1.0, typical ofcrustal rocks (Fig. 9). The lowest Eu/Eu* values are associated with the
greatest ΣREE concentrations (Fig. 16), demonstrating that Eu/Eu*values b1.0 are derived from a clay-mineral source.
The general upsection increase in detrital siliciclastic content in theXiaojiaba section was probably related to the latest Changhsingiansea-level fall across the South China Craton (cf., Tong et al., 1999; Yinet al., 2014). It was thus indirectly related to long-term changes inmarine productivity and redox conditions within the study section. Onthe other hand, the abrupt influx of siliciclastic sediment around theLPME horizon (the “boundary clay”) may reflect rapid environmentalchanges associated with the end-Permian biocrisis. Other studies havedocumented enhanced subaerial weathering and erosion during andfollowing the LPME (Sephton et al., 2005; Algeo and Twitchett, 2010),probably in response towidespread destruction of terrestrial vegetation(Looy et al., 2001). These terrestrial environmental changes may havehad important consequences for the end-Permian marine mass extinc-tion (Algeo et al., 2011b).

95H. Wei et al. / Sedimentary Geology 319 (2015) 78–97
6. Conclusions
From evidence at Xiaojiaba, the late Permian paleo-ocean showsdecreasing primary productivity, increasing oxygenation, and anelevated terrigenous detrital influx during the latest Changhsingian.These trends may have been caused by regional sea-level shallowingacross the South China Craton. However, multiple brief episodes ofeuxinia, especially just below the latest Permian mass extinctionhorizon, probably record upward expansion and increased instabilityof the oceanic chemocline (i.e., the top of the oxygen-minimum zone)at that time. Fluctuations of the oceanic chemocline prior to the LPMEand strongly reducing conditions during deposition of the ‘boundaryclay’ may have been a major kill-factor in the end-Permian biocrisis.
Acknowledgments
This research was supported by the National Natural ScienceFoundation of China (NSFC) through grants 41302021, 41203030 and41002007, and by the Jiangxi Province Education Project (GJJ13453).Research by TJA is supported by the Sedimentary Geology andPaleobiology program of the U.S. National Science Foundation, theNASAExobiology program, and by the State Key Laboratory of GeologicalProcesses and Mineral Resources, China University of Geosciences,Wuhan (program: GPMR201301).
We thank BryonyCaswell and an anonymous reviewer aswell as theeditor Jasper Knight for their constructive and helpful comments on theoriginal manuscript. We are additionally indebted to Professor DaizhaoChen for providing some data and invaluable suggestions. We thankFusong Zhang for his help in organic carbon isotopic measurementand Zenghui Guo for his assistance during the lab work. TJA thanksthe U.S. National Science Foundation, the NASA Exobiology program,and the State Key Laboratory of Geological Processes and MineralResources at the China University of Geosciences-Wuhan (programGPMR201301) for research support. This study is a contribution toIGCP Projects 572 and 630.
Appendix A. Supplementary data
Supplementary data associated with this article can be found in theonline version, at http://dx.doi.org/10.1016/j.sedgeo.2014.11.008.These data include Google map of the most important areas describedin this article.
References
Algeo, T.J., Ingall, E.D., 2007. Sedimentary Corg:P ratios, paleocean ventilation, andPhanerozoic atmospheric pO2. Palaeogeography, Palaeoclimatology, Palaeoecology256, 130–155.
Algeo, T.J., Maynard, J.B., 2004. Trace element behavior and redox facies in core shales ofUpper Pennsylvanian Kansas-type cyclothems. Chemical Geology 206, 289–318.
Algeo, T.J., Tribovillard, N., 2009. Environmental analysis of paleoceanographic systemsbased on molybdenum–uranium covariation. Chemical Geology 268, 211–225.
Algeo, T.J., Twitchett, R.J., 2010. Anomalous Early Triassic sediment fluxes due to elevatedweathering rates and their biological consequences. Geology 38, 1023–1026.
Algeo, T.J., Hannigan, R., Rowe, H., Brookfield, M., Baud, A., Krystyn, L., Ellwood, B.B., 2007.Sequencing events across the Permian–Triassic boundary, Guryul Ravine (Kashmir,India). Palaeogeography, Palaeoclimatology, Palaeoecology 252, 328–346.
Algeo, T.J., Shen, Y., Zhang, T., Lyons, T., Bates, S., Rowe, H., Nguyen, T.K.T., 2008.Association of 34S-depleted pyrite layers with negative carbonate δ13C excursions atthe Permian–Triassic boundary: Evidence for upwelling of sulfidic deep–oceanwater masses. Geochemistry, Geophysics, Geosystems 9, Q04025. http://dx.doi.org/10.1029/2007GC001823.
Algeo, T.J., Hinnov, L., Moser, J., Maynard, J.B., Elswick, E., Kuwahara, K., Sano, H., 2010.Changes in productivity and redox conditions in the Panthalassic Ocean during thelatest Permian. Geology 38, 187–190.
Algeo, T.J., Kuwahara, K., Sano, H., Bates, S., Lyons, T., Elswick, E., Hinnov, L., Ellwood, B.,Moser, J., Maynard, J.B., 2011a. Spatial variation in sediment fluxes, redox conditions,and productivity in the Permian–Triassic Panthalassic Ocean. Palaeogeography,Palaeoclimatology, Palaeoecology 308, 65–83.
Algeo, T.J., Chen, Z.Q., Fraiser, M.L., Twitchett, R.J., 2011b. Terrestrial-marineteleconnections in the collapse and rebuilding of Early Triassic marine ecosystems.Palaeogeography, Palaeoclimatology, Palaeoecology 308, 1–11.
Algeo, T.J., Henderson, C.M., Tong, J., Feng, Q., Yin, H., Tyson, R.V., 2013. Plankton andproductivity during the Permian–Triassic boundary crisis: an analysis of organiccarbon fluxes. Global and Planetary Change 105, 52–67.
Alroy, J., Aberhan, M., Bottjer, D.J., Foote, M., Fürsich, F.T., Harries, P.J., Hendy, A.J.W.,Holland, S.M., Ivany, L.C., Kiessling, W., Kosnik, M.A., Marshall, C.R., McGowan, A.J.,Miller, A.I., Olszewski, T.D., Patzkowsky, M.E., Peters, S.E., Villier, L., Wagner, P.J.,Bonuso, N., Borkow, P.S., Brenneis, B., Clapham, M.E., Fall, L.M., Ferguson, C.A.,Hanson, V.L., Krug, A.Z., Layou, K.M., Leckey, E.H., Nürnberg, S., Powers, C.M., Sessa,J.A., Simpson, C., Tomašových, A., Visaggi, C.C., 2008. Phanerozoic trends in the globaldiversity of marine invertebrates. Science 321, 97–100.
Beauchamp, B., Baud, A., 2002. Growth and demise of Permian biogenic chert alongnorthwest Pangea: evidence for end–Permian collapse of thermohaline circulation.Palaeogeography, Palaeoclimatology, Palaeoecology 184, 37–63.
Bishop, J.K.B., 1988. The barite–opal–organic carbon association in oceanic particulatematter. Nature 332, 341–343.
Bond, D.P.G., Wignall, P.B., 2010. Pyrite framboid study of marine Permian–Triassicboundary sections: a complex anoxic event and its relationship to contemporaneousmass extinction. Geological Society of America Bulletin 122, 1265–1279.
Bonn, W.J., Gingle, F.X., Grobe, H., Mackensen, A., Fütterer, D.K., 1998. Palaeoproductivityat the Antarctic continental margin: opal and barium records for the last 400 ka.Palaeogeography, Palaeoclimatology, Palaeoecology 139, 195–211.
Brennecka, G.A., Herrmann, A.D., Algeo, T.J., Anbar, A.D., 2011. Rapid expansion of oceanicanoxia immediately before the end-Permian mass extinction. Proceedings of theNational Academy of Sciences of the United States of America 108, 17631–17634.
Calvert, S.E., Pedersen, T.F., 1993. Geochemistry of recent oxic and anoxic marinesediments: implications for the geological record. Marine Geology 113, 67–88.
Canfield, D.E., 1994. Factors influencing organic carbon preservation inmarine sediments.Chemical Geology 114, 315–329.
Canfield, D.E., Raiswell, R., Westrich, J.T., Reaves, C.M., Berner, R.A., 1986. The use ofchromium reduction in the analysis of reduced inorganic sulfur in sediments andshales. Chemical Geology 54, 149–155.
Cao, C., Love, G.D., Hays, L.E., Wang, W., Shen, S., Summons, R.E., 2009. Biogeochemicalevidence for euxinic oceans and ecological disturbance presaging the end-Permianmass extinction event. Earth and Planetary Science Letters 281, 188–201.
Caron, D.A., Michaels, A.F., Swanberg, N.R., Howse, F.A., 1995. Primary productivity bysymbiont-bearing planktonic sarcodines (Acantharia, Radiolarian, Foraminifera) insurface waters near Bermuda. Journal of Plankton Research 17, 103–129.
Cashman, K.V., Ferry, J.M., 1988. Crystal size distribution (CSD) in rocks and the kineticsand dynamics of crystallization III: Metamorphic crystallization. Contributions toMineralogy and Petrology 99, 401–415.
Chaudhuri, S., Cullers, R.L., 1979. The distribution of rare earth elements in deeply buriedGulf coast sediments. Chemical Geology 24, 327–338.
Croxford, N.J.W., Jephcott, S., 1972. The McArthur River lead–zinc–silver deposit, NT.Australasian Institute of Mining and Metallurgy, Proceedings 243, 1–26.
Dehairs, F., Chesselet, R., Jedwab, J., 1980. Discrete suspended particles of barite and thebarium cycle in the open ocean. Earth and Planetary Science Letters 49, 528–550.
Dehairs, F., Goeyens, L., Stroobants, N., Bernard, P., Goyet, C., Poisson, A., Chesselet, R.,1990. On suspended barite and the oxygen minimum in the Southern Ocean. GlobalBiogeochemical Cycles 4, 85–102.
Dennett, M.R., Caron, D.A., Michaels, A.F., Gallager, S.M., Davis, C.S., 2002. Video planktonrecorder reveals high abundances of colonial radiolarian in surface waters of thecentral North Pacific. Journal of Plankton Research 24, 797–805.
Dustira, A.M., Wignall, P.B., Joachimski, M., Blomeier, D., Hartkopf-Fröder, C., Bond, D.P.G.,2013. Gradual onset of anoxia across the Permian–Triassic Boundary in Svalbard,Norway. Palaeogeography, Palaeoclimatology, Palaeoecology 374, 303–313.
Dymond, J., Suess, E., Lyle, M., 1992. Barium in deep-sea sediment: a geochemical proxyfor paleoproductivity. Paleoceanography 7, 163–181.
Eagle, M., Paytan, A., Arrigo, K.R., van Dijken, G., Murray, R.W., 2003. A comparisonbetween excess barium and barite as indicators of carbon export. Paleoceanography18, 1021. http://dx.doi.org/10.1029/2002PA000793.
Elderfield, H., Greaves,M.J., 1982. The rare earth elements in seawater. Nature 296, 214–219.Erwin, D.H., Bowring, S.A., Jin, Y.G., 2002. End-Permian mass extinctions: a review. In:
Koeberl, C., MacLeod, K.G. (Eds.), Catastrophic Events and Mass Extinctions: Impactsand Beyond. Geological Society of America Special Paper 356, pp. 363–383.
Feng, Z., Yang, Y., Jin, Z., 1997. Lithofacies and palaeogeography of the Permian of SouthChina. Petroleum University Press, Beijing, pp. 60–62 (in Chinese).
Feng, Q.L., He, W.H., Gu, S.Z., Meng, Y.Y., Jin, Y.X., Zhang, F., 2007. Radiolarian evolutionduring the latest Permian in South China. Global and Planetary Change 55, 177–192.
Föllmi, K.B., 1996. The phosphorus cycle, phosphogenesis and marine phosphate-richdeposits. Earth-Science Reviews 40, 55–124.
Frimmel, H.E., 2009. Trace element distribution in Neoproterozoic carbonates aspalaeoenvironmental indicator. Chemical Geology 258, 338–353.
Gingele, F., Dahmke, A., 1994. Discrete barite particles and barium as tracers ofpaleoproductivity in South Atlantic sediments. Paleoceanography 9, 151–168.
Gorjan, P., Kaiho, K., Kakegawa, T., Niitsuma, S., Chen, Z.Q., Kajiwara, Y., Nicora, A., 2007.Paleoredox, biotic and sulfur-isotopic changes associated with the end-Permianmass extinction in the western Tethys. Chemical Geology 244, 483–492.
Grice, K., Cao, C., Love, G.D., Böcher, M.E., Twitchett, R.J., Grosjean, E., Summons, R.E.,Turgeon, S.C., Dunning, W., Jin, Y., 2005. Photic zone euxinia during the Permian–Triassic superanoxic event. Science 307, 706–709.
Hedges, J.I., Keil, R.G., 1995. Sedimentary organic matter preservation: an assessment andspeculative synthesis. Marine Chemistry 49, 81–115.
Helz, G.R., Miller, C.V., Charnock, J.M., Mosselmans, J.L.W., Pattrick, R.A.D., Garner, C.D.,Vaughan, D.J., 1996. Mechanisms of molybdenum removal from the sea and itsconcentration in black shales: EXAFS evidences. Geochimica et Cosmochimica Acta60, 3631–3642.
96 H. Wei et al. / Sedimentary Geology 319 (2015) 78–97
Hotinski, R.M., Bice, K.L., Kump, L.R., Najjar, R.G., Arthur, M.A., 2001. Ocean stagnation andend-Permian anoxia. Geology 29, 7–10.
Hou, T., Zhang, Z.C., Encarnacion, J., Santosh,M., 2012. Petrogenesis andmetallogenesis of theTaihe gabbroic intrusion associated with Fe–Ti-oxide ores in the Panxi district,Emeishan Large Igneous Province, southwest China. Ore Geology Reviews 49, 109–127.
Huey, R.B., Ward, P.D., 2005. Hypoxia, global warming, and terrestrial Late Permianextinctions. Science 308, 398–401.
Ingall, E.D., Jahnke, R.A., 1997. Influence of water-column anoxia on the elementalfractionation of carbon and phosphorus during sediment diagenesis. Marine Geology139, 219–229.
Isozaki, Y., 1997. Permo-Triassic boundary superanoxia and stratified superocean: recordsfrom lost deep sea. Science 276, 235–238.
Isozaki, Y., Shimizu, N., Yao, J., Ji, Z., Matsuda, T., 2007. End-Permian extinction andvolcanism-induced environmental stress: the Permian–Triassic boundary interval oflower-slope facies at Chaotian, South China. Palaeogeography, Palaeoclimatology,Palaeoecology 252, 218–238.
Ji, Z., Yao, J., Isozaki, Y., Matsuda, T., Wu, G., 2007. Conodont biostratigraphy across thePermian–Triassic boundary at Chaotian, northern Sichuan, China. Palaeogeography,Palaeoclimatology, Palaeoecology 252, 39–55.
Jones, B., Manning, D.A.C., 1994. Comparison of geochemical indices used for the interpre-tation of palaeoredox conditions in ancient mudstones. Chemical Geology 111,112–129.
Kaiho, K., Oba, M., Fukuda, Y., Ito, K., Ariyoshi, S., Gorjan, P., Riu, Y., Takahashi, S., Chen,Z.Q., Tong, J.N., Yamakita, S., 2012. Changes in depth-transect redox conditionsspanning the end-Permianmass extinction and their impact on themarine extinction:evidence from biomarkers and sulfur isotopes. Global and Planetary Change 94–95,20–32.
Kakuwa, Y., 1996. Permian–Triassic mass extinction event recorded in bedded chertsequence in southwest Japan. Palaeogeography, Palaeoclimatology, Palaeoecology121, 35–51.
Kato, Y., Nakao, K., Isozaki, Y., 2002. Geochemistry of Late Permian to Early Triassic pelagiccherts from southwest Japan: Implications for an oceanic redox change. ChemicalGeology 182, 15–34.
Kidder, D.L., Worsley, T.R., 2004. Cause and consequences of extreme Permo-Triassicwarming to globally equable climate and relation to the Permo-Triassic extinctionand recovery. Palaeogeography, Palaeoclimatology, Palaeoecology 203, 207–237.
Kizilshtein, L.J., Minaeva, 1972. Origin of framboidal pyrite. Doklady Akademii Nauk SSSR206, 1187–1189 (in Russian).
Klinkhammer, G.P., Elderfield, H., Edmond, J.M., Mitra, A., 1994. Geochemical implicationsof rare earth element patterns in hydrothermal fluids from mid-ocean ridges.Geochimica et Cosmochimica Acta 58, 5105–5113.
Knoll, A.H., Bambach, R.K., Canfield, D.E., Grotzinger, J.P., 1996. Comparative earth historyand Late Permian mass extinction. Science 273, 452–457.
Knoll, A.H., Bambach, R.K., Payne, J.L., Pruss, S., Fischer, W.W., 2007. Paleophysiology andend-Permian mass extinction. Earth and Planetary Science Letters 256, 295–313.
Koporulin, V.I., Lyapunov, S.M., Seredlin, V.V., 2009. Rare earth elements in the clayfraction of coaliferous sediments of the Arkagalinskoe (Magadan district) andDolinskoe (Sakhalin island) coalfields. Lithology and Mineral Resources 44, 482–496.
Kosacz, R., Sawlowicz, Z., 1983. Framboidal pyrite from the copper deposit on theFore-Sudetic monocline, Poland. Rudy Metale 8, 292–297 (in Polish).
Kraus, S.H., Brandner, R., Heubeck, C., Kozur, H.W., Struck, U., Korte, C., 2013. Carbonisotope signatures of latest Permian marine successions of the Southern Alps suggesta continental runoff pulse enriched in land plant material. Fossil Record 16, 97–109.
Kump, L.R., Pavlov, A., Arthur, M.A., 2005. Massive release of hydrogen sulfide to thesurface ocean and atmosphere during intervals of oceanic anoxia. Geology 33,397–400.
Looy, C.V., Twitchett, R.J., Dilcher, D.L., van Konijnenburg-van Cittert, J.H.A., Visscher, H.,2001. Life in the end-Permian dead zone. Proceedings of the National Academy ofSciences of the United States of America 98, 7879–7883.
Love, L.G., 1967. Early diagenetic iron sulfide in recent sediment of the Wash (England).Sedimentology 9, 327–352.
Lyons, T.W., Severmann, S., 2006. A critical look at iron paleoredox proxies: new insightsfrom modern euxinic marine basins. Geochimica et Cosmochimica Acta 70,5698–5722.
Lyons, T.W.,Werne, J.P., Hollander, D.J.,Murray,R.W., 2003. Contrasting sulfur geochemistryand Fe/Al andMo/Al ratios across the last oxic-to-anoxic transition in the CariacoBasin,Venezuela. Chemical Geology 195, 131–157.
Ma, Y., Mu, C., Guo, X., Tan, Q., Yu, Q., 2006. Characteristic and framework of theChanghsingian sedimentation in the northeastern Sichuan Basin. Geological Review52, 25–29 (in Chinese with English abstract).
McLennan, S.M., 1989. Rare earth elements in sedimentary rocks: influence of provenanceand sedimentary processes. Reviews in Mineralogy and Geochemistry 21, 169–200.
McLennan, S.M., 2001. Relationships between the trace element composition of sedimen-tary rocks and upper continental crust. Geochemistry, Geophysics, Geosystems 2.http://dx.doi.org/10.1029/2000GC000109 (2000GC000109).
Michard, A., 1989. Rare earth systematics in hydrothermal fluids. Geochimica etCosmochimica Acta 53, 745–750.
Muecke, G.K., Pride, C., Sarkar, P., 1979. Rare earth element geochemistry of regionalmetamorphic rocks. Physics and Chemistry of the Earth 11, 449–464.
Munksgaard, N.C., Lim, K., Parry, D.L., 2003. Rare earth elements as provenance indicatorsin North Australian estuarine and coastal marine sediments. Estuarine, Coastal andShelf Science 57, 399–409.
Murray, R.W., Leinen, M., 1993. Chemical transport to the seafloor of the equatorial PacificOcean across a Latitudinal transect at 135°W: tracking sedimentary major, trace andrare earth element fluxes at the Equator and the Intertropical Convergence Zone.Geochimica et Cosmochimica Acta 57, 4141–4163.
Nafi, M., Xia, W., Zhang, N., 2006. Late Permian (Changhsingian) conodont biozonationand thebasal boundary, Ganxi section,westernHubei Province, south China. CanadianJournal of Earth Sciences 43, 121–133.
Nath, B.N., Bau, M., Rao, B.R., Rao, Ch.M., 1997. Trace and rare earth elemental variation inArabian Sea sediments through a transect across the oxygen minimum zone.Geochimica et Cosmochimica Acta 61, 2375–2388.
Nath, B.N., Kunzendorf, H., Pluger, W.L., 2000. Influence of provenance, weathering andsedimentary processes on the elemental ratios of the fine-grained fraction of thebedload sediments from the Vembanad Lake and the adjoining continental shelf,southwest coast of India. Journal of Sedimentary Research 70, 1081–1094.
Nielsen, J.K., Shen, Y., 2004. Evidence for sulfidic deep water during the Late Permian inthe East Greenland Basin. Geology 32, 1037–1040.
Papunen, H., 1966. Framboidal texture of the pyritic layer found in a peat bog in SEFinland. Bulletin de la Commission Geologique de Finlande 222, 117–125.
Paytan, A., Griffith, E.M., 2007. Marine barite: Recorder of variations in ocean exportproductivity. Deep-Sea Research II 54, 687–705.
Paytan, A., Kastner, M., 1996. Benthic Ba fluxes in the central Equatorial Pacific: implica-tions for the oceanic Ba cycle. Earth and Planetary Science Letters 142, 439–450.
Peng, Y.Q., Tong, J.N., Shi, G.R., Hansen, H.J., 2001. The Permian–Triassic boundarystratigraphic set: characteristics and correlation. Newsletters on Stratigraphy 39,55–71.
Piper, D.Z., 1974. Rare earth elements in the sedimentary cycle: a summary. ChemicalGeology 14, 285–304.
Raiswell, R., Berner, R.A., 1985. Pyrite formation in euxinic and semi-euxinic sediments.American Journal of Science 298, 219–245.
Redfield, A.C., 1958. The biological control of chemical factors in the environment.American Scientist 46, 205–222.
Redfield, A.C., Ketchum, B.H., Richards, F.A., 1963. The influence of organisms on thecomposition of seawater. In: Hill, M.N. (Ed.), The Sea vol. 2. Wiley, New York, pp. 26–77.
Riccardi, A.L., Arthur, M.A., Kump, L.R., 2006. Sulfur isotopic evidence for chemoclineupward excursions during the end-Permian mass extinction. Geochimica etCosmochimica Acta 70, 5740–5752.
Riccardi, A., Kump, L.R., Arthur, M.A., D'Hondt, S., 2007. Carbon isotopic evidence forchemocline upward excursions during the end-Permian event. Palaeogeography,Palaeoclimatology, Palaeoecology 248, 73–81.
Riegel, W., 2008. The Late Palaeozoic phytoplankton blackout — artefact or evidence ofglobal change? Review of Palaeobotany and Palynology 148, 73–90.
Roaldset, E., 1979. Rare earth elements in different size fractions of a marine quick clayfrom Ullensker, and a till from Upper Numedal, Norway. Clay Minerals 14, 229–240.
Ross, D.J.K., Bustin, R.M., 2009. Investigating the use of sedimentary geochemical proxiesfor paleoenvironment interpretation of thermally mature organic-rich strata:examples from the Devonian–Mississippian shales, Western Canadian SedimentaryBasin. Chemical Geology 260, 1–19.
Rudnick, R.L., 1992. Restites, Eu anomalies, and the lower continental crust. Geochimica etCosmochimica Acta 56, 963–970.
Saitoh, M., Isozaki, Y., Ueno, Y., Yoshida, N., Yao, J., Ji, Z., 2013. Middle–Upper Permiancarbon isotope stratigraphy at Chaotian, South China: Pre-extinction multipleupwelling of oxygen-depleted water onto continental shelf. Journal of Asian EarthSciences 67–68, 51–62.
Sawlowicz, Z., 1993. Pyrite framboids and their development: a new conceptualmechanism. Geologische Rundschau 82, 148–156.
Schmitz, B., 1987. Barium, equatorial high productivity, and the northward wandering ofthe Indian continent. Paleoceanography 2, 63–77.
Schoepfer, S.D., Henderson, C.M., Garrison, G.H., Ward, P.D., 2012. Cessation of a produc-tive coastal upwelling system in the Panthalassic Ocean at the Permian–Triassicboundary. Palaeogeography, Palaeoclimatology, Palaeoecology 313–314, 181–188.
Schoepfer, S.D., Henderson, C.M., Garrison, G.H., Foriel, J., Ward, P.D., Selby, D., Hower, J.C.,Algeo, T.J., Shen, Y., 2013. Termination of a continent-margin upwelling system at thePermian–Triassic boundary (Opal Creek, Alberta, Canada). Global and PlanetaryChange 105, 21–35.
Schoepfer, S.D., Shen, J., Wei, H., Tyson, R.V., Ingall, E., Algeo, T.J., 2015. TOC, organic P, andbiogenic Ba accumulation rates as proxies for marine productivity and export flux.Earth-Science Reviews (in press).
Sephton, M.A., Looy, C.V., Brinkhuis, H., Wignall, P.B., de Leeuw, J.W., Visscher, H., 2005.Catastrophic soil erosion during the end-Permian biotic crisis. Geology 33, 941–944.
Shellnutt, J.G., Iizuka, Y., 2012. Oxidation zonation within the Emeishan large igneousprovince: evidence from mantle-derived syenitic plutons. Journal of Asian EarthSciences 54–55, 31–40.
Sholkovitz, E.R., 1990. Rare earth elements in marine sediments and geochemicalstandards. Chemical Geology 88, 333–347.
Slomp, C.P., van der Gaast, S.J., van Raaphorst, W., 1996. Phosphorus binding by poorlycrystalline iron oxides in North Sea sediments. Marine Chemistry 52, 55–73.
Stolz, A.J., 1985. The role of fractional crystallization in the evolution of the NandewarVolcano, NortheasternNewSouthWales, Australia. Journal of Petrology26, 1002–1026.
Takahashi, S., Yamasaki, S.I., Ogawa, Y., Kimura, K., Kaiho, K., Yoshida, T., Tsuchiya, N.,2014. Bioessential element-depleted ocean following the euxinic maximum of theend-Permian mass extinction. Earth and Planetary Science Letters 392, 94–104.
Taylor, S.R., McLennan, S.M., 1985. The Continental Crust: Its Composition and Evolution.Blackwell, Oxford, p. 312.
Tong, J., Yin, H., Zhang, K., 1999. Permian and Triassic sequence stratigraphy and sea levelchanges of eastern Yangtze Platform. Journal of China University of Geosciences(Wuhan) 10, 161–169.
Towell, D.G., Spirn, R.V., Winchester, J.W., 1969. Europium anomalies and the genesis ofbasalt: a discussion. Chemical Geology 4, 461–465.
Tribovillard, N., Algeo, T.J., Lyons, T., Riboulleau, A., 2006. Trace metals as paleoredox andpaleoproductivity proxies: an update. Chemical Geology 232, 12–32.

97H. Wei et al. / Sedimentary Geology 319 (2015) 78–97
Wang, Y., Jin, Y., 2000. Permian palaeogeographic evolution of the Jiangnan Basin, SouthChina. Palaeogeography, Palaeoclimatology, Palaeoecology 160, 35–44.
Wang, Y., Wen, Y., Hong, H., Xia, M., Fan, Y., Wen, L., Kong, L., Wu, C., 2009. Carbonateslope facies sedimentary characteristics of the Late Permian to Early Triassic in north-ern Sichuan Basin. Journal of Palaeogeography 11, 143–156 (In Chinese with Englishabstract).
Wei, H., Chen, D., Yu, H., Wang, J., 2012a. End-Guadalupian mass extinction and negativecarbon isotope excursion at Xiaojiaba, Guangyuan, Sichuan. Science in China Series D:Earth Sciences 55, 1480–1488.
Wei, H., Chen, D., Wang, J., Yu, H., Tucker, M.E., 2012b. Organic accumulation in the lowerChihsia Formation (Middle Permian) of South China: Constraints from pyritemorphology and multiple geochemical proxies. Palaeogeography, Palaeoclimatology,Palaeoecology 353–355, 73–86.
Wignall, P.B., Hallam, A., 1992. Anoxia as a cause of the Permian/Triassic extinction: faciesevidence from northern Italy and the western United States. Palaeogeography,Palaeoclimatology, Palaeoecology 93, 21–46.
Wignall, P.B., Twitchett, R.J., 1996. Oceanic anoxia and the end-Permian mass extinction.Science 272, 1155–1158.
Wignall, P.B., Wand Twitchett, R.J., 2002. Extent, duration and nature of the Permian-Triassic superanoxic event. In: Koeberl, C., MacLeod, K.G. (Eds.), Catastrophicevent and mass extinctions: impacts and beyond. Geological Society of AmericaSpecial Papers 365. GSA Boulder, pp. 395–413.
Wignall, P.B., Hallam, A., Lai, X., Yang, F., 1995. Palaeoenvironmental changes across thePermian/Triassic boundary at Shangsi (N. Sichuan, China). Historical Biology 10,175–189.
Wignall, P.B., Bond, D.P.G., Kuwahara, K., Kakuwa, Y., Newton, R.J., Poulton, S.W., 2010. An80 million year oceanic redox history from Permian to Jurassic pelagic sediments ofthe Mino–Tamba terrane, SW Japan, and the origin of four mass extinctions. Globaland Planetary Change 71, 109–123.
Wilkin, R.T., Arthur, M.A., 2001. Variations in pyrite texture, sulfur isotope composition,and iron systematics in the Black Sea: Evidence for Late Pleistocene to Holocene ex-cursions of the O2–H2S redox transition. Geochimica et Cosmochimica Acta 65,1399–1416.
Wilkin, R.T., Barnes, H.L., Brantley, S.L., 1996. The size distribution of framboidal pyrite inmodern sediments: an indicator of redox conditions. Geochimica et CosmochimicaActa 60, 3897–3912.
Wilkin, R.T., Arthur, M.A., Dean, W.E., 1997. History of water-column anoxia in the BlackSea indicated by pyrite framboid size distributions. Earth and Planetary ScienceLetters 148, 517–525.
Yin, H.F., Huang, S.J., Zhang, K.X., Hansen, H.J., Yang, F.Q., Ding, M.H., Bie, X.M., 1992. Theeffect of volcanism on the Permo–Triassic mass extinction in South China. In:Sweet, W.C., Yang, Z.Y., Dickins, J.M., Yin, H.F. (Eds.), Permo–Triassic Events in theEastern Tethys. Cambridge University Press, Cambridge, pp. 146–157.
Yin, H.F., Zhang, K.X., Tong, J.N., Yang, Z.Y., Wu, S.B., 2001. The global stratotype sectionand point (GSSP) of the Permian–Triassic boundary. Episodes 24, 102–114.
Yin, H.F., Jiang, H., Xia, W., Feng, Q., Zhang, N., Shen, J., 2014. The end-Permian regressionin South China and its implication on mass extinction. Earth-Science Reviews 137,19–33.
Zhao, L., Chen, Z.Q., Algeo, T.J., Chen, J., Chen, Y., Tong, J., Gao, S., Zhou, L., Hu, C., Liu, Y.,2013. Rare-earth element patterns in conodont albid crowns: evidence for massiveinputs of volcanic ash during the latest Permian biocrisis? Global and PlanetaryChange 105, 135–151.
Zheng, Y., Anderson, R.F., van Geen, A., Kuwabara, J., 2000. Authigenic molybdenumformation in marine sediments: a link to pore water sulfide in the Santa BarbaraBasin. Geochimica et Cosmochimica Acta 64, 4165–4178.
Related Documents