SERVICES prepared by EARSC under assignment from ESA September 2015

Welcome message from author
This document is posted to help you gain knowledge. Please leave a comment to let me know what you think about it! Share it to your friends and learn new things together.
Transcript
eoSERVICESindustry
A Survey into the State andHealth of the European EOServices Industry
prepared by EARSC under assignment from ESASeptember 2015
201 5
eoSERVICESindustry © EARSC 2
1 . Forward2. Strategic context3. Industriallandscape4. Employment5. Revenues & growth6. Activities7. Copernicus8. Customers9. Thematic areas1 0. Data sales1 1 . Internal practices1 2. Strategic issues1 3. The future[Glossary]
ForwardI t is with great pleasure that we bring you the results of the 201 5 EARSC survey of the EO services industry.
This is the fourth survey conducted and the second performed by EARSC. We are very grateful to al l the
companies that have spent their time responding to our questions. This brochure is a summary of the survey
results and the ful l report can be downloaded at www.earsc.org .
This is a critical time for the industry with a great deal of change happening in and around the sector; new
low-cost satel l ites are being launched by start-up companies and several significant acquisitions have
occurred suggesting that M&A activity may increase. Against this background the European Union flagship
programme Copernicus is committing over €7b investment into the sector leading to new satel l ites, data
sources and commercial relationships.
Our survey considers EO services companies which are those sel l ing geospatial products which contain an
element of satel l ite data. I t comprises data suppliers including satel l ite operators, value-adding and GIS
companies as wel l as consultants. In the report we show our view of the value chain and also give a glossary of
relevant terms.
The survey provides an overview of the industry in 33 countries in Europe plus Canada (as an ESA member)
based on sol id, reported numbers; and it does so just before the Copernicus investments wil l start to impact
the sector. The results provide a firm base on which the impact of the Copernicus investment can be
measured.
The methodology used is basical ly the same as in 201 2 and starts to give us comparisons on which we can
analyse trends in the industry. We now have 3 years in which data was gathered; in 2006, 201 2, and 201 4
which is used to make comparison and to assess trends, as wel l as interpolate the intermediate years.
We plan to revisit the industry facts and figures every two years. Regular survey wil l be essential to develop a
ful l understanding of the impact that pol icy decisions are having on the industry. In the meantime, the results
for 201 4 fol low which we hope you wil l find interesting, stimulating and helpful in your ventures.
The survey
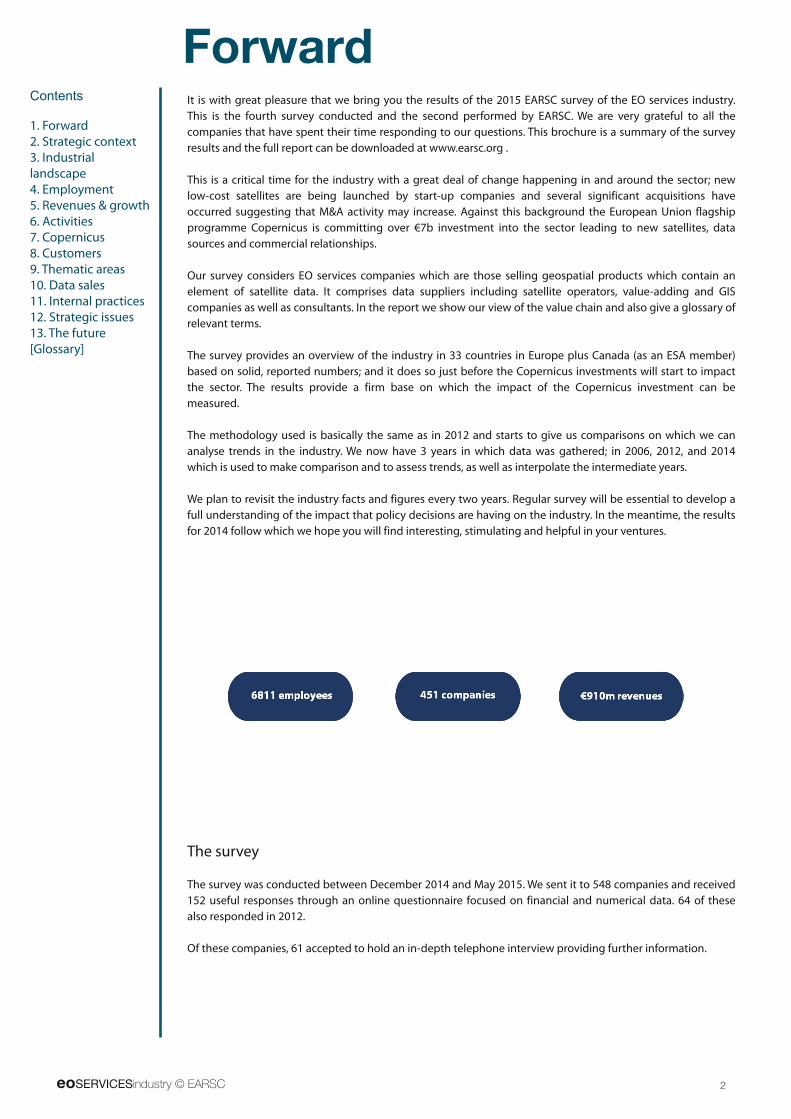
The survey was conducted between December 201 4 and May 201 5. We sent it to 548 companies and received
1 52 useful responses through an onl ine questionnaire focused on financial and numerical data. 64 of these
also responded in 201 2.
Of these companies, 61 accepted to hold an in-depth telephone interview providing further information.
3 eoSERVICESindustry © EARSC
Strategic contextThe 201 5 EARSC survey of the EO Services Industry in Europe and Canada comes at a time when the strategic
landscape is changing very rapidly. A number of European EO satel l ites were launched as shown in the table
below. In the US, 201 4 saw the launch ofWorldview 3 offering imagery down to 25cm resolution fol lowing the
l ifting of ITAR regulations and Landsat 8 which, l ike the Sentinels, provides data on a free and open basis,
Skybox’s first satel l ite and up to 1 01 “Doves” – the Planet Labs nano satel l ites launched in flocks at a time.
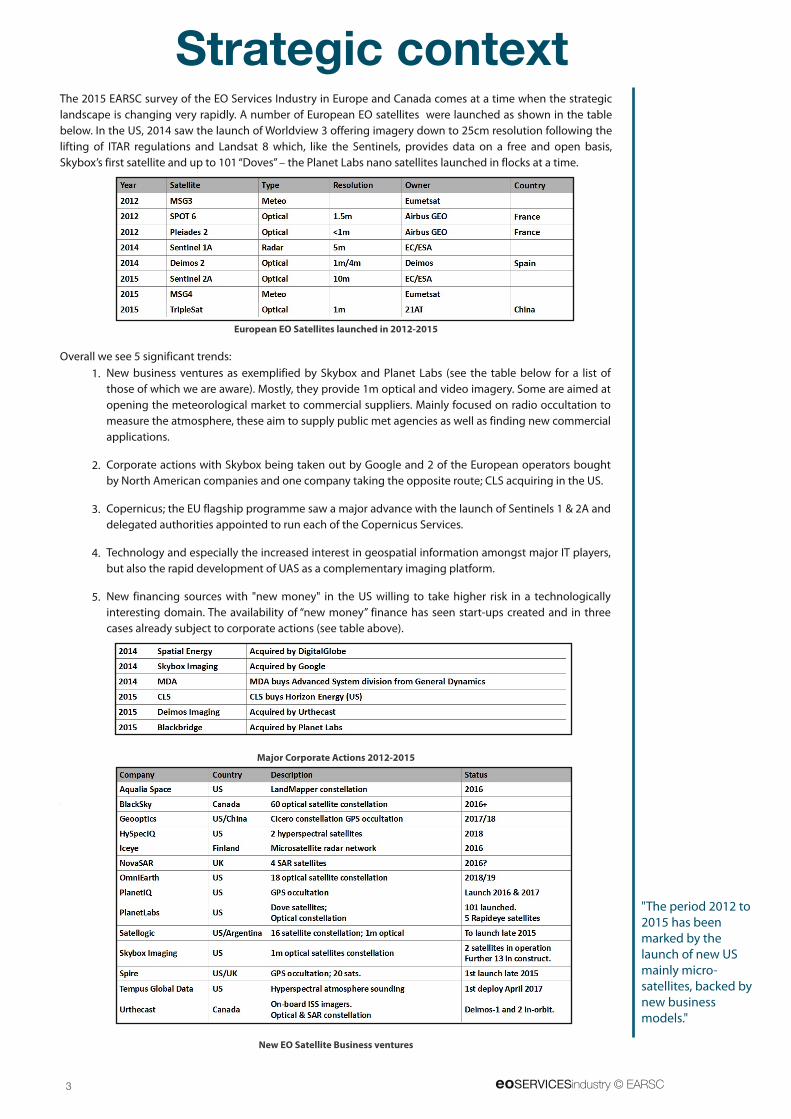
European EO Satellites launched in 201 2-201 5
Overal l we see 5 significant trends:
Major Corporate Actions 201 2-201 5
.
New EO Satellite Business ventures
"The period 201 2 to201 5 has beenmarked by thelaunch of new USmainly micro-satel l ites, backed bynew businessmodels."
New business ventures as exemplified by Skybox and Planet Labs (see the table below for a l ist of
those of which we are aware). Mostly, they provide 1 m optical and video imagery. Some are aimed at
opening the meteorological market to commercial suppliers. Mainly focused on radio occultation to
measure the atmosphere, these aim to supply public met agencies as wel l as finding new commercial
appl ications.
Corporate actions with Skybox being taken out by Google and 2 of the European operators bought
by North American companies and one company taking the opposite route; CLS acquiring in the US.
Copernicus; the EU flagship programme saw a major advance with the launch of Sentinels 1 & 2A and
delegated authorities appointed to run each of the Copernicus Services.
Technology and especial ly the increased interest in geospatial information amongst major IT players,
but also the rapid development of UAS as a complementary imaging platform.
New financing sources with "new money" in the US wil l ing to take higher risk in a technological ly
interesting domain. The availabil ity of “new money” finance has seen start-ups created and in three
cases already subject to corporate actions (see table above).
1 .
2.
3.
4.
5.
eoSERVICESindustry © EARSC 4
In 201 4, our survey indicates there are 451
companies active in the domain of EO services in
Europe and Canada. This compares with the 31 9
companies which we considered were active at the
time of the survey in 201 2. Our database has grown
as we became aware of the existence of new
companies and suspect that we missed some
earl ier. We thus decided to revise the figures of the
2 last surveys. For 201 2, 31 9 has been revised
upwards to 389 and for 2006, the figure of 1 51 has
been revised upwards to 1 93.
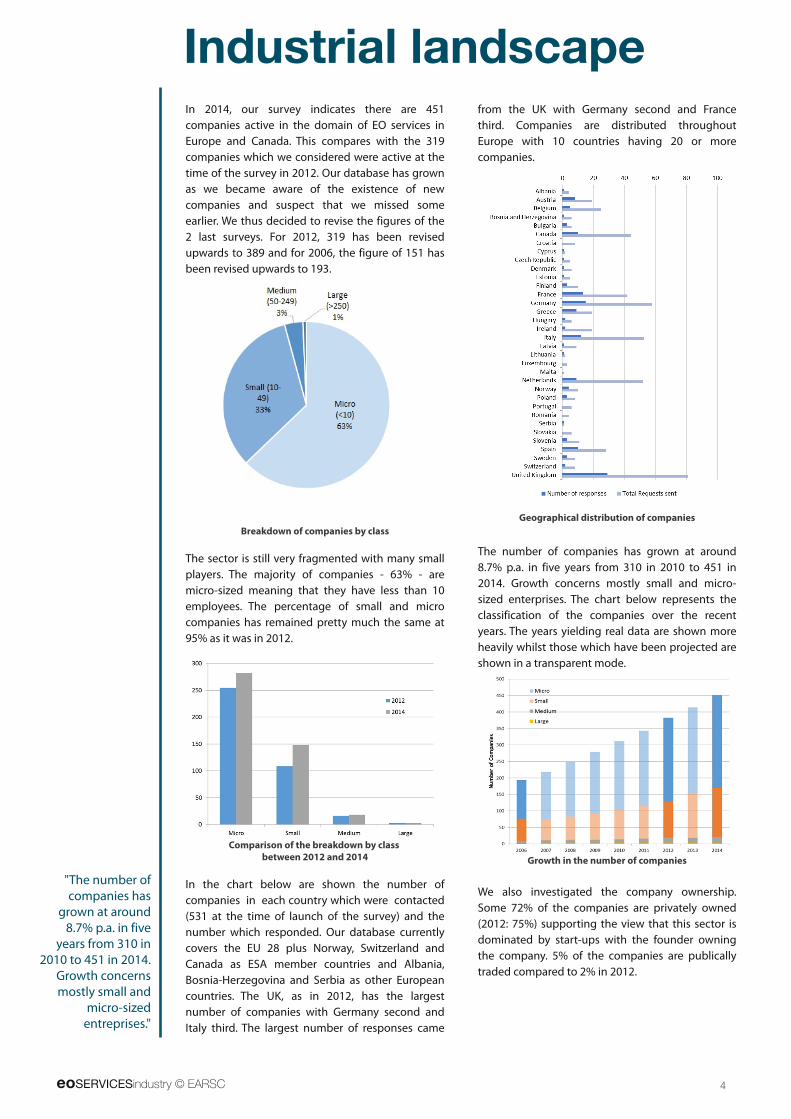
Breakdown of companies by class
The sector is sti l l very fragmented with many smal l
players. The majority of companies - 63% - are
micro-sized meaning that they have less than 1 0
employees. The percentage of smal l and micro
companies has remained pretty much the same at
95% as it was in 201 2.
Comparison of the breakdown by class
between 201 2 and 201 4
In the chart below are shown the number of
companies in each country which were contacted
(531 at the time of launch of the survey) and the
number which responded. Our database currently
covers the EU 28 plus Norway, Switzerland and
Canada as ESA member countries and Albania,
Bosnia-Herzegovina and Serbia as other European
countries. The UK, as in 201 2, has the largest
number of companies with Germany second and
Italy third. The largest number of responses came
from the UK with Germany second and France
third. Companies are distributed throughout
Europe with 1 0 countries having 20 or more
companies.
Geographical distribution of companies
The number of companies has grown at around
8.7% p.a. in five years from 31 0 in 201 0 to 451 in
201 4. Growth concerns mostly smal l and micro-
sized enterprises. The chart below represents the
classification of the companies over the recent
years. The years yielding real data are shown more
heavily whilst those which have been projected are
shown in a transparent mode.
Growth in the number of companies
We also investigated the company ownership.
Some 72% of the companies are privately owned
(201 2: 75%) supporting the view that this sector is
dominated by start-ups with the founder owning
the company. 5% of the companies are publical ly
traded compared to 2% in 201 2.
Industrial landscape
"The number ofcompanies has
grown at around8.7% p.a. in five
years from 31 0 in201 0 to 451 in 201 4.
Growth concernsmostly smal l and
micro-sizedentreprises."
5 eoSERVICESindustry © EARSC
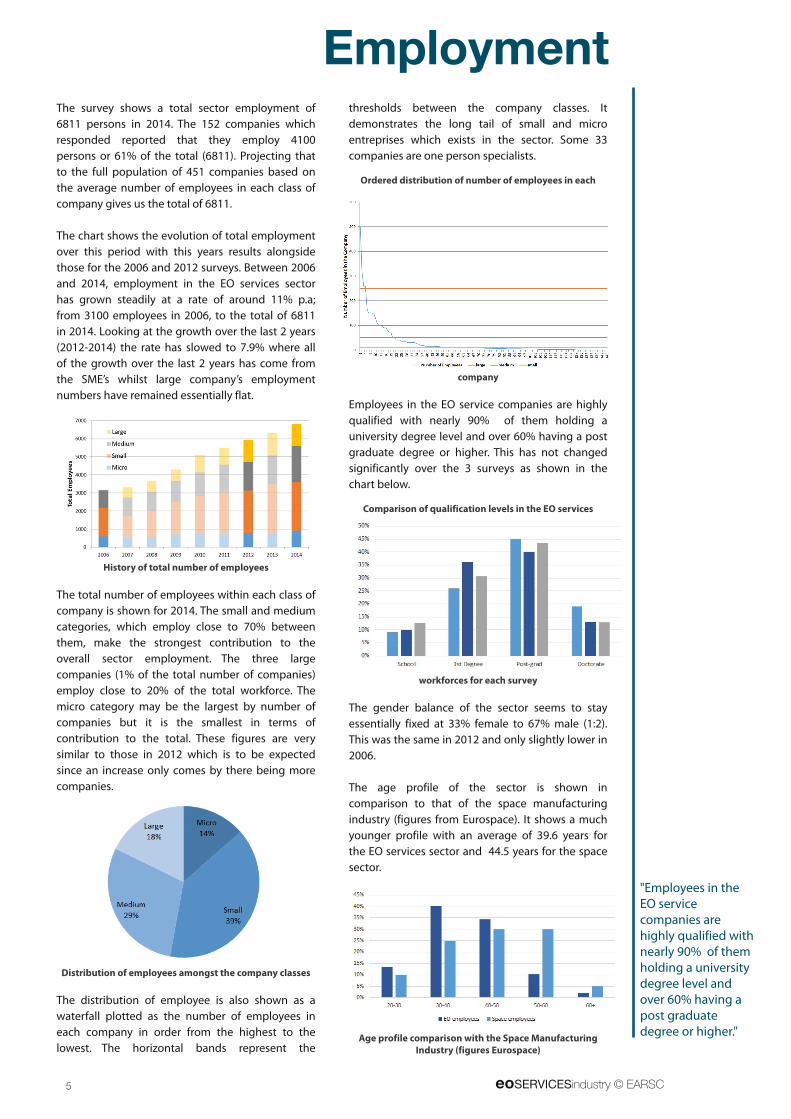
The survey shows a total sector employment of
681 1 persons in 201 4. The 1 52 companies which
responded reported that they employ 41 00
persons or 61 % of the total (681 1 ). Projecting that
to the ful l population of 451 companies based on
the average number of employees in each class of
company gives us the total of 681 1 .
The chart shows the evolution of total employment
over this period with this years results alongside
those for the 2006 and 201 2 surveys. Between 2006
and 201 4, employment in the EO services sector
has grown steadily at a rate of around 1 1 % p.a;
from 31 00 employees in 2006, to the total of 681 1
in 201 4. Looking at the growth over the last 2 years
(201 2-201 4) the rate has slowed to 7.9% where al l
of the growth over the last 2 years has come from
the SME’s whilst large company’s employment
numbers have remained essential ly flat.
History of total number of employees
The total number of employees within each class of
company is shown for 201 4. The smal l and medium
categories, which employ close to 70% between
them, make the strongest contribution to the
overal l sector employment. The three large
companies (1 % of the total number of companies)
employ close to 20% of the total workforce. The
micro category may be the largest by number of
companies but it is the smal lest in terms of
contribution to the total. These figures are very
similar to those in 201 2 which is to be expected
since an increase only comes by there being more
companies.
Distribution of employees amongst the company classes
The distribution of employee is also shown as a
waterfal l plotted as the number of employees in
each company in order from the highest to the
lowest. The horizontal bands represent the
thresholds between the company classes. I t
demonstrates the long tail of smal l and micro
entreprises which exists in the sector. Some 33
companies are one person special ists.
Ordered distribution of number of employees in each
company
Employees in the EO service companies are highly
qual ified with nearly 90% of them holding a
university degree level and over 60% having a post
graduate degree or higher. This has not changed
significantly over the 3 surveys as shown in the
chart below.
Comparison of qualification levels in the EO services
workforces for each survey
The gender balance of the sector seems to stay
essential ly fixed at 33% female to 67% male (1 :2).
This was the same in 201 2 and only sl ightly lower in
2006.
The age profile of the sector is shown in
comparison to that of the space manufacturing
industry (figures from Eurospace). I t shows a much
younger profile with an average of 39.6 years for
the EO services sector and 44.5 years for the space
sector.
Age profile comparison with the Space Manufacturing
Industry (figures Eurospace)
Employment
"Employees in theEO servicecompanies arehighly qual ified withnearly 90% of themholding a universitydegree level andover 60% having apost graduatedegree or higher."
eoSERVICESindustry © EARSC 6
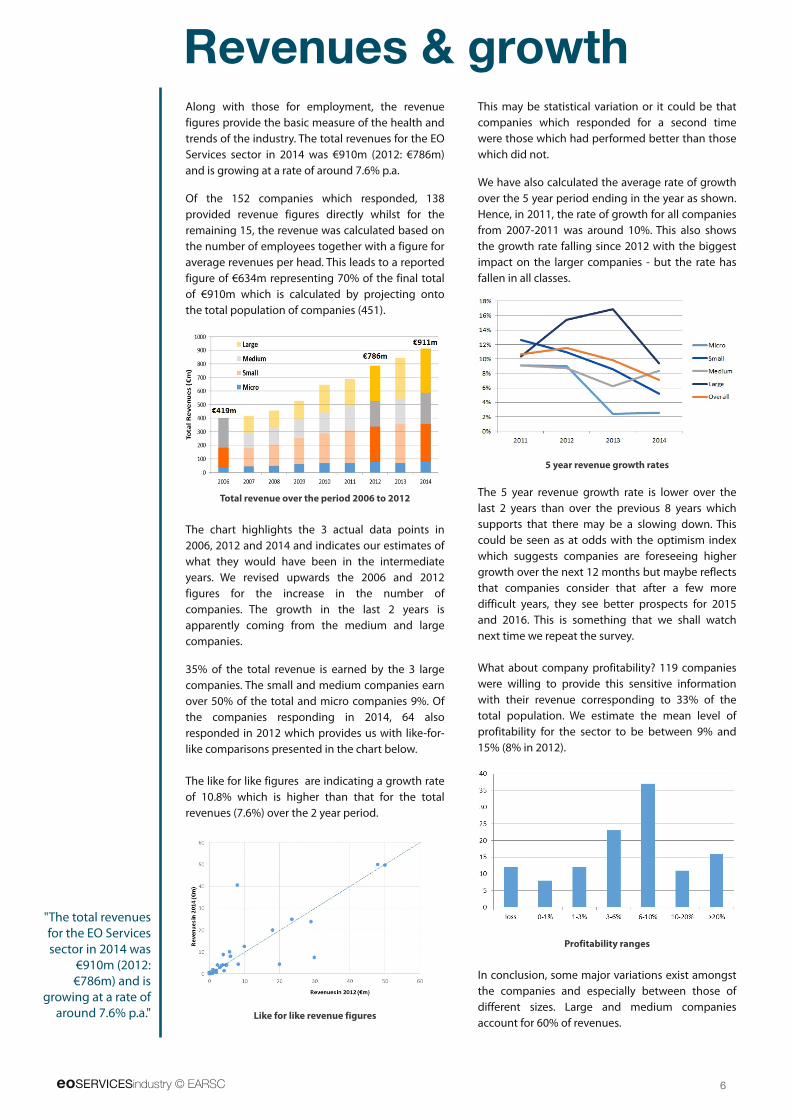
Revenues & growthAlong with those for employment, the revenue
figures provide the basic measure of the health and
trends of the industry. The total revenues for the EO
Services sector in 201 4 was €91 0m (201 2: €786m)
and is growing at a rate of around 7.6% p.a.
Of the 1 52 companies which responded, 1 38
provided revenue figures directly whilst for the
remaining 1 5, the revenue was calculated based on
the number of employees together with a figure for
average revenues per head. This leads to a reported
figure of €634m representing 70% of the final total
of €91 0m which is calculated by projecting onto
the total population of companies (451 ).
Total revenue over the period 2006 to 201 2
The chart highl ights the 3 actual data points in
2006, 201 2 and 201 4 and indicates our estimates of
what they would have been in the intermediate
years. We revised upwards the 2006 and 201 2
figures for the increase in the number of
companies. The growth in the last 2 years is
apparently coming from the medium and large
companies.
35% of the total revenue is earned by the 3 large
companies. The smal l and medium companies earn
over 50% of the total and micro companies 9%. Of
the companies responding in 201 4, 64 also
responded in 201 2 which provides us with l ike-for-
l ike comparisons presented in the chart below.
The l ike for l ike figures are indicating a growth rate
of 1 0.8% which is higher than that for the total
revenues (7.6%) over the 2 year period.
Like for like revenue figures
This may be statistical variation or it could be that
companies which responded for a second time
were those which had performed better than those
which did not.
We have also calculated the average rate of growth
over the 5 year period ending in the year as shown.
Hence, in 201 1 , the rate of growth for al l companies
from 2007-201 1 was around 1 0%. This also shows
the growth rate fal l ing since 201 2 with the biggest
impact on the larger companies - but the rate has
fal len in al l classes.
5 year revenue growth rates
The 5 year revenue growth rate is lower over the
last 2 years than over the previous 8 years which
supports that there may be a slowing down. This
could be seen as at odds with the optimism index
which suggests companies are foreseeing higher
growth over the next 1 2 months but maybe reflects
that companies consider that after a few more
difficult years, they see better prospects for 201 5
and 201 6. This is something that we shal l watch
next time we repeat the survey.
What about company profitabil ity? 1 1 9 companies
were wil l ing to provide this sensitive information
with their revenue corresponding to 33% of the
total population. We estimate the mean level of
profitabil ity for the sector to be between 9% and
1 5% (8% in 201 2).
Profitability ranges
In conclusion, some major variations exist amongst
the companies and especial ly between those of
different sizes. Large and medium companies
account for 60% of revenues.
"The total revenuesfor the EO Servicessector in 201 4 was
€91 0m (201 2:€786m) and is
growing at a rate ofaround 7.6% p.a."
7 eoSERVICESindustry © EARSC
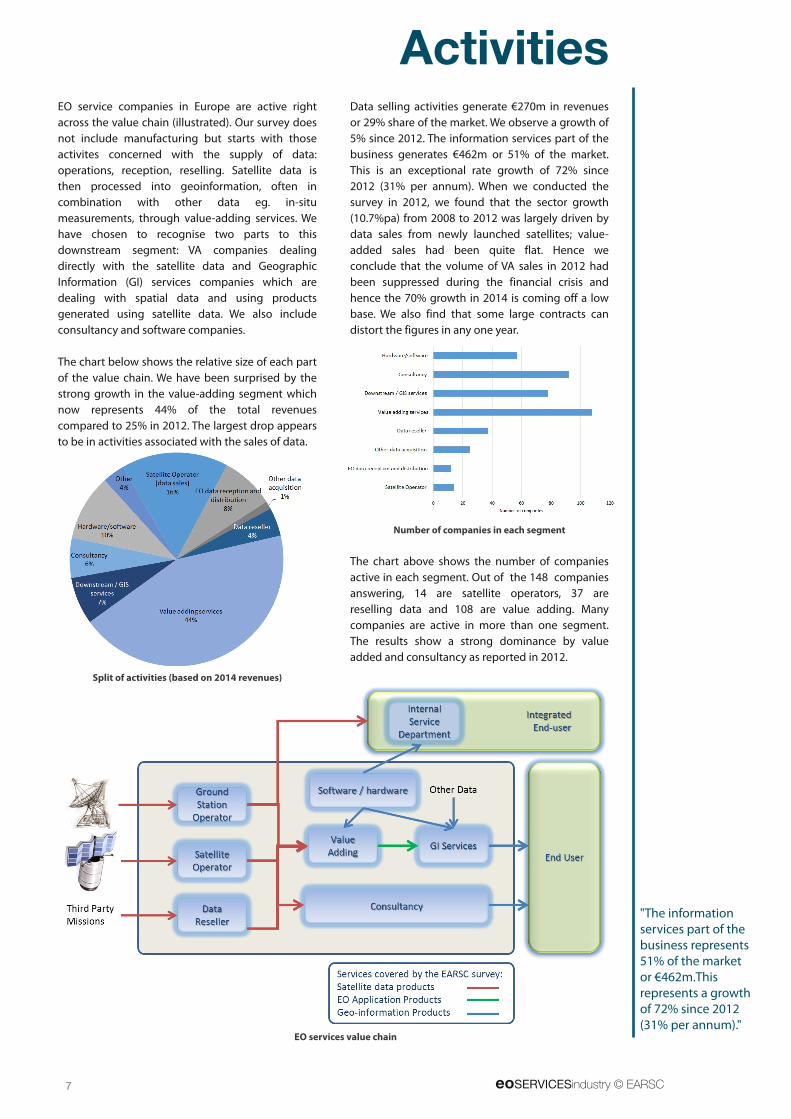
ActivitiesEO service companies in Europe are active right
across the value chain (i l lustrated). Our survey does
not include manufacturing but starts with those
activites concerned with the supply of data:
operations, reception, resel l ing. Satel l ite data is
then processed into geoinformation, often in
combination with other data eg. in-situ
measurements, through value-adding services. We
have chosen to recognise two parts to this
downstream segment: VA companies deal ing
directly with the satel l ite data and Geographic
Information (GI) services companies which are
deal ing with spatial data and using products
generated using satel l ite data. We also include
consultancy and software companies.
The chart below shows the relative size of each part
of the value chain. We have been surprised by the
strong growth in the value-adding segment which
now represents 44% of the total revenues
compared to 25% in 201 2. The largest drop appears
to be in activities associated with the sales of data.
Split of activities (based on 201 4 revenues)
Data sel l ing activities generate €270m in revenues
or 29% share of the market. We observe a growth of
5% since 201 2. The information services part of the
business generates €462m or 51 % of the market.
This is an exceptional rate growth of 72% since
201 2 (31 % per annum). When we conducted the
survey in 201 2, we found that the sector growth
(1 0.7%pa) from 2008 to 201 2 was largely driven by
data sales from newly launched satel l ites; value-
added sales had been quite flat. Hence we
conclude that the volume of VA sales in 201 2 had
been suppressed during the financial crisis and
hence the 70% growth in 201 4 is coming off a low
base. We also find that some large contracts can
distort the figures in any one year.
Number of companies in each segment
The chart above shows the number of companies
active in each segment. Out of the 1 48 companies
answering, 1 4 are satel l ite operators, 37 are
resel l ing data and 1 08 are value adding. Many
companies are active in more than one segment.
The results show a strong dominance by value
added and consultancy as reported in 201 2.
EO services value chain
"The informationservices part of thebusiness represents51 % of the marketor €462m.Thisrepresents a growthof 72% since 201 2(31 % per annum)."

eoSERVICESindustry © EARSC 8
CopernicusCopernicus is European flagship programme to
provide geospatial information to policy makers. I t
has the potential to make a strong impact on the
market for EO services with a goal to del iver
economic growth and jobs. This survey has been
conducted before Copernicus has become
operational and whilst some revenues wil l be
l inked to it, in the main it is too early to have a big
impact. Hence it provides reference numbers for
comparison with future surveys.
For the next survey, provisional ly in 2 years time
(201 6), we should start to see some impact in value
added sales whilst we shal l be watching for any
impact on the sales of commercial data (since
Sentinel data wil l be available for free). We can also
expect to see an increase in revenues derived from
using the (free) Sentinel data. In 201 4, the value-
added revenue from using Sentinel-l ike data was
rather low; 4% from optical and 4% from radar (see
the 3rd chart on page 1 2).
With the launch of Sentinel 1 A in April 201 4, the
program has entered into its operational phase.
Copernicus provides geo-information services to
EU policy makers and provides a strong
opportunity as market driver for EO-based services.
I t can only be real ised through ful l involvement of
the private sector.
Industry is optimistic about this. Whilst they rate
the current impact of Copernicus on their business
as being 1 .1 6 (on a scale of -5 to +5), the future
impact is given a rating of 3.1 4. The survey was
taken at the time when Sentinel 1 had just been
launched and before Sentinel 2 was in orbit and the
Copernicus Services are only starting in 201 5.
Hence the figures take no account of any influence
of actual Copernicus data which is only built into
the expectations.
Present and Future impact of Copernicus
We asked the companies if they were presently
participating to the supply of the pre-operational
Copernicus Services which are grouped into 6
specific categories . 36 companies out of 1 25
respondents are involved. Their involvement in the
different services is presented below. We can see
that land service is where industry is the most
involved. Only one company participates to the
supply of the Atmosphere service. The industry is
sti l l concerned to be adequately involved in the
supply of the Copernicus Services in the face of
public sector bodies.
Companies participating to the supply of Copernicus
Services
We also asked the companies the percentage of
their revenue coming from Copernicus Services
provision. I f we take the percentages given and
weight them according to the revenue of each
company, we obtain a figure of 3% of the total
industry revenue coming from Copernicus.
Then, companies were asked which of these
services is of most interest for their business. As
shown on the chart, unsurprisingly, land is sti l l the
service with most interest for the private sector but
we note a strong future interest in al l the services.
This reflects the degree to which each is open to
private business. Cl imate and atmosphere are
topics dominated by public sector bodies but
industry is ready to get involved in the next few
years which is encouraging.
Companies interest in Copernicus Services
As Copernicus can impact businesses and the
market in several ways, we wanted to know the
aspects of Copernicus l ikely to be exploited by
industry. When asked which aspect of Copernicus
they thought would benefit them most, access to
Sentinel data is the most cited both now and in the
future. In addition, interest in other aspects such as
European funding for the programme is increasing
as awareness is growing.
"land is sti l l theservice with mostinterest for the
private sector butwe note a strong
future interest in al lthe services."
9 eoSERVICESindustry © EARSC
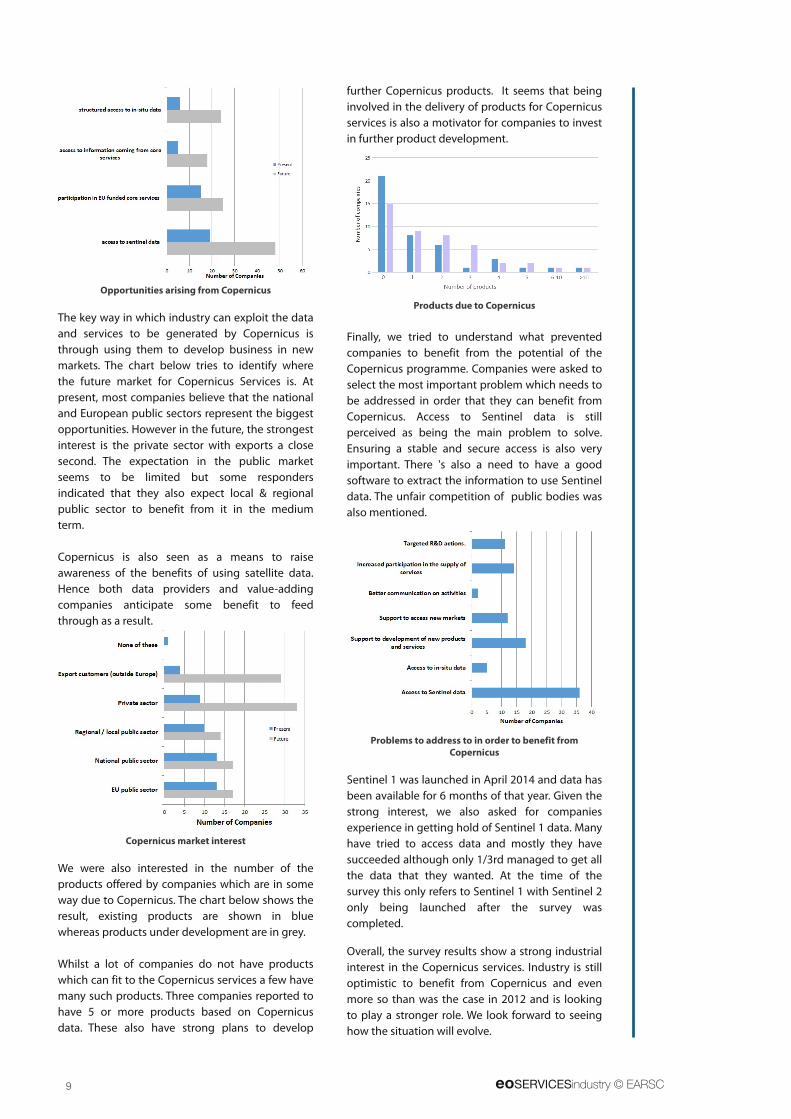
Opportunities arising from Copernicus
The key way in which industry can exploit the data
and services to be generated by Copernicus is
through using them to develop business in new
markets. The chart below tries to identify where
the future market for Copernicus Services is. At
present, most companies bel ieve that the national
and European public sectors represent the biggest
opportunities. However in the future, the strongest
interest is the private sector with exports a close
second. The expectation in the public market
seems to be l imited but some responders
indicated that they also expect local & regional
publ ic sector to benefit from it in the medium
term.
Copernicus is also seen as a means to raise
awareness of the benefits of using satel l ite data.
Hence both data providers and value-adding
companies anticipate some benefit to feed
through as a result.
Copernicus market interest
We were also interested in the number of the
products offered by companies which are in some
way due to Copernicus. The chart below shows the
result, existing products are shown in blue
whereas products under development are in grey.
Whilst a lot of companies do not have products
which can fit to the Copernicus services a few have
many such products. Three companies reported to
have 5 or more products based on Copernicus
data. These also have strong plans to develop
further Copernicus products. I t seems that being
involved in the del ivery of products for Copernicus
services is also a motivator for companies to invest
in further product development.
Products due to Copernicus
Final ly, we tried to understand what prevented
companies to benefit from the potential of the
Copernicus programme. Companies were asked to
select the most important problem which needs to
be addressed in order that they can benefit from
Copernicus. Access to Sentinel data is sti l l
perceived as being the main problem to solve.
Ensuring a stable and secure access is also very
important. There 's also a need to have a good
software to extract the information to use Sentinel
data. The unfair competition of public bodies was
also mentioned.
Problems to address to in order to benefit from
Copernicus
Sentinel 1 was launched in April 201 4 and data has
been available for 6 months of that year. Given the
strong interest, we also asked for companies
experience in getting hold of Sentinel 1 data. Many
have tried to access data and mostly they have
succeeded although only 1 /3rd managed to get al l
the data that they wanted. At the time of the
survey this only refers to Sentinel 1 with Sentinel 2
only being launched after the survey was
completed.
Overal l , the survey results show a strong industrial
interest in the Copernicus services. Industry is sti l l
optimistic to benefit from Copernicus and even
more so than was the case in 201 2 and is looking
to play a stronger role. We look forward to seeing
how the situation wil l evolve.
eoSERVICESindustry © EARSC 10
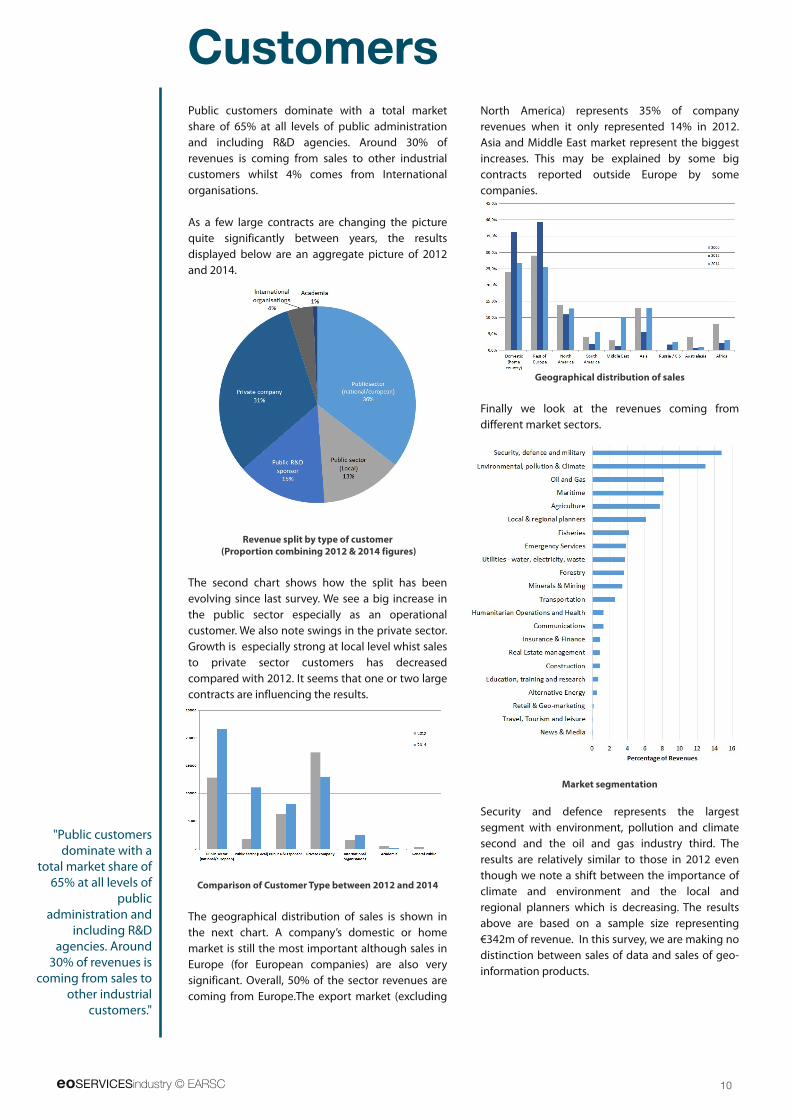
Public customers dominate with a total market
share of 65% at al l levels of public administration
and including R&D agencies. Around 30% of
revenues is coming from sales to other industrial
customers whilst 4% comes from International
organisations.
As a few large contracts are changing the picture
quite significantly between years, the results
displayed below are an aggregate picture of 201 2
and 201 4.
Revenue split by type of customer
(Proportion combining 201 2 & 201 4 figures)
The second chart shows how the spl it has been
evolving since last survey. We see a big increase in
the public sector especial ly as an operational
customer. We also note swings in the private sector.
Growth is especial ly strong at local level whist sales
to private sector customers has decreased
compared with 201 2. I t seems that one or two large
contracts are influencing the results.
Comparison of Customer Type between 201 2 and 201 4
The geographical distribution of sales is shown in
the next chart. A company’s domestic or home
market is sti l l the most important although sales in
Europe (for European companies) are also very
significant. Overal l , 50% of the sector revenues are
coming from Europe.The export market (excluding
North America) represents 35% of company
revenues when it only represented 1 4% in 201 2.
Asia and Middle East market represent the biggest
increases. This may be explained by some big
contracts reported outside Europe by some
companies.
Geographical distribution of sales
Final ly we look at the revenues coming from
different market sectors.
Market segmentation
Security and defence represents the largest
segment with environment, pol lution and cl imate
second and the oil and gas industry third. The
results are relatively similar to those in 201 2 even
though we note a shift between the importance of
cl imate and environment and the local and
regional planners which is decreasing. The results
above are based on a sample size representing
€342m of revenue. In this survey, we are making no
distinction between sales of data and sales of geo-
information products.
Customers
"Publ ic customersdominate with a
total market share of65% at al l levels of
publicadministration and
including R&Dagencies. Around30% of revenues is
coming from sales toother industrial
customers."
11 eoSERVICESindustry © EARSC
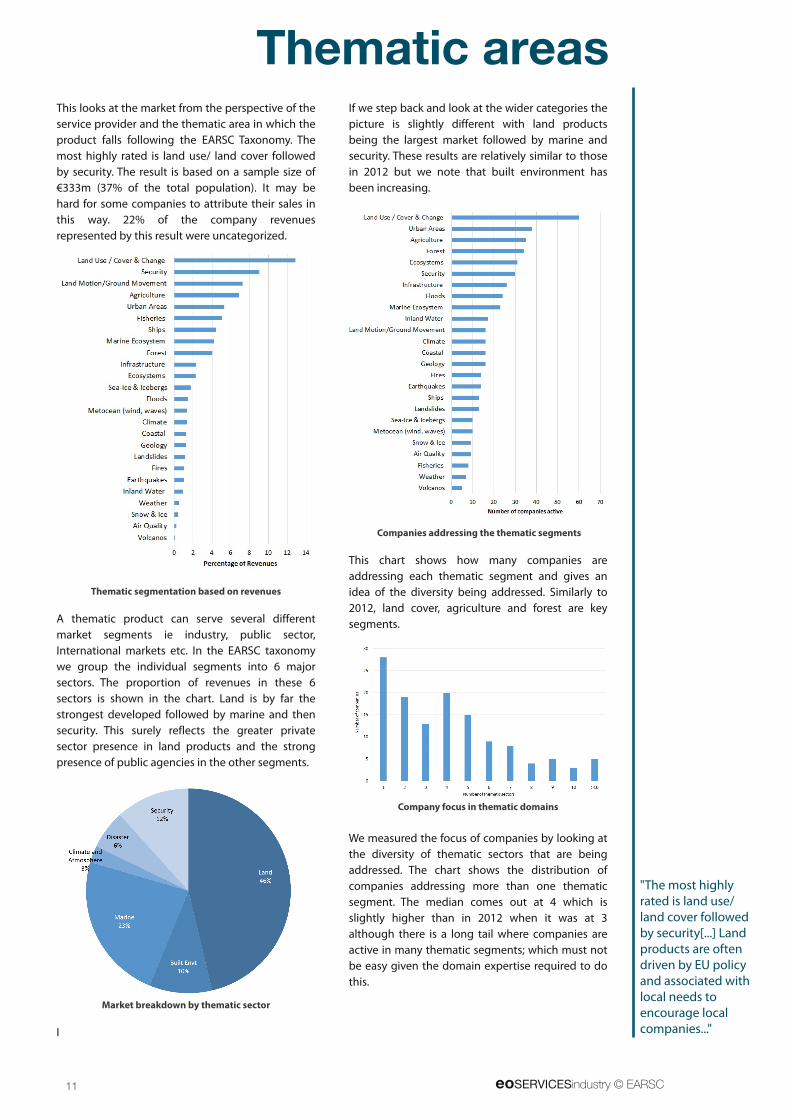
Thematic areasThis looks at the market from the perspective of the
service provider and the thematic area in which the
product fal ls fol lowing the EARSC Taxonomy. The
most highly rated is land use/ land cover fol lowed
by security. The result is based on a sample size of
€333m (37% of the total population). I t may be
hard for some companies to attribute their sales in
this way. 22% of the company revenues
represented by this result were uncategorized.
Thematic segmentation based on revenues
A thematic product can serve several different
market segments ie industry, publ ic sector,
International markets etc. In the EARSC taxonomy
we group the individual segments into 6 major
sectors. The proportion of revenues in these 6
sectors is shown in the chart. Land is by far the
strongest developed fol lowed by marine and then
security. This surely reflects the greater private
sector presence in land products and the strong
presence of public agencies in the other segments.
Market breakdown by thematic sector
I
I f we step back and look at the wider categories the
picture is sl ightly different with land products
being the largest market fol lowed by marine and
security. These results are relatively similar to those
in 201 2 but we note that built environment has
been increasing.
Companies addressing the thematic segments
This chart shows how many companies are
addressing each thematic segment and gives an
idea of the diversity being addressed. Similarly to
201 2, land cover, agriculture and forest are key
segments.
Company focus in thematic domains
We measured the focus of companies by looking at
the diversity of thematic sectors that are being
addressed. The chart shows the distribution of
companies addressing more than one thematic
segment. The median comes out at 4 which is
sl ightly higher than in 201 2 when it was at 3
although there is a long tail where companies are
active in many thematic segments; which must not
be easy given the domain expertise required to do
this.
"The most highlyrated is land use/land cover fol lowedby security[...] Landproducts are oftendriven by EU policyand associated withlocal needs toencourage localcompanies..."
eoSERVICESindustry © EARSC 12
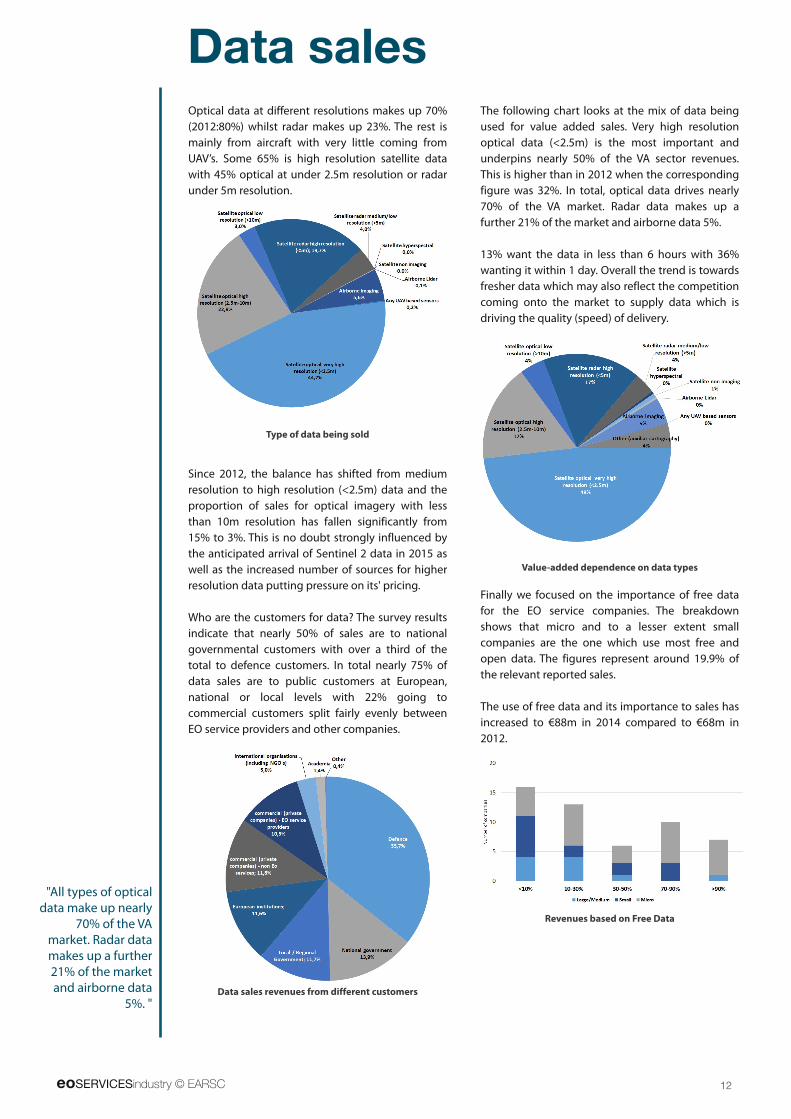
Optical data at different resolutions makes up 70%
(201 2:80%) whilst radar makes up 23%. The rest is
mainly from aircraft with very l ittle coming from
UAV’s. Some 65% is high resolution satel l ite data
with 45% optical at under 2.5m resolution or radar
under 5m resolution.
Type of data being sold
Since 201 2, the balance has shifted from medium
resolution to high resolution (<2.5m) data and the
proportion of sales for optical imagery with less
than 1 0m resolution has fal len significantly from
1 5% to 3%. This is no doubt strongly influenced by
the anticipated arrival of Sentinel 2 data in 201 5 as
wel l as the increased number of sources for higher
resolution data putting pressure on its' pricing.
Who are the customers for data? The survey results
indicate that nearly 50% of sales are to national
governmental customers with over a third of the
total to defence customers. In total nearly 75% of
data sales are to public customers at European,
national or local levels with 22% going to
commercial customers spl it fairly evenly between
EO service providers and other companies.
Data sales revenues from different customers
The fol lowing chart looks at the mix of data being
used for value added sales. Very high resolution
optical data (<2.5m) is the most important and
underpins nearly 50% of the VA sector revenues.
This is higher than in 201 2 when the corresponding
figure was 32%. In total, optical data drives nearly
70% of the VA market. Radar data makes up a
further 21 % of the market and airborne data 5%.
1 3% want the data in less than 6 hours with 36%
wanting it within 1 day. Overal l the trend is towards
fresher data which may also reflect the competition
coming onto the market to supply data which is
driving the qual ity (speed) of del ivery.
Value-added dependence on data types
Final ly we focused on the importance of free data
for the EO service companies. The breakdown
shows that micro and to a lesser extent smal l
companies are the one which use most free and
open data. The figures represent around 1 9.9% of
the relevant reported sales.
The use of free data and its importance to sales has
increased to €88m in 201 4 compared to €68m in
201 2.
Revenues based on Free Data
Data sales
"Al l types of opticaldata make up nearly
70% of the VAmarket. Radar datamakes up a further21 % of the marketand airborne data
5%. "
13 eoSERVICESindustry © EARSC
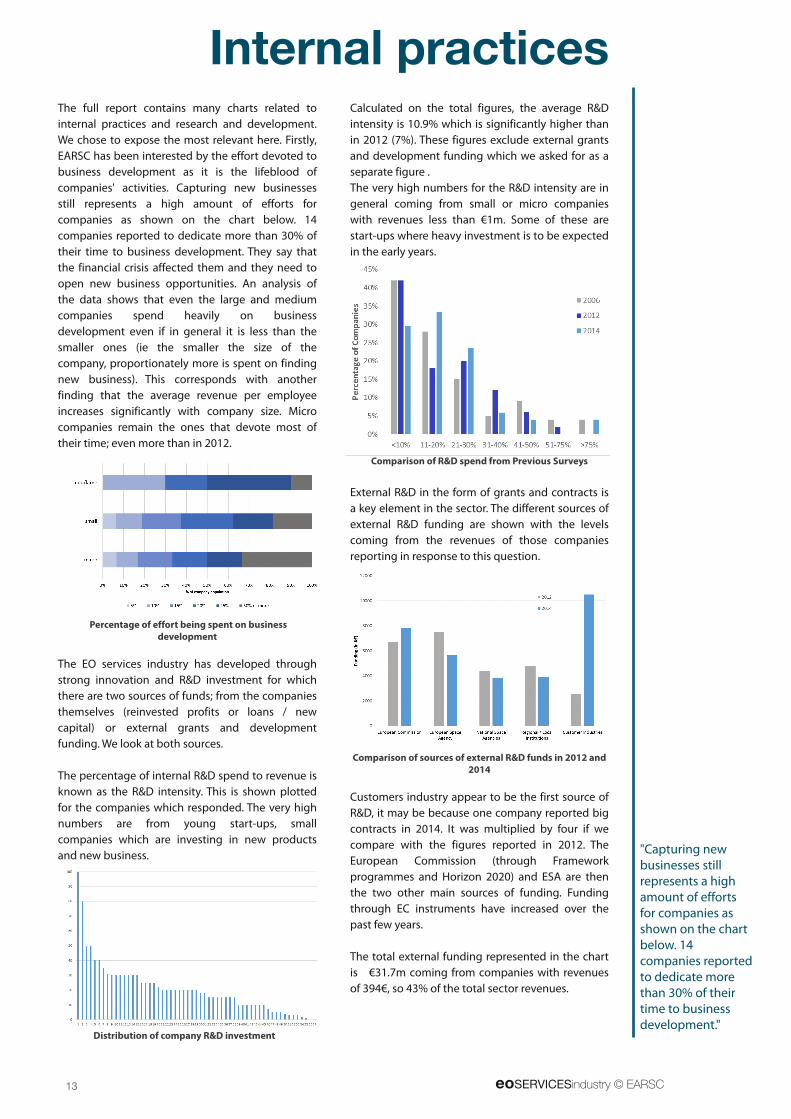
The ful l report contains many charts related to
internal practices and research and development.
We chose to expose the most relevant here. Firstly,
EARSC has been interested by the effort devoted to
business development as it is the l ifeblood of
companies' activities. Capturing new businesses
sti l l represents a high amount of efforts for
companies as shown on the chart below. 1 4
companies reported to dedicate more than 30% of
their time to business development. They say that
the financial crisis affected them and they need to
open new business opportunities. An analysis of
the data shows that even the large and medium
companies spend heavily on business
development even if in general it is less than the
smal ler ones (ie the smal ler the size of the
company, proportionately more is spent on finding
new business). This corresponds with another
finding that the average revenue per employee
increases significantly with company size. Micro
companies remain the ones that devote most of
their time; even more than in 201 2.
Percentage of effort being spent on business
development
The EO services industry has developed through
strong innovation and R&D investment for which
there are two sources of funds; from the companies
themselves (reinvested profits or loans / new
capital ) or external grants and development
funding. We look at both sources.
The percentage of internal R&D spend to revenue is
known as the R&D intensity. This is shown plotted
for the companies which responded. The very high
numbers are from young start-ups, smal l
companies which are investing in new products
and new business.
Distribution of company R&D investment
Calculated on the total figures, the average R&D
intensity is 1 0.9% which is significantly higher than
in 201 2 (7%). These figures exclude external grants
and development funding which we asked for as a
separate figure .
The very high numbers for the R&D intensity are in
general coming from small or micro companies
with revenues less than €1 m. Some of these are
start-ups where heavy investment is to be expected
in the early years.
Comparison of R&D spend from Previous Surveys
External R&D in the form of grants and contracts is
a key element in the sector. The different sources of
external R&D funding are shown with the levels
coming from the revenues of those companies
reporting in response to this question.
Comparison of sources of external R&D funds in 201 2 and
201 4
Customers industry appear to be the first source of
R&D, it may be because one company reported big
contracts in 201 4. I t was multipl ied by four if we
compare with the figures reported in 201 2. The
European Commission (through Framework
programmes and Horizon 2020) and ESA are then
the two other main sources of funding. Funding
through EC instruments have increased over the
past few years.
The total external funding represented in the chart
is €31 .7m coming from companies with revenues
of 394€, so 43% of the total sector revenues.
Internal practices
"Capturing newbusinesses sti l lrepresents a highamount of effortsfor companies asshown on the chartbelow. 1 4companies reportedto dedicate morethan 30% of theirtime to businessdevelopment."
eoSERVICESindustry © EARSC 14
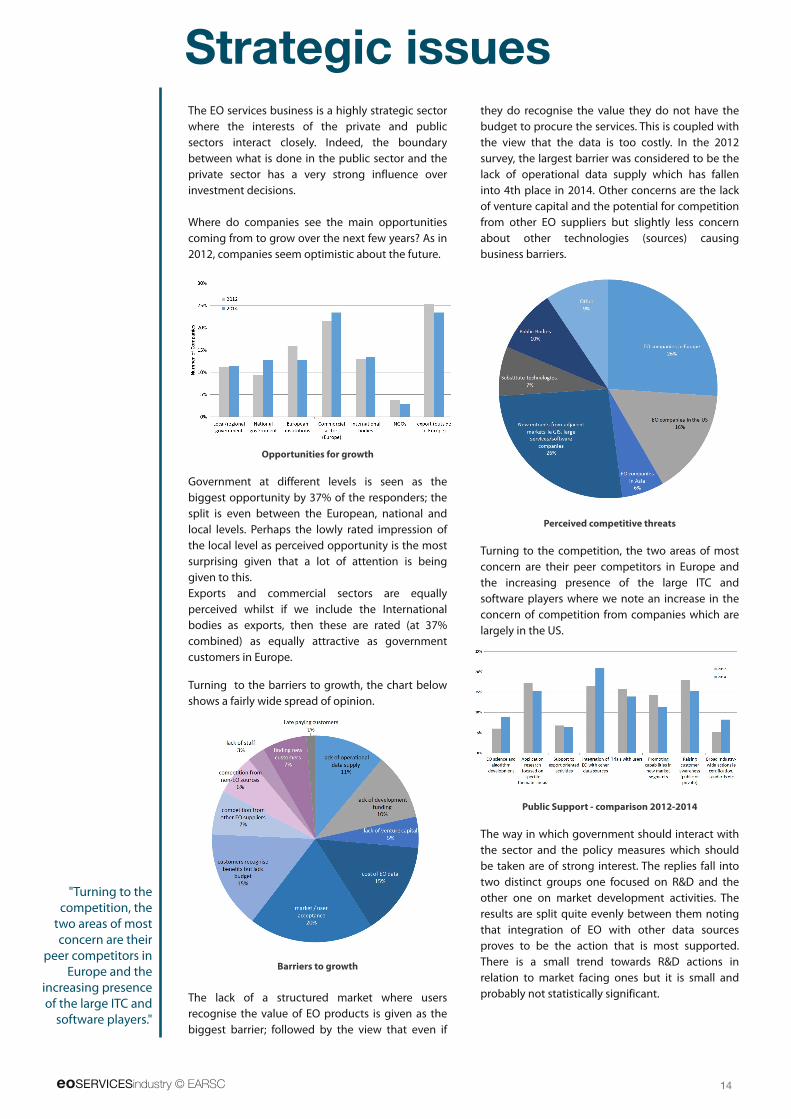
The EO services business is a highly strategic sector
where the interests of the private and public
sectors interact closely. Indeed, the boundary
between what is done in the public sector and the
private sector has a very strong influence over
investment decisions.
Where do companies see the main opportunities
coming from to grow over the next few years? As in
201 2, companies seem optimistic about the future.
Opportunities for growth
Government at different levels is seen as the
biggest opportunity by 37% of the responders; the
spl it is even between the European, national and
local levels. Perhaps the lowly rated impression of
the local level as perceived opportunity is the most
surprising given that a lot of attention is being
given to this.
Exports and commercial sectors are equal ly
perceived whilst if we include the International
bodies as exports, then these are rated (at 37%
combined) as equal ly attractive as government
customers in Europe.
Turning to the barriers to growth, the chart below
shows a fairly wide spread of opinion.
Barriers to growth
The lack of a structured market where users
recognise the value of EO products is given as the
biggest barrier; fol lowed by the view that even if
they do recognise the value they do not have the
budget to procure the services. This is coupled with
the view that the data is too costly. In the 201 2
survey, the largest barrier was considered to be the
lack of operational data supply which has fal len
into 4th place in 201 4. Other concerns are the lack
of venture capital and the potential for competition
from other EO suppliers but sl ightly less concern
about other technologies (sources) causing
business barriers.
Perceived competitive threats
Turning to the competition, the two areas of most
concern are their peer competitors in Europe and
the increasing presence of the large ITC and
software players where we note an increase in the
concern of competition from companies which are
largely in the US.
Public Support - comparison 201 2-201 4
The way in which government should interact with
the sector and the policy measures which should
be taken are of strong interest. The repl ies fal l into
two distinct groups one focused on R&D and the
other one on market development activities. The
results are spl it quite evenly between them noting
that integration of EO with other data sources
proves to be the action that is most supported.
There is a smal l trend towards R&D actions in
relation to market facing ones but it is smal l and
probably not statistical ly significant.
Strategic issues
"Turning to thecompetition, thetwo areas of mostconcern are their
peer competitors inEurope and the
increasing presenceof the large ITC andsoftware players."
15 eoSERVICESindustry © EARSC
The future
Glossary
This 2nd survey both re-enforces the results from the 1 st and starts to establ ish some trends which we shal l
regard closely in the future. I t comes at a critical time for the industry with major shifts in the satel l ite
operators, the entry of large IT players into the sector and the start
of the European Copernicus programme. In particular it provides
further reference for future analysis regarding the impact of the
Copernicus programme on the downstream industry. We plan to
repeat our survey in 201 6, ie to be launched at the end of 201 6
with results available in 201 7. We aim at maintaining a view of the
trend of the industry.
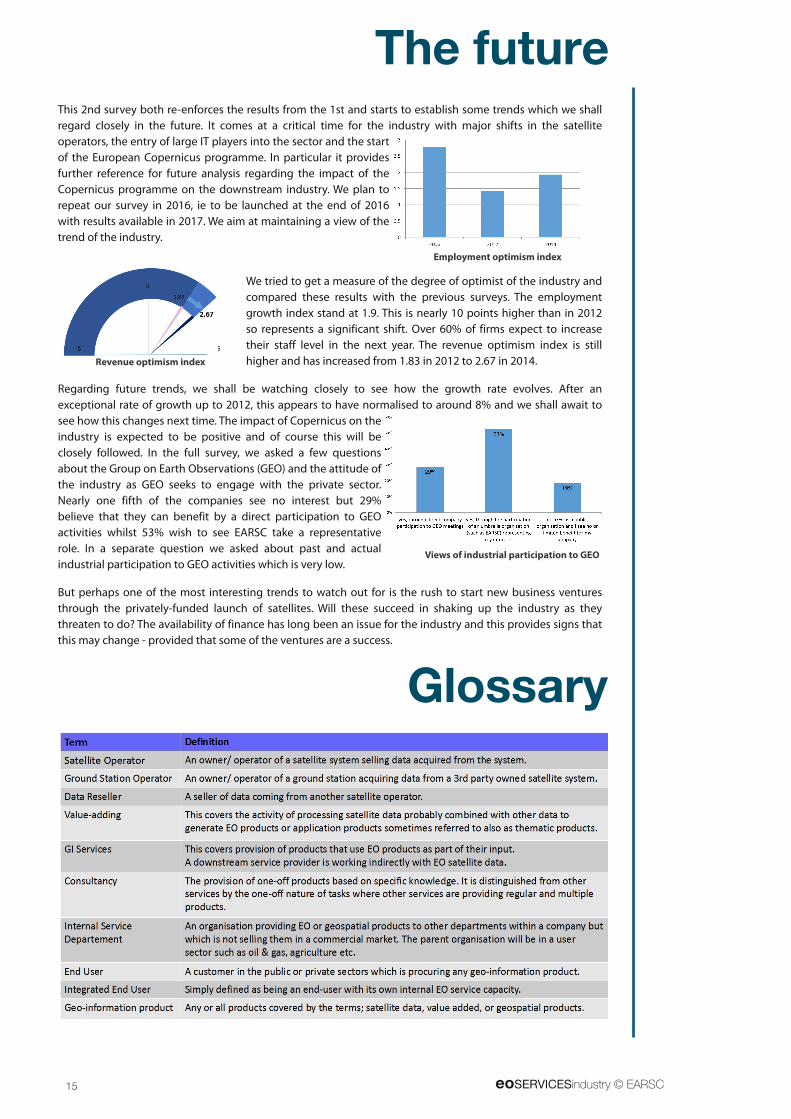
We tried to get a measure of the degree of optimist of the industry and
compared these results with the previous surveys. The employment
growth index stand at 1 .9. This is nearly 1 0 points higher than in 201 2
so represents a significant shift. Over 60% of firms expect to increase
their staff level in the next year. The revenue optimism index is sti l l
higher and has increased from 1 .83 in 201 2 to 2.67 in 201 4.
Regarding future trends, we shal l be watching closely to see how the growth rate evolves. After an
exceptional rate of growth up to 201 2, this appears to have normalised to around 8% and we shal l await to
see how this changes next time. The impact of Copernicus on the
industry is expected to be positive and of course this wil l be
closely fol lowed. In the ful l survey, we asked a few questions
about the Group on Earth Observations (GEO) and the attitude of
the industry as GEO seeks to engage with the private sector.
Nearly one fifth of the companies see no interest but 29%
believe that they can benefit by a direct participation to GEO
activities whilst 53% wish to see EARSC take a representative
role. In a separate question we asked about past and actual
industrial participation to GEO activities which is very low.
But perhaps one of the most interesting trends to watch out for is the rush to start new business ventures
through the privately-funded launch of satel l ites. Wil l these succeed in shaking up the industry as they
threaten to do? The availabil ity of finance has long been an issue for the industry and this provides signs that
this may change - provided that some of the ventures are a success.
Employment optimism index
Revenue optimism index
Views of industrial participation to GEO
EARSC is a non-profit-making organisation created in 1 989 with the mission to foster the development of European Geo-
Information Service Industry. Our main objective is to stimulate a sustainable market for geo-information services using
EO data. EARSC has 75 members from more than 22 European countries and is a recognised association both in Europe
and worlwide.
EARSC represents the European providers of geo-information services creating a network between industry, decision-
makers and users. We consider that the market is at a crucial stage of development as Earth observation becomes more
frequently used by society and adds positive value to our daily l ives. Nevertheless, there are many issues, opportunities
and threats facing industrial actors. Supported by a smal l secretariat, EARSC informs and involves its members through its
website and newsletters, through the provision of web-tools, as wel l as organizing events.
EARSC provides tools for its members to promote themselves and their services. As wel l as the EARSC web-site
(www.earsc.org), we run a portal (www.earsc-portal.eu) which promotes l inks between EARSC members and other
Communities such as the Oil & Gas industry, and a brokerage site (www.eopages.eu) for customers to find the services
which they require and which companies can provide them with a solution.
European Association of Remote Sensing Companies26, Rue Beranger
1 1 90, Brussels, [email protected]
www.earsc.org | www.eopages.eu | www.eomag.eu
Related Documents