Environmental report 2018

Welcome message from author
This document is posted to help you gain knowledge. Please leave a comment to let me know what you think about it! Share it to your friends and learn new things together.
Transcript

Environmental report2018

1
Contents
1.Report profile and Commitment ……………… P3
・Editorial Policies………………………………………………… P4
・Environmental Division Manager Commitment ………… P7
・Kansai Electric Power Group Environmental Action Policy
………………………………………………P8
・Eco Action…………………………………………………………P9
2.Initiatives contributing to the realization of a
low-carbon society……………………………………P11
・Lowering electric power’s carbon intensity………………P14
・Technological developments for constructing the Smart Grid
…………………………………………… P22
・Contributing to energy conservation, cost reductions and
CO2 emissions reductions for customers and society
…………………………………………… P24
・Overseas activities…………………………………………… P29
・Technical development efforts…………………………… P33
・Value chain efforts…………………………………………… P35
・Efforts to reduce other greenhouse gases in addition to CO2
…………………………………………… P36
3.Initiatives contributing to the realization of a
recycling-oriented society…………………………P37
・Promotion of proactive 3R efforts aimed at zero
emission………………………………………………………… P39
・Promoting sate, reliable, and complete disposal of PCB
wastes…………………………………………………………… P43
・Promoting green procurement………………………………P45
2
4.Promotion of environmental protection in local
communities……………………………………………………… P46
・Measures to prevent air and water pollution, etc…………P49
・Efforts to strictly manage and reduce toxic chemicals… P54
・Considering the preservation of biodiversity……………… P56
・Initiatives of the Kansai Electric Power Group …………… P61
5.Promoting environmental management and
environmental communication………………… P62
・Continuous improvement using environmental management
systems based on ISO 14001 systems and strict adherence to
laws and regulations…………………………………………… P63
・Active advancement of environmental awareness raising
activities with local communities and customers and disclosure
of environmental information………………………………… P66
<Data>………………………………………………………………P68
・Status overview of our business activities and
environmental load……………………………………………… P69
・Environmental accounting………………………………………P71
・Environmental Data …………………………………………… P75
・Environmental protection records at thermal power plants
…………………………………………… P81
Contents

3
1. Report profile and Commitment
・Editorial Policies
・Environmental Division Manager Commitment
・Kansai Electric Power Group Environmental Action Policy
・Eco Action

41.Report profile and Commitment
Editorial Policies
For the contents of the report which related to the environment, we referred to the Environmental Reporting Guidelines (Fiscal 2012 edition) published by the Ministry of the Environment. In addition, we have provided information for the disclosure items by industry of GRI Sustainability Reporting Standards 2016 and the GRI Sustainability Reporting Guidelines (G4).
○Period covered
April 1, 2017 ー March 31, 2018
Note: Some plans for future effort are also covered.
○Data covered
Environmental aspects
(Economic and social aspects are covered in the Kansai Electric Power Group Report 2018)
○Companies covered
The Kansai Electric Power Co., Inc., and Kansai Electric Power Group companies.
“The Company” refers to the Kansai Electric Power Co., Inc., the names of the various Group companies are clearly stated in the relevant text.
○Reference guidelinesEnvironmental Reporting Guidelines (Fiscal 2012 edition) published by the Ministry of the EnvironmentGRI Sustainability Reporting Standards 2016GRI Sustainability Reporting Guidelines (G4)

51.Report profile and Commitment
(1)Specific data of environmental impact including electricity consumption in an office is grasped and reported in this report
⇒ 96.0%
<Explanation>It represents the ration of companies that are performing Eco-
Action among 69 consolidated subsidiaries (ratio of sales).
・<Calculation Method>
*Eco-ActionIt is the environmental action plan including the reducing office electricity consumption and office water consumption
■Capture ratio of Kansai Electric Power and its 69 consolidated subsidiaries (as of the end of March 2018)
(Sales of Kansai Electric Power in FY 2017)+
(Sales of 41 consolidated subsidiaries in FY 2017 that are performing Eco-Action as of the end of March 2018)
(Sales of Kansai Electric Power in FY 2017 )+
(sales of 69 consolidated subsidiaries in FY 2017)
Editorial Policies
61.Report profile and Commitment
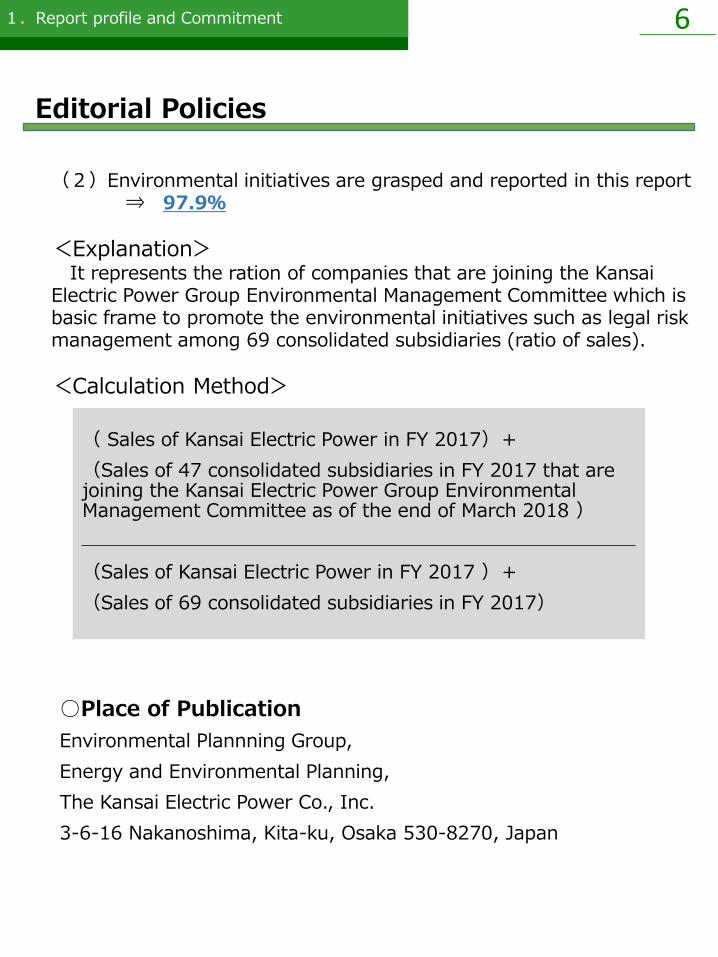
○Place of Publication
Environmental Plannning Group,
Energy and Environmental Planning,
The Kansai Electric Power Co., Inc.
3-6-16 Nakanoshima, Kita-ku, Osaka 530-8270, Japan
(2)Environmental initiatives are grasped and reported in this report⇒ 97.9%
<Explanation>It represents the ration of companies that are joining the Kansai
Electric Power Group Environmental Management Committee which is basic frame to promote the environmental initiatives such as legal risk management among 69 consolidated subsidiaries (ratio of sales).
<Calculation Method>
( Sales of Kansai Electric Power in FY 2017)+
(Sales of 47 consolidated subsidiaries in FY 2017 that are joining the Kansai Electric Power Group Environmental Management Committee as of the end of March 2018 )
(Sales of Kansai Electric Power in FY 2017 )+
(Sales of 69 consolidated subsidiaries in FY 2017)
Editorial Policies

71.Report profile and Commitment
Environmental Division Manager Commitment
Demands for environmental efforts increase, including the Paris Agreement, which is an international framework for greenhouse gases reductions from 2020 and beyond, and the Sustainable Development Goals (SDGs) for 2030. As a provider of energy services that are closely connected with the environment, our corporate group will proactively seek to resolve issues related to these demands.
The problem of global warming requires great carbon reduction over the long-term, so we will continue leading efforts to reduce carbon in the energy field. We are seeking to create a balanced composition of power sources by making efforts for utilization of nuclear power generation with the most emphasis on safety, the maintenance and improvement of the thermal efficiency of thermal power plants, and the development of renewable energies. In addition, we are advancing efforts on both supply and demand sides, including providing information and services that contribute to energy conservation, cost cutting and CO2 emissions reductions, as well as constructing the Smart Grid.
Toward the realization of a recycling-oriented society, we will continue steadily making efforts, for example, to achieve a goal of zero emissions and to process the entire amount of polychlorinated biphenyl (PCB) waste within the legal time limit. Moreover, we will keep seeking to enhance environmental communication with our customers and local communities, which should lead to earning more of their trust.
Yutaka KawakamiGeneral Manager Office of Energy and Environmental Planning (Environmental Planning)
81.Report profile and Commitment
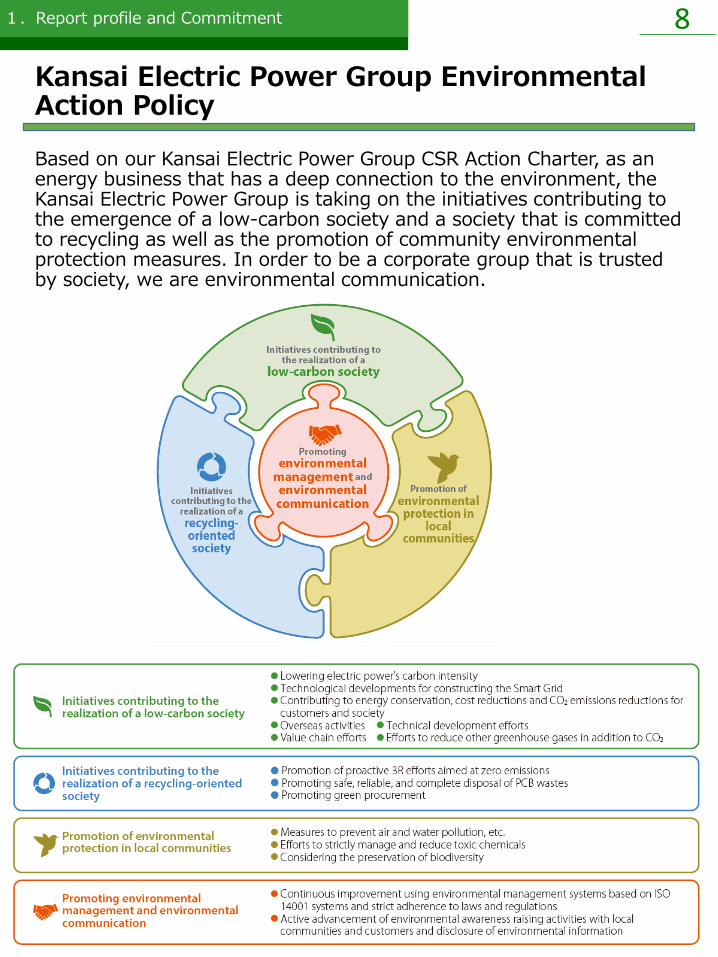
Kansai Electric Power Group Environmental Action Policy
Based on our Kansai Electric Power Group CSR Action Charter, as an energy business that has a deep connection to the environment, the Kansai Electric Power Group is taking on the initiatives contributing to the emergence of a low-carbon society and a society that is committed to recycling as well as the promotion of community environmental protection measures. In order to be a corporate group that is trusted by society, we are environmental communication.

91.Report profile and Commitment
Eco Action (annual targets and results)【 Kansai Electric Power Co., Inc., 】

101.Report profile and Commitment
Eco Action (annual targets and results)【 Goup companies】

11
2. Initiatives contributing to the realization of a low-carbon society
・Lowering electric power’s carbon intensity
・Technological developments for constructing the Smart Grid
・Contributing to energy conservation, cost reductions and CO2emissions reductions for customers and society
・Overseas activities
・Technical development efforts
・Value chain efforts
・Efforts to reduce other greenhouse gases in addition to CO2

2.Initiatives contributing to the realization ofa low-carbon society 12
Initiatives contributing to the realization of a low-carbon society
Our company joined the Electric Power Council for a Low Carbon Society, and the industry as a whole is seeking to achieve an emission factor of about 0.37 kg-CO2/kWh (user-end) by fiscal 2030.
We will continue the utilization of nuclear power generation with the most emphasis on safety, the maintenance and improvement of the thermal efficiency of thermal power plants, and the development of renewable energies. In addition, with a long-term perspective, we will contribute to the realization of a low carbon society by promoting electrification in society.
○Changes in CO2 emission factor, etc.
Our CO2 emission factor for fiscal 2017 was 0.418 kg- CO2 /kWh※ (after adjustment), and it was great improvement compared to the previous fiscal year. Main factors that we can give are our efforts toward carbon reduction through increased utilization rates for nuclear power, hydroelectric power and, at our Himeji No.2 Power Station, high-efficiency natural gas power generation facilities.
2.Initiatives contributing to the realization ofa low-carbon society 13
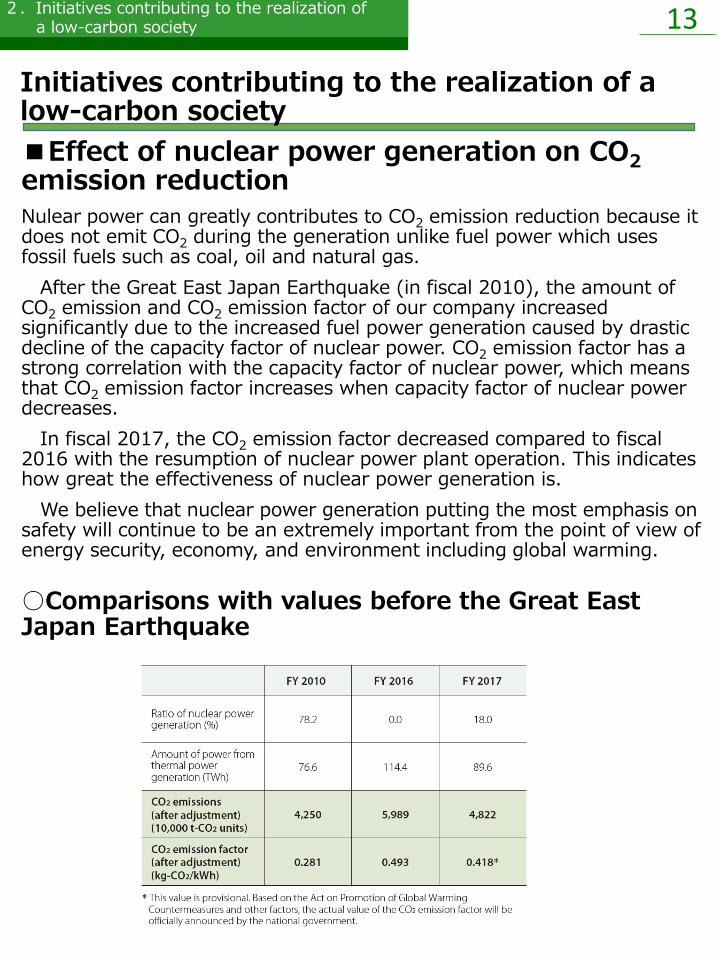
■Effect of nuclear power generation on CO2
emission reduction
Nulear power can greatly contributes to CO2 emission reduction because it does not emit CO2 during the generation unlike fuel power which uses fossil fuels such as coal, oil and natural gas.
After the Great East Japan Earthquake (in fiscal 2010), the amount of CO2 emission and CO2 emission factor of our company increased significantly due to the increased fuel power generation caused by drastic decline of the capacity factor of nuclear power. CO2 emission factor has a strong correlation with the capacity factor of nuclear power, which means that CO2 emission factor increases when capacity factor of nuclear power decreases.
In fiscal 2017, the CO2 emission factor decreased compared to fiscal 2016 with the resumption of nuclear power plant operation. This indicates how great the effectiveness of nuclear power generation is.
We believe that nuclear power generation putting the most emphasis on safety will continue to be an extremely important from the point of view of energy security, economy, and environment including global warming.
○Comparisons with values before the Great East Japan Earthquake
Initiatives contributing to the realization of a low-carbon society

2.Initiatives contributing to the realization ofa low-carbon society 14
We are working to reduce the carbon impacts of electricity that we provide to customers, starting with efforts for the operation of nuclear power plants with safety as the first priority. Our efforts also include the maintenance and improvement of the thermal efficiency of thermal power plants as well as the development and popularization of renewable energies.
■Nuclear power generation prioritizing safety
Since nuclear power generation emits no CO2, it is an important source of energy that prevents global warming. With understanding of residents of local communities, we continue the safe and stable operation of plants that have resumed operation and restart plants as soon as the safety is confirmed by appropriately responding to examinations of the Nuclear Regulation Authority. We will also keep independently and continuously promoting safety measures that exceed regulatory requirements.
Lowering electric power’s carbon intensity

2.Initiatives contributing to the realization ofa low-carbon society 15
■Maintaining and improving the thermal efficiency of thermal power plants and further increasing natural gas use
We continuously undertake measures related to facilities and operation, working to reduce the amount of fuel used and suppress the amount of CO2 emissions by maintaining and increasing thermal efficiency.
We undertook to convert the Himeji No. 2 Power Station, one of our largest natural gas-fired thermal power plants, to a combined-cycle power plant* with advanced 1,600°C class gas turbines. We are working to suppress the amount of CO2 emissions by increasing thermal efficiency to about 60%, which is the highest global standard, and reducing the amount of fuel used.
Moreover, at Units 1 and 3 of the Aioi Power Station, in addition to the heavy oil and crude oil we had been using thus far, we began using natural gas, which is less expensive and better for the environment. Unit 1 began in May and Unit 2 began in August 2016.
※Combined cycle power generation: Power is generated by using both gas turbines and steam turbines capturing exhaust heat from the gas turbine with high thermal efficiency.
Lowering electric power’s carbon intensity
2.Initiatives contributing to the realization ofa low-carbon society 16
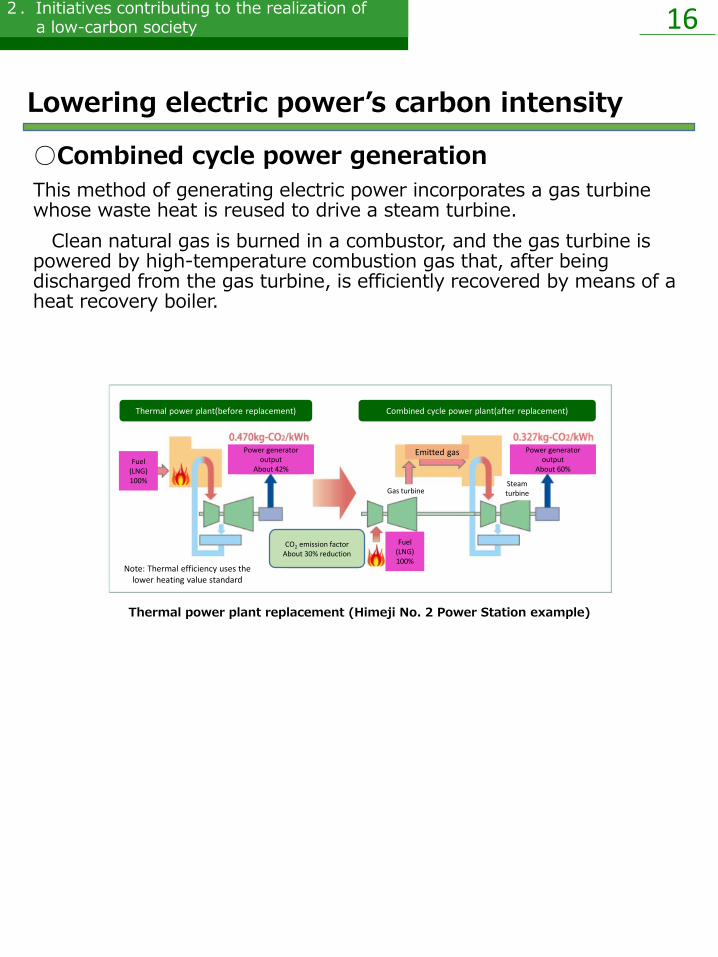
○Combined cycle power generation
This method of generating electric power incorporates a gas turbine whose waste heat is reused to drive a steam turbine.
Clean natural gas is burned in a combustor, and the gas turbine is powered by high-temperature combustion gas that, after being discharged from the gas turbine, is efficiently recovered by means of a heat recovery boiler.
Thermal power plant replacement (Himeji No. 2 Power Station example)
Thermal power plant(before replacement) Combined cycle power plant(after replacement)
Fuel(LNG)100%
Power generator output
About 42%
Fuel(LNG)100%
CO2 emission factorAbout 30% reduction
Gas turbineSteam turbine
Power generator output
About 60%
Emitted gas
Note: Thermal efficiency uses the lower heating value standard
Lowering electric power’s carbon intensity

2.Initiatives contributing to the realization ofa low-carbon society 17
■Development and promotion of renewable energy
Like nuclear power, renewable forms of energy such as hydropower, solar power, and wind power emit no CO2 when generating power, making them effective energy sources for preventing global warming. As a unified group, we are accelerating efforts toward the target of incorporating 500,000 kW of renewable energy in Japan by 2030.
We have been working to increase the output of existing hydropower plants and to develop power generation using renewable energy sources, including land-based wind, solar and biomass. As of March 2018, we had announced the start of operation for about 110,000 kW of generation capacity. We will continue to work for the development of diverse renewable energy sources, including offshore wind farms and geothermal power plants with a broad view that includes all of Japan as well as overseas locations.
On the other hand, solar and wind power generation are easily affected by the weather, and power generated in excess of demand can have an effect on the quality of electricity. Furthermore, power generation costs become high because energy densities and usage rates of power generation facilities are low. We are working to overcome these issues related to supply stability and generation costs and seeking to expand the utilization of renewable energy sources. We will continue advancing carbon intensity reduction for electricity further by utilizing various energy sources in a well-balanced manner.
Lowering electric power’s carbon intensity

2.Initiatives contributing to the realization ofa low-carbon society 18
・Ratio of renewable energy sources among power generated(amounts generated by our company in fiscal 2017)
Notes:Figures may not match due to rounding up.:Some unconfirmed imbalances are included.:Sending ends are included.:Generated power amounts reflect the compositionratio of our electricity output to demand.: Renewable energies include hydropower and new energies, for example (wind power, solar, geothermal, biomass and waste).
(12.9 TWh)Thermal power
72%
Nuclear power
14%
Renewable energies
15%
(67.8 TWh)
(13.8 TWh)
Lowering electric power’s carbon intensity

2.Initiatives contributing to the realization ofa low-carbon society 19
In December 2016, Kenes began operation of the Asago Biomass Power Plant (5,600 kW output) in Asago City, Hyogo Prefecture. This plant generates power using the biomass of domestic unused wood as a fuel. With the cooperation of the Hyogo Forest Public Service Corporation, the Hyogo Prefectural Federation of Forest Owners Cooperative Associations manufactures the fuel chips and Kenes generates power from these chips. This business scheme conducted with cooperation between government and private interests is the first of its kind in Japan.
In addition, we are planning the construction of a biomass power plant (75,000 kW output) that utilizes materials from overseas in order to advance a biomass power generation project in the town of Kanda in Miyako, Fukuoka. With the intention to start commercial operation in October 2021, we established Biopower Kanda LLC as
In June 2018, Kanden Energy Solution Co., Inc. (Kenes) began operation of the Ako Nishihama Solar Power Station (1,990 kW output) in Ako City, Hyogo Prefecture. Our corporate group has solar power generation plants in a total of ten locations. They effectively reduce CO2emissions by a total of about 27,000 tonnes per year.
In the city of Tahara, Aichi Prefecture, Kenes’ Tahara No. 4 Wind Power Station (6,000 kW [2,000 kW × 3 units]) has been in continuous operation since May 2014. Together with the Awaji Wind Power Station (12,000 kW), our Group operates wind power stations in two locations, which reduce our CO2 emissions by about 18,000 tonnes/year in total.
a new company on November 9, 2017 for the construction of this power plant.
The realization of this biomass project would indicate that our group has the second biomass-fired power plant and it would be our first biomass power plant outside the Kansai area.
Ako Nishihama Solar Power Station
Tahara No.4 WindPower Station
Asago Biomass Power Plant
・Solar power development
・Wind power development
・Development of biomass power generation
Lowering electric power’s carbon intensity

2.Initiatives contributing to the realization ofa low-carbon society 20
・CO2 reduction through the incorporation of adjustable speed pumped-storage hydropower
○Stable operation and functional enhancement of hydropower
Kurobegawa No. 2 Hydropower Plant
・Facility upgrades for hydropower plantsWe are systematically implementing equipment upgrades, such as water turbine and generator replacement, at existing hydropower plants. When performing these equipment upgrades, we will appropriately determine the best upgrade time frames. By using computerized analytic technologies, we will optimize the shape of the water turbines and other elements to suit each power plant location. This will allow us to replace older equipment with new equipment offering better power generation efficiency, and thus increase our power output.
At the Kurobegawa No. 2 Hydropower Plant in Kurobe City, Toyama Prefecture, we upgraded the facilities of water turbine
At the Okutataragi Hydropower Plant Units 1 and 2, we are introducing pumped-storage systems with variable speed capabilities. This system can respond to demand that fluctuates by small amounts when pumping water up. Doing this will enable us to reduce the operation of thermal power plants, which are responsible for frequency control. This technology has already been adopted at the Okawachi Hydropower Plant Units 3 and 4, which have the largest capacities in the world. Unit 4 began operation in December 1993 and Unit 3 in June 1995.
Hydropower is a purely domestic energy source with excellent supply stability and economic efficiency. In addition, it emits no CO2, making it an important energy source for preventing global warming. Kansai Electric Power will continue stable operation of our hydropower plants by carrying out appropriate maintenance, improving the output and efficiency at our existing facilities, promote adoption of an adjustable-speed system at our pumped-storage hydropower plants, and develop small- and mid-scale hydropower generation, with the goals of flexible response to supply and demand fluctuations and further mitigation of our environmental impact.
and generator unit 1 in May 2017, increasing maximum output from 72,000 kW to 72,500 kW. (approximately 365.1 – 376.2 GWh of power generated annually)
Lowering electric power’s carbon intensity
2.Initiatives contributing to the realization ofa low-carbon society 21
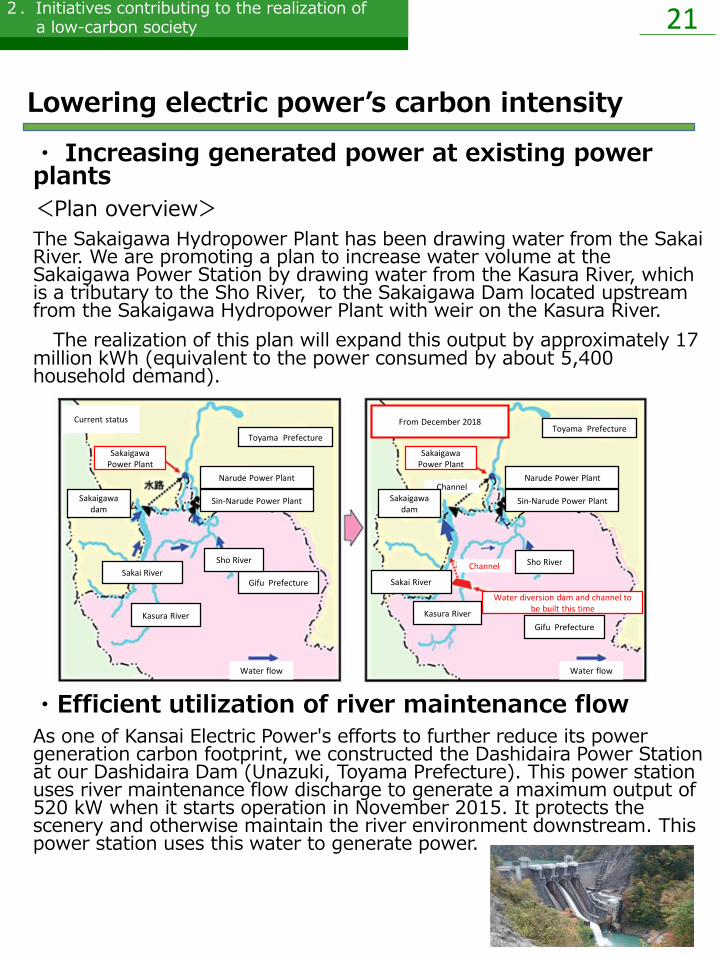
・ Increasing generated power at existing power plants
<Plan overview>
The Sakaigawa Hydropower Plant has been drawing water from the Sakai River. We are promoting a plan to increase water volume at the Sakaigawa Power Station by drawing water from the Kasura River, which is a tributary to the Sho River, to the Sakaigawa Dam located upstream from the Sakaigawa Hydropower Plant with weir on the Kasura River.
The realization of this plan will expand this output by approximately 17 million kWh (equivalent to the power consumed by about 5,400 household demand).
・Efficient utilization of river maintenance flow
As one of Kansai Electric Power's efforts to further reduce its power generation carbon footprint, we constructed the Dashidaira Power Station at our Dashidaira Dam (Unazuki, Toyama Prefecture). This power station uses river maintenance flow discharge to generate a maximum output of 520 kW when it starts operation in November 2015. It protects the scenery and otherwise maintain the river environment downstream. This power station uses this water to generate power.
Current status
Water flow Water flow
From December 2018
Toyama Prefecture
Gifu Prefecture
Narude Power Plant
Sin-Narude Power Plant
Sakai River
Kasura River
Sho River
Sakaigawa Power Plant
Channel
Sakaigawa dam
Toyama Prefecture
Gifu Prefecture
Narude Power Plant
Sin-Narude Power Plant
Sakai River
Kasura River
Sho River
Sakaigawa Power Plant
ChannelSakaigawa
dam
Water diversion dam and channel to be built this time
Lowering electric power’s carbon intensity

2.Initiatives contributing to the realization ofa low-carbon society 22
The Kansai Electric Power Group aims for the realization of a low-carbon society and better usability for customers through the construction of a smart grid (next-generation electricity transmission and distribution network).
Technological developments for constructing the Smart Grid
With large-scale or focused introduction of renewable energy, including solar power, into the electric power grid, the stability of the power grid can be compromised. For this reason, as technology measures for grid facilities, we are advancing systems to evaluate these impacts and research for the development of supply and demand control technologies using advanced voltage control and power storage.
Furthermore, we are undertaking a virtual power plant demonstration project that applies the supply and demand management functionality of a power plant (virtual power plant) to numerous customer devices, including storage batteries and electric vehicles, connected to the power grid by using IoT technologies and controlling them collectively through the Internet. By
■What is the “Smart Grid” ?Our Group has positioned the smart grid as a key to achieving an efficient, high quality, reliable electricity transmission and distribution system, employing advanced information, telecommunications, and storage battery technologies to achieve a low-carbon society and a better energy environment for customers without sacrificing the stability of the basic power grid.
■Meeting the challenges of large-scale renewable energy use
doing so, we are seeking to optimize energy use and further increase the adoption of renewable energy sources.
2.Initiatives contributing to the realization ofa low-carbon society 23
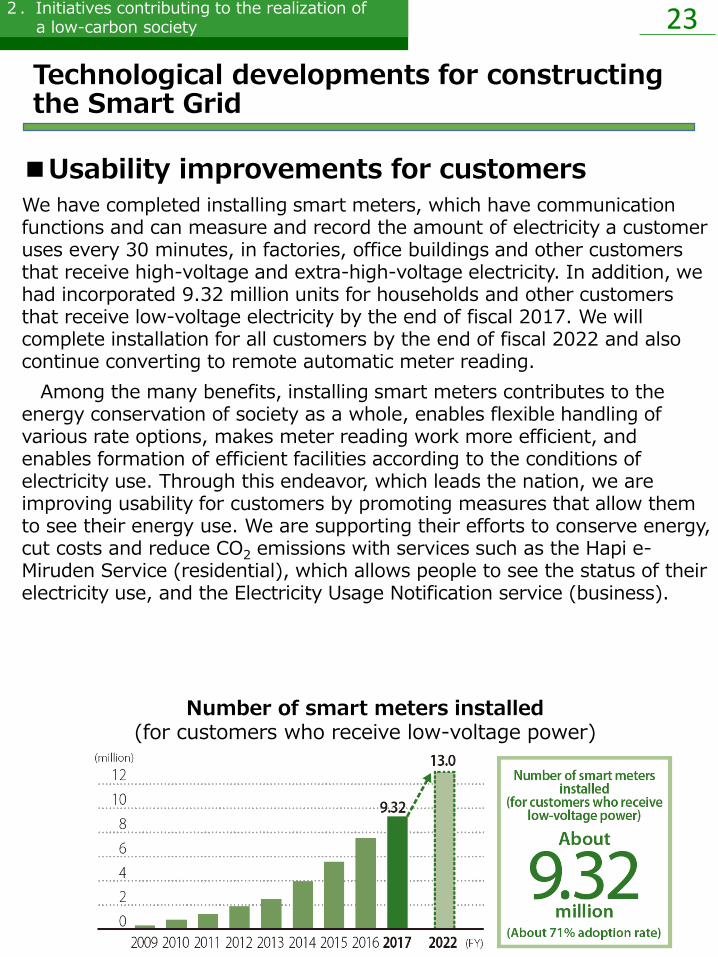
■Usability improvements for customersWe have completed installing smart meters, which have communication functions and can measure and record the amount of electricity a customer uses every 30 minutes, in factories, office buildings and other customers that receive high-voltage and extra-high-voltage electricity. In addition, we had incorporated 9.32 million units for households and other customers that receive low-voltage electricity by the end of fiscal 2017. We will complete installation for all customers by the end of fiscal 2022 and also continue converting to remote automatic meter reading.
Among the many benefits, installing smart meters contributes to the energy conservation of society as a whole, enables flexible handling of various rate options, makes meter reading work more efficient, and enables formation of efficient facilities according to the conditions of electricity use. Through this endeavor, which leads the nation, we are improving usability for customers by promoting measures that allow them to see their energy use. We are supporting their efforts to conserve energy, cut costs and reduce CO2 emissions with services such as the Hapi e-Miruden Service (residential), which allows people to see the status of their electricity use, and the Electricity Usage Notification service (business).
Number of smart meters installed(for customers who receive low-voltage power)
Technological developments for constructing the Smart Grid

2.Initiatives contributing to the realization ofa low-carbon society 24
Contributing to energy conservation, costreductions and CO2 emissions reductions for customers and society
With the goals of realizing energy conservation, cost cutting and CO2
reduction for our customers and society, we are offering high-efficiency systems that utilize renewable energy sources and heat pump technologies, as well as proposing effective operation procedures, for example. In addition, we are providing total support for energy management to customers and other members of society and undertaking activities that serve these purposes, including the services that allow customers to see energy use.
Providing information related to energy conservation through Hapi e-Miruden
household CO2 emissions. On this service we also provide “energy conservation advice” with useful information related to energy conservation. In these ways, we are advancing a variety of efforts that contribute to helping customers conserve energy, cut costs and reduce CO2 emissions.
Moreover, with our Internet-based Hapi e-Miruden service we have established “environmental household account books” in which users can input kerosene charges along with electricity and gas to check their total
By enabling customers to use energy efficiently and comfortably, we are contributing to increased energy efficiency, lower costs, and reduced CO2
emissions for customers and society. We are also promoting energy conservation and CO2 emissions reductions at our workplaces.
■Encouraging efficient energy use
For our residential customers we are proposing “complete electrical conversions” that realize more effective use of energy and comfortable and convenient lifestyles. This is achieved by combining electrical appliances, particularly our EcoCute energy-efficient hot water supplies and “IH cooking heaters” that are safe comfortable and convenient, with our Hapi e-Time discount electricity rate options and Hapi e-Miruden web service that makes electricity use visible.
○Serving residential customers
2.Initiatives contributing to the realization ofa low-carbon society 25
○Serving corporate customers
We provide our customers with support for total energy management according to customer needs and offer advice regarding optimal energy systems and their application. In addition, we work with other Group companies to offer a range of services including energy conservation diagnoses and energy management support appropriate to the customer’s facility usage patterns. We remain committed to helping our customers minimize their energy consumption, achieve cost savings, and reduce their CO2 emissions.
Contributing to energy conservation, costreductions and CO2 emissions reductions for customers and society
2.Initiatives contributing to the realization ofa low-carbon society 26
■Energy conservation and CO2 emissions reductions at our workplaces
○Energy management at business branches
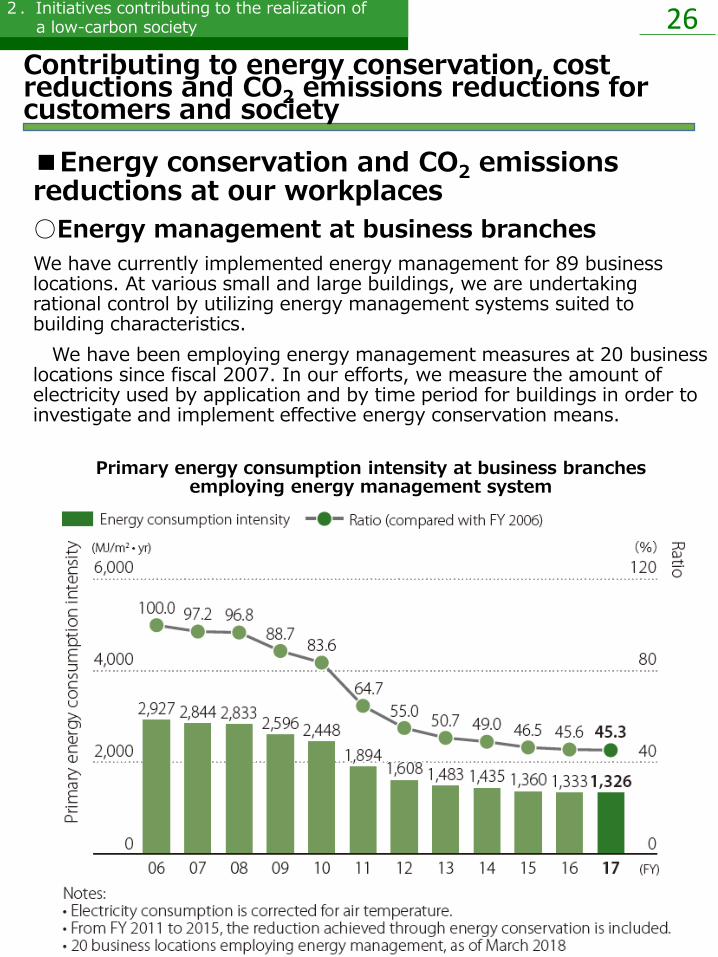
We have currently implemented energy management for 89 business locations. At various small and large buildings, we are undertaking rational control by utilizing energy management systems suited to building characteristics.
We have been employing energy management measures at 20 business locations since fiscal 2007. In our efforts, we measure the amount of electricity used by application and by time period for buildings in order to investigate and implement effective energy conservation means.
Primary energy consumption intensity at business branches employing energy management system
Contributing to energy conservation, costreductions and CO2 emissions reductions for customers and society
2.Initiatives contributing to the realization ofa low-carbon society 27
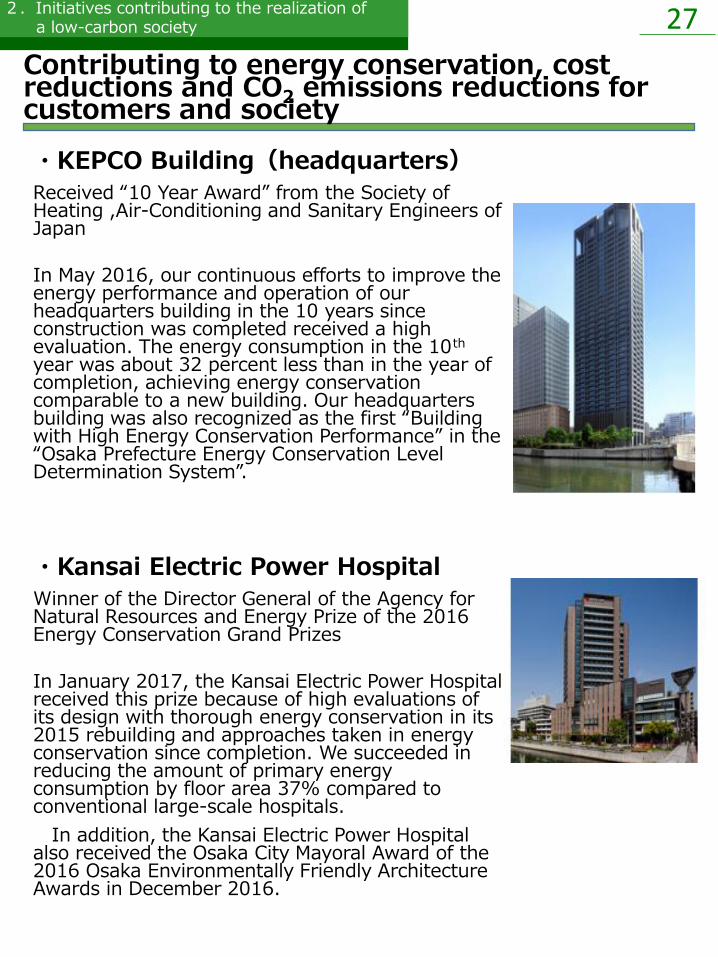
・KEPCO Building(headquarters)
Received “10 Year Award” from the Society of Heating ,Air-Conditioning and Sanitary Engineers of Japan
In May 2016, our continuous efforts to improve the energy performance and operation of our headquarters building in the 10 years since construction was completed received a high evaluation. The energy consumption in the 10th
year was about 32 percent less than in the year of completion, achieving energy conservation comparable to a new building. Our headquarters building was also recognized as the first “Building with High Energy Conservation Performance” in the “Osaka Prefecture Energy Conservation Level Determination System”.
・Kansai Electric Power Hospital
Winner of the Director General of the Agency for Natural Resources and Energy Prize of the 2016 Energy Conservation Grand Prizes
In January 2017, the Kansai Electric Power Hospital received this prize because of high evaluations of its design with thorough energy conservation in its 2015 rebuilding and approaches taken in energyconservation since completion. We succeeded in reducing the amount of primary energy consumption by floor area 37% compared to conventional large-scale hospitals.
In addition, the Kansai Electric Power Hospital also received the Osaka City Mayoral Award of the 2016 Osaka Environmentally Friendly Architecture Awards in December 2016.
Contributing to energy conservation, costreductions and CO2 emissions reductions for customers and society

2.Initiatives contributing to the realization ofa low-carbon society 28
・Kansai Electric Power Company Minami Osaka Sales Branch Office
-Received 31st Technology Encouragement Award from the Society of Heating, Air-Conditioning and Sanitary Engineers of Japan in May 2017.
-Received a 6th Carbon Neutral Award Branch honorable Mention in May 2018.
The Minami Osaka Sales Branch Office received 31st Technology Encouragement Award from the Society of Heating, Air-Conditioning and Sanitary Engineers of Japan in May 2017, having been highly evaluated for its continuous energy conservation efforts through very efficient air-conditioning operation as a result of realizing its own control system and
Building scareNumber
of offices
Energyconsumption
ratioManagement methods
Large offices 6000~10000㎡ 14 60%
・Make visible the status of energy use by utilizing existing central monitoring data
・Analyze and evaluate various types of data and make corresponding improvements led by building manager
Medium offices 1500~8500㎡ 20 17%
・ Install power use meters (about 30–100 points)
・ Make visible the status of energy use in real-time
・Analyze and evaluate power measurement data and make improvements by architectural engineer
Small offices 400~6000㎡ 55 23%
・Visualization of electricity meter leading value on corporate-wide portal site
・Throughout the company share examples of energy conservation achieved at medium offices
・Conduct energy conservation walk-throughs investigation
○Status of energy efficiency management and systems incorporation in real estate
conducting performance evaluation meetings. They were able to reduce primary energy consumption intensity by about 52% compared to the target at the time of design, realizing environmental performance appropriate for a “next-generation sales office that is good for the environment and people.
Contributing to energy conservation, costreductions and CO2 emissions reductions for customers and society

2.Initiatives contributing to the realization ofa low-carbon society 29
Overseas activities
We have been implementing a wide range of initiatives outside Japan in an effort to devise solutions to global issues including environmental problems by utilizing our technical expertise, knowledge, and know-how we have cultivated over the years of our experienced operation as an electric power utility.
Main power plant and main dam
Sub power plant and secondary dam
* Build–operate–transfer (BOT) is a type of project arrangement whereby a project company builds a facility and manages and operates it for a certain period to recover its investment, after which it transfers ownership of the facility to the public sector / authority
On the Nam Ngiep River, the tributary of the Mekong River which forms the boundary between Laos and Thailand, we are constructing power stations in two locations with a capacity of 272 MW (Main Power Station) and 180 MW (Re-Regulation Power Station). With a height of 167 m and width of 530 m, the Main Dam is as large as the Kurobe Dam. This is a BOT* project with 27-year concession period, after which the ownership will be transferred to the Lao Government.
We began investigations for the Nam Ngiep 1 Hydropower Project in 2004 as a leading development company. This is the first overseas project in which Kansai Electric took the largest shareholder’s position. In 2013, we established the Nam Ngiep 1 Power Company together with EGAT International (Thailand) and the Lao Holding State Enterprise. Main construction work started in October 2014 and in April 2016, placing concrete for the dam began. The reservoir impounding began in May 2017 at the Re-Regulation Dam and May 2018 at the Main Dam. Commercial operation is scheduled to begin in 2019.
Utilizing our experience as an electric power business in Japan, we are responsible for engineering and work progress and quality control for the entire construction project. We have issued orders for the main construction work, which has been divided into civil engineering, electrical-mechanical, hydro-mechanical and other categories, and we have contracted with Japanese companies that have high levels of engineering capabilities. The construction of the dam, installation of the power generation equipment and other facilities are advancing under the supervision, primarily led by employees dispatched from
■Nam Ngiep 1 Hydropower ProjectLao People’s Democratic Republic
our company. By undertaking the project in an “ALL JAPAN” organization and widely communicating its advantages, we believe that we can contribute to the expanded export of quality Japanese infrastructure.

2.Initiatives contributing to the realization ofa low-carbon society 30
■Rajamandala Hydroelectric Power ProjectRepublic of Indonesia
We are constructing a run-of-river hydroelectric power plant with a capacity of 47 MW, located on the Citarum River, in Java Island, the Republic of Indonesia (commercial operation scheduled in 2019). This is a BOT* project which will sell electricity to the PT Perusahaan Listrik Negara (state electricity company of Indonesia) utilizing the water released from an upstream hydroelectric power plant** operated by a local power company.
While this project is designed to make profit for Kansai Electric Power, it is also supposed to contribute to the development of Indonesia where power demand is growing remarkably. We will be able to supply affordable and low carbon electricity in a stable manner over the long term.
Power plants area overview
* Build–operate–transfer (BOT) is a type of project arrangement whereby a project company builds a facility and manages and operates it for a certain period to recover its investment, after which it transfers ownership of the facility to the public sector / authority.** Saguling Hydroelectric Power Plant (700 MW) owned by PT Indonesia Power (100% subsidiary of PLN)
Overseas activities

2.Initiatives contributing to the realization ofa low-carbon society 31
■Contributing to the development of renewable energy sources
Energy Globe Award receivedThe DSIP was selected as the most outstanding project in the Republic of Maldives in the Energy Globe Awards (2017), which is given to excellent environmental projects around the world. This project was highly evaluated for the reasons that include the economic benefits brought by the ice machine to the local community and residents, the fact that no waste is generated by a storage battery for storing excess power and that the project could easily be reproduced on other islands.
※ GSEP:GSEP stands for “Global Sustainable Electricity Partnership.” Comprised of nine major electric power companies from seven countries, including Japan, the USA and France, in this organization leaders from each company exchange ideas about the development of sustainable energy sources, climate change problems and other global issues related to the electric power business as a whole.
Our company is setting up infrastructure and working to reduce global environmental impacts by participating in GSEP* efforts, including micro hydroelectric power generation in the Kingdom of Bhutan, solar power generation at Tsubaru, and the Dhiffushi Solar Ice Project (DSIP) in the Republic of Maldives.
On Dhiffushi Island, in order to balance the amount of power generated by solar and the amount of electricity used, an ice machine was installed instead of a storage battery. This ice is provided for the fishing business, which is a principal industry on the island. This has received great attention as a replicated model project that could be developed on other islands and in other countries. Our company has also worked to promote it publicly. We will monitor the project for five years in order to confirm that, for example, the equipment we transferred stays in good condition and that the power system is stabilized. Through this effort we expect that about 50 tonnes of CO2
can be reduced per year.
Overseas activities
2.Initiatives contributing to the realization ofa low-carbon society 32
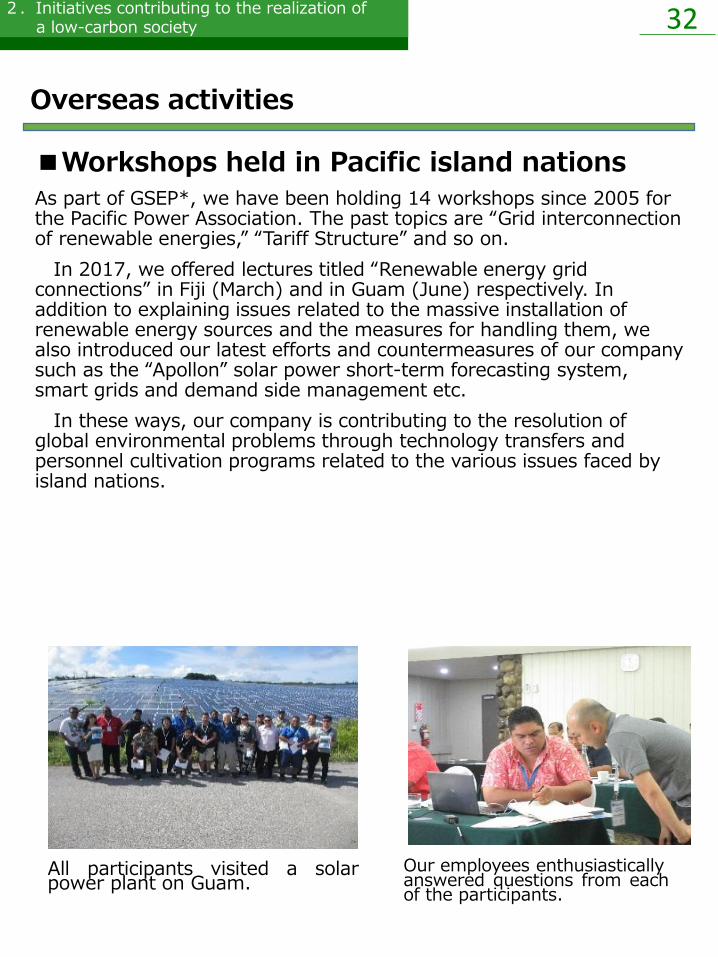
■Workshops held in Pacific island nations
As part of GSEP*, we have been holding 14 workshops since 2005 for the Pacific Power Association. The past topics are “Grid interconnection of renewable energies,” “Tariff Structure” and so on.
In 2017, we offered lectures titled “Renewable energy grid connections” in Fiji (March) and in Guam (June) respectively. In addition to explaining issues related to the massive installation of renewable energy sources and the measures for handling them, we also introduced our latest efforts and countermeasures of our company such as the “Apollon” solar power short-term forecasting system, smart grids and demand side management etc.
In these ways, our company is contributing to the resolution of global environmental problems through technology transfers and personnel cultivation programs related to the various issues faced by island nations.
All participants visited a solarpower plant on Guam.
Our employees enthusiasticallyanswered questions from eachof the participants.
Overseas activities

2.Initiatives contributing to the realization ofa low-carbon society 33
Technical development efforts
By making use of our specialized technical capabilities as an electric company, we are contributing to the emergence of a low-carbon society using our technological breakthroughs.
■Apollon solar power short-time forecasting system
In preparation for the high-volume adoption of solar power generation, which varies in output according to the weather, we developed the Apollon solar power short-time forecasting system together with the Meteorological Engineering Center, Inc. from fiscal 2012–2014. The Apollon system analyzes the characteristics of clouds from cloud images captured by weather satellites and estimates the solar radiation strength on the Earth’s surface (Figure 1). In addition, it predicts the movement of clouds by analyzing changes in clouds over time shown in weather satellite images (Figure 2) and predicts the amount solar radiation in three-minute intervals for 1 km grid units up to 3 1/2 hours ahead. By utilizing predicted solar radiation amounts, fluctuations in solar power generation output can be predicted in advance, allowing stable control of supply and demand. In this way, our company is contributing to the popularization of solar power, and seeking to build a low-carbon society.
Predicting solar radiation for 3 1/2 hours (in 3-minute intervals) from a weather satellite image

2.Initiatives contributing to the realization ofa low-carbon society 34
■Joint development of hot wind generator using high-efficiency air to air heat pump
To respond to the needs for the promotion of energy saving in drying processes in industrial fields, we jointly developed* “Neppu-ton,” a hot wind generator using a high-efficiency air-source heat pump. Mitsubishi Heavy Industries Thermal Systems, Ltd. started sales of it in June 2017.
As with general air conditioners, it has a separate-type configuration comprised of an outdoor unit that takes in heat from the atmosphere and an indoor unit that can directly generate hot wind. It generates hot wind of 90°C, which is the highest-temperature hot wind provided by an air-source heat pump in Japan, and has achieved a high-efficiency of a COP of 3.5**, realizing great reductions in energy use, cost and CO2 emissions.
We received the Energy Conservation Center Chairman’s Award of the Energy Conservation Grand Prizes (products and business models division) for fiscal 2017.
* Joint development partners: Mitsubishi Heavy Industries Thermal Systems, Ltd., Tokyo Electric Power Company Holdings, Inc., and Chubu Electric Power Co., Inc.** Coefficient Of Performance (COP) indicates the energy consumption efficiency of a heat generator
Neppu-ton appearance and Energy Conservation Grand Prize trophy
Technical development efforts

2.Initiatives contributing to the realization ofa low-carbon society 35
Value chain efforts
We are working to introduce and utilize high-efficiency LNG vessels.
■Fuel value chainWe are advancing the introduction of LNG vessels with excellent energy conservation performance. Following the LNG EBISU, the LNG JUROJIN and the LNG FUKUROKUJU, which are already in service, we completed the LNG SAKURA in fiscal 2017.
The LNG FUKUROKUJU adopts a new type of steam turbine that reuses the steam once used by reheating them. It achieves 25% reduction of fuel consumption compared to conventional steam turbine.
The LNG SAKURA has Dual Fuel Diesel Engine system for power. We hope to achieve outstanding fuel economy compared to conventional steam turbine systems.
By utilizing the latest thermal insulation systems, they achieve an LNG evaporation rate of 0.08% per day, which is the lowest level in the world, making them outstanding in terms of both environmental and economic performance.
LNG SAKURALNG FUKUROKUJU

2.Initiatives contributing to the realization ofa low-carbon society 36
Efforts to reduce other greenhouse gases in addition to CO2
We are working to suppress SF6 gas emissions.
■Suppression of SF6 gas emissions
SF6 (sulfur hexafluoride) gas, which is used to fill gas circuit breakers (GCB) because of its high-insulation performance and other merits, is a greenhouse gas that is subject to reduction by the Kyoto Protocol.
To prevent the atmospheric emission of SF6 gas during internal inspection and removal of GCBs, we are recovering almost all SF6 gas using recovery equipment before such work.
Recovery rate upon
inspections
Calendaryear
Recovery rate upon removal
99.2% CY 2012 99.4%
99.1% CY 2013 99.4%
98.8% CY 2014 99.5%
99.1% CY 2015 99.2%
99.3% CY 2016 99.6%
99.6% CY 2017 99.3%
Gas recovery tank
Vacuum pump
Gas supply ports
Recovery support equipment
(developed by our company)
Recovery device
Gas recovery device
To high-pressure gas cylinder
To vacuum pump

37
3. Initiatives contributing to the realization of a
recycling-oriented society
・Promotion of proactive 3R efforts aimed at zero emission
・Promoting safe, reliable, and complete disposal of PCB wastes
・Promoting green procurement

3.Initiatives contributing to the realization ofa recycling-oriented society 38
Initiatives contributing to the realization of a recycling-oriented society
Based on the Kansai Electric Power Group Environmental Action Plan, we are undertaking 3R (reduction, reuse and recycling) efforts toward the achievement of zero emissions of general waste generated from our business activities. In addition, for office trash, including copy paper, and other ordinary waste, we are undertaking 3R efforts with an emphasis on “sorting” at all our business places, and we are working to reduce and recycle general waste.
Other efforts that we are making include advancing the safe, reliable and complete disposal of all PCB wastes that we have according to their characteristics, promoting green procurement, and using limited water resources appropriately.

3.Initiatives contributing to the realization ofa recycling-oriented society 39
Promotion of proactive 3R efforts aimed at zero emission
The principal types of industrial waste generated by Kansai Electric Power include coal ash from coal-fired thermal power plants and concrete pole fragments remaining from power grid construction. We have targeted an industrial waste recycling rate of at least 99.5% with the goal of achieving zero emissions.
We achieved a 99.9% recycling rate in fiscal 2017, which marks the eighth consecutive year that we have reached our target. We are also working to reduce and recycle general waste, such as printer paper, produced by our offices.
■industrial wastes
○Changes in emissions and recycling rates forindustrial wastes

3.Initiatives contributing to the realization ofa recycling-oriented society 40
○Main applications of recycled industrial waste, etc.
○Recycling scrap insulators
Conventionally, scrap insulators have been limited to use as a roadbed material after crushing because of the sharpe edges that remain. However, Kanden L&A Co., Ltd., developed a grinder that eliminates such sharp edges, and crushed insulators can now be used as landscaping stone for residential use. As a result, the Kansai Electric Power Company is maintaining a high recycling rate for insulator waste.
At the fiscal 2015 Awards for Resource-Recycling Technologies and Systems, Kanden L & A Co., Ltd. and Kansai Electric Power received a Ministry of Economy, Trade and Industry Technology Environmental Director General Award.
Insulator waste after grinding
Insulator waste after conventional crushing
Insulators before crushing
Insulator
Example of household application
Promotion of proactive 3R efforts aimed at zero emission

3.Initiatives contributing to the realization ofa recycling-oriented society 41
fly ash
○Recycling of coal ashWe are recycling all the coal ash emitted by the Maizuru Power Station as raw material for cement and roadbed material, for example. The minute spherical particles found in coal ash are called “fly ash” when in their modified form and, when mixed with concrete, add strength. Fly ash is used as concrete admixture for engineering and construction projects for bridges and the like. Kanden Power-Tech Corporation is promoting sales of this material.
Promotion of proactive 3R efforts aimed at zero emission
3.Initiatives contributing to the realization ofa recycling-oriented society 42
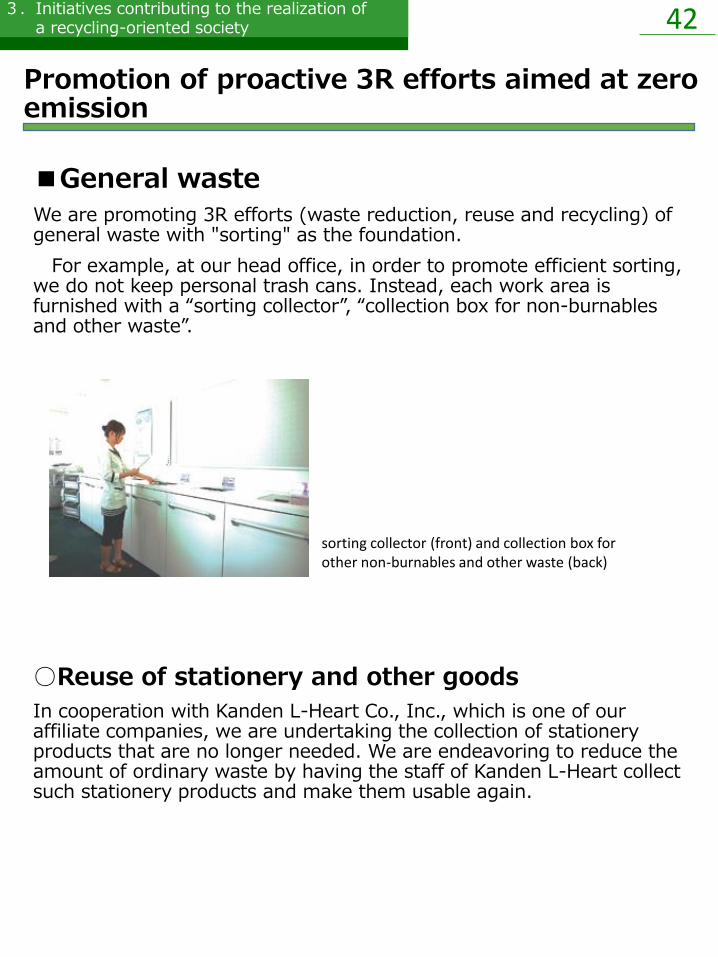
■General waste
We are promoting 3R efforts (waste reduction, reuse and recycling) of general waste with "sorting" as the foundation.
For example, at our head office, in order to promote efficient sorting, we do not keep personal trash cans. Instead, each work area is furnished with a “sorting collector”, “collection box for non-burnables and other waste”.
○Reuse of stationery and other goods
In cooperation with Kanden L-Heart Co., Inc., which is one of our affiliate companies, we are undertaking the collection of stationery products that are no longer needed. We are endeavoring to reduce the amount of ordinary waste by having the staff of Kanden L-Heart collect such stationery products and make them usable again.
sorting collector (front) and collection box for other non-burnables and other waste (back)
Promotion of proactive 3R efforts aimed at zero emission

3.Initiatives contributing to the realization ofa recycling-oriented society 43
Promoting safe, reliable, and complete disposal of PCB wastes
PCB* materials have characteristics that include insulation and non-flammability, and they are chemically stable. For these reasons, their production began in Japan in 1954 and they were used in a wide range of applications, including electrical equipment such as transformers and capacitors. However, PCB manufacture was terminated due to their toxicity becoming a problem for society. The Law Concerning Special Measures Against PCB Waste also requires businesses with equipment and other items that use PCBs to store them suitably and dispose of them by the end of March 2027.
Kansai Electric Power complies strictly with the Law Concerning Special Measures Against PCB* Waste and related laws, and promotes safe, reliable disposal based on the special characteristics of the PCB waste involved. Kansai Electric Power uses a range of methods for dealing with the disposal of electrical equipment containing minute amounts of PCBs. We established the Recycling Center for Utility Pole Transformers to render insulating oil and transformer cases harmless and suitable for recycling. At the end of July 2015, we completed processing of stored insulating oil and transformer cases. For other equipment, we are promoting effective processing using technologies from our Group companies.
In keeping with government plans, we have commissioned Japan Environmental Storage & Safety Corporation (JESCO) to process waste containing high concentrations of PCB insulating oil.
※ PCB: Initialism for polychlorinated biphenyl. It is a strong electrical insulator and has been used as an insulating oil in electrical transformers. Because it has an adverse environmental impact, its production and use have been prohibited in principle.

3.Initiatives contributing to the realization ofa recycling-oriented society 44
■Initiatives of our group companies(The Kanden L & A Co., Ltd.)
○Received the first permit in Japan from the Minister of the Environment for disposal treatment of low-concentration PCBs in discarded electrical equipment by using mobile solvent-based cleaning equipment
Kanden Engineering Corporation received the first permit in Japan from the Minister of the Environment in May 2014 for disposal treatment of low-concentration PCBs in discarded electrical equipment by using mobile solvent-based cleaning equipment. It has been conducting safe and economical decontamination treatments that do not require moving or dismantling contaminated equipment. In the future, our corporate group will continue contributing to the realization of a recycling-oriented society.
Kanden Engineering Corporation PCB cleaning equipment
Promoting safe, reliable, and complete disposal of PCB wastes

3.Initiatives contributing to the realization ofa recycling-oriented society 45
Promoting green procurement
In order to advance efforts for the realization of a recycling-oriented society, we have prepared a Kansai Electric Power Group Green Procurement Manual.
○Our fundamental approach to green procurement
(1) We recognize that all procured goods, building equipment and methods used in construction have some kind of impacts on the environment; therefore, we purchase and use office supplies, materials, building equipment and methods that consider environmental impact reduction as much as possible.
(2) Before purchasing a good we “rethink” whether that good is really necessary and investigate whether it is possible to “reduce” the quantity we purchase. Furthermore, we strive to use purchased goods for long periods, and we seek to “reuse” goods that become unneeded in different places as well as “recycle” and “repair” them.

46
4. Promotion of environmental protection
in local communities
・Measures to prevent air and water pollution, etc.
・Efforts to strictly manage and reduce toxic substances
・Considering the preservation of biodiversity
・Initiatives of the Kansai Electric Power Group
4.Promotion of environmental protection in local communities 47
Promotion of environmental protection in local communities
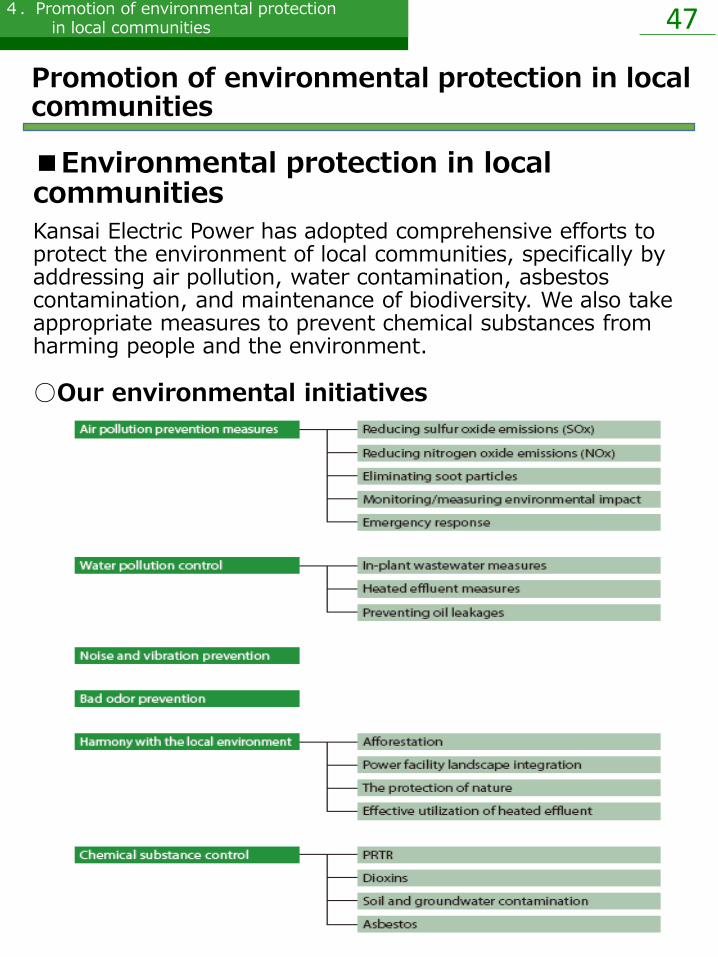
■Environmental protection in local communities
Kansai Electric Power has adopted comprehensive efforts to protect the environment of local communities, specifically by addressing air pollution, water contamination, asbestos contamination, and maintenance of biodiversity. We also take appropriate measures to prevent chemical substances from harming people and the environment.
○Our environmental initiatives

4.Promotion of environmental protection in local communities 48
○Environmental protection measures at power plants
At our power plants, we undertake measures based on laws, local regulations, environmental protection agreements and other rules to reduce air pollution, water contamination, noise, vibrations, and other problems.
In addition, we monitor and measure the air and ocean around our power plants and carefully evaluate the environmental effects of our operations on the regional environment to ensure that no problems occur.
Environmental measures adopted at thermal power stations
Promotion of environmental protection in local communities

4.Promotion of environmental protection in local communities 49
Measures to prevent air and water pollution, etc.
We have implemented measures aimed at reducing the volume of SOx (sulfur oxides) emitted by our thermal power plants by using low-sulfur fuels, installing sulfur scrubbers, and other measures. To address the issue of NOx (nitrogen oxides), we are taking steps to lower emission levels, such as improving combustion methods and installing nitrogen scrubbers. As a result, our SOx and NOx emissions per unit of electric power generated are significantly lower than those of the major countries of Europe and North America, remaining among the lowest in the world. In addition, we have installed high-performance electrostatic precipitators that dramatically cut soot emissions.
Moreover, at our power plants, wastewater is released into the ocean and public sewers after being purified by wastewater treatment equipment. As we strive to prevent water pollution, we are managing wastewater so that we can adhere to values that are legally restricted and values that are agreed upon with local governments.
■Air pollution prevention measures
○Reducing sulfur oxide emissions
Sulfur oxides (SOx) are formed when sulfur from burning fuel combines with oxygen in the air.
To reduce the volume of SOx emissions from our thermal power stations, measures we employ include the use of low-sulfur fuels and sulfur scrubbers that remove SOx from smoke.
・Usage of Low-sulfur fuels
We use low-sulfur heavy oil, low-sulfur crude oil, and clean LNG that contains no sulfur as fuels.
The combined use of the above three fuels in fiscal 2017 totaled approximately 80% of fuel for thermal power generation (in heavy oil).

4.Promotion of environmental protection in local communities 50
・Installation of sulfur scrubbers
Since the 1960s we have actively engaged in R&D on sulfur scrubbers and their applications for removing SOx from flue gas.
As of the end of fiscal 2017, we have eight units in operation, the equivalent of 4.95 million-kW. The expanded use of low-sulfur fuels has also contributed greatly to reductions in SOx emissions.
○Reducing nitrogen oxide emissions
Nitrogen oxides (NOx) are formed when nitrogen from burning fuel combines with oxygen in the air. The higher the combustion temperature the more is released. To reduce the volume of NOx emissions from our thermal power stations, measures we employ include improving combustion methods and using nitrogen scrubbers that remove NOx from flue gas.
・Improving combustion methods
We employ three specific methods to improve fuel combustion and reduce NOx: (1) two-stage combustion; (2) exhaust gas mixed combustion; and (3) low-NOx burners. We have modified our boilers to be able to handle both two-stage combustion and exhaust gas mixed combustion, while also installing low-NOx burners to further reduce NOx emissions.
Measures to prevent air and water pollution, etc.
4.Promotion of environmental protection in local communities 51
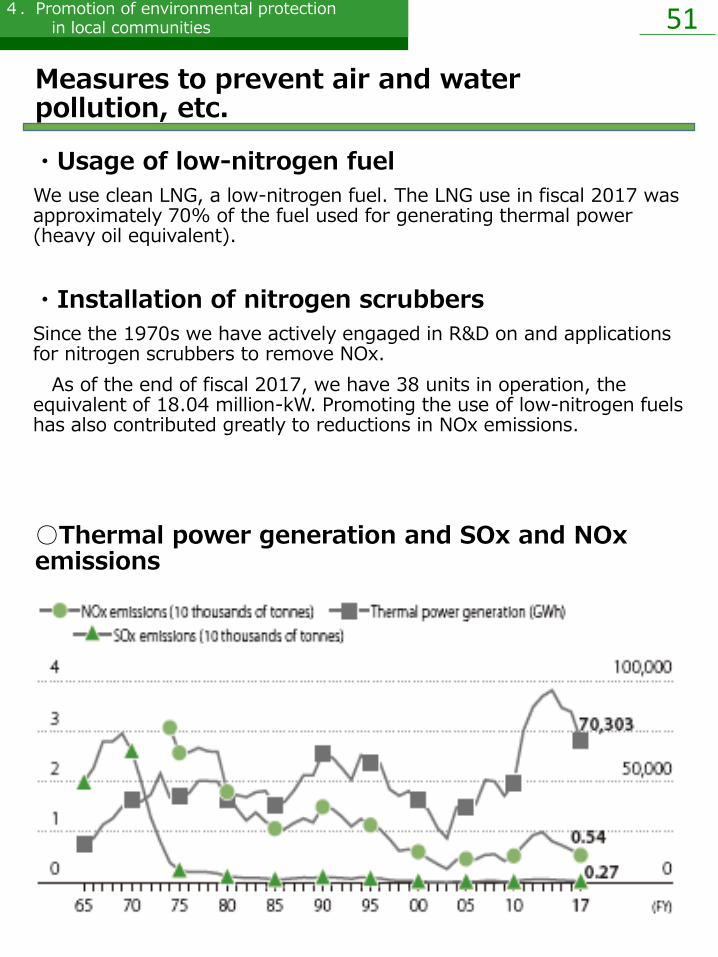
○Thermal power generation and SOx and NOx emissions
・Usage of low-nitrogen fuel
We use clean LNG, a low-nitrogen fuel. The LNG use in fiscal 2017 was approximately 70% of the fuel used for generating thermal power (heavy oil equivalent).
・Installation of nitrogen scrubbers
Since the 1970s we have actively engaged in R&D on and applications for nitrogen scrubbers to remove NOx.
As of the end of fiscal 2017, we have 38 units in operation, the equivalent of 18.04 million-kW. Promoting the use of low-nitrogen fuels has also contributed greatly to reductions in NOx emissions.
Measures to prevent air and water pollution, etc.

4.Promotion of environmental protection in local communities 52
○Measures to reduce soot
We have installed high-performance electrostatic precipitator for all boilers burning heavy oil, crude oil, and coal as fuel that dramatically cut soot emissions.
○SOx and NOx emission factors for thermal power generation of major countries and Kansai Electric Power
Japan’s NOx emissions per unit of thermal power generated are significantly lower than figures for the major countries of Europe and North America (the United States, Canada, United Kingdom, France, Germany and Italy) at 0.077 g/kWh. And KEPCO’s values are low in comparison to other power providers in Japan.
Measures to prevent air and water pollution, etc.
4.Promotion of environmental protection in local communities 53
■Measures to prevent water quality degradation
Water used in thermal power plants is thoroughly purified by a variety of processing equipment before discharge. Furthermore, to supplement oil barricades and loading arms, we have installed oil fences and other oil spill countermeasures to be completely prepared for the unlikely occurrence of an oil spill. We also release seawater used for power plant cooling (hot water discharge) at a temperature no more than 7℃ higher than the nearby ocean. In addition, to prevent affecting the sea creatures that live nearby, we choose appropriate methods and locations for water intake and output.
■Noise pollution, vibration measures
Whenever possible we place devices that could cause noise pollution or vibrations inside and far from the boundaries of our power plants and subsutations. We also install noise absorbers and barriers to minimize noise pollution and vibrations.
■Measures to prevent bad odor
The injection of ammonia used in the nitrogen scrubber and electrostatic precipitator is maintained constantly at proper levels by an automatic controller. The concentration of ammonia in emission gas is kept low and periodically measured to prevent the release of bad odors.
Measures to prevent air and water pollution, etc.

4.Promotion of environmental protection in local communities 54
Efforts to strictly manage and reduce toxic substances
We properly manage toxic substances and other substances that we handle in our business in accordance with related laws and regulations.
■Measures to prevent soil and groundwater contaminationWe have produced our own Handbook on Measures Against Soil Pollution, and complies with all laws and local regurations against soil contamination. Moreover, our power plants have water- and oil-retaining walls installed, preventing soil contamination from chemicals and fuels such as heavy oil in the unlikely event of leakage.
■Handling chemicalsIn addition to complying with the Pollutant Release and Transfer Register(PRTR) Act, the Company has prepared a Handbook on PRTR Chemical Management. We follow its guidelines to ensure strict management of hazardous chemical substances, and make efforts to reduce the volume of such substances. In accordance with the PRTR Act, we report to the national governament our volumes of chemical emissions and the amounts transported, and regularly make the same information public.
■Addressing the issue of asbestosWe regularly monitor the status of buildings and equipment that
contain asbestos and systematically advance the removal of asbestos and replacement with non-asbestos products. In these ways, we are managing asbestos suitably as we strictly abide by related laws, regulations and other rules.

4.Promotion of environmental protection in local communities 55
Efforts to strictly manage and reduce toxic substances
○Scope of use (buildings and facilities) of asbestos (at March 31, 2018)

4.Promotion of environmental protection in local communities 56
Considering the preservation of biodiversity
The promotion of business activities that consider the preservation of biodiversity is part of the Kansai Electric Power Group Environmental Action Plan. In accordance with this, in carrying out our business, we are steadily implementing efforts for this purpose, including conducting environmental assessments and undertaking environmental preservation measures that suit local characteristics.
At our power stations and other locations, we are engaged in efforts to create natural woodlands using our ecological revegetation method. Moreover, we consider the preservation of biodiversity by undertaking protection measures for animals and plants at and nearby our facilities.
■Creating natural woodlands (ecological revegetation)In the expansive green spaces where our power plants are located, we have implemented ecological revegetation in an effort to create natural forests as quickly as possible. This is a method of selecting the saplings of trees and bushes that are suitable for each area, and then doing mixed, dense plantings for the purpose of creating the most natural forest possible in a short amount of time. Kansai Electric Power first introduced this revegetation process at the Tanagawa No.2 Power Station in 1977, and natural forests have now been created through ecological revegetation activities at many of our power plants.
Also, we strive to protect the ecosystem endemic to each region by exterminating invasive species in these wooded tracts, thereby preserving biodiversity. Because there was no natural forest around Nanko Power Station, which is located within Osaka City, and thus we could not expect to achieve vegetational diversity through the use ofnearby resources, we have made efforts to further increase the
Forest accounts for a quarter of the grounds of the Gobo Power Station. These trees grow to more than 10 meters in height.
diversity of the ecological vegetation by adding 1,168 plants of 66 different species.

4.Promotion of environmental protection in local communities 57
○Ako Power StationPhoto taken Sept. 1987 Photo taken Oct. 2007
Abundant woodlands have grown at many of our business locations, creating homes for wild birds, insects and small animals.*Kansai Electric Power maintains vegetated areas, including natural woodlands, covering 77 million m2 (29 times the size of the Expo park in Osaka)
Japanese bush warbler shrike
Areas of ecological revegetation: 15 times the size of Koshien Stadium(approx.600,000m2)
Kansai Electric Powersupply area
Maizuru Power Station
Oi Power Station
Aioi Power Station
Ako Power Station
Nanko power station
Gobo Power Station
Miyazu Energy Research Center
Himeji No.1 Power Station
Himeji No.2 Power Station
Tanagawa No.2 Power Station
Considering the preservation of biodiversity
4.Promotion of environmental protection in local communities 58
■Protecting oriental white storks
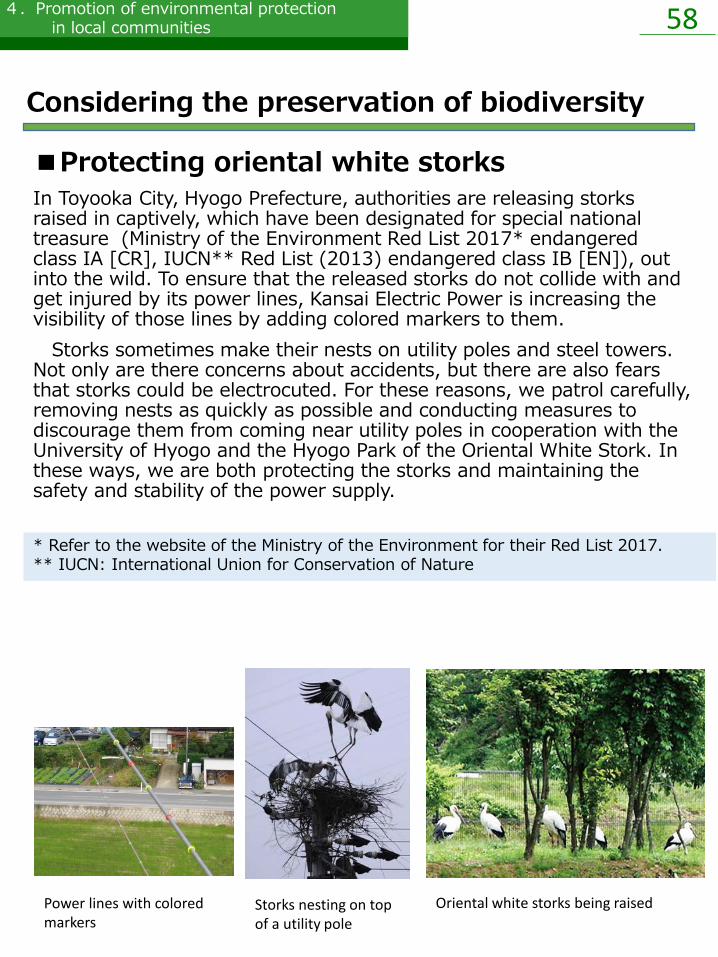
In Toyooka City, Hyogo Prefecture, authorities are releasing storks raised in captively, which have been designated for special national treasure (Ministry of the Environment Red List 2017* endangered class IA [CR], IUCN** Red List (2013) endangered class IB [EN]), out into the wild. To ensure that the released storks do not collide with and get injured by its power lines, Kansai Electric Power is increasing the visibility of those lines by adding colored markers to them.
Storks sometimes make their nests on utility poles and steel towers. Not only are there concerns about accidents, but there are also fears that storks could be electrocuted. For these reasons, we patrol carefully, removing nests as quickly as possible and conducting measures to discourage them from coming near utility poles in cooperation with the University of Hyogo and the Hyogo Park of the Oriental White Stork. In these ways, we are both protecting the storks and maintaining the safety and stability of the power supply.
Power lines with colored markers
Storks nesting on top of a utility pole
Oriental white storks being raised
* Refer to the website of the Ministry of the Environment for their Red List 2017.** IUCN: International Union for Conservation of Nature
Considering the preservation of biodiversity
4.Promotion of environmental protection in local communities 59
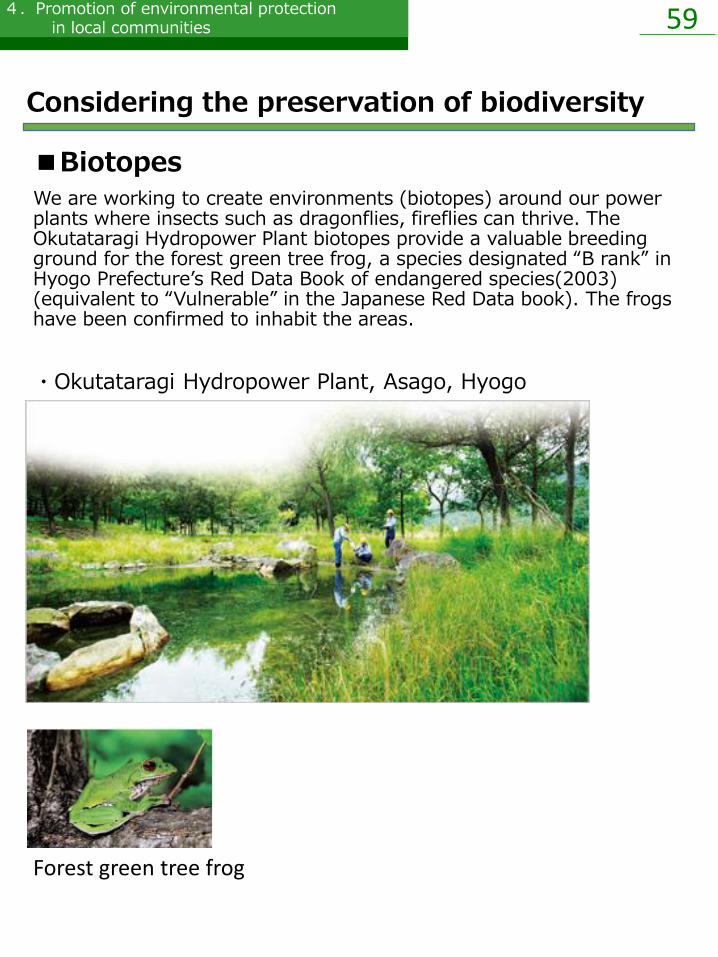
■Biotopes
We are working to create environments (biotopes) around our power plants where insects such as dragonflies, fireflies can thrive. The Okutataragi Hydropower Plant biotopes provide a valuable breeding ground for the forest green tree frog, a species designated “B rank” in Hyogo Prefecture’s Red Data Book of endangered species(2003) (equivalent to “Vulnerable” in the Japanese Red Data book). The frogs have been confirmed to inhabit the areas.
・Okutataragi Hydropower Plant, Asago, Hyogo
Forest green tree frog
Considering the preservation of biodiversity

4.Promotion of environmental protection in local communities 60
■Protecting native species around Kurobe Dam
A trolley bus runs along the Tateyama Kurobe Alpine Route that connects Nagano Prefecture and Toyama Prefecture. Unlike an ordinary bus, this trolley bus runs on an electric motor rather than gasoline, and thus produces no exhaust. Because it is also extremely quiet, it rarely startles animals with its sound.
Kurobe Dam, which is situated in a national park, receives one million visitors annually. At Ogizawa Station, which is the entrance to the Nagano Prefecture side, the seeds of plants that do not naturally grow in Kurobe sometimes get brought over on the soles of the shoes of tourists. Thus, seed removal mats have been placed at the station ticket gates to prevent the influx of non-native species. The removed seeds are collected with a vacuum cleaner and incinerated.
Seed-removing floor mat
Trolley bus
Conservation of biodiversity

4.Promotion of environmental protection in local communities 61
Initiatives of the Kansai Electric Power Group
■Kanden Realty & Development Co., Ltd.
○Akasaka Center Building receives the Organization for Landscape and Urban Green Infrastructure Chairman’s Award
In December 2017, the landscaping (completed January 2013) of the Akasaka Center Building received the Chairman’s Award in the 16th Rooftop and Wall Green Technology Competition held by the Organization for Landscape and Urban Green Infrastructure.
According to the commendation received, “In the wall plantings of this multipurpose building, which combines offices and condominiums, nearby a verdant area that symbolizes local history and culture, vegetation was actively incorporated into an exterior design that has a softness unlike stone walls, creating an urban environment where people can enjoy strolling.”
62
5. Promoting environmental management and
environmental communication
・Continuous improvement using environmental management systems based on ISO 14001 systems and strict adherence to laws and regulations
・Active advancement of environmental awareness raising activities with local communities and customers and disclosure of environmental information

5.Promoting environmental management and environmental communication 63
Continuous improvement using environmental management systems based on ISO 14001 systems and strict adherence to laws and regulations
○Corporate Governance
To ensure the continuous improvement of its corporate value while maintaining the transparency and soundness of its business management, the Kansai Electric Power Group views its commitment to improving corporate governance as a key management initiative. We are always striving to make effective improvements in this area.
Moreover, auditors continuously and efficiently audit our business activities comply with environmental laws and regulations.
○CSR Promotion System
Headed by the president of Kansai Electric Power, the CSR Promotion Council establishes the general policies that guide the entire Group in promoting CSR, and provides general coordination of specific activities. Issues of a specialized nature are sent to committees, such as the Environmental Board, for deliberation.
⇒For details, please see the Kansai Electric Power Group Report 2018

5.Promoting environmental management and environmental communication 64
■Promoting environmental management
In our corporate group, our company and our group companies have been unified in efforts to reduce environmental impacts and environmental risks, and we have built environmental management systems that incorporate the approaches of ISO 14001. Kansai Electric Power has established an Environmental Board within its CSR Promotion Council. For the Group, we have established the Kansai Electric Power Group Environmental Management Committee, and are working to develop Eco Action measures and implement Check and Review, as well as comply with environmental law and other regulations.
The Office of Energy and Environmental Planning communicates with every division and group company about the state of environmental management, providing advice or guidance as necessary.
・Environmental Management system of our corporate group
(PDCA cycle)
○Environmental management promotion system of the Kansai Electric Power Group
Continuous improvement using environmental management systems based on ISO 14001 systems and strict adherence to laws and regulations
Formulation of Eco Action
Implementation of Eco Action
Check of Eco Action
Review of Eco Action
5.Promoting environmental management and environmental communication 65
■Strict adherence to laws, regulations and other rules
We endeavor to adhere to laws and regulations with restrictions related to the environment.
In addition, we have sought to adhere unfailingly to “environmental protection agreements” made with local governments near our power plants, and we had no violations of such agreements. In fiscal 2017, there were no cases in which we received guidance, recommendations or orders from the national or local governments about these laws, regulations and agreements related to the environment.
■Implementation of environmental education and awareness raising
We conduct education for our employees to cultivate personnel who can understand and put into practice the Kansai Electric Power Group Environmental Action Policy.
Specifically, we conduct specialized education for staff members who are responsible for environmental concerns at every business place. For every employee, we also provide general education that contributes to knowledge of environmental initiatives undertaken by society and our corporate group.
Continuous improvement using environmental management systems based on ISO 14001 systems and strict adherence to laws and regulations

5.Promoting environmental management and environmental communication 66
Active advancement of environmental awarenessraising activities with local communities and customers and disclosure of environmental information
■Promoting environmental communication
Committed to the proactive release of environmental information and the promotion of a sustainable society, Kansai Electric Power is not only addressing various ecological issues, but also actively working with customers and the regional community to raise environmental awareness.
○Community environmental initiatives undertaken in cooperation with local governments
We consider the environment together with the community residents through environmental events hosted by the local government, cleaning campaigns, and environmental education at local schools. We emphasize environmental communication by seeking out residents’ opinions about our initiatives.
○Initiatives for Kansai Electric Power GroupEnvironment Month
June is Environment Month at Kansai Electric Power Group, a time when our entire Group engages in activities such as community cleanups, tree planting, exhibiting at environmental events, and conducting on-site environmental classes at schools. Our Group has undertaken a variety of environmental initiatives.
5.Promoting environmental management and environmental communication 67
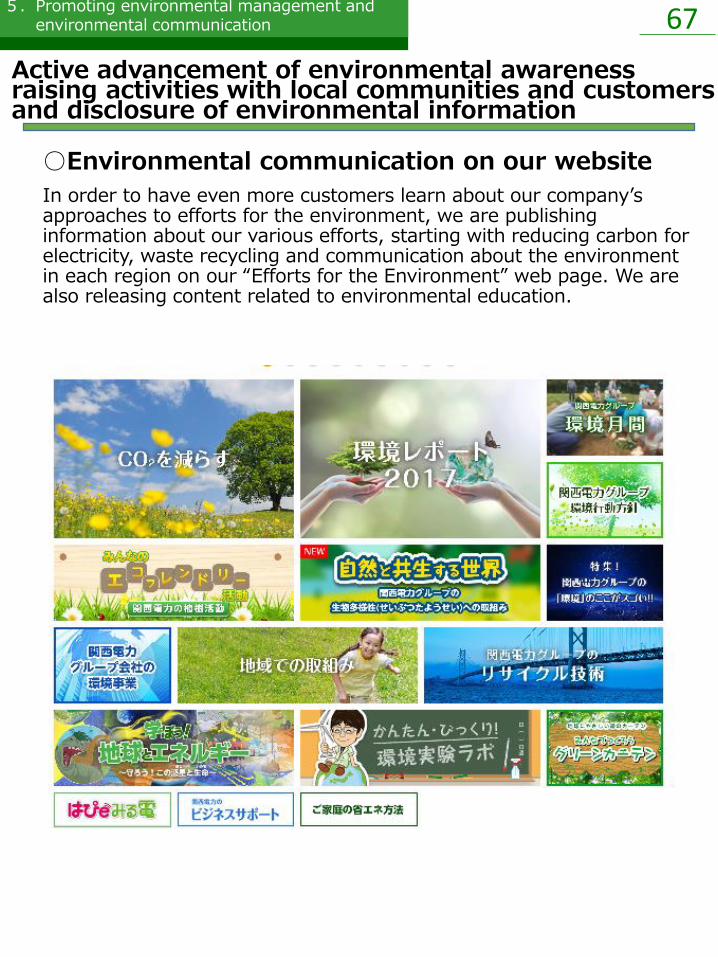
○Environmental communication on our website
In order to have even more customers learn about our company’s approaches to efforts for the environment, we are publishing information about our various efforts, starting with reducing carbon for electricity, waste recycling and communication about the environment in each region on our “Efforts for the Environment” web page. We are also releasing content related to environmental education.
Active advancement of environmental awarenessraising activities with local communities and customers and disclosure of environmental information

68
<Data>
<Environmental Data 2018> 69
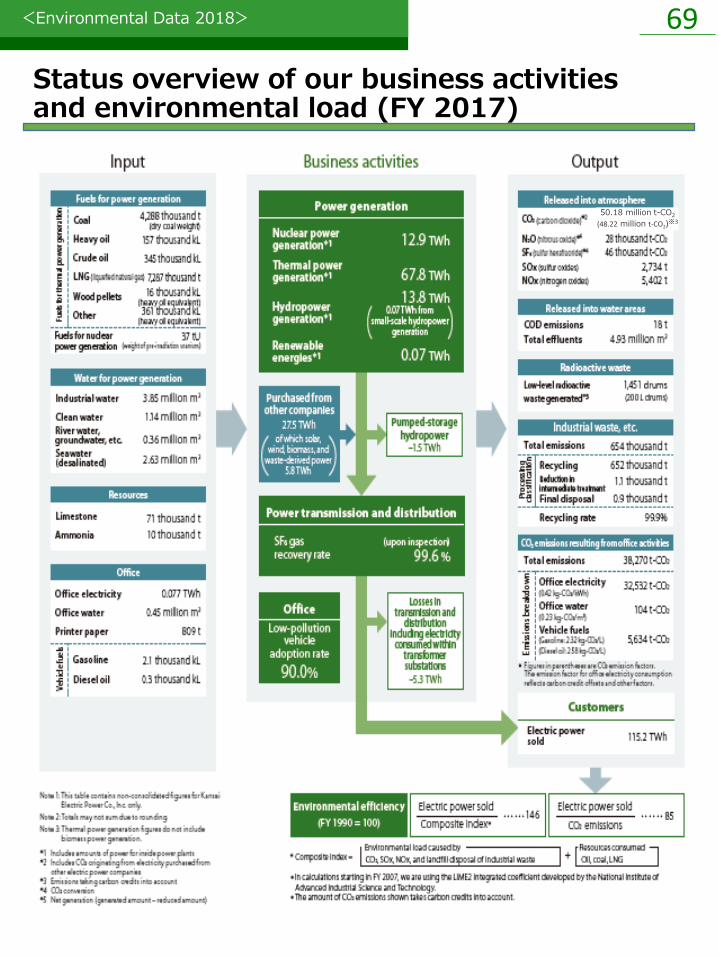
Status overview of our business activities and environmental load (FY 2017)
50.18 million t-CO2
(48.22 million t-CO2)※3
<Environmental Data 2018> 70
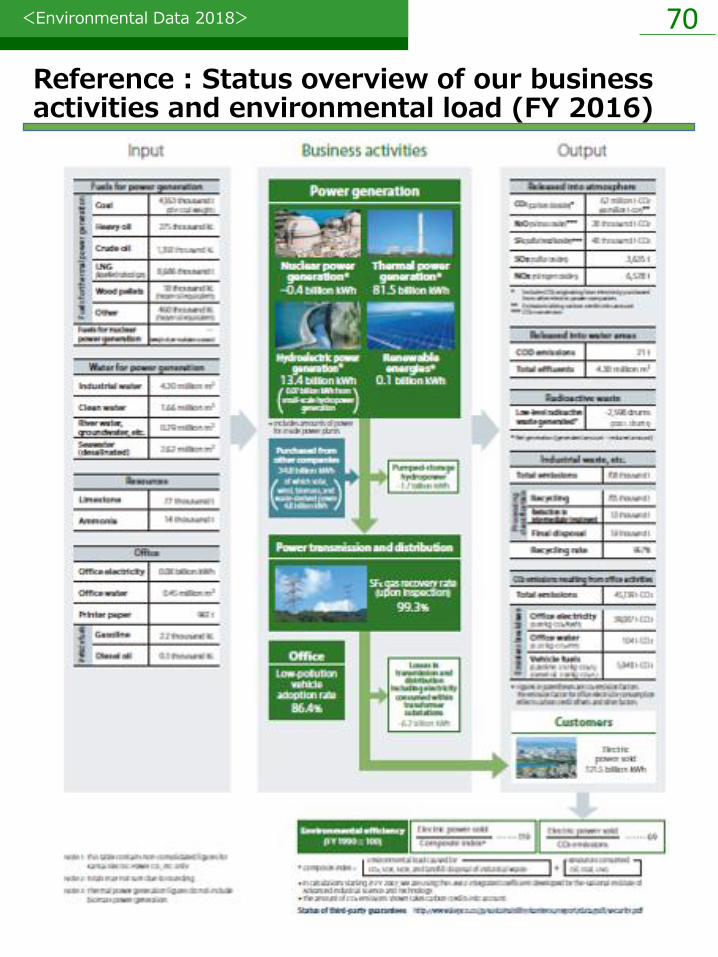
Reference : Status overview of our business activities and environmental load (FY 2016)

<Environmental Data 2018> 71
Environmental accounting (KEPCO ①)
Note: Based on the Environmental Reporting Guidelines (FY2005 version) issued by the Ministry of the Environment. Depreciation is not calculated into expenses. Composite costs are tallied proportionally by one of three methods: (1)calculation of differences; (2) proportional division based on rational criteria; (3) proportional division based on criteria of expediency. Costs involved in generating nuclear power are calculated with the sum of individual measures to protect the environment taken as environmental conservation costs (radiation control and measurement, low-level radioactive waste processing, etc.). Figures may not add up due to rounding off.
KEPCO has introduced environmental accounting both on a non-consolidated basis and for group companies to clarify the costs of environmental conservation in our business activities and the benefits achieved.
FY2017 assessment(Environmental conservation costs)For environmental conservation costs, investments were about 9 billion yen, about 3 billion less than the previous fiscal year. Due to industrial waste processing costs and other cost reduction efforts, expenses were about 18 billion yen, which is about 1 billion yen less than the previous fiscal year.
Environmental conservation costs (100 million yen)
1. Global environmental conservation costs
(CO2 reductions,etc.)8.5 3.4 1.9 0.7 SF6 gas collection
2.Local environmental conservation costs 109 87 46.8 44.0
(1)Measuring/monitoring
environmental impact1.9 4.0 11.4 12.5
Radiation control and measurement, air
quality concentration measurement,
marine area surveys
(2)Pollution control(air pollution, water
contamination, oil leakage, etc.)106.8 82.5 27.6 23.4
Air pollution control measures, water
contamination prevention measures
(3)Nature conservation 0 0 7.8 8.1 Revegetation
3.Costs to build a circular economy 3.4 1.2 140.5 134.7
(1)Industrial waste processing,
recycling3.3 1.2 65.7 63.9
Industrial waste processing,
PCB processing
(2)General waste processing, recycling 0 0 0.1 0.1 Paper recycling
(3)Radioactive waste processing 0 0 74.7 70.7 Low-level radioactive waste processing
(4)Green purchasing 0.1 0.1 0 0 Research-related work
4.Environmental management costs 0 0 1.1 0.8 Environmental reports
5.R&D costs 0.2 0.2 4.3 3.0
Load leveling, environmental
conservation, energy savings
and recycling, natural energy
6.Other costs 0 0 0.2 0.2 Research Laboratory repairs
Total 120.7 91.3 194.9 183.5
Total capital investment
during the period2,324 2,954 - -
Operating expenses
during period- - 24,499 25,185
CategoryInvestment Expenses
Major itemsFY2016 FY2017 FY2016 FY2017

<Environmental Data 2018> 72
Note: CO2 emissions: including from power supplied by other companies; CO2 emissions coefficient: by amount of power sold(after adjustment CO2 emission factors include deductions that reflect CO2 credits and other deductions, as well as environmental valueadjustments based on the purchasing system for surplus solar and the purchasing system for total amounts of renewable); SOx and NOx emissions: only KEPCO-generated power; SOx and NOx emissions coe cient: by amount of power generated by KEPCO thermal power plants
FY2017 assessment(Effects of environmental conservation)We improved the CO2 emission intensity over the previous fiscal year. In addition to the increased utilization ratios of nuclear power and hydroelectric power compared to the previous fiscal year, this result was due to the increased utilization rate of high-efficiency natural gas power generation equipment at the Himeji No.2 Power Station as well as the increased use of renewable energy using a feed-in tariff system and other efforts for carbon reduction.
Moreover, the SOx and NOx emission intensities improved over the previous fiscal year as a result of the the suitable use of sulfur scrubbers and nitrogen scrubbers, and other efforts.
Effects of environmental conservation
Environmental accounting (KEPCO ②)
CO2 emissions
(before carbon credits)
CO2 emissions intensity
(before carbon credits)
CO2 emissions
(after carbon credits)
CO2 emissions intensity
(after carbon credits)
SOx emissions (t) 3,635 2,734 ▲ 901
SOx emissions intensity (g/kWh) 0.043 0.039 ▲ 0.004
NOx emissions (t) 6,528 5,402 ▲ 1,126
NOx emissions intensity (g/kWh) 0.077 0.077 0.000
Revegetation area (1,000 m2) 3,425 3,341 ▲ 84
Industrial waste and other
emissions(1,000 t) 708 654 ▲ 54
Recycling rate for
industrial waste, etc(%) 99.7 99.9 0.2
Low-level radioactive
waste processing(Rods) -2,598 1,451 4,049
3.Building a
circular
economy
FY2016 FY2017Year-on-year
change
(kg-CO2/kWh) 0.493 0.418 ▲ 0.08
(kg-CO2/kWh) 0.509 0.435 ▲ 0.07
2.Local
environmental
conservation
Air pollution control
Landscape integration
(10,000t-CO2) 5,989 4,822 ▲ 1,167
1.Global
environmental
conservation
(10,000t-CO2) 6,179 5,018 ▲ 1,161
Category Item (unit)

<Environmental Data 2018> 73
Note: LIME2 integration coefficients developed by the National Institute of Advanced Industrial Science and Technology have been used for calculations since fiscal 2007.
Environmental efficiencyEnvironmental efficiency (with FY1990 as the base year) is calculated to indicate the relationship between environmental load and economic value.
Environmental efficiency for fiscal 2017 include scores of 146 for electric power sold/composite index, which is an increase of 27 points from the previous fiscal year, and 85 for electric power sold/CO2 emissions, which is an increase of 13 points from the previous fiscal year. Main factors for this included reductions in CO2, SOx and NOx emissions intensities and a decrease in fuel consumption accompanying the resumption of nuclear power plant operation.
Economic benefits from environmental conservation measures (100 million yen)
FY2017 assessment(Economic benefits from environmental conservation measures)
Economic benefits increased approximately 1.7 billion yen from the previous year due to a reduction in results from efforts that lead to cost savings.
Environmental efficiency graph
108 109 115 119
146
68 68 71 72 85
50
70
90
110
130
150
170
'13 '14 '15 '16 '17
23.3 40.0
FY2016 FY2017
Operating revenues from
recycling, etc.
Cost savings from reuse and
recycling, etc.
Cost
savings0.1 0.1
Cost savings from the purchase of
recycled items
Total
Category Major Items
Revenue 23.2 39.9 Gain on sale of disused articles(recycling)
(Fiscal year)
Environmental accounting (KEPCO ③)
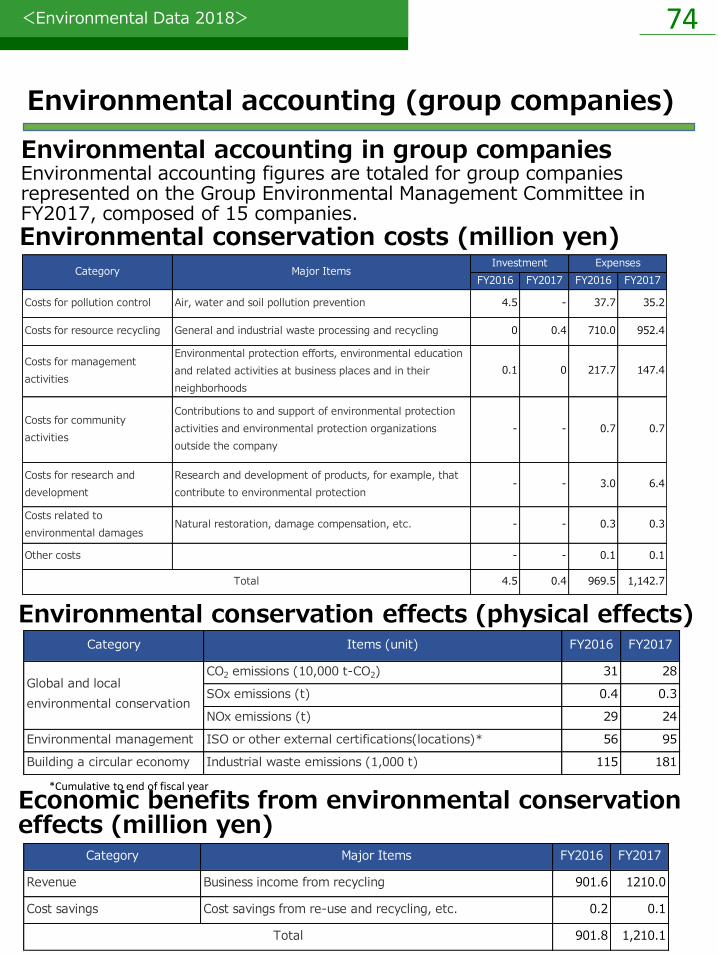
<Environmental Data 2018> 74
Environmental accounting (group companies)
*Cumulative to end of fiscal year
Environmental conservation costs (million yen)
Environmental accounting in group companiesEnvironmental accounting figures are totaled for group companies represented on the Group Environmental Management Committee in FY2017, composed of 15 companies.
Environmental conservation effects (physical effects)
Economic benefits from environmental conservation effects (million yen)
FY2016 FY2017 FY2016 FY2017
Costs for pollution control Air, water and soil pollution prevention 4.5 - 37.7 35.2
Costs for resource recycling General and industrial waste processing and recycling 0 0.4 710.0 952.4
Costs for management
activities
Environmental protection efforts, environmental education
and related activities at business places and in their
neighborhoods
0.1 0 217.7 147.4
Costs for community
activities
Contributions to and support of environmental protection
activities and environmental protection organizations
outside the company
- - 0.7 0.7
Costs for research and
development
Research and development of products, for example, that
contribute to environmental protection- - 3.0 6.4
Costs related to
environmental damagesNatural restoration, damage compensation, etc. - - 0.3 0.3
Other costs - - 0.1 0.1
4.5 0.4 969.5 1,142.7Total
ExpensesCategory Major Items
Investment
Category Major Items FY2016 FY2017
Revenue Business income from recycling 901.6 1210.0
Cost savings Cost savings from re-use and recycling, etc. 0.2 0.1
901.8 1,210.1Total
Category Items (unit) FY2016 FY2017
CO2 emissions (10,000 t-CO2) 31 28
SOx emissions (t) 0.4 0.3
NOx emissions (t) 29 24
Environmental management ISO or other external certifications(locations)* 56 95
Building a circular economy Industrial waste emissions (1,000 t) 115 181
Global and local
environmental conservation

<Environmental Data 2018> 75
Environment-related data
※1 The direct greenhouse gas emission amounts (scope 1) are totals of direct greenhouse gas emissions (CO2, SF6 and N2O from energy) reported (for the business) in accordance with the Warming Countermeasures Act and CO2 emissions from vehicle fuel not included in this reporting.※2 The indirect greenhouse gas emission amounts (scope 2) are totals of CO2 emissions from electricity and heat purchased from others among those reported (for the business) in accordance with the Warming Countermeasures Act as indirect CO2 emissions.※3 For other indirect greenhouse gas emission amounts (scope 3, categories 4 and 5), contracted transportation amounts were extracted from the reporting (of the shippers) in accordance with the Warming Countermeasures Act. They were mainly calculated using the ton-kilometer method.
※1 The amount of CO2 emissions is the amount produced from consumption of fuel used for power generation by thermal power plants and includes that for power purchased from other companies.※2 After adjustment figures include deductions that reflect CO2 credits as well as environmental value adjustments based on the purchasing system for surplus solar and the purchasing system for total amounts of renewable energy in the CO2 emissions amounts.CO2 emissions amount = CO2 emissions amount(before adjustment) + feed-in tariff adjustment CO2 emissions amount,etc.※3 CO2 emissions coefficient (end use) is the amount of CO2 emissions per kWh of Kansai Electric Power Company electricity used.
・CO2 emissions coefficient (end use) (before adjustment) = amount of CO2 emissions (before adjustment) ÷ electricity sales volume・CO2 emissions coefficient (end use) (after adjustment) = amount of CO2 emissions (after adjustment) ÷ electricity sales volume
※4 Global CO2 emissions: IEA "CO2 Emissions From Fuel Combustion" 2015 Edition※5 Japan's CO2 emissions: Source: Greenhouse Gas Inventory Office of Japan (Center for Global Environmental Research, National Institute for Environmental Studies)※6 Sources for CO2 emissions and CO2 emission coefficients for the electric power industry are resources from the Industrial Structure Council and materials from the Natural Resources and Energy Working Group of the Electric Power Council for a Low Carbon Society(ELCS).(Through fiscal 2014, the total of results of the Federation of Electrical Power Companies of Japan and volunteering PPS (power producer and supplier) companies are used. In fiscal 2015,the results of 39 companies that undertook business activities that fiscal year among member businesses of the ELCS are used.)※7 Published in FY2010 results; figures are CO2 equivalents※8 Utilization rate of nuclear power facilities = amount of power generated÷(permitted output× calendar hours)×100※9 Net thermal efficiency of thermal power facilities = (amount of power transmitted × quantity of heat per kWh)※10 Figures reported to the government based on the Act on the Rational Use of Energy.(Fossil fuel used, purchased electricity, purchased heat)
○Initiatives contributing to the realization of a low-carbon society
2013 2014 2015 2016 2017 Unit
7,325 7,141 6,487 6,179 5,018 10,000 t-CO2
7,251 7,029 6,331 5,989 4,822 10,000 t-CO2
0.522 0.531 0.509 0.509 0.435 kg-CO2/kWh
0.516 0.523 0.496 0.493 0.418 kg-CO2/kWh
321 324 ─ ─ 0.42100 million
t-CO2
13.16 12.66 12.26 12.06 ─100 million
t-CO2
CO2 emissions
(before carbon credits,etc.)4.94 4.70 4.44 4.32 ─
CO2 emissions
(after carbon credits,etc.)4.93 4.69 4.41 4.30 ─
CO2 emissions
(before carbon credits,etc.)
(by amount of electric power sold)
0.567 0.553 0.534 0.518 ─
CO2 emissions
(after carbon credits,etc.)
(by amount of electric power sold)
0.567 0.552 0.531 0.516 ─
N2O (dinitrogen oxide)※7
2.6 2.9 2.7 2.8 2.8 10,000 t-CO2
SF6 (sulfur hexafluoride)※7 4.9 5.0 4.4 4.8 4.6 10,000 t-CO2
10.9 0.0 1.0 0.0 18.0 %
44.6 46.5 46.6 47.6 48.3 %
765,923 760,782 701,315 675,113 554,793 1,000GJ
Greenhouse gases
other than CO2
Utilization rate of nuclear power facilities※8
Net thermal efficiency of thermal power facilities※9
Total energy use※10
Fiscal year
CO2 emissions (before adjustment)※1
CO2 emissions (after adjustment)※2
CO2 emissions coefficient (end use)(before adjustment)
(by amount of electric power sold)※3
CO2 emissions coefficient (end use)(after adjustment)
(by amount of electric power sold)※3
Japan's CO2 emissions※5
Electric
power
industry※6
Reference
100 million
t-CO2
kg-CO2/kWh
Global CO2 emissions※4
2014 2015 2016 2017
4,571 4,180 3,949 3,284
1.0 1.0 1.0 1.0
- 3.6 2.6 1.9
Fiscal year
Total direct GHG emissions (Scope1)*1
Indirect greenhouse gas emissions from energy
purchased and consumed (Scope2)*2
Other indirect greenhouse gas emission
amounts*3
(related to scope 3, categories 4 and 5)
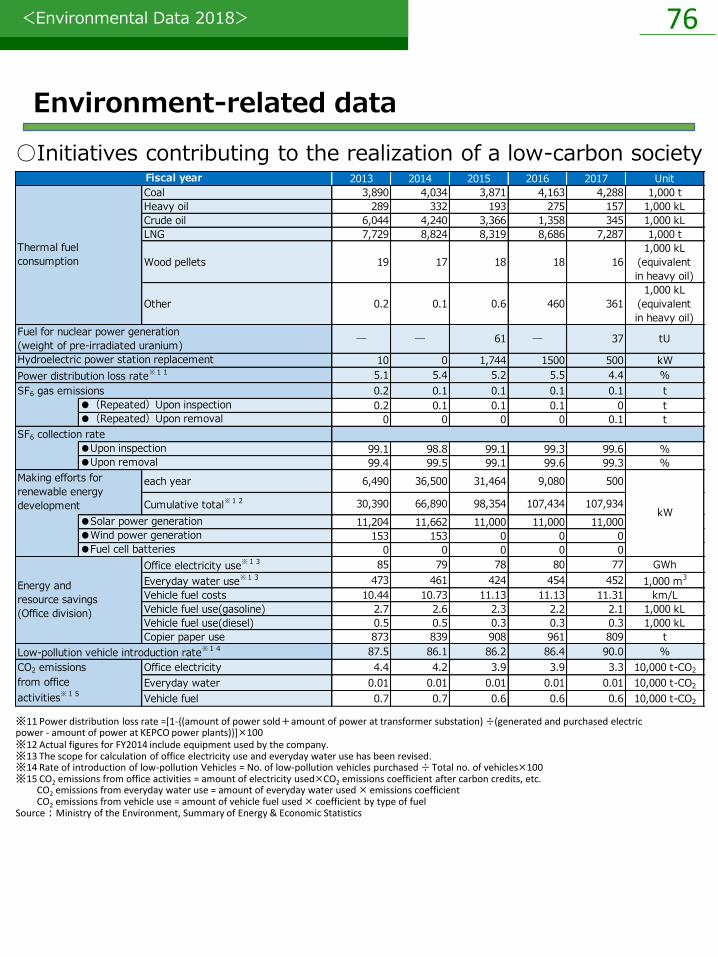
<Environmental Data 2018> 76
※11 Power distribution loss rate =[1-{(amount of power sold+amount of power at transformer substation) ÷(generated and purchased electric power - amount of power at KEPCO power plants)}]×100※12 Actual figures for FY2014 include equipment used by the company.※13 The scope for calculation of office electricity use and everyday water use has been revised.※14 Rate of introduction of low-pollution Vehicles = No. of low-pollution vehicles purchased ÷ Total no. of vehicles×100※15 CO2 emissions from office activities = amount of electricity used×CO2 emissions coefficient after carbon credits, etc.
CO2 emissions from everyday water use = amount of everyday water used × emissions coefficientCO2 emissions from vehicle use = amount of vehicle fuel used × coefficient by type of fuel
Source:Ministry of the Environment, Summary of Energy & Economic Statistics
○Initiatives contributing to the realization of a low-carbon society
Environment-related data
2013 2014 2015 2016 2017 Unit
Coal 3,890 4,034 3,871 4,163 4,288 1,000 t
Heavy oil 289 332 193 275 157 1,000 kL
Crude oil 6,044 4,240 3,366 1,358 345 1,000 kL
LNG 7,729 8,824 8,319 8,686 7,287 1,000 t
Wood pellets 19 17 18 18 16
1,000 kL
(equivalent
in heavy oil)
Other 0.2 0.1 0.6 460 361
1,000 kL
(equivalent
in heavy oil)
─ ─ 61 ─ 37 tU
10 0 1,744 1500 500 kW
5.1 5.4 5.2 5.5 4.4 %
0.2 0.1 0.1 0.1 0.1 t
0.2 0.1 0.1 0.1 0 t
0 0 0 0 0.1 t
99.1 98.8 99.1 99.3 99.6 %
99.4 99.5 99.1 99.6 99.3 %
each year 6,490 36,500 31,464 9,080 500
Cumulative total※12 30,390 66,890 98,354 107,434 107,934
11,204 11,662 11,000 11,000 11,000
153 153 0 0 0
0 0 0 0 0
Office electricity use※13 85 79 78 80 77 GWh
Everyday water use※13 473 461 424 454 452 1,000 m3
Vehicle fuel costs 10.44 10.73 11.13 11.13 11.31 km/L
Vehicle fuel use(gasoline) 2.7 2.6 2.3 2.2 2.1 1,000 kL
Vehicle fuel use(diesel) 0.5 0.5 0.3 0.3 0.3 1,000 kL
Copier paper use 873 839 908 961 809 t
87.5 86.1 86.2 86.4 90.0 %
Office electricity 4.4 4.2 3.9 3.9 3.3 10,000 t-CO2
Everyday water 0.01 0.01 0.01 0.01 0.01 10,000 t-CO2
Vehicle fuel 0.7 0.7 0.6 0.6 0.6 10,000 t-CO2
CO2 emissions
from office
activities※15
Energy and
resource savings
(Office division)
Low-pollution vehicle introduction rate※14
Fiscal year
●(Repeated)Upon removal
Fuel for nuclear power generation
(weight of pre-irradiated uranium)
Making efforts for
renewable energy
development
Hydroelectric power station replacement
Power distribution loss rate※11
SF6 gas emissions
Thermal fuel
consumption
SF6 collection rate
●(Repeated)Upon inspection
●Upon inspection
●Upon removal
●Solar power generation
●Wind power generation
●Fuel cell batteries
kW

<Environmental Data 2018> 77
※1 Industrial waste recycling rate = [(Industrial waste and other emissions - Amount of landfill disposal) ÷ (Industrial waste and other emissions)]×100※2 Processing at pole-mounted transformer case recycling center was completed in July 2015.※3 Excluding desalinated seawater
○Initiatives contributing to the realization of a recycling-oriented society
Environment-related data
2013 2014 2015 2016 2017 Unit
747.1 698.6 670.2 707.9 653.6 1,000 t
12.0 3.4 4.0 4.4 5.5
477.1 474.3 443.8 480.6 438.3
156.9 143.2 141.9 141.1 130.3
29.7 27.4 28.8 28.0 28.6
19.3 21.0 23.8 18.3 16.5
42.4 21.7 20.6 28.9 29.1
2.7 2.5 2.2 2.6 1.8
3.4 2.4 2.2 2.4 2.2
1.2 1.0 0.8 0.8 0.9
14.5 5.1 6.0 5.4 6.0
1.3 1.2 0.9 1.8 0.9 1,000 t
0.00 1.20 0.90 1.40 0.50
0.11 0.12 0.10 0.33 0.06
0.73 0.74 0.47 0.34 0.19
0.09 0.11 0.03 0.02 0.03
0.0 0.0 0.0 0.0 0.0
0.23 0.07 0.09 0.07 0.05
0.10 0.05 0.10 0.55 0.19
0.06 0.13 0.14 0.52 0.42
99.8 99.8 99.9 99.7 99.9 %
100 100 100 100 100 %
Insulating oil 7.7 7.7 7.7 - - 10,000kL
Transformer cases 20.6 22.7 about 24 - - 10,000 units
Total net fresh water consumption※3 7.10 6.76 6.86 6.25 5.35 1,000,000 m3
0.42 0.40 0.36 0.29 0.36 1,000,000 m3
0.00 0.00 0.00 0.00 0.00 1,000,000 m3
Total municipal water supplies 6.68 6.36 6.50 5.96 4.99 1,000,000 m3
4.46 4.31 4.53 4.30 3.85 1,000,000 m3
2.22 2.05 1.97 1.66 1.14 1,000,000 m3
2.63 2.45 2.55 2.62 2.63 1,000,000 m3
●Other
(Repeated) Ash and gypsum waste recycling rate※1
Fiscal year
Amount of industrial waste and other emissions
Amount of industrial waste for landfill disposal
(Repeated)Special controlled industrial waste
(Repeated)Total amount except for Special
controlled industrial waste
●Soot particles (Heavy/crude oil ash, coal ash,etc.)
●Sludge (Desulfogypsum,wastewater processing sludge,etc.)
●Demolition debris(Waste concrete utility poles,etc.)
●Cinders
●Metal scraps
●Glass/ceramic scraps(Thermal insulation scraps,insulator
scraps, etc.)
●Waste oil
●Waste plastic
1,000 t
1,000 t
Seawater (desalinated)
River water
Groundwater
Amount of industrial water used (for power generation)
Amount of service water used (for power generation)
●Other
●Glass/ceramic scraps
(Thermal insulation scraps,insulator scraps,etc.)
●sludge(Wastewater processing sludge,etc.)
Low-concentration PCB industrial waste
Amount processed※2
(utility pole transformers)
Industrial waste recycling rate※1
●Demolition debris
●Cinders
●Waste plastic
●Metal scraps
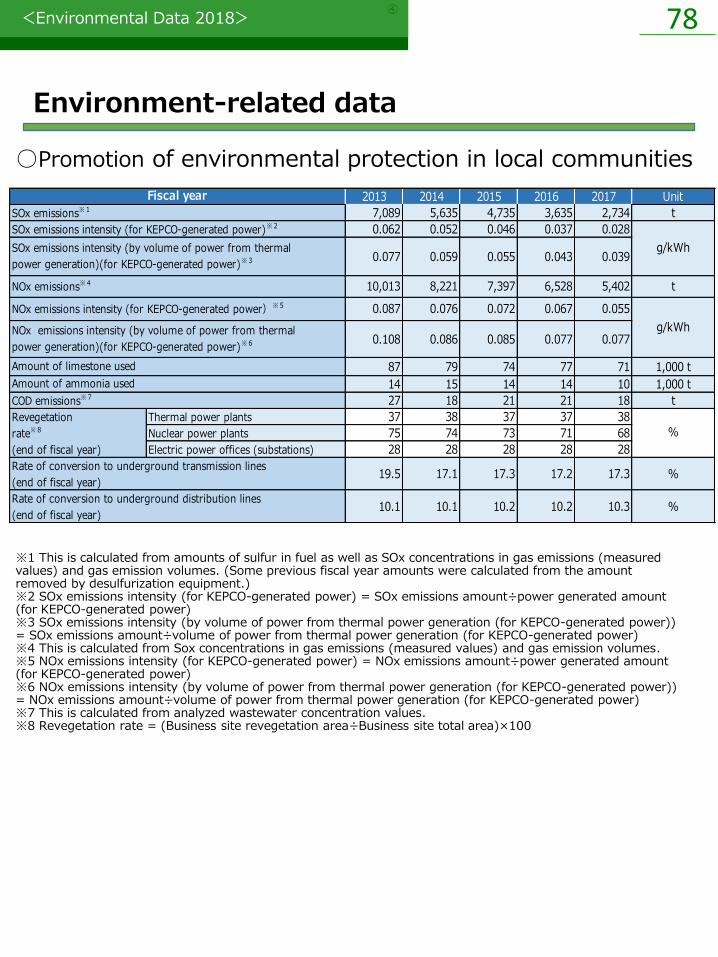
<Environmental Data 2018> 78
※1 This is calculated from amounts of sulfur in fuel as well as SOx concentrations in gas emissions (measured values) and gas emission volumes. (Some previous fiscal year amounts were calculated from the amount removed by desulfurization equipment.)※2 SOx emissions intensity (for KEPCO-generated power) = SOx emissions amount÷power generated amount (for KEPCO-generated power)※3 SOx emissions intensity (by volume of power from thermal power generation (for KEPCO-generated power)) = SOx emissions amount÷volume of power from thermal power generation (for KEPCO-generated power)※4 This is calculated from Sox concentrations in gas emissions (measured values) and gas emission volumes.※5 NOx emissions intensity (for KEPCO-generated power) = NOx emissions amount÷power generated amount (for KEPCO-generated power)※6 NOx emissions intensity (by volume of power from thermal power generation (for KEPCO-generated power)) = NOx emissions amount÷volume of power from thermal power generation (for KEPCO-generated power)※7 This is calculated from analyzed wastewater concentration values.※8 Revegetation rate = (Business site revegetation area÷Business site total area)×100
○Promotion of environmental protection in local communities
Environment-related data
2013 2014 2015 2016 2017 Unit
7,089 5,635 4,735 3,635 2,734 t
0.062 0.052 0.046 0.037 0.028
0.077 0.059 0.055 0.043 0.039
10,013 8,221 7,397 6,528 5,402 t
NOx emissions intensity (for KEPCO-generated power)※5 0.087 0.076 0.072 0.067 0.055
0.108 0.086 0.085 0.077 0.077
87 79 74 77 71 1,000 t
14 15 14 14 10 1,000 t
27 18 21 21 18 t
Thermal power plants 37 38 37 37 38
Nuclear power plants 75 74 73 71 68
Electric power offices (substations) 28 28 28 28 28
19.5 17.1 17.3 17.2 17.3 %
10.1 10.1 10.2 10.2 10.3 %
g/kWh
g/kWh
%
Rate of conversion to underground distribution lines
(end of fiscal year)
Revegetation
rate※8
(end of fiscal year)
COD emissions※7
Rate of conversion to underground transmission lines
(end of fiscal year)
NOx emissions intensity (by volume of power from thermal
power generation)(for KEPCO-generated power)※6
Amount of limestone used
Amount of ammonia used
Fiscal year
SOx emissions※1
SOx emissions intensity (for KEPCO-generated power)※2
SOx emissions intensity (by volume of power from thermal
power generation)(for KEPCO-generated power)※3
NOx emissions※4

<Environmental Data 2018> 79
Notes : ●The chart show total values reported in compliance with the PRTR Law●"0"indicates no emissions or transfers at targeted business site●"<0.1"indicates less than 0.1 t/year emissions, etc.●"-" indicates no business sites targeted for totaling●Significant figures are displayed in two digits
○Management of chemical substances (PRTR)
Environment-related data
2013 2014 2015 2016 2017
2-aminoethanol 5.6 8.9 - - 4.1
Asbestos (specified) 2.7 5.1 3.4 1.3 4.7
Ethylbenzene 0 0 0 0 0
Ferric chloride 0 3 0 0 0
Xylene 0 0 <0.1 0 0
HCFC-225 0 - 2.2 - -
Styrene 0 - 0 0 -
Dioxins (specified)0.0016
(mg-TEQ/year)
0.0050
(mg-TEQ/年)
0.000079
(mg-TEQ/年)
0.04
(mg-TEQ/年)
1.4
(mg-TEQ/年)
1,2,4-trimethylbenzene - - 0 0 0
Toluene 0 0 0 0 0
Hydrazine <0.1 3.1 3 0.9 2.5
n-Hexane 0 0 0 0 -
Benzenes (specified) 0 0 0 0 0
Boron compound 1.1 6.7 7.3 6.3 8.4
PCB - - - - 5.3
Methylnaphthalene 0 <0.1 0 0 0
Methylenebis (4,1-
phenylene) diisocyanate- - - - -
Name of targeted
chemical substance
Amount moved (t/year)
2013 2014 2015 2016 2017
2-aminoethanol 0 0 - - 0
Asbestos (specified) 0 0 0 0 0
Ethylbenzene 6.0 6.2 12 11 3.8
Ferric chloride 0 0 0 0 0
Xylene 12 12 16 17 5.4
HCFC-225 3.6 - 0 - -
Styrene 2.6 - 2 1.5 -
Dioxins (specified)0.13
(mg-TEQ/year)
0.28
(mg-TEQ/year)
0.54
(mg-TEQ/year)
0.66
(mg-TEQ/year)
0.29
(mg-TEQ/year)
1,2,4-trimethylbenzene - - 0 0 1.9
Toluene 14 12 11 7.2 5.9
Hydrazine <0.1 <0.1 <0.1 <0.1 <0.1
n-Hexane 8.3 5.9 4.6 0.6 -
Benzenes (specified) 3.3 2.4 1.9 0.8 0.2
Boron compound 0 0 0 0 0
PCB - - - - 0
Methylnaphthalene 2.8 3.3 3.4 3.2 2.4
Methylenebis (4,1-
phenylene) diisocyanate- - - - -
Name of targeted
chemical substance
Emissions (t/year)

<Environmental Data 2018> 80
*1 Millisieverts (effective dose): unit indicating the degree of radiation's effect on the human body*2 Becquerel: Unit of radioactivity (one becquerel is defined as one nucleus decaying per second, representing the rate at which radioactive material emits radiation)*3 Notes 4-7 are for the storage status at power plants*4 This is the amount of solid low-level radioactive waste produced in the fiscal year.*5 This is the total of amount of solid waste with low-level radioactivity reduced through incineration, for example, and transported out of facilities in the fiscal year.*6 This is the net increase of solid waste with low-level radioactivity calculated by deducting the amount reduced from the amount generated in the fiscal year.*7 Cumulative amount of low-level solid radioactive waste*8 Totals might not match due to rounding after conversion to drum equivalent.
○Radioactive substances, radioactive waste
Environment-related data
2013 2014 2015 2016 2017 Unit
Mihama Nuclear Power Station N.D. N.D. N.D. <0.001 N.D.
Takahama Nuclear Power Station N.D. <0.001 <0.001 N.D. N.D.
Ohi Nuclear Power Station N.D. N.D. N.D. N.D. N.D.
Mihama Nuclear Power Station N.D. N.D. N.D. N.D. N.D.
Takahama Nuclear Power Station N.D. N.D. N.D. N.D. N.D.
Ohi Nuclear Power Station N.D. N.D. N.D. N.D. N.D.
Mihama Nuclear Power Station <0.001 <0.001 <0.001 <0.001 <0.001
Takahama Nuclear Power Station <0.001 <0.001 <0.001 <0.001 <0.001
Ohi Nuclear Power Station <0.001 <0.001 <0.001 <0.001 <0.001
Mihama Nuclear Power Station N.D. N.D. N.D. 2.7E+9 N.D.
Takahama Nuclear Power Station N.D. 2.3E+08 2.5E+08 N.D. N.D.
Ohi Nuclear Power Station N.D. N.D. N.D. N.D. N.D.
Mihama Nuclear Power Station N.D. N.D. N.D. N.D. N.D.
Takahama Nuclear Power Station N.D. N.D. N.D. N.D. N.D.
Ohi Nuclear Power Station N.D. N.D. N.D. N.D. N.D.
Mihama Nuclear Power Station N.D. N.D. N.D. N.D. N.D.
Takahama Nuclear Power Station N.D. N.D. N.D. N.D. N.D.
Ohi Nuclear Power Station N.D. N.D. N.D. N.D. N.D.
12,372 15,756 14,318 13,750 15,863
4,299 4,888 4,978 4,302 5,000
3,649 6,368 4,471 5,002 5,722
4,424 4,500 4,869 4,446 5,141
13,972 18,082 20,298 16,348 14,412
4,085 5,710 6,583 4,514 5,424
4,893 6,152 7,402 6,984 4,354
4,994 6,220 6,313 4,850 4,634
-1,600 -2,326 -5,980 -2,598 1,451
214 -822 -1,605 -212 -424
-1,244 216 -2,931 -1,982 1,368
-570 -1,720 -1,444 -404 507
107,061 104,735 98,756 96,159 97,610
28,313 27,491 25,887 25,675 25,251
46,616 46,832 43,901 41,919 43,287
32,132 30,412 28,968 28,565 29,072
Mihama Nuclear Power Station
Takahama Nuclear Power Station
Ohi Nuclear Power Station
Mihama Nuclear Power Station
Takahama Nuclear Power Station
Ohi Nuclear Power Station
Mihama Nuclear Power Station
Takahama Nuclear Power Station
Ohi Nuclear Power Station
Equivalent
in drums
Equivalent
in drums
Equivalent
in drums
Millisieverts※1
Becquerel※2
Becquerel※2
Becquerel※2
Equivalent
in drums
Radioactive solid nuclear waste cumulative amount stored
(200-L drums)※7、8
Mihama Nuclear Power Station
Takahama Nuclear Power Station
Ohi Nuclear Power Station
Radioactive solid nuclear waste shrinkage (200-L drums)※5
Amount of solid radioactive waste generated-amount of
solid radioactive waste reduced (200-L drum can equivalent)※6
Millisieverts※1
Fiscal year
Millisieverts※1
Gaseous
waste
Evaluated dose values
for the public in the
vicinity of power plants
(inert gases)
Evaluated dose values
for the public in the
vicinity of power plants
(iodine)
Evaluated dose values
for the public in the
vicinity of power plants
Liquid
waste
Radioactive gaseous
waste discharged
(inert gas)
Radioactive gaseous
waste discharged
(iodine)
Radioactive gaseous
waste discharged
(excluding tritium)
Radioactive solid nuclear waste generated (200-L drums)※4
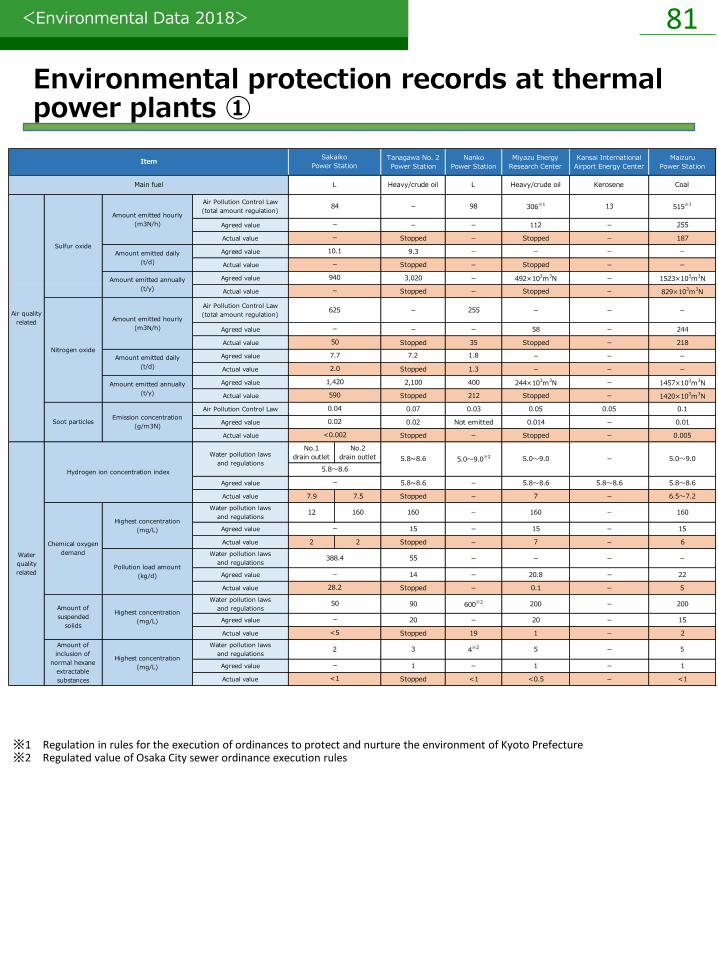
<Environmental Data 2018> 81
Environmental protection records at thermal power plants ①
Tanagawa No. 2
Power Station
Nanko
Power Station
Miyazu Energy
Research Center
Kansai International
Airport Energy Center
Maizuru
Power Station
Heavy/crude oil L Heavy/crude oil Kerosene Coal
Air Pollution Control Law
(total amount regulation)- 98 306※1 13 515※1
Agreed value - - 112 - 255
Actual value Stopped - Stopped - 187
Agreed value 9.3 - - - -
Actual value Stopped - Stopped - -
Agreed value 3,020 - 492×103m3N - 1523×103m3N
Actual value Stopped - Stopped - 829×103m3N
Air Pollution Control Law
(total amount regulation)- 255 - - -
Agreed value - - 58 - 244
Actual value Stopped 35 Stopped - 218
Agreed value 7.2 1.8 - - -
Actual value Stopped 1.3 - - -
Agreed value 2,100 400 244×103m
3N - 1457×10
3m
3N
Actual value Stopped 212 Stopped - 1420×103m3N
Air Pollution Control Law 0.07 0.03 0.05 0.05 0.1
Agreed value 0.02 Not emitted 0.014 - 0.01
Actual value Stopped - Stopped - 0.005
No.1
drain outlet
No.2
drain outlet
Agreed value 5.8~8.6 - 5.8~8.6 5.8~8.6 5.8~8.6
Actual value 7.9 7.5 Stopped - 7 - 6.5~7.2
Water pollution laws
and regulations12 160 160 - 160 - 160
Agreed value 15 - 15 - 15
Actual value 2 2 Stopped - 7 - 6
Water pollution laws
and regulations55 - - - -
Agreed value 14 - 20.8 - 22
Actual value Stopped - 0.1 - 5
Water pollution laws
and regulations90 600※2 200 - 200
Agreed value 20 - 20 - 15
Actual value Stopped 19 1 - 2
Water pollution laws
and regulations3 4
※2 5 - 5
Agreed value 1 - 1 - 1
Actual value Stopped <1 <0.5 - <1
Amount of
inclusion of
normal hexane
extractable
substances
Water
quality
related
Air quality
related
Sulfur oxide
Sakaiko
Power Station
L
84
-
-
10.1
-
940
-
625
0.02
<0.002
-
50
7.7
2.0
1,420
5.0~9.0 - 5.0~9.0
28.2
388.4
-
5.8~8.6 5.0~9.0※2
5.8~8.6
-
-
Item
Main fuel
Water pollution laws
and regulations
Amount emitted hourly
(m3N/h)
Amount emitted daily
(t/d)
Amount emitted annually
(t/y)
Amount emitted hourly
(m3N/h)
Amount emitted daily
(t/d)
Amount emitted annually
(t/y)
Emission concentration
(g/m3N)
Hydrogen ion concentration index
Nitrogen oxide
Soot particles
Chemical oxygen
demand
Amount of
suspended
solids
<1
Highest concentration
(mg/L)
Pollution load amount
(kg/d)
Highest concentration
(mg/L)
Highest concentration
(mg/L)
50
-
<5
2
-
590
0.04
※1 Regulation in rules for the execution of ordinances to protect and nurture the environment of Kyoto Prefecture※2 Regulated value of Osaka City sewer ordinance execution rules

<Environmental Data 2018> 82
※3 Regulated K value
Environmental protection records at thermal power plants ②
Kainan
Power Station
Gobo
Power Station
Himeji No.1
Power Station
5,6U & GT1,2U
Himeji No.2
Power Station
Aioi
Power Station
Ako
Power Station
Heavy/crude oil Heavy/crude oil LNG LNGLNG/
Heavy/crude oilHeavy/crude oil
Air Pollution Control Law
(total amount regulation)646 6,510※3 126 582 2,757※3 2,158※3
Agreed value 310 184 - - 165 180
Actual value 91 130 - - 44 50
Agreed value - - - - - -
Actual value - - - - - -
Agreed value 1,760×103m3N 970×103m3N - - 885×103m3N 650×103m3N
Actual value 55×103m3N 46×103m3N - - 14×103m3N 15×103m3N
Air Pollution Control Law
(total amount regulation)- - - - - -
Agreed value 370 110 123.5 463 85 94
Actual value 44 75 55.0 105 69 66
Agreed value - - - - - -
Actual value - - - - - -
Agreed value 1,970×103m3N 560×103m3N 701×103m3N 2,263×103m3N 390×103m3N 340×103m3N
Actual value 23×103m3N 32×103m3N 178×103m3N 478×103m3N 80×103m3N 35×103m3N
Air Pollution Control Law 0.07 0.07 0.05 0.05 0.07 0.05
Agreed value 0.02 0.01 - - 0.015 0.015
Actual value 0.001 0.005 - - 0.003 0.003
Agreed value 5.8~8.6 5.8~8.6 5.8~8.6 5.8~8.6 5.8~8.6 5.8~8.6
Actual value 6.0~8.0 6.3~7.9 6.7~7.6 7.1~7.8 6.7~7.3 6.5~7.9
Water pollution laws
and regulations10 - 70 70 70 70
Agreed value 10 10 15 15 15 15
Actual value 5 7 4 3 3 3
Water pollution laws
and regulations187.7 - 38.8 173.9 67.8 85.5
Agreed value 50 36.8 15.2 35 18 22.4
Actual value 7.9 11.4 3.5 11.5 2.3 4.6
Water pollution laws
and regulations40 - 90 90 90 90
Agreed value 20 20 20 20 20 20
Actual value 6 3 1 2 2 <1
Water pollution laws
and regulations2 - 5 5 5 5
Agreed value 2 1 1 1 1 1
Actual value <0.1 0.2 <0.1 <0.1 0.4 <0.5
- 5.0~9.0 5.0~9.0 5.0~9.0 5.0~9.0
Amount of
inclusion of
normal hexane
extractable
substances
Water
quality
related
Air quality
related
Sulfur oxide
5.0~9.0
Item
Main fuel
Water pollution laws
and regulations
Amount emitted hourly
(m3N/h)
Amount emitted daily
(t/d)
Amount emitted annually
(t/y)
Amount emitted hourly
(m3N/h)
Amount emitted daily
(t/d)
Amount emitted annually
(t/y)
Emission concentration
(g/m3N)
Hydrogen ion concentration index
Nitrogen oxide
Soot particles
Chemical oxygen
demand
Amount of
suspended
solids
Highest concentration
(mg/L)
Pollution load amount
(kg/d)
Highest concentration
(mg/L)
Highest concentration
(mg/L)
Related Documents