National Environmental Research Institute University of Aarhus . Denmark NERI Technical Report No. 674, 2008 Environmental monitoring at the cryolite mine in Ivittuut, South Greenland, 2007

Welcome message from author
This document is posted to help you gain knowledge. Please leave a comment to let me know what you think about it! Share it to your friends and learn new things together.
Transcript

National Environmental Research InstituteUniversity of Aarhus . Denmark
NERI Technical Report No. 674, 2008
Environmental monitoring at the cryolite mine in Ivittuut, South Greenland, 2007

[Blank page]

National Environmental Research InstituteUniversity of Aarhus . Denmark
NERI Technical Report No. 674, 2008
Environmental monitoring at the cryolite mine in Ivittuut, South Greenland, 2007
Poul JohansenGert AsmundFrank RigétKasper Johansen

Data sheet
Series title and no.: NERI Technical Report No. 674
Title: Environmental monitoring at the cryolite mine in Ivittuut, South Greenland, 2007
Authors: Poul Johansen, Gert Asmund, Frank Riget & Kasper Johansen Department: Department of Arctic Environment Publisher: National Environmental Research Institute ©
University of Aarhus - Denmark URL: http://www.neri.dk
Year of publication: June 2008 Editing completed: May 2008 Referee: Christian Glahder
Financial support: No external financial support
Please cite as: Johansen, P., Asmund, G., Riget, F. & Johansen, K. 2008: Environmental monitoring at the cryolite mine in Ivittuut, South Greenland, 2007. National Environmental Research Institute, University of Aarhus. 32 pp. – NERI Technical Report no. 674. http://www.dmu.dk/Pub/FR674.pdf
Reproduction permitted provided the source is explicitly acknowledged
Abstract: This report evaluates the pollution in Arsuk Fjord at Ivittuut in South Greenland based on envi-ronmental studies conducted in 2007. The area is polluted by lead and zinc caused by the min-ing of cryolite that took place from 1854 to 1987. The 2007 study shows that the lead pollution of the fjord continues to fall. Zinc concentrations also generally decrease, but slower. We have found elevated lead concentrations in blue mussels in outer Arsuk Fjord and in areas 3-4 km outside the fjord. On a c. 5 km stretch of coastline around Ivittuut, the lead concentration in blue mussels is so high, that it is recommended not collecting and eating mussels from this area. Lead and zinc concentrations in brown seaweed are also elevated in a large part of Arsuk Fjord.
Keywords: Ivittuut, cryolite, mining, lead, zinc, seaweed, mussel
Layout: NERI Graphics Group, Silkeborg
Cover photo: The cryolite mine in Ivittuut, while mining still took place (photo: Kryolitselskabet Øresund A/S)
ISBN: 978-87-7073-051-8 ISSN (electronic): 1600-0048
Number of pages: 32
Internet version: The report is available in electronic format (pdf) at NERI's website http://www.dmu.dk/Pub/FR674.pdf
Contents
English summary 5
Resumé 6
Eqikkaaneq 7
1 Introduction 8
2 Sampling and analyses 10
3 Results and discussion 13 3.1 Analytical results and data processing 13 3.2 Spatial trends of lead and zinc concentrations 13 3.3 Time trends of lead and zinc concentrations 16 3.4 Restrictions on eating blue mussels 27
4 References 29
Annex 1. Brown seaweed data 2007 30
Annex 2. Blue mussel data 2007 31
National Environmental Research Institute
NERI technical reports

[Blank page]

5
English summary
In Ivittuut at Arsuk Fjord in South Greenland the mineral cryolite was mined, sorted and shipped out from 1854 to 1987. The mining operations have caused pollution with lead and zinc in the fjord. The main source is waste rock, which has been left at the coastline and is releasing lead and zinc to the fjord from tidal water action.
The pollution of the fjord has been monitored since 1982. Since 1985 this monitoring has included only brown seaweed and blue mussels, since earlier studies had shown that fish and shrimp from the fjord did not have elevated lead and zinc levels. This report presents the results of the latest environmental study, which was carried out in 2007.
The geographical pattern of lead and zinc levels found in brown sea-weed and blue mussels in 2007 shows that waste rock in Ivittuut still is the main source of the pollution of the fjord.
In brown seaweed elevated lead levels were found on a c. 20 km stretch of coastline in eastern Arsuk Fjord around Ivittuut, whereas zinc levels were elevated on the entire coastline studied in Arsuk Fjord. In blue mussels elevated lead levels were seen in all of the studied parts of Ar-suk Fjord, and also on coasts 3-4 km outside the fjord.
Along a stretch of coastline of c. 5 km around Ivittuut the lead concentra-tion in blue mussels is so high that it is recommended not to eat blue mussels from this area. This area is smaller than found in 2004 and much smaller than found in the period 1982-1992. During that period it also in-cluded part of the western coastline of Arsuk Fjord.
Over the entire monitoring period (1982 to 2007) a decline of lead levels is seen in both brown seaweed and blue mussels in Arsuk Fjord. In aver-age lead concentrations have decreased by a factor of 2.5 since 1982. Zinc concentrations also generally have decreased, but at a slower rate.

6
Resumé
I Ivittuut ved Arsuk Fjord i Sydgrønland foregik der brydning, sortering og udskibning af mineralet kryolit i perioden 1854 til 1987. Mineaktivite-terne har bevirket en forurening med bly og zink af fjorden. Hovedkil-den er frasorterede sten, såkaldt gråbjerg, fra kryolitbrydningen. Dette materiale er bl.a. efterladt som opfyld langs kysten ved Ivittuut. Det in-deholder bly- og zinkmineraler, som opløses i og udvaskes af tidevandet til Arsuk Fjord.
Forureningen i området er blevet overvåget siden 1982. Denne overvåg-ning har siden 1985 kun omfattet blæretang og blåmuslinger, idet tidli-gere undersøgelser havde vist, at fisk og rejer fra fjorden ikke var bela-stet med bly og zink. Denne rapport redegør for den seneste undersøgel-se, som blev udført i juli 2007.
Den geografiske fordeling af bly- og zinkkoncentrationen i blæretang og blåmusling i 2007 viser, at kajområdet ved Ivittuut fortsat er den domi-nerende forureningskilde.
I blæretang er der forhøjede blyværdier på en ca. 20 km lang kyststræk-ning i den østlige del af Arsuk Fjord omkring Ivittuut, mens der er forhø-jede zinkværdier på hele kyststrækningen af det undersøgte område. I blåmuslinger er der forhøjede blyværdier i alle undersøgte områder af Arsuk Fjord, men også i områder 3-4 km udenfor fjorden.
På en ca. 5 km lang kyststrækning omkring Ivittuut er blykoncentratio-nen i blåmuslinger så høj, at det frarådes at spise blåmuslinger indsamlet på denne kyststrækning. Dette område er mindre end fundet ved under-søgelsen i 2004 og meget mindre end fundet i perioden 1982-1992. I den-ne periode omfattede området også en del af kyststrækningen på den vestlige del af Arsuk Fjord.
Set over hele undersøgelsesperioden (1982 til 2007) er blykoncentratio-nen i både blæretang og blåmusling faldet i Arsuk Fjord. Blykoncentra-tionerne er nu i gennemsnit to en halv gang lavere end de var i 1982. Zinkkoncentrationen i tang og musling er også faldet, men ikke så meget som blykoncentrationen.
7
Eqikkaaneq
Arsuup iluatungaani Ilorput-mi Ivittuut 1854-imiit 1987-mut orsugiam-mik piiaaffiusimavoq, immikkoortiteriffiulluni aallarussuiffiullunilu. Or-sugiassiorneq pissutigalugu kangerluk aqerlumik zinkimillu mingutsi-taavoq. Mingutsitsinerup aallaavigineruai ujaqqat immikkoortitikkat or-sugiammik piiaaffimmeersut. Immikkoortiternerlukut taakku Ivittuut sissaa atuarlugu qimagarneqarsimapput. Aqerlumik zinkimillu akoqar-put ulittarneranillu immamut arrortinneqarlutik Ilutsinnut siammarsi-mallutik.
Mingutsitsineq 1982-imiilli misissuiffigineqartalerpoq. Misissuisarnerni taakkunani 1985-imiit taamaallaat qeqqussat uillullu misissuiffigineqar-talersimapput paasineqareersimammat kangerluup aalisagai raajaalu aqerlumik zinkimillu mingutsitaalluarneq ajortut. Nalunaarusiammi ma-tumani misissuineq kingulleq juli 2007-imi pisoq oqaluttuarineqarpoq.
Aqerlup zinkillu qeqqussani uillunilu ittup 2007-imi siammarsimanera aallaavigalugu takuneqarsinnaavoq Ivittuut umiarsualiviata eqqaa min-gutsitsinerup aallaaviginerpaagaa.
Qeqqussat Ivittuut eqqaanni Ilutta kangia-tungaani 20 km ungasissusilik tikillugu aqerlortaqarnerupput, taavalu sinerissami misissuiffiusumi ta-marmi annerusumik zinkitaqarlutik. Uillut Ilutsinni misissuiffiusumi tamarmi aqerlortaqarnerupput, aammali kangerluup silataani 3-4 km-inik ungasissusilimmi aqerlortaat annertuseqqalluni.
Ivittuut eqqaanni sinerissami 5 km-iterisut isorartussusilimmi uillut ima aqerlortaqartigipput nerineqarnissaat inassutigineqarani. Tamaani paasi-sat 2004-imi misissukkaniit annikinnerupput aammalu 1982-1992-imi misissuisarnerniit annikinneroqalutik. Piffissami tassanissaaq Ilutta ki-taata tungaani sineriak ilanngullugu misissuiffigineqarpoq.
Piffissaq misissuiffiusoq tamaat (1982-2007) isigigaanni Ilutsinni qeqqus-sat uillullu aqerlortaat annikkilliartorsimavoq. Maanna aqerloq 1982-imiit 2 ½-eriaamik annikinneruvoq. Qeqqussat uillullu annikinnerusu-mik zinkertaqalersimapput, aqerlulli appariarsimaneratut appariarsima-tiginatik.

8
1 Introduction
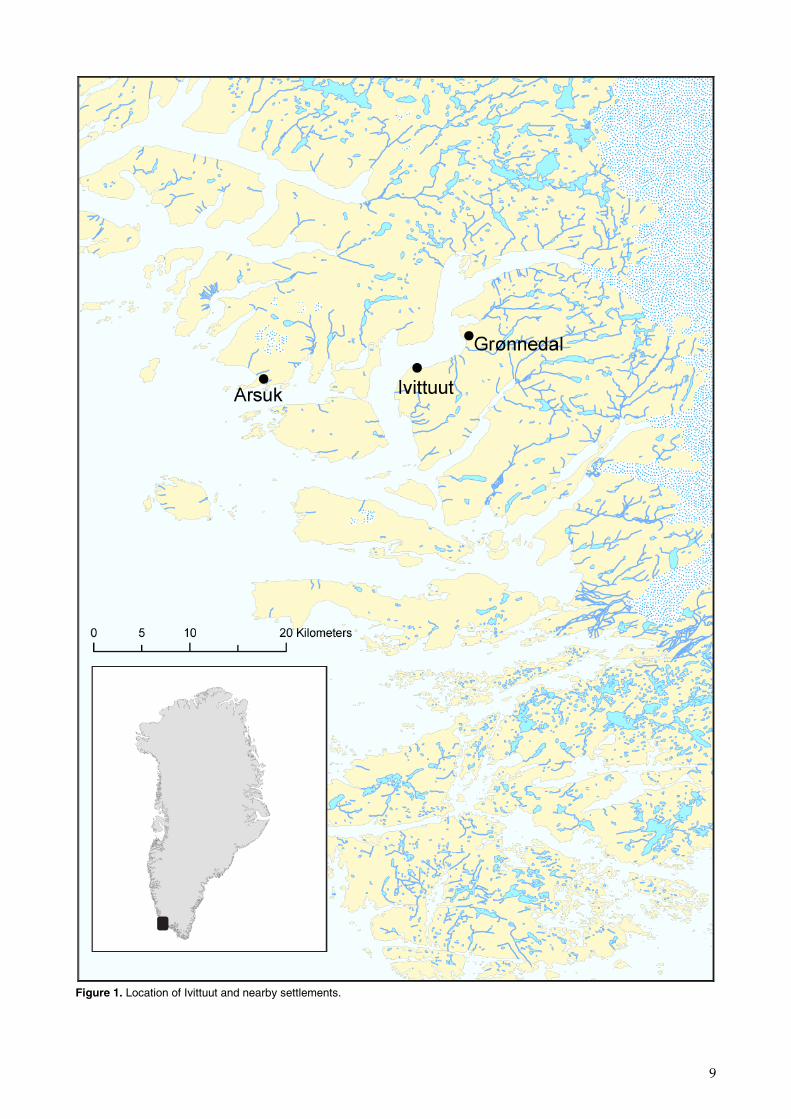
At the place called Ivittuut in South Greenland, mining for cryolite took place from 1854 to 1987. The mine was an open pit located close to the shore of Arsuk Fjord (Figure 1). The closest settlements are Arsuk, c. 15 km W of Ivittuut, and the Naval Station Grønnedal, c. 5 km NE of Ivit-tuut (Figure 1).
Cryolite is an industrial mineral which is mainly used in aluminium production. The ore was blasted, crushed and sorted on site and subse-quently shipped for flotation elsewhere, e.g. in Copenhagen, Denmark.
Environmental studies initiated in 1982 showed that the operation caused pollution with heavy metals, particularly lead and zinc, which are found in the ore. The most important source has been waste rock, which has been disposed at the coastline in Ivittuut. The waste rock con-tains lead and zinc, which is released as dissolved metals to Arsuk Fjord, when the tide moves in and out the waste rock. We have estimated that between 400 and 1.000 kg of dissolved lead annually entered Arsuk Fjord from this source in 1985 (Johansen et al. 1995).
From 1982 to 1992 environmental monitoring was conducted each year, after which it was carried out in 1995 and each third year since. The re-sults from 1982 to 1992 are summarized in Johansen et al. (1995). Results from 1995 are reported by Riget et al. (1995a), from 1998 by Johansen et al. (1998), from 2001 by Johansen & Asmund (2003) and from 2004 by Johansen & Asmund (2005). The first studies showed that the species af-fected by the heavy metal pollution were brown seaweed (Fucus vesiculo-sus) and blue mussel (Mytilus edulis), while fish and prawns from the fjord did not have elevated concentrations of heavy metals. Therefore, since 1985 the environmental monitoring has only included brown sea-weed and blue mussel. These two species are widely used to monitor heavy metal pollution. They are suitable indicators because they are ses-sile and accumulate metals from the surrounding seawater. They there-fore reflect the water quality over longer periods of time in the tidal zone, where they live.
In this report we present results from the study conducted at Ivittuut in 2007. We compare levels of lead and zinc within the study area and over time and also with lead and zinc levels found in these species in Greenland regions not affected by known local sources.
9
Figure 1. Location of Ivittuut and nearby settlements.

10
2 Sampling and analyses
Sampling of brown seaweed and blue mussels was conducted in the pe-riod 27th June to 4th July 2007 by Sigga Joensen and Lene Bruun from NERI. The study used a boat chartered by the Naval Station Grønnedal, and here the preparation of samples was carried out. Figure 2 shows sampling stations in 2007. They were identical to stations sampled in 2004.
Two samples of brown seaweed (Fucus vesiculosus) were collected at 10 to 30 metres distance at each station in order to account for local varia-tion. Growing tips were cut with scissors, rinsed 3 times in clean tap wa-ter and frozen.
Blue mussels (Mytilus edulis) collected at each station were divided into size classes after their shell length. The adductors of the mussels were cut and the mussels were allowed to drain, before the soft parts of the mussel were cut out of the shell with a stainless steel scalpel. The soft parts of each size group were then frozen.
At the laboratory of the Department of Arctic Environment at NERI (NERI-DAE), the samples of both seaweed and mussels were initially freeze-dried and then ground in an agate mortar. A sub sample of the dried and ground sample was then dissolved with nitric acid in Teflon bombs under pressure in an Anton Paar Multiwawe 3000 Microwave Oven. Zinc concentrations were determined using flame AAS (Perkin Elmer AAnalyst 300) and lead concentrations were determined using graphite furnace AAS (Perkin Elmer AAnalyst 800).
The analytical methods were checked by regularly analyzing certified reference materials Dorm-1, Dolt-3 and Tort-2.
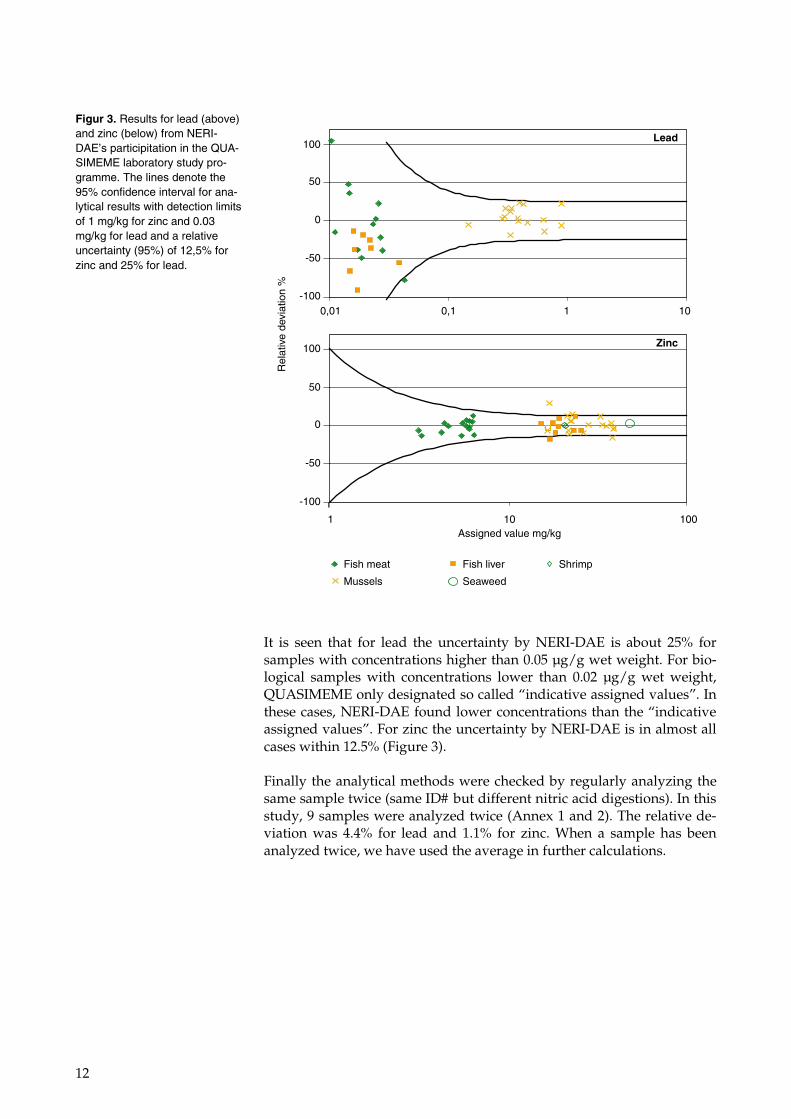
The analytical methods were also checked independently by participat-ing in the intercalibration program QUASIMEME organized by the European Union. In this program a sample with an unknown concentra-tion of e.g. lead and zinc is analyzed by many laboratories. Based on the results, the organizers of QUASIMEME compute a so called “assigned value” for the concentration of – in this case – lead and zinc in the sam-ple. Figure 3 shows the result of the NERI-DAE’s participation in QUA-SIMEME. In the figure, NERI-DAE’s results are shown as the relative deviation from the “assigned value” plotted against the concentration.

11
Figure 2. Sampling stations.
12
It is seen that for lead the uncertainty by NERI-DAE is about 25% for samples with concentrations higher than 0.05 µg/g wet weight. For bio-logical samples with concentrations lower than 0.02 µg/g wet weight, QUASIMEME only designated so called “indicative assigned values”. In these cases, NERI-DAE found lower concentrations than the “indicative assigned values”. For zinc the uncertainty by NERI-DAE is in almost all cases within 12.5% (Figure 3).
Finally the analytical methods were checked by regularly analyzing the same sample twice (same ID# but different nitric acid digestions). In this study, 9 samples were analyzed twice (Annex 1 and 2). The relative de-viation was 4.4% for lead and 1.1% for zinc. When a sample has been analyzed twice, we have used the average in further calculations.
Figur 3. Results for lead (above) and zinc (below) from NERI-DAE’s participitation in the QUA-SIMEME laboratory study pro-gramme. The lines denote the 95% confidence interval for ana-lytical results with detection limits of 1 mg/kg for zinc and 0.03 mg/kg for lead and a relative uncertainty (95%) of 12,5% for zinc and 25% for lead.
1
0,01 0,1 1 10
Lead
Zinc
10Assigned value mg/kg
100
Rel
ativ
e de
viat
ion
%
Fish meat
Mussels
Fish liver
Seaweed
-100
-50
0
50
100
-100
-50
0
50
100
Shrimp
13
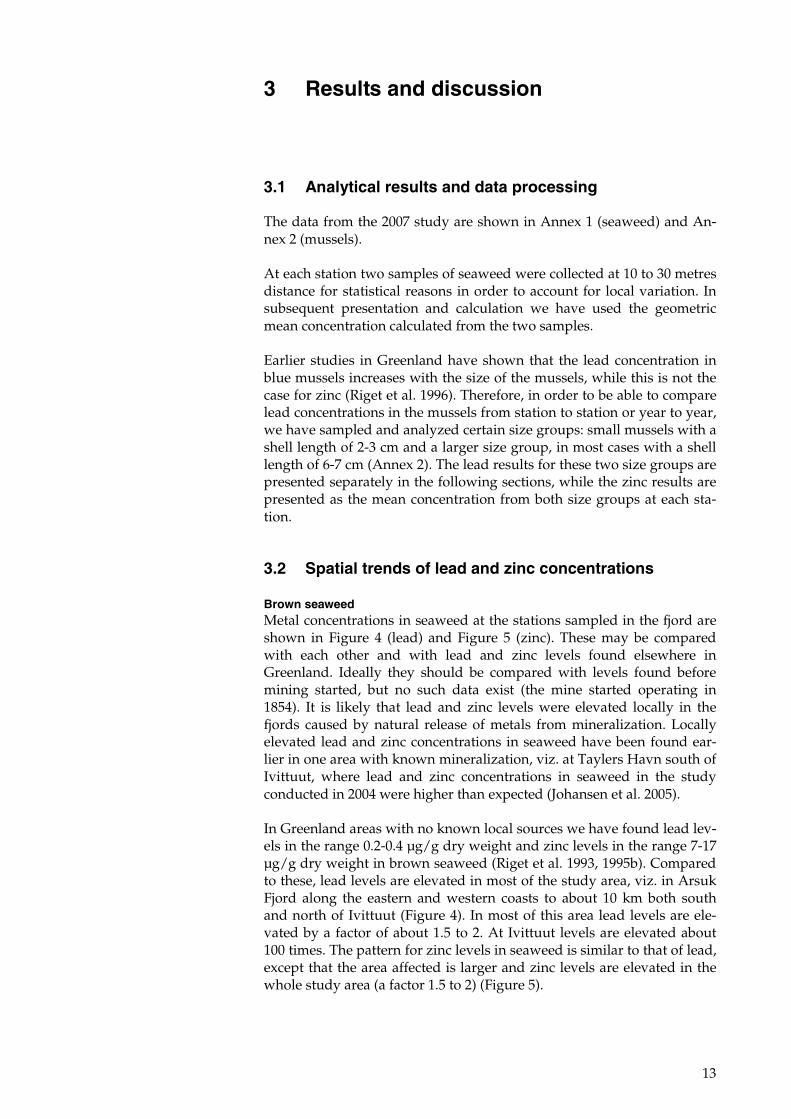
3 Results and discussion
3.1 Analytical results and data processing
The data from the 2007 study are shown in Annex 1 (seaweed) and An-nex 2 (mussels).
At each station two samples of seaweed were collected at 10 to 30 metres distance for statistical reasons in order to account for local variation. In subsequent presentation and calculation we have used the geometric mean concentration calculated from the two samples.
Earlier studies in Greenland have shown that the lead concentration in blue mussels increases with the size of the mussels, while this is not the case for zinc (Riget et al. 1996). Therefore, in order to be able to compare lead concentrations in the mussels from station to station or year to year, we have sampled and analyzed certain size groups: small mussels with a shell length of 2-3 cm and a larger size group, in most cases with a shell length of 6-7 cm (Annex 2). The lead results for these two size groups are presented separately in the following sections, while the zinc results are presented as the mean concentration from both size groups at each sta-tion.
3.2 Spatial trends of lead and zinc concentrations
Brown seaweed Metal concentrations in seaweed at the stations sampled in the fjord are shown in Figure 4 (lead) and Figure 5 (zinc). These may be compared with each other and with lead and zinc levels found elsewhere in Greenland. Ideally they should be compared with levels found before mining started, but no such data exist (the mine started operating in 1854). It is likely that lead and zinc levels were elevated locally in the fjords caused by natural release of metals from mineralization. Locally elevated lead and zinc concentrations in seaweed have been found ear-lier in one area with known mineralization, viz. at Taylers Havn south of Ivittuut, where lead and zinc concentrations in seaweed in the study conducted in 2004 were higher than expected (Johansen et al. 2005).
In Greenland areas with no known local sources we have found lead lev-els in the range 0.2-0.4 µg/g dry weight and zinc levels in the range 7-17 µg/g dry weight in brown seaweed (Riget et al. 1993, 1995b). Compared to these, lead levels are elevated in most of the study area, viz. in Arsuk Fjord along the eastern and western coasts to about 10 km both south and north of Ivittuut (Figure 4). In most of this area lead levels are ele-vated by a factor of about 1.5 to 2. At Ivittuut levels are elevated about 100 times. The pattern for zinc levels in seaweed is similar to that of lead, except that the area affected is larger and zinc levels are elevated in the whole study area (a factor 1.5 to 2) (Figure 5).

14
Figure 4. Lead concentration (µg/g dry weight) in brown seaweed (Fucus vesiculosus) at Ivittuut 2007.

15
Figure 5. Zinc concentration (µg/g dry weight) in brown seaweed (Fucus vesiculosus) at Ivittuut 2007.

16
Blue mussels Lead concentrations in blue mussels at the stations sampled in the fjord are shown in Figure 6 (small mussels) and Figure 7 (large mussels). Zinc concentrations in mussels are shown in Annex 2. As with seaweed the levels from Arsuk Fjord may be compared with each other and with lead and zinc levels found elsewhere in Greenland. In blue mussels from Greenland areas with no known local sources we have found lead and zinc concentration as shown below (Riget et al. 1993, Aar-krog et al. 1997):
Shell length Lead (µg/g dry weight) Zinc (µg/g dry weight) 2-3 cm 0.7-0.9 80-100 >6 cm 0.7-1.7 80-100
Figure 6 and 7 show that these concentrations are exceeded in the whole study area, that is in most of Arsuk Fjord, but also in areas outside the fjord north and south of the island of Arsuk. Even on the island Napasut (station 29), about 15 km south of Ivittuut, lead levels are elevated about 2 times. In most of the other areas, including Arsuk Fjord, lead levels are elevated 3-4 times. The highest levels are found at Ivittuut where levels are elevated 200-500 times.
3.3 Time trends of lead and zinc concentrations
The pollution with lead and zinc in seaweed and blue mussels in Arsuk Fjord has been monitored since 1982. In the temporal trend analyses of lead and zinc in seaweed it has been assumed that no systematic differ-ence exists between the two Fucus species analyzed (Fucus vesiculosus and distichus) over the monitoring period. This assumption was con-firmed in a comprehensive study carried out in Godthåbs Fjord (Riget et al. 1997). Geometric mean values were calculated for samples at the same station in the same year.
Analyses of temporal trend of lead concentrations in blue mussels were applied for size group 2 to 4 cm shell length and 5 to 8 cm shell length separately. Separating blue mussels into two size groups was done be-cause lead concentrations increase with length (age) of the mussels (Riget et al. 1996). This is not the case for zinc, so no separation between size groups was done for zinc. If two samples of blue mussels belonging to same size group were available from the same station in the same year, the geometric mean value was calculated and used in the temporal trend analyses.

17
Figure 6. Lead concentration (µg/g dry weight) in small blue mussels (Mytilus edulis) at Ivittuut 2007.

18
Figure 7. Lead concentration (µg/g dry weight) in large blue mussels (Mytilus edulis) at Ivittuut 2007.
19
The statistical temporal trend analyses followed the ICES (International Council for the Exploitation of the Sea) temporal trend assessment pro-cedure (Nicholson et al. 1998). The log-mean lead concentration is used as the annual index value. The total variation over time is partitioned into a linear and non-linear component. Linear regression analysis is ap-plied to describe the linear component, and a LOESS smoother (locally weighted quadratic least-squares regression smoothing) with a window width of 7 years is applied to describe the non-linear component. The linear and non-linear components are tested by means of an analysis of variance. The theory behind the use of smoothers in temporal trend analyses is described in detail by Fryer and Nicholson (1999). A signifi-cance level of 5% was applied.
The results of the temporal trend analysis can be interpreted as follows:
• Both log-linear and non-linear trend not significant – no temporal trend.
• Log-linear trend significant, non-linear trend not significant – log-linear trend (exponential trend)
• Both log-linear trend and non-linear trend significant – non-linear trend
• Log-linear trend not significant, non-linear trend significant – non-linear trend.
The temporal trend analyses also give the overall annual change esti-mated from the log-linear regression.
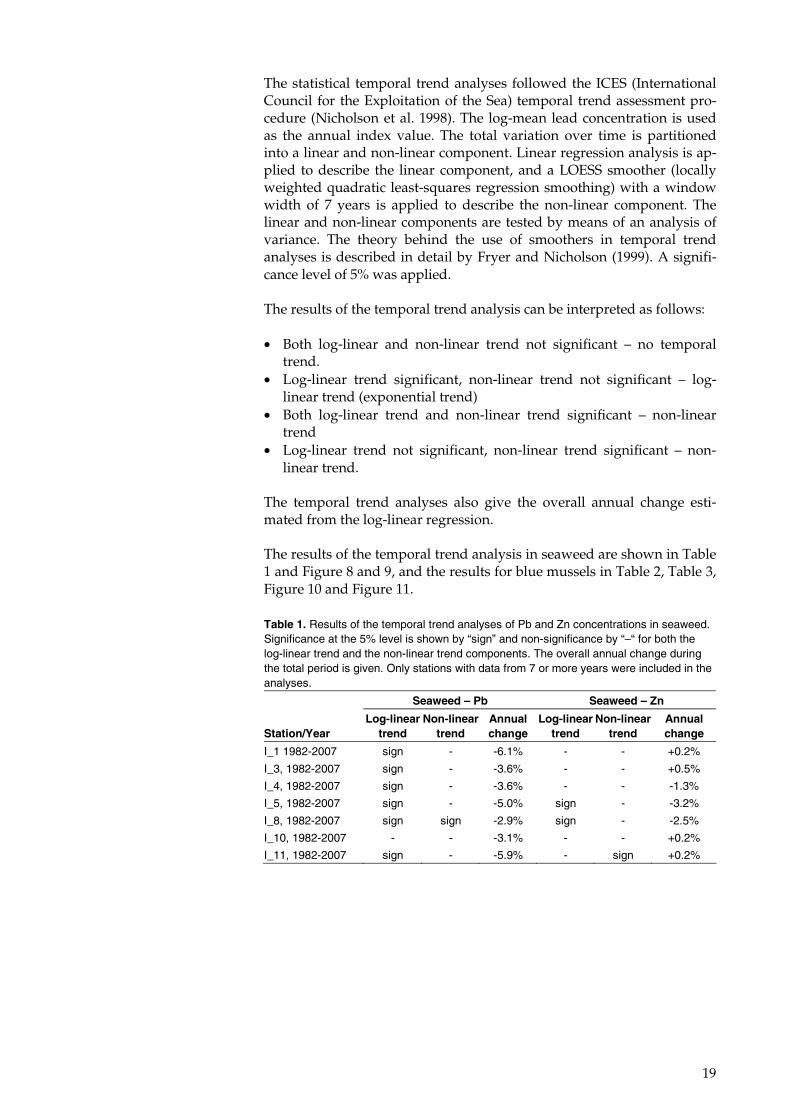
The results of the temporal trend analysis in seaweed are shown in Table 1 and Figure 8 and 9, and the results for blue mussels in Table 2, Table 3, Figure 10 and Figure 11.
Table 1. Results of the temporal trend analyses of Pb and Zn concentrations in seaweed. Significance at the 5% level is shown by “sign” and non-significance by “–“ for both the log-linear trend and the non-linear trend components. The overall annual change during the total period is given. Only stations with data from 7 or more years were included in the analyses.
Seaweed – Pb Seaweed – Zn
Station/Year Log-linear
trend Non-linear
trend Annual change
Log-linear trend
Non-linear trend
Annual change
I_1 1982-2007 sign - -6.1% - - +0.2%
I_3, 1982-2007 sign - -3.6% - - +0.5%
I_4, 1982-2007 sign - -3.6% - - -1.3%
I_5, 1982-2007 sign - -5.0% sign - -3.2%
I_8, 1982-2007 sign sign -2.9% sign - -2.5%
I_10, 1982-2007 - - -3.1% - - +0.2%
I_11, 1982-2007 sign - -5.9% - sign +0.2%

20
There is a decrease ranging from 2.9 to 6.1% per year for the lead concen-tration in seaweed at all stations in the period 1982 to 2007. For all sta-tions except station 10 the temporal trend was significant at the 5% level. The significant trend could be described as an exponential decrease at station 1, 3, 4, 5 and 11, whereas the decrease at station 8 was non-linear (on a log scale) with a sharp decrease in the beginning of the period fol-lowed by a nearly constant level.
No such clear picture is seen for the zinc concentration in seaweed. Lev-els have decreased significantly at the stations with the highest concen-trations (stations 5 and 8 at Ivittuut) and the trend could be described as an exponential decrease. At station 10 the temporal trend was also statis-tical significant with a U-shaped trend, but outside the area at Ivittuut (stations 5 and 8) zinc concentrations in seaweed have not decreased over the whole monitoring period.
0
1
2
3
4
5
00
1985 1990 1995 2000 2005 1985 1990 1995 2000 2005
1985 1990 1995 2000 2005
20
40
60
80
0
0.5
1.0
1.5
2.0
2.5
1
2
3
4
5
0
0
0
0
0
0
50
100
150
0
0.5
1.0
1.5
2.0
Pb
conc
entr
atio
ns in
sea
wee
dI_1 I_3 I_4
I_5
I_11
I_8 I_10
Figure 8. Temporal trend of Pb concentrations in seaweed. Points denote annual geometric mean concentrations. Solid line together with 95% confidence broken lines is given when significant trend was found in the temporal trend analysis. Solid line alone is given when no significant trend was found.

21
1985 1990 1995 2000 2005 1985 1990 1995 2000 2005
1985 1990 1995 2000 2005
Zn
conc
entr
atio
ns in
sea
wee
dI_1 I_3 I_4
I_5
I_11
I_8 I_10
0
0
100
200
300
400
500
0 0
00
100
200
300
400
10203040506070
20
0
40
60
80
10
20
30
40
5
10
15
20
25
30
10
20
30
40
50
Figure 9. Temporal trend of Zn concentrations in seaweed. Points denote annual geometric mean concentrations. Solid line together with 95% confidence broken lines is given when significant trend was found in the temporal trend analysis. Solid line alone is given when no significant trend was found.
Table 2. Results of the temporal trend analyses of lead concentrations in blue mussels of size group 2 to 4 cm and 5 to 8 cm shell length, respectively. Significance at the 5% level is shown by “sign” and non-significance by “–“ for both the log-linear trend and the non-linear trend components. The overall annual change during the total period is given.
Blue mussel – Pb Size 2 to 4 cm Size 5 to 8 cm
Station/Year Log-linear
trend Non-linear
trend Annual change
Log-linear trend
Non-linear trend
Annual change
I_1 1982-2007 sign - -3.7% sign - -5.4%
I_3, 1982-2007 - - -1.6% sign - -4.4%
I_4, 1982-2007 sign - -4.7% sign sign -3.2%
I_5, 1982-2007 sign - -6.4% sign - -3.5%
I_8, 1982-2007 - - -1.1% sign - -2.3%
I_10, 1982-2007 sign - -2.4% sign - -3.1%
I_11, 1982-2007 sign - -5.3% sign - -4.6%
I_12, 1983-2007 sign - -4.6% sign - -2.6%
I_13, 1983-2007 sign - -3.6% sign - -3.0%
I_15, 1983-2007 sign - -3.5% sign - -3.8%
I_16, 1986-2007 sign - -4.5% sign sign -3.9%
I_17, 1983-2007 sign - -4.4% sign - -5.1%
I_21, 1983-2007 sign - -4.3% sign - -4.7%
I_22, 1983-2007 sign - -4.0% sign - -3.5%
I_24, 1983-2007 sign - -3.5% sign - -4.3%
I_27, 1984-2007 sign - -3.1% sign - -3.4%
I_28, 1984-2007 sign - -3.2% sign - -5.6%

22
I_1 I_3 I_4
I_5 I_8 I_10
1985 1990 1995 2000 2005
Lead
con
cent
ratio
ns in
blu
e m
usse
ls
I_11 I_12 I_13
I_15
I_27
I_16 I_17
1985 1990 1995 2000 2005
I_21 I_22 I_24
1985 1990 1995 2000 2005
I_28
0
0
0 0
5
10
15
0
5
10
15
0
5
10
15
0
5
10
15
0 0 0
2
4
6
8
10
12
0 0
5
10
15
20
2
4
6
8
10
12
5
10
15
5
10
15
0
5
10
15
5
10
15
20
25
0 0
10
20
30
40
50
60
200
400
600
800
1000
1200
200400600800
100012001400
0 0
20
40
60
80
100
120
10
20
30
40
5
10
15
Figure10. Temporal trend of lead concentrations in blue mussels. Red colours denote results of size group 2 to 4 cm shell length and blue colour denotes results of size group 5 to 8 cm shell length. Points (geometric mean) and solid trend line to-gether with 95% confidence broken lines are given when significant trend was found in the temporal trend analysis. Points and black solid line are given when no significant trend was found.

23
In order to illustrate an overall, simplified time trend of lead and zinc concentrations, stations sampled have been divided into three groups ac-cording to concentrations levels (and distance to the source). For each group the mean concentration was computed.
For seaweed the groups are:
• At the mine: Stations 5, 6 and 8 • 1 km from the mine: Stations 4 and 9 • 2-6 km from the mine: Stations 1, 3, 10 and 11.
For blue mussels the groups are:
• At the mine: Stations 5 and 8 • 1 km from the mine: Stations 4 and 9 • 2-10 km from the mine: Stations 1, 3, 10, 11, 12, 13, 15, 16, 17, 21, 22, 24
and 28.
Table 3. Results of the temporal trend analyses of Zn concentrations in blue mussel. Significance at the 5% level is shown by “sign” and non-significance by “–“ for both the log-linear trend and the non-linear trend components. The overall annual change during the total period is given.
Blue mussel – Zn
Station/Year Log-linear trend Non-linear trend Annual change
I_1 1982-2007 - - -0.6%
I_3, 1982-2007 sign - -1.4%
I_4, 1982-2007 sign - -2.2%
I_5, 1982-2007 sign - -3.1%
I_8, 1982-2007 - sign -0.9%
I_10, 1982-2007 sign - -1.4%
I_11, 1982-2007 sign - -2.6%
I_12, 1983-2007 sign - -0.8%
I_13, 1983-2007 sign - -1.3%
I_15, 1983-2007 - - -1.1%
I_16, 1986-2007 - - -1.1%
I_17, 1983-2007 - - 0%
I_21, 1983-2007 sign - -2.2%
I_22, 1983-2007 - - -0.7%
I_24, 1983-2007 - - -1.0%
I_27, 1984-2007 sign - -2.1%
I_28, 1984-2007 sign - -1.5%

24
I_1 I_3 I_4
I_5 I_8 I_10
1985 1990 1995 2000 2005
Zn
conc
entr
atio
ns in
blu
e m
usse
ls
I_11 I_12 I_13
I_15
I_27
I_16 I_17
1985 1990 1995 2000 2005
I_21 I_22 I_24
1985 1990 1995 2000 2005
I_28
0
20
40
60
80
100
120
0
20
40
60
80
100
120
0
20
40
60
80
100
120
0
20
40
60
80
100
120
0
20
40
60
80
100
120
0
20
40
60
80
100
120
0
50
100
150
0
50
100
150
0
0
0 0
20
40
60
80
100
120
0
20
40
60
80
100
120
20406080
100120140
0
50
100
150
200
250
300
0
20
40
60
80
100
120
100
200
300
20
40
60
80
100
120
0 0
50
100
150
20
40
60
80
100
120
Figure 11. Temporal trend of Zn concentrations in blue mussels. Points denotes annual geometric mean concentration, solid line together with 95% confidence broken lines are given when significant trend was found in the temporal trend analysis. Solid line alone is given when no significant trend was found.

25
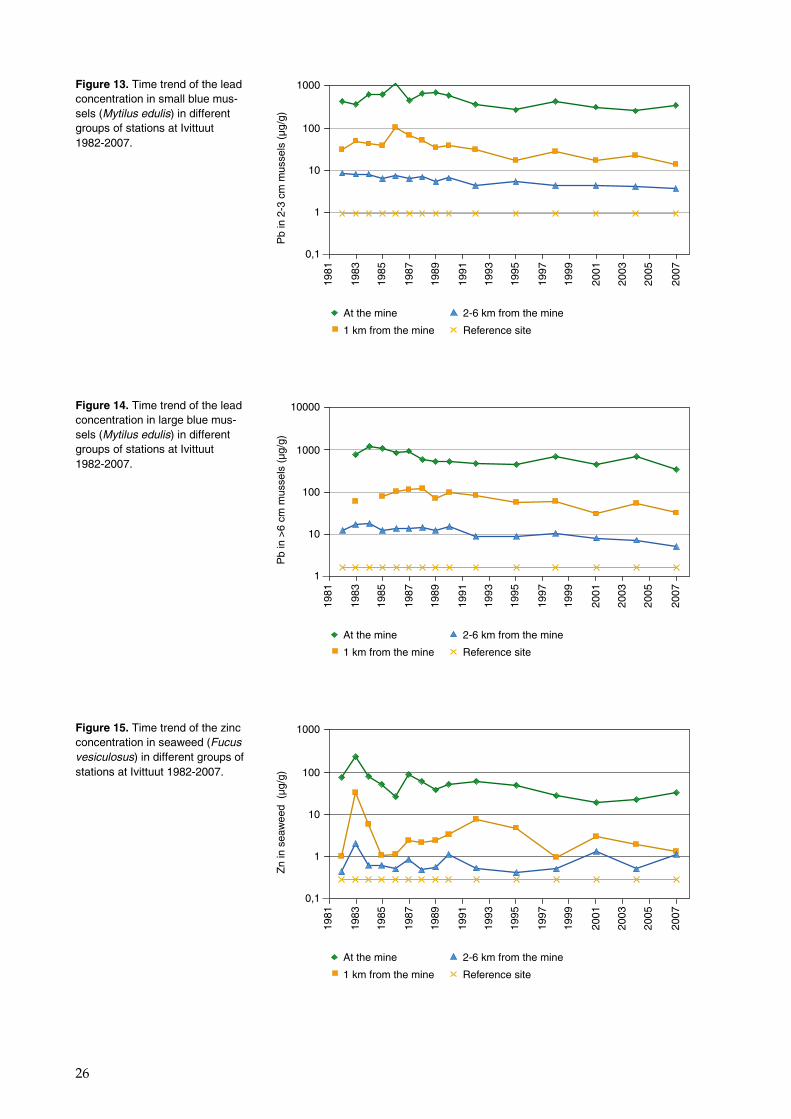
Lead concentrations in blue mussels have decreased in the period 1982 to 2007 at all stations. The annual rate of decrease during the whole period ranges from 1.1 to 6.4%. For size 2 to 4 cm, the lead concentrations fol-lowed a decreasing exponential curve except at station 3 and 8 where no significant temporal trend was found. For size 5 to 8 cm, all temporal trends were significant and following an exponential decrease except at station 4 and 16, where lead concentrations increased or were constant in the first years of the period and then decreased until today. In average for all stations and both size groups the lead has yearly decreased 3.83% which correspond to a factor 2.56 over the 25 years of monitoring.
Zinc concentrations in blue mussels have also decreased but the rate is lower and the change is significant at only 10 out of 17 stations. At all stations with significantly temporal trends, this followed an exponential decrease, except at station 8 where the zinc concentrations peaked in the late 1980s. It is notable that zinc concentrations have also decreased at stations where levels are not elevated compared to regions in Greenland with no known local pollution sources.
Time trends of lead and zinc concentrations are illustrated in Figure 12-16. Note that the scale in the figures 12-15 is logarithmic.
Both in seaweed and blue mussels lead concentrations have decreased by about 4% per year since 1982. We expect that this rate of decrease will continue. A similar consistent pattern is not seen for zinc; in most cases there is no significant trend.
Figure 12. Time trend of the lead concentration in seaweed (Fucus vesiculosus) in different groups of stations at Ivittuut 1982-2007.
1981
1983
1985
1987
1989
1991
1993
1995
1997
1999
2001
2003
2005
2007
Pb
in s
eaw
eed
(µg/
g)
At the mine
1 km from the mine
2-6 km from the mine
Reference site
0,1
1
10
100
1000
26
Figure 13. Time trend of the lead concentration in small blue mus-sels (Mytilus edulis) in different groups of stations at Ivittuut 1982-2007.
1981
1983
1985
1987
1989
1991
1993
1995
1997
1999
2001
2003
2005
2007
Pb
in 2
-3 c
m m
usse
ls (
µg/g
)
At the mine
1 km from the mine
2-6 km from the mine
Reference site
0,1
1
10
100
1000
Figure 14. Time trend of the lead concentration in large blue mus-sels (Mytilus edulis) in different groups of stations at Ivittuut 1982-2007.
1981
1983
1985
1987
1989
1991
1993
1995
1997
1999
2001
2003
2005
2007
Pb
in >
6 cm
mus
sels
(µg
/g)
At the mine
1 km from the mine
2-6 km from the mine
Reference site
1
10
100
1000
10000
Figure 15. Time trend of the zinc concentration in seaweed (Fucus vesiculosus) in different groups of stations at Ivittuut 1982-2007.
1981
1983
1985
1987
1989
1991
1993
1995
1997
1999
2001
2003
2005
2007
Zn
in s
eaw
eed
(µg
/g)
At the mine
1 km from the mine
2-6 km from the mine
Reference site
0,1
1
10
100
1000
27
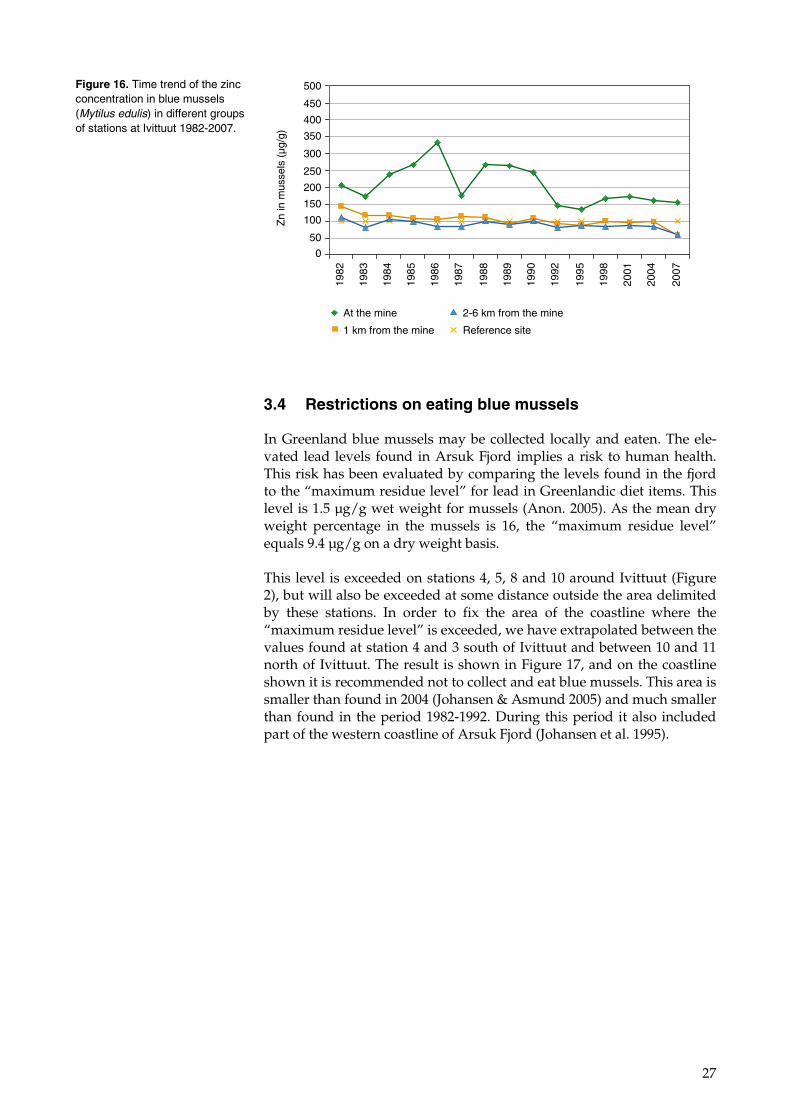
3.4 Restrictions on eating blue mussels
In Greenland blue mussels may be collected locally and eaten. The ele-vated lead levels found in Arsuk Fjord implies a risk to human health. This risk has been evaluated by comparing the levels found in the fjord to the “maximum residue level” for lead in Greenlandic diet items. This level is 1.5 µg/g wet weight for mussels (Anon. 2005). As the mean dry weight percentage in the mussels is 16, the “maximum residue level” equals 9.4 µg/g on a dry weight basis.
This level is exceeded on stations 4, 5, 8 and 10 around Ivittuut (Figure 2), but will also be exceeded at some distance outside the area delimited by these stations. In order to fix the area of the coastline where the “maximum residue level” is exceeded, we have extrapolated between the values found at station 4 and 3 south of Ivittuut and between 10 and 11 north of Ivittuut. The result is shown in Figure 17, and on the coastline shown it is recommended not to collect and eat blue mussels. This area is smaller than found in 2004 (Johansen & Asmund 2005) and much smaller than found in the period 1982-1992. During this period it also included part of the western coastline of Arsuk Fjord (Johansen et al. 1995).
Figure 16. Time trend of the zinc concentration in blue mussels (Mytilus edulis) in different groups of stations at Ivittuut 1982-2007.
1982
1983
1984
1985
1986
1987
1988
1989
1990
1992
1995
1998
2001
2004
2007
Zn
in m
usse
ls (
µg/g
)
At the mine
1 km from the mine
2-6 km from the mine
Reference site
0
50
100
150
200
250
300
350
400
450
500

28
Figure 17. Area where it is recommended not to collect and eat blue mussels.

29
4 References
Aarkrog, A., Aastrup, P., Asmund, G., Bjerregaard, P., Boertmann, D., Carlsen, L., Christensen, J., Cleeman, M., Dietz, R., Fromberg, A., Storr-Hansen, E., Heidam, N.Z., Johansen, P., Larsen, H., Paulsen, G.B., Peter-sen, H., Pilegaard, K., Poulsen, M.E., Pritzl, G., Riget, F., Skov, H., Spliid, H., Weihe, P. & Wåhlin, P. 1997: AMAP Greenland 1994-1996. Environ-mental Project No. 356. Danish Environmental Protection Agency, 788 pp.
Anon. 2005. Bekendtgørelse for Grønland om visse forureninger i føde-varer. Fødevarestyrelsen, bekendtgørelse nr. 891, 22.september 2005.
Johansen, P. & Asmund, G. 2003: Tungmetaller i tang og musling ved Ivittuut 2001. Danmarks Miljøundersøgelser. - Faglig rapport fra DMU 444: 34 s. (elektronisk).
Johansen, P. & Asmund, G. 2005: Tungmetaller i tang og musling ved Ivittuut 2004. Danmarks Miljøundersøgelser. - Faglig rapport fra DMU 538: 28 s. (elektronisk).
Johansen, P., Asmund, G. & Riget, F. 1995: Miljøundersøgelser ved Ivit-tuut. Grønlands Miljøundersøgelser. Rapportserie nr. 7, 60 s.
Johansen, P., Riget, F. & Asmund, G. 1998: Tungmetaller i tang og mus-ling ved Ivittuut 1998. Danmarks Miljøundersøgelser. Faglig rapport fra DMU 258: 28 s.
Riget, F., Johansen, P. & Asmund, G. 1993: Naturlig variation af kobber, cadmium, bly og zink i blæretang og blåmusling ved Nuuk. Grønlands Miljøundersøgelser. Teknisk Rapport: 40 s.
Riget, F., Johansen, P. & Asmund, G. 1995a: Tungmetaller i tang og mus-ling ved Ivittuut 1995. Danmarks Miljøundersøgelser. Faglig rapport fra DMU 146: 33 s.
Riget, F., Johansen, P. & Asmund, G. 1995b: Natural Seasonal Variation of Cadmium, Copper, Lead and Zinc in Brown Seaweed (Fucus vesiculo-sus). Mar.Poll.Bull. 30(6): 409-413.
Riget, F., Johansen, P. & Asmund, G. 1996: Influence of Length on Ele-ment Concentrations in Blue Mussels (Mytilus edulis). Mar.Poll.Bull. 32(10): 745-751.
Riget, F., Johansen, P. & Asmund, G. 1997: Baseline Levels and Natural Variability of Elements in Three Seaweed Species from West Greenland. Mar.Poll.Bull. 34(3): 171-176.

30
Annex 1. Brown seaweed data 2007
Lead and zinc concentrations (µg/g d.w.) in brown seaweed (Fucus vesiculosus)
ID # Station Pb Zn
37001 St. 1 0.67 31.8
37001 St. 1 0.69 32.4
37002 St. 1 0.47 22.9
37003 St. 2 0.54 24.7
37004 St. 2 0.46 26.4
37005 St. 3 0.53 28.7
37005 St. 3 0.51 28.5
37006 St. 3 0.62 28.8
37007 St. 4 1.07 28.7
37008 St. 4 1.16 28.8
37009 St. 5 28.46 145.0
37010 St. 5 48.06 179.7
37011 St. 6 21.89 170.9
37012 St. 6 19.19 155.7
37079 St. 8 31.92 236.9
37080 St. 8 30.26 220.0
37081 St. 9 1.34 47.5
37082 St. 9 1.53 41.9
37083 St.10 1.11 40.9
37084 St.10 1.19 42.1
37084 St.10 1.28 43.3
37063 St.11 0.61 35.2
37064 St.11 0.54 40.6
37023 St.12 0.58 35.5
37024 St.12 0.50 32.5
37025 St.13 0.83 35.6
37026 St.13 0.54 25.4
37027 St.15 0.63 27.5
37028 St.15 0.61 20.1
37029 St.16 0.51 20.2
37030 St.16 0.50 27.6
37043 St.17 0.35 28.3
37044 St.17 0.33 28.9
37031 St.20 0.47 19.8
37031 St.20 0.45 19.7
37032 St.20 0.34 17.3
37065 St.21 0.51 34.6
37066 St.21 0.55 24.8
37045 St.22 0.49 29.4
37046 St.22 0.54 38.5
37047 St.24 0.43 25.4
37048 St.24 0.46 23.1
37067 St.27 0.52 22.6
37068 St.27 0.51 22.5
37049 St.28 0.36 20.5
37050 St.28 0.37 20.2

31
Annex 2. Blue mussel data 2007
Lead and zinc concentrations (µg/g d.w.) in blue mussel (Mytilus edulis)
ID # Station Shell length
Number Mean weight
Dry weight
Pb Zn
gram % µg/g µg/g
37013 St. 1 2-3 cm 40 0.62 15.50 2.82 58.1
37014 St. 1 5-6 cm 20 2.51 15.06 4.04 48.1
37015 St. 2 2-3 cm 40 0.51 17.09 3.91 69.5
37016 St. 2 5-6 cm 20 4.93 15.20 4.09 72.1
37017 St. 3 2-3 cm 40 0.45 17.96 6.16 54.6
37085 St. 3 6-7 cm 20 9.05 14.56 5.20 63.0
37019 St. 4 2-3 cm 40 0.48 17.49 13.56 56.5
37086 St. 4 6-7 cm 20 9.22 16.83 31.92 56.3
37021 St. 5 2-3 cm 40 0.61 16.53 172.18 110.7
37087 St. 5 6-7 cm 20 7.29 13.76 259.44 113.7
37088 St. 8 2-3 cm 40 0.49 17.34 505.68 241.0
37089 St. 8 5.9-6.8 cm 19 8.34 16.25 418.89 146.6
37090 St. 10 2-3 cm 40 0.60 17.15 9.81 72.4
37091 St. 10 6-7 cm 20 7.87 14.61 14.95 50.7
37069 St. 11 2-3 cm 40 0.52 15.36 2.78 67.3
37070 St. 11 5.6-6.3 cm 20 5.53 13.85 4.20 50.0
37033 St. 12 2-3 cm 40 0.51 17.66 2.72 66.9
37034 St. 12 6-7 cm 20 8.95 16.36 3.45 56.2
37035 St. 13 2-3 cm 40 0.47 17.63 4.83 55.4
37036 St. 13 6-7 cm 20 8.20 15.10 5.15 48.7
37037 St. 15 2-3 cm 40 0.49 18.25 3.75 58.6
37038 St. 15 5-6 cm 20 4.97 15.69 5.57 55.4
37039 St. 16 2-3 cm 40 0.56 17.75 3.10 59.8
37040 St. 16 6-7 cm 20 7.29 14.53 5.54 53.5
37053 St. 17 2-3 cm 40 0.52 16.37 1.99 79.8
37054 St. 17 6-7.4 cm 20 8.08 13.36 3.41 61.6
37071 St. 19 2-3 cm 40 0.51 16.59 6.16 44.5
37072 St. 19 6-7 cm 20 8.21 15.80 1.76 65.1
37041 St. 20 2-3 cm 40 0.55 18.52 2.50 48.0
37042 St. 20 6-7 cm 19 8.42 13.83 2.24 68.3
37073 St. 21 2-3 cm 20 8.51 14.25 2.26 53.9
37074 St. 21 6-7.4 cm 40 0.48 16.16 3.36 45.3
37055 St. 22 2-3 cm 40 0.57 16.58 2.46 71.4
37056 St. 22 6-7.3 cm 20 9.91 16.43 4.67 56.9
37057 St. 24 2-3 cm 40 0.61 17.45 2.77 74.3
37058 St. 24 5.7-6.8 cm 20 7.84 16.89 3.49 69.3
37075 St. 26 2-3 cm 40 0.57 18.58 1.71 58.0
37076 St. 26 6-7 cm 20 9.03 16.63 3.37 50.4
37077 St. 27 2-3 cm 40 0.56 15.41 2.55 60.3
37078 St. 27 6-7 cm 20 8.37 13.33 3.82 49.3
37059 St. 28 2-3 cm 40 0.58 18.00 1.80 71.7
37060 St. 28 6-7 cm 19 8.63 15.03 3.29 72.1
37061 St. 29 2-3 cm 40 0.56 17.60 1.36 71.6
37062 St. 29 5.1-6.6 cm 20 6.12 15.36 2.60 69.4

National Environmental Research Institute, NERI, is a part of
University of Aarhus.
NERI’s tasks are primarily to conduct research, collect data, and give advice
on problems related to the environment and nature.
At NERI’s website www.neri.dk you’ll fi nd information regarding ongoing research and development projects.
Furthermore the website contains a database of publications including scientifi c articles, reports, conference contributions etc. produced by NERI staff members.
National Environmental Research InstituteDanmarks Miljøundersøgelser
NERIDMU
Further information: www.neri.dk
National Environmental Research Institute Management Frederiksborgvej 399 Personnel and Economy Secretariat PO Box 358 Monitoring, Advice and Research Secretariat DK-4000 Roskilde Department of Policy Analysis Denmark Department of Atmospheric Environ ment Tel: +45 4630 1200 Department of Marine Ecology Fax: +45 4630 1114 Department of Environmental Chemistry and Microbiology Department of Arctic Environment
National Environmental Research Institute Monitoring, Advice and Research Secretariat Vejlsøvej 25 Department of Marine Ecology PO Box 314 Department of Terrestrial Ecology DK-8600 Silkeborg Department of Freshwater Ecology Denmark Tel: +45 8920 1400 Fax: +45 8920 1414
National Environmental Research Institute Department of Wildlife Ecology and Biodiversity Grenåvej 14, Kalø DK-8410 Rønde Denmark Tel: +45 8920 1700 Fax: +45 8920 1514

NERI Technical Reports
NERI’s website www.neri.dk contains a list of all published technical reports along with other NERI publications. All recent reports can be downloaded in electronic format (pdf) without charge. Some of the Danish reports include an English summary.
Nr./No. 2008
666 Agerhønens biologi og bestandsregulering. En gennemgang af den nuværende viden. Af Kahlert, T., Asferg, T. & Odderskær, P. 61 s.
665 Individual traffi c-related air pollution and new onset adult asthma. A GIS-based pilot study. By Hansen, C.L. et al. 23 pp.
664 Aluminiumsmelter og vandkraft i det centrale Grønland. Datagrundlag for natur og ressourceudnyttelse i forbindelse med udarbejdelse af en Strategisk Miljøvurdering (SMV). Af Johansen, P. et al. 110 s.
663 Tools to assess conservation status on open water reefs in Nature-2000 areas. By Dahl, K. & Carstensen, J. 25 pp.
662 Environmental monitoring at the Nalunaq Gold Mine, South Greenland, 2007. By Glahder, C.M., Asmund, G. & Riget, F. 31 pp.
661 Tilstandsvurdering af levesteder for arter. Af Søgaard, B. et al. 72 s.
660 Opdatering af vurdering af anvendelse af SCR-katalysatorer på tunge køretøjer som virkemiddel til nedbringelse af NO2 forureningen i de største danske byer. Af Ketzel, M. & Palmgren, F. 37 s.
659 Optimering af behandlingseffekten i akvakultur. Minimering af forbrug og udlednbing af hjælpestoffer. Af Sortkjær, O. et al. 124 s. (også tilgængelig i trykt udgave).
658 Danske kystklitter – vegetation og jordbundskemi. Analyse af NOVANA-data 2004-2006. Af Damgaard, C., Nygaard, B. & Nielsen, K.E. 66 s.
657 High density areas for harbour porpoises in Danish waters. By Teilmann, J. et al. 40 pp.
656 Manglende indberetninger til vildtudbyttestatistikken i jagtsæsonen 2006/07. Af Asferg, T. 21 s.
654 Rapportering af Luftemissioner på Grid. Metoder og principper. Af Jensen, M.T. et al. 56 s.
653 Control of Pesticides 2006. Chemical Substances and Chemical Preparations. By Krongaard, T., Petersen, K.K. & Christoffersen, C. 25 pp.
652 A preliminary strategic environmental impact assessment of mineral and hydrocarbon activities on the Nuussuaq peninsula, West Greenland. By Boertmann, D. et al. 66 pp.
651 Undersøgelser af jordhandler i forbindelse med naturgenopretning. Af Jensen, P.L., Schou, J.S. & Ørby, P.V. 44 s.
650 Fuel consumption and emissions from navigation in Denmark from 1990-2005 – and projections from 2006-2030. By Winther, M. 108 pp.
2007
649 Annual Danish Emission Inventory Report to UNECE. Inventories from the base year of the protocols to year 2005. By Illerup, J.B. et al. 182 pp.
648 Optælling af agerhøns på Kalø Gods 2004-2007 – metodeafprøvning og bestandsudvikling. Af Odderskær, P. & Berthelsen, J.P. 38 s.
647 Criteria for favourable conservation status in Denmark. Natural habitat types and species covered by the EEC Habitats Directive and birds covered by the EEC Birds Directive. By Søgaard, b. et al. 92 pp.
646 Vandmiljø og Natur 2006. NOVANA. Tilstand og udvikling – faglig sammenfatning. Af Boutrup, S. et al. 125 s.
645 Atmosfærisk deposition 2006. NOVANA. Af Ellermann, T. et al. 62 s.
644 Arter 2006. NOVANA. Af Søgaard, B., Pihl, S. & Wind, P. 88 s.
643 Terrestriske Naturtyper 2006. NOVANA. Af Bruus, M. et al. 70 s.
642 Vandløb 2006. NOVANA. Af Bøgestrand, J. (red.). 93 s.
641 Søer 2006. NOVANA. Af Jørgensen, T.B. et al. 63 s.
640 Landovevågningsoplande 2006. NOVANA. Af Grant, R. et al. 121 s.
639 Marine områder 2005-2006. Tilstand og udvikling i miljø- og naturkvaliteten. NOVANA. Af Ærtebjerg, G. (red.). 95 s.
637 Forvaltningsmetoder i N-belastede habitatnaturtyper. Af Damgaard, C. et al. 46 s.
National Environmental Research Institute ISBN 978-87-7073-051-8University of Aarhus . Denmark ISSN 1600-0048
This report evaluates the pollution in Arsuk Fjord at Ivittuut in South Greenland based on environmental studies conducted in 2007. The area is polluted by lead and zinc caused by the mining of cryolite that took place from 1854 to 1987. The 2007 study shows that the lead pollution of the fjord continues to fall. Zinc concentrations also generally decrease, but slower. We have found elevated lead concentrations in blue mussels in outer Arsuk Fjord and in areas 3-4 km outside the fjord. On a c. 5 km stretch of coastline around Ivittuut, the lead concentration in blue mus-sels is so high, that it is recommended not collecting and eating mussels from this area. Lead and zinc concentrations in brown seaweed are also elevated in a large part of Arsuk Fjord.
674 En
viron
men
tal mo
nito
ring
at the cryo
lite min
e in Ivittu
ut,
So
uth
Green
land
, 2007
Related Documents