Proceeding on the 5th EnvironmentAsia International Conference 13-15 June 2019, Convention Center, The Empress Hotel, Chiang Mai, Thailand I-28 Environmental Analysis of Coal-Fired Power Plants in Ultra Supercritical Technology Versus Integrated Gasification Combined Cycle Dwi Ratna Mustafida 1* , Abdul Wahid 2 , and Yuli Amalia Husnil 3 1*,2 Chemical Engineering Department, Faculty of Engineering, Universitas Indonesia, Depok 16424, Indonesia 3 Chemical Engineering Department, Institut Teknologi Indonesia, Serpong 15314, Indonesia. *E-mail: [email protected] ABSTRACT This study evaluates and compared the performance of coal-fired power plants in ultra-supercritical (USC) versus integrated gasification combined cycle (IGCC). System performance in terms of environmental analysis. Base on the exhaust emissions than IGCC and USC in terms of SO2, CO2, CO, and H2S. The IGCC system is modeled and simulated with post-combustion capture and both of them used sub-bituminous coal from the Indramayu PLTU. The result display that with the same amount of raw materials (20 ton/h coal) the IGCC produce lower exhaust emissions than USC. IGCC produced 7.80 ton CO2-eq. / MWh and USC of 27.93 ton CO2-eq. / MWh. IGCC technology for the long term will be better than USC because it has produced greater electrical power with the amount of material the same coal standard and produces lower exhaust emissions. Keywords: Clean Coal Technology, USC, IGCC, environmental analysis, sub-bituminous

Welcome message from author
This document is posted to help you gain knowledge. Please leave a comment to let me know what you think about it! Share it to your friends and learn new things together.
Transcript

Proceeding on the 5th EnvironmentAsia International Conference
13-15 June 2019, Convention Center, The Empress Hotel, Chiang Mai, Thailand
I-28
Environmental Analysis of Coal-Fired Power Plants in Ultra
Supercritical Technology Versus Integrated Gasification
Combined Cycle
Dwi Ratna Mustafida1*, Abdul Wahid 2, and Yuli Amalia Husnil3
1*,2 Chemical Engineering Department, Faculty of Engineering, Universitas
Indonesia, Depok 16424, Indonesia
3Chemical Engineering Department, Institut Teknologi Indonesia, Serpong
15314, Indonesia.
*E-mail: [email protected]
ABSTRACT
This study evaluates and compared the performance of coal-fired power plants
in ultra-supercritical (USC) versus integrated gasification combined cycle
(IGCC). System performance in terms of environmental analysis. Base on the
exhaust emissions than IGCC and USC in terms of SO2, CO2, CO, and H2S.
The IGCC system is modeled and simulated with post-combustion capture and
both of them used sub-bituminous coal from the Indramayu PLTU. The result
display that with the same amount of raw materials (20 ton/h coal) the IGCC
produce lower exhaust emissions than USC. IGCC produced 7.80 ton CO2-eq.
/ MWh and USC of 27.93 ton CO2-eq. / MWh. IGCC technology for the long
term will be better than USC because it has produced greater electrical power
with the amount of material the same coal standard and produces lower
exhaust emissions.
Keywords: Clean Coal Technology, USC, IGCC, environmental analysis,
sub-bituminous
Proceeding on the 5th EnvironmentAsia International Conference
13-15 June 2019, Convention Center, The Empress Hotel, Chiang Mai, Thailand
I-29
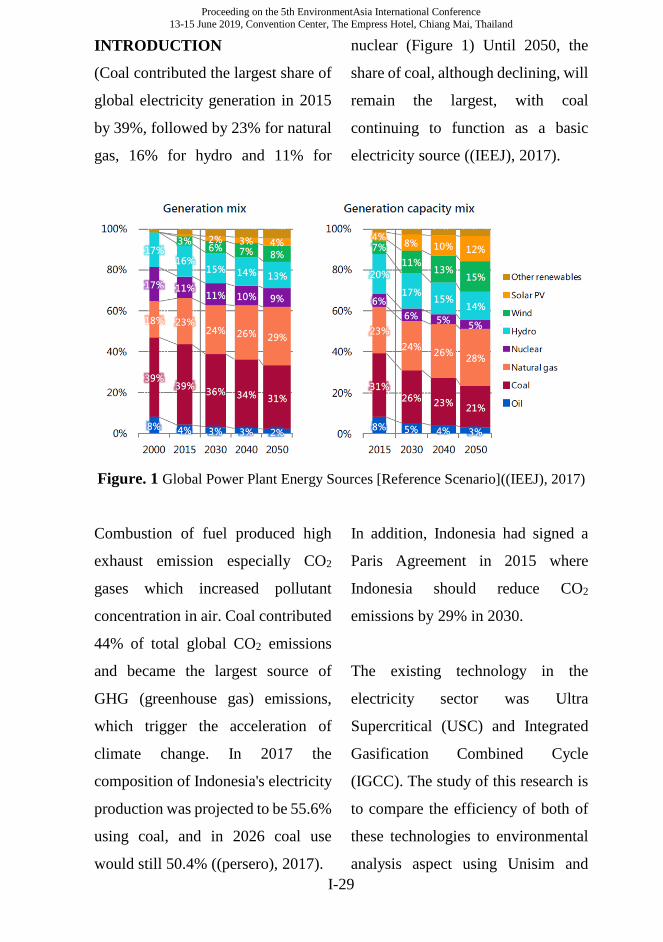
INTRODUCTION
(Coal contributed the largest share of
global electricity generation in 2015
by 39%, followed by 23% for natural
gas, 16% for hydro and 11% for
nuclear (Figure 1) Until 2050, the
share of coal, although declining, will
remain the largest, with coal
continuing to function as a basic
electricity source ((IEEJ), 2017).
Figure. 1 Global Power Plant Energy Sources [Reference Scenario]((IEEJ), 2017)
Combustion of fuel produced high
exhaust emission especially CO2
gases which increased pollutant
concentration in air. Coal contributed
44% of total global CO2 emissions
and became the largest source of
GHG (greenhouse gas) emissions,
which trigger the acceleration of
climate change. In 2017 the
composition of Indonesia's electricity
production was projected to be 55.6%
using coal, and in 2026 coal use
would still 50.4% ((persero), 2017).
In addition, Indonesia had signed a
Paris Agreement in 2015 where
Indonesia should reduce CO2
emissions by 29% in 2030.
The existing technology in the
electricity sector was Ultra
Supercritical (USC) and Integrated
Gasification Combined Cycle
(IGCC). The study of this research is
to compare the efficiency of both of
these technologies to environmental
analysis aspect using Unisim and

Proceeding on the 5th EnvironmentAsia International Conference
13-15 June 2019, Convention Center, The Empress Hotel, Chiang Mai, Thailand
I-30
Promax Simulation Program. The
coal data was obtained from
Indramayu PLTU. The data of this
research were compared to the
Intergovernmental Panel on Climate
Change Guidelines to obtain the
calculation. From report Huaneng
Greengen Co the result shows that
USC has higher exhaust emissions
than IGCC in terms of SO2, CO2,
NOx, CO and slag (Co., 2008).
Much research has been done to
improve equipment efficiency and
optimization in the (CCT) power
plants by analyzing processes from
various aspects such as energy (first
law of thermodynamics), exergy
(second law of thermodynamics),
economy and environmental (4-E).
The main purpose of this paper is to
analyze the previous work done by
researchers related to CCT power
plant 4-E analysis. If anyone extracts
the ideas for the development of the
concept of using the article, we will
achieve our goal. This review also
indicates the scope of future research
in the clean coal technology power
plants
METHODOLOGY
Process description
The flowsheet of the IGCC process
used in the analysis is shown in
Figure 2. The process is composed of
the following five integrated blocks:
coal sizing and slurry preparation,
gasification, syngas cooling, and
cleaning, acid gas removal (AGR),
CO2 gas Removal and combined
cycle power section. However,
Figure 2, directly shows the flow
diagram of the process of separating
H2S until the process of generating
electricity from the syngas of the
gasifier reactor output and Figure 3
shown the cryogenic CO2 separation.
Figure 4. Shown the flowsheet of the
process of USC. The process is
composed of the following two
integrated blocks: boiler subsystem
and the steam turbine system.
Modeling, simulation, and
calculation
An IGCC post-combustion and USC
plant integrated with CO2 capture are
modeled and simulated using UniSim
Design® R450 and Promax® 4.0
simulation software. The composition of
syngas products and IGCC process

Proceeding on the 5th EnvironmentAsia International Conference
13-15 June 2019, Convention Center, The Empress Hotel, Chiang Mai, Thailand
I-31
model based on experimental data (Asif,
Bak, Saleem, & Kim, 2015; Wang,
2017). The USC proses model is based
on the validated model of Yang, et al.
and Zhou, et al. (Yang et al., 2013; Zhao
et al., 2017). The Cryogenic is based on
a reference model (Air Liquide
Indonesia. PT). The model is based on a
steady-state operation. In the heat
exchanger, there is a pressure drop of 5
psi. Pump efficiency of 65%, Turbine
efficiency, and compressor of 75 %.
Coal specification was obtained from the
Indramayu PLTU and mass was 20000
kg/h shown in Table 1.
Figure 2. Schematic of the IGCC system with Promax® 4.0
Figure 3. Schematic of the cryogenic CO2 separation system
Raw Syngas Syngas Feed
H2S Removal
7
1
Sweet Gas
Rich Amine
Lean/Rich Exchanger 1
34
Lean Amine
Rich Flash 1
Flash Gas
7
Recycle
13MKUP-1
Syngas Cooler
14
Makeup Solven 1
Blowdown 1
18
pump 1
19
Q-1Air Cooler
20
Q-4
K-1001
2
Condenser 16
8
Stripper 1
10
1
2
Q-2
Q-3
Acid Gas
valve1
10
Air Compresor5
Q-5
CombustorMIX-100
9 11 12
Gas Turbine
Q-7Preheater
16
17HP Turbine IP Turbine LP Turbine
22
Superheater
24
Exhaust Gas
26
27
Q-6 Q-8 Q-9
21
Flash drum29
31
Q-10
RCYL-1
23
MKUP-2
Condenser
PUMP-100
Makeup Water
Blowdown Water
32
Q-11
15
25
Economizer
30
Steam Compresor
54
Q-19
MKUP-4
59
60
61
Recycle Air from CO2 Removal

Proceeding on the 5th EnvironmentAsia International Conference
13-15 June 2019, Convention Center, The Empress Hotel, Chiang Mai, Thailand
I-32
Figure 4. Schematic of the USC system with Promax® 4.0
Table 1. Composition analysis of coal
Composition Value (% wt)
Proximate analysis
Moisture 14.34
Fixed carbon 37.63
Volatile matter 43.47
Ash 4.56
Ultimate analysis
C 55.42
H 4.20
N 0.71
S 0.1
O 20.67
Ash 4.56
Calorific value, HHV (kcal/kg) 4236
Environmental analysis is carried out
based on the calculation of GHG
emissions (CO2) in the energy sector
in the power plant sub-sector. The
methodology used in calculating this
emission is the method established by
the Intergovernmental Panel on
Climate Change Guidelines in the
Combustor
Out Combustor
WSPSH FRH
To FRH Out FRH
Coal
Air
MIX-100
In Combustor
APH
Out Economizer
Out APH
FSH
Economizer PRH
Out FSHOut PRH
Steam from HPT 2
In FRH
To IPT
Feed Water
In WSPSH
Out WSPSH
To HPT 1
H1 H2 H3
Out H2 Out H3
HPT 1Out HPT 1
In HPT 2
HPT 2
Out HPT 2
Out IPT 1
In IPT 2
Out IPT 2
DEA
MKUP-1
Makeup Water
Condensat
In DEA
Blow Down
Out Vap. DEA
H5H4
LPT1LPT2
LPT3
Out LPT 1
In LPT 2
In H4
LPT4
H6
Out LPT 2
In LPT 3
Out LPT 3
In LPT 4
Out LPT 4
Out H6 In H6
Condenser
Out Condenser
Flash Drum
Vapor
Q-1Q-2
Q-3Q-4
Q-7Q-8
Q-9
Q-10
CMPR-100
In Intercooler 1
Q-11
Intercooler 1
In economizer
Q-12
Q-5
IPT1
IPT2
Q-6
RCYL-1Recycle Condensat
Liquid
CMPR-102
Out Liq. DEA
CO2 Removal
15
1
Cooler2
Pump 2 MKUP-3
RCYL-2
Rich Flash 2
Flue Gas
Out Liq. CO2 Removal
Out Vap. Rich Flash 2
Out Liq. Rich Flash 2
In Stripper
In cooler 4
45
Makeup Solven 2
Blowdown 2
Solven in
51
Q-16
Q-17
In Cooler 2
In Cooler 1
Heater 2
K-100
Boilup
Liq. Stripper
VSSL-100
Vap. Stripper
Reflux
Stripper
10
1
2
Q-14
Q-15
in Cooler 3
Recycle Solven
MIX-101
Cooler 3
Out Cooler 3
VSSL-101
Carbon Dioxide
H2O
Q-18
Mixed Solven
Heater 1
Q-20In Heater 2
PUMP-100
H2O Out pump
Q-21
Cooler 4
Q-22
Out cooler 4
Feed Air
VLVE-100 Cooler1
Feed AbsorberQ-13

Proceeding on the 5th EnvironmentAsia International Conference
13-15 June 2019, Convention Center, The Empress Hotel, Chiang Mai, Thailand
I-33
2006 IPCC Guidelines. The
application of this method has been
stipulated in LHK Ministerial
Regulation Number P.73 / Men LHK
/ Setjen / Kum.1 / 12/2017 dated 29
December 2017 concerning the
Implementation and Reporting
Guidelines for Greenhouse Gas
Inventories. Broadly speaking, the
calculation of GHG emissions/
removals is obtained through
multiplying data on activities with
emission factors, the Global
Warming Potential (GWP) index was
used to evaluate the climate change
impact. The GWP index allows all of
the GHG flows during the operation
period, ��𝐺𝐻𝐺𝑜𝑝
, to be expressed on a
CO2_eq basis as shown in the simple
equation:
��𝐺𝐻𝐺𝑜𝑝 = ∑ ��𝑗
𝐺𝐻𝐺𝑁𝑗=1 × 𝐺𝑊𝑃𝑗 (1)
According to the Intergovernmental
Panel on Climate Change (IPCC
2007), the GWP index evaluated over
100 years was considered to be 1 for
CO2, 28 for CH4 and 265 for N2O
(Restrepo, Miyake, Kleveston, &
Bazzo, 2012)
RESULTS AND DISCUSSION
Environmental analysis
The environmental model predicted
an emission from the process of 7.249
ton CO2-eq./MWh to IGCC and
25.97 ton CO2-eq./MWh to USC. The
power plant emissions correspond to
87.7%, followed by the pre-burning
process (belt conveyors, fans, mills,
and others) with 7.3%. The mining
and transport stages account for 5%
(Restrepo et al., 2012). Figure 5.
Shown GHG emissions for IGCC and
USC. Table 2 shown the gas emission
produce from IGCC and USC.
Figure 5. GHG emissions for IGCC and USC
0.000
20.000
40.000
PowerPlant
Pre Burningprocess
Transport Mining Total
7.249 0.529 0.003 0.016 7.80
25.971.90 0.01
0.06
27.93
IGCC (ton CO2-eq./MWh) USC (ton CO2-eq./MWh)
Proceeding on the 5th EnvironmentAsia International Conference
13-15 June 2019, Convention Center, The Empress Hotel, Chiang Mai, Thailand
I-34
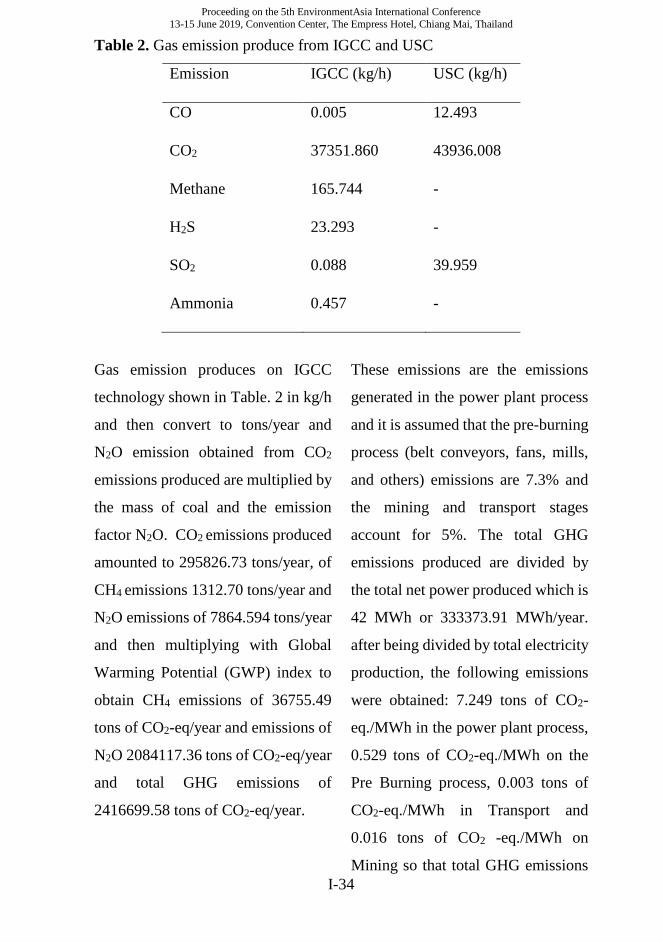
Table 2. Gas emission produce from IGCC and USC
Emission IGCC (kg/h) USC (kg/h)
CO 0.005 12.493
CO2 37351.860 43936.008
Methane 165.744 -
H2S 23.293 -
SO2 0.088 39.959
Ammonia 0.457 -
Gas emission produces on IGCC
technology shown in Table. 2 in kg/h
and then convert to tons/year and
N2O emission obtained from CO2
emissions produced are multiplied by
the mass of coal and the emission
factor N2O. CO2 emissions produced
amounted to 295826.73 tons/year, of
CH4 emissions 1312.70 tons/year and
N2O emissions of 7864.594 tons/year
and then multiplying with Global
Warming Potential (GWP) index to
obtain CH4 emissions of 36755.49
tons of CO2-eq/year and emissions of
N2O 2084117.36 tons of CO2-eq/year
and total GHG emissions of
2416699.58 tons of CO2-eq/year.
These emissions are the emissions
generated in the power plant process
and it is assumed that the pre-burning
process (belt conveyors, fans, mills,
and others) emissions are 7.3% and
the mining and transport stages
account for 5%. The total GHG
emissions produced are divided by
the total net power produced which is
42 MWh or 333373.91 MWh/year.
after being divided by total electricity
production, the following emissions
were obtained: 7.249 tons of CO2-
eq./MWh in the power plant process,
0.529 tons of CO2-eq./MWh on the
Pre Burning process, 0.003 tons of
CO2-eq./MWh in Transport and
0.016 tons of CO2 -eq./MWh on
Mining so that total GHG emissions
Proceeding on the 5th EnvironmentAsia International Conference
13-15 June 2019, Convention Center, The Empress Hotel, Chiang Mai, Thailand
I-35
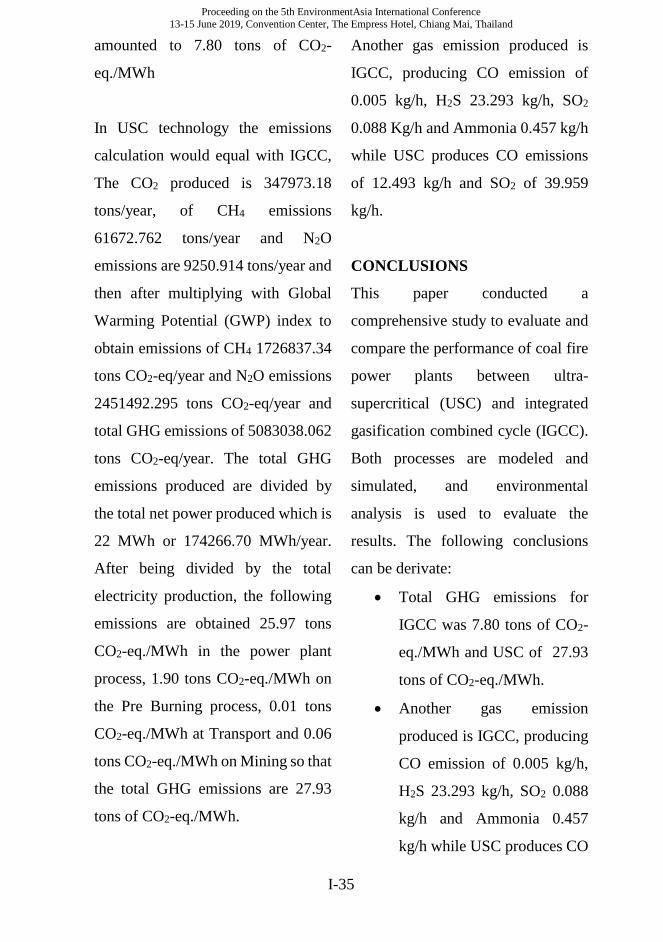
amounted to 7.80 tons of CO2-
eq./MWh
In USC technology the emissions
calculation would equal with IGCC,
The CO2 produced is 347973.18
tons/year, of CH4 emissions
61672.762 tons/year and N2O
emissions are 9250.914 tons/year and
then after multiplying with Global
Warming Potential (GWP) index to
obtain emissions of CH4 1726837.34
tons CO2-eq/year and N2O emissions
2451492.295 tons CO2-eq/year and
total GHG emissions of 5083038.062
tons CO2-eq/year. The total GHG
emissions produced are divided by
the total net power produced which is
22 MWh or 174266.70 MWh/year.
After being divided by the total
electricity production, the following
emissions are obtained 25.97 tons
CO2-eq./MWh in the power plant
process, 1.90 tons CO2-eq./MWh on
the Pre Burning process, 0.01 tons
CO2-eq./MWh at Transport and 0.06
tons CO2-eq./MWh on Mining so that
the total GHG emissions are 27.93
tons of CO2-eq./MWh.
Another gas emission produced is
IGCC, producing CO emission of
0.005 kg/h, H2S 23.293 kg/h, SO2
0.088 Kg/h and Ammonia 0.457 kg/h
while USC produces CO emissions
of 12.493 kg/h and SO2 of 39.959
kg/h.
CONCLUSIONS
This paper conducted a
comprehensive study to evaluate and
compare the performance of coal fire
power plants between ultra-
supercritical (USC) and integrated
gasification combined cycle (IGCC).
Both processes are modeled and
simulated, and environmental
analysis is used to evaluate the
results. The following conclusions
can be derivate:
Total GHG emissions for
IGCC was 7.80 tons of CO2-
eq./MWh and USC of 27.93
tons of CO2-eq./MWh.
Another gas emission
produced is IGCC, producing
CO emission of 0.005 kg/h,
H2S 23.293 kg/h, SO2 0.088
kg/h and Ammonia 0.457
kg/h while USC produces CO
Proceeding on the 5th EnvironmentAsia International Conference
13-15 June 2019, Convention Center, The Empress Hotel, Chiang Mai, Thailand
I-36
emissions of 12.493 kg/h and
SO2 of 39.959 kg/h.
IGCC technology requires a greater
investment because there are several
additional tools such as gasifiers gas
turbines and H2S removal, but when
compared to USC, this technology
for the long term will be better
because it has produced greater
electrical power with the amount of
material the same coal standard and
produces lower exhaust emissions.
ACKNOWLEDGEMENTS
The author would like to thank for the
support provided by all parties
involved in writing this paper
especially the mentors, Universitas
Indonesia which has funded this
research through the scheme of Hibah
Publikasi Internasional Terindeks
Untuk Tugas Akhir Mahasiswa
(PITTA B) No. NKB-
0691/UN2.R3.1/HKP.05.00/2019
and Institut Teknologi Indonesia
REFERENCES
(IEEJ), T. I. o. E. E. (2017). Outlook 2018,
Prospects and challenges until 2050,
Energy, Environment and Economy.
Retrieved from
(persero), P. P. (2017). Rancangan Usaha
Penyediaan Tenaga Listrik (RUPTL)
PLN 2017-2026. Retrieved from
Asif, M., Bak, C.-u., Saleem, M. W., & Kim,
W.-S. (2015). Performance
evaluation of integrated gasification
combined cycle (IGCC) utilizing a
blended solution of ammonia and 2-
amino-2-methyl-1-propanol (AMP)
for CO2 capture. Fuel, 160, 513-524.
doi:10.1016/j.fuel.2015.08.008
Co., H. G. (2008). People’s Republic of
China: Tianjin Integrated
Gasification Combined Cycle Power
Plant Project (42117). Retrieved from
Restrepo, Á., Miyake, R., Kleveston, F., &
Bazzo, E. (2012). Exergetic and
environmental analysis of a
pulverized coal power plant. Energy,
45(1), 195-202.
doi:https://doi.org/10.1016/j.energy.
2012.01.080
Wang, T. (2017). An overview of IGCC
systems. In Integrated Gasification
Combined Cycle (IGCC)
Technologies (pp. 1-80).
Yang, Y., Wang, L., Dong, C., Xu, G.,
Morosuk, T., & Tsatsaronis, G.
(2013). Comprehensive exergy-based
evaluation and parametric study of a
coal-fired ultra-supercritical power
plant. Applied Energy, 112, 1087-
1099.
doi:10.1016/j.apenergy.2012.12.063
Zhao, Z., Su, S., Si, N., Hu, S., Wang, Y., Xu,
J., . . . Xiang, J. (2017). Exergy

Proceeding on the 5th EnvironmentAsia International Conference
13-15 June 2019, Convention Center, The Empress Hotel, Chiang Mai, Thailand
I-37
analysis of the turbine system in a
1000 MW double reheat ultra-
supercritical power plant. Energy,
119, 540-548.
doi:https://doi.org/10.1016/j.energy.
2016.12.07

Proceeding on the 5th EnvironmentAsia International Conference
13-15 June 2019, Convention Center, The Empress Hotel, Chiang Mai, Thailand
I-38
Optimization of Ca(OH)2 pretreatment to enhance methane
production of rice straw using response surface methodology
Witthayaporn Kongyoo1, Muhammad Zaeem Zubair Bin Sazali2,
Nopawan Ratasuk1, Daoroong Sungthong1*
1Department of Environmental Science, Faculty of Science,
Silpakorn University, Nakhon Pathom, Thailand
2Environmental and Water Technology, School of Life Sciences and Chemical
Technology, Ngee Ann Polytechnic, Singapore
Corresponding author: [email protected]
ABSTRACT
In this study, an alkaline pretreatment process with Ca(OH)2 for rice straw at different
conditions to enhance methane production was investigated through biochemical
methane potential (BMP) tests. The pretreatment process factors including Ca(OH)2
concentrations of 5 – 15% (by weight) and temperatures of 70 – 90°C with
pretreatment time of 2 h were studied. A response surface methodology (RSM)
combined with a face-centered composite design (FCCD) was employed in obtaining
the optimized pretreatment conditions for the highest methane yield of rice straw. The
BMP experimental results show that the methane yield for all pretreated rice straws
was increased by 55.44 – 78.59%, compared to the untreated rice straw. The statistical
analyses show that the maximum methane yield of 304.31 NmL/g VS was obtained
at the desirable pretreatment conditions of 5% Ca(OH)2 and 87.34°C with
pretreatment time of 2 h. The ANOVA test also revealed that the model was
considered statistically significant with a determination coefficient (R2) of 81.65%.
The model could be efficiently used to predict the methane yield from the anaerobic
digestion process of the pretreated rice straw. Furthermore, Ca(OH)2 concentration
was a more significant factor affecting methane production than temperature.
Keywords: Rice straw, Alkaline pretreatment, Biochemical methane potential
(BMP), Methane production, Response surface methodology (RSM)

Proceeding on the 5th EnvironmentAsia International Conference
13-15 June 2019, Convention Center, The Empress Hotel, Chiang Mai, Thailand
I-39
INTRODUCTION
Globally, agricultural crop residues
are significant contributors of
biomass resources and can be
transformed into different types of
bioenergy which can then be utilized
as a promising source of alternative
energy to fossil fuels. As one of the
appropriate conversion methods of
agricultural crop residues for
bioenergy synthesis, the anaerobic
digestion process is being used
extensively to produce biogas,
mainly containing methane (Cheng,
2010).
As one of the world’s major producer
and exporter of rice, Thailand has an
abundance of agricultural crop
residues comprising a large amount
of abandoned rice straw (Department
of Alternative Energy Development
and Efficiency, 2014). As a primary
agricultural crop residue, rice straw is
considered to have the potential for
bioenergy synthesis by being
transformed into biogas through the
anaerobic digestion process.
However, rice straw is a
lignocellulosic material that
predominantly contains cellulose,
hemicellulose, and lignin. Rice straw,
therefore, becomes recalcitrant to
biological degradation.
Consequently, the anaerobic
digestion of rice straw for methane
production is then hindered because
water-soluble low molecular weight
compounds are less available for
anaerobic microorganisms (Song et
al., 2014; Taherzadeh & Karimi,
2008). Thus, the pretreatment of rice
straw prior to the anaerobic digestion
process is quite essential and it is
used to destroy the complex structure
of lignin and decrease the
crystallinity of cellulose and
hemicellulose resulting in increasing
the degradability and the potential of
methane yield and accelerating the
digestion process (Ferreira et al.,
2013; Teghammar et al., 2010).
Several approaches for the
pretreatment of rice straw have been
investigated including physical,
chemical, biological or a
combination of these (Gu et al., 2015;
Kim et al., 2012; Chen, 2014). As one
of the pretreatment methods, the

Proceeding on the 5th EnvironmentAsia International Conference
13-15 June 2019, Convention Center, The Empress Hotel, Chiang Mai, Thailand
I-40
alkaline pretreatment with calcium
hydroxide or lime (Ca(OH)2) has
been extensively used due to its low
cost, safe handling, and minor
environmental impacts (Montgomery
& Bochmann, 2014). For instance,
Song et al. (2013) showed that the
main compositions of rice straw
pretreated with Ca(OH)2 such as
lignin, cellulose, and hemicellulose,
were significantly degraded with
increasing Ca(OH)2 concentration.
The modeling and optimization using
response surface methodology
(RSM) combined with Box-Behnken
experimental design confirmed that
the optimum conditions for the
pretreated rice straw in an anaerobic
digestion were 9.81% Ca(OH)2 (w/w
TS), 5.89 days treatment time, and
45.12% inoculum content, which
resulted in a methane yield of 225.3
mL/g VS. Gu et al. (2015) reported
that the rice straw pretreated with
Ca(OH)2 at the concentrations of 8%
and 10% (w/w TS) under ambient
temperature for 72 h gave the highest
methane yield of 564.7 mL/g VS and
574.5 mL/g VS, respectively, which
were 34.3% and 36.7% higher than
the untreated.
Even though, there have been many
studies reported about the effects of
Ca(OH)2 as a pretreatment chemical
in terms of chemical concentration,
pretreatment time, and inoculum
amount on the digestibility of rice
straw, however, there has been very
little research reported about the
effects of Ca(OH)2 as a pretreatment
chemical in terms of temperature.
Also, in the last few years, RSM has
been applied in optimizing and
evaluating the interactive effects of
independent factors of numerous
chemicals and biochemical processes
involved in anaerobic digestion
(Song et al., 2013; Zou et al., 2016).
Therefore, this work has been made
to find out the effectiveness of two
operating parameters, including the
concentration of calcium hydroxide
and the temperature as pretreatment
methods of rice straw on methane
yield under batch conditions.
Additionally, a response surface
methodology (RSM) combined with
Proceeding on the 5th EnvironmentAsia International Conference
13-15 June 2019, Convention Center, The Empress Hotel, Chiang Mai, Thailand
I-41
a face-centered composite design
(FCCD) was applied to determine the
optimum pretreatment conditions of
the two operating pretreatment
parameters on methane yield. The
information from this study will not
only make use of rice straw in the
form of renewable energy, i.e.,
methane, but also to reduce the
pollutants from rice straw open-field
burning.
METHODOLOGY
Rice straw preparation
Rice straw was obtained from a rice
planting area located in Ratchaburi,
Thailand. At first, the collected rice
straw was oven dried at 60℃ for
about 24 h, then ground into fine
particles by a cutting mill. The
ground particles of rice straw were
later screened to have an average
particle size between 0.5 and 2.0 mm
and stored in a polyethylene zipper
bag at room temperature before being
subjected to the pretreatment. Some
physical and chemical characteristics
of the rice straw sample are shown in
Table 1. This prepared rice straw
sample was defined as untreated rice
straw.
Pretreatment process
Ca(OH)2 solution at concentrations
of 5%, 10%, and 15% (by weight)
combined with temperature levels of
70℃, 80℃, and 90℃ was used for the
pretreatments. The conditions of the
pretreatment used in this study are
shown in Table 2.
For each experiment (Table 2), a
sample of 50 g prepared rice straw
was mixed with 1 kg of Ca(OH)2
solution in a 1-L laboratory bottle
resulting in the ratio of rice straw to
Ca(OH)2 solution loading of 1:20 (by
weight). The bottle was then heated
on a hot plate to a specific
temperature and was later kept in a
hot air oven at that temperature for 2
h. Afterwards, the bottle was
removed from the oven, and the
pretreated rice straw sample was
washed with tap water until neutral
pH and then oven-dried at 60℃ for
about 24 h. The pretreated rice straw
sample was homogenized and kept in
a polyethylene zipper bag at room

Proceeding on the 5th EnvironmentAsia International Conference
13-15 June 2019, Convention Center, The Empress Hotel, Chiang Mai, Thailand
I-42
temperature for being further
investigated the effects of the
pretreatments on methane yield using
biochemical methane potential test.
Table 1 The physical and chemical characteristics of untreated rice straw.
Parameter Values
Total solids (%) 92.01 ± 0.05
Volatile solids (%TS) 86.67 ± 0.10
Fixed solids (%TS) 13.33 ± 0.10
Organic carbon (%TS) 54.69 ± 0.66
Total nitrogen (%TS) 0.5056 ± 0.0127
Carbon to nitrogen (C/N) ratio 108
Extractives (%TS) 1.21 ± 0.11
Cellulose (%TS) 25.15
Hemicellulose (%TS) 47.79 ± 0.55
Lignin (%TS) 12.51 ± 0.15
Result = mean ± standard deviation (SD).
Table 2 The pretreatment conditions.
Experiment Concentration (%) Temperature (℃) Time (h)
1 5 70 2
2 5 80 2
3 5 90 2
4 10 70 2
5 10 80 2
6 10 90 2
7 15 70 2
8 15 80 2
9 15 90 2

Proceeding on the 5th EnvironmentAsia International Conference
13-15 June 2019, Convention Center, The Empress Hotel, Chiang Mai, Thailand
I-43
Inoculum preparation
The inoculum used in this study
being characterized as granular
sludge was taken from an anaerobic
wastewater treatment reactor
operated by Choheng Rice
Vermicelli Factory Company
Limited, located in Nakhon Pathom,
Thailand. The collected inoculum
was washed with anaerobic mineral
salt medium, then transferred into a
10-L stainless steel bioreactor and
incubated at 3 5 ℃ under anaerobic
condition for approximately 5 days in
order to deplete the residual
biodegradable organic material
(degasification), according to the
recommendation of Angelidaki et al.
(2009).
Biochemical methane potential tests
The biochemical methane potential
(BMP) tests of the untreated and
pretreated rice straws were evaluated
according to the method described by
Angelidaki et al. (2009) and Hansen
et al. (2004) with some
modifications. Batch experiments
were carried out in 500-mL
laboratory bottles (Schott Duran,
Germany). Firstly, a sample of 5 g
volatile solids (VS) from the
untreated and pretreated rice straws
was weighed and added into the
bottle. Secondly, a certain amount of
incubated inoculum was fed into the
bottle with a substrate-to-inoculum
ratio of 1:2 on a VS basis. Dry forms
of ammonium chloride (NH4Cl) and
potassium phosphate (KH2PO4) were
added to adjust a COD:N:P ratio of
the substrate to 100:5:1 (by weight)
(Eskicioglu & Ghorbani, 2011).
Sodium bicarbonate (NaHCO3)
powder was also added in order for
the mixture to achieve alkalinity of
5,000 mg/L (as CaCO3) (McCarty,
1964). Thirdly, distilled water was
added to the bottle for reaching the
working volume of 400 mL. Finally,
the headspace was filled with
nitrogen gas for 1 min to remove
oxygen traces and to ensure
anaerobic condition in the bottle. The
bottle was then sealed with two
pieces of 3-mm thick silicone discs
which were held tightly to the bottle
head by a plastic screw cap punched
in the middle (Schott Duran,
Germany). To enable biogas transfer

Proceeding on the 5th EnvironmentAsia International Conference
13-15 June 2019, Convention Center, The Empress Hotel, Chiang Mai, Thailand
I-44
from the bottle to the methane
content measurement device, a 27-
gauge needle equipped with 3-way
stopcock was pierced through the
silicone discs. After that, the bottle
was placed in the incubator at 35℃
for 30 days. During the BMP
experiment, the bottle was
occasionally shaken. In the first
week, methane content was daily
measured due to very high biogas
production, after that occasionally
measured. The methane content in
the produced biogas in the bottle was
directly obtained through an alkaline
and water displacement method
(Wellinger et al., 2013) with 12%
NaOH used as a barrier solution to
entrap CO2 and H2S that had been
produced and the residual methane
volume to be measured by water
displacement. A blank control
without substrate added was also
conducted under the same conditions
to remove endogenous methane
production from the inoculum. All
tests were performed in triplicate.
The methane yield over a period of 30
days was calculated at standard
temperature and pressure (273 K and
1 atm) and expressed as the methane
content (NmL) per gram of VS from
the substrate introduced to the bottle.
Statistical analysis, and
optimization of the experimental
data
Design Expert software version 11, a
statistical program, was used for data
analysis and model building. RSM
coupled with FCCD was applied to
optimize the pretreatment condition
variables and was also used to
determine the optimum conditions
and the effects of two independent
variables, including Ca(OH)2
concentration (X1) and temperature
(X2) on methane yield (Y) which was
a response variable or a dependent
variable. The range of the
independent variables and their levels
are presented in Table 3. All
experimental data with a total of 27
runs, as shown in Table 4, were
performed according to the FCCD
configuration. The functional
relationships between the response
variable (methane yield) and the two
independent variables (concentration
and temperature) were obtained by
Proceeding on the 5th EnvironmentAsia International Conference
13-15 June 2019, Convention Center, The Empress Hotel, Chiang Mai, Thailand
I-45
estimating the coefficients of the
following polynomial model:
Y = β + ∑ βiXi
2i=1 +
∑ ∑ βijXiXj
2j=1
2i=1 +
∑ ∑ ∑ βijk
2k=1 Xi
2j=1 Xj
2i=1 Xk (1)
where Y is the predicted response,
is the intercept, i is the linear
constant coefficient, and ij and ijk
are the interaction constant
coefficients. The independent
variables are denoted by X.
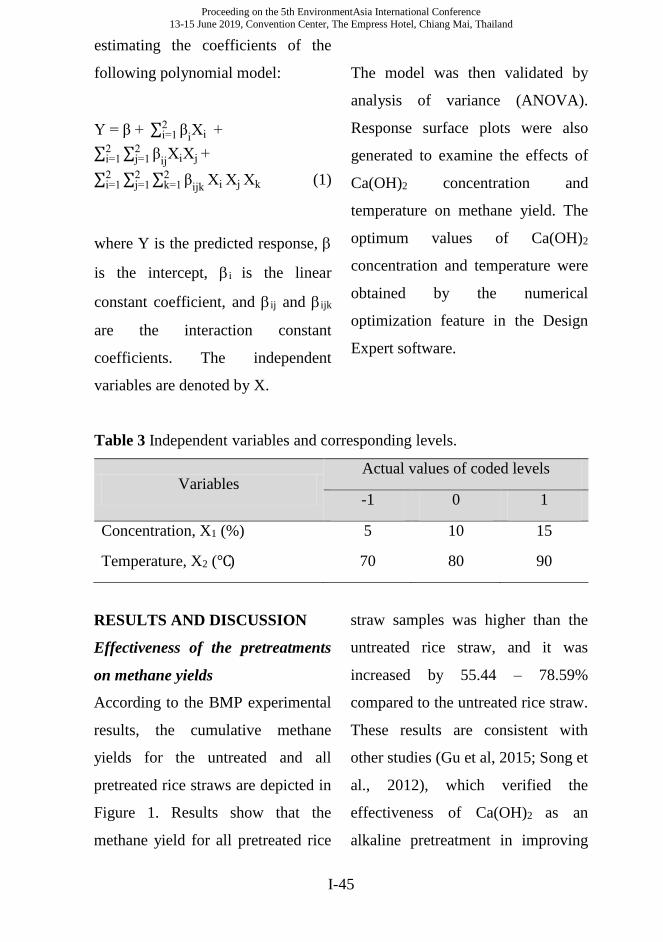
The model was then validated by
analysis of variance (ANOVA).
Response surface plots were also
generated to examine the effects of
Ca(OH)2 concentration and
temperature on methane yield. The
optimum values of Ca(OH)2
concentration and temperature were
obtained by the numerical
optimization feature in the Design
Expert software.
Table 3 Independent variables and corresponding levels.
Variables Actual values of coded levels
-1 0 1
Concentration, X1 (%) 5 10 15
Temperature, X2 (℃) 70 80 90
RESULTS AND DISCUSSION
Effectiveness of the pretreatments
on methane yields
According to the BMP experimental
results, the cumulative methane
yields for the untreated and all
pretreated rice straws are depicted in
Figure 1. Results show that the
methane yield for all pretreated rice
straw samples was higher than the
untreated rice straw, and it was
increased by 55.44 – 78.59%
compared to the untreated rice straw.
These results are consistent with
other studies (Gu et al, 2015; Song et
al., 2012), which verified the
effectiveness of Ca(OH)2 as an
alkaline pretreatment in improving

Proceeding on the 5th EnvironmentAsia International Conference
13-15 June 2019, Convention Center, The Empress Hotel, Chiang Mai, Thailand
I-46
the biodegradability and enhancing
the bioenergy production. This
phenomenon can be explained by the
fact that Ca(OH)2 pretreatment is
capable of removing amorphous
substances (e.g., lignin and
hemicellulose), which increases the
crystallinity index (Kim et al., 2016).
However, the methane yield was not
increased as the Ca(OH)2
concentration, and the temperature
increased. The reason may be due to
the fact that calcium hydroxide is
relatively insoluble in water, and its
solubility also decreases as
temperature increases (Athanassiadis
et al., 2017). Therefore, it is possible
that increasing Ca(OH)2 loading and
temperature level for the
pretreatment of rice straw did not
affect the methane yield.
Model building
Based on the two independent
variables, including Ca(OH)2
concentration and temperature, and
the response variable that is the
experimental methane yield, along
with FCCD (Table 4), the
significance of the cubic model as
shown in Eq. (1) was evaluated by
ANOVA. However, the insignificant
terms were eliminated from the
model, with the exception of those
required to maintain the model
hierarchy. Consequently, the final
model obtained for methane yield of
pretreated rice straw in terms of
Ca(OH)2 concentration and

Proceeding on the 5th EnvironmentAsia International Conference
13-15 June 2019, Convention Center, The Empress Hotel, Chiang Mai, Thailand
I-47
Table 4 Coded and actual values of experimental data and corresponding
methane yield with different combinations of two independent variables for
FCCD.
Run Space type
Coded values Actual values Response methane yield
(NmL/g VS)
X1 X2 Concentration (%) Temperature (℃) Experimental Predicted
1 Factorial -1 -1 5 70 278.74 282.52
2 Factorial -1 -1 5 70 289.34 282.52
3 Factorial -1 -1 5 70 282.56 282.52
4 Axial 0 -1 10 70 291.99 296.14
5 Axial 0 -1 10 70 295.16 296.14
6 Axial 0 -1 10 70 295.69 296.14
7 Factorial 1 -1 15 70 290.54 288.08
8 Factorial 1 -1 15 70 285.68 288.08
9 Factorial 1 -1 15 70 291.40 288.08
10 Axial -1 0 5 80 296.88 300.35
11 Axial -1 0 5 80 304.92 300.35
12 Axial -1 0 5 80 293.56 300.35
13 Center 0 0 10 80 289.33 284.99
14 Center 0 0 10 80 288.27 284.99
15 Center 0 0 10 80 289.50 284.99
16 Axial 1 0 15 80 261.62 267.00
17 Axial 1 0 15 80 259.75 267.00
18 Axial 1 0 15 80 274.36 267.00
19 Factorial -1 1 5 90 303.82 303.72
20 Factorial -1 1 5 90 304.71 303.72
21 Factorial -1 1 5 90 305.79 303.72
22 Axial 0 1 10 90 279.88 294.08
23 Axial 0 1 10 90 304.02 294.08
24 Axial 0 1 10 90 292.98 294.08
25 Factorial 1 1 15 90 297.83 300.83
26 Factorial 1 1 15 90 307.22 300.83
27 Factorial 1 1 15 90 301.13 300.83

Proceeding on the 5th EnvironmentAsia International Conference
13-15 June 2019, Convention Center, The Empress Hotel, Chiang Mai, Thailand
I-48
(a) Variations of the cumulative methane yields over a period of 30 days.
(b) Cumulative methane yields over a period of 30 days.
Figure 1 Cumulative methane yield of the untreated and Ca(OH)2 pretreated
rice straws.
0
100
200
300
0 5 10 15 20 25 30Met
han
e y
ield
(N
mL
/g V
S)
Time (Day)
5%-70C 5%-80C
5%-90C 10%-70C
10%-80C 10%-90C
15%-70C 15%-80C
15%-90C Untreated
0
50
100
150
200
250
300
350
Met
han
e yie
ld (
Nm
L/g
VS
)
Rice straw
Proceeding on the 5th EnvironmentAsia International Conference
13-15 June 2019, Convention Center, The Empress Hotel, Chiang Mai, Thailand
I-49
temperature is given as follow:
Y = –1589.21 + 283.949X1 +
43.4312X2 – 6.35224X1X2 –
3.09763X12 – 0.24566X2
2 +
0.03806X12X2 + 0.03468X1X2
2 (2)
where Y represents the methane yield
(NmL/g VS), X1 and X2 represent
Ca(OH)2 concentration (% by
weight) and temperature (°C),
respectively.
The results of the ANOVA for the
developed model are tabulated in
Table 5. As noted in the Table, the
model F-value of 12.08 with a p-
value of <0.0001 (p<0.05) implies
that this model was statistically
significant at 95% confidence level,
indicating the suitability of the model
to predict the methane yield in terms
of Ca(OH)2 concentration and
temperature. The lack of fit with a p-
value of 0.10007 (p > 0.05) was not
significant, meaning that the model
exhibits fitness for the prediction.
The R2 value of 81.65% and the
adjusted R2 value of 74.89% were
quite high, suggesting the model
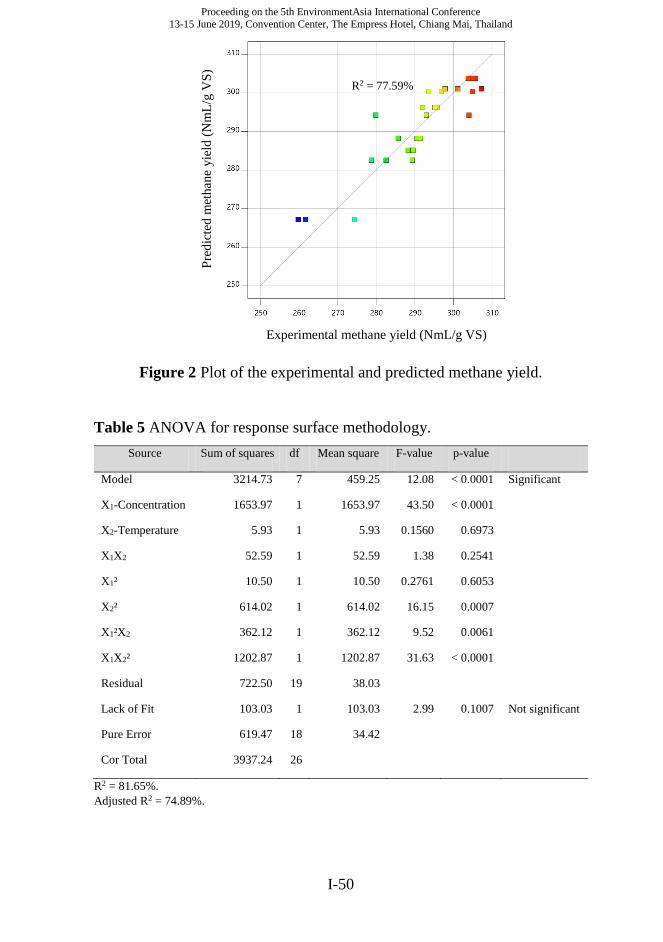
adequacy. As shown in Figure 2, the
predicted methane yield values were
found in close agreement with the
experimental methane yield results
(R2 = 77.59%), suggesting a good
relationship between the
experimental and predicted values of
the methane yield. The ANOVA
results also imply that Ca(OH)2
concentration was the most
significant factor, with an F-value of
43.50, and signifies that the other
important factors were the second-
order polynomial of temperature and
the interactive effects.
Analysis of response surfaces
A three-dimensional plot and a
contour plot, as shown in Figure 3,
were drawn to visualize the
interaction between the two
pretreatment variables (Ca(OH)2
concentration and temperature) and
the methane yield. An increase in the
temperature allowed for an increase
Proceeding on the 5th EnvironmentAsia International Conference
13-15 June 2019, Convention Center, The Empress Hotel, Chiang Mai, Thailand
I-50
Figure 2 Plot of the experimental and predicted methane yield.
Table 5 ANOVA for response surface methodology.
Source Sum of squares df Mean square F-value p-value
Model 3214.73 7 459.25 12.08 < 0.0001 Significant
X1-Concentration 1653.97 1 1653.97 43.50 < 0.0001
X2-Temperature 5.93 1 5.93 0.1560 0.6973
X1X2 52.59 1 52.59 1.38 0.2541
X1² 10.50 1 10.50 0.2761 0.6053
X2² 614.02 1 614.02 16.15 0.0007
X1²X2 362.12 1 362.12 9.52 0.0061
X1X2² 1202.87 1 1202.87 31.63 < 0.0001
Residual 722.50 19 38.03
Lack of Fit 103.03 1 103.03 2.99 0.1007 Not significant
Pure Error 619.47 18 34.42
Cor Total 3937.24 26
R2 = 81.65%.
Adjusted R2 = 74.89%.
Pre
dic
ted
met
hane
yie
ld (
Nm
L/g
VS
)
Experimental methane yield (NmL/g VS)
R2 = 77.59%

Proceeding on the 5th EnvironmentAsia International Conference
13-15 June 2019, Convention Center, The Empress Hotel, Chiang Mai, Thailand
I-51
Figure 3 Response surface plots for the interactions of Ca(OH)2
concentration and temperature on the methane yield.
(a) A three dimensional plot.
Methane yield (NmL/g VS)
Concentration (%)
Tem
per
ature
(℃
)
(b) A contour plot.

Proceeding on the 5th EnvironmentAsia International Conference
13-15 June 2019, Convention Center, The Empress Hotel, Chiang Mai, Thailand
I-52
in the methane yield, however hitting
a maximum at 87℃, and thereafter, a
slow decrease in the methane yield
was found. Increasing Ca(OH)2
concentrations above 10% may cause
a decrease in the methane yield, and
increasing the Ca(OH)2
concentrations from 5% to 10% will
increase the methane yield at a lower
temperature, however, at a higher
temperature the results are inverted.
This can be compared to the results in
Song et al. (2014), where increasing
Ca(OH)2 concentrations from 8% to
10% led to a decrease in methane
yield. Therefore, in this study the
optimum methane yield has led to a
point where the temperature is near
87℃ and where the concentration is
low.
According to the optimization
process of the developed model, the
optimum conditions for maximizing
the methane yield were found to be at
5% of Ca(OH)2 concentration and
87.34℃ of temperature, resulting in
the predicted methane yield of
304.31 Nml/g VS. Under the
optimum conditions, the methane
yield was 1.78-fold greater than the
methane yield of the untreated rice
straw (170.65 Nml/g VS).
CONCLUSIONS
This study examined the
effectiveness of Ca(OH)2 loading and
reaction temperature as the
pretreatment methods of rice straw
on methane production in an
anaerobic digestion process. From
the BMP experiment results, it was
found that the pretreated rice straws
had significantly increased in
methane yields by 55.44 – 78.59%,
compared to the untreated rice straw.
From the statistical analyses, it was
revealed that Ca(OH)2 concentration
was a more significant factor
affecting methane production than
reaction temperature. The optimum
conditions for maximizing the
methane yield were Ca(OH)2
concentration of 5% (by weight), and
temperature of 87.34℃ with
pretreatment time of 2 h in which
maximum methane yield of 304.31
NmL/g VS was obtained.

Proceeding on the 5th EnvironmentAsia International Conference
13-15 June 2019, Convention Center, The Empress Hotel, Chiang Mai, Thailand
I-53
ACKNOWLEDGMENTS
This work was partially funded by the
National Research Council of
Thailand (NRCT) under the program
of Research Scholarships for
Graduate Students 2017. We would
like to thank the Department of
Environmental Science, Faculty of
Science, Silpakorn University,
Nakhon Pathom, Thailand for
providing the laboratory facilities.
We would like to extend our gratitude
to our undergraduate students for
their contribution to some laboratory
works. Thanks are also due to the
Choheng Rice Vermicelli Factory
Company Limited, Nakhon Pathom,
Thailand for their kindness providing
the granular sludge.
REFERENCES
Angelidaki I, Alves M, Bolzonella D,
Borzacconi L, Campos JL, Guwy AJ, et
al. Defining the biomethane potential
(BMP) of solid organic wastes and
energy crops: A proposed protocol for
batch assays. Water Science and
Technology. 2009;59(5):927-34.
Athanassiadis B, Walsh LJ. Aspects of
Solvent Chemistry for Calcium
Hydroxide Medicaments. Materials.
2017;10(10):1-8.
Chen X, Zhang Y, Gu Y, Liu Z, Shen Z, Chu
H, et al. Enhancing methane production
from rice straw by extrusion
pretreatment. Applied Energy.
2014;122:34-41.
Cheng JJ. Biomass to renewable energy
process. United States of America:
CRC Press; 2010.
Department of Alternative Energy
Development and Efficiency. The
potential of biomass in Thailand 2014
[Available from:
http://biomass.dede.go.th/biomass_we
b/index.html.
Eskicioglu C, Ghorbani M. Effect of
inoculum/substrate ratio on mesophilic
anaerobic digestion of bioethanol plant
whole stillage in batch mode. Process
Biochemistry. 2011;46(8):1682-7.
Ferreira LC, Donoso-Bravo A, Nilsen PJ,
Fdz-Polanco F, Pérez-Elvira SI.
Influence of thermal pretreatment on
the biochemical methane potential of
wheat straw. Bioresource Technology.
2013;143:251-7.
Gu Y, Zhang Y, Zhou X. Effect of Ca(OH)2
pretreatment on extruded rice straw
anaerobic digestion. Bioresource
Technology. 2015;196:116-22.
Hansen TL, Schmidt JE, Angelidaki I, Marca
E, Jansen JlC, Mosbæk H, et al.
Method for determination of methane
potentials of solid organic waste.
Waste Management. 2004;24(4):393-
400.

Proceeding on the 5th EnvironmentAsia International Conference
13-15 June 2019, Convention Center, The Empress Hotel, Chiang Mai, Thailand
I-54
Kim I, Han J-I. Optimization of alkaline
pretreatment conditions for enhancing
glucose yield of rice straw by response
surface methodology. Biomass and
Bioenergy. 2012;46:210-7.
Kim JS, Lee YY, Kim TH. A review on
alkaline pretreatment technology for
bioconversion of lignocellulosic
biomass. Bioresource Technology.
2016;199:42-8.
McCarty PL. Anaerobic waste treatment
fundamentals. Public Work.
1964;95(9):107-12.
Montgomery LFR, Bochmann G.
Pretreatment of feedstock for enhanced
biogas production. United Kingdom:
IEA Bioenergy; 2014.
Song Z, Gaihe Y, Liu X, Yan Z, Yuan Y,
Liao Y. Comparison of seven chemical
pretreatments of corn straw for
improving methane yield by anaerobic
digestion. PloS one. 2014;9(4):1-8.
Song Z, Yang G, Han X, Feng Y, Ren G.
Optimization of the alkaline
pretreatment of rice straw for enhanced
methane yield. BioMed Research
International. 2013;2013:1-9.
Song Z, Yang G, Zhang T, Feng Y, Ren G,
Han X. Effect of Ca(OH)2 pretreatment
on biogas production of rice straw
fermentation. Transactions of the
Chinese Society of Agricultural
Engineering. 2012;28(19):207-13.
Taherzadeh MJ, Karimi K. Pretreatment of
lignocellulosic wastes to improve
ethanol and biogas production: A
review. International Journal of
Molecular Sciences. 2008;9(9):1621-
51.
Teghammar A, Yngvesson J, Lundin M,
Taherzadeh MJ, Horváth IS.
Pretreatment of paper tube residuals for
improved biogas production.
Bioresource Technology.
2010;101(4):1206-12.
Wellinger A, Murphy J, Baxter D. The
biogas handbook: science, production
and applications. United States of
America: Woodhead; 2013.
Zou S, Wang H, Wang X, Zhou S, Li X, Feng
Y. Application of experimental design
techniques in the optimization of the
ultrasonic pretreatment time and
enhancement of methane production in
anaerobic co-digestion. Applied
Energy. 2016;179:191-202.

Proceeding on the 5th EnvironmentAsia International Conference
13-15 June 2019, Convention Center, The Empress Hotel, Chiang Mai, Thailand
I-55
Electrospun Poly(lactic acid)/Polyvinylpyrrolidone Composite
for Biodegradable Face Mask
Pattama Madaeng1, Chariya Kaewsaneha2, Alice Sharp3,
and Pakorn Opaprakasit2*
1Sustainable Energy and Resources Engineering, Sirindhorn International
Institute of Technology (SIIT), Thammasat University, Pathum Thani,
12121, Thailand
2School of Bio-Chemical Engineering and Technology, Sirindhorn
International Institute of Technology (SIIT), Thammasat University, Pathum
Thani, 12121, Thailand
3Department of Biology, Faculty of Science, Chiang Mai University,
Chiang Mai, 50200, Thailand.
*E-mail: [email protected]
ABSTRACT
Recently, PM2.5 (particulate matter with a diameter of 2.5 microns or
less) in polluted air has become a major health hazard in Thailand,
especially in the northern region. Regular face masks are used to prevent
inhaling of hazardous particles. However, these are not able to filter out
PM2.5 because of their larger pore size. In addition, the majority of these
commercial masks are produced from petroleum-based plastics, e.g.,
polypropylene, which becomes non-degradable wastes after use. Rising
environment concerns have forced many industries to seek more
environmentally-friendly processing and safer materials alternatives.
Poly(lactic acid) (PLA), a biodegradable polyester derived from
renewable resources, e.g., corn, cassava, and sugarcane has been widely
used in various applications. Herein, biodegradable face mask based on
PLA nanofibers has been developed by an electrospinning technique. To
Proceeding on the 5th EnvironmentAsia International Conference
13-15 June 2019, Convention Center, The Empress Hotel, Chiang Mai, Thailand
I-56
further improve the mask efficiency, polyvinylpyrrolidone and
negatively-charged graphene oxide (GO) nanoparticles were introduced
to the PLA nanofibers. The obtained composite nanofibers were
characterized by scanning electron microscope (SEM), air permeability
tests, and PM2.5 trapping experiments. The results showed that the
composite nanofibers can effectively filter out 98% of PM2.5 particles,
while that of regular commercial face mask is 70%, and simultaneously
preserve a good breathability. We attribute such improvements to the
nano-scaled inter-fiber space and the presence of negative charges on the
fiber surface.
Keywords: Degradable polymer, PLA, electrospinning, dust capturing,
face mask, filter
INTRODUCTION
Recently, air pollution caused by
particular matters, especially those
with diameters of ≤ 2.5 μm (PM2.5),
has become a major health hazard in
Thailand, especially in the northern
region. In attempts to prevent
inhaling of PM2.5 in haze, people
wear regular masks. Most of these
masks are made of non-woven fabric,
or cotton which has fiber diameter of
several micrometers. However, these
have significant shortcomings of
poor PM2.5 filtration and low air
permeability (Li, 2015). Rengasamy
S et al. reported filtration efficiency
of general fabric products, e.g.,
sweatshirts, T-shirts, towels, scarves,
and cloth masks, in comparison with
commercial N95 as control media
(Rengasamy, 2010). The results on
aerosol penetration showed that N95
filter media had 0.12% penetration at
5.5 cm/s face velocity while other
fabric products: cloth mask,
sweatshirts, T-shirts, towels, scarves,
and cloth masks had 60-82 %
penetration at both 5.5 and 16.5 cm/s
face velocity. Although N95 showed
high filtration efficiency, the

Proceeding on the 5th EnvironmentAsia International Conference
13-15 June 2019, Convention Center, The Empress Hotel, Chiang Mai, Thailand
I-57
majority of this mask are produced
from petroleum-based plastics, e.g.,
polypropylene, which becomes non-
degradable wastes after use.
Rising environment concerns have
forced many industries to seek more
environmentally-friendly processing
and safer materials alternatives.
Poly(lactide) or PLA, a
biodegradable polymer obtained
from natural resources e.g., corn,
cassava, and sugarcane has been
widely used in various applications,
such as plastic bag, plastic film, food
packaging (Jamshidian, 2010), and
medical device (Noh, 2010). In
practical use, compounding PLA
with fillers, especially nano-scale
fillers, could help improving the
composite’s mechanical properties
(Xing, 2016) and provides
functionality for specific
applications. Dias et al. (Dias, 2017)
successfully prepared PLA/multi-
layer graphene oxide (MLG) via an
electrospinning technique, and the
result showed that the incorporation
of MLG leaded to a decrease in fiber
size distribution. This resulted in
enhancements of surface area to
volume ratio of the materials for
potential use as filter products.
Polyvinylpyrrolidone (PVP) is
conductive and hydrophilic polymer
that is widely used in industry,
especially in biomedical
applications, because of its low
toxicity, high biocompatibility, and
excellent solubility in almost all
organic solvents. To further optimize
its property, mixing with other
polymers have been practiced. PVP
was blended with polyacrylamide to
form a thin film, and the results
showed that increasing amount of
PVP leaded to an increase in
conductivity of the thin film (Rawat,
2014). Moreover, PVP can also form
fibers via an electrospinning process.
By using dimethylformamide (DMF)
solvent, uniform, and bead-free
electrospun PVP fibers were
obtained (Huang, 2016).
In this study, biodegradable face
masks, based on PLA nanofibers, are
developed by using an
electrospinning technique. To further
improve the mask’s efficiency, PVP
and various amounts of graphene
oxide nanoparticles were introduced.
Proceeding on the 5th EnvironmentAsia International Conference
13-15 June 2019, Convention Center, The Empress Hotel, Chiang Mai, Thailand
I-58
The obtained composite nanofibers
are then characterized by scanning
electron microscopy, transmission
electron microscope and PM2.5
filtration efficiency.
METHODOLOGY
Materials
PLA (Mw = 1.5×10⁵ g/mol, film
grade, NatureWork®), PVP (Mw =
5.8 x 10⁴ g/mol, Acros), graphite
powder (Acros), Potassium
permanganate (ACS, Carlo Erba),
N,N-dimethylformamide (DMF,
ACS, Carlo Erba), Chloroform
(CHL, ACS, Carlo Erba), Sodium
nitrate (Extrs pure, Loba Chmie),
Sulfuric acid (AR, QREC),
Hydrochloric acid (HCl, ACS, Carlo
Erba). Hydrogen Peroxide (GPO).
Deionized (DI) water was used
throughout the work.
Preparation of Graphene Oxide
Graphene oxide (GO) was
synthesized by using the Hummers’
method, as previously described
(Marcano, 2010). Briefly, graphite
powder (3.0 g) and sodium nitrate
(1.5 g) were added into sulfuric acid
(69 ml) at 0 °C. Potassium
permanganate (9.0 g) was gradually
added to maintain the reaction
temperature below 20˚C. After
stirring for 30 min, DI water (138.0
ml) was dropped into the solution
and the temperature was raised to 98
°C for 15 min. The mixture was then
cooled down using an ice bath for 10
min. Subsequently, DI water (420
mL) and 30% hydrogen peroxide (3
mL) were added. The mixture was
purified by adding HCl (5%), and
centrifuged at 4,000 rpm for 5 min,
alternating with DI water for twice.
Finally, the mixture was dried at 60
ºC in a vacuum oven for two weeks.
The obtained GO (3.0 g) was
dissolved in DMF (150.0 ml) before
passing through Microfluidizer (M-
110P Microfluidizer®) at 30,000
PSI, 20 °C to reduce the particle size
for 20 cycles. The particle size and
zeta potential of GO were determined
by using a Zetasizer (Zetasizer Ver.
7.11 Malvern Instruments Ltd.).
Preparation of nanofibers by
electrospinning process
PLA and PVP (5:1) were dissolved
in a mixture of CHL and DMF (7:1)
Proceeding on the 5th EnvironmentAsia International Conference
13-15 June 2019, Convention Center, The Empress Hotel, Chiang Mai, Thailand
I-59
to obtain polymer solution having
concentration of 10 %w/v. Briefly,
PLA was dissolved in CHL until
homogeneous then PVP was added
and the mixture was stirred at room
temperature for overnight. After that,
DMF was added, with further stirring
for 4 hours. GO dispersed in DMF
with a concentration of 2 %w/v was
added into the PLA/PVP solution
and stirred at room temperature for
overnight.
The electrospinning system consists
of a high voltage supply (Gamma
High Voltage Research, 0–40 kV,
Cleveland, Ohio), an aluminum foil
collector and a feed system
consisting of a syringe pump
(KDS100, KD Scientific, Holliston,
MA, USA) and a needle injector. A
feeding rate of the polymer mixture
was 1 ml/h. The needle tip to
collector distance was kept at 20 cm,
and the applied voltage was 15 kV.
The total amount of polymer solution
used was 2 ml per mat.
Characterization of nanofibers
Scanning electron microscopy
(SEM, JEOL, JSM-7800F) and
transmission electron microscopy
(TEM, JEOL, JEM 2100 Plus) were
used to determine morphology of the
nanofibers. For TEM sample
preparation, the sample was
dispersed in ethanol and a few drops
of fibers dispersion solution was
dropped on grid and dried at room
temperature overnight before
characterization.
Filtration Efficiency Tests
The filtration efficiency tests were
conducted on fiber mats of neat PLA
and the composite material, using
commercial non-woven face mask as
a supporting layer. The experiments
were conducted at 60% relative
humidity, 1 atm, and at 30˚C. An
atomizer aerosol generator (model
3076, TSI company) was employed
to generate monodisperse aerosol in
a range of 0.01 – 1.00 μm, and flow
through the sample which was held
by a filter holder, with a flow rate of
0.6 L/min for 1 hour. A condensation
particle counter (model of CPC 3788,
TSI company) was employed to
measure concentrations of particles
(diameter between 2.5 nm – 3.0 μm).

Proceeding on the 5th EnvironmentAsia International Conference
13-15 June 2019, Convention Center, The Empress Hotel, Chiang Mai, Thailand
I-60
The filtration efficiency (ɳ) was
calculated from the equation below;
ɳ =𝑐𝑖𝑛𝑙𝑒𝑡 − 𝑐𝑜𝑢𝑡𝑙𝑒𝑡
𝑐𝑖𝑛𝑙𝑒𝑡
Where cinlet is a concentration of
particles before the filter. coutlet is
concentration of particle after
filtration by the sample.
RESULTS AND DISCUSSION
GO nanoparticles
To effectively incorporate GO
particles into the nano-fibers, particle
size, size distribution and surface
charge of the particles must be
optimized. The particles size and size
distribution of GO after size
reduction was determined and data is
shown in Figure 1
The initial size of GO before size
reduction operation was around 13
μm in diameter. After the size
reduction by using a microfluidizer
for 20 passes, the size of GO was
reduced to 450 nm in diameter, with
monodispersion in DMF solution.
Figure 1 Particle size and size distribution of GO particles after size
reduction

Proceeding on the 5th EnvironmentAsia International Conference
13-15 June 2019, Convention Center, The Empress Hotel, Chiang Mai, Thailand
I-61
Moreover, the GO nanoparticles
showed a zeta potential value of -25.1
mV, due to the residual oxygen
groups on the particle’s surface
(Shao, 2014).
PLA nanofibers
Morphology
Appearance of the fiber mat products
and morphology of the fibers are
examined. The thickness of the
nanofiber mats was ranging from 10
- 40 µm, measured by a Mitutoyo
2046S Dial Indicator Gage. All fiber
mats are white in color, including
those containing GO, which is black
in nature. To confirm the presence of
GO in the composite nanofibers,
TEM was employed in morphology
examination.
Figure 2 TEM image of PLA/PVP/GO nanofiber filaments
A TEM picture, as shown in Figure
3, clearly depicts the presence of GO
as black particles, with sizes of ~ 200
nm, randomly embedded on the
interface of the filaments. It is noted
that during the sample preparation for
TEM measurement, the fiber mat was
dispersed in ethanol for a few hours
to separate each filaments. The
results indicated that the GO
nanoparticles were strongly attached
on the fiber surface by physical
interaction.
Proceeding on the 5th EnvironmentAsia International Conference
13-15 June 2019, Convention Center, The Empress Hotel, Chiang Mai, Thailand
I-62
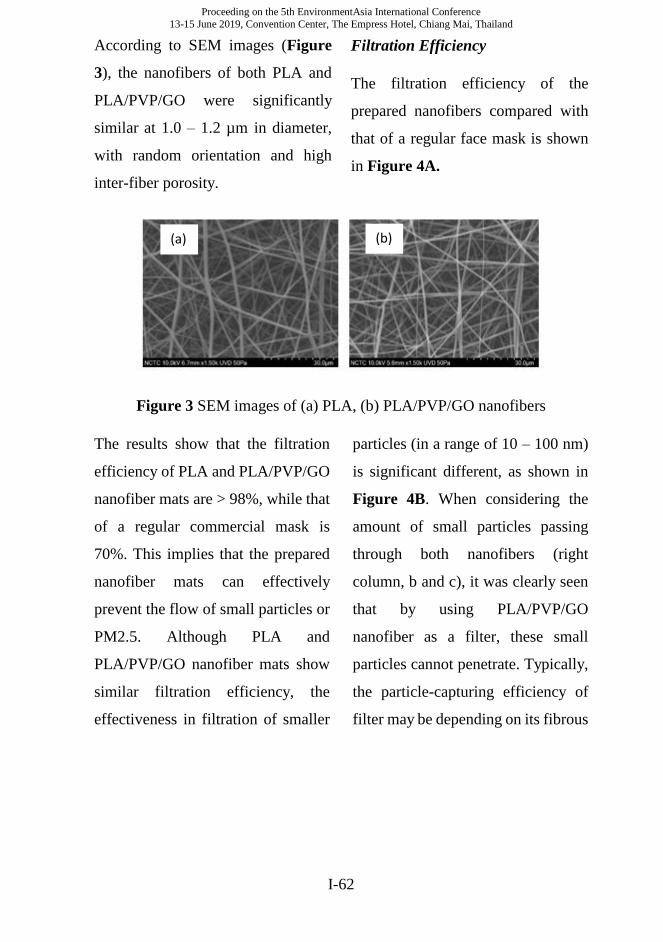
According to SEM images (Figure
3), the nanofibers of both PLA and
PLA/PVP/GO were significantly
similar at 1.0 – 1.2 µm in diameter,
with random orientation and high
inter-fiber porosity.
Filtration Efficiency
The filtration efficiency of the
prepared nanofibers compared with
that of a regular face mask is shown
in Figure 4A.
Figure 3 SEM images of (a) PLA, (b) PLA/PVP/GO nanofibers
The results show that the filtration
efficiency of PLA and PLA/PVP/GO
nanofiber mats are > 98%, while that
of a regular commercial mask is
70%. This implies that the prepared
nanofiber mats can effectively
prevent the flow of small particles or
PM2.5. Although PLA and
PLA/PVP/GO nanofiber mats show
similar filtration efficiency, the
effectiveness in filtration of smaller
particles (in a range of 10 – 100 nm)
is significant different, as shown in
Figure 4B. When considering the
amount of small particles passing
through both nanofibers (right
column, b and c), it was clearly seen
that by using PLA/PVP/GO
nanofiber as a filter, these small
particles cannot penetrate. Typically,
the particle-capturing efficiency of
filter may be depending on its fibrous
(a) (b)

Proceeding on the 5th EnvironmentAsia International Conference
13-15 June 2019, Convention Center, The Empress Hotel, Chiang Mai, Thailand
I-63
Figure 4 (A) filtration efficiency and (B) particle size distribution of generated
particles before (left) and after passing through the filter products (right) of:
(a) regular face mask, (b) PLA fiber mat and (c) PLA/PVP/GO nanofiber mat
(A)
(B)
(a)
(b)
(c)
Proceeding on the 5th EnvironmentAsia International Conference
13-15 June 2019, Convention Center, The Empress Hotel, Chiang Mai, Thailand
I-64
structure, void size between fibers,
and size of fibers, in which particles
or dust with bigger size may stick on
the fibers or being trapped in inter-
fiber voids. However, the presence of
negatively-charged GO particles on
the composite fiber’s surface may
enhance attraction interaction with
dust particle, leading to higher
trapping efficiency, especially for
particles with smaller sizes. It was
reported that filtration efficiency of
masks which use only physical
mechanism revealed higher
percentage of aerosol penetration
than the masks containing both
physical and electrical mechanisms
(Brown, 1995).
CONCLUSIONS
Nanofibers derived from degradable
PLA with uniform fibers and high
porosity are successfully prepared
by an electrospinning technique.
The PLA nanofibers can effectively
filter out PM2.5 particles, with 98%
efficiency, compared to that of
regular commercial face mask of
70%. Although, the filtration
efficiency of PM2.5 for both
nanofiber mat samples are almost
similar, the presence of proper PVP
and negatively-charged GO
contents on PLA provides improved
filtration efficiency toward smaller
dust particles, in the range of 10 –
100 nm. SEM images show high
porosity of composited PLA
nanofibers, implying that the
nanofibers would simultaneously
preserve a good breathability.
Although it is well-known that PLA
is biodegradable polymer,
experiments on durability and
degradability tests of the face masks
after use are undergoing.
ACKNOWLEDGEMENTS
Financial supports from the National
Research Council of Thailand
(NRCT) through a Research
University Network (RUN), Center
of Excellence in Materials and
Plasma Technology (CoE M@P
Tech), and Center of Scientific
Equipment for Advanced Research,
Thammasat University, are
gratefully acknowledged. P.M.
Proceeding on the 5th EnvironmentAsia International Conference
13-15 June 2019, Convention Center, The Empress Hotel, Chiang Mai, Thailand
I-65
thanks support from the TAIST-
Tokyo Tech scholarship program and
SIIT.
REFERENCES
Brown RC. Protection Against Dust by
Respirators. International journal of
Occupational safety and ergonomics
1995; 1(1): 14-28.
Chen BK, Shen CH, Chen SC and Chen AF.
Ductile PLA modified with
methacryloyloxyalkylisocyanate
improves mechanical properties.
Polymer 2010; 51(21): 4667-4672.
Dias ML, Dip RMM, Souza DHS,
Nascimento JP, Santos AP
and Furtado CA. Electrospun
Nanofibers of Poly(lactic
acid)/Graphene Nanocomposites.
Journal of Nanoscience and
Nanotechnology 2017; 17(4):
2531- 2540.
Huang S, Zhou L, Li MC, Wu Q, Kojima Y
and Zhou D. Preparation and
Properties of Electrospun Poly
(Vinyl Pyrrolidone)/Cellulose
Nanocrystal/Silver Nanoparticle
Composite Fibers. Materials 2016;
9(7): 523.
Jamshidian M, Tehrany EA, Imran M,
Jacquot M and Desobry S. Poly-
Lactic Acid: Production,
Applications, Nanocomposites, and
Release Studies 2010.
Comprehensive Reviews in Food
Science and Food Safety; 9(5): 552-
571.
Li X, Gong Y. Design of Polymeric
Nanofiber Gauze Mask to Prevent
Inhaling PM2.5 Particles from
Haze Pollution. Journal of
Chemistry 2015; 2015: 5.
Marcano DC, Kosynkin DV, Berlin JM,
Sinitskii A, Sun Z, Slesarev A,
Alemany LB, Lu W and Tour JM.
Improved Synthesis of Graphene
Oxide. ACS Nano 2010; 4 (8): 4806–
4814.
Noh KT, Lee HY, Shin US and Kim HW.
Composite nanofiber of bioactive
glass nanofiller incorporated
poly(lactic acid) for bone
regeneration. Materials Letters 2010;
64(7): 802-805.
Rawat A, Mahavar HK, Tanwar A and Singh
PJ. Study of electrical properties of
polyvinylpyrrolidone/polyacrylamid
e blend thin films. Bulletin of
Materials Science 2014; 37(2): 273-
279.
Rengasamy S, Eimer B and Shaffer RE.
Simple Respiratory Protection-
Evaluation of the Filtration
Performance of Cloth Masks
and Common Fabric Materials
Against 20–1000 nm Size Particles.
Proceeding on the 5th EnvironmentAsia International Conference
13-15 June 2019, Convention Center, The Empress Hotel, Chiang Mai, Thailand
I-66
Ann Occup Hyg 2010; 54(7): 789-
798.
Shao JJ, Lv W and Yang QH. Self‐
Assembly of Graphene Oxide at
Interfaces. Advanced
Materials 2014; 26: 5586 - 5612.
Sun B, Duan B and Yuan X. Preparation of
Core/Shell PVP/PLA Ultrafine
Fibers by Coaxial
Electrospinning. Journal of
Applied Polymer Science 2006;
102(1): 39-45.
Xing YF, Xu YH, Shi MH and Lian YX. The
impact of PM2.5 on the human
respiratory system. Journal of
Thoracic Disease 2016; 8(1): 69-74.

Proceeding on the 5th EnvironmentAsia International Conference
13-15 June 2019, Convention Center, The Empress Hotel, Chiang Mai, Thailand
I-67
Optimization of microwave-assisted extraction for enhancing
reducing sugar of water hyacinth pretreatment at Klong
Yong community in Phutthamonthon, Nakhon Pathom,
Thailand
Hendri Rantau Silalahi1, Nuttawan Yoswathana2*
1*Department of Chemical Engineering, Faculty of Engineering,
Mahidol University
2Department of Chemical Engineering, Faculty of Engineering,
Mahidol University
Corresponding author: e-mail: [email protected]
ABSTRACT
Water hyacinth is an aquatic plant that has emerged as a major invasive weed
and high reproduction rate at Soi Bon canal in Klong Yong, Phutthamonthon,
Thailand. As a lignocellulosic plant material, it can be made into an organic
fertilizer at 60-90 days. Microwave-assisted extraction technique was
investigated to optimize hydrolysis of cellulose and hemicellulose and disrupt
lignin structure using Calcium hydroxide solution, Sodium bicarbonate
solution and Distilled water and also various size of raw material (0.1-0.5 cm
and 3-5 cm). The result showed that calcium hydroxide solution was the best
solvent for total reducing sugar extraction from water hyacinth with size of 3-
5 cm. Box-Behnken design was conducted for microwave-assisted
pretreatment at 450 watts using three parameters; the solid to liquid ratios as
1:10, 1:15, and 1:20 with volume of liquid at 30 ml, extraction times of 20,
30, and 40 minutes, and calcium hydroxide solution at various concentrations
as 0.1, 0.55, and 1 %wt. The optimum conditions of total reducing sugar from
water hyacinth solution were 54 mg/g at the solid to liquid ratio as 1:10,
concentration of calcium hydroxide at 0.55 %wt, 30 minutes of extraction

Proceeding on the 5th EnvironmentAsia International Conference
13-15 June 2019, Convention Center, The Empress Hotel, Chiang Mai, Thailand
I-68
time, and %brix was 5.74. Microwave-assisted pretreatment using calcium
hydroxide solution was an alternative to hydrolyze cellulose and
hemicellulose and disrupt lignin structure.
Keywords: Water hyacinth, Total reducing sugar, Lignocellulosic,
Microwave-assisted extraction, Box-Behnken.
INTRODUCTION
The water hyacinth (Eichhornia
crassipes) is an aquatic plant that
originated from South America
(Keawmanee, 2015) (Bolenz et al,
1990). Water hyacinth lives in
tropical and sub-tropical regions such
as in Indonesia and Thailand. In
Thailand, water hyacinth can be
found such as in lakes, dams, and
rivers. Water hyacinth is known for
their rapid growth rates, extensive
dispersal capabilities, large and rapid
reproductive output and broad
environmental tolerance (Bolenz et
al, 1990). These makes water
hyacinth become water pollution that
cause major problem in the area, such
as block water flow in the river,
reduce oxygen content in the water
thus reducing of fishes in the water,
increase sedimentation, and also
provoke health problem (Bolenz et
al, 1990) (Lee B, 1979) (Carina et al,
2007). Current solution, especially in
Thailand, for this problem is dispose
water hyacinth manually someplace
else. This solution is temporary
solution and requires high cost.
Despite of disadvantages, as one of
the biomass material, water hyacinth
has many advantages. Water
hyacinth can be made into organic
fertilizer (Polprasert et al, 1994),
craft (Keawmanee, 2015), bio
adsorbent (Kasem et al, 2012),
bioethanol (Yang et al, 2016), animal
feed (Abdel et al, 1991), and biogas
(Chanakya et al, 1993) also can be
produced from water hyacinth. Those
benefits of water hyacinth can have
good impacts to the community. For
example, water hyacinth craft can be
done by local community and can
increase their income. But this has
limitation due to only small amount
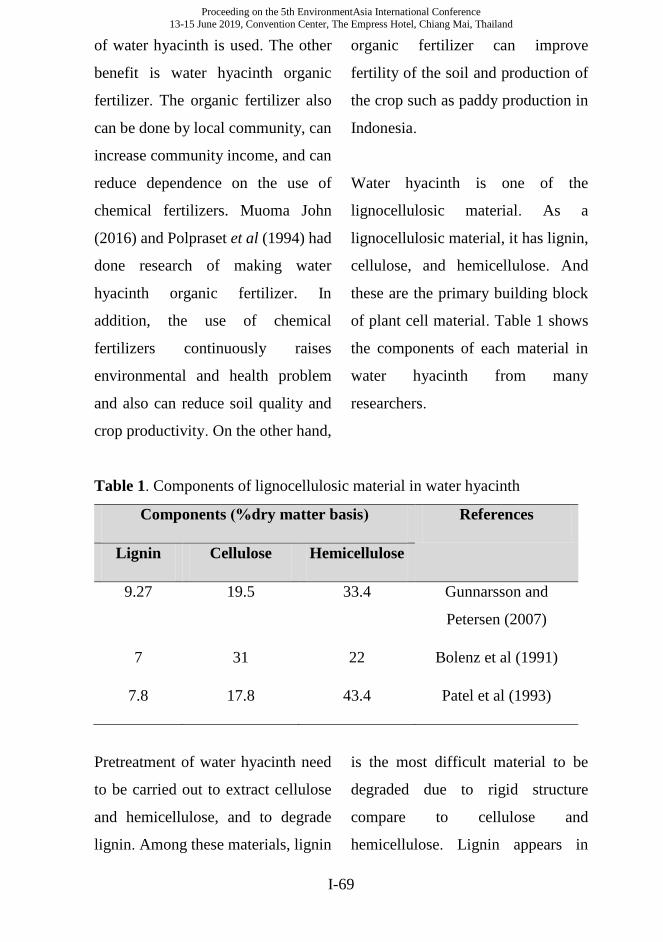
Proceeding on the 5th EnvironmentAsia International Conference
13-15 June 2019, Convention Center, The Empress Hotel, Chiang Mai, Thailand
I-69
of water hyacinth is used. The other
benefit is water hyacinth organic
fertilizer. The organic fertilizer also
can be done by local community, can
increase community income, and can
reduce dependence on the use of
chemical fertilizers. Muoma John
(2016) and Polpraset et al (1994) had
done research of making water
hyacinth organic fertilizer. In
addition, the use of chemical
fertilizers continuously raises
environmental and health problem
and also can reduce soil quality and
crop productivity. On the other hand,
organic fertilizer can improve
fertility of the soil and production of
the crop such as paddy production in
Indonesia.
Water hyacinth is one of the
lignocellulosic material. As a
lignocellulosic material, it has lignin,
cellulose, and hemicellulose. And
these are the primary building block
of plant cell material. Table 1 shows
the components of each material in
water hyacinth from many
researchers.
Table 1. Components of lignocellulosic material in water hyacinth
Components (%dry matter basis) References
Lignin Cellulose Hemicellulose
9.27 19.5 33.4 Gunnarsson and
Petersen (2007)
7 31 22 Bolenz et al (1991)
7.8 17.8 43.4 Patel et al (1993)
Pretreatment of water hyacinth need
to be carried out to extract cellulose
and hemicellulose, and to degrade
lignin. Among these materials, lignin
is the most difficult material to be
degraded due to rigid structure
compare to cellulose and
hemicellulose. Lignin appears in
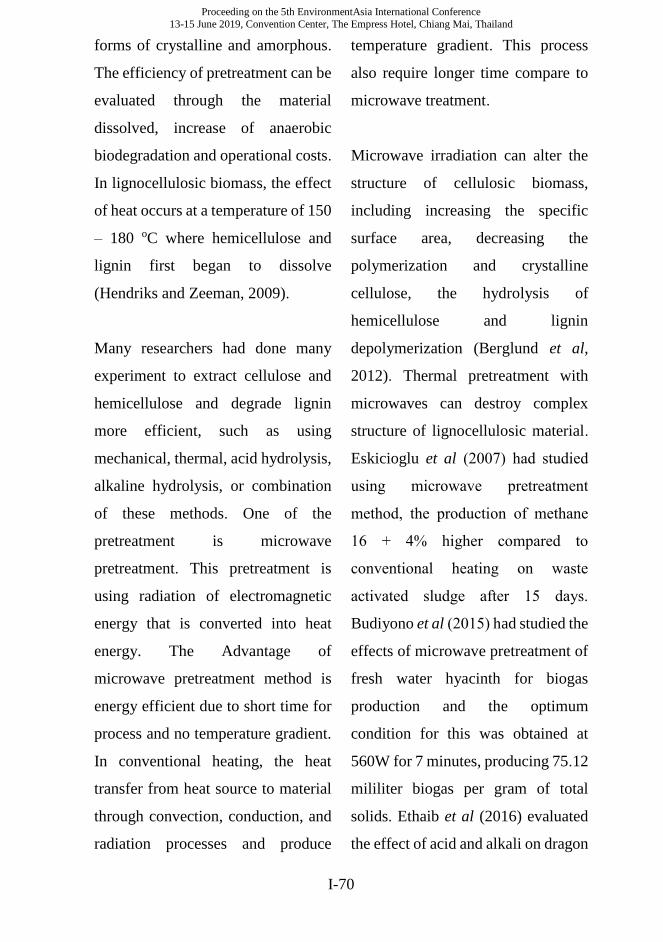
Proceeding on the 5th EnvironmentAsia International Conference
13-15 June 2019, Convention Center, The Empress Hotel, Chiang Mai, Thailand
I-70
forms of crystalline and amorphous.
The efficiency of pretreatment can be
evaluated through the material
dissolved, increase of anaerobic
biodegradation and operational costs.
In lignocellulosic biomass, the effect
of heat occurs at a temperature of 150
– 180 oC where hemicellulose and
lignin first began to dissolve
(Hendriks and Zeeman, 2009).
Many researchers had done many
experiment to extract cellulose and
hemicellulose and degrade lignin
more efficient, such as using
mechanical, thermal, acid hydrolysis,
alkaline hydrolysis, or combination
of these methods. One of the
pretreatment is microwave
pretreatment. This pretreatment is
using radiation of electromagnetic
energy that is converted into heat
energy. The Advantage of
microwave pretreatment method is
energy efficient due to short time for
process and no temperature gradient.
In conventional heating, the heat
transfer from heat source to material
through convection, conduction, and
radiation processes and produce
temperature gradient. This process
also require longer time compare to
microwave treatment.
Microwave irradiation can alter the
structure of cellulosic biomass,
including increasing the specific
surface area, decreasing the
polymerization and crystalline
cellulose, the hydrolysis of
hemicellulose and lignin
depolymerization (Berglund et al,
2012). Thermal pretreatment with
microwaves can destroy complex
structure of lignocellulosic material.
Eskicioglu et al (2007) had studied
using microwave pretreatment
method, the production of methane
16 + 4% higher compared to
conventional heating on waste
activated sludge after 15 days.
Budiyono et al (2015) had studied the
effects of microwave pretreatment of
fresh water hyacinth for biogas
production and the optimum
condition for this was obtained at
560W for 7 minutes, producing 75.12
mililiter biogas per gram of total
solids. Ethaib et al (2016) evaluated
the effect of acid and alkali on dragon

Proceeding on the 5th EnvironmentAsia International Conference
13-15 June 2019, Convention Center, The Empress Hotel, Chiang Mai, Thailand
I-71
fruit foliage using microwave at
power 800 W for 5 minutes using
microwave pretreatment and 0.1 N
NaOH which gave highest result of
monomeric sugar at 15.56 mg/g.
Therefore, microwave pretreatment
can be used as an approach over
conventional heating for
pretreatment of biomass in biogas
production. Optimization of
bioethanol production using water
hyacinth had been studied by Zhang
et al (2016) using microwave
pretreatment at power 150 W, H2SO4
concentration at 1 wt% for 20
minutes treatment time and the
optimum bioethanol production was
1.291 g/L. Zhu et al (2006) reported
that microwave pretreatment on rice
straw was an effective pretreatment
method for increasing the rate of
hydrolysis.
For optimization of the process, Box-
Behnken design method was being
used for this experiment. Yang et al
(2006) had studied the optimization
using Box-Behnken design for
maximizing biofuel content of water
hyacinth using microwave
pretreatment method at power 1110
W and 3.5 minutes treatment time.
The experimental are microwave
power, amount of absorbent, and
treatment time.
Previous researchers have studied
production of water hyacinth organic
fertilizer using subcritical pre-
treatment and without pretreatment
and the result was the fertilizer can be
produced in 10 days (subcritical
method) and 30 days–58 days
(conventional method). Also,
previous researchers had studied the
effect of microwave pretreatment on
lignocellulosic biomass using strong
base (NaOH) and strong acid
(H2SO4). However, there is no
researcher investigating the influence
of the microwave pretreatment
method on water hyacinth for organic
fertilizer production using calcium
hydroxide solution. The objective of
this research was to study the effect
of microwave pretreatment at various
microwave levels of power, various
solvents concentration and times on
improving the digestion of water
hyacinth.

Proceeding on the 5th EnvironmentAsia International Conference
13-15 June 2019, Convention Center, The Empress Hotel, Chiang Mai, Thailand
I-72
METHODOLOGY
Material
The water hyacinth was collected
from Klong Yong district in Nakhon
Pathom Province, Thailand. The
water hyacinth was then sun dried for
14 days and cut 3-5 cm long.
Microwave-assisted pretreatment
Microwave-assisted pretreatment
were performed using Microwave
digestion system (Anton Paar
Multiwave PRO). The pretreatment
was conducted using microwave
power 450 W, various type of
solvents (Distilled water, Sodium
bicarbonate, and Calcium
hydroxide), different size of raw
material (size 3-5 cm long and size
0.1-0.5 cm long), various treatment
time (5, 10, 20, 30 minutes), at solid
to solvent ratio 1:10, and at 1.2%wt
solvent concentration. After cooling,
the content was filtered using filter
paper and %Brix of the filtrate was
measured using digital refractometer.
The filtrate contain of sugar solution
due to of the hydrolysis of cellulose
and hemicellulose produce sugar
(Joseph and Ronald, 2010).
Box-Behnken Design
The Box-Behnken design method
used for optimization. Factors and
levels for Box-Behnken design was:
Table 2 Variables and codes for Box-Behnken Design
Variables
Codes
Ranges and level
-1 0 1
Ratio x1 1:10 1:15 1:20
Concentration x2 0.1 %wt 0.55 %wt 1 %wt
Time x3 20 min 30 min 40 min
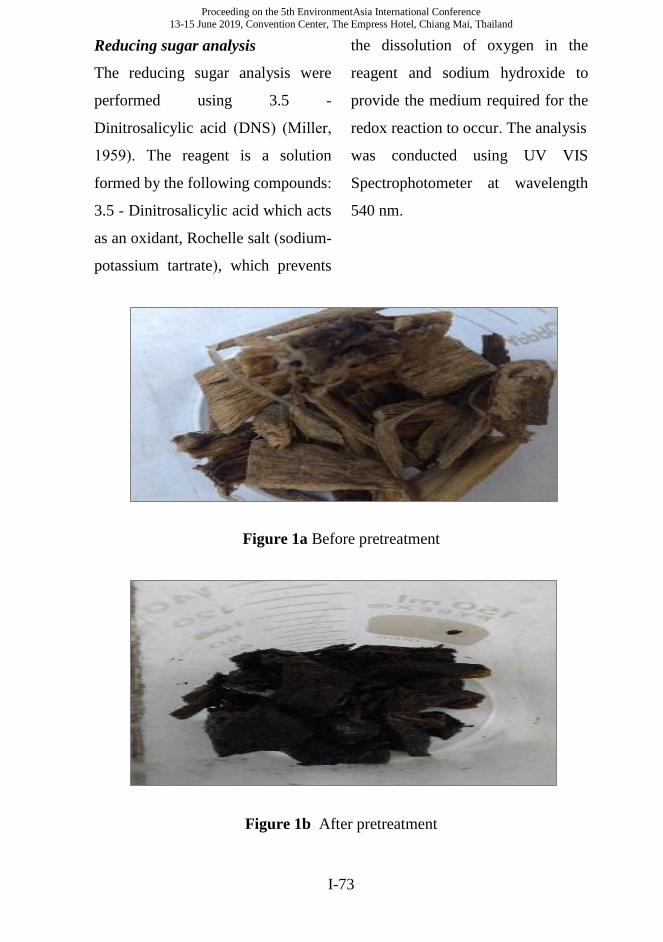
Proceeding on the 5th EnvironmentAsia International Conference
13-15 June 2019, Convention Center, The Empress Hotel, Chiang Mai, Thailand
I-73
Reducing sugar analysis
The reducing sugar analysis were
performed using 3.5 -
Dinitrosalicylic acid (DNS) (Miller,
1959). The reagent is a solution
formed by the following compounds:
3.5 - Dinitrosalicylic acid which acts
as an oxidant, Rochelle salt (sodium-
potassium tartrate), which prevents
the dissolution of oxygen in the
reagent and sodium hydroxide to
provide the medium required for the
redox reaction to occur. The analysis
was conducted using UV VIS
Spectrophotometer at wavelength
540 nm.
Figure 1a Before pretreatment
Figure 1b After pretreatment
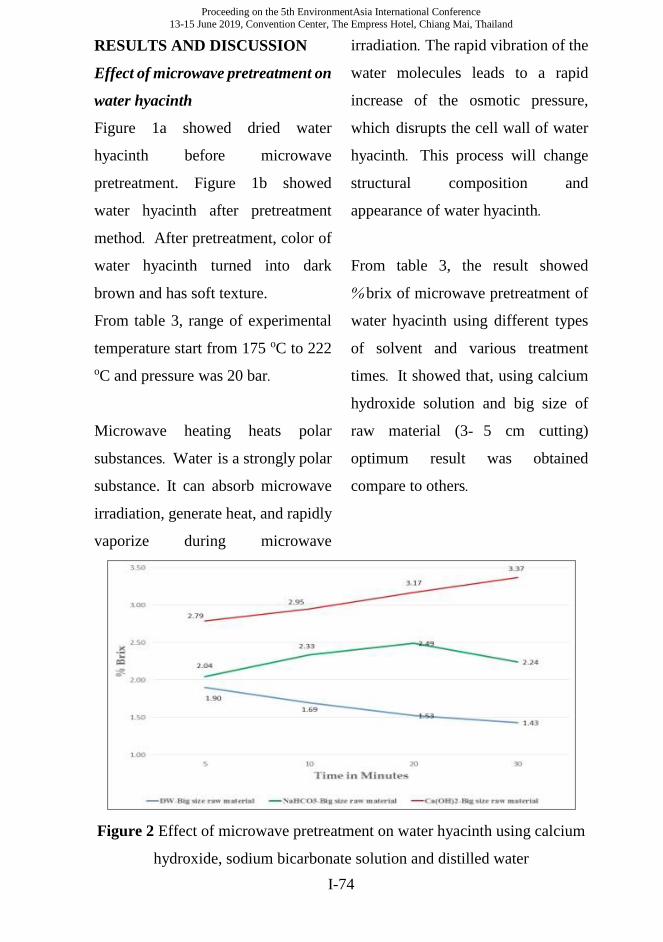
Proceeding on the 5th EnvironmentAsia International Conference
13-15 June 2019, Convention Center, The Empress Hotel, Chiang Mai, Thailand
I-74
RESULTS AND DISCUSSION
Effect of microwave pretreatment on
water hyacinth
Figure 1a showed dried water
hyacinth before microwave
pretreatment. Figure 1b showed
water hyacinth after pretreatment
method. After pretreatment, color of
water hyacinth turned into dark
brown and has soft texture.
From table 3, range of experimental
temperature start from 175 oC to 222
oC and pressure was 20 bar.
Microwave heating heats polar
substances. Water is a strongly polar
substance. It can absorb microwave
irradiation, generate heat, and rapidly
vaporize during microwave
irradiation. The rapid vibration of the
water molecules leads to a rapid
increase of the osmotic pressure,
which disrupts the cell wall of water
hyacinth. This process will change
structural composition and
appearance of water hyacinth.
From table 3, the result showed
% brix of microwave pretreatment of
water hyacinth using different types
of solvent and various treatment
times. It showed that, using calcium
hydroxide solution and big size of
raw material (3- 5 cm cutting)
optimum result was obtained
compare to others.
Figure 2 Effect of microwave pretreatment on water hyacinth using calcium
hydroxide, sodium bicarbonate solution and distilled water

Proceeding on the 5th EnvironmentAsia International Conference
13-15 June 2019, Convention Center, The Empress Hotel, Chiang Mai, Thailand
I-75
From figure 2, for big size raw
material, when using calcium
hydroxide (red line) , the result
increase from 5 minutes treatment
time to 30 minutes treatment time.
When using sodium bicarbonate
(green line), the figure showed that
result increase from 5 minutes
treatment time to 20 minutes
treatment time, then decrease when
treatment time at 30 minutes. When
using distilled water (blue line), the
result decrease from 5 minutes
treatment time to 30 minutes
treatment time.
From this result, using calcium
hydroxide gave the optimum result
compare to other solvents (distilled
water and sodium bicarbonate). And
using big size raw material (3- 5 cm
cutting) also gave optimum result
compare to small size raw material
(0.1-0.5 cm).
Box-Behnken Design
From table 3 below, experimental
value obtained of % brix for Box-
Behnken design range from 1. 8- 5. 4
%brix.
By using Microsoft Excel® 2013,
regression analysis model as shown
in Eq.1 below
Y= 5. 27- 1. 11X1+ 0. 11X2- 0. 13X3-
0. 76X12- 1. 66X2
2- 1. 88X32-
0.25X1.X2+0.48X1.X3–0.08X2.X3
Where Y is Experimental yield, X1 is
solid to solvent ratio, X2 is
concentration of calcium hydroxide
solution. And X3 is experimental
time. From regression analysis, value
of Multiple R is 0. 987 found to be
statistically significant when
performing a hyphothesis testing
with significance level of 5%. The
value of R square (R2) is 0. 975
indicates that 97.50% of variation in
%brix (y) can be explained by
variation of concentration of
solution, solid to solvent ratio, and
experimental time.
The 3D- response surface graphs
showed the interaction effect of
variables (concentration of solution,
solid to solvent ratio, and
experimental time) on % brix were
plotted and shown in figures 3-5.

Proceeding on the 5th EnvironmentAsia International Conference
13-15 June 2019, Convention Center, The Empress Hotel, Chiang Mai, Thailand
I-76
Table 3 Box-Behnken design of microwave-assisted extraction
No x1 = Solid
to solvent
ratio
x2 =
Concentration
x3 =
Time
Y =
Yield
(%Brix)
Temp
(oC)
1 -1(1:10) -1(0.1%wt) 0(30) 3.4 196
2 1(1:20) -1(0.1%wt) 0(30) 1.9 184
3 -1(1:10) 1(1%wt) 0(30) 4.3 200
4 1(1:20) 1(1%wt) 0(30) 1.8 198
5 -1(1:10) 0(0.55%wt) -1(20) 5.4 196
6 1(1:20) 0(0.55%wt) -1(20) 2 175
7 -1(1:10) 0(0.55%wt) 1(40) 3.7 222
8 1 (1:20) 0(0.55%wt) 1(40) 2.2 211
9 0 (1:15) -1(0.1%wt) -1(20) 2.2 184
10 0 (1:15) 1(1%wt) -1(20) 2.4 187
11 0 (1:15) -1(0.1%wt) 1(40) 2.6 209
12 0 (1:15) 1(1%wt) 1(40) 2.5 212
13 0 (1:15) 0(0.55%wt) 0 (30) 5.2 209
14 0 (1:15) 0(0.55%wt) 0 (30) 5.3 210
15 0 (1:15) 0(0.55%wt) 0 (30) 5.3 209

Proceeding on the 5th EnvironmentAsia International Conference
13-15 June 2019, Convention Center, The Empress Hotel, Chiang Mai, Thailand
I-77
Figure 3 The 3D-graph showing the effect of concentration of solvent and
solid to solvent ratio on %brix at 30 minutes treatment time.
Figure 4 The 3D-graph showing the effect of concentration of solvent and
treatment time on %brix at 1:15 solid to solvent ratio.
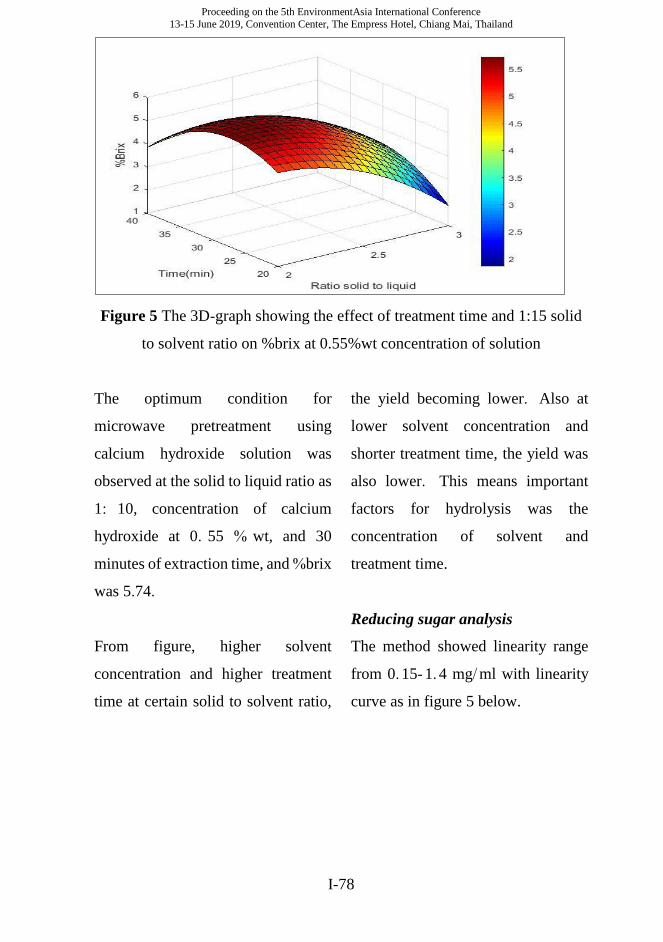
Proceeding on the 5th EnvironmentAsia International Conference
13-15 June 2019, Convention Center, The Empress Hotel, Chiang Mai, Thailand
I-78
Figure 5 The 3D-graph showing the effect of treatment time and 1:15 solid
to solvent ratio on %brix at 0.55%wt concentration of solution
The optimum condition for
microwave pretreatment using
calcium hydroxide solution was
observed at the solid to liquid ratio as
1: 10, concentration of calcium
hydroxide at 0. 55 % wt, and 30
minutes of extraction time, and %brix
was 5.74.
From figure, higher solvent
concentration and higher treatment
time at certain solid to solvent ratio,
the yield becoming lower. Also at
lower solvent concentration and
shorter treatment time, the yield was
also lower. This means important
factors for hydrolysis was the
concentration of solvent and
treatment time.
Reducing sugar analysis
The method showed linearity range
from 0. 15- 1. 4 mg/ ml with linearity
curve as in figure 5 below.
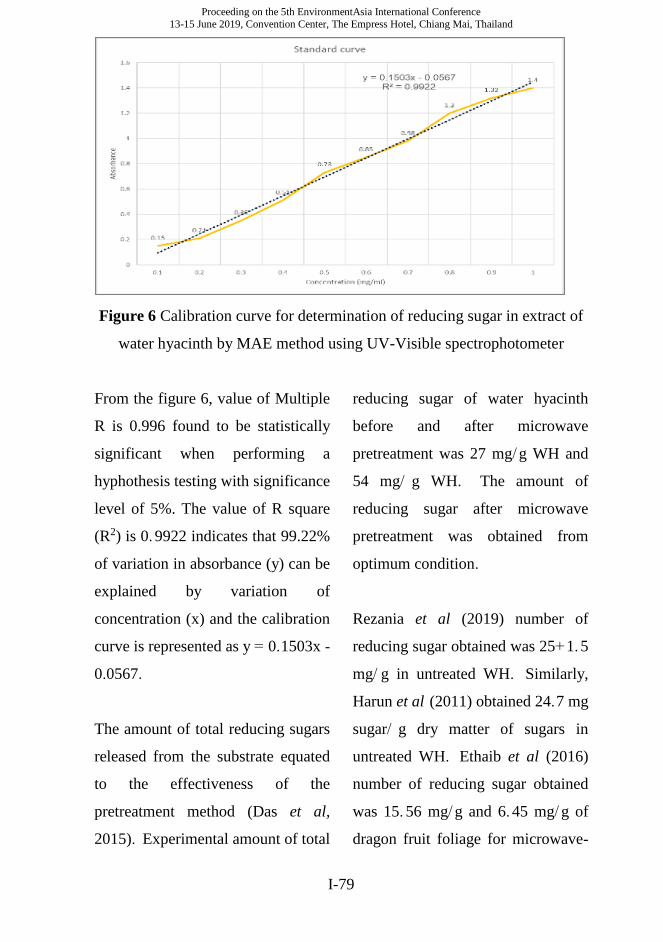
Proceeding on the 5th EnvironmentAsia International Conference
13-15 June 2019, Convention Center, The Empress Hotel, Chiang Mai, Thailand
I-79
Figure 6 Calibration curve for determination of reducing sugar in extract of
water hyacinth by MAE method using UV-Visible spectrophotometer
From the figure 6, value of Multiple
R is 0.996 found to be statistically
significant when performing a
hyphothesis testing with significance
level of 5%. The value of R square
(R2) is 0. 9922 indicates that 99.22%
of variation in absorbance (y) can be
explained by variation of
concentration (x) and the calibration
curve is represented as y = 0.1503x -
0.0567.
The amount of total reducing sugars
released from the substrate equated
to the effectiveness of the
pretreatment method (Das et al,
2015). Experimental amount of total
reducing sugar of water hyacinth
before and after microwave
pretreatment was 27 mg/ g WH and
54 mg/ g WH. The amount of
reducing sugar after microwave
pretreatment was obtained from
optimum condition.
Rezania et al (2019) number of
reducing sugar obtained was 25+ 1. 5
mg/ g in untreated WH. Similarly,
Harun et al (2011) obtained 24.7 mg
sugar/ g dry matter of sugars in
untreated WH. Ethaib et al (2016)
number of reducing sugar obtained
was 15. 56 mg/ g and 6. 45 mg/ g of
dragon fruit foliage for microwave-
Proceeding on the 5th EnvironmentAsia International Conference
13-15 June 2019, Convention Center, The Empress Hotel, Chiang Mai, Thailand
I-80
pretreatment method using sodium
hydroxide and sodium bicarbonate
solution. Jongmeesuk et al (2014)
obtained reducing sugar from water
hyacinth 2. 35 + 0. 34 g/ L using
sodium hydroxide solution. Rezania
et al (2019) obtained reducing sugar
from water hyacinth was 95 ± 3. 1
mg/ g of Water Hyacinth using
microwave-pretreatment and sodium
hydroxide solution.
CONCLUSIONS
Water hyacinth can be utilized for
many organic material, such as
organic fertilizer, bioethanol, and
many more. Water hyacinth can be
hydrolyzed using many pretreatment
methods and many solvent, one of
the method is microwave method
using calcium hydroxide solution.
Water hyacinth was hydrolyzed
using various concentration of
calcium hydroxide solution, different
treatment time, and various solid to
solvent ratio. And the optimum
condition obtained at solid to liquid
ratio as 1: 10, concentration of
calcium hydroxide at 0. 55 % wt, and
30 minutes of extraction time with
total reducing sugar was 54 mg/ g
WH. The reducing sugar using
calcium hydroxide solution was less
comparing to sodium hydroxide ( 95
mg/ g WH) (Rezania et al, 2019)
compare to sodium hydroxide,
calcium hydroxide is better for
making organic fertilizer due to
sodium hydroxide is toxic, corrosive
and irritating to the skin, eyes and
mucous membranes, and also it will
endanger environment (USEPA,
1992).
Microwave pretreatment using
calcium hydroxide solution can be
one of the method to hydrolysis
lignocellulosic material from water
hyacinth.
ACKNOWLEDGEMENTS
The authors acknowledge the support
from Department of Chemical
Engineering, Faculty of Engineering,
Mahidol University, Thailand.
REFERENCES
Keawmanee, Ratchanon. Water Hyacinth -
The Green Potential. Tesis. Rochester
Institute of Technology. 2015.
Proceeding on the 5th EnvironmentAsia International Conference
13-15 June 2019, Convention Center, The Empress Hotel, Chiang Mai, Thailand
I-81
Accessed from
http://scholarworks.rit.edu/theses.
Bolenz, S. , Omran, H. , Gierschner, K.
Treatments of water hyacinth tissue to
obtain useful products. Biological
Wastes 33 (4), 1990, pages 263–274.
Lee B. Insects for controlling water weeds.
Rural-Research (105), 1979, 25–29.
Carina C. Gunnarsson, Cecilia Mattsson
Petersen. Water hyacinths as a
resource in agriculture and energy
production: A literature review. Waste
Management 27, 2007, pages 117–
129.
Kasem Chunkao, Chatri Nimpee, Kittichai
Duangmal. The King's initiatives using
water hyacinth to remove heavy metals
and plant nutrients from wastewater
through Bueng Makkasan in Bangkok,
Thailand. Ecological Engineering,
Volume 39, 2012, Pages 40-52, ISSN
0925-8574.
T.Yang, G. Wei Zhang, W. Zhe Zhu, J. Bin
Su, Y. Zhao. Microwave Pyrolysis
Parameter Design of Water Hyacinth
after Optimization based on Box-
Behnken. 2016 International
Conference on Power Engineering &
Energy, Environment ( PEEE 2016) .
ISBN: 978-1-60595-376-2.
Bolenz, S., Omran, H., Gierschner, K., 1990.
Treatments of water hyacinth tissue to
obtain useful products. Biological
Wastes 33 (4), 263–274.
Abdelhamid, A. M. , Gabr, A. A. Evaluation
of water hyacinth as feed for
ruminants. Archives of Animal
Nutrition (Archiv fuer Tiererna¨hrung)
41 (7/8), 1991. 745–756.
Chanakya, H.N., Borgaonkar, S., Meena, G.,
Jagadish, K. S. Solid phase biogas
production with garbage or water
hyacinth. Bioresource Technology 46,
1993, 227–231.
Gunnarsson, C, Petersen, C. Water
hyacinths as a resource in agriculture
and energy production: a literature
review. Waste Manage. 27, 2007, 117–
129.
Patel, V. , Desai, M. , Madamwar, D. A
Thermochemical pretreatment of water
hyacinth for improved biomethanation.
Applied Biochemistry and
Biotechnology, 42, 1993, 67–74.
Patel, V. B. , Patel, A. R. , Patel, M. C. ,
Madamwar, D. B. , 1993b. Effect of
metals on anaerobic digestion of water
hyacinth- cattle dung. Applied
Biochemistry and Biotechnology 43,
45–50.
Hendriks, A. and Zeeman, G. Pretreatments
to enhance the digestibility of
lignocellulosic biomass. Bioresource
Technology, Vol. 100, No. 1, 2009,
10-18.
Kumar, P. , Barrett, D. M. , Delwiche, M. J. ,
and Stroeve, P. A. Methods for
Pretreatment of Lignocellulosic
Biomass for Efficient Hydrolysis and
Biofuel Production. Industrial &
Proceeding on the 5th EnvironmentAsia International Conference
13-15 June 2019, Convention Center, The Empress Hotel, Chiang Mai, Thailand
I-82
Engineering Chemistry Research,
2009.
Polprasert C, N. Kongsricharoern and W.
Kanjanaprapin. Production of feed and
fertilizer from water hyacinth plants in
the tropics. Waste management &
research, 1994, 12. 3-11.
Muoma John. Production of Organic
Compost from Water Hyacinth
( Eichhornia crassipes [ Mart. ] Solms)
in the Lake Victoria Basin: A Lake
Victoria Research Initiative ( VicRes) .
Journal of Agriculture and Allied
Sciences, 2016, ISSN: 2319-9857.
Budiyono, S. Sumardiono, D. Tri Mardiani.
Microwave Pretreatment of Fresh
Water Hyacinth (Eichhornia crassipes)
in Batch Anaerobic Digestion Tank.
International Journal of Engineering,
IJE TRANSACTIONS C: Aspects
Vol. 28, No. 6, 2015, 832-840.
Berglund Odhner, P. , Sárvári Horváth, I. ,
Kabir, M. M. and Shabbauer,A. ,
"Biogas from lignocellulosic biomass,
Rapport SGC, sgc.camero.se, 2012.
Cigdem Eskicioglu, Nicolas Terzian, Kevin
J. Kennedy, Ronald L. Droste,
Mohamed Hamoda, “Athermal
microwave effects for enhancing
digestibility of waste activated
sludge”, Water Research, Volume 41,
Issue 11, 2007.
Zhu, S. , Wu, Y. , Yu, Z. , Wang, C. , Yu, F. ,
Jin, S., Ding, Y., Chi,R.a., Liao, J. and
Zhang, Y. , Comparison of three
microwave/ chemical pretreatment
processes for enzymatic hydrolysis of
rice straw. Biosystems Engineering,
Vol. 93, No. 3, 2006, 279-283.
Jackowiak, D. , Bassard, D. , Pauss, A. and
Ribeiro, T. Optimisation of a
microwave pretreatment of wheat
straw for methane production.
Bioresource Technology, Vol. 102,
No. 12, 2011, 6750-6756.
Sapci, Z. , Morken, J. and Linjordet, R. An
investigation of the enhancement of
biogas yields from lignocellulosic
material using two pretreatment
methods: Microwave irradiation and
steam explosion. BioResources, Vol.
8, No. 2, 2013, 1976-1985.
Banik, S. , Bandyopadhyay, S. , Ganguly, S.
and Dan, D. , " Effect of microwave
irradiated ethanosarcina barkeri dsm-
804 on biomethanation" , Bioresource
Technology, Vol. 97, No. 6, 2006,
819-823.
Eskicioglu, C., Prorot, A., Marin, J., Droste,
R. L. and Kennedy, K. J. Synergetic
pretreatment of sewage sludge by
microwave irradiation in presence of h
2 o 2 for enhanced anaerobic digestion.
Water Research, Vol. 42, No. 18,
2008, 4674-4682.
Marin, J., Kennedy, K.J. and Eskicioglu, C.
Effect of microwave irradiation on
anaerobic degradability of model
kitchen waste. Waste Management,
Vol. 30, No. 10, 2010, 1772-1779.

Proceeding on the 5th EnvironmentAsia International Conference
13-15 June 2019, Convention Center, The Empress Hotel, Chiang Mai, Thailand
I-83
Mudhoo, A. , Moorateeah, P.R. and Mohee,
R. Effects of microwave heating on
biogas production, chemical oxygen
demand and volatile solids
solubilization of food residue.
Citeseer, 2012.
Shahriari, H. , Warith, M. , Hamoda, M. and
Kennedy, K. J. Anaerobic digestion of
organic fraction of municipal solid
waste combining two pretreatment
modalities, high temperature
microwave and hydrogen peroxide.
Waste Management, Vol. 32, No. 1,
2012, 41-52.
Mehdizadeh, S. N. , Eskicioglu, C. ,
Bobowski, J. and Johnson, T.
Conductive heating and microwave
hydrolysis under identical heating
profiles for advanced anaerobic
digestion of municipal sludge. Water
Research, Vol.47, No. 14, 2013, 5040-
5051.
Saifuddin, N. and Fazlili, S. Effect of
microwave and ultrasonic
pretreatments on biogas production
from anaerobic digestion of palm oil
mill effluent. American Journal of
Engineering and Applied Sciences,
Vol. 2, No. 1, 2009, 23-34.
Qiuzhuo Zhang, Chen Weng, Huiqin Huang,
Varenyam Achal, and Duanchao
Wang. Optimization of bioethanol
production using whole plant of water
hyacinth as substrate in simultaneous
saccharification and fermentation
process. Frontiers in Microbiology.
January 2016. Volume 6. Article 1411.
Ethaib, S. , Omar, R. ,Mazlina, M. ,Radiah,
A.,Syafiie, S. and Harun, M. Y. Effect
of microwave- assisted acid or alkali
pretreatment on sugar release from
Dragon fruit foliage. International
Food Research Journal 23( Suppl) :
S149-S154 December 2016.
G. L. Miller. Use of Dinitrosalicylic Acid
Reagent for Determination of
Reducing Sugar. Anal. Chem. , 1959,
31 ( 3) , pp 426– 428. DOI:
10. 1021/ ac60147a030. Publication
Date: March 1959.
Marisa Garriga, Melisa Almaraz, Alicia
Marchiaro. Determination of reducing
sugars in extracts of Undaria
pinnatifida ( harvey) algae by UV-
visible spectrophotometry ( DNS
method) . Actas de Ingeniería.
Volumen 3, pp. 173-179, 2017.
Bai- Hang Zhao, Jie Chen, Han- Qing Yu,
Zhen-Hu Hu, Zheng-Bo Yue, and Jun
Li. Optimization of microwave
pretreatment of lignocellulosic waste
for enhancing methane production:
Hyacinth as an example. Front.
Environ. Sci. Eng. 2017, 11(6) : 17.
DOI 10.1007/s11783-017-0965-z.
A. Shitu, S. Izhar, T. M. Tahir. Sub-critical
water as a green solvent for production
of valuable materials from agricultural
waste biomass: A review of recent
work. Global J. Environ. Sci. Manage.,
1( 3) : 255-264, Summer 2015, ISSN

Proceeding on the 5th EnvironmentAsia International Conference
13-15 June 2019, Convention Center, The Empress Hotel, Chiang Mai, Thailand
I-84
2383 – 3572.
Shahabaldin Rezania, Hossein Alizadeh,
Junboum Park, Mohd Fadhil Md Din,
Negisa Darajeh,Shirin Shafiei
Ebrahimi, Bidyut Baran Saha, and
Hesam Kamyab. Effect of Various
Pretreatment Methods on Sugar and
Ethanol Production from Cellulosic
Water Hyacinth. BioResources Vol 14,
No. 1, 01.02.2019, p. 592-606.
Harun, M. Y., Radiah, A. D., Abidin, Z. Z.,
and Yunus, R. ( 2011) . Effect of
physical pretreatment on dilute acid
hydrolysis of water hyacinth
( Eichhornia crassipes) . Bioresource
Technology 102(8), 5193-5199. DOI:
10.1016/j.biortech.2011.02.001.
Atcharaporn Jongmeesuk, Vorapat
Sanguanchaipaiwong, and Duangjai
Ochaikul. Pretreatment and Enzymatic
Hydrolysis from Water Hyacinth
( Eichhornia crassipes) . KMITL Sci.
Tech. J. Vol. 14 No. 2 Jul.-Dec. 2014.
R.E.D. FACTS. Sodium Hydroxide. United
States Environmental Protection
Agency. EPA- 738- F- 92- 008
September 1992.
Zhang Q, Weng C, Huang H, Achal V, Wang
D. Optimization of Bioethanol
Production Using Whole Plant of
Water Hyacinth as Substrate in
Simultaneous Saccharification and
Fermentation Process. Front
Microbiol. 2016; 6: 1411. Published
2016 Jan 7.
Fiorella P. Cardenas-Toro, Sylvia C.
Alcazar-Alay, Tânia Forster-Carneiro,
M. Angela A. Meireles. Obtaining
Oligo- and Monosaccharides from
Agroindustrial and Agricultural
Residues Using Hydrothermal
Treatments. Food and Public Health
2014, 4(3): 123-139. DOI:
10.5923/j.fph.20140403.08.
Joseph B. Binder and Ronald T. Raines.
Fermentable sugars by chemical
hydrolysis of biomass. Proceedings of
the National Academy of Sciences Mar
2010, 107 (10) 4516-4521; DOI:
10.1073/pnas.0912073107
S.Das, A. Bhattacharya, S. Haldar, A.
Ganguly, Sai Gu, Y.P. Ting, P.K.
Chatterjee. Optimization of enzymatic
saccharification of water hyacinth
biomass for bio-ethanol: Comparison
between artificial neural network and
response surface methodology.
Sustainable Materials and
Technologies. Volume 3. 2015. Pages
17-28. ISSN 2214-99
Proceeding on the 5th EnvironmentAsia International Conference
13-15 June 2019, Convention Center, The Empress Hotel, Chiang Mai, Thailand
I-85
Discrimination of Seismic Events in Lampang Province: A
Complexity Approach
Santawat Sukrungsri, Chutimon Promsuk, Chirawat Kamjudpai, and Sukrit
Kirtsaeng*
Earthquake Observation Division, Thai Meteorological Department,
Bangkok 10260, Thailand; *Corresponding author: e-mail:
ABSTRACT
This study aimed to distinguish microearthquakes from quarry blasts in order
to clarify seismic hazard situation in Lampang province. Complexity (C)
technique is regarded as an effective statistical approach for seismic
discrimination that quarry blasts generate larger P-wave energy than that of
earthquakes in specific time window. This technique was carried out utilizing
30 short period seismograms with local magnitudes of 1.0-1.9, recorded in
February 2019 by Thai Meteorological Department (TMD). The events posed
in vicinity of both the quarry and the fault rupture zone which associated with
the M4.9 earthquake in Lampang province. The suitable Complexity
parameters obtained from successive retrospective tests indicating the time
windows of t1 = 3s and t2 = 6s were appropriate in classifying seismic events
in the region. The seismic events in the mining area had C-value lower than
1.0 (in the range of 0.23-0.95) while the events with C-value higher than 1.0
(varies from 1.12 to 4.31) were located only within the aftershock zone of
M4.9 earthquake. The proposed criteria in this study were the seismic events
with C-value lower than 1.0 and higher than 1.0 be identified as quarry blast
and earthquake, respectively. The above criteria will be useful for seismic
discrimination, decontamination of earthquake catalogue, as well as seismic
hazard investigations, particularly for Lampang province.
Proceeding on the 5th EnvironmentAsia International Conference
13-15 June 2019, Convention Center, The Empress Hotel, Chiang Mai, Thailand
I-86
Keywords: Discrimination, Microearthquake, Quarry blast, Lampang
province, Complexity
INTRODUCTION
The Indian-Eurasian plate collision
causes the tectonic activity, the
intraplate seismic sources, and the
seismogenic fault zones along the
intermountain basin of the northern
Thailand, such as Mae-Chan, Mae-
Tha, Phayao, Pua, and Thoen fault
zones. Thoen active fault has been
recognized as the significant seismic
source in Lampang province
(Charusiri et al. 1998). The tectonic
geomorphology in the region (i.e.
triangular facet and shutter ridge)
illustrate obviously the Thoen fault
strikes mainly NE-SW direction that
aligns 120 km cross the area between
the Phrae basin to east and the
Lampang, Mae Moh, and Thoen
basins to west (Charoenprawat et al.
1994). The rate of the last fault
movement in the region was 0.18
mm/year with a recurrence interval
for the large earthquakes of 1,700
years (Pailoplee et al. 2009).
Tectonically, Lampang province is
situated in the seismically active zone
with the accumulated seismotectonic
stress as expressed in Fig. 1. As a
result, a large number of shallow
crustal earthquakes have been
detected in Lampang province over
the last four decades. The latest event
was a M4.9 strike-slip faulting
earthquake in February 2019.
Although the event is small in sense
of the earthquake magnitude, the
shallow of focal depth adjacent to the
densely populated zones cause the
shaking intensity is noticeable within
the areas covering approximately 50
km from the earthquake epicenter
with no significant damage or
casualties. However, the clusters of
microearthquakes were generated,
the more than 100 aftershocks have
been observed around the main shock
source that many people can be felt
and were panic. The historical
earthquake information, instrumental
seismic records including
paleoseismological evidence realized
that the Lampang province is an
earthquake-prone area. However,
there is the large quarry in the

Proceeding on the 5th EnvironmentAsia International Conference
13-15 June 2019, Convention Center, The Empress Hotel, Chiang Mai, Thailand
I-87
Lampang province, known as the
Mae Moh Mine. The observe seismic
waves could be originated from both
the quarry blast and active faults in
the region, referred as man-made
activity and earthquake hazard,
respectively. Therefore, in order to
clarify the seismic hazard situation,
this study aimed to discriminate the
seismic events in the region with
respect to suitable technique for
Lampang Province.
METHODOLOGY
The seismic events occurred
in Lampang province with the local
magnitude of 1.0-1.9 in February
2019 were employed in this study.
The magnitudes and locations of the
seismic events are provided from
Earthquake Observation Division of
TMD. We investigated
vertical components of velocity
seismograms
from 30 seismic events that were
recorded by the OMKO short period
station with a 148-km radius of the
Mae Moh mining area. The
seismicity and waveform data of 30
events are
shown in Table 1 and Fig. 2,
respectively. Complexity (C) is the
ratio of integrated powers of the
seismogram in the selected time
windows (Yoshida, 2016) as
illustrated in Eq. (1).
Generally, the P-wave energy of a
quarry blast is greater than that of the
S-wave. C-value becomes larger for
earthquakes than for probable mining
blasts, since the P-wave amplitude on
the seismogram is larger than the S-
wave amplitude for mining blasts
(Horasan et al. 2009; Ogutcu et al.
2010). Based on the locations of the
events, we analyzed 15 probable
mining blast waveforms and 15
earthquake waveforms. The
parameters of t1 and t2 were tested
retrospectively with 30 seismic
events as mentioned above. A long-
time window length of about 18 sec
depending on the distance to the
seismic source from the OMKO
seismic station.
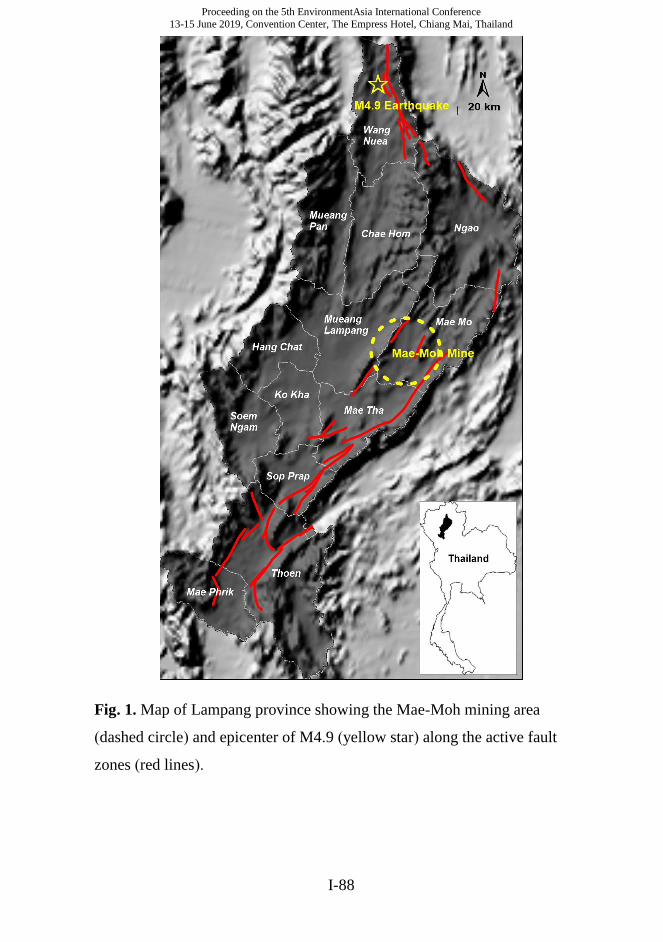
Proceeding on the 5th EnvironmentAsia International Conference
13-15 June 2019, Convention Center, The Empress Hotel, Chiang Mai, Thailand
I-88
Fig. 1. Map of Lampang province showing the Mae-Moh mining area
(dashed circle) and epicenter of M4.9 (yellow star) along the active fault
zones (red lines).
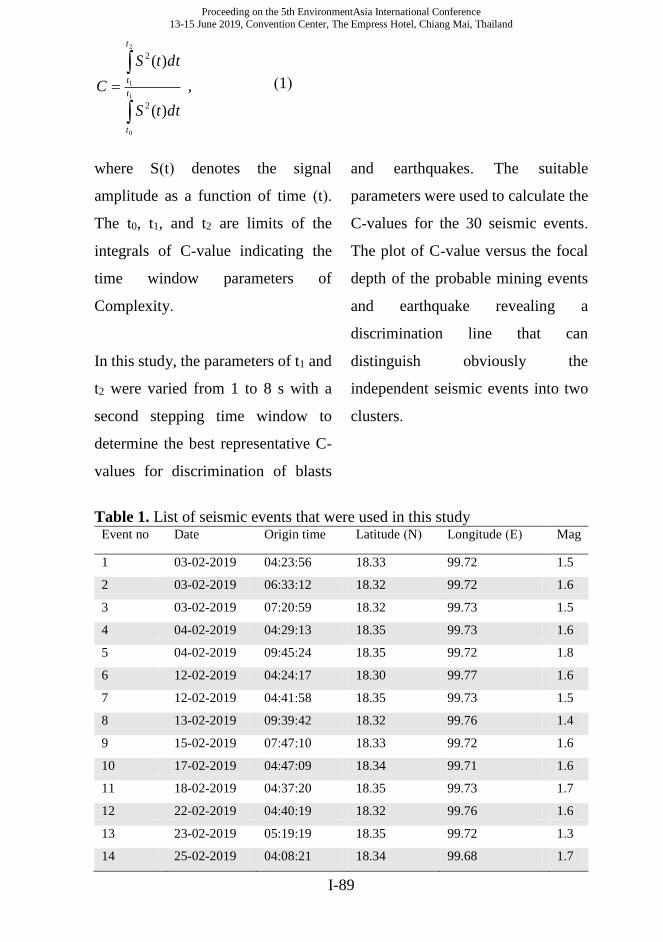
Proceeding on the 5th EnvironmentAsia International Conference
13-15 June 2019, Convention Center, The Empress Hotel, Chiang Mai, Thailand
I-89
1
0
2
1
)(
)(
2
2
t
t
t
t
dttS
dttS
C ,
where S(t) denotes the signal
amplitude as a function of time (t).
The t0, t1, and t2 are limits of the
integrals of C-value indicating the
time window parameters of
Complexity.
In this study, the parameters of t1 and
t2 were varied from 1 to 8 s with a
second stepping time window to
determine the best representative C-
values for discrimination of blasts
and earthquakes. The suitable
parameters were used to calculate the
C-values for the 30 seismic events.
The plot of C-value versus the focal
depth of the probable mining events
and earthquake revealing a
discrimination line that can
distinguish obviously the
independent seismic events into two
clusters.
Table 1. List of seismic events that were used in this study Event no Date Origin time Latitude (N) Longitude (E) Mag
1 03-02-2019 04:23:56 18.33 99.72 1.5
2 03-02-2019 06:33:12 18.32 99.72 1.6
3 03-02-2019 07:20:59 18.32 99.73 1.5
4 04-02-2019 04:29:13 18.35 99.73 1.6
5 04-02-2019 09:45:24 18.35 99.72 1.8
6 12-02-2019 04:24:17 18.30 99.77 1.6
7 12-02-2019 04:41:58 18.35 99.73 1.5
8 13-02-2019 09:39:42 18.32 99.76 1.4
9 15-02-2019 07:47:10 18.33 99.72 1.6
10 17-02-2019 04:47:09 18.34 99.71 1.6
11 18-02-2019 04:37:20 18.35 99.73 1.7
12 22-02-2019 04:40:19 18.32 99.76 1.6
13 23-02-2019 05:19:19 18.35 99.72 1.3
14 25-02-2019 04:08:21 18.34 99.68 1.7
(1)

Proceeding on the 5th EnvironmentAsia International Conference
13-15 June 2019, Convention Center, The Empress Hotel, Chiang Mai, Thailand
I-90
Table 1. (Continued)
Event no Date Origin time Latitude (N) Longitude (E) Mag
15 26-02-2019 03:56:26 18.31 99.72 1.6
16 20-02-2019 05:01:55 19.26 99.58 1.0
17 20-02-2019 19:36:34 19.28 99.62 1.7
18 20-02-2019 21:02:43 19.29 99.63 1.5
19 20-02-2019 21:05:35 19.27 99.66 1.5
20 21-02-2019 19:02:36 19.26 99.62 1.9
21 21-02-2019 21:24:32 19.28 99.62 1.7
22 22-02-2019 15:02:18 19.25 99.61 1.5
23 22-02-2019 18:23:21 19.29 99.62 1.8
24 22-02-2019 18:59:00 19.29 99.64 1.7
25 22-02-2019 20:15:10 19.28 99.65 1.3
26 24-02-2019 00:24:20 19.24 99.62 1.6
27 25-02-2019 20:17:39 19.28 99.60 1.0
28 27-02-2019 04:13:45 19.26 99.57 1.9
29 27-02-2019 17:07:23 19.25 99.63 1.5
30 28-02-2019 21:08:57 19.25 99.62 1.9
RESULTS AND DISCUSSION
In this study, we analyzed 30 seismic
events with magnitude of 1.0-1.9
occurred in Lampang province in
February 2019. Complexity was
utilized to discriminate between
quarry blasts and earthquakes. The
suitable parameters for the
discrimination obtained from
successive retrospective tests and
were applied to determine the C-
values of 30 seismic events indicating
the criteria for classifying the seismic
events in the region. The results
illustrate 30 seismic events could
reasonably be classified into two
clusters with the time window
parameters of t1 = 3s and t2 = 6s. The
events located within Mae Moh
mining zone, C-values would be only
lower than 1.0 in the range of 0.23-
0.95 while the events with C-values
be higher than 1.0 (varies from 1.12
to 4.31) generated only within the
aftershock zone of M4.9 earthquake
in Lampang province. The plot of C-
value versus the focal depth of the
probable mining events and
earthquake reveal a discrimination
line of C-values = 1.0 was

Proceeding on the 5th EnvironmentAsia International Conference
13-15 June 2019, Convention Center, The Empress Hotel, Chiang Mai, Thailand
I-91
appropriate for discrimination of the
seismic events, which all of quarry
blast are placed below the
discrimination line while most of
earthquake located above the line as
illustrated in Fig. 3. However, some
earthquakes remained below the line
of discrimination indicating the
events were not completely
discriminated by a Complexity
approach in the region.
Fig. 2. The seismograms of 30 seismic events that were used in this study.
This is a limitation of Complexity for
classifying the seismic events
(Ogutcu et al. 2010; Yilmaz et al.
2012). The limitation should be
clarified using the increasing seismic
data in further study. According to
the seismic events in Lampang
province, discrimination of quarry
blasts from earthquakes using
satellite images may not be accurate
since the quarries are situated along
active fault zones in Lampang region

Proceeding on the 5th EnvironmentAsia International Conference
13-15 June 2019, Convention Center, The Empress Hotel, Chiang Mai, Thailand
I-92
as well as the seismic events with
magnitude less than 2.0 were not
precisely reported by TMD network.
Additionally, the discrimination by
using the occurrence times is difficult
since the information regarding the
location and blasting time from
quarries have not been reported to
TMD on a regular basis.
Fig. 3. Distribution of Complexity for the seismic events in Lampang
province with the discrimination line (dashed line) obtained from this study.
CONCLUSIONS
The presence of the quarries along
the active fault zones in Lampang
province caused the significant
contamination of the earthquake
catalogue by blasts as well as
misinterpretation of the present-day
seismotectonic activities. In order to
clarify the earthquake hazard
situation in Lampang province,
Complexity approach with the
suitable parameters was employed to
discriminate the seismic events in the
region. The obtained results lead to
the conclusion as follows:
i) Suitable Complexity
Parameters for Lampang province
were derived in order to discriminate
Proceeding on the 5th EnvironmentAsia International Conference
13-15 June 2019, Convention Center, The Empress Hotel, Chiang Mai, Thailand
I-93
the seismic events in the region. The
time window parameters of t1 = 3s
and t2 = 6s can reasonably distinguish
seismic events within mining zone
and the earthquake within aftershock
zone of M4.9 main shock.
ii) The C-value of 1.0 is
appropriate sufficiently to distinguish
seismic events in the mining area (C
< 1.0) while the events with C-value
higher than 1.0 were located within
the aftershock zone of M4.9
earthquake.
iii) The plot of C-value versus
focal depth indicates some
earthquakes are placed below a
discrimination line of C-value of 1.0
representing the limitation of
Complexity that the events were not
completely discriminated in the
region.
iv) Discrimination of
earthquakes from quarry blasts in
Lampang province using simple
criteria, i.e., satellite images,
occurrence times, may not be
accurate since quarries are located
along the active fault zone as well as
the insufficiency of information
regarding the location and blasting
time from quarries in the region.
ACKNOWLEDGMENTS
This research was supported
by Thai Meteorological Department
(TMD). The authors appreciate the
thoughtful comments and
suggestions by the anonymous
reviewers. We are grateful to the staff
of Earthquake Observation Division
for recording the seismic data that
were used in this study. Thanks are
also extended to Parwapath
Phunthirawuthi for a critical review
and improved English.
REFERENCES
Charoenprawat, A., Chuaviroj, S., Hintong,
C., and Chonglakmani, C., 1994.
Geological map of Changwat
Lampang quadrangle. Geological
Survey Division, Department of
Mineral Resources, Bangkok,
Thailand, scale 1:250,000.
Charusiri, P., Kosuwan, S., Lumjuan, A., and
Wechbunthung, B., 1998. Review of
active fault and seismicity in
Thailand. Geological Society of
Malaysia Bulletin, 653-665.
Horasan, G., Boztepe-Guney, A., Kusmezer,
A., Bekler, F., Ogutcu, Z., Musaoglu,
N., 2009. Contamination of
Proceeding on the 5th EnvironmentAsia International Conference
13-15 June 2019, Convention Center, The Empress Hotel, Chiang Mai, Thailand
I-94
seismicity catalogs by quarry blasts:
an example from Istanbul and its
vicinity, northwestern Turkey.
Journal of Asian Earth Sciences, 34:
90-99.
Ogutcu, Z., Horasan, G., Kalafat, D., 2010.
Investigation of microseismic activity
source in Konya and its vicinity,
Central Turkey. Natural Hazards, 58:
497-509.
Pailoplee, S., Takashima, I., Kosuwan, S.,
and Charusiri, P., 2009. Earthquake
activities along the Lampang-Thoen
fault zone, northern Thailand:
evidence from paleoseismological
and seismicity data. Journal of
Applied Sciences Research, 5(2):
168-180.
Yilmaz, S., Bayrak, Y., and Cinar, H., 2012.
Discrimination of earthquake and
quarry blasts in the eastern Black Sea
region of Turkey. Journal of
Seismology, 17: 721-734.
Yoshida, Y., 2016. Discrimination by short-
period seismograms. International
Institute of Seismology and
Earthquake Engineering, Building
Research Institute, Lecture Notes,
Global Course, Tsukuba, Japan, 19
pp.

Proceeding on the 5th EnvironmentAsia International Conference
13-15 June 2019, Convention Center, The Empress Hotel, Chiang Mai, Thailand
I-95
Effect of silver nanoparticles on Pseudomonas putida and
Bacillus subtilis biofilm formation
Rungnapa Takam1, Kritchaya Issakul1, Pumis Thuptimdang2,3,*
1Department of Environmental Science, School of Energy and Environment,
University of Phayao, Phayao 56000, Thailand
2Department of Chemistry, Faculty of Science, Chiang Mai University,
Chiang Mai 50200, Thailand
3Environmental Science Research Center, Faculty of Science, Chiang Mai
University, Chiang Mai 50200, Thailand; Corresponding author:
e-mail: [email protected]
ABSTRACT
Wide applications of silver nanoparticles (AgNPs) could possibly lead to the
release into the environment. Environmental bacteria are normally living
together in a protective layer of extracellular polymeric substances (EPS)
called biofilms. The toxicity of AgNPs probably results in the unfavorable
conditions for biofilm formation, causing the reduction of biofilm biomass and
consequently the activities beneficial to the ecosystem. The objective of this
research is to study the effect of various concentrations of AgNPs on the
formation of gram-negative and gram-positive bacteria. By using soil bacteria,
Pseudomonas putida KT2440 and Bacillus subtilis, as the representatives of
environmental bacteria. The experiments were conducted in a 96-well plate
with the presence of AgNPs (average size of 5-20 nm) at the concentrations
of 0, 0.1, 0.5, 1, 10, 50, 100, 500 and 1000 mg/L. The plate was incubated at
room temperature for 48 h, and biofilm formation was measured by crystal
violet staining throughout the incubation period. The growth curve of biofilm
formation under different AgNP concentrations was conducted. The results
showed that AgNPs at 10 and 50 mg/L resulted in the formation of P. putida
KT2440 biofilms similar to the control (0 mg/L) while the formation was
Proceeding on the 5th EnvironmentAsia International Conference
13-15 June 2019, Convention Center, The Empress Hotel, Chiang Mai, Thailand
I-96
inhibited completely at the AgNP concentrations of 100, 500 and 1,000 mg/L.
Interestingly, AgNPs at low concentrations of 0.1, 0.5 and 1 mg/L could
increase P. putida KT2440 biofilm formation compared with the control.
Differently, AgNPs at the studied concentrations only inhibited B. subtilis
biofilm formation, and no increased formation of biofilms was observed. The
findings from this study can be used in the determination of AgNP impacts on
environmental biofilms of both gram negative and positive bacteria.
Keywords: Silver nanoparticles, Biofilms, Extracellular polymeric
substances
INTRODUCTION
Silver nanoparticles (AgNPs) are
widely used as antimicrobial agents
in various consumer products for
environmental, medical, and
industrial applications (Dorobantu et
al., 2015; Duran et al., 2016). Since
AgNPs possess antimicrobial
properties (Garuglieri et al., 2017),
the widespread uses can possibly
release high loads of AgNPs into
wastewater and natural water
environment (Angel et al., 2013).
AgNPs in the environment could
suppress the growth and activity of
various microorganisms including
bacteria, yeast, and algae (Gutierrez
et al., 2013; Dorobantu et al., 2015).
Bacteria in nature often live in the
form of biofilms, which are clusters
of bacteria forming on surface by
assembling the cells within the
extracellular polymeric substance
(EPS). In both natural water and
wastewater systems, bacteria form
biofilms to promote nutrient
diffusion and uptake for growth, to
survive in diverse conditions, or to
protect themselves from harmful
substances (Flemming et al., 2007;
Jamal et al., 2015; Donlan, 2002).
AgNPs with strong activity are
capable of eradicating the wastewater
biofilms, changing the biofilm
structure, and reducing the
wastewater treatment ability. Also,
AgNPs that accumulate in the soil

Proceeding on the 5th EnvironmentAsia International Conference
13-15 June 2019, Convention Center, The Empress Hotel, Chiang Mai, Thailand
I-97
will reduce the activity and diversity
of bacteria (Morones et al., 2005;
Nadell, 2009; Samarajeewa et al.,
2017).
The concentrations of AgNPs found
in wastewater or natural water might
be possibly low and did not
completely eradicate the biofilms
(Melissa et al., 2013). However, these
low or sub-lethal concentrations of
AgNPs could still have an impact on
the process of biofilm formation, and
research in this area is still limited.
Therefore, the objective of this
research is to study the effect of
various concentrations of AgNPs on
the process of biofilm formation of
gram-negative and gram-positive
bacteria. Firstly, the sub-lethal
concentrations of AgNPs that did not
inhibit biofilm formation were
chosen. After that, the impact of
AgNPs on the alteration of biofilms
was determined from biomass
production.
METHODOLOGY
Bacterial culture preparation
P. putida KT2440 (ATCC 47054), a
gram-negative bacterial strain, was
cultivated in Luria-Bertani (LB)
medium at 30°C. Bacillus subtilis
(TISTR1248 and TISTR1451), gram-
positive bacterial strains, were
cultivated in Nutrient Broth (NB)
medium at 37 °C. Before each
experiment, all strains were shaken
overnight corresponding to their
media and temperature at 100 rpm of
shaking speed. The cell suspension
was centrifuged at 7000 rpm for 1
min and the cell pellet was washed
twice with 0.85% NaCl solution. The
cell suspension was prepared by
adding 0.85% NaCl to the pellet and
adjust the optical density at 600 nm
(OD600) of the suspension to 0.4. This
is to ensure the same starting number
of cells (107 CFU/ml) in each biofilm
experiment.
AgNP preparation
The commercial AgNPs was
obtained from Prime Nano
Technology (Bangkok, Thailand).
According to the manufacturer, the

Proceeding on the 5th EnvironmentAsia International Conference
13-15 June 2019, Convention Center, The Empress Hotel, Chiang Mai, Thailand
I-98
AgNPs are rounded-shape with the
size range between 5–20 nm and the
concentration of 10,000 mg/L.
Before use, the AgNP suspension
was diluted to the desired
concentrations using sterile de-
ionized (DI) water.
Biofilm experiment
Biofilm formation was conducted in
a polystyrene, flat-bottom, 96-well
plate. Each well (200 µl) contained
the cell suspension, LB (0.5X) or NB
(0.5X) medium, DI water, and with or
without the AgNP suspension. DI
water was used to adjust the volume
and dilute AgNPs to the required
concentrations (0, 0.1, 0.5, 1, 10, 50,
100, 500 and 1000 mg/L). The plate
was incubated at room temperature
for 48 h. Every experiment was
conducted with three wells
representing three replicates.
At each sampling time, after the
biofilms formed, the media was
carefully removed before the
biofilms were slowly rinsed twice
with 0.85% NaCl. The biomass
amount was determined by crystal
violet (CV) staining, which was then
measured at the absorbance of 600
nm (A600) according to Thuptimdang
et al. (2015). The appearance of
biofilms before and after CV staining
is shown in Figure 1.
Figure 1 Biofilms before (upper row) and after (lower row) CV staining.

Proceeding on the 5th EnvironmentAsia International Conference
13-15 June 2019, Convention Center, The Empress Hotel, Chiang Mai, Thailand
I-99
RESULTS AND DISCUSSION
Determination of Minimum
Biofilm Inhibitory Concentration
(MBIC) of AgNPs
The objective of this study was to
determine the effect of AgNPs in
the range of sub-lethal
concentrations. In order to find
that range, a preliminary
experiment was conducted to
determine the minimum biofilm
inhibitory concentrations (MBIC)
of AgNPs. Pseudomonas putida
KT2440 were exposed to different
concentrations (a series of half-
dilutions) of AgNPs in the 96-well
plate for 12 h to allow biofilm
formation. The results showed that
the MBIC of AgNPs was 62.5
mg/L, and the concentrations
below 62.5 to 0.12 mg/L were sub-
lethal to biofilms, showing similar
biofilm formation compared with
the control (0 mg/L) (Figure 2).
The MBIC from this study is
higher compared to the study of
another gram-negative bacteria, E.
coli AB1157 (Radzig et al., 2013),
which showed the sub-lethal
concentrations of AgNPs between
0.10 to 0.15 mg/L. This might
suggest higher AgNP tolerance in
P. putida KT2440 biofilms.
According to the data from this
experiment, the concentrations
below MBIC (0.1, 0.5, 1, 10, and
50 mg/L) and above MBIC (100,
500, and 1,000 mg/L) were
selected for further experiments.

Proceeding on the 5th EnvironmentAsia International Conference
13-15 June 2019, Convention Center, The Empress Hotel, Chiang Mai, Thailand
I-100
Figure 2 Effect of different AgNP concentrations on Pseudomonas putida
KT2440 biofilm formation at 12 h.
Effect of AgNPs on P. putida KT
2440 biofilm formation
The 48-h growth curve of biofilm
formation was conducted under
different AgNP concentrations
(below or above the MBIC). The
results showed that the effect of
AgNPs can be divided into three
groups (Figure 3): inhibition of
biofilm formation, no effect on
biofilm formation, and increased
biofilm formation. Above the MBIC
level (100, 500, and 1,000 mg/L), P.
putida KT2440 biofilm formation
was inhibited, resulting in no biomass
or less biomass compared with the
control (0 mg/L). For the
concentrations below the MBIC,
AgNPs at 10 and 50 mg/L showed no
effect on the formation of P. putida
KT2440 biofilms, resulting in similar
formation compared with the control.
Interestingly, AgNPs at sub-lethal
concentrations of 0.1, 0.5 and 1 mg/L
could increase P. putida KT2440
biofilm formation. This finding has
previously been observed in the study
by Yang and Alvarez (2015), which
showed the increased formation of
Pseudomonas aeruginosa PAO1
biofilms when exposed to AgNPs at
low concentrations. This study is the
very first report on the promotion of
P. putida biofilms by AgNPs. The
finding from this study will be useful
in the determination of AgNP effect

Proceeding on the 5th EnvironmentAsia International Conference
13-15 June 2019, Convention Center, The Empress Hotel, Chiang Mai, Thailand
I-101
on environmental biofilms. Small
concentrations of AgNPs might not
be harmful to environmental biofilms
since the promotion of biomass can
be expected. However, the activities
in the promoted biofilms need to be
studied further to confirm whether
there is no adverse effect of sub-
lethal AgNPs on biofilms.
Figure 3 Effect of AgNPs on Pseudomonas putida KT2440
biofilm formation.
Effect of AgNPs on B. subtilis
biofilm formation
This part of the study was to
determine whether the sub-lethal
concentrations of AgNPs could
increase the biofilm formation of the
gram-positive bacteria: B. subtilis
TISTR1248 and B. subtilis
TISTR1451. The experiments were
conducted in a 96-well plate in the
similar manner as P. putida KT2440
with different temperature and
growth media as described in the
method section. The growth curve of
B. subtilis biofilm formation under
different AgNP concentrations was
conducted (Figure 4). The results
showed that AgNPs at the studied
concentrations only showed no effect
(concentrations below MBIC: 0.1,
0.5, 1, 10, 50 mg/L) or slightly
inhibited B. subtilis biofilm
formation (concentrations above
MBIC: 100, 500, 1,000 mg/L), and
no increased formation of biofilms
was observed as in P. putida KT2440
biofilms. The results also showed that
the impact of AgNPs on bacterial
biofilms depend on the strain type
(gram-positive or gram-negative). On

Proceeding on the 5th EnvironmentAsia International Conference
13-15 June 2019, Convention Center, The Empress Hotel, Chiang Mai, Thailand
I-102
the other hand, Gambino et al. (2015)
found more polysaccharide
production in the biofilms of B.
subtilis wild type strain Cu1065 after
exposed to 1 and 10 mg/L of AgNPs,
which was not observed in this study.
This difference might be due to the
low amount of B. subtilis biofilm
formation (Branda et al., 2001);
therefore, the small increase or
decrease in biofilm formation that
might be affected by AgNPs could
not be measured by the crude method
like CV staining used in this study.
Figure 4 Effect of AgNPs on B. subtilis biofilm formation:
(A) B. subtilis TISTR1248 and (B) B. subtilis TISTR1451.

Proceeding on the 5th EnvironmentAsia International Conference
13-15 June 2019, Convention Center, The Empress Hotel, Chiang Mai, Thailand
I-103
CONCLUSIONS
Effects of AgNPs on P. putida and B.
subtilis biofilm formation were
observed in this research. The data
showed that biofilms from gram-
negative bacteria were more resistant
to AgNPs than gram-positive
bacteria, which was proved by the
increased biomass of biofilm
formation at low AgNPs
concentrations of 0.1, 0.5 and 1
mg/L. The findings from this
research will help elucidating the
impact of AgNPs on wastewater and
environmental biofilms. In
wastewater systems, more biomass
production of biofilms caused by
AgNPs could lead to more
biofouling. However, bacteria
effective in producing EPS might be
an important indicator to detect the
contamination of AgNPs in
environment since they will be able
to withstand AgNPs and produce
more biomass.
ACKNOWLEDGEMENTS
This research was partly granted by
TRF Research Grant for New
Scholar (Grant number
MRG6080156). The authors would
like to thank School of Energy and
Environment, University of Phayao,
for providing laboratorial space and
equipment.
REFERENCES
Angel BM, Batley GE, Jarolimek CV,
Rogers NJ. The impact of size on the
fate and toxicity of nanoparticulate
silver in aquatic systems. Chemosphere
2013; 93: 359-365.
Donlan RM. Biofilms: microbial life on
surfaces. Emerging Infectious Diseases
2002; 8(9): 881-890.
Dorobantu LS, Fallone C, Noble AJ, Veinot
J, Ma G, Goss GG, Burrell, R.E.
Toxicity of silver nanoparticles against
bacteria, yeast, and algae. Journal of
Nanoparticle Research 2015; 17: 1-13.
Duran N, Duran M, de Jesus MB, Seabra
AB, Favaro WJ, Nakazato G,
Silver nanoparticles: a new view on
mechanistic aspects on antimicrobial
activity. Nanomedicine 2016; 12: 789-
799.
Flemming HC, Neu TR, Wozniak DJ. The
EPS matrix: The “House of Biofilm
Cells”. Journal of Bacteriology 2007;
189(22): 7945–7947.
Gambino M, Marzano V, Villa F, Vitali A,
Vannini C, Landini P, Cappitelli F.
Effects of sublethal doses of silver
nanoparticles on Bacillus subtilis
planktonic and sessile cells. Journal of
Proceeding on the 5th EnvironmentAsia International Conference
13-15 June 2019, Convention Center, The Empress Hotel, Chiang Mai, Thailand
I-104
Applied Microbiology 2015; 118:
1103-1115.
Garuglieri E, Meroni E, Cattò C, Villa F,
Cappitelli F, Erba D. Effects of Sub-
lethal concentrations of silver
nanoparticles on a simulated intestinal
prokaryotic–eukaryotic interface.
Frontiers in microbiology 2017; 8: 1-
13.
Jamal M, Hussain T, Das CR, Andleeb S.
Characterization of Siphoviridae phage
Z and studying its efficacy against
multidrug-resistant Klebsiella
pneumoniae planktonic cells and
biofilm. Journal of Medical
Microbiology 2015; 64: 454–462.
Martinez-Gutierrez F, Boegli L, Agostinho
A, Sanchez EM, Bach H, Ruiz F, James
G. Anti-biofilm activity of silver
nanoparticles against different
microorganisms. Biofouling 2013; 29:
651-660.
Melissa A, Jones M, Gunsolus IL, Murphy
CJ, Haynes CL. Toxicity of Engineered
Nanoparticles in the Environment.
Analytical Chemistry 2013; 85(6):
3036–3049.
Morones JR. The bactericidal effect of silver
nanoparticles. Journal of Nano-
technology 2005; 16(10): 2346-2353.
Nadell CD, Xavier JB, Foster KR. The
sociobiology of biofilms. FEMS
Microbiology Reviews 2 0 0 9 ; 3 3 (1 ) :
206-24.
Radzig MA, Nadtochenko VA, Koksharova
OA, Kiwi J, Lipasova VA,.Khmel IA.
Antibacterial effects of silver
nanoparticles on gram-negative
bacteria: Influence on the growth and
biofilms formation, mechanisms of
action. Colloids and Surfaces B:
Biointerfaces 2013; 102(1): 300-306.
Samarajeewa AD. Effect of silver nano-
particles on soil microbial growth,
activity and community diversity in a
sandy loam soil. Journal of
Environmental Pollution 2 0 1 7 ; 5 0 4 -
513.
Branda SS, Pastor JEG, Yehuda SB, Losick
R, Kolter R. Fruiting body formation
by Bacillus subtilis. Department of
Molecular and Cellular Biology 2001;
98(20): 11621–11626.
Yang Y, Alvarez PJJ. Sublethal
concentrations of silver nanoparticles
stimulate biofilm development.
Environmental Science and
Technology Letters 2015; 2(8): 221-
226.

Proceeding on the 5th EnvironmentAsia International Conference
13-15 June 2019, Convention Center, The Empress Hotel, Chiang Mai, Thailand
I-105
Comparison of water quality and caddisfly (Trichoptera)
communities between old and new reservoirs in Chiang Mai
university
Miatta Kiawu1, Terdthai Phutthanurak2, Pornpimon Buntha2, Decha
Thapanya2*
1Master’s Degree Program in Environmental Science, Environmental
Science Research Center, Faculty of Science, Chiang Mai University,
Chiang Mai, 50200, Thailand
2Department of Biology, Faculty of Science, Chiang Mai University, Chiang
Mai,50200, Thailand *Corresponding author: e-mail: [email protected]
ABSTRACT
Some physicochemical parameters and adult caddisfly specimens were
sampled using portable black light traps at Angkaew (approximately 50 years
old) and Tart Chompoo (3 years old) reservoirs, during October 2018 to
February 2019. Air and water temperature, pH, total dissolved solids,
electrical conductivity, biological oxygen demand, dissolved oxygen, and
wind speed were measured for 3 replications per site. Both reservoirs had the
significant difference (p< 0.05) of air and water temperature, pH, electrical
conductivity, total dissolved solids, orthophosphate, and wind speed. For
example, the mean values of electrical conductivity at Angkaew and Tart
Chompoo reservoirs were 116.4 and 226.0 µS cm-1 respectively. Angkaew
was significantly lower of pH than Tart Chompoo, which was 6.94 and 7.61
respectively. A total of 487 adult male caddisflies were collected from the
sampling sites representing 2 species, Dipseudopsis robustior and
Amphipsyche meridiana. D. robustior contained the highest number of species
at Angkaew reservoir (217 individuals, 44.6%); while Tart Chompoo
consisted of (143 individuals, 29.4%). On the other hand, A. meridiana

Proceeding on the 5th EnvironmentAsia International Conference
13-15 June 2019, Convention Center, The Empress Hotel, Chiang Mai, Thailand
I-106
contained (72 individuals, 14.7%) at Angkaew; and (55 individuals, 11.3%) at
Tart Chompoo reservoir. Results from correlation showed that air temperature,
is the physicochemical factor to affect the abundance of both caddisfly
species.
Keywords: water quality, Trichoptera, newly created reservoir
INTRODUCTION
Reservoirs, or dams, are man-made
bodies of open water serving as
public water supply sources, as
winter storage for crop irrigation or
as flood storage facilities. Reservoirs
are among the more useful means of
controlling the natural character of
water flows, instead of depending on
nature (Votruba, and Broža, 1989).
Aquatic habitats are greatly altered
by construction of reservoirs from
running rivers, to deep standing
waters which are not suitable for
original organisms (Thapanya et al.,
2013).
Trichoptera, or caddisfly are
holometabolous insects with aquatic
larvae, pupae, and terrestrial adults.
The order is the largest diverse insect
order presenting the aquatic
ecosystems. They include three
suborders: spicipalpia, annulipalpia
and intergripalpia each one
containing 4, 8, and 33 families,
respectively (Makekei-Ravasa et al.,
2013). A. meridiana belongs to the
family Hydropsychidae and is widely
distributed in the Oriental region
including Thailand. It is an aquatic
species that inhabits lake outlets; is
light brown to yellowish in color, and
can be distinguished under the
microscope by a black spot on the
wings. D. robustior is a species of
Trichoptera in the family
Dipseudopsidae which can also be
found in the Oriental area. It has a
chestnut brown color and the
genitalia of all species are totally
alike. Another distinguishing feature
is a tusk like organ in the mouth part
when viewing under the microscope.
The known caddisfly fauna of
Thailand includes, 1,004 species
belonging to 28 families

Proceeding on the 5th EnvironmentAsia International Conference
13-15 June 2019, Convention Center, The Empress Hotel, Chiang Mai, Thailand
I-107
(Chantaramongkol et al., 2010,
Malicky, 2010). Adults have been
studied widely because they are
easily collected by light traps. Genus
and species level identifications of
adult caddisflies are possible and
clearly produce more accurate results
than the family level identification,
thereby giving better ability to assess
the change of water quality (Prommi
et al., 2014). Previous studies on the
use of adult caddisflies as
bioindicator of water quality in
Thailand have been reported by
Chiabu, Laudee, Cheunbarn, and
Prommi and Thamsenanupap
(Prommi et al., 2014). Caddisflies
were chosen for this study because
they are usually more diverse than
other aquatic insect orders, and are
academically recognized as a good
indicator in aquatic ecosystem. The
objective of this study is to compare
the physicochemical parameters and
caddisfly communities between the
old and new reservoirs, in order to
provide knowledge on the properties
of water in the newly created
reservoir.
MATERIALS AND METHODS
2.1. Study site
The study was conducted at Angkaew
(18º48ʹ24ʹʹN, 98º56ʹ59ʹʹE) and Tart
Chompoo reservoir (18º48ʹ13ʹʹN,
98º56ʹ53ʹʹE) Chiang Mai University
campus. A total of 5 study sites were
located at both reservoirs, 3 at
Angkaew and 2 at Tart Chompoo.
Angkaew, the main reservoir which
is approximately more than 50 years
old can hold 300,000 cubic meters of
water and usually dries up during the
dry season; while Tart Chompoo, the
new reservoir is about 3 years old and
can hold up to 100,000 cubic meters
of water. The main source of water of
both reservoirs is Doi Suthep.
Angkaew reservoir receives water
from Huai Kaew and Kookaew
streams, whereas Tart Chompoo
receives water from Mae Ra Npong
stream and a household waste water
pipe that empties into the reservoir.
The substrate at Tart Chompoo is
rocky and consists mainly of stones
and sand, while on the other hand,
substrate at Angkaew is rather muddy
consisting of clay and silt. Both
reservoirs are characterized by

Proceeding on the 5th EnvironmentAsia International Conference
13-15 June 2019, Convention Center, The Empress Hotel, Chiang Mai, Thailand
I-108
human activities which has potential
for input of waste water run-off. At
each site, samples were collected
once every month from October 2018
to February 2019.
2.2. Physicochemical analysis
Some physicochemical parameters
such as air and water temperature,
pH, electrical conductivity, total
dissolved solids, dissolved oxygen,
biological oxygen demand, and wind
speed each had 3 replicates; while
other physicochemical parameters of
water quality at both reservoirs were
recorded at sampling sites. These
parameters include: pH, total
dissolved solids (TDS), and electrical
conductivity (EC), were measured
using the multi parameter analyzer.
Water and air temperature was
measured by means of a glass
thermometer, percentage humidity
was calculated using a wet and dry
thermometer; dissolved oxygen (DO)
and biological oxygen demand
(BOD) was measured using APHA
4500-O C Azide modification
method in laboratory. Ammonia-
nitrogen was determined by means of
Nessler method with powder pillows
using Hach DR 2000 Direct
Spectrophotometer, nitrate-nitrogen
by cadmium reaction method with
powder pillows using Hach DR
Direct Spectrophotometer; while
ortho-phosphate was measured by
PhosVer 3 (Ascorbic Acid) method
with powder pillows using Hach DR
2000 Direct Spectrophotometer.
Turbidity was also measured by the
Hach DR 2000 Direct
spectrophotometer using
absorptometric method, while wind
speed was determined using an
anemometer.
2.3. Adult Trichoptera collection
Adults were collected using portable
black light traps (12 volts DC
motorcycle batteries), and 10 watts
fluorescent tube suspended across a
pan containing water and detergent
solution. Light traps were set up
before sunset and collected the next
morning. Insects that were attracted
to the black light were collected in the
detergent solution and transferred
into 95% ethyl alcohol until sorting,
and later preserved in 80% ethyl
alcohol. Specimens were examined

Proceeding on the 5th EnvironmentAsia International Conference
13-15 June 2019, Convention Center, The Empress Hotel, Chiang Mai, Thailand
I-109
under a stereomicroscope, and adult
caddisfly males were used for making
species determinations. Identification
of species was carried out at the
species level using Malicky, 2010.
Species counts from collections were
later summed and recorded.
2.4. Data analysis
Paleontological Statistics
(Past3version 2.22) was used to
determine statistical differences
between the means of the five
sampling sites at both old and new
reservoirs.
RESULTS AND DISCUSSION
3.1. Physicochemical variables
Results of physicochemical
variables at Angkaew and Tart
Chompoo reservoirs are provided in
Table 1. Air and water temperature,
pH, electrical conductivity, total
dissolved solids, and orthophosphate;
with a physical parameter wind speed
were significantly different (p<0.05)
during the period of sampling;
whereas biological oxygen demand,
dissolved oxygen, percentage
humidity, ammonia- nitrate, nitrate-
nitrogen, orthophosphate, and
turbidity were not of significant
difference (p>0.05)
Table 1 Mean ± SD physicochemical water quality parameters at Angkaew
and Tart Chompoo reservoirs from October 2018 to February 2019
Phtsico-
chemical
Parameter
Angkaew Tart Chompoo
Oct Nov Dec Jan Feb Oct Nov Dec Jan Feb
Avg ± SD
Ang Tart
Air temperature
(ºC)
33.0
±0.0
30.0
±1.9
25.1
±8.8
29.3
±0.5
34.0
±0.1
27.0
±3.5
26.5
±0.0
24.7
±0.7
27.4
±0.3
33.2
±0.1
30.3
±3.51
27.7
±3.22*
Water
temperature
(ºC)
31.7
±0.6
26.4
±1.9
24.7
±2.0
23.9
±1.4
25.3
±1.8
32.0
±0.0
26.0
±1.1
26.6
±1.1
25.7
±1.6
26.7
±0.3
26.4
±3.09
27.4
±2.61*
pH 9.05
±0.09
5.71
±3.52
6.36
±3.27
6.16
±3.12
7.40
±0.21
9.08
±0.10
6.21
±3.87
7.06
±3.14
7.04
±3.12
8.64
±0.06
6.94
±1.34
7.61
±1.20*
Electrical
Conductivity
(µS/cm)
87.0
±3.2
123.9
±75.9
115.9
±72.2
113.7
±65.4
141.4
±100.5
175.7
±1.5
162.8
±22.1
174.0
±15.7
297.8
±115.6
319.
±136.0
116.4
±19.72
226
±76.04*
Total Dissolved
Solids
(mg/l)
46.9
±3.5
67.0
±41.7
61.5
±38.6
61.4
±35.2
73.0
±51.0
92.7
±0.6
88.0
±11.3
93.5
±9.0
158.7
±61.7
172.5
±76.4
62.0
±9.66
121.1
±40.98*

Proceeding on the 5th EnvironmentAsia International Conference
13-15 June 2019, Convention Center, The Empress Hotel, Chiang Mai, Thailand
I-110
Dissolved
Oxygen (mg/l)
11.7
±0.3
5.5
±3.6
7.5
±4.8
7.5
±5.6
8.3
±2.2
10.6
±0.4
5.6
±3.5
6.9
±3.1
6.9
±3.1
9.6
±1.7
8.1
±2.2
7.9
±2.1
Biological
Oxygen
Demand (mg/l)
2.5
±0.1
3.2
±2.0
4.46
±2.8
2.9
±2.2
6.1
±1.3
2.7
±0.4
2.7
±1.7
2.9
1.3)
3.0
±1.4
5.4
±1.2
3.8
±1.5
3.3
±1.1
Percentage
Humidity
“-“ 75.0
±4.2
70.0
±0.0
48.2±
39.5
40.7±
10.8
“-“ 81.5±
3.5
91
±0.0
61.2±
12.5
39.1±
8.5
58.5±
16.6
68.2
±23.0
Ammonia
Nitrate (mg/l)
N NH3 Ness
0.05 0.12 0.11 0.42 0.57
0.07 0.09 0.09 0.38 0.41
0.25
±0.23
0.21
±0.17
Nitrate
Nitrogen (mg/l)
N NO3- H
1.6 1.9 2.1 3.5 3.2 2.4 1.9 2.6 1.9 2.7 2.5
±0.8
2.3
±0.4
Ortho
Phosphate
(mg/l) PO43- PV
0.22 0.20 0.25 0.30 0.32 0.15 0.24 0.16 0.24 0.27 0.26
±0.05
0.21
±0.05*
Turbidity
(FTU)
16.67
±1.53
2.50
±4.28
3.44
±5.46
3.56
±5.81
7.67
±3.79
20
±1.00
7.50
±3.54
9.50
±2.12
10.50
±0.71
4.50
±2.12
6.77
±5.88
10.40
±5.84
Wind speed
(m/s)
“-“ “-“ 1.48
±0.40
1.91
±1.00
2.65
±0.54
“-“ “-“ 0.66
±0.39
0.90
±0.40
1.98
±0.24
2.01
±0.59
1.18
±0.70*
*: Indicates significant difference (p<0.05), PAST
Ang: Angkaew and Tart: Tart chompoo
The average air temperature at both
study areas were significantly
different (p<0.05). Angkaew
reservoir had an average temperature
of 30.3 ºC. The highest average
temperature was 34.0 ºC in February
2019, while the lowest was 25.1 ºC in
December 2018. Tart Chompoo
reservoir had an average temperature
of 27.7 ºC. The highest average air
temperature in February 2019 was
33.2 ºC, and lowest of 24.7 ºC in
December 2018.
Average water temperature at all sites
were significantly different (p<0.05).
The average temperature at Angkaew
reservoir was 26.4 ºC. The highest
temperature was observed in October
which was 31.7 ºC; while the lowest
was 23.9 ºC in January 2019. On the
other hand, the average water
temperature at Tart Chompoo was
27.4 ºC. The month of October 2018
had the highest temperature which
was 32.0 ºC, while a lower
temperature of 25.7 ºC was observed
in January 2019.
pH was significantly different at both
study areas (p<0.05). The average pH
at Angkaew reservoir was 6.94; with
highest average of 9.05 in October
2018, and lowest of 5.71 in

Proceeding on the 5th EnvironmentAsia International Conference
13-15 June 2019, Convention Center, The Empress Hotel, Chiang Mai, Thailand
I-111
November 2018. At the same time,
the average pH at Tart Chompoo was
7.61. the highest average was 9.08 in
October 2018, while the lowest was
6.21 in November 2018.
The average electrical conductivity at
both reservoirs was significantly
different (p<0.05). Angkaew
reservoir showed average value of
116.4 µS/cm. February 2019 had the
highest value of 141.4µS/cm, and a
low value of 87.0 µS/cm in October.
Tart Chompoo had an average
electrical conductivity of 226.0
µS/cm; with highest average of 319.5
µS/cm in February 2019, and lowest
of 162.8 µS/cm in November 2018.
The phenomenon of higher electrical
conductivity was observed at Tart
Chompoo because sediment at this
reservoir is made of stone, which
might have basic properties that can
cause higher conductivity. Moreover,
there was some contamination from
dissolved ions.
Orthophosphate was significantly
different at both sites (p<0.05).
Angkaew reservoir had an average of
0.26 mg/l, whereas Tart Chompoo
had an average value of 0.21 mg/l.
The average total dissolved solids at
both study areas was significantly
different (p<0.05). Angkaew
reservoir had an average total
dissolved solids of 62.0 mg/l. The
highest value was 73.0 mg/l in
February 2019, while the lowest was
46.9 mg/l in October 2018. Tart
Chompoo reservoir’s average total
dissolved solids was 121.1 mg/l; with
the highest value of 172.5 mg/l in
February 2019, and lowest of 88.0
mg/l in November 2018.
The average physical parameter of
wind speed was significantly
different (p<0.05). The average at
Angkaew reservoir was 2.01 m/s;
with the highest of 2.65 m/s in
February 2019, and the lowest of 1.48
m/s in December 2018.
On the overall, Tart Chompoo
reservoir showed higher average
mean values for water temperature,
pH, electrical conductivity, and total
dissolved solids than Angkaew,
indicating that Tart Chompoo is
hotter than Angkaew reservoir. This

Proceeding on the 5th EnvironmentAsia International Conference
13-15 June 2019, Convention Center, The Empress Hotel, Chiang Mai, Thailand
I-112
can be due to the lack of vegetation,
native trees and shrubs around the
reservoir, which provide shade and
help reduce extreme temperature.
High electrical conductivity was
observed at Tart Chompoo due to
elevated temperatures owing to the
fact that electrical conductivity is
dependent on temperature. Even
though in the case of this study it is
expected that Angkaew which is the
older reservoir, should be more stable
than Tart Chompoo the new reservoir
in terms of water quality and
biodiversity. Environmental factors
such as clearing of vegetation, waste
water run-off, and eutrophication
which leads to algae bloom are
among the main factors affecting the
biodiversity and water quality of both
reservoirs regardless of their ages.
The number of caddisfly diversity
found in this study were far less than
that of previous studies. For example,
Prommi and Thani, 2014. This is
because most caddisfly species are
known to proliferate in lotic than
lentic ecosystems.
3.2. Adult caddisflies survey
A total of 487 adult Trichoptera
representing 2 species; Dipseudopsis
robustior ULMER 1929 and
Amphipsyche meridian ULMER
1909 were collected by light traps
(Fig. 1). D. robustior showed the
greatest number of individuals
(73.9%, 360 individuals) at both
reservoirs; whereas A. meridian
showed a lower amount of
individuals (26.1%, 127 individuals),
therefore making D. robustior a high
abundance species and Angkaew
reservoir the site with higher
abundance. During the course of the
study October and November were
months of high abundance for both
species; while on the other hand,
December- February were months of
low abundance which can be
associated with seasonal changes.
Another reason for low abundance at
Tart Chompoo reservoir is the
construction of street lights which

Proceeding on the 5th EnvironmentAsia International Conference
13-15 June 2019, Convention Center, The Empress Hotel, Chiang Mai, Thailand
I-113
attracted more caddisflies than the
light trap.
Figure 1 Overall number of individual caddisfly species collected at Angkaew
and Tart Chompoo reservoirs during October 2018 to February 2019.
3.3. The correlation between
Trichoptera species and
physicochemical variables
Pearson’s correlation coefficient (r)
relationship between Trichoptera and
physicochemical variables are shown
in Table 2.
Correlation values between the range
of 0.000- 0.299 are considered weak,
0.300-0.499 moderate, and 0.500-
1.000 strong (Bootdee et al., 2016).
Both Amphipsyche meridiana and
Dipseudopsis robustior exhibited a
positive correlation with all
parameters. There was a weak
correlation with A. meridian and
water temperature, biological oxygen
demand, ammonia-nitrate, nitrate-
nitrogen, orthophosphate, turbidity,
and wind speed. This finding
corresponds with results from
(Prommi and Thani, 2014) which
proposed A. meridiana as a taxon
intolerant to ammonia-nitrogen,
nitrate-nitrogen, orthophosphate, and
020406080
100120140160
Oct
ob
er
No
vem
ber
Dec
em
ber
Jan
uar
y
Feb
ruar
y
Oct
ob
er
No
vem
ber
Dec
em
ber
Jan
uar
y
Feb
ruar
y
Tota
l po
pu
lati
on
Angkaew reservoir Tart Chompoo reservoir
po
pula
tio
n
Caddisfly population graph
D.robustior A.meridiana

Proceeding on the 5th EnvironmentAsia International Conference
13-15 June 2019, Convention Center, The Empress Hotel, Chiang Mai, Thailand
I-114
turbidity of water as seen in this
study. There was a strong correlation
between air temperature, and A.
meridian. Other parameters such as:
pH, electrical conductivity, total
dissolved solids, dissolved oxygen,
and percentage humidity had a
moderate correlation. On the other
hand, D. robustior had a weak
correlation with water temperature,
pH, electrical conductivity, total
dissolved solids, dissolved oxygen,
biological oxygen demand,
ammonia-nitrate, nitrate-nitrogen,
turbidity, and wind speed. Air
temperature, percentage humidity,
and orthophosphate had a moderate
correlation. There was no strong
correlation found to exist between D.
robustior and any parameter.
The present study shows that higher
air was the suitable condition for the
flight of A. meridian, while
orthophosphate appears to
moderately affect the population of
D. robustior. The high
orthophosphate levels were found
during October 2018, December
2018, and February 2019 at Angkaew
reservoir which was concurrent to the
high population of emerging adult
caddisfly especially in October 2018.
The concentrations of phosphate in
Angkaew reservoir were higher than
that of Tart Chompoo.
Orthophosphate concentrations at
Tart Chompoo were close to the
concentration of orthophosphate in
natural stream such as headwater
stream of Mae Ngat Dam, Chiang
Mai (Thapanya et al., 2013).
Therefore, phosphate concentrations
should be monitored on a long-term
basis in order to keep the water
quality of both reservoirs in the good
condition

Proceeding on the 5th EnvironmentAsia International Conference
13-15 June 2019, Convention Center, The Empress Hotel, Chiang Mai, Thailand
I-115
Table 2 Pearson’s correlation between parameters of water quality and
Trichoptera species during sampling interval at Angkaew and Tart Chompoo
reservoirs.
Parameters Amphipsyche
Meridian
Dipseudopsis robustior
Air temperature 0.79636* 0.47081
Water temperature 0.034341 0.0018
pH 0.4941 0.093957
Electrical conductivity 0.34622 0.21558
Total dissolved solids 0.34898 0.21774
Dissolved oxygen 0.43939 0.037601
Biological oxygen demand 0.172 0.077712
Percentage humidity 0.43681 0.37992
Ammonia nitrogen 0.089397 0.085645
Nitrate nitrogen 0.18841 0.11357
Orthophosphate 0.072772 0.31767
Turbidity 0.077837 0.019921
Wind speed 0.053121 0.11437
*: Indicates strong correlation, PAST
CONCLUSION
The physicochemical parameters that
were of significant difference
(p<0.05) are: air and water
temperature, pH of water, electrical
conductivity, orthophosphate, and
wind speed; while dissolved oxygen,
biological oxygen demand speed;
percentage humidity, ammonia
nitrogen, nitrate nitrogen,
orthophosphate, and turbidity were
not significantly different (p>0.05).
From results gathered throughout the
study, there was a total of 487
caddisflies representing 2 species

Proceeding on the 5th EnvironmentAsia International Conference
13-15 June 2019, Convention Center, The Empress Hotel, Chiang Mai, Thailand
I-116
that were collected at Angkaew and
Tart Chompoo reservoirs from
October 2018 to February 2019. A.
meridian increased when the air
temperature increased. Other
physicochemical factors such as pH,
electrical conductivity, total
dissolved solids, dissolved oxygen,
and percentage humidity also affect
the above mentioned species. On the
other hand, D. robustior was affected
by air temperature, percentage
humidity and orthophosphate; and
intolerant to water temperature, pH,
electrical conductivity, total
dissolved solids, dissolved oxygen,
biological oxygen demand,
ammonia-nitrate, nitrate-nitrogen,
turbidity, and wind speed. It may be
preferable to use a single insect order
for adult bio monitoring. Caddisfly
(Trichoptera) are an ideal taxon since
they can be found in many types of
aquatic ecosystems, and can be
sampled without much effort and
difficulty.
ACKNOWLEDGEMENT
We thank Thailand International
Cooperative Agency (TICA) for
financial support, Aquatic Insect
Research Lab, Faculty of Science,
Department of Biology, Chiang Mai
University, and Environmental
Science Research
Center, Faculty of Science, Chiang
Mai University, Chiang Mai.
REFERENCES
American Public Health Association, and
American Water Works Association.
(1989). Standard methods for the
examination of water and wastewater.
American public health association.
Bootdee, S., Chantara, S., and Prapamontol,
T. (2016). Determination of PM2. 5
and polycyclic aromatic hydrocarbons
from emission burning for health risk
assessment. Atmospheric Pollution
Research, 7 (4), 680-689.
Chantaramongkol, P., Thapanya, D., and
Bunlue, P. (2010). The Aquatic Insect
Research Unit (AIRU) of Chiang Mai
University, Thailand, with an updated
list of the Trichoptera species of
Thailand. Denisia, 29, 55-79.
Malekei-Ravasan, N., Bahrami, A.,
Shayeghi, M., Oshaghi, M. A., Malek,
M., Mansoorian,. A. B., and
Vatandoost, H. (2013). Notes on the
Iran Caddisflies and role of

Proceeding on the 5th EnvironmentAsia International Conference
13-15 June 2019, Convention Center, The Empress Hotel, Chiang Mai, Thailand
I-117
Annulipalpian hydropsychid
Caddisflies as a bio-monitoring agent.
Journal of arthropod-borne diseases,
7(1), 71.
Malicky, H. (2010). Atlas of Southeast Asian
Trichoptera, Biology Department,
Science Faculty, Chiang Mai
University
Prommi, T. O., Laudee, P., and
Chareonviriyaphap, T. (2014).
Biodiversity of adult Trichoptera and
water quality variables in streams,
northern Thailand. APCBEE
procedia, 10, 292-298.
Prommi, T. O., and Thani, I. (2014).
Diversity of trichoptera fauna and its
correlation with water quality
parameters at Pasak Cholasit reservoir,
Central Thailand. Environment and
Natural Resources Journal, 12(2), 35-
41.
Thapanya, D., Bunlue, P., and
Chantaramongkol, P. (2013). Adult
caddisfly assemblages from upstream
and downstream of the Mae Ngat Dam,
Chiang Mai, northern Thailand.
In Proceedings of the 1st Symposium of
Benthological Society of Asia.
Scientific Research Society of Inland
Water Biology, Sakai, Osaka, Japan.
Biology of Inland Waters (Vol. 2, pp.
151-156).
Votruba, L., and Broža, V. (1989). Water
management in reservoirs (Vol. 33).
Elsevier.
Proceeding on the 5th EnvironmentAsia International Conference
13-15 June 2019, Convention Center, The Empress Hotel, Chiang Mai, Thailand
I-118
Determination of profenofos and cypermethrin in
Chinese kale using a modified quick, easy, cheap,
effective, rugged and safe method with Fe3O4 magnetic
nanoparticles
Nipawan Phosri1 and Thitiya Pung2*
1Graduate student in Chemistry Department, Faculty of Liberal Arts and
Science, Kasetsart University, Kamphaeng Saen Campus, Nakhon Pathom,
73140 Thailand
2Chemistry Department, Faculty of Liberal Arts and Science, Kasetsart
University, Kamphaeng Saen Campus, Nakhon Pathom, 73140 Thailand
Correspondig author: e-mail: [email protected]
ABSTRACT
A modified quick, easy, cheap, effective, rugged and safe (QuEChERS) sample
preparation with Fe3O4 magnetic nanoparticles ( MNPs) was established to
determine profenofos and cypermethrin in Chinese kale. The magnetic
nanoparticles have excellent function as adsorbents and fast separated from the
extract. Fe3O4 MNPs were synthesized by co-precipitation of FeCl3.6H2O and
FeCl2.4H2O. Sample extracts were analyzed by HPLC-UV with C18 column
( 2 5 mm× 4 . 6 mm, 5 . 0 m) at 219 nm. The extractions of profenofos and
cypermethrin with MNPs 40 mg and without MPNs gave similar recoveries
and RSDs. The amounts of Fe3O4 MNPs were investigated and found that the
optimum amount of Fe3O4 MNPs was 20 mg. Moreover, the recoveries and
precisions of profenofos and cypermethrin were evaluated by spiking with the
concentrations of 0. 5, 1. 0 and 2. 0 mg/ kg and they were in the range 100. 37-
102.58% and 98.86-102.04%, respectively, with relative standard deviations
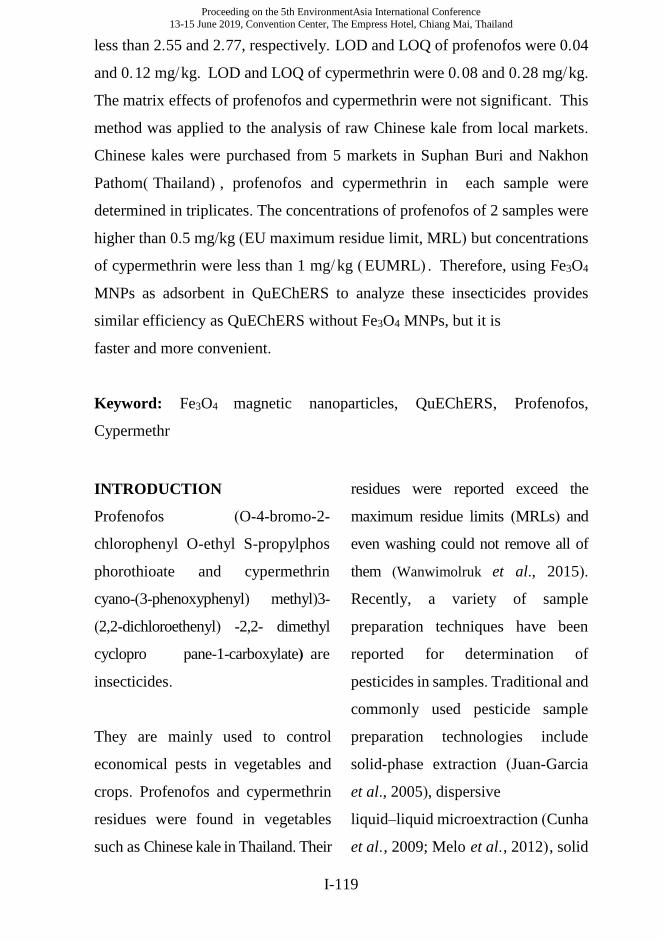
Proceeding on the 5th EnvironmentAsia International Conference
13-15 June 2019, Convention Center, The Empress Hotel, Chiang Mai, Thailand
I-119
less than 2.55 and 2.77, respectively. LOD and LOQ of profenofos were 0.04
and 0.12 mg/kg. LOD and LOQ of cypermethrin were 0.08 and 0.28 mg/kg.
The matrix effects of profenofos and cypermethrin were not significant. This
method was applied to the analysis of raw Chinese kale from local markets.
Chinese kales were purchased from 5 markets in Suphan Buri and Nakhon
Pathom( Thailand) , profenofos and cypermethrin in each sample were
determined in triplicates. The concentrations of profenofos of 2 samples were
higher than 0.5 mg/kg (EU maximum residue limit, MRL) but concentrations
of cypermethrin were less than 1 mg/ kg ( EUMRL) . Therefore, using Fe3O4
MNPs as adsorbent in QuEChERS to analyze these insecticides provides
similar efficiency as QuEChERS without Fe3O4 MNPs, but it is
faster and more convenient.
Keyword: Fe3O4 magnetic nanoparticles, QuEChERS, Profenofos,
Cypermethr
INTRODUCTION
Profenofos (O-4-bromo-2-
chlorophenyl O-ethyl S-propylphos
phorothioate and cypermethrin
cyano-(3-phenoxyphenyl) methyl)3-
(2,2-dichloroethenyl) -2,2- dimethyl
cyclopro pane-1-carboxylate) are
insecticides.
They are mainly used to control
economical pests in vegetables and
crops. Profenofos and cypermethrin
residues were found in vegetables
such as Chinese kale in Thailand. Their
residues were reported exceed the
maximum residue limits (MRLs) and
even washing could not remove all of
them (Wanwimolruk et al., 2015).
Recently, a variety of sample
preparation techniques have been
reported for determination of
pesticides in samples. Traditional and
commonly used pesticide sample
preparation technologies include
solid-phase extraction (Juan-Garcia
et al., 2005), dispersive
liquid–liquid microextraction (Cunha
et al., 2009; Melo et al., 2012), solid

Proceeding on the 5th EnvironmentAsia International Conference
13-15 June 2019, Convention Center, The Empress Hotel, Chiang Mai, Thailand
I-120
phase microextraction ( Rodrigues et
al. , 2011; Song et al. , 2013) and
matrix solid- phase dispersion ( Silva
et al., 2008) have been used to extract
pesticide residues. However, these
methods have some drawback such as
time consuming and/ or labor
intensive, expensive and consume a
large volume of solvent.
QuEChERS method was first
reported in 2003 ( Anastassiades et
al. , 2003) . The method involves an
initial extraction with solvent
followed by cleanup steps: using
dispersive adsorbents such as
anhydrous magnesium sulphate,
primary secondary amine ( PSA) ,
graphitised carbon black ( GCB) .
Currently, QuEChERS is a popular
sample preparation technique for
determination of pesticide (Heidari et
al. , 2012; Lehotay et al. , 2010;
Fernandes et al. , 2018) . Due to
QuEChERS has several advantages
and easy for modification.
Magnetic nanoparticles ( MNPs) are
applied as adsorbents and can easily
be separated out from sample extract
by magnetic field. Wu et al. ( 2011)
used a graphene- based magnetic
nanocomposite as an effective
adsorbent for the pre- concentration
of five carbamate pesticides in
environmental water samples.
Heidari and Razmi ( 2012) used
carbon coated Fe3O4 nanoparticles
for the determination of some
organophosphorus pesticides in
aquatic samples. Deng et al. ( 2014)
used multi- walled carbon- nanotube
MNPs to analyze eight pesticide
residues in tea samples. Moreover,
bare MNPs were modified with
QuEChERS method for
determination of multiple pesticides
in fruits and vegetables and analyzed
by GC-tandom-MS (Li et al., 2014).
In this study, bare Fe3O4 MNPs were
synthesized by co- precipitation and
used as co- adsorbent in QuEChERS
for the determination profenofos and
cypermethrin in Chinese kale and
analysis by HPLC-UV (Harshit et al. ,
2017) . We modified HPLC- UV to
determine profenofos and
cypermethrin because HPLC – UV is
common use in laboratory.

Proceeding on the 5th EnvironmentAsia International Conference
13-15 June 2019, Convention Center, The Empress Hotel, Chiang Mai, Thailand
I-121
METHODOLOGY
2.1 Material
Standard solutions of profenofos
( 99. 7% ) and cypermethrin ( 99% )
were purchased from Sigma- Aldrich
Supelco ( Sigma- Aldrich Corp. ,
USA) . Primary secondary amine
( PSA, particle size 40 μm) and
graphitised carbon black (GCB) was
purchased from Agilent
Technologies. Ferric
chloride(FeCl3·6H2O, ferrous
chloride(FeCl2·4H2O, sodium
chloride( NaCl) and anhydrous
magnesium sulphate(MgSO4) were
purchased from QRëc. Fe3O4
magnetic nanoparticle powders
(MNPs) ( size 50-100 nm (by SEM)
97% were purchased from Sigma-
Aldrich Supelco ( Sigma- Aldrich
Corp. , USA) . Acetonitrile and
methanol were HPLC grade and
obtained from Daejung
Chemicals&Metals Co. LTD.
Working standards of pesticides were
prepared with acetonitrile at a
concentration of 100 µg/mL.
A centrifuge ( Hitachi, high- speed
refrigerated centrifuge) from Hitachi
Centrifuge Instrument Co. , Ltd.
( China) was used for precipitation.
Vortex Mixer (VM-10) was obtained
from Witeg Co. , Ltd. The grinder
( SJ303- 250) was obtained from
Supor Co., Ltd.
2. 2 Preparation of Fe3O4 magnetic
nanoparticles
MNPs were synthesized by co-
precipitation method. Briefly,
FeCl3·6H2O and FeCl2·4H2O ( Li et
al. , 2014) . were dissolved in
deionized water ( 100 mL) in a 250-
mL erlenmayer flask. After that, 110
mL of ammonia were added and
stirred in an oil bath at 80 ˚C for 3 h.
The MNPs were magnetically
collected and washed with 100 mL of
deionized water for three times, and
then washed with ethanol. Finally,
they were dried in oven at 55 C for
12 h.
2.3 Sample preparation
A schematic of developed sample
preparation based on the proposed
QuEChERS method is shown in

Proceeding on the 5th EnvironmentAsia International Conference
13-15 June 2019, Convention Center, The Empress Hotel, Chiang Mai, Thailand
I-122
Figure 1. Chinese kales were cut into
small pieces and comminuted with an
electric grinder to achieve good
sample homogeneity.
The homogenized sample ( 10. 0 g)
was weighed into a centrifuge tube
( 50 mL) and appropriate volumes of
pesticide standards were added. The
sample was extracted with 10 mL
acetonitrile and the centrifuge tube
was shaken vigorously for 30 s. Then,
4. 0 g anhydrous MgSO4 and 1. 0 g
NaCl were added and shaken
vigorously for 30 s. After that, the
extract was centrifuged for 5 min at
6000 rpm, the supernatant ( 1. 0 mL)
was transferred to an Eppendorf vial
( 1. 5 mL) that containing 150 mg
anhydrous MgSO4, 7. 5 mg GCB, 50
mg PSA and 40 mg MNPs (optimized
condition) . The mixture was shaken
vigorously for 60 s and the
supernatant was collected with the
aid of an external magnet. The final
sample extract was injected to HPLC-
UV.
Figure 1 Schematic of developed sample preparation. Fe3O4 magnetic
nanoparticles ( Fe3O4 MNPs) ; graphitised carbon black ( GCB) ; primary
secondary amine (PSA)

Proceeding on the 5th EnvironmentAsia International Conference
13-15 June 2019, Convention Center, The Empress Hotel, Chiang Mai, Thailand
I-123
2. 4 Instrumentation and analytical
conditions
PSA, GCB, MNPs were examined by
a Field Emission Transmission
Electron Microscope ( FE- SEM) for
their morphology characterization.
Analysis of pesticides was performed
by high- performance liquid
chromatography (HPLC) Hitachi CM
5000 connected to UV detector. ACE
Generix 5 C-18 column (250 mm, 4.6
mm, 5) was used and column
temperature was maintained at 25˚C.
The injected sample volume was 20
µL. The isocratic mobile phase
consisted of acetonitrile: water
( 74: 26, v/ v) . Flow rate of mobile
phase was 1 mL/min. The eluent was
monitored using UV detector at a
wavelength of 219 nm.
RESULTS AND DISCUSSION
3.1 Characterization of materials
Micro-morphologies of PSA, GCB,
MNPs were investigated by FE-SEM
( Figure 2a– c) . PSA had nearly
irregular shape and its size is about
40- 50 m. GCB and MNPs have
smaller sizes about 20-50 nm.
Figure 2 The FE-SEM of the adsorbents. The scale bar represents 100 nm,
(a) Fe3O4 magnetite nanoparticles (MNPs); (b) GCB; (c) PSA
(d)
(a)
(c)
(a) (b)
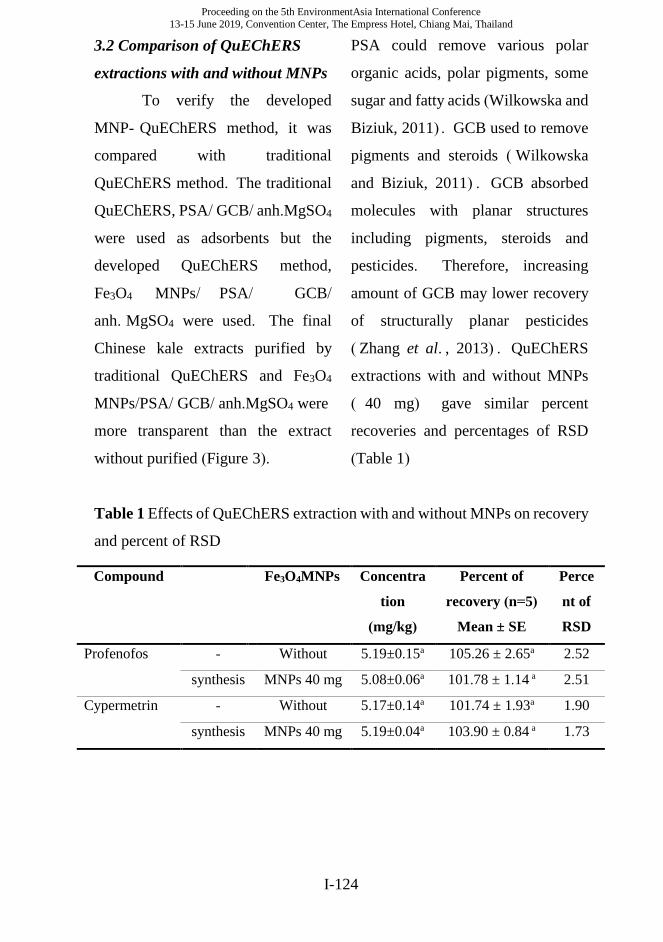
Proceeding on the 5th EnvironmentAsia International Conference
13-15 June 2019, Convention Center, The Empress Hotel, Chiang Mai, Thailand
I-124
3.2 Comparison of QuEChERS
extractions with and without MNPs
To verify the developed
MNP- QuEChERS method, it was
compared with traditional
QuEChERS method. The traditional
QuEChERS, PSA/ GCB/ anh.MgSO4
were used as adsorbents but the
developed QuEChERS method,
Fe3O4 MNPs/ PSA/ GCB/
anh. MgSO4 were used. The final
Chinese kale extracts purified by
traditional QuEChERS and Fe3O4
MNPs/PSA/ GCB/ anh.MgSO4 were
more transparent than the extract
without purified (Figure 3).
PSA could remove various polar
organic acids, polar pigments, some
sugar and fatty acids (Wilkowska and
Biziuk, 2011) . GCB used to remove
pigments and steroids ( Wilkowska
and Biziuk, 2011) . GCB absorbed
molecules with planar structures
including pigments, steroids and
pesticides. Therefore, increasing
amount of GCB may lower recovery
of structurally planar pesticides
( Zhang et al. , 2013) . QuEChERS
extractions with and without MNPs
( 40 mg) gave similar percent
recoveries and percentages of RSD
(Table 1)
Table 1 Effects of QuEChERS extraction with and without MNPs on recovery
and percent of RSD
Compound Fe3O4MNPs Concentra
tion
(mg/kg)
Percent of
recovery (n=5)
Mean ± SE
Perce
nt of
RSD
Profenofos - Without 5.19±0.15a 105.26 ± 2.65a 2.52
synthesis MNPs 40 mg 5.08±0.06a 101.78 ± 1.14 a 2.51
Cypermetrin - Without 5.17±0.14a 101.74 ± 1.93a 1.90
synthesis MNPs 40 mg 5.19±0.04a 103.90 ± 0.84 a 1.73

Proceeding on the 5th EnvironmentAsia International Conference
13-15 June 2019, Convention Center, The Empress Hotel, Chiang Mai, Thailand
I-125
Figure 3 Photography of clean- up performance by different DSPE
adsorbents: (a) 1 mL Chinese kale extracts without DSPE clean-up; (b) 1
mL Chinese kale extracts with DSPE clean-up by 150 mg anh.MgSO4, 7.5
mg GCB 50 mg PSA and without Fe3O4 MNPs; ( c) 1 mL Chinese kale
extracts with DSPE clean-up by 150 mg anh.MgSO4, 7.5 mg GCB and 50
mg PSA and 40 mg Fe3O4 MNPs.
3. 3 Optimization of the amount of
Fe3O4 MNPs adsorbents
The amount of Fe3O4 MNPs was
optimized by using 1 mL of the
Chinese kale sample extract at the
spiked profenofos and cypermethrin
of 5 mg/ kg. The adsorbents were 50
mg PSA, 7. 5 mg GCB and different
amounts of Fe3O4 MNPs (20, 30, 40
and 50 mg) . As shown in Figure 4
when the amount of Fe3O4 MNPs
increased between 20– 50 mg, the
recoveries of both pesticides have no
obvious difference. Therefore, the
amount of MNPs would be set at 20
mg.
c b a
Magn
etic

Proceeding on the 5th EnvironmentAsia International Conference
13-15 June 2019, Convention Center, The Empress Hotel, Chiang Mai, Thailand
I-126
Figure 4 Effect of mass of Fe3O4 on the extraction efficiency of profenofos
and cypermethrin (5 mg/ kg).
4. Method validation
4.1 Accuracy and precision
We spiked profenofos and
cypermethrin into Chinese kale at
0. 5, 1. 0 and 2. 0 mg/ kg, and each
concentration was tested in five
replicates. Recoveries of profenofos
and cypermethrin were obtained by
comparing the amount calculated
from the calibration curves with the
corresponding spiked amount.
The recoveries of profenofos and
cypermethrin were in the range
100. 37- 102. 58% and 98. 86-
102. 04% , respectively, with relative
standard deviations less than 2.55 and
2. 77, respectively ( Table 2) . The
recoveries were in the range of 80-
120 % , their accuracies could be
accepted (AOAC, 2002. The relative
standard deviations were less than
10% indicated that their precision
were accepted (AOAC, 2002)
50
60
70
80
90
100
110
0 20 40
% R
ecover
y
Fe3O4 (mg)
Obtimization of mg of Fe3O4 (S)
Profenofos
cypermetrin
Proceeding on the 5th EnvironmentAsia International Conference
13-15 June 2019, Convention Center, The Empress Hotel, Chiang Mai, Thailand
I-127
Table 2 Recoveries and repeatability (RSD) obtained from profenofos and
cypermetrin spiked in Chinese kale.
Table 3 LOD and LOQ obtained from profenofos and cypermetrin
spiked in Chinese kale.
4.2 LOD and LOQ
The sensitivity of method was
estimated by examining the LOD
and LOQ. LOD was defined as the
lowest detectable concentration with a
signal-to-noise ratio of at least 3. LOQ
was defined as the lowest quantifiable
concentration with a signal-to-noise
ratio of at least 10. LOD and LOQ of
profenofos were 0.04 and 0.12 mg/kg.
LOD and LOQ of cypermethrin were
0.08 and 0.28 mg/kg (Table 3). LOQs
of profenofos and cypermethrin
were less than MRLs (0.5 ppm and
1. 0 ppm, respectively) . The
developed method had sufficient
sensitivity.
Insecticide 0.5
(mg/kg)
1.0
(mg/kg)
2.0
(mg/kg)
%
recovery
%RSD % recovery %RSD %
recovery
%RSD
Profenofos 102.58 2.55 101.18 2.46 100.37 1.24
Cypermetrin 102.04 2.77 101.16 1.92 98.86 1.37
Compound LOD
(mg/kg)
LOQ
(mg/kg)
MRLs
(mg/kg)
Profenofos 0.04 0.12 0.5
Cypermetrin 0.08 0.26 1

Proceeding on the 5th EnvironmentAsia International Conference
13-15 June 2019, Convention Center, The Empress Hotel, Chiang Mai, Thailand
I-128
4.2 Matrix effect
Chinese kale has high amounts
of pigments such as chlorophyll,
carotenoids, and lycopene.
Matrix components can interact
with active sites in the column or
they can reduce signals, given by
analytes when they reach the
detector. Therefore, matrix effects
were analyzed. A comparison
between the calibration equations
obtained from
standards dissolved in solvent and
matrix- matched standards was
performed ( Zhao et al. , 2012) .
Percent of matrix effects of
prophenofos and cypermethrin
were -0.81and 6.87 (Figure 5). The
clean- up step was efficiency
because of matrix effect were
within ±10%. Therefore, the matrix
effects of profenofos and
cypermethrin were not significant.
Figure 5 Matrix effect (ME) in Chinese kale : superposition of solvent
and matrix curves of profenofos(a) and cypermetrin (b). Distribution of
percent of ME for profenofos and cypermetrin in Chinese kale (c)
-10.00
-5.00
0.00
5.00
10.00
profenofos cypermetrin
%M
E
matrix effect
y = 32485x - 500.04R² = 0.9995
y = 32221x + 2266.1R² = 0.9973
0
20000
40000
60000
80000
100000
0 0.5 1 1.5 2 2.5 3
Peak
are
a
concentration.(ppm)
profenofossolvent
matrix
y = 39523x - 1268.5
R² = 0.9997
y = 42237x - 6294.4
R² = 0.9977
0
20000
40000
60000
80000
100000
120000
0 0.5 1 1.5 2 2.5 3
Peak
are
a
concentration.(ppm)
cypermetrin
solvent
matrix
(c)
(a) (b)

Proceeding on the 5th EnvironmentAsia International Conference
13-15 June 2019, Convention Center, The Empress Hotel, Chiang Mai, Thailand
I-129
4.3 Application to commercial
Chinese kale samples
This method was applied to the
analysis of raw Chinese kale from
local markets. Chinese kales were
purchased from 5 markets in Suphan
Buri and Nakhon Pathom ( Thailand)
and profenofos and cypermethrin in
each sample were determined in
triplicates. The concentrations of
profenofos of 2 samples in Nakhon
Pathom were higher than 0. 5 mg/ kg
( EU MRL) but concentrations of
cypermethrin in all samples were less
than 1 mg/kg (Figure 6) which is EU
MRL.
Figure 6 Concentrations of profenofos and cypermetrin in raw Chinese kale
samples from local markets. (Su1= Suphan Buri(1) , Su2= Suphan Buri(2) ,
Np1=Nakhon Pathom(1), Np2=Nakhon Pathom(2), Np3=Nakhon Pathom(3
CONCLUSIONS
In this study, bare Fe3O4 MNPs
were synthesized by co- precipitation
method and used with QuEChERS
method for determination of
profenofos and cypermethrin in
Chinese kale, coupled with HPLC-
UV. When compared with Li et al.
(2014), this method using amounts of
Fe3O4 MNPs and GCB less than Li’s

Proceeding on the 5th EnvironmentAsia International Conference
13-15 June 2019, Convention Center, The Empress Hotel, Chiang Mai, Thailand
I-130
group. While Li’s group used 50 mg
PSA, 10 mg GCB and 50 mg Fe3O4
MNPs, We used 50 mg PSA, 7.5 mg
GCB and Fe3O4 MNPs 20 mg. Our
modified method gave high
recovery, low percent RSD and
reducing extraction time.
Moreover, LODs of profenofos
and cypermethrin 0. 04 and 0. 08
mg/ kg. LOQ of profenofos and
cypermethrin were 0. 12 and 0. 28
mg/ kg, which were above MRL
values ( profenofos is 0. 5mg/ kg,
cypermethrin is 1 mg/ kg, EU) .
Therefore, using Fe3O4 MNPs as
adsorbent in QuEChERS method to
analyze these insecticides provides
similar efficiency as QuEChERS
without Fe3O4 MNPs, but it is faster
and more convenient.
ACKNOWLEDGEMENTS
Authours and thankful to Department
of Chemistry, Faculty of Liberal Arts
and Science Kasetsart University for
providing the facility to carry out this
research.
REFERENCES
Anastassiades M, Lehotay SJ, Stajnbaher D
and Schenck F. Fast and easy
multiresiduemethodemploying
acetonitrile extraction/ partitioning
and “dispersive solid- phase
extraction” for the
determination of pesticide residues in
produce . J. AOAC 2003; 86: 412–
431.
AOAC (2002) Official Method of Analysis.
16th Edition, Association of Official
Analytical, Washington DC.
Cunha SC, Fernandes JO, Oliveira MBPP.
Fast analysis of multiple pesticide
residues in apple juice using
dispersive liquid– liquid
microextraction and
multidimensional gas
chromatography– mass spectrometry
Journal of Chromatography A 2009;
1216: 8835–8844.
Deng XJ, Guo QJ, Chen XP, Xue T, Wang
H, Yao P. Rapid and effective sample
clean- up based on magnetic
multiwalled carbon nanotubes for
the determination of pesticide
residues in tea by gas
chromatography– mass spectrometry.
Food Chemistry 2014; 145:853–858.
Harshit D, Charmy D, Nrupesh
P. Organophosphorus pesticides
determination by novel HPLC and
spectrophotometric method. Food
Chemistry 2017; 230: 448-453.
Proceeding on the 5th EnvironmentAsia International Conference
13-15 June 2019, Convention Center, The Empress Hotel, Chiang Mai, Thailand
I-131
Heidari H, Razmi H. Multi- response
optimization of magnetic solid phase
extraction based on carbon coated
Fe3O4 nanoparticles using
desirability function approach for the
determination of the
organophosphorus pesticides in
aquatic samples by HPLC– UV.
Talanta 2012; 99: 13–21.
Fernandes VC, Freitas M, Pacheco JPG,
Oliveira JM, Domingues VF, Matos
CD. Magnetic dispersive micro solid-
phase extraction and gas
chromatography determination of
organophosphorus pesticides
instrawberries Journal of
Chromatography A 2018; 1566: 1–
12.
Juan- Garcia A, Pico Y, Font G, Capillary
electrophoresis for analyzing
pesticides in fruits and vegetables
using solid- phase extraction and stir-
bar sorptiveextractionJ. Journal of
Chromatography A 2005; 1073
229- 236.
Li YF, Qiao YQ, Li FW, Ding Y, Yang ZJ,
Wang ML. Determination of
multiple pesticides in fruits and
vegetables using a modified quick,
easy, cheap, effective, rugged and
safe method with magnetic
nanoparticles and gas
chromatography tandem
massspectrometry. Journal of
Chromatography A 2014; 1300: 127-
133.
Lehotay SJ, Son AK, Kwon
H, Koesukwiwat U, Fu W,
MastovskaK. Comparison of
QuEChERS sample preparation
methods for the analysis of pesticide
residues in fruits and vegetable.
Journal of Chromatography A 2010;
1217: 2548-2560.
Melo A, Cunha SC, Mansilha C, Aguiar A,
Pinho O, Ferreira IMPLVO.
Monitoring pesticide residues in
greenhouse tomato by combining
acetonitrile- based extraction with
dispersive liquid– liquid
microextraction followed by gas-
chromatography-mass spectrometry
Food Chemistry 2012; 135: 1071-
1077.
Rodrigues FDM, Mesquita PRR, Oliveira
LSD, Oliveira FSD, Filho AM,
Pereira PADP, Andrade JBD.
Development of a headspace solid-
phase microextraction/ gas
chromatography– mass spectrometry
method for determination of
organophosphorus pesticide residues
in cow milk. Microchemical Journal
2011; 98: 56–61.
Silva MGD, Aquino A, Dórea HS, Navickiene
S, Simultaneous determination of
eight pesticide residues in coconut
using MSPD and GC/ MS. Talanta
2008; 76: 680–684.
Song XY, Shi YP, Chen J, Carbon
nanotubes- reinforced hollow fibre
solid-phase microextraction coupled

Proceeding on the 5th EnvironmentAsia International Conference
13-15 June 2019, Convention Center, The Empress Hotel, Chiang Mai, Thailand
I-132
with high performance liquid
chromatography for the
determination of carbamate
pesticides in apples. Food
Chem. 2013; 139: 246–252.
Wanwimolruk S, Kanchanamayoon O,
Phopin K, Prachayasittikul V. Food
safety in Thailand 2: Pesticide
residues found in Chinese kale
(Brassica oleracea) , a commonly
consumed vegetable in Asian
countries. Science of the Total
Environment 2015;532: 447– 455.
Wilkowska A, BiziekM. Determination of
pesticide residues in food matrices
using QuEChERS methodology.
Food Chemistry.2011; 125: 803-812.
Wu QH, Zhao GY, Feng C, Wang C, Wang
Z. Preparation of a graphene-based
magnetic nanocomposite for the
extraction of carbamate pesticides
from environmental water samples.
Journal of Chromatography A. 2011;
1218: 7936 -7942.
Zhao P, Wang L, Zhou L, Zhang F, Kang
S, Pan C. Multi- walled carbon
nanotubes as alternative reversed-
dispersive solid phase extraction
materials in pesticide multi- residue
analysis with
QuEChERSmethod. Journal of
Chromatography A 2012;
1225: 17-25.
Zheng HB, Zhao Q, Mo JZ, Huang
YQ, Luo YB, Yu QW, Feng YQ.
Quick, easy, cheap, effective, rugged
and safe method with magnetic
graphitized carbon black and primary
secondary amine as adsorbent and its
application in pesticide residue
analysis. Journal of Chromatography
A 2013; 1300: 127-133.

Proceeding on the 5th EnvironmentAsia International Conference
13-15 June 2019, Convention Center, The Empress Hotel, Chiang Mai, Thailand
I-133
Chlorpyrifos tolerance of Pseudomonas pseudoalcaligenes
biofilms under water-limiting conditions
Suthi Rattanaprapha1, Kritchaya Issakul1, Pumis Thuptimdang2,3,*
1Department of Environmental Science, School of Energy and Environment,
University of Phayao, Phayao 56000, Thailand
2Department of Chemistry, Faculty of Science, Chiang Mai University,
Chiang Mai 50200, Thailand
3Environmental Science Research Center, Faculty of Science, Chiang Mai
University, Chiang Mai 50200, Thailand; Corresponding author:
e-mail: [email protected]
ABSTRACT
Chlorpyrifos (CP) is an insecticide widely used in agricultural area in northern
Thailand. Due to its high toxicity, CP may have an adverse effect on the
beneficial bacteria in soil. Bacteria normally develop biofilms to protect the
cells from toxic substances. However, during a dry season, drought may
induce more stress to the biofilms in soil by creating water-limiting conditions,
which could affect the biofilm tolerance to CP, leading to a decrease in soil
fertility. The objective of this study is to determine the CP tolerance of the
biofilms of an indigenous bacterium from agricultural soil under water-
limiting conditions. Pseudomonas pseudoalcaligenes, a biofilm-forming
bacterium able to tolerate CP, was isolated from the tangerine-field soil in Nan
province that had received continuous application of CP. The biofilm
experiments were conducted in a 96-well plate at room temperature in media
added with different CP concentrations. Water-limiting conditions were
simulated using NaCl and polyethylene glycol ( PEG) at various
concentrations of NaCl ( 0, 20 and 40 mg/L) and PEG ( 0, 5 and 10%) .
Reduction in biofilm biomass after the exposure was determined by crystal

Proceeding on the 5th EnvironmentAsia International Conference
13-15 June 2019, Convention Center, The Empress Hotel, Chiang Mai, Thailand
I-134
violet staining. The results showed that P. pseudoalcaligenes biofilms showed
high tolerance to CP up to 300 mg/L. Biofilms formed with highest biomass
at 12 and 24 h at the CP concentrations of 5 to 300 mg/L. The biofilms at 24-
h formation time was then selected for further experiments. When forming
under water-limiting conditions (20 mg/L of NaCl and 5 and 10% of PEG),
biofilms produced more biomass than those in the regular conditions. Our
findings suggest that during drought season, soil bacteria could produce higher
biomass as a stress response to provide the protection from CP residue in the
field.
Keywords: Chlorpyrifos, Biofilms, Water-limiting conditions
INTRODUCTION
Thailand has been commercially
developing agricultural products to
meet the needs of exporters and
consumers. In order to meet the
specific criteria and the cost-
effectiveness in production, the use
of fertilizers and pesticides is
unavoidable, and the trend is
increasing. From the amount of
pesticide imports in 2017, it was
found that imports were more than
198 million kilograms/year, which
accounted of active ingredient for
more than 102 million
kilograms/year (Thailand Pesticide
Alert Networks, 2017). According to
formulas, structures and actions,
pesticides can be categorized into
classes such as organophosphate,
carbamates, organochlorine and other
groups. The most imported substance
is organophosphate group followed
by the carbamates group (Putkham,
2007).
Chlorpyrifos (CP) is a common
organophosphate pesticide used in
agricultural areas. Based on the
import data in 2017 from The Office
of Agriculture Regulation,
Department of Agriculture, the
amount was found to be as high as
375,291 kilograms per year
(Thailand Pesticide Alert Networks,
2017). Even though banning this

Proceeding on the 5th EnvironmentAsia International Conference
13-15 June 2019, Convention Center, The Empress Hotel, Chiang Mai, Thailand
I-135
chemical had been proposed, it did
not yet pass to be prohibited by law.
This high use creates a risk of being
contaminated in agricultural products
and residues in the environment. CP
is harmful to humans and other
organisms at moderate to high levels
depending on the amount and time of
the exposure, and it may accumulate
in the environment for more than a
year (Putkham, 2007)
In agricultural areas, the
environmental effect of residual
pesticides after using is an important
concern. Although CP is toxic to
microorganisms (Mahmood et al.,
2016), there are some species of
environmental bacteria that have the
ability to tolerate or degrade CP.
Bacteria in the environment generally
form biofilms, which are bacterial
cells adhering on surface such as soil
particles within the secreted mucus-
substance called extracellular
polymeric substances (EPS). EPS
acts as a barrier, making biofilms
highly resistant to toxic substances in
the environment (Thuptimdang et al.,
2015). However, drought during the
dry season can cause water-limiting
conditions to soil biofilms. This may
result in changes in cell membrane
and protein structure or the EPS
production process, leading to the
reduction on the biofilm formation
and resistance to chlorpyrifos
(Ngumbi and Kloepper, 2016).
The objective of this research is to
study the effect of chlorpyrifos on
Pseudomonas pseudoalcaligenes
biofilm formation under water-
limiting conditions. This bacterial
strain was isolated from a local
agricultural area that has a CP usage
history, and it showed CP tolerance
and pollutant degrading abilities
(Nishino and Spin, 1993). CP
tolerance was determined by
measuring the change in biomass of
biofilms forming under normal and
water-limiting conditions. The
knowledge from this study will be
useful for assessing the impact of CP
on bacteria in the environment.

Proceeding on the 5th EnvironmentAsia International Conference
13-15 June 2019, Convention Center, The Empress Hotel, Chiang Mai, Thailand
I-136
METHODOLOGY
Soil sample for bacterial isolation
A tangerine-field in Ban Pha
Khwang, Moo 4, Bo Subdistrict,
Mueang District, Nan Province, with
the history of CP usage was chosen
for soil sampling. A sampling site
was divided into 15 sub-plots. Soil
was randomly collected through a 5-
inch depth from each sub-plot. Soil
samples from all sub-plots were
entirely mixed in a container before
dividing into 4 piles. One pile of soil
was then used for isolation of bacteria
that have the ability to tolerate CP.
Isolation and identification of
chlorpyrifos-tolerate bacteria
Ten grams of soil sample was added
to a flask containing 100 mL of
minimal salt medium (MSM) and CP
as a sole carbon source. Flasks were
replicated with different CP
concentrations of 30, 60 and 100
mg/L. MSM contains 5.8 g/L of
Na2HPO4, 3 g/L of KH2PO4, 0.5 g/L
of NaCl, 1 g/L of NH4Cl, and 0.25
g/L of MgSO4. The flasks were
incubated at 30°C on a rotary shaker
at 120 rpm. After 2 weeks, 1 mL of
enrichment culture was sub-cultured
into a flask containing fresh MSM
spiked with CP according to previous
concentrations. After three
successive transfers, the culture was
pipetted, serially diluted, and spread
on MSM agar plate containing 50
mg/L of CP. The plates were
incubated at 30°C for 3 days.
Bacterial colonies grown on the plate
were purified by repeatedly streaking
on MSM agar plate containing 50 and
100 mg/L of CP to confirm the
tolerance of bacteria. The purified
culture was grown in Luria-Bertani
(LB) medium and preserved at -80°C
by mixing with glycerol at a ratio of
60:40 (culture:glycerol). Pure
colonies were sent for DNA
extraction, purification, and
sequencing for identification of
bacterial species (Macrogen,
Republic of Korea). Among all
identified species, P.
pseudoalcaligenes was selected for
this study as it was able to form
colonies in CP up to 100 mg/L.

Proceeding on the 5th EnvironmentAsia International Conference
13-15 June 2019, Convention Center, The Empress Hotel, Chiang Mai, Thailand
I-137
Culture preparation
Culture was prepared before each
biofilm experiment. One colony of P.
pseudoalcaligenes grown on an NB
agar plate was taken to a 50-mL
bottle containing 20 mL of NB
medium. The flask was incubated at
30°C on a rotary shaker at 120 rpm
for 18 hours. Then, 1 mL was taken
to a 250-mL Erlenmeyer flask
containing 100 mL of NB medium
and incubated at the same condition.
After shaking overnight, the cells
were in stationary phase according to
the preliminary experiment
conducted (data not shown). Cells
were harvested by centrifuging at
5,000 ×g for 5 min at room
temperature, washed with autoclaved
saline solution (0.85% NaCl) twice,
and adjusted with 0.85% NaCl to
obtain the optical density at 600 nm
(OD600) of 0.3-0.4 (108 CFU/ mL).
The culture was then used for further
experiments for biofilm formation.
Effect of CP on the formation of P.
pseudoalcaligenes biofilms
The experiments for studying the CP
tolerance of biofilms were conducted
in a polystyrene, flat-bottom, 96-well
plate. Each well (200 µL) contained 5
µL of the prepared culture, 100 µL of
NB medium, and 95 µL of CP diluted
in de-ionized (DI) water. The
commercial grade CP (40% v/v)
purchased from a local market was
used. By using the density value
(1.398 g/cm3) for calculation, CP
concentrations were adjusted with DI
water to 0, 5, 10, 25, 50, 100, and 300
mg/L. After pipetting the mixed
solution into the wells, the plate was
incubated at room temperature to
allow biofilm formation. At each
sampling time, media was removed
from the well, and biofilms were
carefully rinsed twice with 0.85%
NaCl. The biofilms were air-dried
and measured for their biomass using
crystal violet (CV) staining according
to the method by Thuptimdang et al.
(2017). The data were represented as
the absorbance at 600 nm (A600).
Three wells were used as three
replicates for each sample to create
standard deviation values represented
in error bars.

Proceeding on the 5th EnvironmentAsia International Conference
13-15 June 2019, Convention Center, The Empress Hotel, Chiang Mai, Thailand
I-138
CP tolerance of P.
pseudoalcaligenes biofilms under
water-limiting conditions
The biofilm experiments were
conducted similar to previous
section. Water-limiting conditions
were simulated by adding NaCl
solution at the concentrations of 0, 20
and 40 g/L and poly-ethylene glycol
6000 (PEG-6000) solution at the
concentrations of 0, 5 and 10% (w/v).
CP concentrations were at 0, 5, 10,
25, 50, 100, and 300 mg/L. After
biofilms formed at 24 h, CV staining
was conducted to measure the
biomass of the biofilms. CP tolerance
was determined by comparing the
amount of biomass, implying higher
CP tolerance in biofilms forming
with higher biomass (higher A600
value). Three wells were used as
three replicates for each sample to
create standard deviation values
represented in error bars.
Biodegradation of CP by P.
pseudoalcaligenes
To determine whether the CP
tolerance of biofilms was contributed
by the ability to degrade CP by the
bacterial cells, biodegradation
experiments were conducted. One
milliliter of P. pseudoalcaligenes
culture (prepared as described
before) was added into a flask
containing 100 mL of MSM medium
amended with 0 and 50 mg/L of
commercial grade CP. The flask was
shaken at 120 rpm and 30ºC for 5
days. At day 1, 3, and 5, 1 mL of
sample was taken and mixed
vigorously with 2 mL of HPLC-grade
methanol (RCI Labscan) using a
vortex mixer. The sample was then
centrifuged at 7,200 ×g for 10 min.
Two milliliters of the supernatant
were then filtered through a 0.45 µm
filter membrane. Twenty microliters
of sample was then analyzed for CP
by HPLC (Shimadzu LC-20A) using
a mixture of methanol and DI water
as a mobile phase and the reagent
grade (99.8%) CP (Dr.Ehrenstorfer
GmbH, Germany) as a standard. The
biodegradation results were
represented as Ct/C0, where Ct is the
CP concentration at time t (day) and
C0 is the CP concentration at day 0.

Proceeding on the 5th EnvironmentAsia International Conference
13-15 June 2019, Convention Center, The Empress Hotel, Chiang Mai, Thailand
I-139
RESULTS AND DISCUSSION
Effect of CP on the formation of P.
pseudoalcaligenes biofilms
In environment, biofilms are the form
of bacteria able to tolerate toxic
substances including pesticides
through EPS production (Lundqvist
et al., 2010). In this study, P.
pseudoalcaligenes was isolated from
agricultural soil with the history of
CP application. This strain was able
to tolerate CP by forming colonies on
CP agar plate; therefore, it was
chosen for the study determining the
effect of CP on biofilm formation.
The results show that, during 48 h of
formation, the biomass of biofilms
increased with time with the highest
biomass at 24 h (Figure 1).
Interestingly, when CP was added,
biofilms were able to form with
higher biomass compared to the
control (0 mg/L), which proves that
this strain and its biofilms could
tolerate CP. The highest amount of
biomass was still at 24 h except the
biofilms forming under 300 mg/L of
CP, in which the highest biomass was
at 12 h.
Figure 1 P. pseudoalcaligenes biofilm formation under different CP
concentrations.

Proceeding on the 5th EnvironmentAsia International Conference
13-15 June 2019, Convention Center, The Empress Hotel, Chiang Mai, Thailand
I-140
There are two reasons contributing to
higher biofilm formation when CP
was added: the bacterial stress
response mechanism and the ability
to use CP as a carbon source for
growth promotion.
For the first reason on the stress
response mechanism, there are
reports on more biofilm formation
after exposed to antimicrobial agents
(Gambino et al., 2015; Yang and
Alvarez, 2015). EPS production was
governed by various genes
responsible for producing EPS
molecules such as alginate or other
polysaccharides (Thuptimdang et al.,
2015), and bacterial cells use the
expression of those genes to produce
more EPS after the exposure to toxic
substances, resulting in more biofilm
amount compared to the unexposed
biofilms.
For the second reason that cells might
be able to use CP as a carbon source
to promote cell growth and biofilm
formation, further experiment has
been conducted and the results are
reported in the last subsection.
Tolerance of P. pseudoalcaligenes
biofilms to CP under water-limiting
conditions
Since P. pseudoalcaligenes biofilms
showed CP tolerance by forming
with higher biomass with the
presence of CP, further experiment
was conducted to observe the CP
tolerance under water-limiting
conditions.
Water-limiting conditions was
created by adding NaCl and PEG at
different concentrations. When
forming under 20 g/L of NaCl,
biofilms showed higher biomass at
the CP concentrations of 100 and 300
mg/L compared with the control (0
mg/L) (Figure 2(a) and (b)). This
proves that with the presence of
water-limiting condition, biofilms
exhibited higher CP tolerance. The
reason for this phenomenon could
also be explained by the stress
response mechanism. In this case,
two kinds of stress might contribute
to each other, which results in more
promotion of biofilm formation than
the normal condition or the condition
with CP only.

Proceeding on the 5th EnvironmentAsia International Conference
13-15 June 2019, Convention Center, The Empress Hotel, Chiang Mai, Thailand
I-141
However, when the water-limiting
condition was increased to 40 g/L of
NaCl (Figure 2(c)), biofilm
formation was reduced to the
comparable amount to the control.
Figure 2 CP tolerance of P. pseudoalcaligenes 24-h biofilms under different
NaCl concentrations: (a) 0 g/L, (b) 20 g/L, and (c) 40 g/L.

Proceeding on the 5th EnvironmentAsia International Conference
13-15 June 2019, Convention Center, The Empress Hotel, Chiang Mai, Thailand
I-142
When forming under 5% of PEG,
biofilms showed higher biomass
compared with the control at the CP
concentrations of 50, 100, and 300
mg/L (Figure 3(a) and (b)). After
increasing the water-limiting
condition to 10% of PEG, higher
formation of biofilms was only
observed at 100 mg/L of CP, showing
the sign of too much water limitation.
High concentrations of NaCl (40 g/L)
and PEG (10%) could result in strong
osmotic pressure toward the outside
of bacterial cell, resulting in cell
shrink or excessive stress for biofilm
formation process (Ngumbi and
Kloepper, 2016).
It should be noted that the addition of
CP, NaCl, or PEG alone did not result
in more CV staining (data not
shown); therefore, higher A600
observed under the presence of CP,
NaCl, and PEG in this study was
from biofilm formation. The
molecular aspects of biofilm
formation processes should be
observed in future study to explain
the phenomenon discovered in this
study.
Biodegradation of CP by P.
pseudoalcaligenes
As stated earlier, CP tolerance of the
biofilms could be from the ability to
biodegrade CP and use it as a carbon
source. So, the biodegradation
experiment was conducted with the
planktonic cells of P.
pseudoalcaligenes and 50 mg/L of
CP. Two types of growth media were
used to understand the mechanism of
degradation: minimal medium
(MSM) and rich medium (NB). The
results show that P.
pseudoalcaligenes could not use CP
as a sole carbon source as observed
by no degradation in MSM medium
after 5 days (Figure 4(a)). On the
other hand, some biodegradation
(around 30%) was observed at day 5
in NB medium (Figure 4(b)).
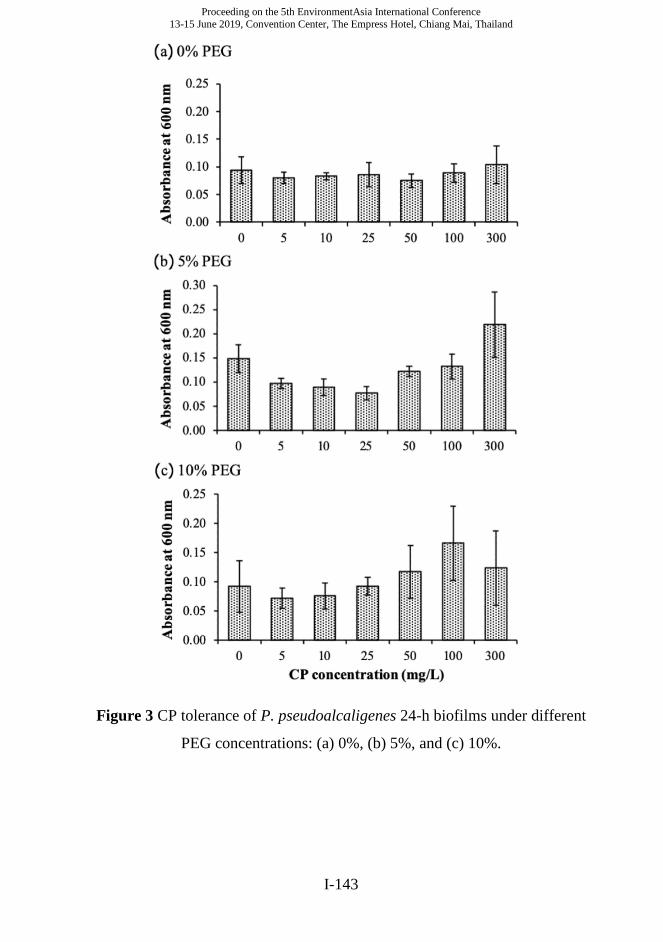
Proceeding on the 5th EnvironmentAsia International Conference
13-15 June 2019, Convention Center, The Empress Hotel, Chiang Mai, Thailand
I-143
Figure 3 CP tolerance of P. pseudoalcaligenes 24-h biofilms under different
PEG concentrations: (a) 0%, (b) 5%, and (c) 10%.
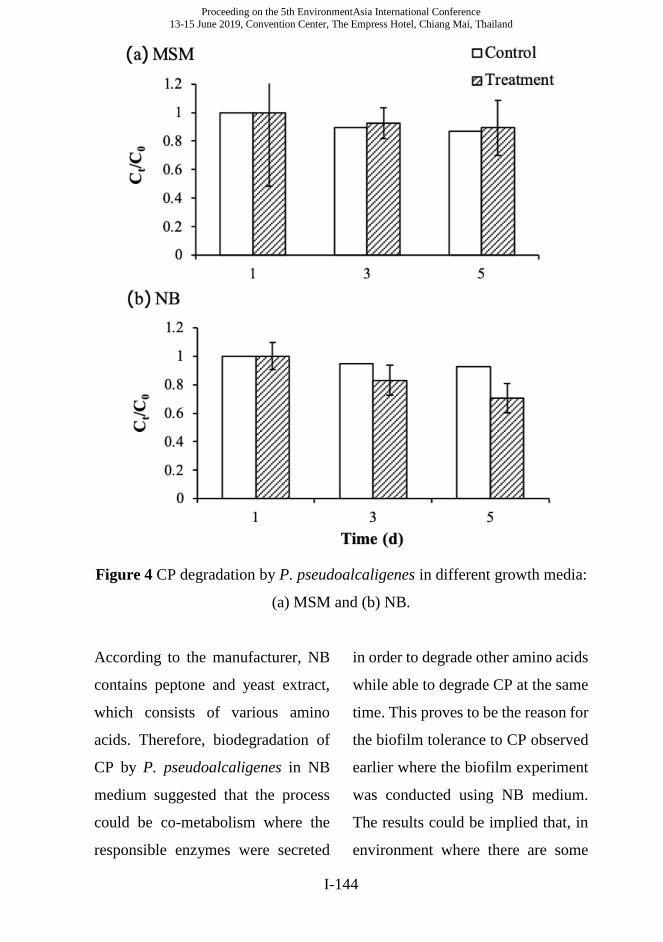
Proceeding on the 5th EnvironmentAsia International Conference
13-15 June 2019, Convention Center, The Empress Hotel, Chiang Mai, Thailand
I-144
Figure 4 CP degradation by P. pseudoalcaligenes in different growth media:
(a) MSM and (b) NB.
According to the manufacturer, NB
contains peptone and yeast extract,
which consists of various amino
acids. Therefore, biodegradation of
CP by P. pseudoalcaligenes in NB
medium suggested that the process
could be co-metabolism where the
responsible enzymes were secreted
in order to degrade other amino acids
while able to degrade CP at the same
time. This proves to be the reason for
the biofilm tolerance to CP observed
earlier where the biofilm experiment
was conducted using NB medium.
The results could be implied that, in
environment where there are some

Proceeding on the 5th EnvironmentAsia International Conference
13-15 June 2019, Convention Center, The Empress Hotel, Chiang Mai, Thailand
I-145
specific carbon sources available, P.
pseudoalcaligenes biofilms would
show high tolerance to CP since it
can degrade the pesticide at that
condition.
CONCLUSIONS
This study aims to determine P.
pseudoalcaligenes biofilm tolerance
to CP under water-limiting
conditions, which were created by
adding NaCl and PE) at the
concentrations of 0, 20 and 40 mg/L
and 0, 5 and 10%, respectively. The
results from CV staining showed
high tolerance of biofilms to CP up to
300 mg/L with the highest biomass at
12 and 24 h at the CP concentrations
of 5 to 300 mg/L, respectively. When
forming under water-limiting
conditions (20 mg/L of NaCl and 5
and 10% of PEG), biofilms produced
more biomass than those in the
regular conditions. Also, P.
pseudoalcaligenes showed the
ability to degrade CP under the
presence of other carbon sources,
leading to the CP tolerance of
biofilms. The data obtained from this
study suggest that this soil bacterium
is capable of producing higher
biomass as a stress response to
drought during the dry season, which
can provide protection from CP
residue in the field.
ACKNOWLEDGEMENTS
This research was partially supported
by Kurita Water and Environment
Foundation (KWEF) through
KWEF-AIT Research Grant 2016.
REFERENCES
Gambino M, Marzano V, Villa F, Vitali A,
Vannini C, Landini P, Cappitelli F.
Effects of sublethal doses of silver
nanoparticles on Bacillus subtilis
planktonic and sessile cells. Journal of
Applied Microbiology 2015; 118:
1103-1115.
Lundqvist A, Bertilsson S, Goedkoop W.
Effects of extracellular polymeric and
humic substances on chlorpyrifos
bioavailability to Chironomus
riparius. Ecotoxicology 2010; 19: 614-
622.
Mahmood I, Imadi SR, Shazadi K, Gul A,
Hakeem KR. Effects of Pesticides on
Environment. Springer International
Publishing Switzerland 2016; 2 5 3 -
268.
Ngumbi E, Kloepper J. Bacterial-mediated
drought tolerance: Current and future

Proceeding on the 5th EnvironmentAsia International Conference
13-15 June 2019, Convention Center, The Empress Hotel, Chiang Mai, Thailand
I-146
prospects. Applied Soil Ecology 2016;
105: 109-125.
Nishino SF, Spain JC. Degradation of
nitrobenzene by a Pseudomonas
pseudoalcaligenes. Applied and
Environmental Microbiology 1993;
59(8): 2520-2525.
Putkham S. Acetylcholinesterase inhibition
in golden apple snail (pomacea
canaliculata lamarck) exposed to
chlorpyrifos dichlorvos and carbaryl.
Master of Science thesis 2007.
Burapha University.
Thailand Pesticide Alert Networks. 2017.
Report on the import of agricultural
hazardous substances. Online source:
https://thaipan.org/wp-
content/uploads/2018/
10/pesticide_doc54.pdf. Access on
February 22, 2019.
Thuptimdang P, Limpiyakorn T, McEvoy J,
Pruß BM, Khan E. Effect of silver
nanoparticles on Pseudomonas putida
biofilms atdifferent stages of maturity.
Journal of Hazardous Materials 2015;
290: 127-133.
Thuptimdang P, Limpiyakorn T, Khan E.
Dependence of toxicity of silver
nanoparticles on Pseudomonas putida
biofilm structure. Chemosphere 2017;
188: 199-207.
Yang Y, Alvarez PJJ. Sublethal
concentrations of silver nanoparticles
stimulate biofilm development.
Environmental Science and
Technology Letters 2015; 2(8): 221-
226.

Proceeding on the 5th EnvironmentAsia International Conference
13-15 June 2019, Convention Center, The Empress Hotel, Chiang Mai, Thailand
I-147
Photocatalytic Degradation and Mechanism of Glyphosate
Herbicide Contaminated in Water by TiO2 Pellet
Photocatalyst
Kanokwan Yamsomphong1, Chonlada Pokhum2, Eden G Mariqui3, Hirofumi
Hinode3, Paiboon Sreearunothai1, Chamorn Chawengkijwanich2*,
1Sustainable Energy and Resources Engineering, Sirindhorn International
Institute of Technology, Thammasat University, Thailand
2* National Nanotechnology Center, National Science and Technology
Development Agency, Thailand
3Hinode Laboratory, Department of Transdisciplinary Science and
Engineering, School of Environment and Society, Tokyo Institute of
Technology, Japan; Corresponding author: e-mail: [email protected]
ABSTRACT
In Thailand, glyphosate has been used intensively to prevent food crops from
weeds and grass, contributing to the contamination of water resources. In
this paper, two types of TiO2 pellets—clay TiO2 pellets and Polyethylene
(PE)-TiO2 pellets— have been studied for photocatalytic degradation of
glyphosate in water. The clay TiO2 pellets were prepared in the laboratory by
using TiO2 powder (Degussa P-25) as raw material, whereas the PE-TiO2
pellets were purchased from Shandong Longsheng Masterbatch Co., Ltd,
China. Such TiO2 pellets were characterized by X-ray diffraction (XRD),
Brunauer-Emmett-Teller (BET) and scanning electron microscopy with
energy dispersive X-ray spectroscopy (SEM/EDX). Meanwhile, the
photocatalytic degradation of glyphosate as well as its possible mechanisms
have been investigated. Results showed that 99.08% of glyphosate
degradation was reached by using clay TiO2 pellets within 240 mins under
UVA illumination, while the photocatalytic degradation of glyphosate by using
PE-TiO2 pellets was lower, with 74.02%.

Proceeding on the 5th EnvironmentAsia International Conference
13-15 June 2019, Convention Center, The Empress Hotel, Chiang Mai, Thailand
I-148
Keywords: Glyphosate, TiO2, Photocatalysis, Contamination
INTRODUCTION
Glyphosate (N-(phosphono-
methyl) glycine) is an
organophosphate herbicide
extensively used to prevent food
crops in agriculture, especially in
Thailand. It is a common substance
used to control broadleaf weeds and
grass prior to planting or after the
crops are harvested. However, it has
been reported that glyphosate was
found in water resources such as
drinking water and tap water in
Thailand (Patsiriwong, 2015). It is an
organic pollutant, which is classified
as “probably carcinogenic” to
humans reported by the International
Agency for Research on Cancer
(IARC) in March 2015. It can cause
serious harmful effects on people
who use water which surrounds these
agricultural areas.
During recent decades, the titanium
dioxide (TiO2) photocatalysis has
been an effective process to degrade
organic pesticide including
glyphosate in water (Chen et al.,
2012; Echavia et al., 2009; Muneer
and Boxall, 2008). Once TiO2
photocatalyst is used to absorb light,
with light having energy equal or
higher than 3.2 eV, generating
reactive oxygen species (ROS) to
degrade or transform the organic
compounds into carbon dioxide
(CO2), water and mineral byproducts
(Umar and Aziz, 2013; Carp et al.,
2004). Although TiO2 has been
widely applied in the photocatalytic
degradation of pesticides, using the
commercial TiO2 powder as a
catalyst causes difficulties during
separation of photocatalyst from
water for the real-life applications.
Consequently, the development of
TiO2 photocatalyst has been
attracting a lot of recent attention
from researches in this field.
Transforming TiO2 powder into
larger pellets is an interesting way to
solve the problem. Recently, TiO2
companies i.e. Shandong Longsheng
Masterbatch Co., Ltd and Soltex
Petro Products, Ltd has lunched TiO2

Proceeding on the 5th EnvironmentAsia International Conference
13-15 June 2019, Convention Center, The Empress Hotel, Chiang Mai, Thailand
I-149
Pellets for commercial and research
applications. Moreover, many
researchers have used clay to exhibit
larger specific surface areas with
TiO2 (Bouna et al., 2011; Kutláková
et al., 2011; Wang et al., 2011).
Previous studies have shown that
using clay with TiO2 as photocatalyst
offers several advantages: They can
be easily separated and recovered
from decontaminated water; increase
adsorption ability and enhance
photocatalytic activity for removing
organic pollutants. Nevertheless, few
studies relating to the degradation of
TiO2 pellet have been presented
(Shimizu et al., 2007; Yamazaki et
al., 2001) and the photocatalytic
degradation of glyphosate in water
has rarely been investigated.
Hence, the aim of this research is to
prepare two types of TiO2 pellets:
clay TiO2 pellets and PE-TiO2 pellets
to investigate the applicability of the
TiO2 pellets under UVA light to
degrade glyphosate herbicide in
water, specifically, the extent of its
products formed during the
degradation process. Based on the
above goals, X-ray diffraction
(XRD), Brunauer-Emmett-Teller
(BET) and scanning electron
microscopy with energy dispersive
X-ray spectroscopy (SEM/EDX) are
employed to investigate the
composition, and surface charge of
the pellets.
METHODOLOGY
Materials
All the chemical reagents used were
of analytical grade and the water used
was deionized water purified by
Barnstead Lab Tower EDI Water
Purification Systems, Thermo
Scientific, U.S. Glyphosate (N-
(Phosphonomethyl)glycine, 96%
purity) was purchased from Sigma–
Aldrich Chemical Co., UK.
Aminomethyl phosphonic acid
(AMPA, 98% purity) was purchased
from Alfa Chemicals Ltd, UK.
Phosphate (PO43−) Standard (1000
mgL-1) was purchased from
Environmental Express, USA. TiO2
powder (80% anatase and 20 % rutile,
Degussa P-25, Evonik Industries,
Germany) and White clay (Wako
Pure Chemical Ind., Ltd, Japan) were

Proceeding on the 5th EnvironmentAsia International Conference
13-15 June 2019, Convention Center, The Empress Hotel, Chiang Mai, Thailand
I-150
used as raw materials. PE-TiO2
pellets (70% anatase) were purchased
from Shandong Longsheng
Masterbatch Co., Ltd, China and used
directly.
Preparation of chemical solutions
A stock solution of 1000 mgL-1 of
glyphosate was prepared by
dissolving approximately 100 mg of
glyphosate in 100 mL of deionized
water. The experimental solutions
were carried out by diluting the stock
solution until concentration of 1
mgL-1 was reached. Also, AMPA
stock solution (1000 mgL-1) was
prepared by dissolving
approximately 100 mg of AMPA in
100 mL of deionized water. The
working phosphate solution was
prepared by further diluting of the
concentrated phosphate (1000 mgL-
1). These prepared stock solutions
were needed for further use and so
were stored at 4 °C for 1 month.
To prepare an appropriate
series of calibration curves, these
stock solutions were diluted with
deionized water until the desired
concentrations were reached.
Clay TiO2 pellet preparation
White clay and TiO2 powder
(Degussa P-25) were manually mixed
with 50-60% distilled water at room
temperature. Subsequently, these
mixtures were heated up to 110 °C for
5 h and then distilled water was added
until the mixture became soft. After
that, the product was formed into 4-7
mm clay TiO2 pellets. The prepared
samples were finally calcined at 600
°C for 2 h in a L 3/12 Burnout
furnace, Nabertherm GmbH,
Germany (modified from
(DĚDKOVÁ et al., 2013; Kutláková
et al., 2011). The pellets were
prepared with different ratios of
white clay and TiO2 powder as shown
in 1.
Characterization methods
XRD analysis
The crystalline structures of TiO2
pellets were determined by x-ray
diffraction at room temperature by
using Bruker D8 Venture
diffractometer with CuKα radiation.
The diffractograms were recorded in
the range of 2θ from 15˚ to 80˚.
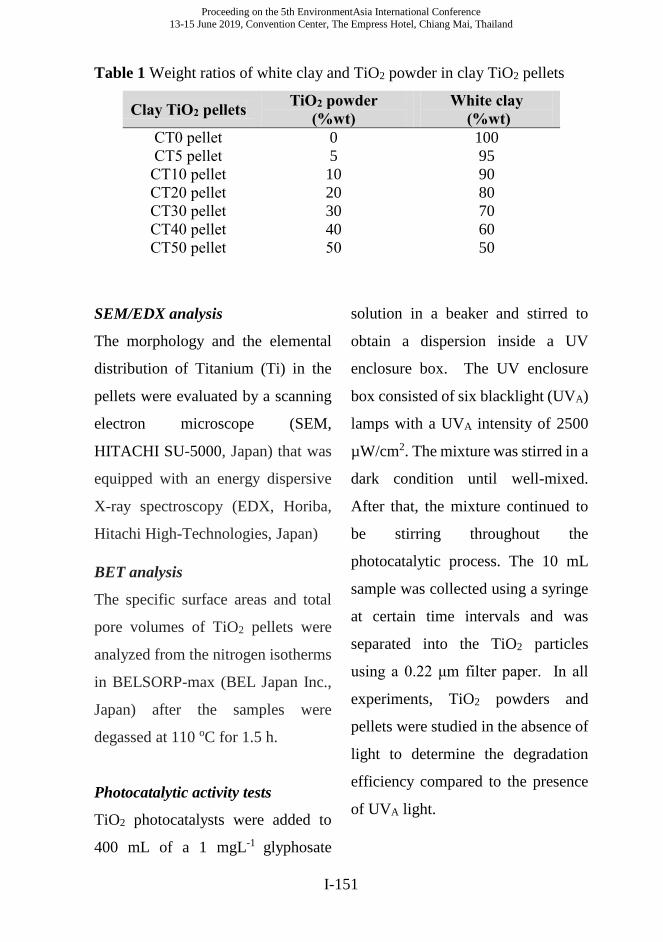
Proceeding on the 5th EnvironmentAsia International Conference
13-15 June 2019, Convention Center, The Empress Hotel, Chiang Mai, Thailand
I-151
Table 1 Weight ratios of white clay and TiO2 powder in clay TiO2 pellets
Clay TiO2 pellets TiO2 powder
(%wt)
White clay
(%wt)
CT0 pellet 0 100
CT5 pellet 5 95
CT10 pellet 10 90
CT20 pellet 20 80
CT30 pellet 30 70
CT40 pellet 40 60
CT50 pellet 50 50
SEM/EDX analysis
The morphology and the elemental
distribution of Titanium (Ti) in the
pellets were evaluated by a scanning
electron microscope (SEM,
HITACHI SU-5000, Japan) that was
equipped with an energy dispersive
X-ray spectroscopy (EDX, Horiba,
Hitachi High-Technologies, Japan)
BET analysis
The specific surface areas and total
pore volumes of TiO2 pellets were
analyzed from the nitrogen isotherms
in BELSORP-max (BEL Japan Inc.,
Japan) after the samples were
degassed at 110 oC for 1.5 h.
Photocatalytic activity tests
TiO2 photocatalysts were added to
400 mL of a 1 mgL-1 glyphosate
solution in a beaker and stirred to
obtain a dispersion inside a UV
enclosure box. The UV enclosure
box consisted of six blacklight (UVA)
lamps with a UVA intensity of 2500
µW/cm2. The mixture was stirred in a
dark condition until well-mixed.
After that, the mixture continued to
be stirring throughout the
photocatalytic process. The 10 mL
sample was collected using a syringe
at certain time intervals and was
separated into the TiO2 particles
using a 0.22 μm filter paper. In all
experiments, TiO2 powders and
pellets were studied in the absence of
light to determine the degradation
efficiency compared to the presence
of UVA light.

Proceeding on the 5th EnvironmentAsia International Conference
13-15 June 2019, Convention Center, The Empress Hotel, Chiang Mai, Thailand
I-152
Glyphosate analysis
The amount of glyphosate in water
was directly measured
by ion chromatography (Dionex ICS-
5000+, Dionex Corp., USA)
equipped with a variable wavelength
detector (VWD), Ion Pac AG11 (4 x
50 mm), AS11 (4 x 250 mm) guard,
an ASRS-300 (4 mm) self-
regenerating suppressor, EG eluent
generator, and an AS-HV auto
sampler. The removal efficiency for
each sample was calculated using the
following equation:
η =(C0 – Ct )
C0 × 100
where η% is the removal efficiency
of glyphosate; Ct is the concentration
of glyphosate in the solution after t
illumination and C0 is the initial
concentration of glyphosate before
illumination.
Mechanisms of the photocatalytic
degradation of glyphosate
Through the possible degradation
pathways, the products monitored
were aminomethyl- phosphonic acid
(AMPA) and phosphate ion (PO43−).
PO43−which could be identified under
the same operation of glyphosate.
Meanwhile, AMPA was examined by
using 6495 Triple Quadrupole Liquid
chromatography–mass spectrometry
(LC–MS, Agilent Technologies,
USA) equipped with a Agilent
Poroshell 120 HILIC-Z, (2.7 μm, 2.1
mm × 100 mm) and a HILIC guard
column (2.7 μm, 2.1 mm × 5 mm)
RESULTS AND DISCUSSION
TiO2 samples characterization
In the experiment, 2 types of TiO2
pellets used were investigated. The
clay TiO2 pellets comprising of 0, 5,
10, 20, 30, 40 and 50 wt% of TiO2
(CT0, CT5, CT910, CT20, CT30,
CT40 and CT50 pellets, respectively)
with a diameter of 4-7 mm were
prepared for this experiment,
whereas the PE-TiO2 pellets that
were 2.5-3 mm in diameter were
purchased commercially. All clay
TiO2 pellets had a similar external
appearance (Figure 1A). However,
the stability of the clay TiO2 pellets in
water decreases with the increasing
clay content. After immersion in
water, the stability of CT0, CT5 and
CT10 pellets proved to be in effective
because they broke down
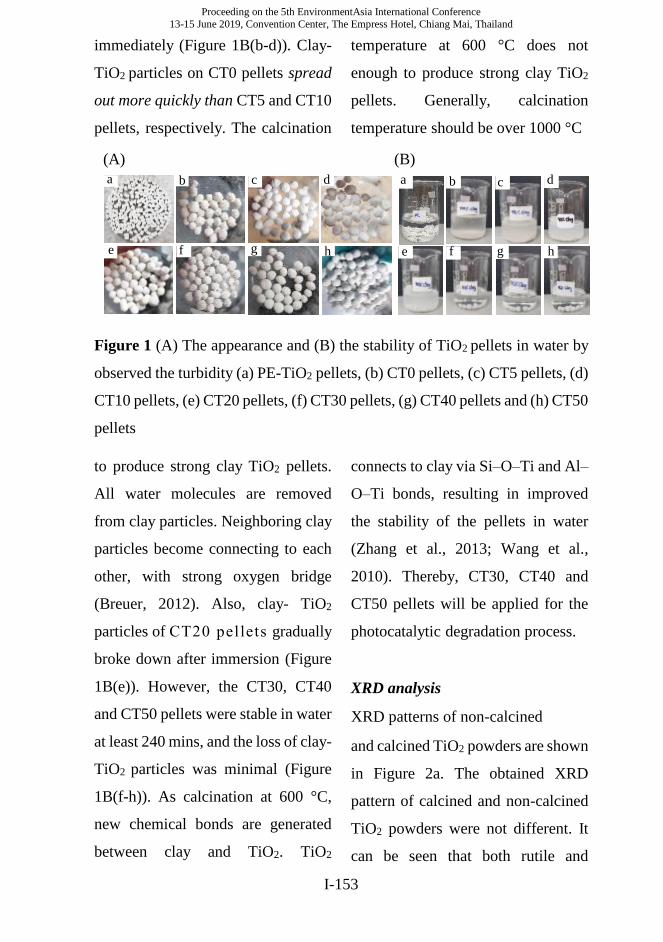
Proceeding on the 5th EnvironmentAsia International Conference
13-15 June 2019, Convention Center, The Empress Hotel, Chiang Mai, Thailand
I-153
immediately (Figure 1B(b-d)). Clay-
TiO2 particles on CT0 pellets spread
out more quickly than CT5 and CT10
pellets, respectively. The calcination
temperature at 600 °C does not
enough to produce strong clay TiO2
pellets. Generally, calcination
temperature should be over 1000 °C
Figure 1 (A) The appearance and (B) the stability of TiO2 pellets in water by
observed the turbidity (a) PE-TiO2 pellets, (b) CT0 pellets, (c) CT5 pellets, (d)
CT10 pellets, (e) CT20 pellets, (f) CT30 pellets, (g) CT40 pellets and (h) CT50
pellets
to produce strong clay TiO2 pellets.
All water molecules are removed
from clay particles. Neighboring clay
particles become connecting to each
other, with strong oxygen bridge
(Breuer, 2012). Also, clay- TiO2
particles of CT20 pellets gradually
broke down after immersion (Figure
1B(e)). However, the CT30, CT40
and CT50 pellets were stable in water
at least 240 mins, and the loss of clay-
TiO2 particles was minimal (Figure
1B(f-h)). As calcination at 600 °C,
new chemical bonds are generated
between clay and TiO2. TiO2
connects to clay via Si–O–Ti and Al–
O–Ti bonds, resulting in improved
the stability of the pellets in water
(Zhang et al., 2013; Wang et al.,
2010). Thereby, CT30, CT40 and
CT50 pellets will be applied for the
photocatalytic degradation process.
XRD analysis
XRD patterns of non-calcined
and calcined TiO2 powders are shown
in Figure 2a. The obtained XRD
pattern of calcined and non-calcined
TiO2 powders were not different. It
can be seen that both rutile and
(A) (B)
a b c d
e f g h
a b c d
e f g h

Proceeding on the 5th EnvironmentAsia International Conference
13-15 June 2019, Convention Center, The Empress Hotel, Chiang Mai, Thailand
I-154
anatase phases obviously appeared in
both TiO2 powder samples. The
percentage of crystalline phases of
the calcined TiO2 powder is quite
similar to non-calcined TiO2 powder
(Table 2). Also, as previously
reported by; Bayan et al., (2017)
Bowering et al., (2007); Raj and
Viswanathan (2009) investigated that
the phase transformation from
anatase to rutile in TiO2 appeared at
temperatures above 700 °C. For XRD
patterns of the white clay, quartz and
pyrophyllite represented as typical
mineral mixtures of white clay
(Figure 2a). No phase transformation
of calcined clay was observed at 600
°C for 2 h. These mineral clays
started transforming after being
heated to over 1000 oC (Sanchez-
Soto and Perez-Rodriguez, 1989;
Zheng et al., 2018). The overall result
indicated calcination at 600 oC for 2
h does not have significant in
transforming the composition of TiO2
and the white clay.
Figure 2b confirms that in the PE-
TiO2 pellets, only anatase phase
obviously appeared, as claimed by
the manufacturer. Meanwhile, the
presence of quartz, pyrophyllite,
rutile and anatase TiO2 was also
detected in all the clay TiO2 pellets.
These mineral mixtures of white clay
had no obvious effect on any
composition change in TiO2. The
phase contents of TiO2 in clay TiO2
pellets are also shown in Table 2. The
percentage of anatase and rutile
contents in CT30, CT40 and CT50
pellets were similar. The result was
also similar to the non-calcined TiO2
powder. Evidently, the decrease of
the TiO2 weight ratios in clay TiO2
pellet is related to a decrease in the
peak intensity of anatase and rutile.

Proceeding on the 5th EnvironmentAsia International Conference
13-15 June 2019, Convention Center, The Empress Hotel, Chiang Mai, Thailand
I-155
Figure 2 XRD diffraction patterns of the TiO2 samples (a) TiO2 powder and
white clay and (b) PE-TiO2 pellets and clay TiO2 pellets
Table 2 The percentage of anatase and rutile phases of TiO2 samples
BET analysis
The surface areas, pore volumes and
pore sizes of PE-TiO2 and clay TiO2
pellets were investigated (as shown in
Table 3). In the manufacturers
specifications, TiO2 powder showed
a large surface area, and its value
reaches 50 ± 15 m2/g (Evonik
Industries, Thailand). Also, Raj and
Viswanathan (2009) invastigated that
TiO2 powder has pore volume 0.177
cm3/g and pore size 17.5 nm. As a
result, the surface area and pore
volume of the clay TiO2 pellets
decreased, compared with TiO2
powder.
Sample TiO2 phase (wt%)
Anatase Rutile
Non-calcined TiO2 powder 79.5 20.5
Calcined TiO2 powder 76.6 23.4
PE-TiO2 Pellet 100.0 0.0
CT30 pellet 77.3 22.7
CT40 pellet 80.2 19.8
CT50 pellet 77.2 22.8
20 40 60 80
Inte
nsi
ty (
a.u
.)
2θ20 40 60 80
2θ
Inte
nsi
ty (
a.u
.)
Non-calcined clay powder
Calcined TiO2 powder
Non-calcined TiO2 powder
Calcined clay powder
CT30 pellet
CT40 pellet
CT50 pellet
PE-TiO2 pellet
Pyrophyllit
e Quartz Anatase Rutile
(a) (b)
( ) ° ( ) °

Proceeding on the 5th EnvironmentAsia International Conference
13-15 June 2019, Convention Center, The Empress Hotel, Chiang Mai, Thailand
I-156
Moreover, the CT30, CT40 and
CT50 pellets had quite similar
surface areas, pore volumes and pore
sizes, whereas the surface area, pore
volume and pore size of the PE-TiO2
pellets were considerably less than
clay TiO2 pellets. This result
indicates that such large surface
areas, pore volume and pore size of
clay TiO2 pellets were presumably
better candidate material for
photocatalytic activity than PE-TiO2
pellets.
Table 3 BET surface area, pore volume and pore size of TiO2 samples
* Raj and Viswanathan, (2009)
SEM/EDX analysis
SEM images and results of EDX
analysis of PE-TiO2 and clay TiO2
pellets are shown in Figure 3. Clay
TiO2 pellets appeared to have a less
smooth and homogeneous surface
than PE-TiO2 pellets. CT50 pellets
exhibited a smoother surface than
other composites (Figure 3b).
Obviously, as the amount of the TiO2
increased, surface of the clay TiO2
pellets became smooth. Also, EDX
mapping analysis revealed that the
Titanium (Ti), Silica (Si) and
Aluminum (Al) were uniformly
distributed either throughout the
entire external or internal surface of
clay TiO2 pellets. Furthermore, EDX
results showed that Ti was found in
both external and internal surfaces of
CT30, CT40 and CT50 pellets in the
range from 15.5 to 15.9 %wt, 21.1 to
25.4%wt and 25.3 to 35.4 %wt,
respectively (Table 4).
Sample Surface area (m2/g) Pore volume (cm3 /g) Pore size (nm)
TiO2 powder 50 ± 15 0.250* 17.500*
PE-TiO2 Pellet 2.160 0.005 7.541
CT30 pellet 30.710 0.145 20.465
CT40 pellet 36.989 0.203 24.493
CT50 pellet 33.124 0.153 18.836

Proceeding on the 5th EnvironmentAsia International Conference
13-15 June 2019, Convention Center, The Empress Hotel, Chiang Mai, Thailand
I-157
Figure 3 SEM and EDX mapping images of TiO2 samples (a) External surface
of PE-TiO2 pellets, (b) External surface of CT 50 pellets, (c) External surface
of CT40 pellets and (d) External and internal surface of CT30 pellets.
Table 4 EDX analysis of clay TiO2 pellets
Sample Al (%wt) Si (%wt) Ti (%wt)
CT30 pellet 5.4-5.9 15.4-15.6 15.5-15.9
CT40 pellet 4.3-4.9 13.1-14.2 21.1-25.4
CT50 pellet 3.6-4.0 11.5-13.4 25.3-35.4
Photocatalytic activity tests
Preliminary, the photocataly- tic
activities of CT50, CT40 and CT30
pellets UVA light were studied by
using methylene blue (MB) as a
model organic pollutant. As a result,
CT30 pellets showed the highest
photocatalytic activity for MB.
External surface
Ti
(b)
Ti
(c)
(a)
Ti
(d)
Ti Ti
Internal surface
Proceeding on the 5th EnvironmentAsia International Conference
13-15 June 2019, Convention Center, The Empress Hotel, Chiang Mai, Thailand
I-158
Consequently, CT30 pellets will be
used for the photodegradation of
glyphosate.
Figure 4 illustrates the removal
efficiency of the glyphosate over the
course of the experiment. When the
TiO2 powder was employed under
dark condition, glyphosate was
adsorbed on the TiO2 surface. The
concentration of glyphosate
decreased from 1 to 0.6 mgL-1
(approximately 39.82% removal
efficiency) within 30 min and then
the concentration became stable until
the end of experiment. Upon UV
irradiation, glyphosate rapidly
decreased and completely
disappeared by TiO2 powder within
30 min (Figure 4a). In the absence of
TiO2, however, the concentration of
glyphosate slightly decreased under
UV irradiation at 240 min,
approximately 9% removal
efficiency.
Apart from TiO2 powder, PE-TiO2
and CT30 pellets also can remove
glyphosate effectively (Figure 4b).
The removal efficiency of glyphosate
using both PE-TiO2 and CT30 pellets
under UV irradiation represented a
considerable increase with time. For
CT30 pellets, the concentration of
glyphosate was reduced from 1 to
0.01 mgL-1, with 99.08% removal
efficiency, whereas the removal
efficiency of glyphosate reached
74.02% by using PE-TiO2 pellets
after 240 mins. Although both PE-
TiO2 and CT30 pellets showed a
lower performance than TiO2
powder, they were much easier to
separate from water than TiO2
powder. As mentioned previously,
clay TiO2 pellets showed a higher
performance for the photocatalytic
degradation of glyphosate, compared
with PE-TiO2 pellets. Also, clay TiO2
pellets had a mixture of anatase-rutile
phase, while the PE-TiO2 pellets only
have anatase phase (Figure 2b). The
mixture of rutile and anatase phases
enhance photocatalytic activity,
leading to improve electron–hole
separation (Ohtani et al., 2010). Also,
clay TiO2 pellets had a larger surface
area than the PE-TiO2 pellets. The
high surface area relates to the greater
number of active sites for reactive

Proceeding on the 5th EnvironmentAsia International Conference
13-15 June 2019, Convention Center, The Empress Hotel, Chiang Mai, Thailand
I-159
oxygen species (ROS) production to
degrade glyphosate (Dârjan et al.,
2013; Kumar and Pandey, 2017;
Hurum et al., 2003).
Apart from the photocatalytic
degradation of glyphosate,
glyphosate can be adsorbed by PE-
TiO2 and CT30 pellets. The results
showed that 6.77% of glyphosate was
adsorbed by PE-TiO2 pellets, while
about 41.72% of glyphosate was
adsorbed by using CT30 pellets
within 240 mins (Figure 4b).
Obviously, CT30 pellets showed dual
functions with adsorption and
photocatalytic degradation of
glyphosate, while the decrease of
glyphosate by using PE- TiO2 pellets
was mainly due to the influence of
photocatalytic degradation.
Considering the removal efficiency
of glyphosate, CT30 pellet showed
the higher performance with
convenient separation from the
water.
Mechanisms of the photocatalytic
degradation of glyphosate
A possible photocatalytic
degradation pathway of glyphosate
was supposed to occur due to the
strongly oxidizing species (i.e.
hydroxyl radicals and/or superoxide
anion radicals). It is presumed that
decomposition of glyphosate
released AMPA, glycolic acid,
sarcosine ,phosphoric acid (H3PO4),
carbon dioxide (CO2) and, inorganic
anions i.e. phosphate (PO43− ) and
nitrate (NO3−) (Echavia et al., 2009;
Muneer and Boxall, 2008; Chen and
Liu, 2007) . Among these
byproducts, AMPA is initially
produced and frequently occurs
within glyphosate decomposition,
while PO43− is stable major
byproduct. In relation to glyphosate
decomposition pathway, this study
investigated AMPA and PO43−
formation.

Proceeding on the 5th EnvironmentAsia International Conference
13-15 June 2019, Convention Center, The Empress Hotel, Chiang Mai, Thailand
I-160
Figure 4 Degradation of glyphosate under dark and UV conditions
(a) TiO2 powder and (b) clay TiO2 pellets and PE-TiO2 pellets
The concentrations of AMPA and
PO43− during photocatalytic
degradation of glyphosate by using
TiO2 powder are shown in Figure 5a.
The complete removal of glyphosate
at concentration of 1 mgL-1 was
achieved, and PO43− formation was
observed at 30 mins and stable until
2 4 0 m i n s . It can be seen that the
formation of PO43− was related to the
disappearance of glyphosate.
Compared to CT30 pellets, the
photocatalytic degradation of
glyphosate by using CT30 pellets
showed a different result in the
formation of PO43− (Figure 5b). The
concentration of glyphosate was
gradually decreased and PO43−
concentration increased gradually,
reaching its highest level at 120 mins.
Then, PO43− concentration decreased
until 240 mins (Figure 5b).
Also, the formation of AMPA is
related to the decrease of glyphosate
(Figure 5b). When the concentration
of glyphosate was gradually
decreased, AMPA concentration
increased gradually, reaching its
highest level at 90 mins. Thereafter,
AMPA decreased until 240 mins.
From previous studies, glyphosate
can be directly oxidized to AMPA.
T h e generated AMPA can be also
directly changed into PO43− (Echavia
(a) (b)
0 30 60 90 120 150 180 210 240
0
10
20
30
40
50
60
70
80
90
100R
emoval
Eff
icie
ncy
(%
)
Time (min)
Glyphosate+ TiO2 + UV light
Glyphosate+ TiO2 + Dark
Glyphosate+ UV light
0 30 60 90 120 150 180 210 240
0
10
20
30
40
50
60
70
80
90
100
Rem
oval
Eff
icie
ncy
(%
)
Time (min)
CT30 pellet+UV light
CT30 pellet+Dark
PE-TiO2 pellet+UV light
PE-TiO2 pellet+Dark

Proceeding on the 5th EnvironmentAsia International Conference
13-15 June 2019, Convention Center, The Empress Hotel, Chiang Mai, Thailand
I-161
et al., 2009; Muneer and Boxall,
2008). Thereby, it is presumed that
t h e gradual decrease of AMPA is
resulted from the decrease of
glyphosate and increase of PO43− i n
water. Interestingly, AMPA was no
observed in the photocatalytic
degradation of glyphosate by using
TiO2 powder. This is possibly due to
high performance photocatalytic
activity of TiO2 powder for
degradation of the AMPA and
glyphosate.
Overall, formation of by products
during the photocatalytic degradation
of glyphosate by using TiO2 powder
showed different result from CT30
pellets. Photocatalytic degradation
of glyphosate by using TiO2 powder
found only PO43− , w h i l e
photocatalytic degradation of the
glyphosate by using CT30 pellets
found both AMPA and PO43−. This
difference is might be due to the
lower photocatalytic activity of
CT30 pellets t h an Ti O 2 p o w d e r,
resul t ing in AMPA is not rapidly
decomposed. However, there was a
trend in decreasing of AMPA after 90
mins (Fig. 5b). Due to AMPA are
more toxic and longer half-life than
glyphosate (Grandcoin et al., 2017),
complete degradation of AMPA is
essential. Therefore, increase
photocatalytic activity of CT30, e.g.
increasing reaction time, light
intensity and amount of clay TiO2
pellets, can lead to complete
degradation of AMPA as well as
degradation of glyphosate.

Proceeding on the 5th EnvironmentAsia International Conference
13-15 June 2019, Convention Center, The Empress Hotel, Chiang Mai, Thailand
I-162
Figure 5 Concentration of glyphosate and its byproducts during
photocatalytic degradation (a) TiO2 powder and (b) CT30 pellets
CONCLUSIONS
As shown in this work, CT30 pellets
were simply prepared, easily
removed from water and resulted in
highly photocatalytic activity. The
removal efficiency of glyphosate by
the CT30 pellets reached 99.08%.
Also, AMPA and PO43− has been
observed in the photocatalytic
degradation pathway of glyphosate
by CT30 pellets.
ACKNOWLEDGEMENTS
The authors are grateful to National
Nanotechnology Center
(NANOTEC) (No. P1751698),
Thailand Graduate Institute of
Science and Technology (TGIST)
and Thailand Advanced Institute of
Science and Technology-Tokyo
Institute of Technology (TAIST-
Tokyo Tech), National Science and
Technology Development Agency,
Thailand for their financial support
as well as Miss Duangkamon
Viboonratanasri, senior assistant
research for technical help in using
IC.
The study was also made possible
through the support provided by
Hinode Laboratory, School of
Environment and Society, Tokyo
Institute of Technology, Japan and
(a) (b)
0.0
0.3
0.6
0.9
1.2
0.000
0.005
0.010
0.015
0.020
0 30 60 90 120 150 180 210 240
0.0
0.2
0.4
0.6
Glyphosate
AMPA
Co
ncen
trato
n (
mg
L-1
)
Time (min)
PO43-
0.0
0.3
0.6
0.9
1.2
0.000
0.005
0.010
0.015
0.020
0 30 60 90 120 150 180 210 240
0.0
0.2
0.4
0.6
Glyphosate
AMPA
PO43-C
on
cen
tra
ton
(m
gL
-1)
Time (min)

Proceeding on the 5th EnvironmentAsia International Conference
13-15 June 2019, Convention Center, The Empress Hotel, Chiang Mai, Thailand
I-163
Sirindhorn International Institute of
Technology (SIIT), Thailand.
REFERENCES
Bayan EM, Lupeiko TG, Kolupaeva EV,
Pustovaya LE, Fedorenko AG.
Fluorine-Doped Titanium Dioxide:
Synthesis, Structure, Morphology,
Size and Photocatalytic Activity. In:
Advanced Materials: Springer; 2017.
17-24.
Bouna L, Rhouta B, Amjoud M, Maury F,
Lafont M-C, Jada A, et al. Synthesis,
characterization and photocatalytic
activity of TiO2 supported natural
palygorskite microfibers. Applied
Clay Science 2011; 52(3): 301-311.
Bowering N, Croston D, Harrison PG,
Walker GS. Silver modified Degussa
P25 for the photocatalytic removal of
nitric oxide. International Journal of
Photoenergy 2007;2007.
Breuer S. The chemistry of pottery.
chemistry 2012.
Carp O, Huisman CL, Reller A.
Photoinduced reactivity of titanium
dioxide. Progress in solid state
chemistry 2004; 32(1-2): 33-177.
Chen JQ, Hu ZJ, Wang NX. Photocatalytic
mineralization of glyphosate in a
small-scale plug flow simulation
reactor by UV/TiO2. Journal of
Environmental Science and Health,
Part B 2012; 47(6): 579-588.
Dârjan A, Drăghici C, Perniu D, Duţă A.
Degradation of Pesticides by TiO 2
Photocatalysis. In: Environmental
Security Assessment and
Management of Obsolete Pesticides in
Southeast Europe: Springer; 2013.
155-163.
Dědková K, Peikertová P, Matějová K,
Lang J, Kukutschová K. Study of the
antibacterial activity of composites
kaolinite/Tio2. nanocon 2012.
Echavia GRM, Matzusawa F, Negishi N.
Photocatalytic degradation of
organophosphate and
phosphonoglycine pesticides using
TiO2 immobilized on silica gel.
Chemosphere 2009; 76(5): 595-600.
Edzwald JK, Toensing DC, Leung MC-Y.
Phosphate adsorption reactions with
clay minerals. Environmental Science
& Technology 1976; 10(5): 485-490.
Grandcoin A, Piel S, Baures E.
AminoMethylPhosphonic acid
(AMPA) in natural waters: Its
sources, behavior and environmental
fate. Water research 2017; 117: 187-
197.
Hurum DC, Agrios AG, Gray KA, Rajh T,
Thurnauer MC. Explaining the
enhanced photocatalytic activity of
Degussa P25 mixed-phase TiO2 using
EPR. The Journal of Physical
Chemistry B 2003; 107(19): 4545-
4549.
Kumar A, Pandey G. A review on the
factors affecting the photocatalytic
degradation of hazardous materials.
Proceeding on the 5th EnvironmentAsia International Conference
13-15 June 2019, Convention Center, The Empress Hotel, Chiang Mai, Thailand
I-164
Material Sci & Eng Int J 2017; 1(3):
106-114.
Kutláková KM, Tokarský J, Kovář P,
Vojtěšková S, Kovářová A, Smetana
B, et al. Preparation and
characterization of photoactive
composite kaolinite/TiO2. Journal of
Hazardous Materials 2011; 188(1-3):
212-220.
Muneer M, Boxall C. Photocatalyzed
degradation of a pesticide derivative
glyphosate in aqueous suspensions of
titanium dioxide. International
Journal of Photoenergy 2008; 2008.
Pattarasiriwong WW, P; Sittisorn, T;
Yindee, T; Kerdnoi, T; Hongsibsong,
S. Research on Organophosphate
Pesticide Risk Management in the
Upper Northern Part of Thailand
phayamengrai, Chaingrai Provinces
2016; 3.
Raj K, Viswanathan B. Effect of surface
area, pore volume and particle size of
P25 titania on the phase
transformation of anatase to rutile.
2009.
Sanchez-Soto P, Perez-Rodriguez J.
Thermal analysis of pyrophyllite
transformations. Thermochimica Acta
1989; 138(2): 267-276.
Shimizu N, Ogino C, Dadjour MF, Murata
T. Sonocatalytic degradation of
methylene blue with TiO2 pellets in
water. Ultrasonics sonochemistry
2007; 14(2): 184-190.
Umar M, Aziz HA. Photocatalytic
degradation of organic pollutants in
water. In: Organic Pollutants-
Monitoring, Risk and Treatment:
InTech; 2013.
Wang B, Ding H, Deng Y. Characterization
of calcined kaolin/TiO 2 composite
particle material prepared by
mechano-chemical method. Journal of
Wuhan University of Technology-
Mater. Sci. Ed. 2010;25(5): 765-769.
Wang C, Shi H, Zhang P, Li Y. Synthesis
and characterization of kaolinite/TiO2
nano-photocatalysts. Applied Clay
Science 2011; 53(4): 646-649.
Wang G, Xu L, Zhang J, Yin T, Han D.
Enhanced Photocatalytic Activity of
TiO2 Powders (P25) via Calcination
Treatment; 2012.
Yamazaki S, Matsunaga S, Hori K.
Photocatalytic degradation of
trichloroethylene in water using TiO2
pellets. Water Research 2001; 35(4):
1022-1028.
Zhang Q, Shan A, Wang D, Jian L, Cheng
L, Ma H, et al. A new acidic Ti sol
impregnated kaolin photocatalyst:
synthesis, characterization and visible
light photocatalytic performance.
Journal of sol-gel science and
technology 2013; 65(2): 204-211.
Zheng R, Ren Z, Gao H, Zhang A, Bian Z.
Effects of calcination on silica phase
transition in diatomite. Journal of
Alloys and Compounds 2018; 757:
364-371.
Proceeding on the 5th EnvironmentAsia International Conference
13-15 June 2019, Convention Center, The Empress Hotel, Chiang Mai, Thailand
I-165
Treatment of Highly Colored Wastewater from Commercial
Biogas Reactor Discharge using Fenton Oxidation Process
Hatairut Samakkarn1, Paiboon Sreearunothai2, Maythee Saisriyoot3, Korakot
Sombatmankhong4*
1Thailand Advanced Institute of Science and Technology-Tokyo Institute of
Technology (TAIST-Tokyo Tech), Sirindhorn International Institute of
Technology, Thammasat University, Thailand
2School of Bio-Chemical Engineering and Technology, Sirindhorn
International Institute of Technology, Thammasat University, Thailand
3The Department of Chemical Engineering, Faculty of Engineering,
Kasetsart University, Thailand
4National Metal and Materials Technology Center, 114 Thailand Science
Park, Thanon Phahonyothin, Tambon Khlong Nueng, Amphoe Khlong
Luang, Pathum Thani, 12120, Thailand; Corresponding author: e-mail:
ABSTRACT
Biogas generation utilizes vinasse, a by-product of ethanol distillation, as one
of its ingredients is gaining more interests in recent years. However, discharge
from biogas reactors utilizing vinasse is highly colored and is difficult to be
further degraded by conventional biological treatment. In this work, the
Fenton oxidation process has been employed to test for the color reduction of
the discharge from a commercial biogas reactor using vinasse as its feedstock.
The operating factors, such as the pH and the amount of the Fenton reagents
have been explored to determine their effects on the efficiency of the Fenton
oxidation process. The operating ranges tested, using 2k full factorial design
of experiment (DOE), are the Fe2+ concentrations between 1.7-8.9 mM, the
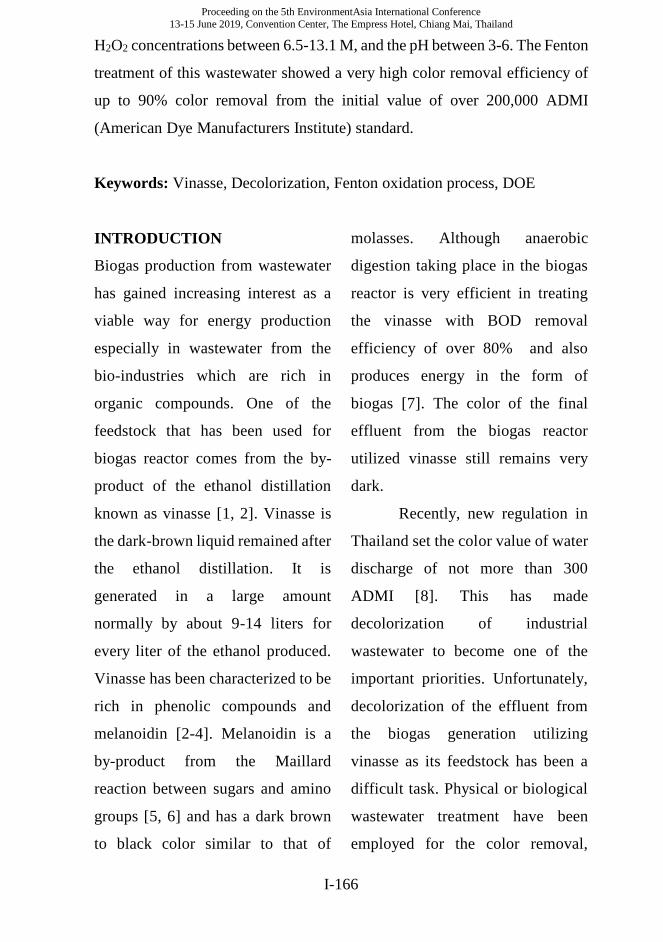
Proceeding on the 5th EnvironmentAsia International Conference
13-15 June 2019, Convention Center, The Empress Hotel, Chiang Mai, Thailand
I-166
H2O2 concentrations between 6.5-13.1 M, and the pH between 3-6. The Fenton
treatment of this wastewater showed a very high color removal efficiency of
up to 90% color removal from the initial value of over 200,000 ADMI
(American Dye Manufacturers Institute) standard.
Keywords: Vinasse, Decolorization, Fenton oxidation process, DOE
INTRODUCTION
Biogas production from wastewater
has gained increasing interest as a
viable way for energy production
especially in wastewater from the
bio-industries which are rich in
organic compounds. One of the
feedstock that has been used for
biogas reactor comes from the by-
product of the ethanol distillation
known as vinasse [1, 2]. Vinasse is
the dark-brown liquid remained after
the ethanol distillation. It is
generated in a large amount
normally by about 9-14 liters for
every liter of the ethanol produced.
Vinasse has been characterized to be
rich in phenolic compounds and
melanoidin [2-4]. Melanoidin is a
by-product from the Maillard
reaction between sugars and amino
groups [5, 6] and has a dark brown
to black color similar to that of
molasses. Although anaerobic
digestion taking place in the biogas
reactor is very efficient in treating
the vinasse with BOD removal
efficiency of over 80% and also
produces energy in the form of
biogas [7]. The color of the final
effluent from the biogas reactor
utilized vinasse still remains very
dark.
Recently, new regulation in
Thailand set the color value of water
discharge of not more than 300
ADMI [8]. This has made
decolorization of industrial
wastewater to become one of the
important priorities. Unfortunately,
decolorization of the effluent from
the biogas generation utilizing
vinasse as its feedstock has been a
difficult task. Physical or biological
wastewater treatment have been
employed for the color removal,

Proceeding on the 5th EnvironmentAsia International Conference
13-15 June 2019, Convention Center, The Empress Hotel, Chiang Mai, Thailand
I-167
however these techniques are rather
not effective and the use of chemical
oxidation may help degrading these
biologically recalcitrant compounds.
Advanced oxidation processes
(AOPs) has been in high demand for
treatment of organic pollutants that
are difficult to be degraded
biologically [9] [10]. Choosing the
optimum dosage of chemicals and
also conditions of treatment in order
to minimize the cost associated with
AOPs can be challenging. The
application of standard statistical
design of experiment (DOE)
approach can help to reduce number
of tests necessary to find optimum
conditions [11]. DOE investigates
the effects of the input variables
(factors) on the output variables
(responses) yielding the optimum
conditions.
The aim of this study is to decrease
color of the effluent discharged from
a commercial biogas reactor
utilizing vinasse as its main
feedstock and to investigate on the
efficiency of Fenton’s processes and
optimum conditions for the color
removal using DOE method.
METHODOLOGY
Chemicals and materials
The biogas wastewater sample was
received from a biogas plant utilizing
vinasse from an ethanol distillery as
its major influent. The wastewater
sample was kept in a dark container
at temperature of 4°C prior to use.
sulfuric acid, FeSO47H2O, H2O2
30% w/w and were purchased from
Dajung Co., Ltd.
Procedure
The experiment was performed at
ambient temperature and pressure.
The Fenton oxidation process was
conducted in a 250 ml glass bottle
containing 20 ml sample. The pH of
the sample was adjusted in the range
between 3-6 using sulfuric acid.
FeSO47H2O and H2O2 were then
added into the sample and the sample
was left under continuous stirring for
24 hours.
Color Measurement
The color measurement standard is
the APHA 2120F ADMI Weighted-
Ordinate Spectrometer. For color
standard method, the sample was first

Proceeding on the 5th EnvironmentAsia International Conference
13-15 June 2019, Convention Center, The Empress Hotel, Chiang Mai, Thailand
I-168
filtered to remove turbidity using a
cellulose acetate syringe filter with a
nominal pore of 0.45 μm. The color
according to the ADMI color
standard was then carried out using a
10mm disposable cuvette using
Spectroquant model Pharo 300.
COD Measurement
COD measurement was carried out
by standard method APHA 5220 D.
closed reflux, colorimetric method.
The sample was added to vials and
digested for 2 hours at 150 °C in a
Spectroquant TR 420 and cooled
down to room temperature for 30
min. The COD concentration was
then measured photometrically using
the Spectroquant model Pharo 300.
RESULTS AND DISCUSSION
ANOVA results
In order to study and optimize
Fenton’s process on the color
reduction, the 2k full factorial DOE
was analyzed using Minitab. The
experiment investigated on the 3
factors (pH, Fe2+ and H2O2
concentrations) resulting in possible
combinations of 8 runs for the low
and high in each factor. The operating
factors on color reduction were
adopted by varying pH of wastewater
between 3-6, Fe2+ concentrations
between 1.7- 8.9 mM, and H2O2
concentrations between 6.5- 13.1 M.
The goal of this type of experiment is
usually focused on developing a full
predictive model (Y = f(X))
describing how the process inputs
jointly affect the process output and
determining the optimal settings of
the inputs.
Based on the ANOVA analysis
conducted (table not shown), the P-
values of the main effects, the two-
way interactions and the three-way
interactions among the factors are
almost 0 (less than 0.05). This
implies that the linear assumption
between the factors and the responses
are statistically significant and that
the pH range between 3-6, the Fe2+
concentration between 1.7- 8.9 mM,
and the H2O2 concentration between
6.5-13.1 M are statistically
significant.
Regression equation
The estimated coefficients generated

Proceeding on the 5th EnvironmentAsia International Conference
13-15 June 2019, Convention Center, The Empress Hotel, Chiang Mai, Thailand
I-169
from the 2k full factorial DOE were
then used to obtain the regression
model (Y=f(X)) which is displayed in
Table 1.
Table 1 Regression equation for the predicted color value of the treated
wastewater as a function of the pH, Fe2+ and H2O2 concentrations.
Color (ADMI) = 525 + 19362 pH + 2354 Fe (mM) + 1280 H2O2 (M)
- 2318.0 pH*Fe (mM) - 1179.1 pH*H2O2 (M)
- 288.1 Fe (mM)*H2O2 (M) + 144.30 pH*Fe (mM)*H2O2 (M)
Effects plot
The Pareto chart in Fig.1 shows the
absolute values of the standardized
effects from the largest effect to the
smallest effect. The chart also plots a
reference line to indicate which
effects are statistically significant.
This chart determines the magnitude
and the importance of the effects.
Model of color response to input
factors
To determine if the model in Table 1
can fit our data, one examines the
goodness-of-fit statistics. The
standard deviation between the color
data values and the fitted color values
is approximately 602.4 ADMI. R2 is
a statistical measure of how close the
data are to the fitted regression line.
The high R2 value of 99.94% means
all the variability of the response data
center around its mean and the model
fits the data well. The predicted-R2
determine, given new observation,
how well the model can predict the
response. In this work, the model has
also a quite good predicted-R2 value
of 99.86% and hence the model
should have a good predictive
ability.This work illustrates that main
effects, two-way interactions and
three-way interactions among factors
cross the reference line at 2.1 so these
factors are statistically significant
with the current model terms. The Fe
concentration is a major factor that
affects the color response.
Proceeding on the 5th EnvironmentAsia International Conference
13-15 June 2019, Convention Center, The Empress Hotel, Chiang Mai, Thailand
I-170
Figure 1 The Pareto graph of all factors on color response
Residual analysis
The normal probability plot verifies
assumption of normality of error
terms that the residuals
approximately follow a straight line.
The histogram shown in Fig. 2
indicates the normal distribution of
the residuals for all observations.
Moreover, the versus fits plot shows
the error term against the fitted value
to verify the assumption that the
residuals are randomly distributed.
They should fall randomly half above
and half below the 0 line, with no
recognizable patterns in the points so
that indicate our assumption of error
terms having mean 0 is valid

Proceeding on the 5th EnvironmentAsia International Conference
13-15 June 2019, Convention Center, The Empress Hotel, Chiang Mai, Thailand
I-171
Figure 2 The normal distribution of histogram of the color response around
the mean value
Optimization
The optimization plot shows how the
factor variables affects the predicted
responses. According to the
calculation, the color value of Fenton
oxidation process can be minimized
at the operating temperature of 25 °C,
the reaction time of 24 hours, pH of
3, the Fe2+ concentration of 8.9 mM,
and the H2O2 concentration of 13.1
M. The highest color removal
efficiency using Fenton oxidation
process of 97.5% is then obtained.
This prediction is also verified in an
experiment and obtained a color
value of 4,983 ADMI. The COD
removal efficiency is about 30% from
the initial COD concentration of
68,000 mg/L to about 47,709 mg/L
after treatment.
Validation of the minimum
condition
After investigation of the minimum
color condition (pH of wastewater 3,
Fe2+ concentrations of 8.9 mM, and
H2O2 concentrations 13.1 M), we
validate response. The experimental
measured color is 4,912 ADMI and is
very close to that of the predicted
value of 4,983 ADMI. The result
shows that the percentage difference
between the actual experimental
value and that of the predicted value
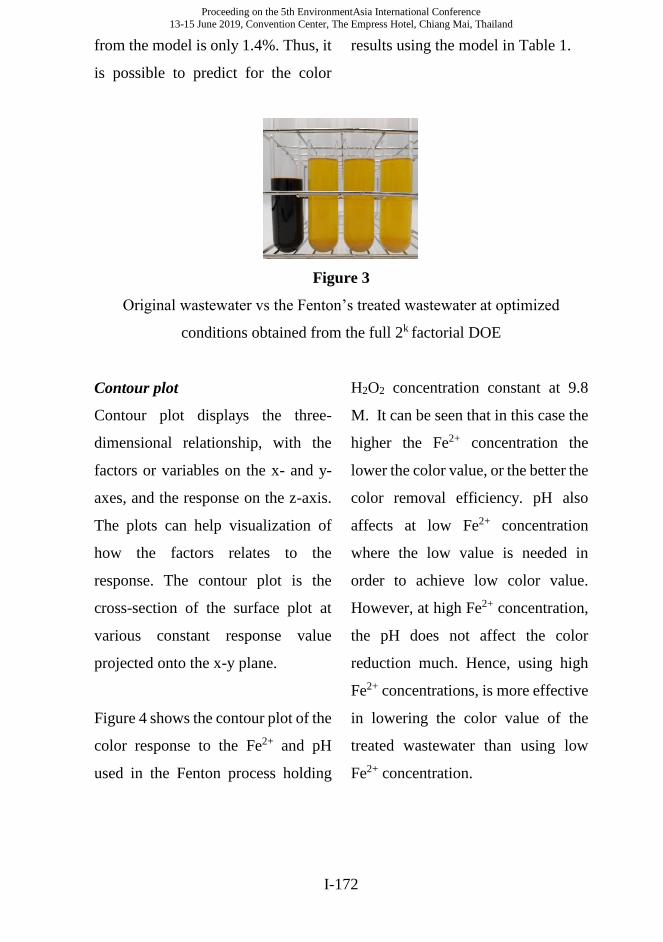
Proceeding on the 5th EnvironmentAsia International Conference
13-15 June 2019, Convention Center, The Empress Hotel, Chiang Mai, Thailand
I-172
from the model is only 1.4%. Thus, it
is possible to predict for the color
results using the model in Table 1.
Figure 3
Original wastewater vs the Fenton’s treated wastewater at optimized
conditions obtained from the full 2k factorial DOE
Contour plot
Contour plot displays the three-
dimensional relationship, with the
factors or variables on the x- and y-
axes, and the response on the z-axis.
The plots can help visualization of
how the factors relates to the
response. The contour plot is the
cross-section of the surface plot at
various constant response value
projected onto the x-y plane.
Figure 4 shows the contour plot of the
color response to the Fe2+ and pH
used in the Fenton process holding
H2O2 concentration constant at 9.8
M. It can be seen that in this case the
higher the Fe2+ concentration the
lower the color value, or the better the
color removal efficiency. pH also
affects at low Fe2+ concentration
where the low value is needed in
order to achieve low color value.
However, at high Fe2+ concentration,
the pH does not affect the color
reduction much. Hence, using high
Fe2+ concentrations, is more effective
in lowering the color value of the
treated wastewater than using low
Fe2+ concentration.

Proceeding on the 5th EnvironmentAsia International Conference
13-15 June 2019, Convention Center, The Empress Hotel, Chiang Mai, Thailand
I-173
Figure 4 Contour plot of color (ADMI) vs Fe2+, pH
Figure 5 shows the contour plot of the
color response from the model to the
H2O2 concentrations and the pH used
to hold the Fe2+ concentration
constant in the mid-range at 5.3 mM.
The response is classified by the
color shade. It can be seen that the
low color value is obtained when the
low color value is achieved at
sufficiently high concentration of
H2O2 and low pH value. Thus, the
higher H2O2 concentrations and
lower pH are prefer at moderate level
of Fe2+.
Figure 5 Contour plot of color (ADMI) vs H2O2, pH

Proceeding on the 5th EnvironmentAsia International Conference
13-15 June 2019, Convention Center, The Empress Hotel, Chiang Mai, Thailand
I-174
Figure 6 shows the contour plot of the
color response to the H2O2 and Fe2+
concentrations used to react in Fenton
process holding pH constant in the
mid-range at 4.5. It can be seen that
in order to achieve low color value,
the Fe2+ has to be sufficiently high in
the range of about 8mM, and at this
level, the low amount of H2O2 can
also be used leading to the lower
process cost.
Figure 6 Contour plot of color (ADMI) vs H2O2, Fe2+
CONCLUSIONS
In this work, Fenton’s oxidation
process has been shown to be very
effective in reducing the color of the
biogas reactor discharge from the
color value of over 200,000 ADMI
to the color value of about 4,983
ADMI.
The optimized Fenton’s conditions
were found to be at the pH value of
3, Fe2+ concentration of 8.9 mM,
and the H2O2 concentration of 13.1
M with color removal efficiency
97.5% at the optimized condition.
The 2k full factorial DOE helps to
also obtain a model that can predict
the final color value of the treated
effluent given the Fenton’s
parameters of pH, Fe2+ and H2O2
concentrations used and show that
the Fe2+ concentrations to be a major
factor affecting the color, and that
operating in the high Fe2+
concentration range is preferred in
Proceeding on the 5th EnvironmentAsia International Conference
13-15 June 2019, Convention Center, The Empress Hotel, Chiang Mai, Thailand
I-175
order to minimize the use of H2O2
and to operate in the near neutral
pH.
ACKNOWLEDGEMENTS
The authors gratefully acknowledge
the TAIST-Tokyo Tech scholarship,
the National Science and
Technology Development Agency
(NSTDA), and Sirindhorn
International Institute of
Technology (SIIT), Thammasat
University.
REFERENCES
Cristiano E. R. Reis, H.B.S.B., Thiago M.
Alves, Ana K. F. Carvalho and
Heizir F. De Castro, Vinasse
Treatment within the Sugarcane-
Ethanol Industry Using Ozone
Combined with Anaerobic and
Aerobic Microbial Processes.
Hu, C.E.R.R.a.B., Vinasse from Sugarcane
Ethanol Production: Better
Treatment or Better Utilization.
V. Parnaudeau, N.C., R. Oliver, P.
Cazevieille, S. Recous, Vinasse
Organic Matter Quality and
Mineralization Potential, as
Influenced by Raw Material,
Fermentation and Concentration
Processes.
Elda España-Gamboa, T.V., Xavier Font,
Jorge Dominguez-Maldonado,
Blondy Canto-Canché and Liliana
Alzate-Gaviria, Pretreatment of
vinasse from the sugar refinery
industry under non-sterile
conditions by Trametes versicolor
in a fluidized bed bioreactor and
its effect when coupled to an
UASB reactor.
Sara I.F.S. Martins*,
W.M.F.J.a.M.A.J.S.v.B., A
review of Maillard reaction in
food and implications to kinetic
modelling.
Surasak Bunrung, S.P., Poonsuk
Prasertsan, Decolourisation of
Biogas Effluent of Palm Oil Mill
using Palm Ash.
Y. Satyawali, M.B., Wastewater treatment
in molasses-based alcohol
distilleries for COD and color
removal: a review.
Thailand, M.o.I., Notification of Ministry
of Industry Industrial Effluent
Standards B.E. 2560. 2560.
STASINAKIS, A.S., USE OF SELECTED
ADVANCED OXIDATION
PROCESSES (AOPs) FOR
WASTEWATER TREATMENT
– A MINI REVIEW
Adina Elena Segneanu, C.O., Carmen
Lazau, Paula Sfirloaga, Paulina
Vlazan, Cornelia Bandas and Ioan
Grozescu, Waste Water Treatment
Methods.

Proceeding on the 5th EnvironmentAsia International Conference
13-15 June 2019, Convention Center, The Empress Hotel, Chiang Mai, Thailand
I-176
Is'haq A. Mohammed*, M.T.B., Ambali S.
Abdulkareem, Stephen S.
Ochigbo, Ayo S. Afolabi,
Oladiran K. Abubakre Full
factorial design approach to
carbon nanotubes synthesis by
CVD method in argon
environment.
Related Documents