CCW | 1 An Industry Disrupted January 2018 ENTERTAINMENT AND THE RISE OF DIGITAL MEDIA IN THE LOS ANGELES BASIN

Welcome message from author
This document is posted to help you gain knowledge. Please leave a comment to let me know what you think about it! Share it to your friends and learn new things together.
Transcript
CCW | 1
An Industry DisruptedJanuary 2018
ENTERTAINMENT AND THE RISE OF DIGITAL MEDIA IN THE
LOS ANGELES BASIN
CCW | 2
We thank the following for additional contributions made to this report:
Shannon M Sedgwick Senior Economist LAEDC
Tyler LaferriereResearch Analyst LAEDC
Eric Hayes Research AnalystLAEDC
Lori Sanchez Director Center of Excellence for Labor Market Research
Juan Madrigal Assistant Director Center of Excellence for Labor Market Research
Wallace Walrod Ph.D. Chief Economic AdvisorOrange County Business Council
Lauren McSherryWriting and Editing
Alma Salazar, Ed.D.Senior Vice President Center for Education Excellence & Talent DevelopmentLos Angeles Area Chamber of Commerce
Adrian McDonald Research Analyst FilmLA
Scott Porter and his team at Ernst & Young
Additional Research Assistance:
Wendy Disch & Sheri-Anne Vaughans LAEDC Interns
Authors
Additional Contributions
Contributions
Funded by the California Community Colleges, Chancellor’s Office under the Strong Workforce Program (SWP) Los Angeles Regional Project under grant agreement DO-17-2185-02 awarded to Citrus College, as the lead college for SWP Round 1.
CCW | 1
Founding Partners
Center for a Competitive Workforce, a regional Strong Workforce project, is a partnership of 19 L.A. Region community colleges in the L.A.|O.C. Regional Consortium, LAEDC, Los Angeles Area Chamber of Commerce, and the Center of Excellence for Labor Market Research at Mt. San Antonio College. The Center’s mission is to better align supply and demand data with labor market information, support industry-driven career education and workforce development programs, and strengthen industry engagement across our region’s talent development systems with the goal to train, educate and upskill a more competitive workforce in the LA Basin for the knowledge-intensive industries that will come to dominate our economic future. This work will also address the talent gaps some employers face, and help balance the supply of skilled graduates with the projected demand of local employers, a balance which helps both job-seekers and local firms.
Learn more at www.ccworkforce.org.
As grant-funded technical assistance providers, the seven Centers of Excellence across the state, located strategically to study the regional economies of California, support the community colleges by providing customized data on high growth, emerging, and economically-critical industries and occupations and their related workforce needs.
The Los Angeles Area Chamber of Commerce champions economic prosperity and quality of life for the Los Angeles region by being the voice of business, promoting collaboration and helping members grow.
The Los Angeles and Orange County Regional Consortium (LAOCRC) provides local and regional decision makers with the increased capacity to measure regional progress toward goals of efficiency and effectiveness, while also improving their access to indicators that measure student/incumbent worker progress through the educational system.
The LAEDC is a 501c3 non-profit dedicated to advancing opportunity and prosperity for all via objective economic research and analysis, strategic assistance to government and business, and targeted public policy. These efforts are guided and supported by the expertise and counsel of the LAEDC’s business, government and education members and partners.
CENTER FOR A COMPETITIVE WORKFORCE
Inform Connect Advance
C E N T E R S O F E X C E L L E N C E
Advancing Opportunity and Prosperity for All
CCW | 2
Dr. Jose Fierro President/Superintendent Cerritos Community College District
Geraldine M. Perri, Ph.D Superintendent/President Citrus Community College District
Dr. David Viar Superintendent/President Glendale Community College District
Rajen Vurdien, Ph.D. Superintendent Pasadena Community College District
Teresa Dreyfuss Superintendent/President Rio Hondo Community College District
Dr. Kathryn E. Jeffery, Superintendent/President Santa Monica Community College District
Dr. Dena P. Maloney Superintendent El Camino Community College District
Dr. Reagan Romali Superintendent/President Long Beach Community College District
Dr. Bill Scroggins President Mt San Antonio Community College District
Dr. Keith Curry Chief Executive Officer Compton Community College District
Dr. Francisco Rodriguez Chancellor Los Angeles Community College District
Dr. Cheryl Marshall Chancellor North Orange County Community College District
Dr. John Weispfenning Chancellor Coast Community College District
Dr. Debra Fitzsimmons Chancellor South Orange County Community College District
Dr. Raúl Rodríguez, Ph.D. Chancellor Rancho Santiago Community College District
Bill Allen CEO Los Angeles County Economic Development Corporation
Gustavo Chamorro Los Angeles/Orange County Regional Consortium
David Flaks President and COO Los Angeles County Economic Development Corporation
Nick Real Cerritos College
Dr. Arvid Spor Citrus College
Dr. Nancy Jones Coastline Community College
Dr. Rodney Murray Compton College
Kathleen Reiland Cypress College
Dr. Virginia Rapp El Camino College
Dr. Doug Benoit Fullerton College
Dr. Jan Swinton Glendale College
Christopher Whiteside Golden West College
Corine Doughty Irvine Valley College
Michelle Grimes-Hillman Long Beach City College
Dr. Alex Davis Los Angeles City College
Sandra Sanchez Los Angeles Harbor College
Marla Uliana Los Angeles Mission College
Tom Vessella Los Angeles Pierce College
Dr. Rick Hodge Los Angeles Southwest College
Dr. Marcia Wilson Los Angeles Trade Tech College
Dr. Laurie Nalepa Los Angeles Valley College
Jemma Blake-Judd Mt San Antonio College
Lisa Knuppel Orange Coast College
Dr. Rocco Cifone Pasadena City College
Mike Slavich Rio Hondo College
Anthony Teng Saddleback College
Bart Hoffman Santa Ana College
Dr. Patricia Ramos Santa Monica College
Von Lawson Santiago Canyon College
Carmen Dones West Los Angeles College
Los Angeles/Orange County Regional Consortium
CEO Council
Additional supporters
County College Resource Leadership Council
CCW | 3
The Model
ACQUIRE
1
ENGAGE
2
DISTILL
3TRANSLATE
4
DEVELOP
5
ACQUIRE PERSISTENT DATA AND ANALYSIS
ENGAGE INDUSTRY FOR REAL-TIME, ONGOING DATA COLLECTION AND VALIDATION
DISTILL DETAILED LABOR MARKET INTELLIGENCE
TRANSLATE AND COMMUNICATEDATA INTELLIGENCE TO COLLEGE COMMUNITY
NEW COURSES AND PROGRAMS DEVELOPED/UPDATED
CONTINUING COMMUNICATION
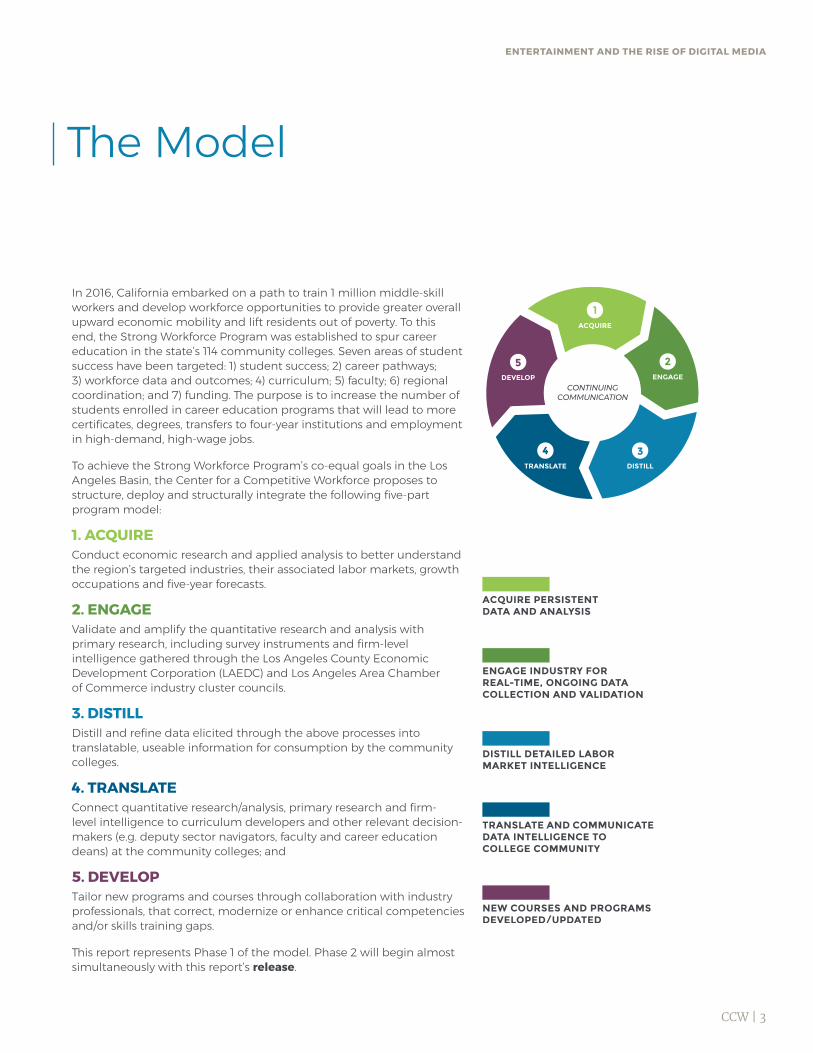
In 2016, California embarked on a path to train 1 million middle-skill workers and develop workforce opportunities to provide greater overall upward economic mobility and lift residents out of poverty. To this end, the Strong Workforce Program was established to spur career education in the state’s 114 community colleges. Seven areas of student success have been targeted: 1) student success; 2) career pathways; 3) workforce data and outcomes; 4) curriculum; 5) faculty; 6) regional coordination; and 7) funding. The purpose is to increase the number of students enrolled in career education programs that will lead to more certificates, degrees, transfers to four-year institutions and employment in high-demand, high-wage jobs.
To achieve the Strong Workforce Program’s co-equal goals in the Los Angeles Basin, the Center for a Competitive Workforce proposes to structure, deploy and structurally integrate the following five-part program model:
1. ACQUIRE Conduct economic research and applied analysis to better understand the region’s targeted industries, their associated labor markets, growth occupations and five-year forecasts.
2. ENGAGE Validate and amplify the quantitative research and analysis with primary research, including survey instruments and firm-level intelligence gathered through the Los Angeles County Economic Development Corporation (LAEDC) and Los Angeles Area Chamber of Commerce industry cluster councils.
3. DISTILL Distill and refine data elicited through the above processes into translatable, useable information for consumption by the community colleges.
4. TRANSLATE Connect quantitative research/analysis, primary research and firm- level intelligence to curriculum developers and other relevant decision-makers (e.g. deputy sector navigators, faculty and career education deans) at the community colleges; and
5. DEVELOP Tailor new programs and courses through collaboration with industry professionals, that correct, modernize or enhance critical competencies and/or skills training gaps.
This report represents Phase 1 of the model. Phase 2 will begin almost simultaneously with this report’s release.
ENTERTAINMENT AND THE RISE OF DIGITAL MEDIA
F or over a century, the entertainment industry has thrived in the Los Angeles Basin, a region encompassing Los Angeles and Orange counties. Known as the home of the motion picture
industry, the Los Angeles Basin also contains a significant portion of the recording industry. The industry’s major companies have much, if not all, of their corporate operations in the region and maintain studios and production facilities across Southern California.
Even so, in a rapidly changing entertainment environment, the Los Angeles Basin is now but one competitor among many domestic and global locales for film and television projects. Following the rise of competitive film incentive programs in Canada in the late-1990s, and their spread across the United States from the early-2000s, the production landscape in the region changed significantly. Feature film projects, being costly and highly mobile, were the first type of production lost in great number to competing jurisdictions.
Due to fierce competition, a shift in viewing habits caused by the emergence of major players, such as Netflix, Hulu and Amazon, and a more competitive California Film & Television Tax Credit Program, television production is now the driving force in the region’s entertainment economy. A combined estimated direct spend for the 2016-17 television season was approximately $6.5 billion for scripted (one-hour and half-hour) television series in the region.
Digitalization and Disruption: The Rise of Digital Media While local industry leaders in film, television and music are still major contributors to the Los Angeles Basin economy, the region’s motion picture and sound recording profile is evolving beyond traditional movie and television production. Digitization is disrupting almost every aspect of the media and entertainment industry from content creation and packaging, to ad platform architecture and distribution, to user interface and feedback. Already, digital is ubiquitous throughout the region’s entertainment industry, accelerating new product acceptance times, altering financing and capitalization strategies, and greatly affecting business models, forecasts and industrywide trends.
To capitalize on these trends, a concentrated and specialized digital media industry has emerged, swiftly scaling and changing the entertainment industry in the Los Angeles Basin by blending digitized content and new distribution technologies.
LA FILM & TVBY THE NUMBERS
CCW | 4
Preface
FILM INDUSTRY ESTABLISHMENTS
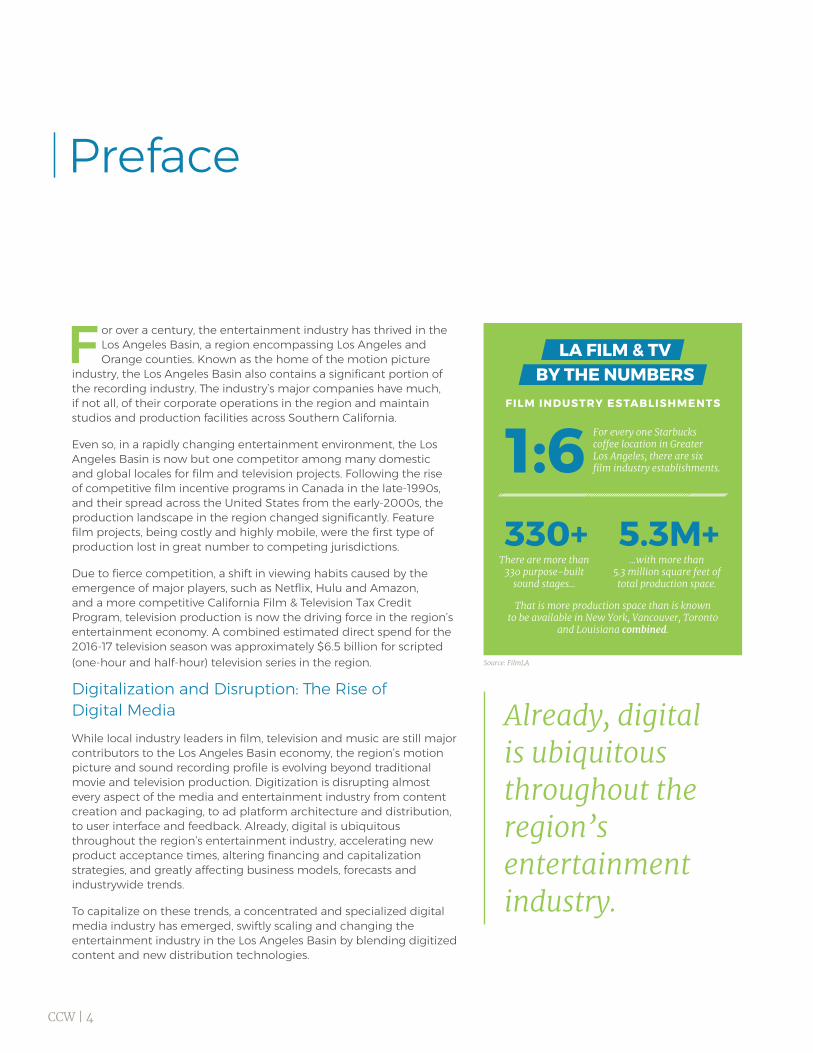
330+ 5.3M+
For every one Starbucks coffee location in Greater Los Angeles, there are six film industry establishments.
There are more than 330 purpose-built
sound stages...
...with more than 5.3 million square feet of total production space.
That is more production space than is known to be available in New York, Vancouver, Toronto
and Louisiana combined.
Already, digital is ubiquitous throughout the region’s entertainment industry.
Source: FilmLA
CCW | 5
TRADTITIONAL MEDIA ACQUIRING
DIGITAL MEDIA
DIGITAL MEDIA TAKING ON
TRADITIONAL MEDIA
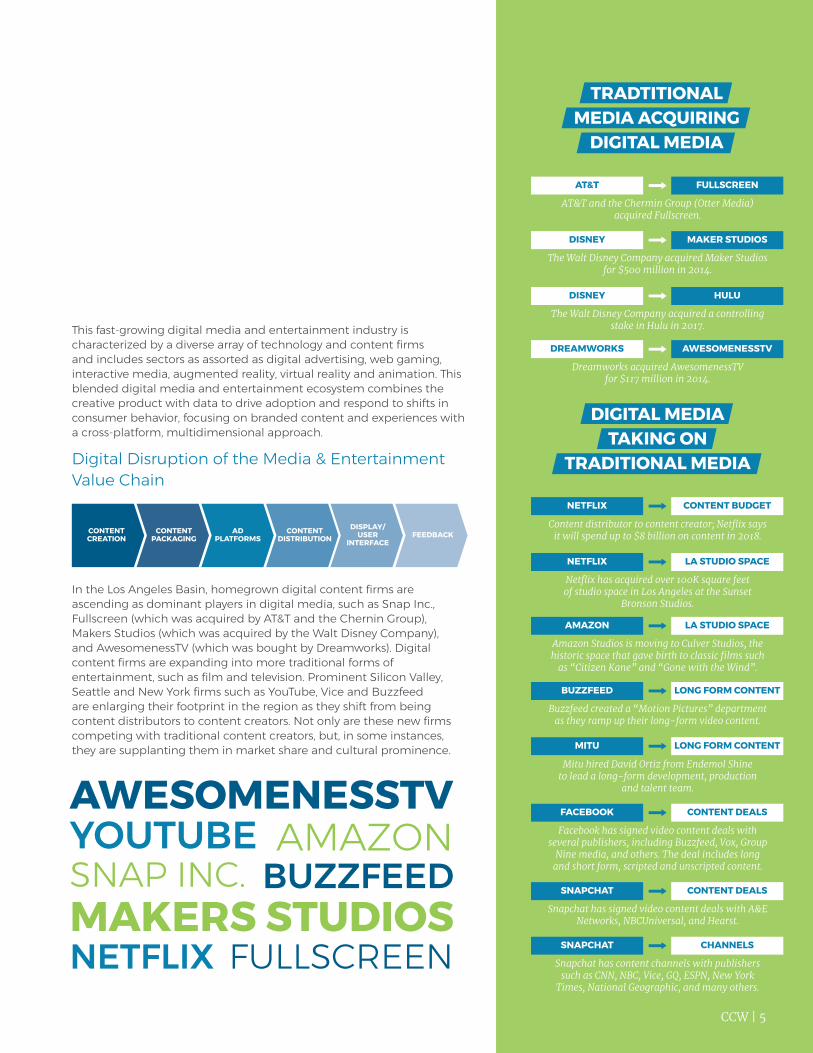
This fast-growing digital media and entertainment industry is characterized by a diverse array of technology and content firms and includes sectors as assorted as digital advertising, web gaming, interactive media, augmented reality, virtual reality and animation. This blended digital media and entertainment ecosystem combines the creative product with data to drive adoption and respond to shifts in consumer behavior, focusing on branded content and experiences with a cross-platform, multidimensional approach.
Digital Disruption of the Media & Entertainment Value Chain
In the Los Angeles Basin, homegrown digital content firms are ascending as dominant players in digital media, such as Snap Inc., Fullscreen (which was acquired by AT&T and the Chernin Group), Makers Studios (which was acquired by the Walt Disney Company), and AwesomenessTV (which was bought by Dreamworks). Digital content firms are expanding into more traditional forms of entertainment, such as film and television. Prominent Silicon Valley, Seattle and New York firms such as YouTube, Vice and Buzzfeed are enlarging their footprint in the region as they shift from being content distributors to content creators. Not only are these new firms competing with traditional content creators, but, in some instances, they are supplanting them in market share and cultural prominence.
YOUTUBE
CONTENT CREATION
CONTENT PACKAGING
ADPLATFORMS
CONTENTDISTRIBUTION
DISPLAY/USER
INTERFACEFEEDBACK
AT&T and the Chermin Group (Otter Media) acquired Fullscreen.
Content distributor to content creator; Netflix says it will spend up to $8 billion on content in 2018.
Mitu hired David Ortiz from Endemol Shine to lead a long-form development, production
and talent team.
The Walt Disney Company acquired Maker Studios for $500 million in 2014.
Netflix has acquired over 100K square feet of studio space in Los Angeles at the Sunset
Bronson Studios.
Facebook has signed video content deals with several publishers, including Buzzfeed, Vox, Group
Nine media, and others. The deal includes long and short form, scripted and unscripted content.
The Walt Disney Company acquired a controlling stake in Hulu in 2017.
Amazon Studios is moving to Culver Studios, the historic space that gave birth to classic films such
as “Citizen Kane” and “Gone with the Wind”.
Snapchat has signed video content deals with A&E Networks, NBCUniversal, and Hearst.
Dreamworks acquired AwesomenessTV for $117 million in 2014.
Buzzfeed created a “Motion Pictures” department as they ramp up their long-form video content.
Snapchat has content channels with publishers such as CNN, NBC, Vice, GQ, ESPN, New York
Times, National Geographic, and many others.
AT&T
NETFLIX
MITU
DISNEY
NETFLIX
DISNEY
AMAZON
SNAPCHAT
DREAMWORKS
BUZZFEED
SNAPCHAT
FULLSCREEN
CONTENT BUDGET
LONG FORM CONTENT
MAKER STUDIOS
LA STUDIO SPACE
CONTENT DEALS
HULU
LA STUDIO SPACE
CONTENT DEALS
AWESOMENESSTV
LONG FORM CONTENT
CHANNELS
AWESOMENESSTV
BUZZFEEDAMAZON
FULLSCREENMAKERS STUDIOSNETFLIX
SNAP INC.

CCW | 6
CCW | 7
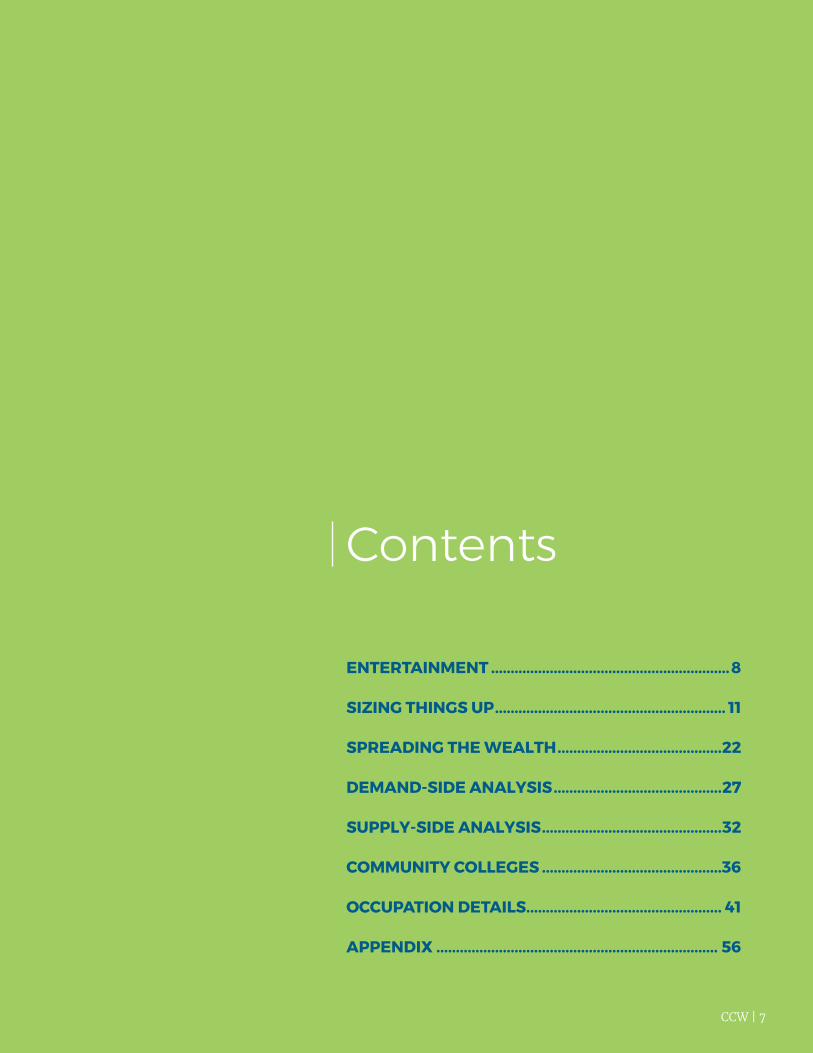
ENTERTAINMENT .............................................................8
SIZING THINGS UP ........................................................... 11
SPREADING THE WEALTH ..........................................22
DEMAND-SIDE ANALYSIS ...........................................27
SUPPLY-SIDE ANALYSIS ..............................................32
COMMUNITY COLLEGES ..............................................36
OCCUPATION DETAILS .................................................. 41
APPENDIX ........................................................................ 56
Contents
An industry disrupted.
CCW | 8
In the Center for a Competitive Workforce’s baseline report “L.A. & Orange County Community Colleges: Powering Economic Opportunity” published in October 2017, the LAEDC’s Institute for
Applied Economics identified six target industries in the Los Angeles Basin expected to undergo significant middle-skill job growth between 2016 and 2021. Entertainment was one of the six identified industries and an obvious choice for the center’s first “deep-dive” report.
Entertainment is a prominent industry that is highly concentrated and growing in the region. It offers significant economic benefits in terms of both wealth generation and opportunities for students attending community colleges in the region. This and other forthcoming deep-dive reports are intended to build knowledge concerning the region’s labor markets and provide a broader understanding of middle-skill workforce gaps, as gauged by the difference between industry needs and community college program completions.
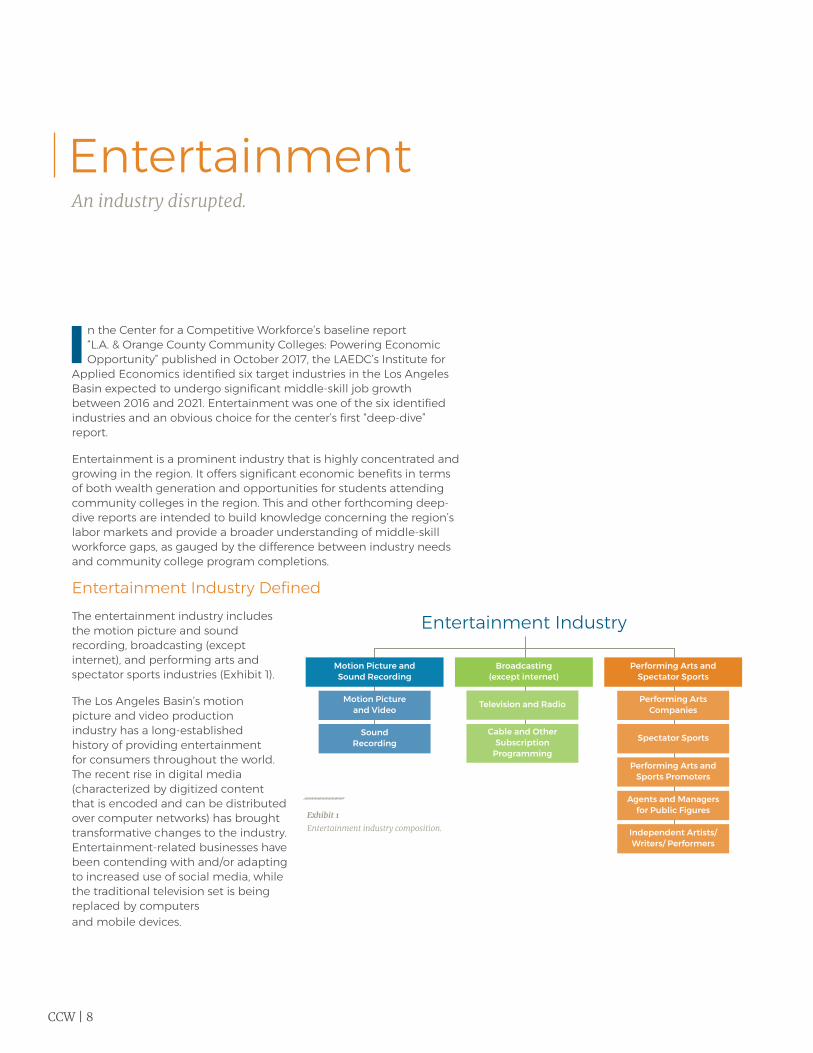
Entertainment Industry DefinedThe entertainment industry includes the motion picture and sound recording, broadcasting (except internet), and performing arts and spectator sports industries (Exhibit 1).
The Los Angeles Basin’s motion picture and video production industry has a long-established history of providing entertainment for consumers throughout the world. The recent rise in digital media (characterized by digitized content that is encoded and can be distributed over computer networks) has brought transformative changes to the industry. Entertainment-related businesses have been contending with and/or adapting to increased use of social media, while the traditional television set is being replaced by computers and mobile devices.
Entertainment
Exhibit 1Entertainment industry composition.
Entertainment Industry
Motion Picture and Sound Recording
Broadcasting (except internet)
Performing Arts and Spectator Sports
Motion Picture and Video Television and Radio Performing Arts
Companies
Sound Recording
Cable and Other Subscription
Programming
Spectator Sports
Performing Arts and Sports Promoters
Agents and Managers for Public Figures
Independent Artists/ Writers/ Performers
Digital media is a disruptive force across numerous industries.
CCW | 9
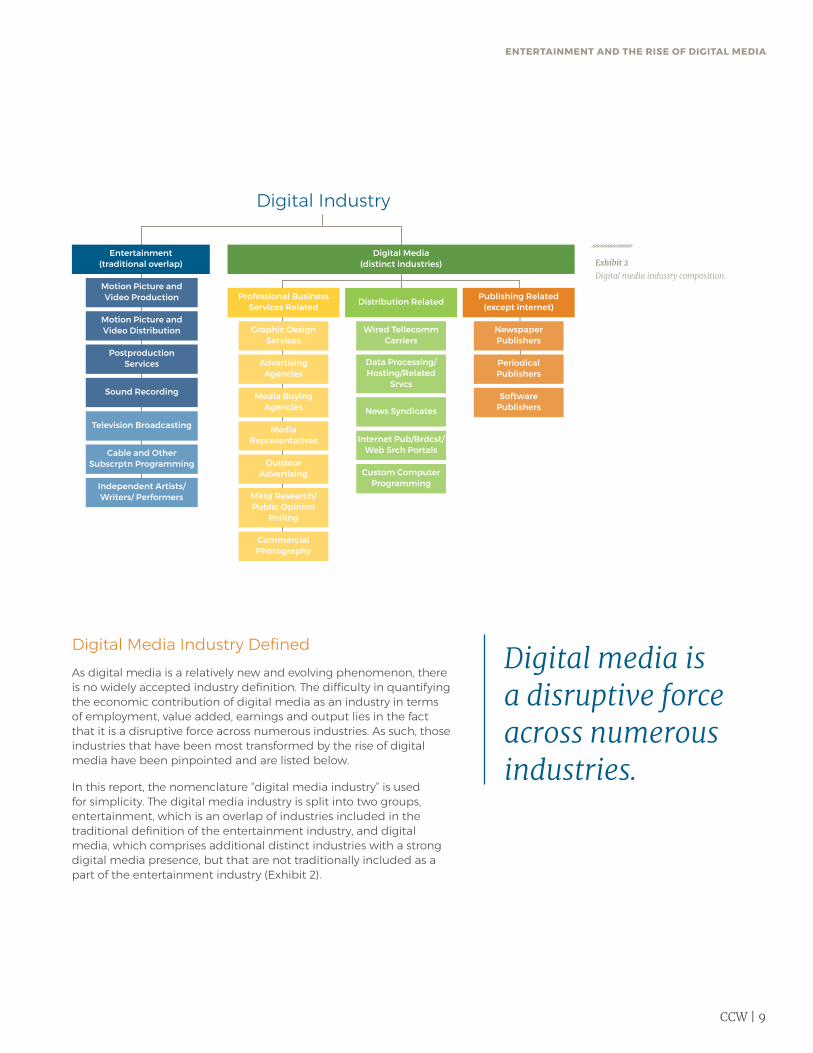
Digital Media Industry DefinedAs digital media is a relatively new and evolving phenomenon, there is no widely accepted industry definition. The difficulty in quantifying the economic contribution of digital media as an industry in terms of employment, value added, earnings and output lies in the fact that it is a disruptive force across numerous industries. As such, those industries that have been most transformed by the rise of digital media have been pinpointed and are listed below.
In this report, the nomenclature “digital media industry” is used for simplicity. The digital media industry is split into two groups, entertainment, which is an overlap of industries included in the traditional definition of the entertainment industry, and digital media, which comprises additional distinct industries with a strong digital media presence, but that are not traditionally included as a part of the entertainment industry (Exhibit 2).
Digital Industry
Entertainment(traditional overlap)
Digital Media (distinct industries)
Motion Picture and Video Production
Sound Recording
Professional Business Services Related
Graphic Design Services
Advertising Agencies
Media Buying Agencies
Media Representatives
Outdoor Advertising
Commercial Photography
Mktg Research/ Public Opinion
Polling
Publishing Related (except internet)
Newspaper Publishers
Periodical Publishers
Software Publishers
Distribution Related
Wired Tellecomm Carriers
Data Processing/ Hosting/Related
Srvcs
News Syndicates
Internet Pub/Brdcst/ Web Srch Portals
Custom Computer Programming
Motion Picture and Video Distribution
Television Broadcasting
Postproduction Services
Cable and Other Subscrptn Programming
Independent Artists/ Writers/ Performers
Exhibit 2Digital media industry composition.
ENTERTAINMENT AND THE RISE OF DIGITAL MEDIA
CCW | 10
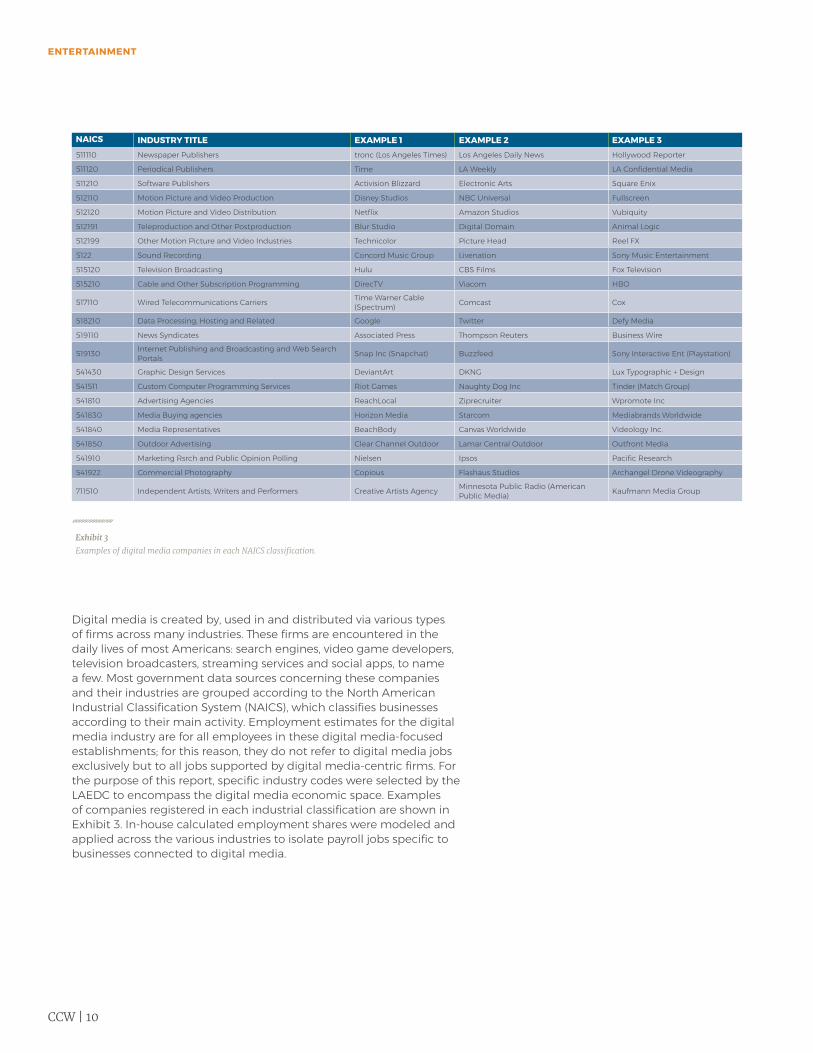
Digital media is created by, used in and distributed via various types of firms across many industries. These firms are encountered in the daily lives of most Americans: search engines, video game developers, television broadcasters, streaming services and social apps, to name a few. Most government data sources concerning these companies and their industries are grouped according to the North American Industrial Classification System (NAICS), which classifies businesses according to their main activity. Employment estimates for the digital media industry are for all employees in these digital media-focused establishments; for this reason, they do not refer to digital media jobs exclusively but to all jobs supported by digital media-centric firms. For the purpose of this report, specific industry codes were selected by the LAEDC to encompass the digital media economic space. Examples of companies registered in each industrial classification are shown in Exhibit 3. In-house calculated employment shares were modeled and applied across the various industries to isolate payroll jobs specific to businesses connected to digital media.
Exhibit 3Examples of digital media companies in each NAICS classification.
NAICS INDUSTRY TITLE EXAMPLE 1 EXAMPLE 2 EXAMPLE 3511110 Newspaper Publishers tronc (Los Angeles Times) Los Angeles Daily News Hollywood Reporter
511120 Periodical Publishers Time LA Weekly LA Confidential Media
511210 Software Publishers Activision Blizzard Electronic Arts Square Enix
512110 Motion Picture and Video Production Disney Studios NBC Universal Fullscreen
512120 Motion Picture and Video Distribution Netflix Amazon Studios Vubiquity
512191 Teleproduction and Other Postproduction Blur Studio Digital Domain Animal Logic
512199 Other Motion Picture and Video Industries Technicolor Picture Head Reel FX
5122 Sound Recording Concord Music Group Livenation Sony Music Entertainment
515120 Television Broadcasting Hulu CBS Films Fox Television
515210 Cable and Other Subscription Programming DirecTV Viacom HBO
517110 Wired Telecommunications Carriers Time Warner Cable (Spectrum) Comcast Cox
518210 Data Processing, Hosting and Related Google Twitter Defy Media
519110 News Syndicates Associated Press Thompson Reuters Business Wire
519130 Internet Publishing and Broadcasting and Web Search Portals Snap Inc (Snapchat) Buzzfeed Sony Interactive Ent (Playstation)
541430 Graphic Design Services DeviantArt DKNG Lux Typographic + Design
541511 Custom Computer Programming Services Riot Games Naughty Dog Inc Tinder (Match Group)
541810 Advertising Agencies ReachLocal Ziprecruiter Wpromote Inc
541830 Media Buying agencies Horizon Media Starcom Mediabrands Worldwide
541840 Media Representatives BeachBody Canvas Worldwide Videology Inc.
541850 Outdoor Advertising Clear Channel Outdoor Lamar Central Outdoor Outfront Media
541910 Marketing Rsrch and Public Opinion Polling Nielsen Ipsos Pacific Research
541922 Commercial Photography Copious Flashaus Studios Archangel Drone Videography
711510 Independent Artists, Writers and Performers Creative Artists Agency Minnesota Public Radio (American Public Media) Kaufmann Media Group
ENTERTAINMENT

CCW | 11
A nalysis of entertainment industry trends provides insights into the challenges and opportunities facing the industry’s workers and employers. Understanding where the jobs are
now, and in the future, is critical. This information can be used to tailor training and career education programs as well as regional policies to prepare for these changes. Industry and education leaders in the Los Angeles Basin have committed to strengthening the regional talent development system to fill the jobs of the future with a workforce that is competitive in a fast-changing global economy.
In this section, job counts, changes in payroll employment and wages are discussed for the two counties comprising the Los Angeles Basin, Los Angeles and Orange.
The digital media and entertainment industries employed 306,550 payroll workers in the Los Angeles Basin in 2016, accounting for 5.2 percent of total regional employment (Exhibit 4). Between the two industries, 121,180 workers were employed in “overlap” industries, those spanning the digital media and entertainment industry definitions. Examples of overlap industries are motion picture and video production, post production services, and independent artists, writers and performers.
The composition of digital media and entertainment industry employment in the two counties varies (Exhibit 5). As a result, the concentration of specific occupations and middle-skill employment opportunities also will differ.
Sizing Things Up The industry defined.
Exhibit 4Employment distribution across entertainment and digital media industries.
28%
39.5%
32.5%
85,690Digital Media (distinct)
121,180Digital Media and
Entertainment Overlap
99,680Entertainment
306,550payroll jobs
Exhibit 5Entertainment and digital media employment distribution in Los Angeles and Orange counties in 2016.
LOS ANGELES ORANGE COUNTY
65%
24.1%
55.7%
20.2% 30.6%4.3%
Digital Media (distinct)
Digital Media (distinct)
Digital Media/ Entertainment
Overlap
Entertainment Entertainment
Digital Media/ Entertainment
Overlap
Sources: QCEW; Estimates by LAEDC
ENTERTAINMENT AND THE RISE OF DIGITAL MEDIA

CCW | 12
Industry Employment
Entertainment IndustryThe entertainment industry includes: motion picture and sound recording (NAICS 512); broadcasting, excluding internet (NAICS 515); and performing arts and spectator sports (NAICS 711).
Broadcasting (except internet) is broadly divided into two branches: TV and radio broadcasting; and cable and other subscription programming. Cable and other subscription programming includes cable TV networks, pay-per-view programming, satellite TV networks, and subscription television networks and services.
Performing arts and spectator sports is broadly divided into four branches: performing arts companies; spectator sports; promoters, agents and managers; and independent artists, writers and performers. Independent artists, writers and performers include freelance individuals (e.g., actors, producers, dancers, artists) performing in artistic productions, creating artistic and cultural works or productions, or providing technical expertise for these productions.
Using this definition, the industry employed 220,860 payroll workers in the Los Angeles Basin in 2016, accounting for more than 75 percent of all entertainment employment in California and nearly 20 percent (18.7 percent in 2016) of entertainment employment nationwide. Motion picture and sound recording industries accounted for 68 percent of total industry employment. Promoters, agents and managers had the next largest share, with just over 10 percent, or 22,310 jobs.
Exhibit 6Employment distribution across the entertainment industry.
220,860payroll jobs
68.1%
10.1%
7.5%
5.5%3.2%2.9%2.7%
150,370Motion Picture/ Sound Recording
22,310Promoters/Agents/ Managers
16,560TV and Radio Broadcasting
12,150Independent Artists/Writers/ Performers
7,140Performing Arts Cos
6,430Spectator Sports
5,900 Cable/Other Subscription Prog
Jobs in entertainment grew four times as fast compared to the regional economy as a whole.
SIZING THINGS UP
CCW | 13
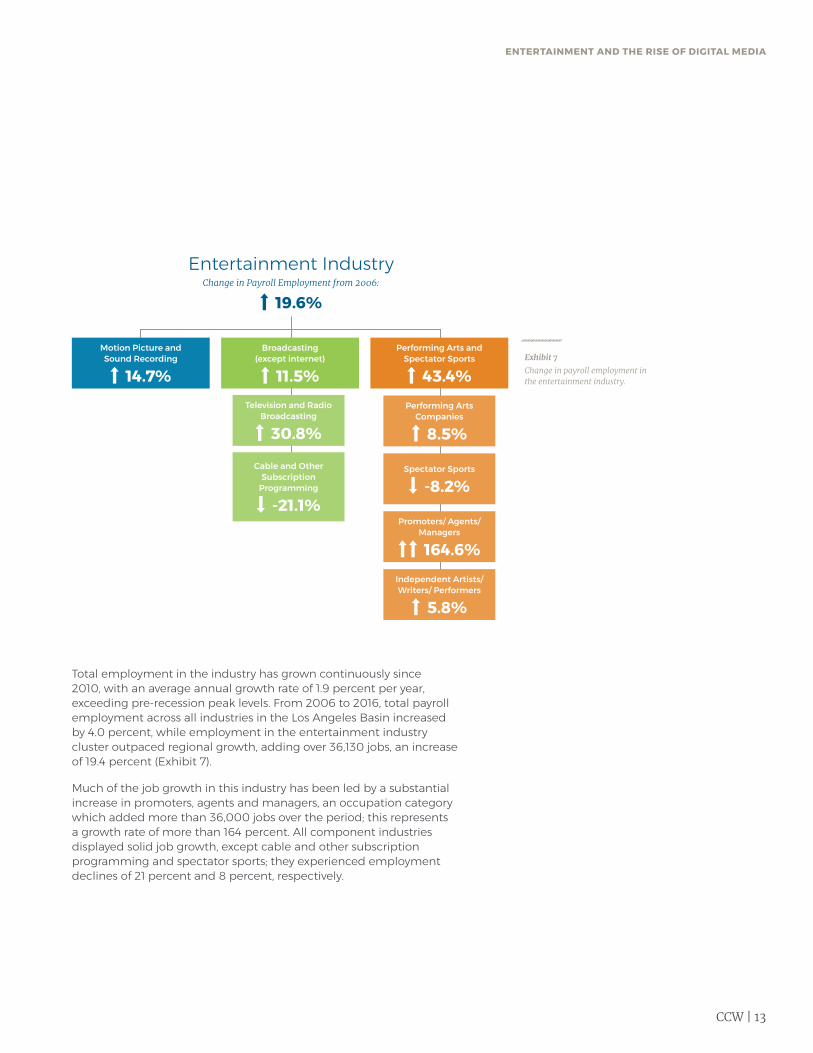
Total employment in the industry has grown continuously since 2010, with an average annual growth rate of 1.9 percent per year, exceeding pre-recession peak levels. From 2006 to 2016, total payroll employment across all industries in the Los Angeles Basin increased by 4.0 percent, while employment in the entertainment industry cluster outpaced regional growth, adding over 36,130 jobs, an increase of 19.4 percent (Exhibit 7).
Much of the job growth in this industry has been led by a substantial increase in promoters, agents and managers, an occupation category which added more than 36,000 jobs over the period; this represents a growth rate of more than 164 percent. All component industries displayed solid job growth, except cable and other subscription programming and spectator sports; they experienced employment declines of 21 percent and 8 percent, respectively.
Exhibit 7Change in payroll employment in the entertainment industry.
Change in Payroll Employment from 2006:
Entertainment Industry
Motion Picture and Sound Recording
14.7%
Broadcasting (except internet)
11.5%
Performing Arts and Spectator Sports
43.4%Television and Radio
Broadcasting
30.8%
Performing Arts Companies
8.5%
Cable and Other Subscription
Programming
-21.1%
Spectator Sports
-8.2%
Promoters/ Agents/ Managers
164.6%
Independent Artists/ Writers/ Performers
5.8%
19.6%
ENTERTAINMENT AND THE RISE OF DIGITAL MEDIA
CCW | 14
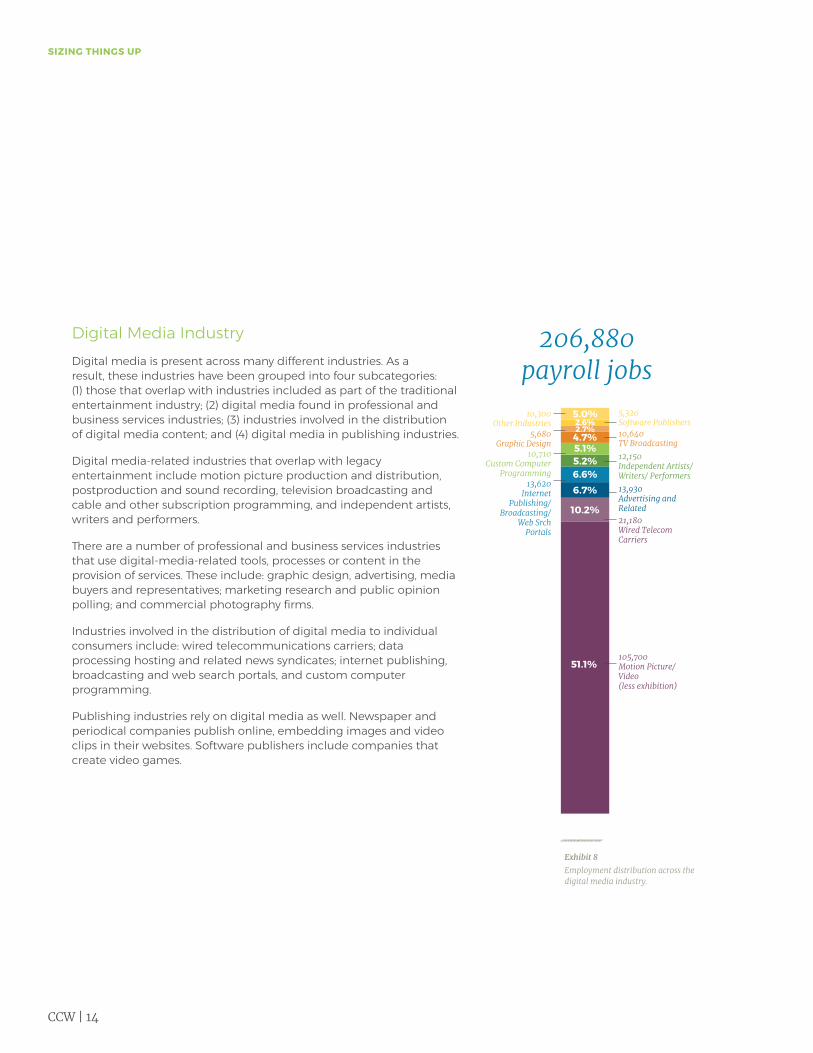
Digital Media IndustryDigital media is present across many different industries. As a result, these industries have been grouped into four subcategories: (1) those that overlap with industries included as part of the traditional entertainment industry; (2) digital media found in professional and business services industries; (3) industries involved in the distribution of digital media content; and (4) digital media in publishing industries.
Digital media-related industries that overlap with legacy entertainment include motion picture production and distribution, postproduction and sound recording, television broadcasting and cable and other subscription programming, and independent artists, writers and performers.
There are a number of professional and business services industries that use digital-media-related tools, processes or content in the provision of services. These include: graphic design, advertising, media buyers and representatives; marketing research and public opinion polling; and commercial photography firms.
Industries involved in the distribution of digital media to individual consumers include: wired telecommunications carriers; data processing hosting and related news syndicates; internet publishing, broadcasting and web search portals, and custom computer programming.
Publishing industries rely on digital media as well. Newspaper and periodical companies publish online, embedding images and video clips in their websites. Software publishers include companies that create video games.
Exhibit 8Employment distribution across the digital media industry.
206,880payroll jobs
51.1%
10.2%
6.7%6.6%5.2%5.1%4.7%2.7%2.6%
5.0%
13,930Advertising and Related21,180 Wired Telecom Carriers
105,700 Motion Picture/Video (less exhibition)
13,620Internet
Publishing/ Broadcasting/
Web Srch Portals
12,150Independent Artists/Writers/ Performers
10,710Custom Computer
Programming
5,320 Software Publishers
10,300Other Industries
10,640TV Broadcasting
5,680Graphic Design
SIZING THINGS UP
CCW | 15
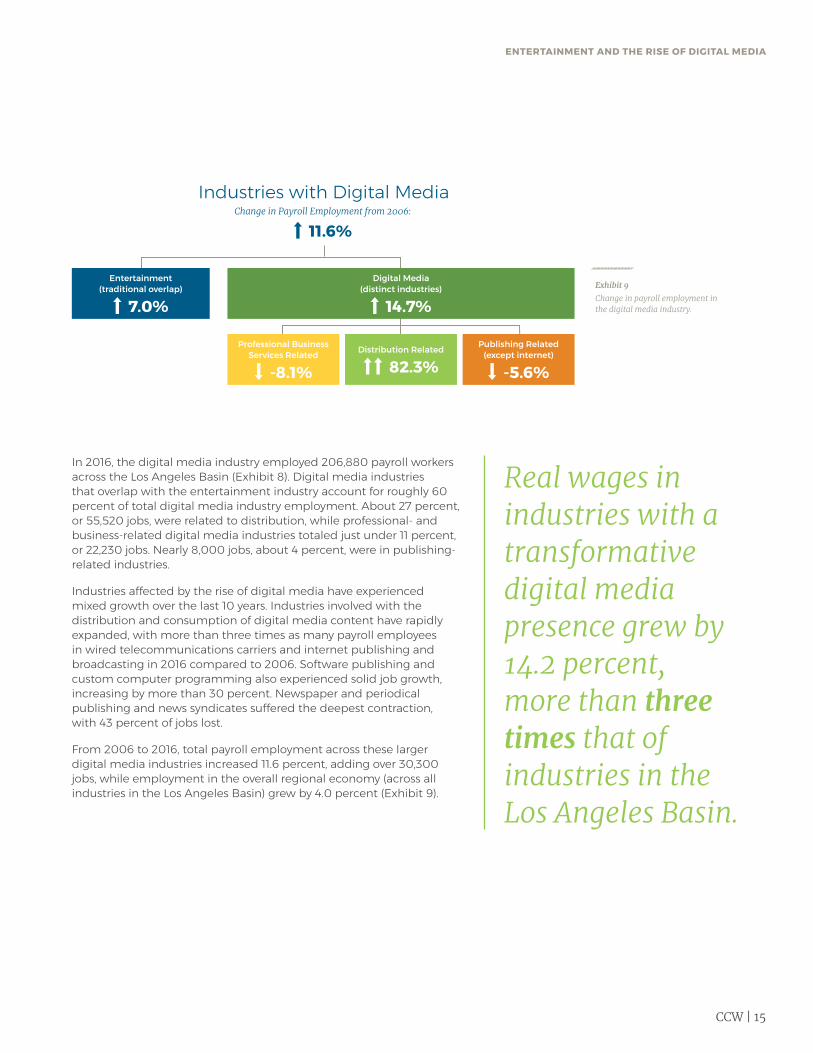
In 2016, the digital media industry employed 206,880 payroll workers across the Los Angeles Basin (Exhibit 8). Digital media industries that overlap with the entertainment industry account for roughly 60 percent of total digital media industry employment. About 27 percent, or 55,520 jobs, were related to distribution, while professional- and business-related digital media industries totaled just under 11 percent, or 22,230 jobs. Nearly 8,000 jobs, about 4 percent, were in publishing-related industries.
Industries affected by the rise of digital media have experienced mixed growth over the last 10 years. Industries involved with the distribution and consumption of digital media content have rapidly expanded, with more than three times as many payroll employees in wired telecommunications carriers and internet publishing and broadcasting in 2016 compared to 2006. Software publishing and custom computer programming also experienced solid job growth, increasing by more than 30 percent. Newspaper and periodical publishing and news syndicates suffered the deepest contraction, with 43 percent of jobs lost.
From 2006 to 2016, total payroll employment across these larger digital media industries increased 11.6 percent, adding over 30,300 jobs, while employment in the overall regional economy (across all industries in the Los Angeles Basin) grew by 4.0 percent (Exhibit 9).
Real wages in industries with a transformative digital media presence grew by 14.2 percent, more than three times that of industries in the Los Angeles Basin.
Exhibit 9Change in payroll employment in the digital media industry.
Change in Payroll Employment from 2006:
Industries with Digital Media
11.6%
Entertainment(traditional overlap)
7.0%
Digital Media (distinct industries)
14.7%
Professional Business Services Related
-8.1%
Publishing Related (except internet)
-5.6%Distribution Related
82.3%
ENTERTAINMENT AND THE RISE OF DIGITAL MEDIA

CCW | 16
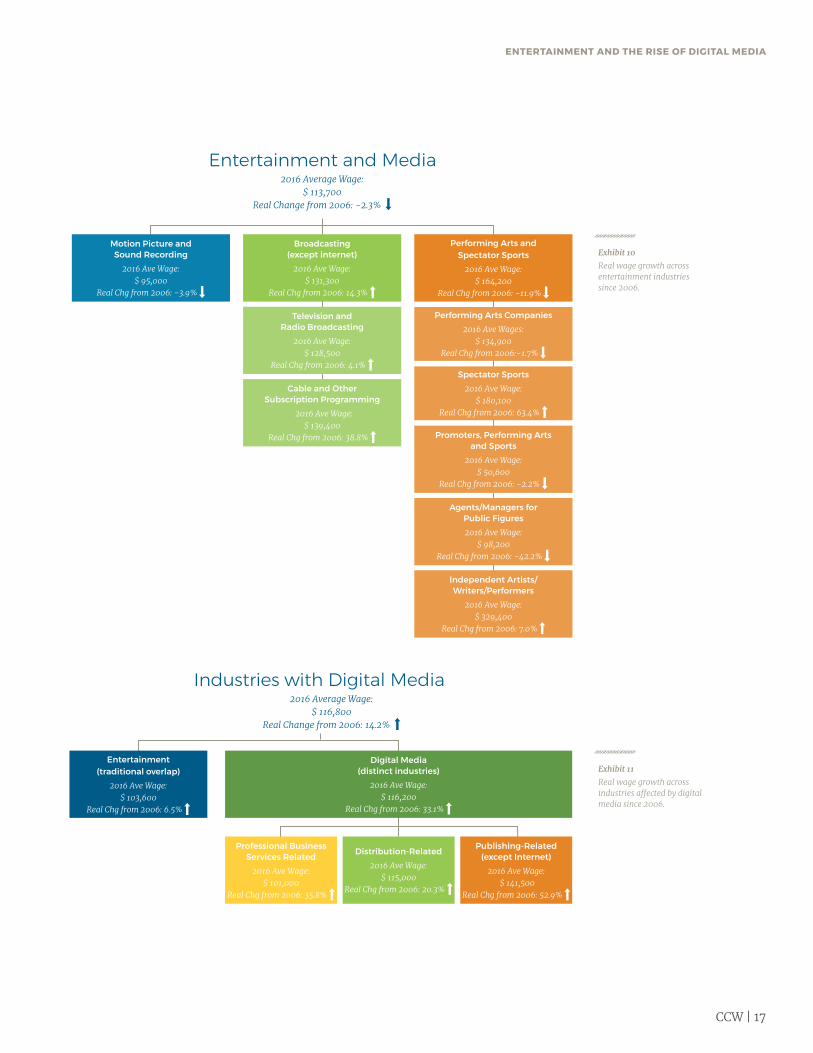
Wages in the IndustryEntertainment and digital media industry employees are among the highest-paid employees in the regional economy. Overall, employees in entertainment earned, on average, $113,720 annually, and those employed in digital media earned $116,820. These earnings are more than double the regional average across all industries, $59,890 annually.
However, some industries in entertainment and digital media pay lower wages. For example, the performing arts and sports promoters industry pays on average $50,560 per year and the graphic design and market research industries pay $77,390 per year.
The industry with the highest wages is independent artists, writers and performers with $329,400 in average annual earnings. These average wages reflect independent producers, movie stars and sports figures, many of whom have very high wages that skew the industry’s average wage.
Real wages in industries identified as having a transformative digital media presence grew overall by 14.2 percent, more than three times the growth of all industries in the Los Angeles Basin, where inflation-adjusted (real) wages increased by nearly 4 percent. In contrast, wages in the entertainment industry declined by 2.3 percent, an annual average growth rate of -0.2 percent.
Wage growth has been fastest in the spectator sports, 63 percent growth, and cable and other subscription programming industries, 40 percent growth, between 2006 and 2016. There were two digital media-influenced industries that had the strongest real wage growth. Graphic design, market research and commercial photography experienced a wage increase of 94 percent. Wages increased by 49 percent in data processing, data hosting and related activities.
SIZING THINGS UP
CCW | 17
ENTERTAINMENT AND THE RISE OF DIGITAL MEDIA
2016 Average Wage:$ 113,700
Real Change from 2006: -2.3%
Exhibit 10Real wage growth across entertainment industries since 2006.
Exhibit 11Real wage growth across industries affected by digital media since 2006.
2016 Average Wage: $ 116,800
Real Change from 2006: 14.2%
Industries with Digital Media
Entertainment(traditional overlap)
2016 Ave Wage:$ 103,600
Real Chg from 2006: 6.5%
Digital Media (distinct industries)
2016 Ave Wage:$ 116,200
Real Chg from 2006: 33.1%
Professional Business Services Related
2016 Ave Wage:$ 101,000
Real Chg from 2006: 35.8%
Publishing-Related (except Internet)
2016 Ave Wage: $ 141,500
Real Chg from 2006: 52.9%
Distribution-Related 2016 Ave Wage:
$ 115,000Real Chg from 2006: 20.3%
Entertainment and Media
Motion Picture and Sound Recording
2016 Ave Wage:$ 95,000
Real Chg from 2006: -3.9%
Broadcasting (except internet)
2016 Ave Wage:$ 131,300
Real Chg from 2006: 14.3%
Performing Arts and Spectator Sports
2016 Ave Wage:$ 164,200
Real Chg from 2006: -11.9%
Television and Radio Broadcasting
2016 Ave Wage:$ 128,500
Real Chg from 2006: 4.1%
Performing Arts Companies2016 Ave Wages:
$ 134,900Real Chg from 2006:-1.7%
Cable and Other Subscription Programming
2016 Ave Wage:$ 139,400
Real Chg from 2006: 38.8%
Spectator Sports2016 Ave Wage:
$ 180,100Real Chg from 2006: 63.4%
Promoters, Performing Arts and Sports
2016 Ave Wage:$ 50,600
Real Chg from 2006: -2.2%
Agents/Managers for Public Figures2016 Ave Wage:
$ 98,200Real Chg from 2006: -42.2%
Independent Artists/ Writers/Performers
2016 Ave Wage:$ 329,400
Real Chg from 2006: 7.0%
CCW | 18
Competitiveness and Regional AdvantageA region’s competitiveness in an industry is a function of many factors, including the attractiveness and value of the product(s)/service(s) produced/delivered, the costs of inputs such as labor and energy, the productivity of individual firms, and the geographic concentration of the industry. Industries that are highly-concentrated in a region are likely to be more competitive. Entertainment is a clear example of an industry with regional strengths in the Los Angeles Basin because there is a clustering of firms, workers and supporting players that enable the industry to be more specialized, nimble, and as a result, more competitive.
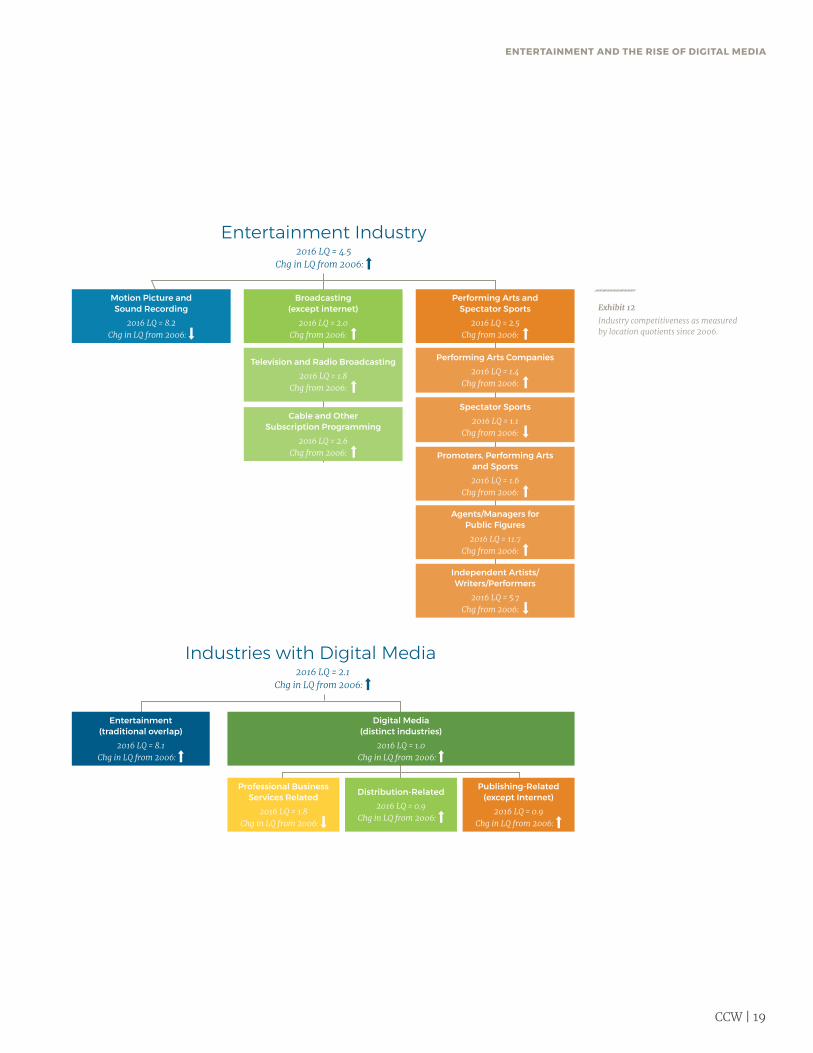
To measure competitiveness, location quotients were used.1 Based on analysis, the region’s entertainment industry continues to be relatively competitive, with a location quotient of 4.5. This means the entertainment industry is over four times more concentrated in the Los Angeles Basin compared to the national average. Industries with a regional digital media presence also are competitive, with a location quotient of 2.1.
Changes in competitiveness over time show whether an industry in a region is gaining or losing competitive strength. In general, location quotients of the region’s component industries are varied and change over time.
The region maintains an impressive competitive strength in motion picture and sound recording, but this has declined slightly since 2006, as other regions have built capacity in this traded industry (Exhibit 12).
Employment has declined in several component industries within the entertainment industry and digital media industries. The change in the location quotient provides some insight into the relative strength of these industries compared to the national average.
Entertainment employment is four and a half times more concentrated in the Los Angeles Basin than it is nationwide.
1See appendix for location quotient definition.
SIZING THINGS UP
CCW | 19
2016 LQ = 4.5Chg in LQ from 2006:
2016 LQ = 2.1Chg in LQ from 2006:
Industries with Digital Media
Entertainment(traditional overlap)
2016 LQ = 8.1Chg in LQ from 2006:
Digital Media (distinct industries)
2016 LQ = 1.0Chg in LQ from 2006:
Professional Business Services Related
2016 LQ = 1.8Chg in LQ from 2006:
Publishing-Related (except Internet)
2016 LQ = 0.9Chg in LQ from 2006:
Distribution-Related 2016 LQ = 0.9
Chg in LQ from 2006:
Entertainment Industry
Motion Picture and Sound Recording
2016 LQ = 8.2Chg in LQ from 2006:
Broadcasting (except internet)
2016 LQ = 2.0Chg from 2006:
Performing Arts and Spectator Sports
2016 LQ = 2.5Chg from 2006:
Television and Radio Broadcasting 2016 LQ = 1.8
Chg from 2006:
Performing Arts Companies2016 LQ = 1.4
Chg from 2006:
Cable and Other Subscription Programming
2016 LQ = 2.6Chg from 2006:
Spectator Sports2016 LQ = 1.1
Chg from 2006:
Promoters, Performing Arts and Sports2016 LQ = 1.6
Chg from 2006:
Agents/Managers for Public Figures
2016 LQ = 11.7Chg from 2006:
Independent Artists/ Writers/Performers
2016 LQ = 5.7Chg from 2006:
ENTERTAINMENT AND THE RISE OF DIGITAL MEDIA
Exhibit 12Industry competitiveness as measured by location quotients since 2006.
CCW | 20
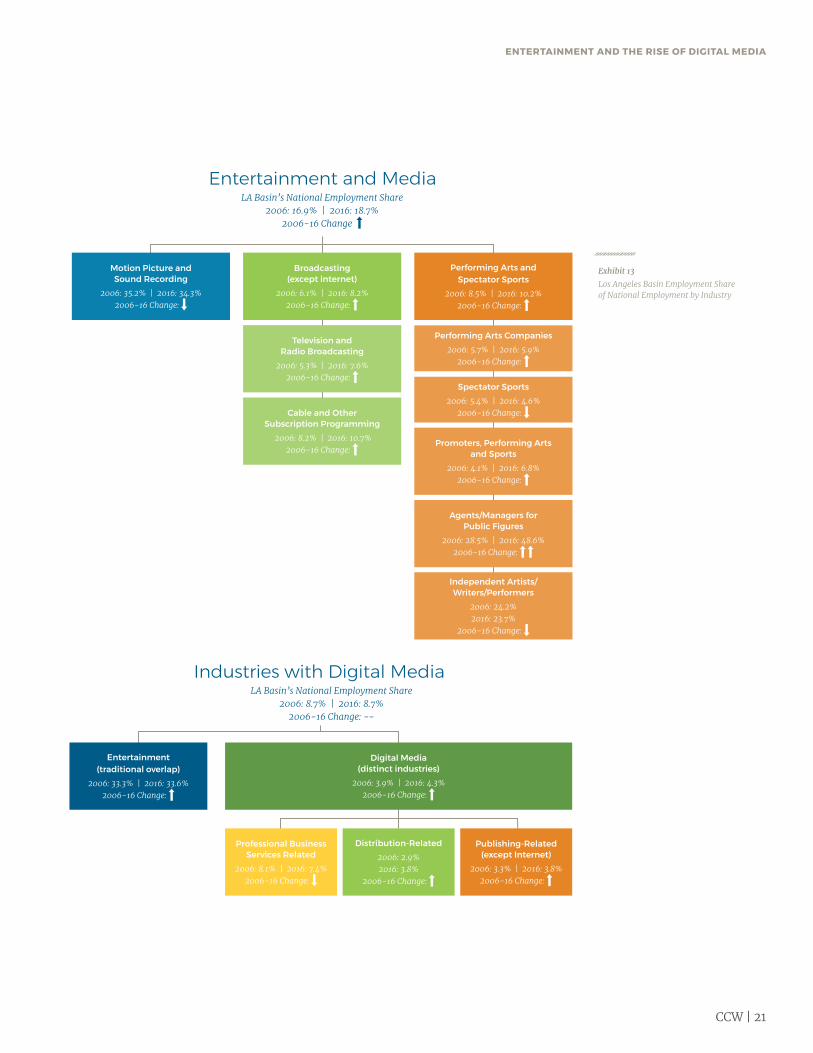
Overall, the region’s share of national entertainment industry employment has grown over the last 10 years. The Los Angeles Basin accounted for 16.9 percent of all employment in the entertainment industry nationwide in 2006. This share increased to 18.7 percent in 2016, indicating a movement of employment to the region.
For the larger industries in which digital media activity is prominent, their share of national employment has remained a constant 8.7 percent from 2006 to 2016, with minimal fluctuation over the period among component industries.
A closer examination reveals the region is strongest, in terms of its national employment share, in three entertainment industries: motion picture and sound recording; agents and managers for public figures; and independent artists, writers and performers (Exhibit 13). Each of these three industries account for at least a quarter of industry employment nationwide, with nearly half of all agents and managers for public figures in the nation employed in the Los Angeles Basin in 2016.
For industries transformed by digital media, the Los Angeles Basin is strongest in advertising industries and internet publishing, accounting for 8 percent of national employment, and broadcasting and web search portals, 6.6 percent of national employment.
The entertainment industry in the Los Angeles Basin grew its national employment share from 16.9 percent in 2006 to 18.7 percent in 2016.
SIZING THINGS UP
CCW | 21
ENTERTAINMENT AND THE RISE OF DIGITAL MEDIA
Exhibit 13Los Angeles Basin Employment Share of National Employment by Industry
LA Basin’s National Employment Share2006: 16.9% | 2016: 18.7%
2006-16 Change
LA Basin’s National Employment Share 2006: 8.7% | 2016: 8.7%
2006-16 Change: --
Industries with Digital Media
Entertainment(traditional overlap)
2006: 33.3% | 2016: 33.6%2006-16 Change:
Digital Media (distinct industries)
2006: 3.9% | 2016: 4.3%2006-16 Change:
Professional Business Services Related
2006: 8.1% | 2016: 7.4%2006-16 Change:
Publishing-Related (except Internet)
2006: 3.3% | 2016: 3.8%2006-16 Change:
Distribution-Related 2006: 2.9%2016: 3.8%
2006-16 Change:
Entertainment and Media
Motion Picture and Sound Recording
2006: 35.2% | 2016: 34.3%2006-16 Change:
Broadcasting (except internet)
2006: 6.1% | 2016: 8.2%2006-16 Change:
Performing Arts and Spectator Sports
2006: 8.5% | 2016: 10.2%2006-16 Change:
Television and Radio Broadcasting
2006: 5.3% | 2016: 7.6%2006-16 Change:
Performing Arts Companies2006: 5.7% | 2016: 5.9%
2006-16 Change:
Cable and Other Subscription Programming
2006: 8.2% | 2016: 10.7%2006-16 Change:
Spectator Sports2006: 5.4% | 2016: 4.6%
2006-16 Change:
Promoters, Performing Arts and Sports
2006: 4.1% | 2016: 6.8%2006-16 Change:
Agents/Managers for Public Figures
2006: 28.5% | 2016: 48.6%2006-16 Change:
Independent Artists/ Writers/Performers
2006: 24.2%2016: 23.7%
2006-16 Change:
CCW | 22
Entertainment impacts a broad spectrum of industries through its supply chain.
T he extent to which an industry’s impact extends to other sectors of the economy and into local households depends on the share of industry revenue recirculated within the region. The
total economic contribution of the entertainment industry to the economy of the Los Angeles Basin is magnified through its supply chain and payroll spending.
Where the Entertainment Industry Spends Its RevenuesFirms generate revenues through sales of their products and services, and use those funds to purchase the inputs needed to produce their products and services, pay workers and taxes, and generate a return on capital in the form of profits.
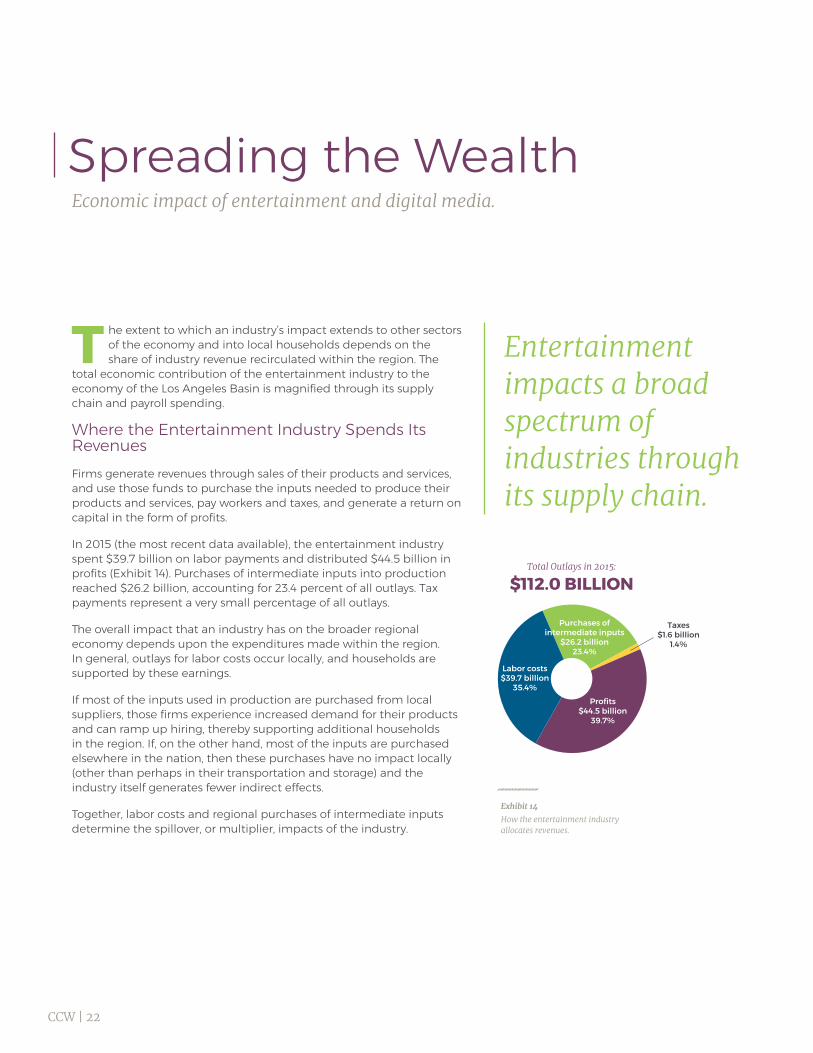
In 2015 (the most recent data available), the entertainment industry spent $39.7 billion on labor payments and distributed $44.5 billion in profits (Exhibit 14). Purchases of intermediate inputs into production reached $26.2 billion, accounting for 23.4 percent of all outlays. Tax payments represent a very small percentage of all outlays.
The overall impact that an industry has on the broader regional economy depends upon the expenditures made within the region. In general, outlays for labor costs occur locally, and households are supported by these earnings.
If most of the inputs used in production are purchased from local suppliers, those firms experience increased demand for their products and can ramp up hiring, thereby supporting additional households in the region. If, on the other hand, most of the inputs are purchased elsewhere in the nation, then these purchases have no impact locally (other than perhaps in their transportation and storage) and the industry itself generates fewer indirect effects.
Together, labor costs and regional purchases of intermediate inputs determine the spillover, or multiplier, impacts of the industry.
Spreading the Wealth Economic impact of entertainment and digital media.
Exhibit 14How the entertainment industry allocates revenues.
$112.0 BILLIONTotal Outlays in 2015:
Labor costs $39.7 billion
35.4%Profits
$44.5 billion39.7%
Purchases of intermediate inputs
$26.2 billion 23.4%
Taxes $1.6 billion
1.4%
CCW | 23
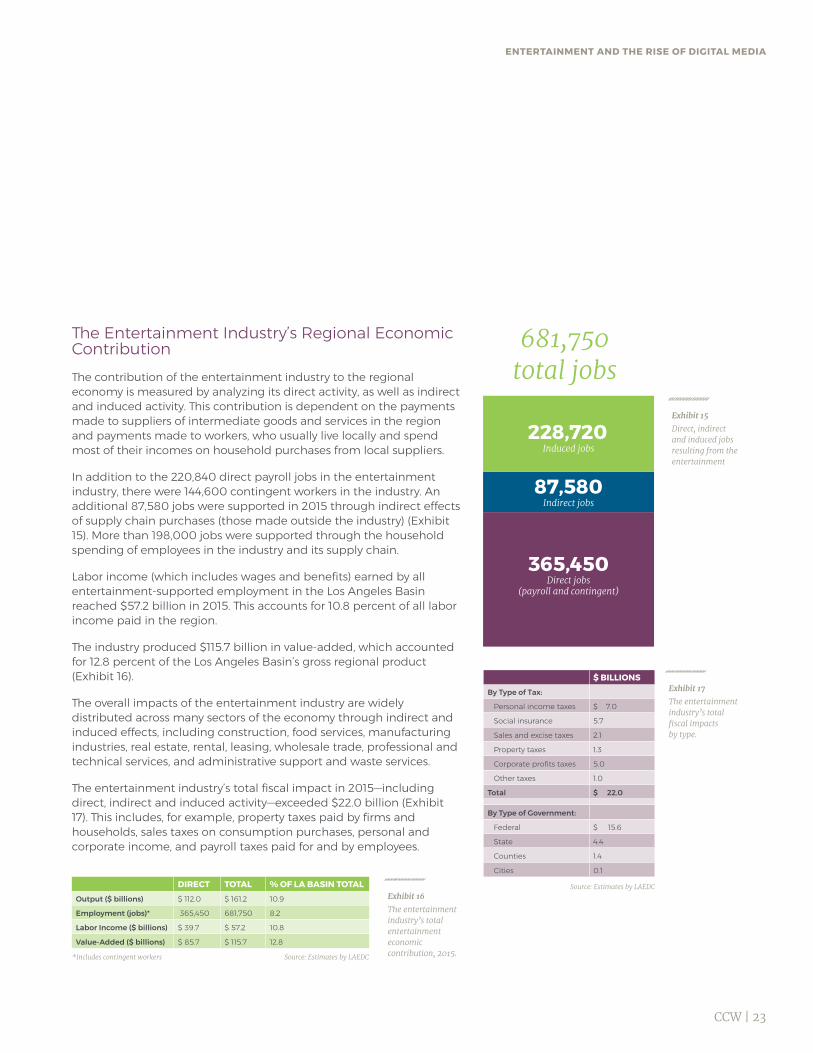
The Entertainment Industry’s Regional Economic Contribution The contribution of the entertainment industry to the regional economy is measured by analyzing its direct activity, as well as indirect and induced activity. This contribution is dependent on the payments made to suppliers of intermediate goods and services in the region and payments made to workers, who usually live locally and spend most of their incomes on household purchases from local suppliers.
In addition to the 220,840 direct payroll jobs in the entertainment industry, there were 144,600 contingent workers in the industry. An additional 87,580 jobs were supported in 2015 through indirect effects of supply chain purchases (those made outside the industry) (Exhibit 15). More than 198,000 jobs were supported through the household spending of employees in the industry and its supply chain.
Labor income (which includes wages and benefits) earned by all entertainment-supported employment in the Los Angeles Basin reached $57.2 billion in 2015. This accounts for 10.8 percent of all labor income paid in the region.
The industry produced $115.7 billion in value-added, which accounted for 12.8 percent of the Los Angeles Basin’s gross regional product (Exhibit 16).
The overall impacts of the entertainment industry are widely distributed across many sectors of the economy through indirect and induced effects, including construction, food services, manufacturing industries, real estate, rental, leasing, wholesale trade, professional and technical services, and administrative support and waste services.
The entertainment industry’s total fiscal impact in 2015—including direct, indirect and induced activity—exceeded $22.0 billion (Exhibit 17). This includes, for example, property taxes paid by firms and households, sales taxes on consumption purchases, personal and corporate income, and payroll taxes paid for and by employees.
Exhibit 15Direct, indirect and induced jobs resulting from the entertainment
228,720
365,450
87,580
Induced jobs
Direct jobs(payroll and contingent)
Indirect jobs
681,750 total jobs
Exhibit 16The entertainment industry’s total entertainment economic contribution, 2015.
DIRECT TOTAL % OF LA BASIN TOTALOutput ($ billions) $ 112.0 $ 161.2 10.9
Employment (jobs)* 365,450 681,750 8.2
Labor Income ($ billions) $ 39.7 $ 57.2 10.8
Value-Added ($ billions) $ 85.7 $ 115.7 12.8
Exhibit 17The entertainment industry’s total fiscal impacts by type.
$ BILLIONS By Type of Tax:
Personal income taxes $ 7.0
Social insurance 5.7
Sales and excise taxes 2.1
Property taxes 1.3
Corporate profits taxes 5.0
Other taxes 1.0
Total $ 22.0
By Type of Government:
Federal $ 15.6
State 4.4
Counties 1.4
Cities 0.1
ENTERTAINMENT AND THE RISE OF DIGITAL MEDIA
*Includes contingent workers Source: Estimates by LAEDC
Source: Estimates by LAEDC
CCW | 24
Entertainment Supply Chain AnalysisThe intermediate purchases of the entertainment industry comprise an important part of the overall economic contribution of the industry. It was shown above that these accounted for 23.4 percent of the industry outlays, or $26.2 billion, in 2015.
Gross inputs are a combination of goods and services. In this industry, approximately 40 percent of intermediate goods are information-related goods and services, such as post production work, software and telecommunications (see left panel in exhibit below). Professional and business services accounted for just over 20 percent of intermediate inputs. These include management services, advertising and public relations, employment services, and other business support services. Financial activities and trade, transportation and utilities, respectively, accounted for 12 percent and five percent of intermediate inputs, including such services as banking and wholesale trade and truck transportation. The remaining 25 percent of inputs were provided by other industries.
About 20 percent of the entertainment industry’s purchases are for professional and business services from firms in the Los Angeles Basin.
SPREADING THE WEALTH
CCW | 25
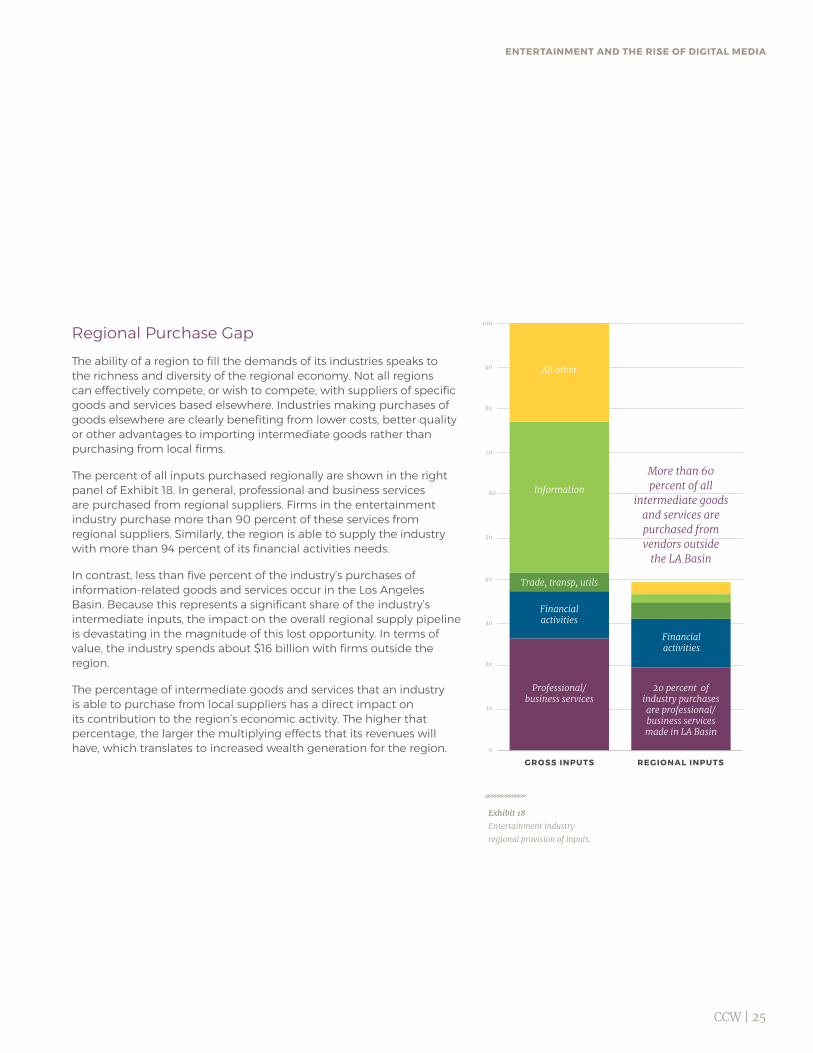
Regional Purchase GapThe ability of a region to fill the demands of its industries speaks to the richness and diversity of the regional economy. Not all regions can effectively compete, or wish to compete, with suppliers of specific goods and services based elsewhere. Industries making purchases of goods elsewhere are clearly benefiting from lower costs, better quality or other advantages to importing intermediate goods rather than purchasing from local firms.
The percent of all inputs purchased regionally are shown in the right panel of Exhibit 18. In general, professional and business services are purchased from regional suppliers. Firms in the entertainment industry purchase more than 90 percent of these services from regional suppliers. Similarly, the region is able to supply the industry with more than 94 percent of its financial activities needs.
In contrast, less than five percent of the industry’s purchases of information-related goods and services occur in the Los Angeles Basin. Because this represents a significant share of the industry’s intermediate inputs, the impact on the overall regional supply pipeline is devastating in the magnitude of this lost opportunity. In terms of value, the industry spends about $16 billion with firms outside the region.
The percentage of intermediate goods and services that an industry is able to purchase from local suppliers has a direct impact on its contribution to the region’s economic activity. The higher that percentage, the larger the multiplying effects that its revenues will have, which translates to increased wealth generation for the region.
ENTERTAINMENT AND THE RISE OF DIGITAL MEDIA
Exhibit 18Entertainment industryregional provision of inputs.
0
20
10
40
30
60
80
50
100
70
90 All other
Information
Trade, transp, utils
Financial activities
Financial activities
Professional/business services
20 percent of industry purchases are professional/ business services made in LA Basin
More than 60 percent of all
intermediate goods and services are purchased from vendors outside
the LA Basin
GROSS INPUTS REGIONAL INPUTS
CCW | 26
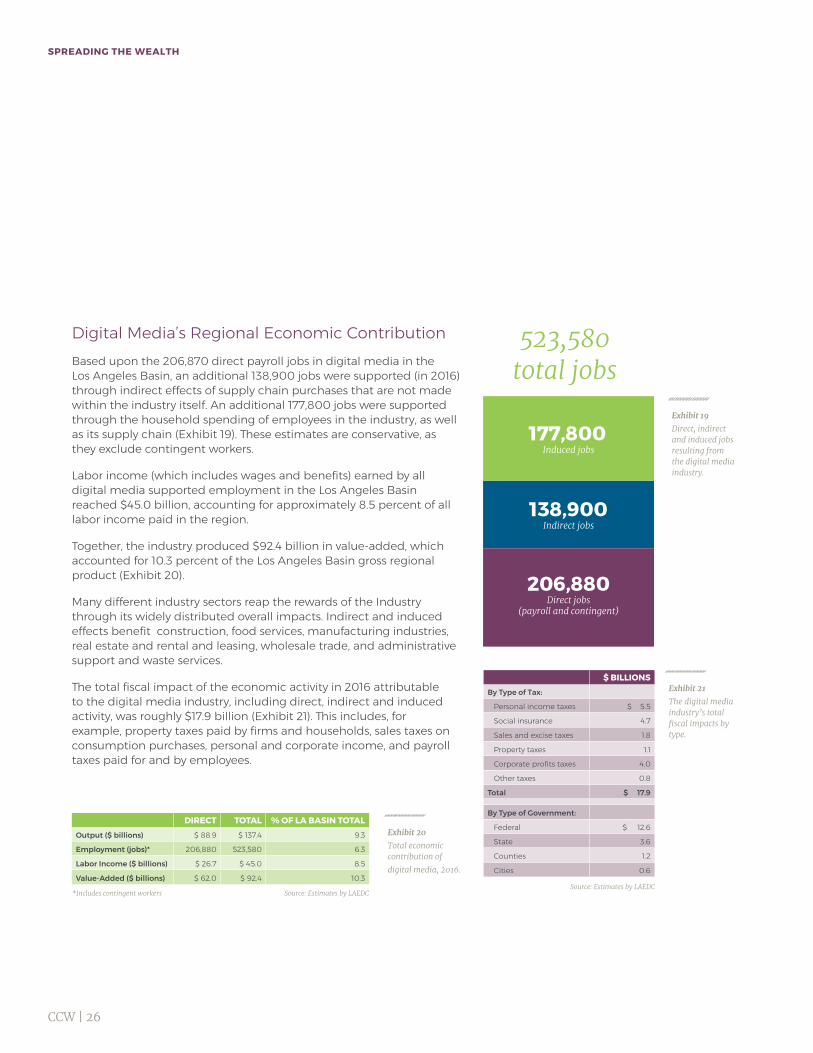
Digital Media’s Regional Economic Contribution Based upon the 206,870 direct payroll jobs in digital media in the Los Angeles Basin, an additional 138,900 jobs were supported (in 2016) through indirect effects of supply chain purchases that are not made within the industry itself. An additional 177,800 jobs were supported through the household spending of employees in the industry, as well as its supply chain (Exhibit 19). These estimates are conservative, as they exclude contingent workers.
Labor income (which includes wages and benefits) earned by all digital media supported employment in the Los Angeles Basin reached $45.0 billion, accounting for approximately 8.5 percent of all labor income paid in the region.
Together, the industry produced $92.4 billion in value-added, which accounted for 10.3 percent of the Los Angeles Basin gross regional product (Exhibit 20).
Many different industry sectors reap the rewards of the Industry through its widely distributed overall impacts. Indirect and induced effects benefit construction, food services, manufacturing industries, real estate and rental and leasing, wholesale trade, and administrative support and waste services.
The total fiscal impact of the economic activity in 2016 attributable to the digital media industry, including direct, indirect and induced activity, was roughly $17.9 billion (Exhibit 21). This includes, for example, property taxes paid by firms and households, sales taxes on consumption purchases, personal and corporate income, and payroll taxes paid for and by employees.
Exhibit 19Direct, indirect and induced jobs resulting from the digital media industry.
177,800
206,880
138,900
Induced jobs
Direct jobs(payroll and contingent)
Indirect jobs
523,580total jobs
Exhibit 20Total economic contribution of digital media, 2016.
DIRECT TOTAL % OF LA BASIN TOTALOutput ($ billions) $ 88.9 $ 137.4 9.3
Employment (jobs)* 206,880 523,580 6.3
Labor Income ($ billions) $ 26.7 $ 45.0 8.5
Value-Added ($ billions) $ 62.0 $ 92.4 10.3
Exhibit 21The digital media industry’s total fiscal impacts by type.
$ BILLIONS By Type of Tax:
Personal income taxes $ 5.5
Social insurance 4.7
Sales and excise taxes 1.8
Property taxes 1.1
Corporate profits taxes 4.0
Other taxes 0.8
Total $ 17.9
By Type of Government:
Federal $ 12.6
State 3.6
Counties 1.2
Cities 0.6
SPREADING THE WEALTH
*Includes contingent workers Source: Estimates by LAEDCSource: Estimates by LAEDC

CCW | 27
Industry outlook and future workforce needs.
Digital media continues to disrupt, transforming traditional forms of entertainment and information.
T o determine where the entertainment industry is headed, the growth of it component industries was forecasted over the next five years and used to extrapolate future workforce needs, that
is, the demand for workers.
Entertainment Industry OutlookBetween 2016 and 2021, very little growth in the entertainment industry is projected in the Los Angeles Basin, with positive net new job growth estimated at 490 jobs (or 0.2 percent) across all skills levels. While growth is projected in the motion picture and sound recording industries group, and the performing arts and spectator sports industries group, there will be significant contraction in broadcasting, where job loss will offset employment gains in other industries.
Over the next five years, the motion picture and sound recording industries expected to add nearly 2,300 jobs to existing employment of 150,400 workers, a growth rate of 1.5 percent (Exhibit 22). Many incumbent industry players are investing in new technologies through strategic mergers and acquisitions, and by creating new divisions, to compete with major digital media players, such as Amazon, Hulu and Netflix, which are directly competing with longstanding movie and television studios. These efforts to compete with disruptive challengers will result in positive, though very slight, growth.
Non-internet broadcasting industries have shed jobs as younger generations have disconnected from traditional media providers in favor of mobile apps, such as Spotify, Hulu and Netflix. As a result, non-internet broadcasting industries are expected to experience substantial employment declines of 12.2 percent over the next five years in the Los Angeles Basin.
Performing arts and spectator sports industries are projected to modestly expand employment by nearly 2 percent over the next five years. Gains are largely due to hiring related to performing arts and sports promoters, and agents and managers of public figures. With Hollywood at the heart of the region’s entertainment industry, and numerous professional sports teams calling the area home, employment opportunities have been fostered for representatives of high-profile athletes and celebrities.
Demand-side Analysis
Entertainment Industry Outlook
Exhibit 22Employment outlook for major component industries comprising the entertainment industry.
Motion Picture
and Sound Recording
2016 Payroll Jobs:
150,370 2016-2021 Net
Job Chg: 2,290
2016-2021 Growth Rate:
1.5%
Broadcasting
(except internet) 2016 Payroll
Jobs: 22.460
2016-2021 Net Job Chg:
-2,740 2016-2021
Growth Rate: -12.2%
Performing Arts and Spectator
Sports 2016 Payroll
Jobs: 48,020
2016-2021 Net Job Chg:
920 2016-2021
Growth Rate: 1.9%
ENTERTAINMENT AND THE RISE OF DIGITAL MEDIA
Digital media employment in the Los Angeles Basin is expected to add more than 14,000 new jobs.
CCW | 28
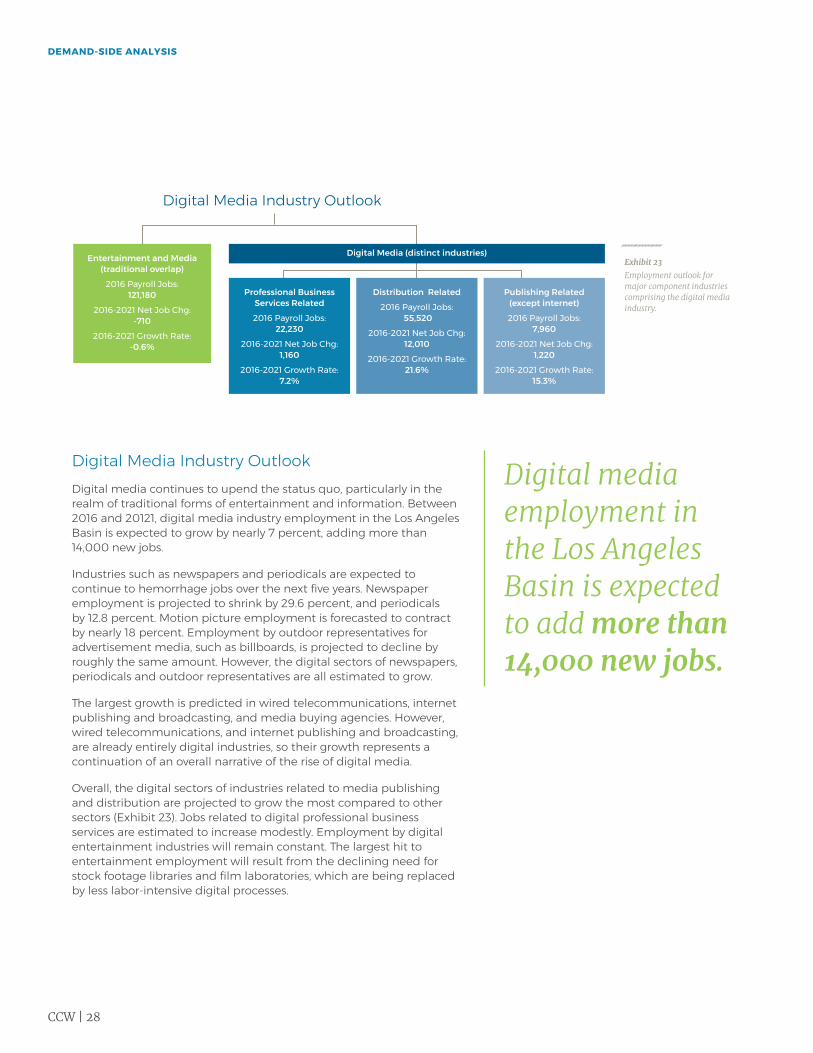
Digital Media Industry OutlookDigital media continues to upend the status quo, particularly in the realm of traditional forms of entertainment and information. Between 2016 and 20121, digital media industry employment in the Los Angeles Basin is expected to grow by nearly 7 percent, adding more than 14,000 new jobs.
Industries such as newspapers and periodicals are expected to continue to hemorrhage jobs over the next five years. Newspaper employment is projected to shrink by 29.6 percent, and periodicals by 12.8 percent. Motion picture employment is forecasted to contract by nearly 18 percent. Employment by outdoor representatives for advertisement media, such as billboards, is projected to decline by roughly the same amount. However, the digital sectors of newspapers, periodicals and outdoor representatives are all estimated to grow.
The largest growth is predicted in wired telecommunications, internet publishing and broadcasting, and media buying agencies. However, wired telecommunications, and internet publishing and broadcasting, are already entirely digital industries, so their growth represents a continuation of an overall narrative of the rise of digital media.
Overall, the digital sectors of industries related to media publishing and distribution are projected to grow the most compared to other sectors (Exhibit 23). Jobs related to digital professional business services are estimated to increase modestly. Employment by digital entertainment industries will remain constant. The largest hit to entertainment employment will result from the declining need for stock footage libraries and film laboratories, which are being replaced by less labor-intensive digital processes.
Digital Media Industry Outlook
Entertainment and Media
(traditional overlap) 2016 Payroll Jobs:
121,180 2016-2021 Net Job Chg:
-710 2016-2021 Growth Rate:
-0.6%
Digital Media (distinct industries)
Professional Business
Services Related 2016 Payroll Jobs:
22,230 2016-2021 Net Job Chg:
1,160 2016-2021 Growth Rate:
7.2%
Publishing Related
(except internet) 2016 Payroll Jobs:
7,960 2016-2021 Net Job Chg:
1,220 2016-2021 Growth Rate:
15.3%
Distribution Related
2016 Payroll Jobs: 55,520
2016-2021 Net Job Chg: 12,010
2016-2021 Growth Rate: 21.6%
Exhibit 23Employment outlook for major component industries comprising the digital media industry.
DEMAND-SIDE ANALYSIS
CCW | 29
ENTERTAINMENT AND THE RISE OF DIGITAL MEDIA
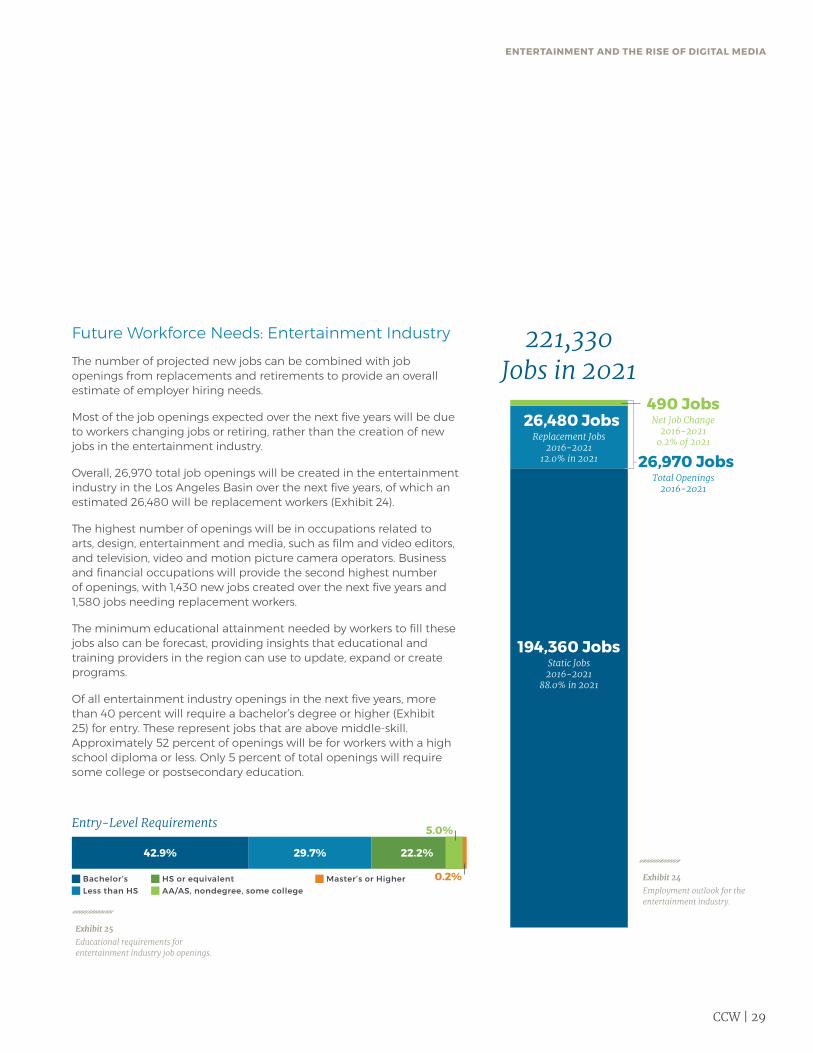
Future Workforce Needs: Entertainment IndustryThe number of projected new jobs can be combined with job openings from replacements and retirements to provide an overall estimate of employer hiring needs.
Most of the job openings expected over the next five years will be due to workers changing jobs or retiring, rather than the creation of new jobs in the entertainment industry.
Overall, 26,970 total job openings will be created in the entertainment industry in the Los Angeles Basin over the next five years, of which an estimated 26,480 will be replacement workers (Exhibit 24).
The highest number of openings will be in occupations related to arts, design, entertainment and media, such as film and video editors, and television, video and motion picture camera operators. Business and financial occupations will provide the second highest number of openings, with 1,430 new jobs created over the next five years and 1,580 jobs needing replacement workers.
The minimum educational attainment needed by workers to fill these jobs also can be forecast, providing insights that educational and training providers in the region can use to update, expand or create programs.
Of all entertainment industry openings in the next five years, more than 40 percent will require a bachelor’s degree or higher (Exhibit 25) for entry. These represent jobs that are above middle-skill. Approximately 52 percent of openings will be for workers with a high school diploma or less. Only 5 percent of total openings will require some college or postsecondary education.
Exhibit 24Employment outlook for the entertainment industry.
Exhibit 25Educational requirements for entertainment industry job openings.
490 Jobs
26,970 Jobs
26,480 Jobs
194,360 Jobs
Net Job Change2016-2021
0.2% of 2021
Total Openings 2016-2021
Entry-Level Requirements
Replacement Jobs2016-2021
12.0% in 2021
Static Jobs2016-2021
88.0% in 2021
221,330 Jobs in 2021
42.9% 29.7% 22.2%
Bachelor’s Less than HS
HS or equivalent AA/AS, nondegree, some college
Master’s or Higher
5.0%
0.2%
CCW | 30
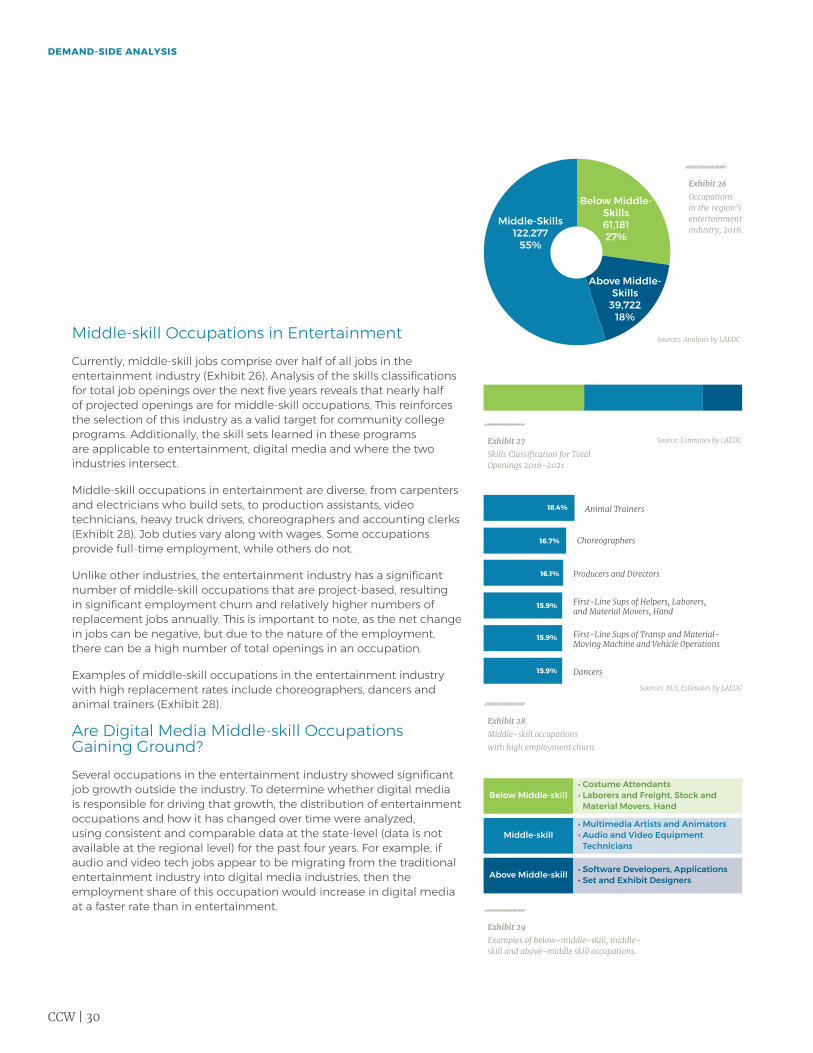
Middle-skill Occupations in Entertainment Currently, middle-skill jobs comprise over half of all jobs in the entertainment industry (Exhibit 26). Analysis of the skills classifications for total job openings over the next five years reveals that nearly half of projected openings are for middle-skill occupations. This reinforces the selection of this industry as a valid target for community college programs. Additionally, the skill sets learned in these programs are applicable to entertainment, digital media and where the two industries intersect.
Middle-skill occupations in entertainment are diverse, from carpenters and electricians who build sets, to production assistants, video technicians, heavy truck drivers, choreographers and accounting clerks (Exhibit 28). Job duties vary along with wages. Some occupations provide full-time employment, while others do not.
Unlike other industries, the entertainment industry has a significant number of middle-skill occupations that are project-based, resulting in significant employment churn and relatively higher numbers of replacement jobs annually. This is important to note, as the net change in jobs can be negative, but due to the nature of the employment, there can be a high number of total openings in an occupation.
Examples of middle-skill occupations in the entertainment industry with high replacement rates include choreographers, dancers and animal trainers (Exhibit 28).
Are Digital Media Middle-skill Occupations Gaining Ground?Several occupations in the entertainment industry showed significant job growth outside the industry. To determine whether digital media is responsible for driving that growth, the distribution of entertainment occupations and how it has changed over time were analyzed, using consistent and comparable data at the state-level (data is not available at the regional level) for the past four years. For example, if audio and video tech jobs appear to be migrating from the traditional entertainment industry into digital media industries, then the employment share of this occupation would increase in digital media at a faster rate than in entertainment.
Exhibit 26Occupations in the region’s entertainment industry, 2016.
Exhibit 28Middle-skill occupations with high employment churn.
Exhibit 27Skills Classification for Total Openings 2016-2021
Exhibit 29Examples of below-middle-skill, middle-skill and above-middle skill occupations.
Middle-Skills 122,277
55%
Above Middle- Skills
39,722 18%
Below Middle- Skills 61,181 27%
Animal Trainers
Sources: Analysis by LAEDC
Source: Estimates by LAEDC
Sources: BLS; Estimates by LAEDC
First-Line Sups of Helpers, Laborers, and Material Movers, Hand
Producers and Directors
Dancers
Choreographers
First-Line Sups of Transp and Material-Moving Machine and Vehicle Operations
18.4%
16.7%
16.1%
15.9%
15.9%
15.9%
DEMAND-SIDE ANALYSIS
Below Middle-skill• Costume Attendants• Laborers and Freight, Stock and
Material Movers, Hand
Middle-skill• Multimedia Artists and Animators• Audio and Video Equipment
Technicians
Above Middle-skill • Software Developers, Applications• Set and Exhibit Designers
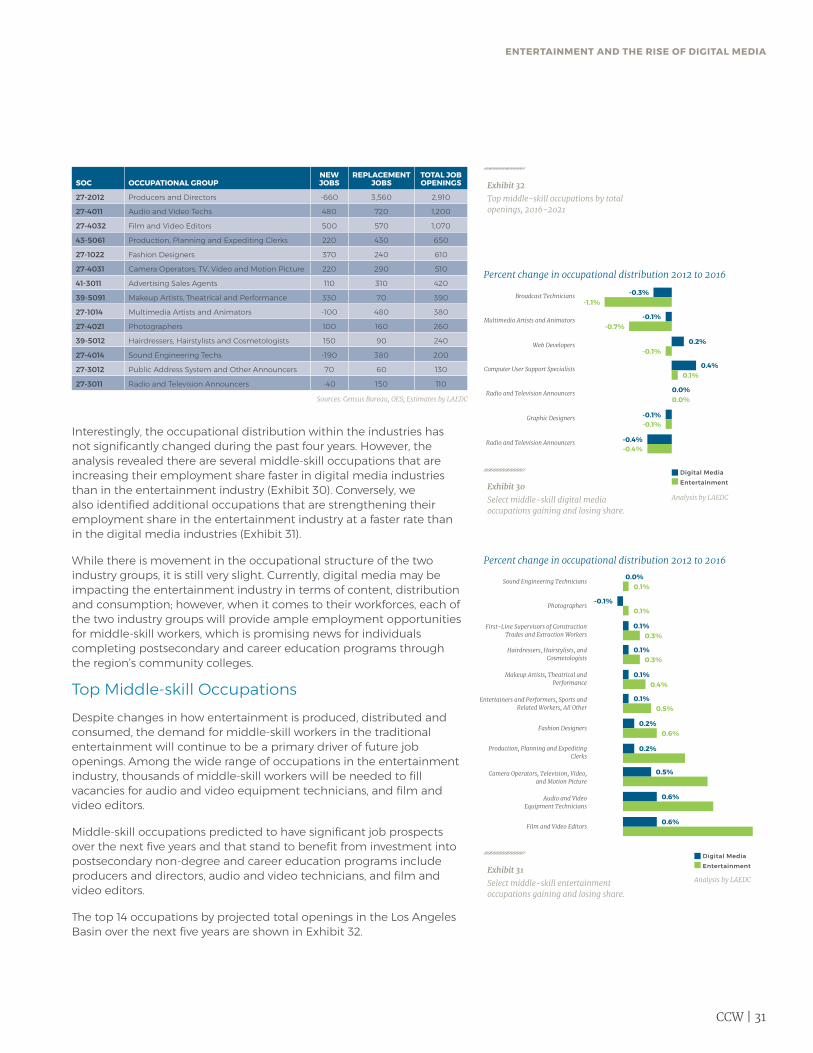
SOC OCCUPATIONAL GROUPNEW JOBS
REPLACEMENT JOBS
TOTAL JOB OPENINGS
27-2012 Producers and Directors -660 3,560 2,910
27-4011 Audio and Video Techs 480 720 1,200
27-4032 Film and Video Editors 500 570 1,070
43-5061 Production, Planning and Expediting Clerks 220 430 650
27-1022 Fashion Designers 370 240 610
27-4031 Camera Operators, TV, Video and Motion Picture 220 290 510
41-3011 Advertising Sales Agents 110 310 420
39-5091 Makeup Artists, Theatrical and Performance 330 70 390
27-1014 Multimedia Artists and Animators -100 480 380
27-4021 Photographers 100 160 260
39-5012 Hairdressers, Hairstylists and Cosmetologists 150 90 240
27-4014 Sound Engineering Techs -190 380 200
27-3012 Public Address System and Other Announcers 70 60 130
27-3011 Radio and Television Announcers -40 150 110
CCW | 31
ENTERTAINMENT AND THE RISE OF DIGITAL MEDIA
Interestingly, the occupational distribution within the industries has not significantly changed during the past four years. However, the analysis revealed there are several middle-skill occupations that are increasing their employment share faster in digital media industries than in the entertainment industry (Exhibit 30). Conversely, we also identified additional occupations that are strengthening their employment share in the entertainment industry at a faster rate than in the digital media industries (Exhibit 31).
While there is movement in the occupational structure of the two industry groups, it is still very slight. Currently, digital media may be impacting the entertainment industry in terms of content, distribution and consumption; however, when it comes to their workforces, each of the two industry groups will provide ample employment opportunities for middle-skill workers, which is promising news for individuals completing postsecondary and career education programs through the region’s community colleges.
Top Middle-skill OccupationsDespite changes in how entertainment is produced, distributed and consumed, the demand for middle-skill workers in the traditional entertainment will continue to be a primary driver of future job openings. Among the wide range of occupations in the entertainment industry, thousands of middle-skill workers will be needed to fill vacancies for audio and video equipment technicians, and film and video editors.
Middle-skill occupations predicted to have significant job prospects over the next five years and that stand to benefit from investment into postsecondary non-degree and career education programs include producers and directors, audio and video technicians, and film and video editors.
The top 14 occupations by projected total openings in the Los Angeles Basin over the next five years are shown in Exhibit 32.
Exhibit 30Select middle-skill digital media occupations gaining and losing share.
Exhibit 32Top middle-skill occupations by total openings, 2016-2021
Exhibit 31Select middle-skill entertainment occupations gaining and losing share.
Sources: Analysis by LAEDC
Source: Estimates by LAEDC
Sources: Census Bureau, OES; Estimates by LAEDC
Analysis by LAEDC
Analysis by LAEDC
Sources: BLS; Estimates by LAEDC
Broadcast Technicians
Computer User Support Specialists
Multimedia Artists and Animators
Radio and Television Announcers
Radio and Television Announcers
Film and Video Editors
Audio and Video Equipment Technicians
Camera Operators, Television, Video, and Motion Picture
Production, Planning and Expediting Clerks
Entertainers and Performers, Sports and Related Workers, All Other
Makeup Artists, Theatrical and Performance
Hairdressers, Hairstylists, and Cosmetologists
First-Line Supervisors of Construction Trades and Extraction Workers
Photographers
Sound Engineering Technicians
Fashion Designers
Web Developers
Graphic Designers
-0.3%
0.4%
0.1%
0.1%
0.5%
0.1%
0.2%
0.6%
0.1%
0.0%
0.2%
0.6%
-0.1%
-0.1%
0.0%
0.2%
-1.1%
-1.1%
0.1%
0.3%
0.5%
1.5%
0.4%
0.6%
1.6%
0.3%
0.1%
0.1%
1.1%
2.3%
-0.7%
0.0%
-0.4%-0.4%
-0.1%
-0.1%-0.1%
Percent change in occupational distribution 2012 to 2016
Percent change in occupational distribution 2012 to 2016
Digital Media Entertainment
Digital Media Entertainment
The region’s community college talent pool.
CCW | 32
T his section details community college program offerings and student completions related to middle-skill occupations in the region’s digital media and entertainment industries. A diversity
of courses and program offerings affords students the opportunity to be well-positioned for various entertainment and digital media positions, while providing local employers a talent pool trained in the latest software, media, online and other related technologies.
As described, in part, above, over the next five years, the Los Angeles Basin can expect more than 4,000 total job openings annually for middle-skill digital media and entertainment occupations across all industries.
With 27 unique digital media and entertainment training programs offered by 27 campuses, community colleges in the region conferred approximately 2,500 awards in the 2015-16 academic year. This represents an increase of more than 130 awards from the 2013-14 academic year.
However, the number of completions does not appear to be adequate to meet future workforce needs.
Digital Media Training ProgramsDigital media programs merge traditional computer technologies with skills and techniques from fine arts and communications disciplines. Established programs such as photography, desktop publishing, commercial art and graphic art are evolving to meet industry needs with more technologically-focused programs as evidenced by program names such as digital art, digital photography, digital design and publication. A complete list of available community college programs can be found at www.ccworkforce.org.
The region’s digital media programs afford students the opportunity to pursue middle-skill positions in radio, film, print media, advertising agencies, internet media companies, and television and broadcasting companies.
Middle-skill occupations, highlighted for their strong employment outlook in the digital media sector include:
Advertising sales agents, Film and video editors, Multimedia artists and animators, Production clerks, Public address system and other announcers, and Radio and television announcers.
Supply-Side Analysis
Over the next five years, the LA Basin can expect more than 4,000 annual job openings for middle-skill digital media and entertainment occupations.
COMMUNITY COLLEGE PROGRAM2015-16
AWARDS
Television (including combined TV/Film/Video) 208
Film Production 174
Graphic Art and Design 169
Radio and Television 86
Animation 70
Computer Graphics and Digital Imagery 67
Radio 39
Digital Media 36
Multimedia 28
Sales and Salesmanship 25
Advertising 7
Broadcast Journalism 4
Total 913
CCW | 33
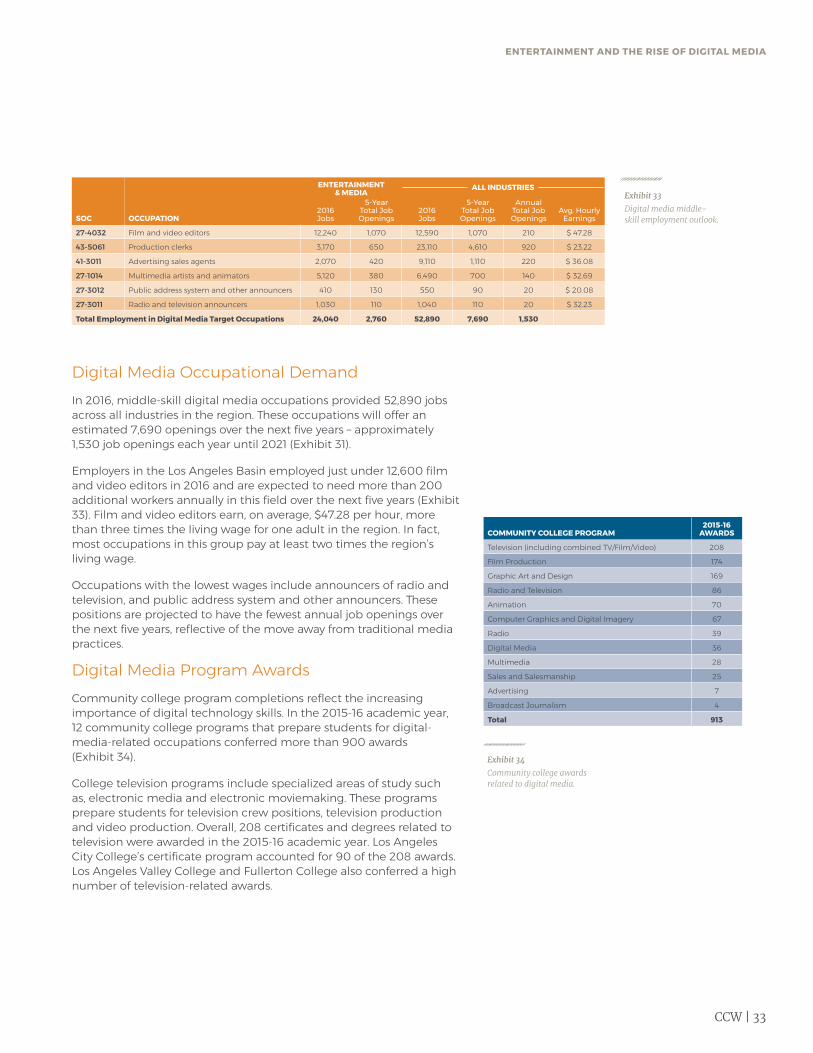
Digital Media Occupational DemandIn 2016, middle-skill digital media occupations provided 52,890 jobs across all industries in the region. These occupations will offer an estimated 7,690 openings over the next five years – approximately 1,530 job openings each year until 2021 (Exhibit 31).
Employers in the Los Angeles Basin employed just under 12,600 film and video editors in 2016 and are expected to need more than 200 additional workers annually in this field over the next five years (Exhibit 33). Film and video editors earn, on average, $47.28 per hour, more than three times the living wage for one adult in the region. In fact, most occupations in this group pay at least two times the region’s living wage.
Occupations with the lowest wages include announcers of radio and television, and public address system and other announcers. These positions are projected to have the fewest annual job openings over the next five years, reflective of the move away from traditional media practices.
Digital Media Program AwardsCommunity college program completions reflect the increasing importance of digital technology skills. In the 2015-16 academic year, 12 community college programs that prepare students for digital-media-related occupations conferred more than 900 awards (Exhibit 34).
College television programs include specialized areas of study such as, electronic media and electronic moviemaking. These programs prepare students for television crew positions, television production and video production. Overall, 208 certificates and degrees related to television were awarded in the 2015-16 academic year. Los Angeles City College’s certificate program accounted for 90 of the 208 awards. Los Angeles Valley College and Fullerton College also conferred a high number of television-related awards.
ENTERTAINMENT AND THE RISE OF DIGITAL MEDIA
SOC OCCUPATION2016 Jobs
5-Year Total Job Openings
2016 Jobs
5-Year Total Job Openings
Annual Total Job Openings
Avg. Hourly Earnings
27-4032 Film and video editors 12,240 1,070 12,590 1,070 210 $ 47.28
43-5061 Production clerks 3,170 650 23,110 4,610 920 $ 23.22
41-3011 Advertising sales agents 2,070 420 9,110 1,110 220 $ 36.08
27-1014 Multimedia artists and animators 5,120 380 6,490 700 140 $ 32.69
27-3012 Public address system and other announcers 410 130 550 90 20 $ 20.08
27-3011 Radio and television announcers 1,030 110 1,040 110 20 $ 32.23
Total Employment in Digital Media Target Occupations 24,040 2,760 52,890 7,690 1,530
ENTERTAINMENT & MEDIA
ALL INDUSTRIESExhibit 33Digital media middle- skill employment outlook.
Exhibit 34Community college awards related to digital media.

CCW | 34
Film production, and graphic art and design programs also had high completion numbers. Film production completions were highest at:
Los Angeles City College, 65 awards; Orange Coast College, 46 awards; and West Los Angeles College, 27 awards.
Regarding graphic art and design, Santa Monica College conferred 34 awards, and Golden West College gave 31 awards in 2015-16. These two colleges led the region with the most graphic art and design awards granted. Santa Monica College awarded 18 associate degrees and 16 certificates, and Golden West awarded five associate degrees and 26 certificates.
Combined, these three programs conferred 551 awards in the 2015-16 academic year. Middle-skill positions related to television, film production, and graphic art and design include: film and video editors, multimedia artists and animators, and production clerks. The anticipated need for new and replacement workers in related occupations is estimated at 420 workers per year until 2021.
Entertainment Training Programs The entertainment industry in the Los Angeles Basin relies on workers in the areas of fashion, hair, makeup, photography and technical professions. Community colleges provide the requisite education and training for many of these positions. A complete list of available community college programs can be found at www.ccworkforce.org.
Middle-skill occupations highlighted for their strong employment outlook in the entertainment sector include:
Audio and video equipment technicians; Camera operators (television, video and motion picture); Fashion designers; Hairdressers, hairstylists and cosmetologists; Makeup artists (theatrical and performance); Photographers; Producers and directors; and Sound engineering technicians.
SUPPLY-SIDE ANALYSIS
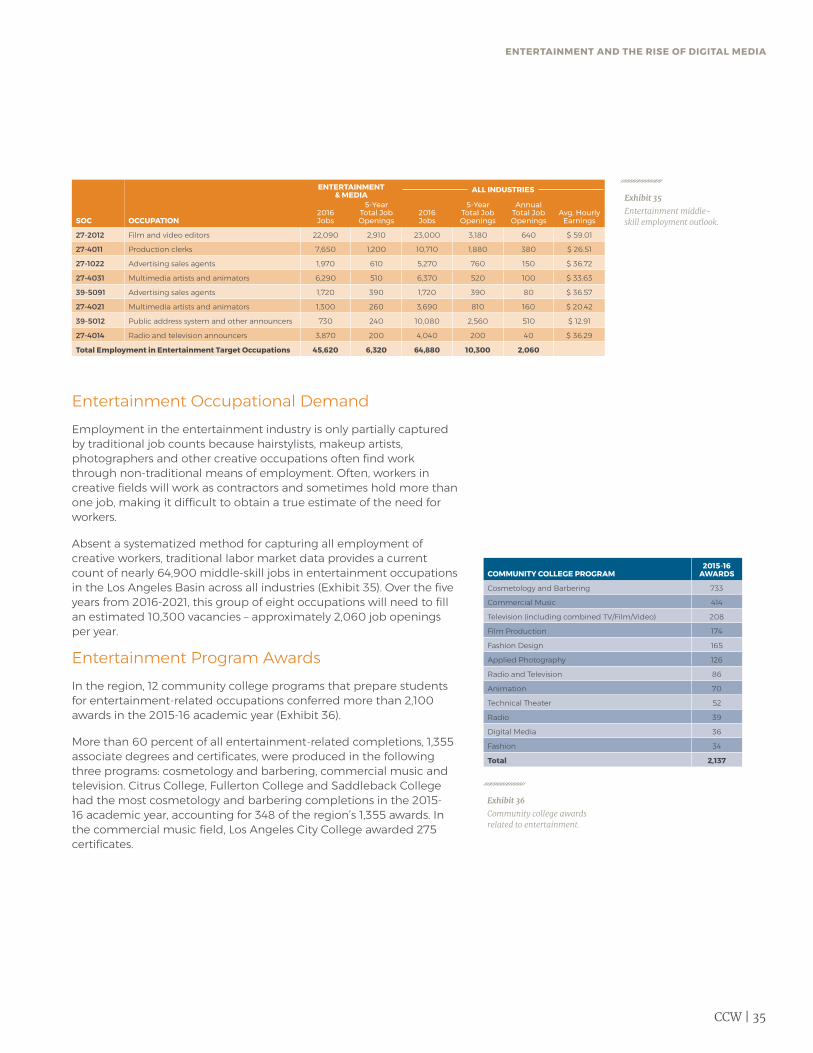
CCW | 35
Entertainment Occupational Demand Employment in the entertainment industry is only partially captured by traditional job counts because hairstylists, makeup artists, photographers and other creative occupations often find work through non-traditional means of employment. Often, workers in creative fields will work as contractors and sometimes hold more than one job, making it difficult to obtain a true estimate of the need for workers.
Absent a systematized method for capturing all employment of creative workers, traditional labor market data provides a current count of nearly 64,900 middle-skill jobs in entertainment occupations in the Los Angeles Basin across all industries (Exhibit 35). Over the five years from 2016-2021, this group of eight occupations will need to fill an estimated 10,300 vacancies – approximately 2,060 job openings per year.
Entertainment Program Awards In the region, 12 community college programs that prepare students for entertainment-related occupations conferred more than 2,100 awards in the 2015-16 academic year (Exhibit 36).
More than 60 percent of all entertainment-related completions, 1,355 associate degrees and certificates, were produced in the following three programs: cosmetology and barbering, commercial music and television. Citrus College, Fullerton College and Saddleback College had the most cosmetology and barbering completions in the 2015-16 academic year, accounting for 348 of the region’s 1,355 awards. In the commercial music field, Los Angeles City College awarded 275 certificates.
ENTERTAINMENT AND THE RISE OF DIGITAL MEDIA
SOC OCCUPATION2016 Jobs
5-Year Total Job Openings
2016 Jobs
5-Year Total Job Openings
Annual Total Job Openings
Avg. Hourly Earnings
27-2012 Film and video editors 22,090 2,910 23,000 3,180 640 $ 59.01
27-4011 Production clerks 7,650 1,200 10,710 1,880 380 $ 26.51
27-1022 Advertising sales agents 1,970 610 5,270 760 150 $ 36.72
27-4031 Multimedia artists and animators 6,290 510 6,370 520 100 $ 33.63
39-5091 Advertising sales agents 1,720 390 1,720 390 80 $ 36.57
27-4021 Multimedia artists and animators 1,300 260 3,690 810 160 $ 20.42
39-5012 Public address system and other announcers 730 240 10,080 2,560 510 $ 12.91
27-4014 Radio and television announcers 3,870 200 4,040 200 40 $ 36.29
Total Employment in Entertainment Target Occupations 45,620 6,320 64,880 10,300 2,060
ENTERTAINMENT & MEDIA
ALL INDUSTRIESExhibit 35Entertainment middle- skill employment outlook.
Exhibit 36Community college awards related to entertainment.
COMMUNITY COLLEGE PROGRAM2015-16
AWARDS
Cosmetology and Barbering 733
Commercial Music 414
Television (including combined TV/Film/Video) 208
Film Production 174
Fashion Design 165
Applied Photography 126
Radio and Television 86
Animation 70
Technical Theater 52
Radio 39
Digital Media 36
Fashion 34
Total 2,137
CCW | 36
C urrently, 27 community colleges in the Los Angeles Basin train students for occupations in digital media and entertainment. The wide spectrum of certificates and degree programs
spans commercial music and recording technology, entertainment and theater technology, animation, mobile app and web design, augmented and virtual reality, gaming and digital video, and audio production. Nine colleges were selected to highlight some of the program offerings in the region.
Program Spotlight Cerritos College—Students can earn an associate degree through the college’s Commercial Music program, which offers training for professional careers in audio studios, film studios, live performance venues and video game development. Students learn how recording, live sound and production apply to the recording, film, television and video game industries. This program covers the technical and creative aspects of the music industry, as well as music business, composing, recording, production, audio editing, film scoring and marketing. Students train on industry-standard equipment in preparation for entry-level positions as audio technicians, broadcast technicians, recording engineers, music editors, dialog editors and composers. The college also offers an Entertainment Technology Occupational Program focusing on technical and production skills for careers in the live performance entertainment industry. Students who earn this certificate gain professional skills in lighting, staging, set construction, rigging and audio mixing technologies used in outdoor and indoor productions as well as film studios. This program trains students to work as entry-level stage technicians for portable entertainment events, including theater productions, concerts, exhibitions and set design for film productions.
Community Colleges Digital media and entertainment training.
CCW | 37
In the Los Angeles Basin, 27 of the 28 community colleges train students for occupations in digital media and entertainment.
Citrus College Citrus College offers associate degrees and certificates related to the Digital Media and Entertainment industries. The college’s Associate of Science (A.S.) in Recording Technology and Certificate in Recording Technology are hands-on, career education programs that develop critical skills in audio engineering and live sound reinforcement. Students learn how to record sound for many different purposes from film to video games, the internet and live performances. Audio basics necessary to engineer any kind of music and sound are taught, including rock concerts, classical recordings and movie scenes. Students have access to world-class recording studio facilities. The Emerging Theatre Technologies (ETT) program develops critical skills in stage lighting, live-sound reinforcement, stage technology, live-event video and project management. ETT instructors are professionals working in concert touring, theme park production, television, film, theater and corporate event production. Students are trained in a console lab with high-end technologies and learn truss rigging, automated scenery, media server, torque certification and video wall. ETT actively tours Southern California, and top students are selected to tour Hawaii for two weeks with all expenses paid. On average, 90 percent of ETT student interns are hired by production companies where they have interned.
Golden West College Golden West College offers a digital arts associate degree, a digital media associate degree, as well as degrees in video game development and software development. Students learn how to produce professional audio and digital video recordings, design and build web-based apps, and digitally edit audio, video and graphic content. The college offers certificates in digital media-animation, digital media-computer assisted photo imaging, digital media-graphic design, and design media-web design and development.
Irvine Valley College The Interactive Media Arts Department focuses on augmented and virtual reality output, gaming and interactive media. The department offers four certificate programs: Immersive Design - 2D Design; Immersive Design - 3D Design; Immersive Design - Game Design; and Immersive Design - Environmental Design. Five students represented the department as semifinalists in the Institute of Electrical and Electronics Engineers (IEEE) GameSIG Intercollegiate Computer Game Showcase in 2017. These individuals competed against teams of bachelor’s and master’s degree students from colleges and universities in the Orange County area.
ENTERTAINMENT AND THE RISE OF DIGITAL MEDIA
CCW | 38
Long Beach City College (LBCC) The Fundamentals of Digital Media Arts Program is an interdisciplinary program that provides the training and skills needed to meet the new and fluid demands of a 21st Century digital media marketplace. The program offers interdisciplinary coursework, incorporating art, music, film, photography, graphics and television broadcasting and provides a strong foundation in aesthetics, theory and technology. Exposed to the creative uses of digital technology, students are prepared to enter a multidisciplinary work environment. Having received state approval to further provide in-demand training for the creative workforce, LBCC has expanded its certificate offerings to include two new advanced certificate programs, Digital Media Advanced Production and Digital Media Interactive Design and Animation. On-campus labs offer full capabilities in graphic production, 3D printing, projection mapping, and sound and video editing.
Los Angeles City College (LACC) The LACC Theatre Academy offers an entertainment technology program, including certificates for backstage jobs and training in theatrical lighting, sound design, scenic painting, and computer-aided drafting and design. The Cinema and Television Program offers an associate degree and eight certificates in the areas of television production, cinema production, cinema-video production and directing skills.
Los Angeles Trade-Tech College The college’s digital media programs consist of three stackable certificates. Students begin with an 18-unit certificate in Digital Media and can pursue additional certificates in Mobile App and Web Design and Digital Video and Audio. A digital media certificate and associate degree provide students with the fundamental skills required to gain employment in a variety of technology-driven, creative fields. Students are introduced to video, audio and computer design programs and receive hands-on experience with digital tools and software while learning industry-related concepts and terminology. The Mobile App and Web Design program teaches best practices in the design, development, testing and delivery of a variety of applications. Students who complete this program enter careers as mobile and interactive application developers, web designers and other technology-related careers in a rapidly evolving industry. The Digital Video and Audio program teaches advanced skills in audio and video production.
COMMUNITY COLLEGES
CCW | 39
Students gain competencies in video editing, sound recording, sound mixing and special effects using industry-recognized software and tools. The program promotes the innovative design of digital video and audio across a variety of delivery platforms and upon completion of the program, students are prepared for middle-skill positions in the film, television and recording industries.
Pierce College Pierce College offers courses in costume design, graphic design, music, technical theatre, theatre arts, and television, film and electronic media.
Santa Monica College (SMC) SMC offers associate degrees and certificates related to the entertainment industry, including an associate degree in Entertainment Promotion/Marketing Production, the only associate degree of its kind in the state. The Entertainment Promotion discipline includes a “Promo Pathway” program, a 10-month course that teaches students how to write, produce and edit promotional spots for television. The course is the result of a partnership with PromaxBDA, an industry association representing promotion, marketing and design professionals, and is aimed at underrepresented groups in the entertainment industry.
ENTERTAINMENT AND THE RISE OF DIGITAL MEDIA
CCW | 40
Conclusion Immediate next steps: activating the report.
A s stated earlier, this report is the beginning of the Center for a Competitive Workforce’s comprehensive program to retool the our region’s career education programs for the in-demand occupations of tomorrow, in this case the
entertainment and digital media industries—which are among the most prominent industries in our region. These careers and related occupations are being dramatically altered by significant, but identifiable, digital transformation trends that are changing how content is created, consumed and distributed.
With the entertainment industry’s talent being trained at community colleges throughout the LA Basin, we are poised to engage industry and partners in the next steps. Building on the labor market data and industry trends identified in this report related to supply and demand in the entertainment and digital media industry, the real work begins to further validate and qualitatively expand on the report’s quantitative findings. Much of this work will be conducted through the Center for a Competitive Workforce partnership and in collaboration with the LAEDC’s Digital Media Entertainment (DME) Industry Council and the LA Area Chamber of Commerce’s Bixel Exchange (Bixel Exchange), which are two of the largest regional organizations representing leaders from many of the biggest brands within the entertainment and digital media industry.
Guided by this report, the DME Industry Council and Bixel Exchange will form subgroups with industry leaders and practitioners from the target occupations identified, along with their direct supervisors, as the individuals best-positioned with industry and firm-level intelligence regarding job-related changes, as well as the new competencies that are required for the candidates they interview and hire.
By engaging entertainment and digital media industry experts on behalf of the community colleges, the Center for a Competitive Workforce seeks to garner first-hand knowledge about the essential and trending requirements for students to be prepared for current and future occupations and careers in the entertainment and digital media industry.
Once target occupational profiles are established, the Center for a Competitive Workforce will facilitate and invest in developing stronger ties with employers through our key community college partners, such as Deputy Sector Navigators, curriculum development specialists, faculty and career education deans, to enhance, reconfigure and/or develop new industry-validated programs and curricula. One of our goals is the development of industry-informed and recognized “model curriculum” that colleges can adopt or adapt and that inspires more relevant student work-based learning opportunities.
Finally, the Center for a Competitive Workforce will continuously communicate these findings and outcomes, primarily through its recently launched site: ccworkforce.org, to increase student access and better inform all regional stakeholder of the successes, gaps, opportunities and challenges in these rapidly involving industries, as well as the performance of the LA Basin’s community colleges as they endeavor to empower their students to thrive in this incredibly dynamic space.
Top 14 OccupationsD etailed information has been compiled for the top 14 middle-skill occupations in the entertainment and digital media industries. Data from 2016, the most recent available,
was used to determine wages and worker characteristics for the charts included with the profiles.
The information on top industries employing these occupations, current and projected employment, wages and demographics can be used by community colleges to tailor existing programs and guide outreach to potential students. The occupational analyses that follow may even inspire new program development or new approaches in attracting students to promising career paths.
Each occupational profile contains:
Hourly wages paid in 2016 for workers in Los Angeles and Orange counties compared to the living wage;
The distribution of workers across industry sectors in the Los Angeles Basin;
Metrics for the occupation including the number of current jobs and projected openings; and
Worker characteristics, such as educational attainment, age distribution, race and ethnicity, and gender.
Occupational Profiles Employment numbers and worker characteristics.
Producers and Directors (SOC 27-2012)
Audio and Video Equipment Technicians (SOC 27-4011)
Film and Video Editors (SOC 27-4032)
Production, Planning, and Expediting Clerks (SOC 43-5061)
Fashion Designers (SOC 27-1022)
Camera Operators, Television, Video, and Motion Picture (SOC 27-4031)
Advertising Sales Agents (SOC 41-3011)
Makeup Artists, Theatrical and Performance (SOC 39-5091)
Multimedia Artists and Animators (SOC 27-1014)
Photographers (SOC 27-4021)
Hairdressers, Hairstylists, and Cosmetologists (SOC 39-5012)
Sound Engineering Technicians (SOC 27-4014)
Public Address System and Other Announcers (SOC 27-3012)
Radio and Television Announcers (SOC 27-3011)
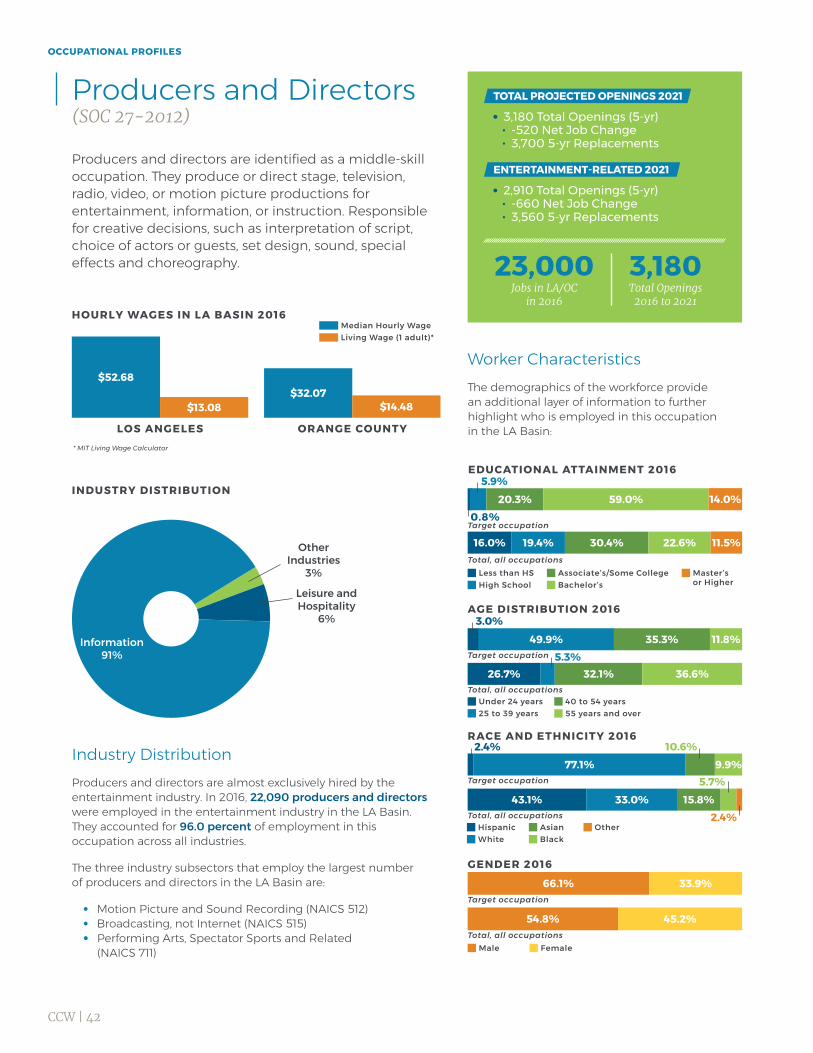
CCW | 42
Information91%
Leisure and Hospitality
6%
Other Industries
3%
3,180 Total Openings (5-yr) -520 Net Job Change 3,700 5-yr Replacements
2,910 Total Openings (5-yr) -660 Net Job Change 3,560 5-yr Replacements
Producers and directors are identified as a middle-skill occupation. They produce or direct stage, television, radio, video, or motion picture productions for entertainment, information, or instruction. Responsible for creative decisions, such as interpretation of script, choice of actors or guests, set design, sound, special effects and choreography.
Producers and Directors(SOC 27-2012)
INDUSTRY DISTRIBUTION
Industry DistributionProducers and directors are almost exclusively hired by the entertainment industry. In 2016, 22,090 producers and directors were employed in the entertainment industry in the LA Basin. They accounted for 96.0 percent of employment in this occupation across all industries.
The three industry subsectors that employ the largest number of producers and directors in the LA Basin are:
Motion Picture and Sound Recording (NAICS 512) Broadcasting, not Internet (NAICS 515) Performing Arts, Spectator Sports and Related
(NAICS 711)
3,180Total Openings
2016 to 2021
23,000Jobs in LA/OC
in 2016HOURLY WAGES IN LA BASIN 2016
$52.68$32.07
$13.08 $14.48
Median Hourly Wage Living Wage (1 adult)*
LOS ANGELES ORANGE COUNTY* MIT Living Wage Calculator
66.1%
54.8%
33.9%
45.2%
16.0%
43.1%
26.7%
19.4%
33.0%
77.1%
49.9%
20.3%
30.4%
15.8%
35.3%
32.1%
59.0%
22.6%
9.9%
11.8%
36.6%
14.0%
11.5%
EDUCATIONAL ATTAINMENT 2016
AGE DISTRIBUTION 2016
RACE AND ETHNICITY 2016
GENDER 2016
Target occupation
Target occupation
Target occupation
Target occupation
Total, all occupations
Total, all occupations
Total, all occupations
Total, all occupations
Less than HS High School
Associate’s/Some College Bachelor’s
Master’s or Higher
Hispanic White
Asian Black
Other
5.7%
10.6%
Male Female
Under 24 years 25 to 39 years
40 to 54 years 55 years and over
Worker CharacteristicsThe demographics of the workforce provide an additional layer of information to further highlight who is employed in this occupation in the LA Basin:
5.9%
5.3%
3.0%
2.4%
2.4%
0.8%
TOTAL PROJECTED OPENINGS 2021
ENTERTAINMENT-RELATED 2021
OCCUPATIONAL PROFILES
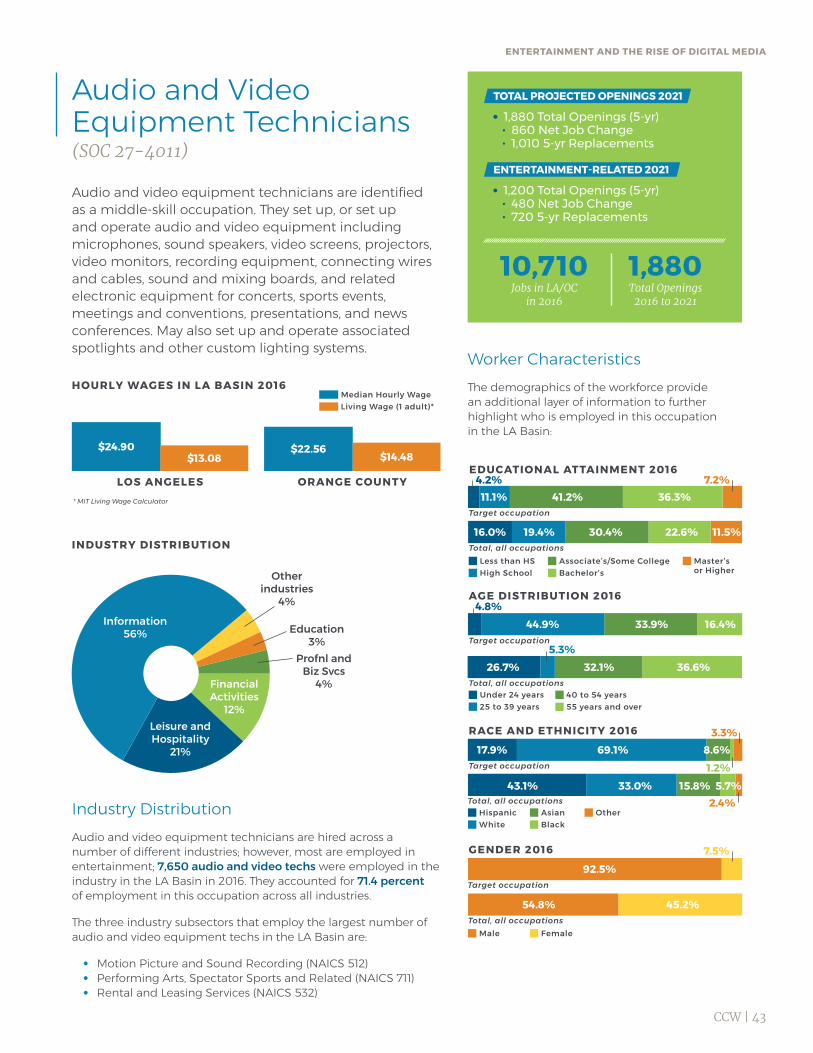
CCW | 43
Information56%
Leisure and Hospitality
21%
Financial Activities
12%
Profnl and Biz Svcs
4%
Education 3%
Other industries
4%
1,880 Total Openings (5-yr) 860 Net Job Change 1,010 5-yr Replacements
1,200 Total Openings (5-yr) 480 Net Job Change 720 5-yr Replacements
Audio and video equipment technicians are identified as a middle-skill occupation. They set up, or set up and operate audio and video equipment including microphones, sound speakers, video screens, projectors, video monitors, recording equipment, connecting wires and cables, sound and mixing boards, and related electronic equipment for concerts, sports events, meetings and conventions, presentations, and news conferences. May also set up and operate associated spotlights and other custom lighting systems.
Audio and Video Equipment Technicians (SOC 27-4011)
INDUSTRY DISTRIBUTION
Industry DistributionAudio and video equipment technicians are hired across a number of different industries; however, most are employed in entertainment; 7,650 audio and video techs were employed in the industry in the LA Basin in 2016. They accounted for 71.4 percent of employment in this occupation across all industries.
The three industry subsectors that employ the largest number of audio and video equipment techs in the LA Basin are:
Motion Picture and Sound Recording (NAICS 512) Performing Arts, Spectator Sports and Related (NAICS 711) Rental and Leasing Services (NAICS 532)
1,880Total Openings
2016 to 2021
10,710Jobs in LA/OC
in 2016
HOURLY WAGES IN LA BASIN 2016
$24.90 $22.56$13.08 $14.48
Median Hourly Wage Living Wage (1 adult)*
LOS ANGELES ORANGE COUNTY* MIT Living Wage Calculator
EDUCATIONAL ATTAINMENT 2016
AGE DISTRIBUTION 2016
RACE AND ETHNICITY 2016
GENDER 2016
Target occupation
Target occupation
Target occupation
Total, all occupations
Total, all occupations
Total, all occupations
Total, all occupations
Less than HS High School
Associate’s/Some College Bachelor’s
Master’s or Higher
Hispanic White
Asian Black
Other2.4%
1.2%
3.3%
Male Female
Under 24 years 25 to 39 years
40 to 54 years 55 years and over
Worker CharacteristicsThe demographics of the workforce provide an additional layer of information to further highlight who is employed in this occupation in the LA Basin:
TOTAL PROJECTED OPENINGS 2021
ENTERTAINMENT-RELATED 2021
4.2% 7.2%41.2% 36.3%11.1%
Target occupation
4.8%
5.3%
16.0%
44.9%
26.7% 32.1% 36.6%
69.1%
92.5%
54.8% 45.2%
7.5%
8.6%17.9%
43.1% 33.0% 15.8% 5.7%
33.9% 16.4%
19.4% 30.4% 22.6% 11.5%
ENTERTAINMENT AND THE RISE OF DIGITAL MEDIA
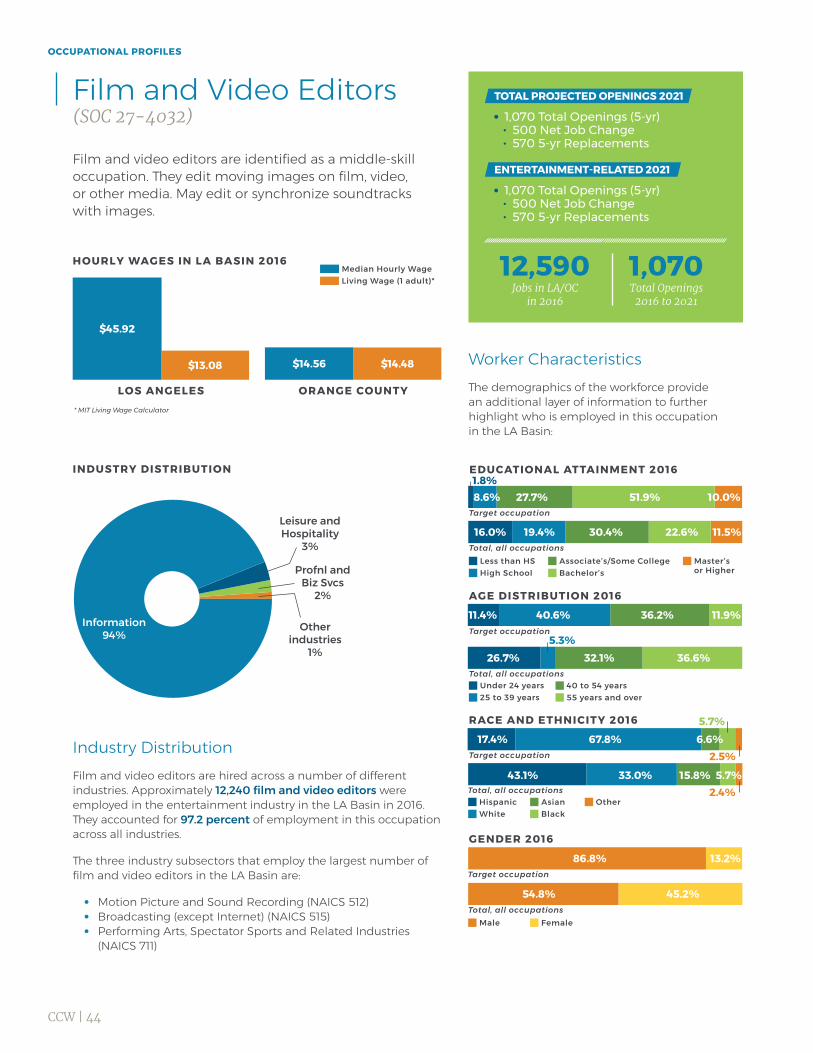
CCW | 44
Information94%
1,070 Total Openings (5-yr) 500 Net Job Change 570 5-yr Replacements
1,070 Total Openings (5-yr) 500 Net Job Change 570 5-yr Replacements
Film and video editors are identified as a middle-skilloccupation. They edit moving images on film, video, or other media. May edit or synchronize soundtracks with images.
Film and Video Editors (SOC 27-4032)
INDUSTRY DISTRIBUTION
Industry DistributionFilm and video editors are hired across a number of different industries. Approximately 12,240 film and video editors were employed in the entertainment industry in the LA Basin in 2016. They accounted for 97.2 percent of employment in this occupation across all industries.
The three industry subsectors that employ the largest number of film and video editors in the LA Basin are:
Motion Picture and Sound Recording (NAICS 512) Broadcasting (except Internet) (NAICS 515) Performing Arts, Spectator Sports and Related Industries
(NAICS 711)
1,070Total Openings
2016 to 2021
12,590Jobs in LA/OC
in 2016
HOURLY WAGES IN LA BASIN 2016
$45.92
$14.56$13.08 $14.48
Median Hourly Wage Living Wage (1 adult)*
LOS ANGELES ORANGE COUNTY* MIT Living Wage Calculator
EDUCATIONAL ATTAINMENT 2016
AGE DISTRIBUTION 2016
RACE AND ETHNICITY 2016
GENDER 2016
Target occupation
Target occupation
Target occupation
Total, all occupations
Total, all occupations
Total, all occupations
Total, all occupations
Less than HS High School
Associate’s/Some College Bachelor’s
Master’s or Higher
Hispanic White
Asian Black
Other2.4%
2.5%
5.7%
Male Female
Under 24 years 25 to 39 years
40 to 54 years 55 years and over
Worker CharacteristicsThe demographics of the workforce provide an additional layer of information to further highlight who is employed in this occupation in the LA Basin:
TOTAL PROJECTED OPENINGS 2021
ENTERTAINMENT-RELATED 2021
Target occupation5.3%
16.0%
26.7% 32.1% 36.6%
54.8% 45.2%
43.1% 33.0% 15.8% 5.7%
19.4% 30.4% 22.6% 11.5%
Profnl and Biz Svcs
2%
Other industries
1%
Leisure and Hospitality
3%
27.7%8.6% 51.9% 10.0%1.8%
11.4% 40.6% 36.2% 11.9%
17.4% 67.8% 6.6%
86.8% 13.2%
OCCUPATIONAL PROFILES

CCW | 45
Manufacturing 28%
Profnl and Biz Svcs
23%Information
16%
Wholesale 11%
Other industries
15%Wrhsing and
Transport 7%
4,610 Total Openings (5-yr) 1,470 Net Job Change 3,140 5-yr Replacements
4,610 Total Openings (5-yr) 1,470 Net Job Change 3,140 5-yr Replacements
Production, planning and expediting clerks are identified as a middle-skill occupation. They compile information and records to draw up purchase orders for procurement of materials and services. These occupations includeschedulers, planners and production assistants.
Production, Planning and Expediting Clerks (SOC 43-5061)
INDUSTRY DISTRIBUTION
Industry DistributionProduction, planning, and expediting clerks are hired across a number of different industries; however, a significant number are employed by the entertainment industry; 3,170 production, planning and expediting clerks in 2016 in the LA Basin. They accounted for 13.7 percent of employment in this occupation across all industries.
The three industry subsectors that employ the largest number of schedulers, planners and production assistants in the LA Basin are:
Motion Picture and Sound Recording Industries (NAICS 512) Professional, Scientific and Technical Services (NAICS 541) Administrative and Support Services (NAICS 561)
4,610Total Openings
2016 to 2021
23,110Jobs in LA/OC
in 2016HOURLY WAGES IN LA BASIN 2016
$21.85 $24.44$13.08 $14.48
Median Hourly Wage Living Wage (1 adult)*
LOS ANGELES ORANGE COUNTY* MIT Living Wage Calculator
EDUCATIONAL ATTAINMENT 2016
AGE DISTRIBUTION 2016
RACE AND ETHNICITY 2016
GENDER 2016
Target occupation
Target occupation
Target occupation
Total, all occupations
Total, all occupations
Total, all occupations
Total, all occupations
Less than HS High School
Associate’s/Some College Bachelor’s
Master’s or Higher
Hispanic White
Asian Black
Other2.4%
2.1%
3.7%
Male Female
Under 24 years 25 to 39 years
40 to 54 years 55 years and over
Worker CharacteristicsThe demographics of the workforce provide an additional layer of information to further highlight who is employed in this occupation in the LA Basin:
TOTAL PROJECTED OPENINGS 2021
ENTERTAINMENT-RELATED 2021
Target occupation5.3%
2.9%
16.0%
26.7% 32.1% 36.6%
54.8% 45.2%
43.1% 33.0% 15.8% 5.7%
19.4% 30.4% 22.6% 11.5%
16.7% 54.2% 22.4%
14.9%27.1%40.4%17.7%
27.2% 46.3% 15.7% 8.7%
45.0% 55.0%
ENTERTAINMENT AND THE RISE OF DIGITAL MEDIA

CCW | 46
Information37%
Wholesale28%
Manufacturing 23%
760 Total Openings (5-yr) 130 Net Job Change 630 5-yr Replacements
610 Total Openings (5-yr) 370 Net Job Change 240 5-yr Replacements
Fashion designers are identified as a middle-skilloccupation. They design clothing and accessories. Create original designs or adapt fashion trends.
Fashion Designers (SOC 27-1022)
INDUSTRY DISTRIBUTION
Industry DistributionFashion designers are hired across a number of different industries; however, a large number are hired by motion picture and sound recording firms. The entertainment industry employed 1,970 fashion designers in 2016 in the LA Basin. They accounted for 37.4 percent of employment in this occupation across all industries.
The three industry subsectors that employ the largest number of fashion designers in the LA Basin are:
Motion Picture and Sound Recording (NAICS 512) Wholesalers, Nondurable Goods (NAICS 424) Apparel Manufacturing (NAICS 315)
760Total Openings
2016 to 2021
5,270Jobs in LA/OC
in 2016
HOURLY WAGES IN LA BASIN 2016
$33.43 $28.70
$13.08 $14.48
Median Hourly Wage Living Wage (1 adult)*
LOS ANGELES ORANGE COUNTY* MIT Living Wage Calculator
EDUCATIONAL ATTAINMENT 2016
AGE DISTRIBUTION 2016
RACE AND ETHNICITY 2016
GENDER 2016
Target occupation
Target occupation
Target occupation
Total, all occupations
Total, all occupations
Total, all occupations
Total, all occupations
Less than HS High School
Associate’s/Some College Bachelor’s
Master’s or Higher
Hispanic White
Asian Black
Other2.4%
3.0%
0.4%
Male Female
Under 24 years 25 to 39 years
40 to 54 years 55 years and over
Worker CharacteristicsThe demographics of the workforce provide an additional layer of information to further highlight who is employed in this occupation in the LA Basin:
TOTAL PROJECTED OPENINGS 2021
ENTERTAINMENT-RELATED 2021
Target occupation5.3%
16.0%
26.7% 32.1% 36.6%
54.8% 45.2%
43.1% 33.0% 15.8% 5.7%
19.4% 30.4% 22.6% 11.5%
Profnl and Biz Svcs
10%
Other industries
1%
Retail Trade 1%
36.3%9.7% 48.9%3.8%1.3%
5.8%55.9% 27.4% 10.8%
27.4% 34.8% 34.6%
23.9 76.1%
OCCUPATIONAL PROFILES

CCW | 47
Information 99%
Government 1%
520 Total Openings (5-yr) 230 Net Job Change 290 5-yr Replacements
510 Total Openings (5-yr) 220 Net Job Change 290 5-yr Replacements
Television, video and motion picture camera operators areidentified as a middle-skill occupation. They operatetelevision, video, or motion picture camera to record images or scenes for various purposes, such as TV broadcasts, advertising, video production, or motion pictures.
Camera Operators, Television, Video and Motion Picture (SOC 27-4031)
INDUSTRY DISTRIBUTION
Industry DistributionTelevision, video and motion picture camera operators are almost exclusively hired by entertainment industries; 6,290 television, video and motion picture camera operators were employed in the entertainment industry in the LA Basin in 2016. They accounted for 98.7 percent of employment in this occupation across all industries.
The three industry subsectors that employ the largest number of television, video and motion picture camera operators in the LA Basin are:
Motion Picture and Sound Recording (NAICS 512) Broadcasting (except Internet) (NAICS 515) Local Government (NAICS 93)
520Total Openings
2016 to 2021
6,370Jobs in LA/OC
in 2016HOURLY WAGES IN LA BASIN 2016
$31.43$19.02$13.08 $14.48
Median Hourly Wage Living Wage (1 adult)*
LOS ANGELES ORANGE COUNTY* MIT Living Wage Calculator
EDUCATIONAL ATTAINMENT 2016
AGE DISTRIBUTION 2016
RACE AND ETHNICITY 2016
GENDER 2016
Target occupation
Target occupation
Target occupation
Total, all occupations
Total, all occupations
Total, all occupations
Total, all occupations
Less than HS High School
Associate’s/Some College Bachelor’s
Master’s or Higher
Hispanic White
Asian Black
Other2.4%
3.2%
Male Female
Under 24 years 25 to 39 years
40 to 54 years 55 years and over
Worker CharacteristicsThe demographics of the workforce provide an additional layer of information to further highlight who is employed in this occupation in the LA Basin:
TOTAL PROJECTED OPENINGS 2021
ENTERTAINMENT-RELATED 2021
Target occupation5.3%
0.0%7.2%
16.0%
26.7% 32.1% 36.6%
54.8% 45.2%
43.1% 33.0% 15.8% 5.7%
19.4% 30.4% 22.6% 11.5%
22.1% 55.4% 15.2%
8.0%34.7%51.2%
81.8% 9.1%
81.5% 18.5%
5.2%
5.8%
ENTERTAINMENT AND THE RISE OF DIGITAL MEDIA
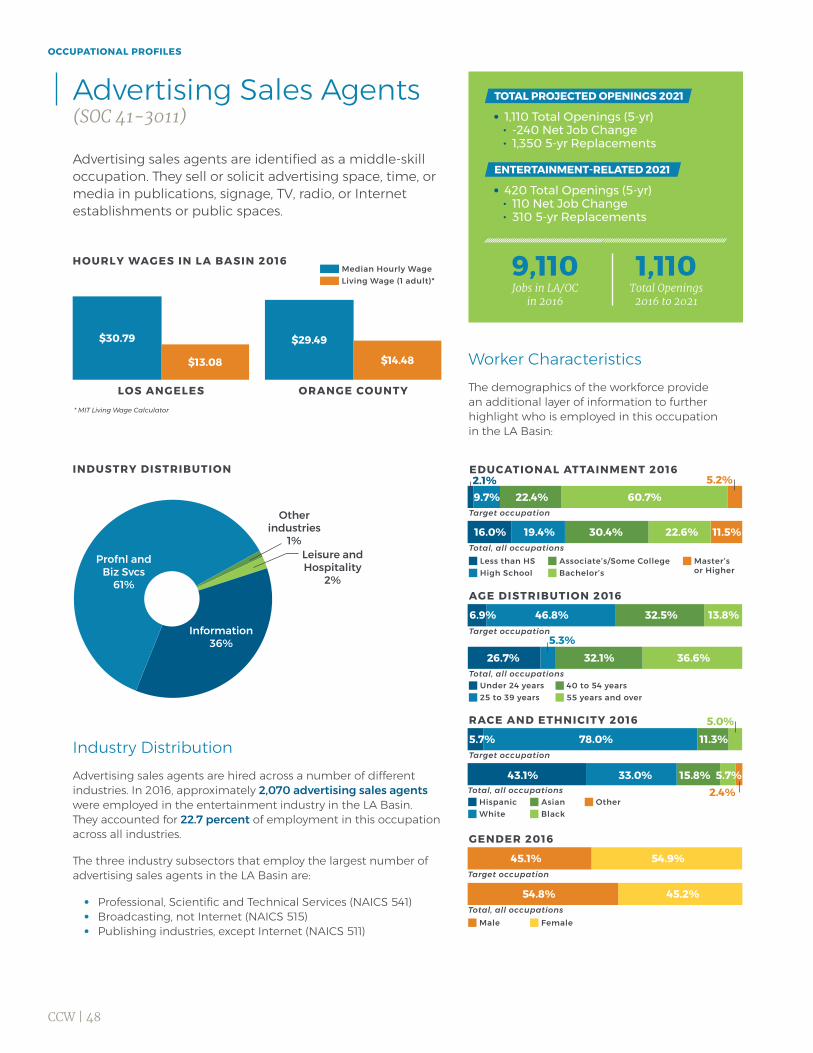
CCW | 48
Profnl and Biz Svcs
61%
Information36%
1,110 Total Openings (5-yr) -240 Net Job Change 1,350 5-yr Replacements
420 Total Openings (5-yr) 110 Net Job Change 310 5-yr Replacements
Advertising sales agents are identified as a middle-skilloccupation. They sell or solicit advertising space, time, ormedia in publications, signage, TV, radio, or Internetestablishments or public spaces.
Advertising Sales Agents (SOC 41-3011)
INDUSTRY DISTRIBUTION
Industry DistributionAdvertising sales agents are hired across a number of different industries. In 2016, approximately 2,070 advertising sales agents were employed in the entertainment industry in the LA Basin. They accounted for 22.7 percent of employment in this occupation across all industries.
The three industry subsectors that employ the largest number of advertising sales agents in the LA Basin are:
Professional, Scientific and Technical Services (NAICS 541) Broadcasting, not Internet (NAICS 515) Publishing industries, except Internet (NAICS 511)
1,110Total Openings
2016 to 2021
9,110Jobs in LA/OC
in 2016
HOURLY WAGES IN LA BASIN 2016
$30.79 $29.49
$13.08 $14.48
Median Hourly Wage Living Wage (1 adult)*
LOS ANGELES ORANGE COUNTY* MIT Living Wage Calculator
EDUCATIONAL ATTAINMENT 2016
AGE DISTRIBUTION 2016
RACE AND ETHNICITY 2016
GENDER 2016
Target occupation
Target occupation
Target occupation
Total, all occupations
Total, all occupations
Total, all occupations
Total, all occupations
Less than HS High School
Associate’s/Some College Bachelor’s
Master’s or Higher
Hispanic White
Asian Black
Other2.4%
5.0%
Male Female
Under 24 years 25 to 39 years
40 to 54 years 55 years and over
Worker CharacteristicsThe demographics of the workforce provide an additional layer of information to further highlight who is employed in this occupation in the LA Basin:
TOTAL PROJECTED OPENINGS 2021
ENTERTAINMENT-RELATED 2021
Target occupation5.3%
16.0%
26.7% 32.1% 36.6%
54.8% 45.2%
43.1% 33.0% 15.8% 5.7%
19.4% 30.4% 22.6% 11.5%
Leisure andHospitality
2%
Other industries
1%
22.4%9.7% 60.7%5.2%2.1%
6.9% 46.8% 32.5% 13.8%
5.7% 78.0% 11.3%
45.1% 54.9%
OCCUPATIONAL PROFILES
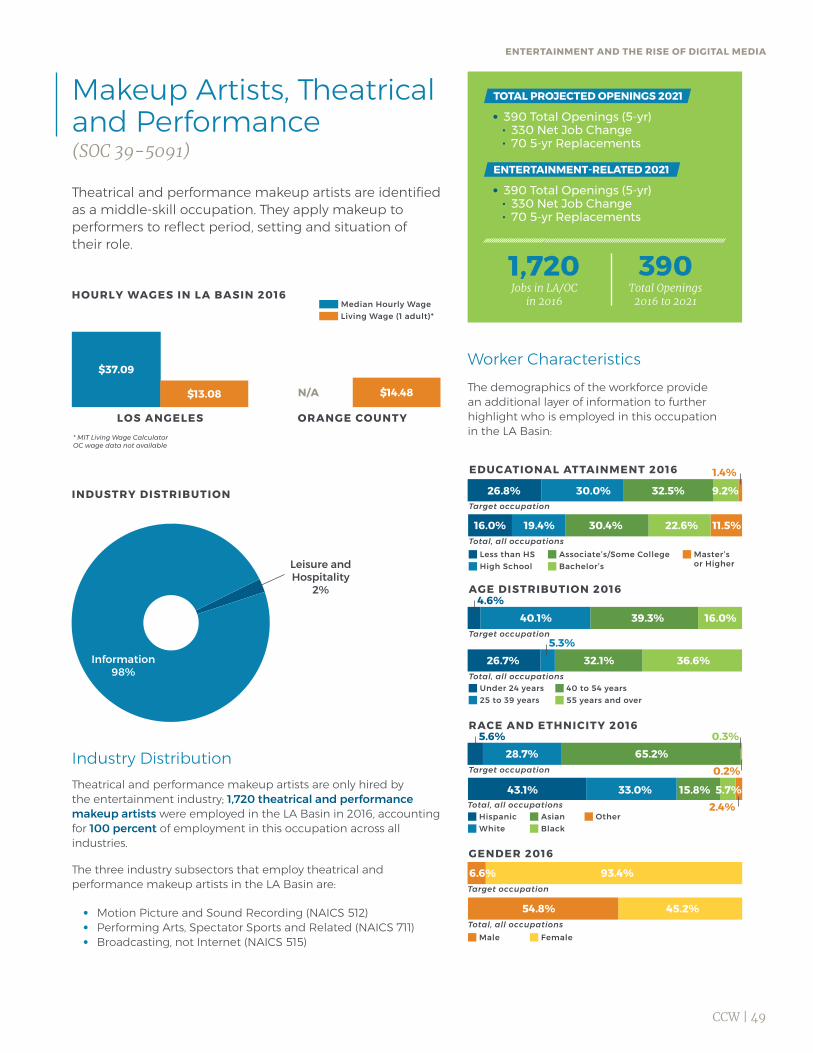
CCW | 49
4.6%
5.6%
Information 98%
Leisure andHospitality
2%
390 Total Openings (5-yr) 330 Net Job Change 70 5-yr Replacements
390 Total Openings (5-yr) 330 Net Job Change 70 5-yr Replacements
Theatrical and performance makeup artists are identifiedas a middle-skill occupation. They apply makeup toperformers to reflect period, setting and situation of their role.
Makeup Artists, Theatrical and Performance (SOC 39-5091)
INDUSTRY DISTRIBUTION
Industry DistributionTheatrical and performance makeup artists are only hired by the entertainment industry; 1,720 theatrical and performance makeup artists were employed in the LA Basin in 2016, accounting for 100 percent of employment in this occupation across all industries.
The three industry subsectors that employ theatrical and performance makeup artists in the LA Basin are:
Motion Picture and Sound Recording (NAICS 512) Performing Arts, Spectator Sports and Related (NAICS 711) Broadcasting, not Internet (NAICS 515)
390Total Openings
2016 to 2021
1,720Jobs in LA/OC
in 2016HOURLY WAGES IN LA BASIN 2016
$37.09
N/A$13.08 $14.48
Median Hourly Wage Living Wage (1 adult)*
LOS ANGELES ORANGE COUNTY* MIT Living Wage CalculatorOC wage data not available
EDUCATIONAL ATTAINMENT 2016
AGE DISTRIBUTION 2016
RACE AND ETHNICITY 2016
GENDER 2016
Target occupation
Target occupation
Target occupation
Total, all occupations
Total, all occupations
Total, all occupations
Total, all occupations
Less than HS High School
Associate’s/Some College Bachelor’s
Master’s or Higher
Hispanic White
Asian Black
Other2.4%
0.3%
0.2%
1.4%
Male Female
Under 24 years 25 to 39 years
40 to 54 years 55 years and over
Worker CharacteristicsThe demographics of the workforce provide an additional layer of information to further highlight who is employed in this occupation in the LA Basin:
TOTAL PROJECTED OPENINGS 2021
ENTERTAINMENT-RELATED 2021
Target occupation5.3%
16.0%
26.7% 32.1% 36.6%
54.8% 45.2%
43.1% 33.0% 15.8% 5.7%
19.4% 30.4% 22.6% 11.5%
26.8% 30.0% 32.5% 9.2%
16.0%39.3%40.1%
28.7% 65.2%
6.6% 93.4%
ENTERTAINMENT AND THE RISE OF DIGITAL MEDIA

CCW | 50
Profnl and Biz Svcs
13%
Information79%
700 Total Openings (5-yr) 100 Net Job Change 610 5-yr Replacements
380 Total Openings (5-yr) -100 Net Job Change 480 5-yr Replacements
Multimedia artists and animators are identified as a middle-skill occupation. They create special effects, animation, or other visual images using film, video, computers, or other electronic tools and media for use in products or creations, such as computer games, movies, music videos and commercials.
Multimedia Artists and Animators (SOC 27-1014)
INDUSTRY DISTRIBUTION
Industry DistributionMultimedia artists and animators are hired across a number of different industries, including those in digital media. Approximately 5,120 multimedia artists and animators were employed in the entertainment industry in the LA Basin in 2016. They accounted for 78.9 percent of employment in this occupation across all industries.
The three industry subsectors that employ the largest number of multimedia artists and animators in the LA Basin are:
Motion Picture and Sound Recording (NAICS 512) Professional, Scientific and Technical Services (NAICS 541) Performing Arts, Spectator Sports and Related (NAICS 711)
700Total Openings
2016 to 2021
6,490Jobs in LA/OC
in 2016HOURLY WAGES IN LA BASIN 2016
$38.36 $30.64$13.08 $14.48
Median Hourly Wage Living Wage (1 adult)*
LOS ANGELES ORANGE COUNTY* MIT Living Wage Calculator
EDUCATIONAL ATTAINMENT 2016
AGE DISTRIBUTION 2016
RACE AND ETHNICITY 2016
GENDER 2016
Target occupation
Target occupation
Target occupation
Total, all occupations
Total, all occupations
Total, all occupations
Total, all occupations
Less than HS High School
Associate’s/Some College Bachelor’s
Master’s or Higher
Hispanic White
Asian Black
Other2.4%
1.1%
6.6%
Male Female
Under 24 years 25 to 39 years
40 to 54 years 55 years and over
Worker CharacteristicsThe demographics of the workforce provide an additional layer of information to further highlight who is employed in this occupation in the LA Basin:
TOTAL PROJECTED OPENINGS 2021
ENTERTAINMENT-RELATED 2021
Target occupation5.3%
4.9%
16.0%
26.7% 32.1% 36.6%
54.8% 45.2%
43.1% 33.0% 15.8% 5.7%
19.4% 30.4% 22.6% 11.5%
Leisure andHospitality
7%
Other industries
1%
30.4%8.7% 48.3% 12.0%0.7%
9.3% 49.8% 29.3% 11.5%
62.3% 25.1%
63.2% 36.8%
OCCUPATIONAL PROFILES

CCW | 51
5.5%
Information 33%
Profnl and Biz Svcs
57%
810 Total Openings (5-yr) 360 Net Job Change 450 5-yr Replacements
260 Total Openings (5-yr) 100 Net Job Change 160 5-yr Replacements
Photographers are identified as a middle-skill occupation.They photograph people, landscapes, merchandise, or other subjects, using digital or film cameras and equipment. May develop negatives or use computer software to produce finished images and prints. Includes scientific photographers, aerial photographers and photojournalists.
INDUSTRY DISTRIBUTION
Industry DistributionPhotographers are hired across a number of different industries; however, a significant number are employed in entertainment; 1,300 photographers were employed in the entertainment industry in the LA Basin in 2016. They accounted for 35.2 percent of employment in this occupation across all industries.
The three industry subsectors that employ the largest number of photographers in the LA Basin are:
Professional, Scientific and Technical Services (NAICS 541) Motion Picture and Sound Recording (NAICS 512) Performing Arts, Spectator Sports and Related (NAICS 711)
810Total Openings
2016 to 2021
3,690Jobs in LA/OC
in 2016HOURLY WAGES IN LA BASIN 2016
$28.17 $23.85$13.08 $14.48
Median Hourly Wage Living Wage (1 adult)*
LOS ANGELES ORANGE COUNTY* MIT Living Wage Calculator
EDUCATIONAL ATTAINMENT 2016
AGE DISTRIBUTION 2016
RACE AND ETHNICITY 2016
GENDER 2016
Target occupation
Target occupation
Target occupation
Total, all occupations
Total, all occupations
Total, all occupations
Total, all occupations
Less than HS High School
Associate’s/Some College Bachelor’s
Master’s or Higher
Hispanic White
Asian Black
Other2.4%
3.9%
4.2%
Male Female
Under 24 years 25 to 39 years
40 to 54 years 55 years and over
Worker CharacteristicsThe demographics of the workforce provide an additional layer of information to further highlight who is employed in this occupation in the LA Basin:
TOTAL PROJECTED OPENINGS 2021
ENTERTAINMENT-RELATED 2021
Target occupation5.3%
16.0%
26.7% 32.1% 36.6%
54.8% 45.2%
43.1% 33.0% 15.8% 5.7%
19.4% 30.4% 22.6% 11.5%
11.2% 38.1% 41.0%
15.7%21.0%52.7%10.6%
74.9%11.5% 9.7%
63.1% 36.9%
Photographers(SOC 27-4021)
Retail Trade2%
Government1%
Leisure andHospitality
6%
Other industries
1%
ENTERTAINMENT AND THE RISE OF DIGITAL MEDIA
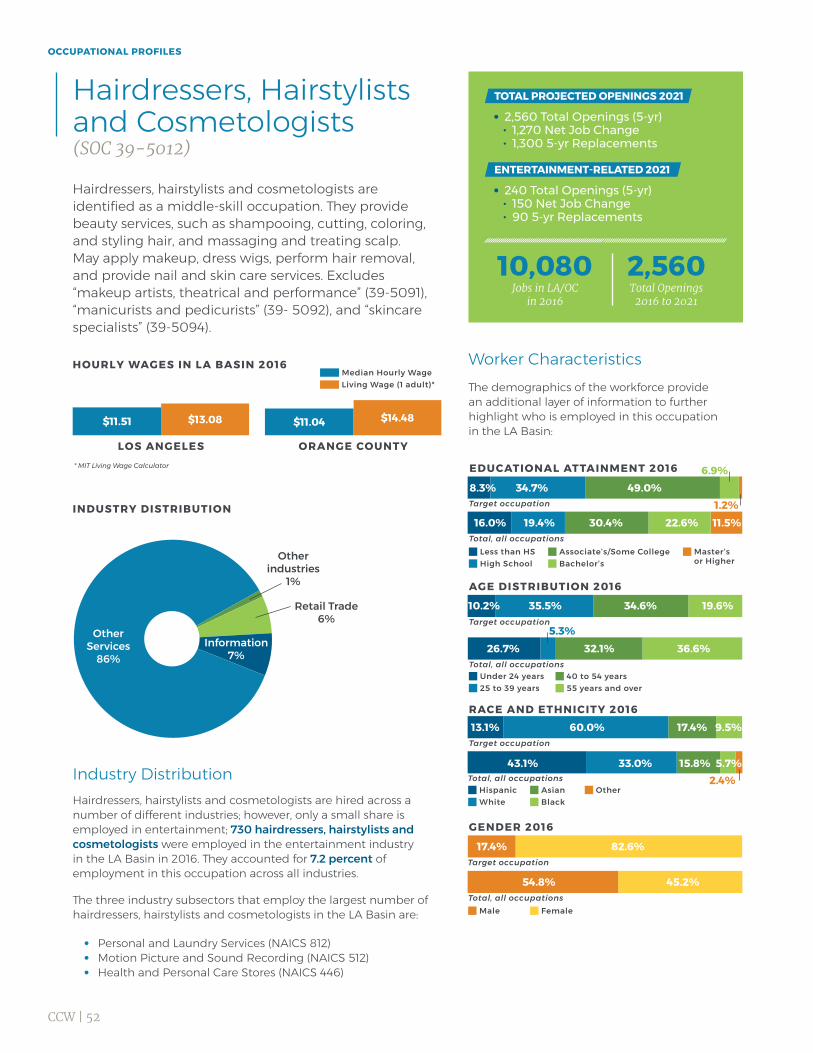
CCW | 52
Information7%
Other Services
86%
2,560 Total Openings (5-yr) 1,270 Net Job Change 1,300 5-yr Replacements
240 Total Openings (5-yr) 150 Net Job Change 90 5-yr Replacements
Hairdressers, hairstylists and cosmetologists are identified as a middle-skill occupation. They provide beauty services, such as shampooing, cutting, coloring, and styling hair, and massaging and treating scalp. May apply makeup, dress wigs, perform hair removal, and provide nail and skin care services. Excludes “makeup artists, theatrical and performance” (39-5091), “manicurists and pedicurists” (39- 5092), and “skincare specialists” (39-5094).
Hairdressers, Hairstylists and Cosmetologists (SOC 39-5012)
INDUSTRY DISTRIBUTION
Industry DistributionHairdressers, hairstylists and cosmetologists are hired across a number of different industries; however, only a small share is employed in entertainment; 730 hairdressers, hairstylists and cosmetologists were employed in the entertainment industry in the LA Basin in 2016. They accounted for 7.2 percent of employment in this occupation across all industries.
The three industry subsectors that employ the largest number of hairdressers, hairstylists and cosmetologists in the LA Basin are:
Personal and Laundry Services (NAICS 812) Motion Picture and Sound Recording (NAICS 512) Health and Personal Care Stores (NAICS 446)
2,560Total Openings
2016 to 2021
10,080Jobs in LA/OC
in 2016
HOURLY WAGES IN LA BASIN 2016
$11.51 $11.04$13.08 $14.48
Median Hourly Wage Living Wage (1 adult)*
LOS ANGELES ORANGE COUNTY* MIT Living Wage Calculator EDUCATIONAL ATTAINMENT 2016
AGE DISTRIBUTION 2016
RACE AND ETHNICITY 2016
GENDER 2016
Target occupation
Target occupation
Target occupation
Total, all occupations
Total, all occupations
Total, all occupations
Total, all occupations
Less than HS High School
Associate’s/Some College Bachelor’s
Master’s or Higher
Hispanic White
Asian Black
Other2.4%
9.5%
Male Female
Under 24 years 25 to 39 years
40 to 54 years 55 years and over
Worker CharacteristicsThe demographics of the workforce provide an additional layer of information to further highlight who is employed in this occupation in the LA Basin:
TOTAL PROJECTED OPENINGS 2021
ENTERTAINMENT-RELATED 2021
Target occupation5.3%
16.0%
26.7% 32.1% 36.6%
54.8% 45.2%
43.1% 33.0% 15.8% 5.7%
19.4% 30.4% 22.6% 11.5%
Retail Trade6%
Other industries
1%
34.7%8.3% 49.0%6.9%
1.2%
10.2% 35.5% 34.6% 19.6%
60.0%13.1% 17.4%
17.4% 82.6%
OCCUPATIONAL PROFILES
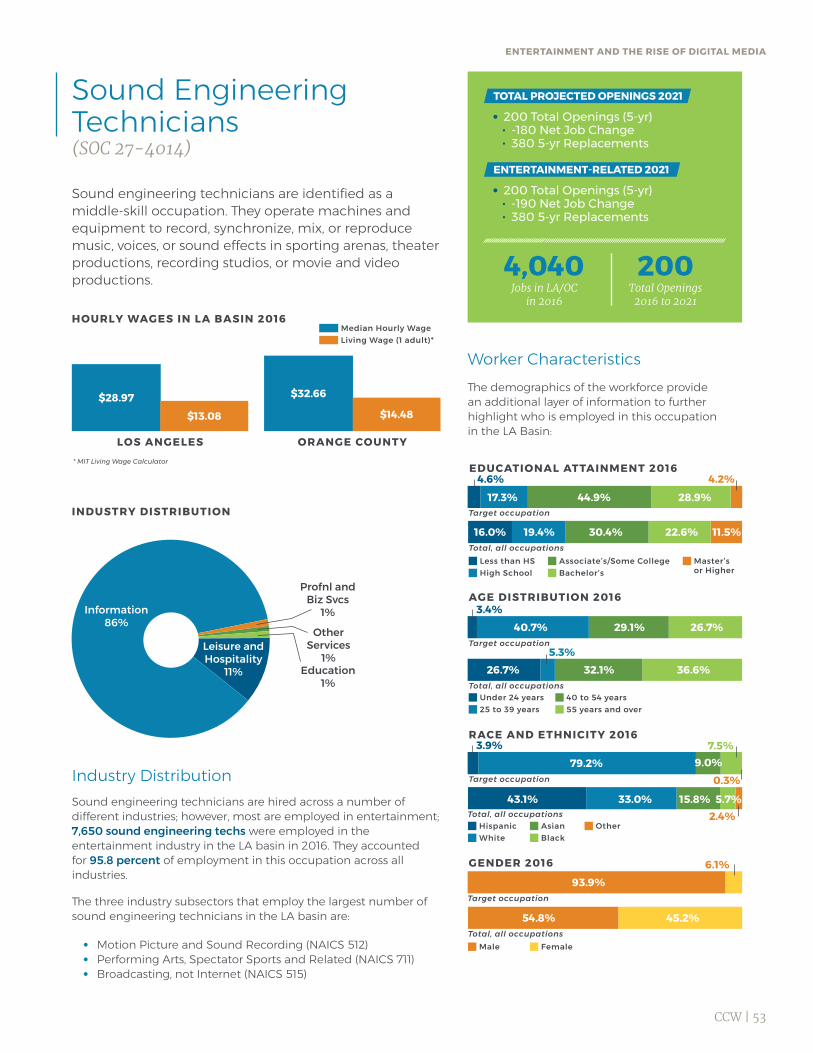
CCW | 53
4.6%
3.4%
3.9%
Information 86%
Leisure andHospitality
11%
200 Total Openings (5-yr) -180 Net Job Change 380 5-yr Replacements
200 Total Openings (5-yr) -190 Net Job Change 380 5-yr Replacements
Sound engineering technicians are identified as a middle-skill occupation. They operate machines and equipment to record, synchronize, mix, or reproduce music, voices, or sound effects in sporting arenas, theater productions, recording studios, or movie and video productions.
INDUSTRY DISTRIBUTION
Industry DistributionSound engineering technicians are hired across a number of different industries; however, most are employed in entertainment; 7,650 sound engineering techs were employed in the entertainment industry in the LA basin in 2016. They accounted for 95.8 percent of employment in this occupation across all industries.
The three industry subsectors that employ the largest number of sound engineering technicians in the LA basin are:
Motion Picture and Sound Recording (NAICS 512) Performing Arts, Spectator Sports and Related (NAICS 711) Broadcasting, not Internet (NAICS 515)
200Total Openings
2016 to 2021
4,040Jobs in LA/OC
in 2016HOURLY WAGES IN LA BASIN 2016
$28.97 $32.66
$13.08 $14.48
Median Hourly Wage Living Wage (1 adult)*
LOS ANGELES ORANGE COUNTY* MIT Living Wage Calculator
EDUCATIONAL ATTAINMENT 2016
AGE DISTRIBUTION 2016
RACE AND ETHNICITY 2016
GENDER 2016
Target occupation
Target occupation
Target occupation
Total, all occupations
Total, all occupations
Total, all occupations
Total, all occupations
Less than HS High School
Associate’s/Some College Bachelor’s
Master’s or Higher
Hispanic White
Asian Black
Other2.4%
6.1%
7.5%
0.3%
4.2%
Male Female
Under 24 years 25 to 39 years
40 to 54 years 55 years and over
Worker CharacteristicsThe demographics of the workforce provide an additional layer of information to further highlight who is employed in this occupation in the LA Basin:
TOTAL PROJECTED OPENINGS 2021
ENTERTAINMENT-RELATED 2021
Target occupation5.3%
16.0%
26.7% 32.1% 36.6%
54.8% 45.2%
43.1% 33.0% 15.8% 5.7%
19.4% 30.4% 22.6% 11.5%
17.3% 44.9% 28.9%
26.7%29.1%40.7%
79.2% 9.0%
93.9%
Sound Engineering Technicians (SOC 27-4014)
Other Services
1%
Profnl and Biz Svcs
1%
Education1%
ENTERTAINMENT AND THE RISE OF DIGITAL MEDIA
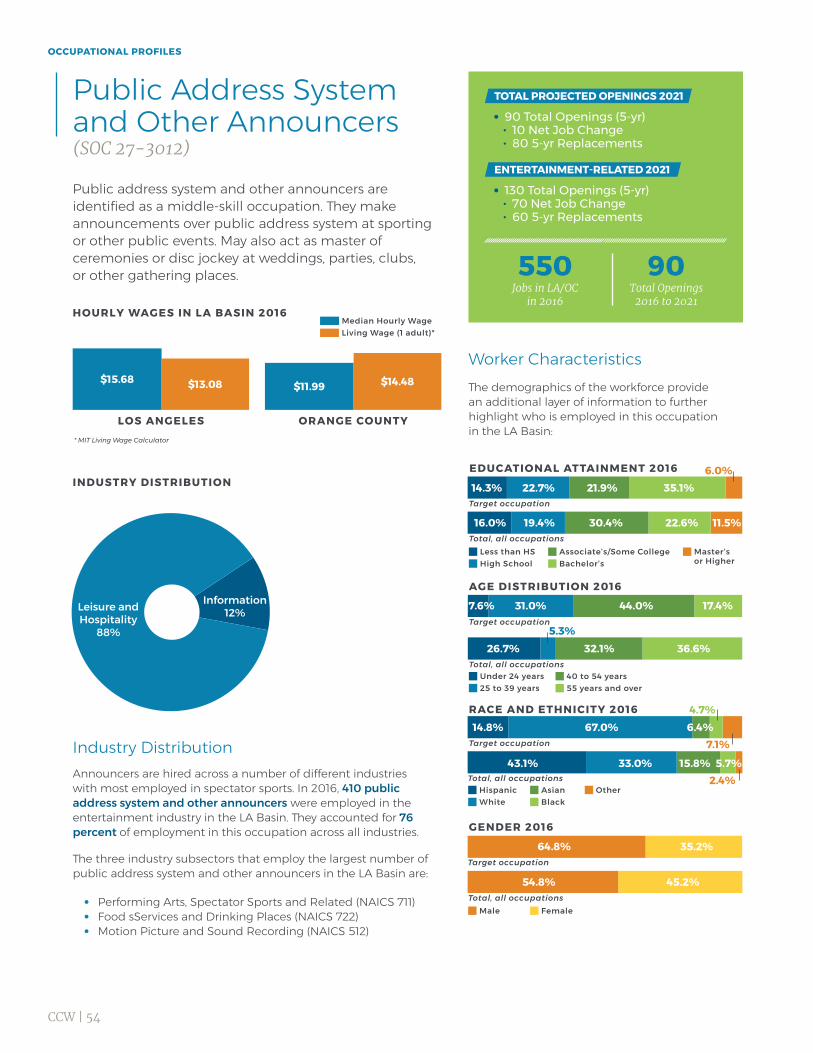
CCW | 54
Information12%Leisure and
Hospitality88%
90 Total Openings (5-yr) 10 Net Job Change 80 5-yr Replacements
130 Total Openings (5-yr) 70 Net Job Change 60 5-yr Replacements
Public address system and other announcers are identified as a middle-skill occupation. They make announcements over public address system at sporting or other public events. May also act as master of ceremonies or disc jockey at weddings, parties, clubs, or other gathering places.
Public Address System and Other Announcers (SOC 27-3012)
INDUSTRY DISTRIBUTION
Industry DistributionAnnouncers are hired across a number of different industries with most employed in spectator sports. In 2016, 410 public address system and other announcers were employed in the entertainment industry in the LA Basin. They accounted for 76 percent of employment in this occupation across all industries.
The three industry subsectors that employ the largest number of public address system and other announcers in the LA Basin are:
Performing Arts, Spectator Sports and Related (NAICS 711) Food sServices and Drinking Places (NAICS 722) Motion Picture and Sound Recording (NAICS 512)
90Total Openings
2016 to 2021
550Jobs in LA/OC
in 2016HOURLY WAGES IN LA BASIN 2016
Median Hourly Wage Living Wage (1 adult)*
EDUCATIONAL ATTAINMENT 2016
AGE DISTRIBUTION 2016
RACE AND ETHNICITY 2016
GENDER 2016
Target occupation
Target occupation
Target occupation
Total, all occupations
Total, all occupations
Total, all occupations
Total, all occupations
Less than HS High School
Associate’s/Some College Bachelor’s
Master’s or Higher
Hispanic White
Asian Black
Other2.4%
7.1%
4.7%
Male Female
Under 24 years 25 to 39 years
40 to 54 years 55 years and over
Worker CharacteristicsThe demographics of the workforce provide an additional layer of information to further highlight who is employed in this occupation in the LA Basin:
TOTAL PROJECTED OPENINGS 2021
ENTERTAINMENT-RELATED 2021
Target occupation5.3%
16.0%
26.7% 32.1% 36.6%
54.8% 45.2%
43.1% 33.0% 15.8% 5.7%
19.4% 30.4% 22.6% 11.5%
22.7%14.3% 35.1%21.9%6.0%
7.6% 31.0% 44.0% 17.4%
67.0%14.8% 6.4%
64.8% 35.2%
$15.68 $11.99$13.08 $14.48
LOS ANGELES ORANGE COUNTY* MIT Living Wage Calculator
OCCUPATIONAL PROFILES
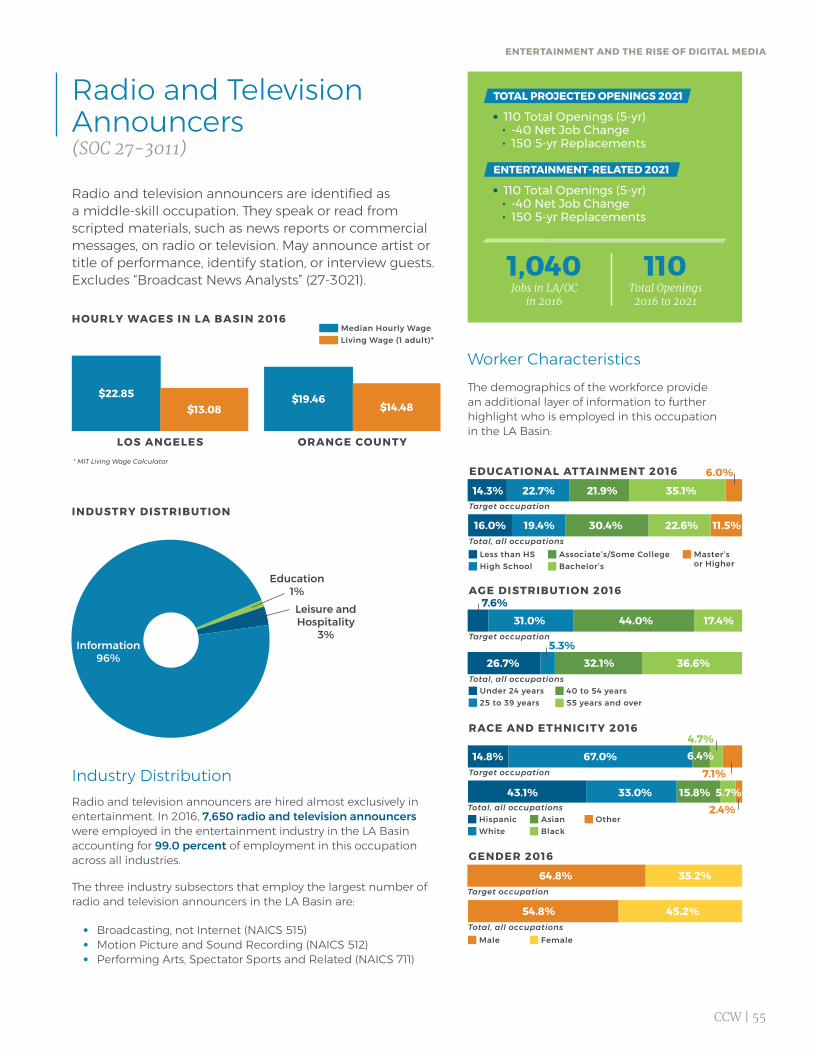
CCW | 55
7.6%
Information 96%
110 Total Openings (5-yr) -40 Net Job Change 150 5-yr Replacements
110 Total Openings (5-yr) -40 Net Job Change 150 5-yr Replacements
Radio and television announcers are identified as a middle-skill occupation. They speak or read from scripted materials, such as news reports or commercial messages, on radio or television. May announce artist or title of performance, identify station, or interview guests. Excludes “Broadcast News Analysts” (27-3021).
INDUSTRY DISTRIBUTION
Industry DistributionRadio and television announcers are hired almost exclusively in entertainment. In 2016, 7,650 radio and television announcers were employed in the entertainment industry in the LA Basin accounting for 99.0 percent of employment in this occupation across all industries.
The three industry subsectors that employ the largest number of radio and television announcers in the LA Basin are:
Broadcasting, not Internet (NAICS 515) Motion Picture and Sound Recording (NAICS 512) Performing Arts, Spectator Sports and Related (NAICS 711)
110Total Openings
2016 to 2021
1,040Jobs in LA/OC
in 2016HOURLY WAGES IN LA BASIN 2016
$22.85 $19.46$13.08 $14.48
Median Hourly Wage Living Wage (1 adult)*
LOS ANGELES ORANGE COUNTY* MIT Living Wage Calculator
EDUCATIONAL ATTAINMENT 2016
AGE DISTRIBUTION 2016
RACE AND ETHNICITY 2016
GENDER 2016
Target occupation
Target occupation
Target occupation
Total, all occupations
Total, all occupations
Total, all occupations
Total, all occupations
Less than HS High School
Associate’s/Some College Bachelor’s
Master’s or Higher
Hispanic White
Asian Black
Other2.4%
4.7%
7.1%
6.0%
Male Female
Under 24 years 25 to 39 years
40 to 54 years 55 years and over
Worker CharacteristicsThe demographics of the workforce provide an additional layer of information to further highlight who is employed in this occupation in the LA Basin:
TOTAL PROJECTED OPENINGS 2021
ENTERTAINMENT-RELATED 2021
Target occupation5.3%
16.0%
26.7% 32.1% 36.6%
54.8% 45.2%
43.1% 33.0% 15.8% 5.7%
19.4% 30.4% 22.6% 11.5%
14.3% 22.7% 21.9% 35.1%
17.4%44.0%31.0%
67.0%14.8% 6.4%
64.8% 35.2%
Radio and Television Announcers (SOC 27-3011)
Leisure andHospitality
3%
Education1%
ENTERTAINMENT AND THE RISE OF DIGITAL MEDIA
CCW | 56
Numerous data sources and methodologies were used to measure the target industry for this deep dive.
Industry ForecastAn economic forecast is created to project employment by industry over the next five years using statistical analysis of historical data paired with the most recent qualitative information impacting a set of 151 industries in the Los Angeles Basin. The industries configured for this forecast are defined through the North American Industry Classification System (NAICS) and comprise industries denoted with 2-digit, 3-digit and 4-digit codes through the NAICS hierarchical classification system. A key input for the regional forecast is projected population growth in Los Angeles and Orange counties, provided by the California Department of Finance. State and national trends concerning production methods, consumer behavior, construction and property values that correspond to each industry are a few of the inputs used for the economic forecast model.
Occupations and ProjectionsOccupations are commonly classified using the Standard Occupational Classification (SOC) system, developed by the Bureau of Labor Statistics. This system classifies workers into 840 detailed occupations that share similar job duties, skills, education and training. These occupations are not industry-specific, but are common to many industries. For example, retail salespersons are employed in a full spectrum of industries, from department and discount stores to computer systems design.
The economic forecast for employment by industry is used to guide a projection of net new jobs for each occupation, calculated by applying the industry occupational composition to the detailed industry employment forecast; occupational forecasts are aggregated across industries.
The United States Census Bureau estimates replacement needs by industry and occupation through detailed surveys of employers and households. These take into account industry changes, the age of the current workforce within each industry and occupation, and the nature of the career path. These estimates are an important component of occupational job openings and workforce development needs, since the retirement and promotion of individuals leave openings for new entrants and those moving up the career ladder.
Total openings are the sum of projected five-year replacement needs and positive net new jobs forecast over the period.
AppendixHow (and why) we did what we did.
CCW | 57
Target Industries and OccupationsTarget industries are selected using a variety of metrics: middle-skill job share; the projected change in middle-skill jobs from 2016 to 2021 (number and rate); the five-year job replacement rate; the 2016 location quotient; the change in location quotient from 2011 to 2016; the 2016 annual average wage relative to all industries; and value added per worker. (Middle-skill jobs require education and training beyond a high school diploma but less than a bachelor’s degree.)
Target occupations are selected in a two-step process. First, all occupations identified as middle-skill are isolated from each target industry. Then, a variety of metrics are used to select target occupations: 2016 employment; projected net job change; replacement rate; number of projected replacement jobs from 2016 to 2021; number of projected total job openings from 2016 to 2021; and annual median wages.
Location QuotientA common metric to assess a region’s competitiveness is employment concentration or location quotients. A location quotient for an industry in a specific region compares the percent of total employment in the industry to the average percent nationwide. For example, if 4 percent of employment in a region is in the aerospace industry compared to 2 percent across the nation, the location quotient for the region’s aerospace industry is 2, indicating the region is more specialized in aerospace than the nation.
A location quotient equal to 1.0 indicates the employment concentration in the region is equal to the nation, meaning the region is not highly-specialized in that industry. Higher location quotients imply a competitive advantage. While there can be some variation in this metric, the location quotient threshold of 1.2 usually demonstrates regional specialization and competitiveness.
SupplyCommunity colleges and other two-year educational institutions provide education and training relevant to middle-skill occupations. Comparing occupations with related training programs provides information for supply-and-demand analysis. The number of awards conferred by community colleges reflects the most recent data available from the 2015-16 academic year. Award data for other two-year education institutions is from the 2014-2015 academic year. Due to data and timing limitations, training gap forecasts are an approximation of unmet labor demand do not represent an absolute oversupply or undersupply of available talent. In addition, a one-to-one relationship between program completions and occupational demand does not exist because some programs train for multiple occupations. Consequently, awards for some education and training programs overall with multiple occupations.
ENTERTAINMENT AND THE RISE OF DIGITAL MEDIA

CCW | 58
Economic Impact and Contribution AnalysisEconomic contribution analysis is used to estimate the portion of a region’s economic activity that can be attributed to an existing industry sector, including the expenditure of money for goods and services from regional vendors. These purchases circulate throughout the regional economy.
The entertainment and digital media industries spend billions of dollars every year on wages and benefits for employees and contingent workers. These workers, as well as the employees of all suppliers, spend a portion of their incomes on groceries, rent, vehicle expenses, health care, entertainment, and so on. This recirculation of household earnings multiplies the initial industry spending through indirect and induced effects.
The extent to which the initial expenditures multiply is estimated using economic models that depict the relationships between industries (such as aerospace and its suppliers) and among different economic agents (such as industries and their employees). These models are built upon data of expenditure patterns reported to the Bureau of Labor Statistics, U.S. Census Bureau and Bureau of Economic Analysis of the U.S. Department of Commerce. Data is regionalized to reflect local conditions such as wage rates, commuting patterns, and resource availability and costs.
The magnitude of the multiplying effect differs from one region to another depending on the extent to which the local region can fill the demand for all rounds of supplying needs. For example, the automobile manufacturing industry has high multipliers in Detroit and Indiana since these regions have deep supplier networks, while the same industry multiplier in Phoenix is quite small. In another example, the jobs multiplier for the construction industry is higher in, say, Arkansas, than in California because a given amount of spending will purchase fewer workers in Los Angeles than in Little Rock.
Multipliers also differ from year to year as relative material and labor costs change and as the production “recipe” of industries change. For example, the IT revolution significantly reduced the job multiplier of many industries (such as manufacturing, accounting and publishing) as computers replaced administrative and production workers.
The metrics used to determine the value of the economic contribution are employment, labor income, value-added and the value of output. Employment includes full-time, part-time, permanent and seasonal employees and the self-employed, and is measured on a job-count basis regardless of the number of hours worked. Labor income includes all income received by both payroll employees and the self-employed, including wages and benefits such as health insurance and pension plan contributions. Value-added is the measure of the contribution to GDP made by the industry, and consists of compensation of employees, taxes on production and gross operating surplus (otherwise known as profit).
APPENDIX

CCW | 59
Output is the value of the goods and services produced. For most industries, this is simply the revenues generated through sales; for others, such as retail, output is the value of the services supplied.
Estimates are developed using software and data from IMPLAN Group, LLC which traces inter-industry transactions resulting from an increase in demand in a given region. The economic region of interest in this document is the Los Angeles Basin. The activity is reported for 2015, the most recent year for which a complete set of data is available. Estimates for labor income and output are expressed in 2015 dollars to maintain consistency with the reported industry activity.
The total estimated economic contribution includes direct, indirect and induced effects. Direct activity includes materials purchased and employees hired by the industry itself. Indirect effects are those which stem from employment and business revenues resulting from purchases made by the industry and any of its suppliers. Induced effects are those generated by household spending of employees whose wages are sustained by both direct and indirect spending.
Contribution analysis differs from economic impact analysis in that linkages between the individual component industries are removed, so that indirect activity is not double-counted as part of direct activity. For example, firms in the aerospace industry purchase supplies from smaller manufacturers of aerospace parts, which would then be included as both direct revenue of the parts supplier and as an expense of the aerospace industry, resulting in a double-counting of overall revenue. Breaking these inter-industry linkages eliminates this double-counting and is a more accurate method of estimating the economic contribution of the industry cluster.
Data SourcesAll data was obtained from the Bureau of Labor Statistics and the Census Bureau. Annual employment and payroll data are from the Quarterly Census of Employment and Wages series. Estimates for non-disclosed employment and payroll data were produced using proportional shares of the prior year’s data or using midpoint estimates from the Census Bureau’s County Business Patterns dataset. Occupational data are from the Occupational Employment Statistics program. Unless noted otherwise, all data is for the 2016 calendar year.
Supply Chain and Output AnalysisComposition of gross output is a metric tracked by the BEA at the state level. It is assumed that the proportion attributable to each component of this metric at the county level is comparable to that at the state level. This seems reasonable given the size of the Los Angeles Basin and its economic activity in the state. Estimates of regional purchases of intermediate goods and services are produced using econometric models by the IMPLAN Group, LLC.
ENTERTAINMENT AND THE RISE OF DIGITAL MEDIA

Related Documents