Enhancing the quality of Embedded Systems through Comparative Reliability Analysis D. Bala Krishna Kamesh 1 , Dr. A. K. Vasishtha 2 , Dr. JKR Sastry 3 and Dr. V Chandra Prakash 4 1 Scholar, Shri Venkateshwara University, Gajraula, [email protected] 2 Professor, Shri Venkateshwara University, Gajraula, [email protected] 3,4 KL University, Vaddeswaram, Guntur district, [email protected], [email protected] Abstract The last step in the Clean Room Software Engineering (CRSE) methodology is to certify the final system after conducting minimal and comprehensive testing. Reliability is generally used as one of the quality assessment parameters for certification. Reliability of a system can be computed by using different methods and a comparative analysis of computed reliabilities gives good insight into refining and maintaining high quality of a system over its life. In this paper, a comparative analysis of reliability of an embedded system computed using three models viz. reliability evaluation through Statistical Use Testing (SUT) and exhaustive testing, reliability evaluation through Fault Tree Analysis (FTA) and reliability evaluation through Markov models has been presented. In this paper, Reliability evaluation of an embedded system that monitors and controls temperatures within a nuclear reactors system (TMCNRS has been presented. In addition, a comparative analysis of reliability computed using all the three methods has been presented bringing in many of the insights that help maintaining the reliability of an embedded system at a steady-state level. Keywords: Reliability evaluation, embedded systems, quality certification, Fault tree analysis, Markov Models, Minimal and comprehensive testing 1.0 Introduction Cleanroom Software engineering has included in it, the issue of certification of the finished product which is either a loaded system or an Embedded System. Evaluation of reliability of the developed system is required to certify a system. In order to compute the reliability of a product, it is necessary to complete both the phases i.e., the development and testing as defined in CRSE. Figure 1.1 shows the models and flow that have been included into refined CRSE methodology. These models make the

Welcome message from author
This document is posted to help you gain knowledge. Please leave a comment to let me know what you think about it! Share it to your friends and learn new things together.
Transcript
Enhancing the quality of Embedded Systemsthrough Comparative Reliability Analysis
D. Bala Krishna Kamesh1, Dr. A. K. Vasishtha2, Dr. JKR Sastry3 and Dr. VChandra Prakash4
1Scholar, Shri Venkateshwara University, Gajraula, [email protected] Professor, Shri Venkateshwara University, Gajraula, [email protected],4KL University, Vaddeswaram, Guntur district, [email protected],
Abstract
The last step in the Clean Room Software Engineering (CRSE) methodology is tocertify the final system after conducting minimal and comprehensive testing.Reliability is generally used as one of the quality assessment parameters forcertification. Reliability of a system can be computed by using different methodsand a comparative analysis of computed reliabilities gives good insight intorefining and maintaining high quality of a system over its life. In this paper, acomparative analysis of reliability of an embedded system computed using threemodels viz. reliability evaluation through Statistical Use Testing (SUT) andexhaustive testing, reliability evaluation through Fault Tree Analysis (FTA) andreliability evaluation through Markov models has been presented. In this paper,Reliability evaluation of an embedded system that monitors and controlstemperatures within a nuclear reactors system (TMCNRS has been presented. Inaddition, a comparative analysis of reliability computed using all the threemethods has been presented bringing in many of the insights that helpmaintaining the reliability of an embedded system at a steady-state level.
Keywords: Reliability evaluation, embedded systems, quality certification, Fault treeanalysis, Markov Models, Minimal and comprehensive testing
1.0 Introduction
Cleanroom Software engineering has included in it, the issue ofcertification of the finished product which is either a loadedsystem or an Embedded System. Evaluation of reliability of thedeveloped system is required to certify a system. In order tocompute the reliability of a product, it is necessary to completeboth the phases i.e., the development and testing as defined inCRSE. Figure 1.1 shows the models and flow that have beenincluded into refined CRSE methodology. These models make the

system of development and testing the embedded systems moreformal and facilitate automation.
Reliability is the ability of a system or component to performits required functions under stated conditions for a specifiedperiod of time. The software failure rate is defined as theprobability of failure of usage of the software.
Reliability is the probability that a system will not fail. Manymethods have been proposed in the past using which thereliability of a system can be computed. In CRSE methodology, thecompletion of design of a system is followed by generation ofcode. Test cases are generated and the testing of the generatedcode is carried using Test cases and the test results obtainedare stored in a file called audit trail which is used forcomputing reliability of a system.
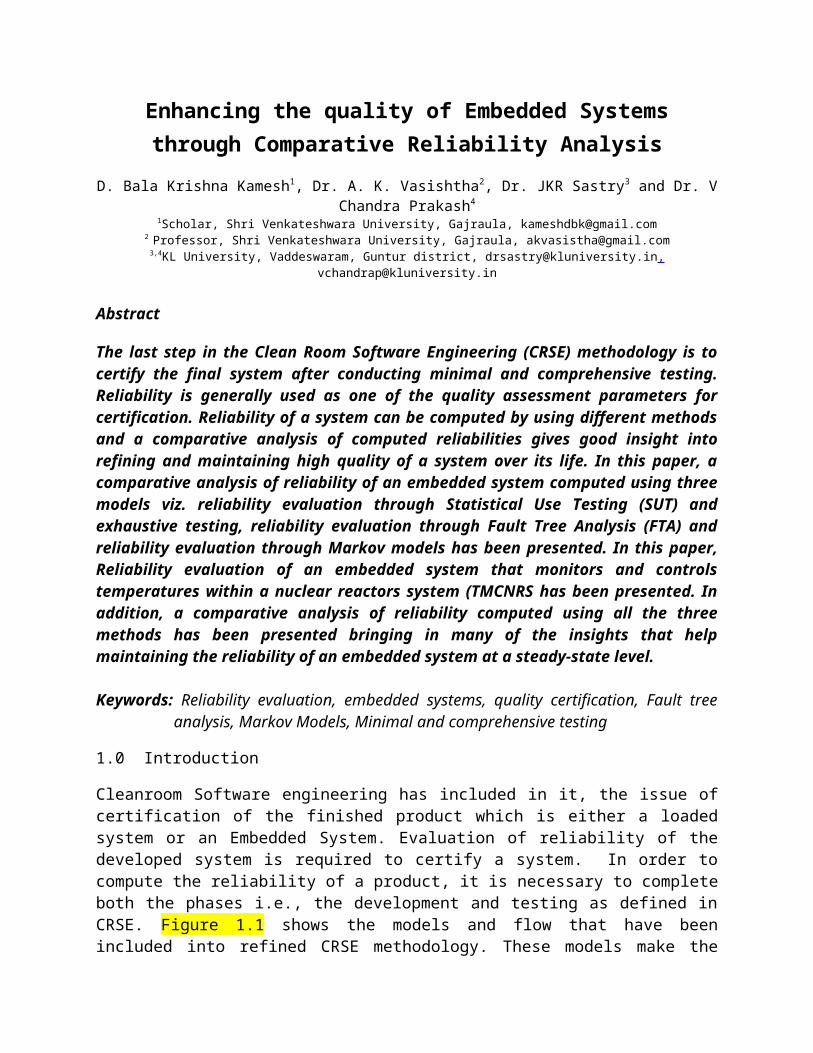
The test case generation and undertaking the actual testingrequires many of the formal models which include stimulus-response models, State transition models, FTA models etc., whichare shown in Figure 1.1. Embedded systems have to becomprehensively tested considering both hardware and softwarewhich requires usage of the many testing methods, test gadgetsand the testing has to be carried at different locations whichinclude HOST, TARGET (Embedded System) and HOST+TARGET. Figure1.2 shows a typical process that is used for undertaking thetesting once test cases have been generated. Formal models havebeen presented using which generation of test cases for carryingminimal testing [D. Bala Krishna Kamesh et al., 2013-6] [D.Bala Krishna Kamesh,Sastry JKR et al., 2011] and exhaustivetesting in the critical regions of the embedded systems [D. BalaKrishna Kamesh et al., 2013-7] [Output Domain + Criticality] canbe undertaken.

Figure 1.1 CRSE Model which includes formal models for undertaking thetesting
Reliability of a system can be computed by using different modelswhich include Comprehensive Testing, FT analysis and MarkovModel. In this paper, the models have been explained and thecomputation of reliability of an embedded system that monitorsand controls temperatures within a Nuclear Reactor System(TMCNRS) has been presented. A comparative analysis of differentreliability computations has also been presented which givesinsights into sustaining the reliability of the system over itslife span.
2.0 Computation of Reliabilitythrough comprehensive testing
Reliability of a system can be computed after generating the testcases and conducting actual testing. The generated test casesmust be sufficient to carry minimal testing as advocated by CRSEand exhaustive testing in the critical regions of the embeddedsystem. Testing has been carried at HOST using the methodsScaffolding, Assert Macros, Instruction set simulators and thirdparty tools, at TARGET using Logic Analyzer and at HOST+TARGETusing the methods In-circuit emulator and monitors. All the testresults obtained are consolidated into an audit trail which isused for computing the reliability using “Testing method”. Asample of results obtained after carrying testing using themethod scaffolding at the HOST are shown in the Table 2.1
Figure 1.2 Testing process – Refined CRSE methodology
Miller model [Keith W. Miller et al., 1992] can be used forcomputing the reliability based on the test results. According toMiller, the expected value of the reliability of a system can becomputed using the equation given below.

E (R )=1−¿
where f is the number of failures, s is the number of successfultest cases, a & b are parameters which are assumed to be 1 inmost of the cases. The Miller model is based on Bayesianstatistics and allows the user of the model to take advantageof prior knowledge of the system under test. The Miller modelassumes that the possible failure rates of the software have astandard Beta distribution.
An iterative process has been used for computing the reliabilityof the TMCNRS. A sample set of 1000 test cases that aredistributed across all the paths contained in the usage model hasbeen generated while keeping account of the number of test casesthat are required in each of the paths. The enrichment of thetest set is achieved through generation of extra test cases tocover exhaustively the critical regions of the embedded system.
A sample of test cases generated is shown in the Table 2.1.
The size of the sample has been varied periodically in steps of100 using an automated process and the test cases are generatedusing which the actual testing has been conducted. Thereliability of the embedded system has been computed using theMiller model. The reliability computations are shown in Table2.2. The reliability of the TMCNRS that is estimated based on thetest results is found to be stable at 0.991 and no furtherimprovement could be achieved thereafter by increasing the samplesize.
Table 2.2 Reliability computations using Miller model Iterationnumbe
r
Samplesize
Number oftest casegenerated
Number ofTestcasesfailed
Number of testcases
succeeded
Reliability
value
1. 1000 653 11 642 0.9812. 1200 853 12 841 0.9843. 1400 1053 12 1041 0.9874. 1600 1253 13 1240 0.9885. 1800 1453 15 1438 0.989

6. 2000 1667 15 1652 0.9907. 2200 1820 16 1804 0.9908. 2500 2000 17 1983 0.991
3.0 Computation of Reliabilitythrough Hardware Fault tree Analysis (FTA)
Reliability of a system can be computed by constructing a Faulttree [Peter Liggesmeyer et al., 2001][D.Bala Krishna Kamesh etal., 2013-]. A top down approach is followed in FTA. It startswith system failure situations which must be avoided and analyzesthat these failures can be caused by faults of the subsystems orsystem components. Fault Tree Analysis is a well-recognized toolfor evaluating safety and reliability in system design,development and operation.
FTA is the most often used method for identifying safety criticalcomponents, verifying product requirements, certifying productreliability, assessing product risk, investigating accidents/incidents, evaluating design changes, displaying the causes andconsequences of events, and identifying common cause of failures.Fault tree is generally represented graphically using the logicalstructure that uses AND/OR gates.
Sometimes, some basic events may need to occur together in orderfor the top event to occur in which case the events would begrouped under an AND gate, and when any of the events couldtrigger the top event then in that case, they would be groupedunder an OR gate.
A fault tree provides a concise, visual representation of variouscombinations of possible occurrences of faults within a systemthat can result in a predefined and undesirable failure of thesystem as a whole.
FTA involves various steps that include defining the top event,analyzing the system, constructing the tree, validating the tree,evaluating the tree, considering alternatives and recommendaction.

Top event defines a specific failure to be investigated and alsodetermines all desired events in an operating environment thatlead to the specific failure. The desired events that have commoncharacteristics are grouped together that lead to the top event.Several FTAs may be necessary to study a system completely.Finally, one event should be established representing all eventswithin each group. All available information about the system andits environment should be studied thoroughly.
A job analysis may prove to be helpful in determining thenecessary information to identify the events. Once the top eventis identified, it is analyzed for the subsystem faults and therelationship between these faults. These are represented as atree using logical gates and some symbols. This requires allowinga person knowledgeable in the process to review the tree forcompleteness and accuracy. The tree should then be inspected forthose areas where improvements can be made or where there may bean opportunity to utilize alternative procedures to decrease thenumber of hazards that may occur. The last step is to consideralternatives and recommend corrective actions or alternativemeasures.
Every embedded system is built using specific Hardware anddedicated Software. FTA models can be used for estimating thefailure rates of Hardware and Software components. The failurerates of the software and hardware states have been considered todetermine the failure rates of the arcs in a usage model. Thedistribution of the test cases among different paths is donebased on the combined failure rates of the arcs emanating fromeach of the states. The paths contained in the HW and SW faulttrees are mapped to the paths in a Markov model and the failurerates of the FT paths are transferred to paths in the Markovmodel.
The reliability of hardware used within an embedded system is thefailure rate considering the failure rates of all the apex nodesof the fault tree. Highest of the failure rates of the APEX nodescan be used to determine the failure rate of the top of the event

node. The hardware fault tree related to TMCNRS is shown in theFigure 3.1.
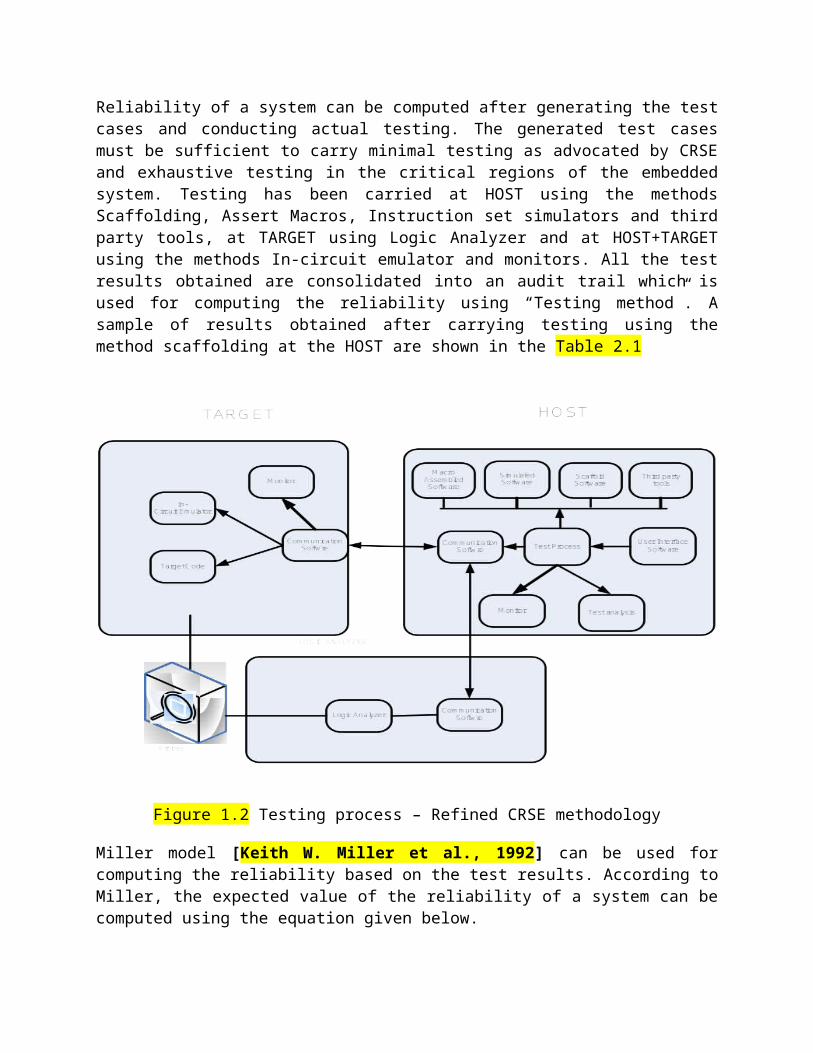
The computation of failure rates of the HW components as per thefault tree (Figure 3.1) is shown in the Table 3.1. Thereliability of the hardware is the success rate consideringsuccess rates of all apex nodes in the fault tree. The successrates are obtained by subtracting failure rates from 1. Thefailure rates and success rates of the apex nodes in FT ofhardware are shown in the Table 3.2. The reliability of thehardware thus of TMCNRS is 0.61.
Table 3.2 Failure rates of the apex nodes in Hardware fault tree
Apex Node Failurerate
Successrate
Pump1 Failure 0.42 0.58Pump2 Failure 0.46 0.54Buzzer Failure 0.39 0.61HOST Interface failure 0.39 0.61LCD Failure 0.39 0.61Maximum failure 0.39 0.61Reliability of HW used in the TMCNRSsystem
0.39 0.61
4.0 Computation of Reliability of software through FTA
Software is divided into small slices so that failure rate of theslices is estimated. Faulty tree for a software can beconstructed using the program slices [D.Bala Krishna Kamesh etal., 2013-1][ Mark Weiser 1984]. The reliability of software usedwithin an embedded system can be estimated using the highestfailure rate considering the failure rates of all the apex nodesof the software fault tree. The software fault tree related toTMCNRS is shown in the Figure 4.1[D. Bala Krishna Kamesh et al.,2013-].
The computation of failure rates of the SW components as per thefault tree (Figure 4.1) is shown in the Table 4.1. The failurerates of the apex nodes in FT of software are shown in the Table4.2. The reliability of the software can be computed using thehighest failure rates of all the apex nodes in the fault tree.The reliability of the software is computed to be 0.893.
Table 4.2 Failure rates of the apex nodes in Software Fault TreeApex Node Failure
rateWrite Ref1 on LCD 0.893Write Ref2 on LCD 0.893Buzzer On 0.893Buzzer Off 0.893Write Temp Mismatch message to LCD 0.893

Write Temp1 to LCD 0.893Send Temp1 to HOST 0.893Pump1On 0.893Pump1Off 0.893Write Temp1 to LCD 0.893Send Temp1 to HOST 0.893Pump1On 0.893Pump1Off 0.893Write Temp1 to LCD 0.893Write Key 0.893Reliability of HW used in the TMCNRS 0.893
5.0 Computation of reliability through Markov model
Reliability of an embedded system can be computed using a Markovmodel constructed for an embedded system [Kirk Sayre 1999]. Theexpected values and variances of the arc failure rates can becomputed using the Beta distribution.
E (F(i.j))−fi.j+ai.j
fi.j+si.j+ai.j+bi.j
The single-use reliability Rv is defined as the Probability ofexecuting from (Invoke) state to (Terminate) state without encounteringa failure. The single-use unreliability,Fv, is the probability ofgoing from (Invoke) to (Terminate) and encountering at least onefailure.
The reliability of a path in a usage model can be computed usingthe following equation
E (Rn)=MAX ¿
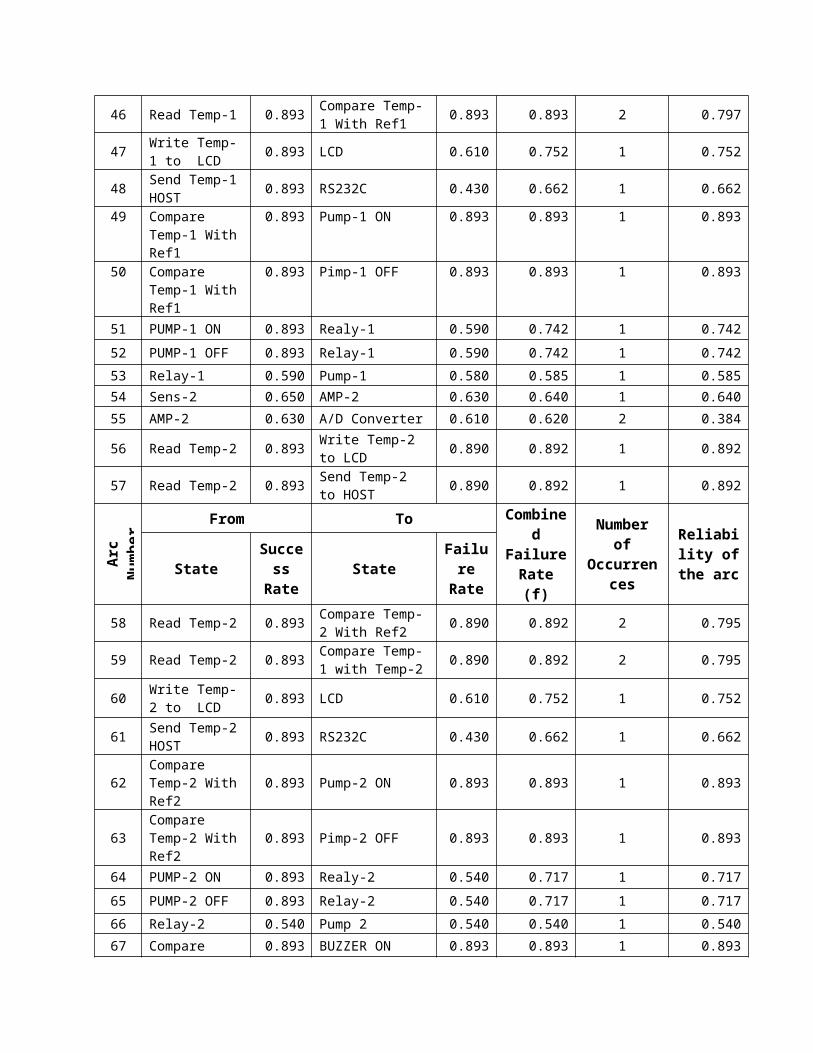
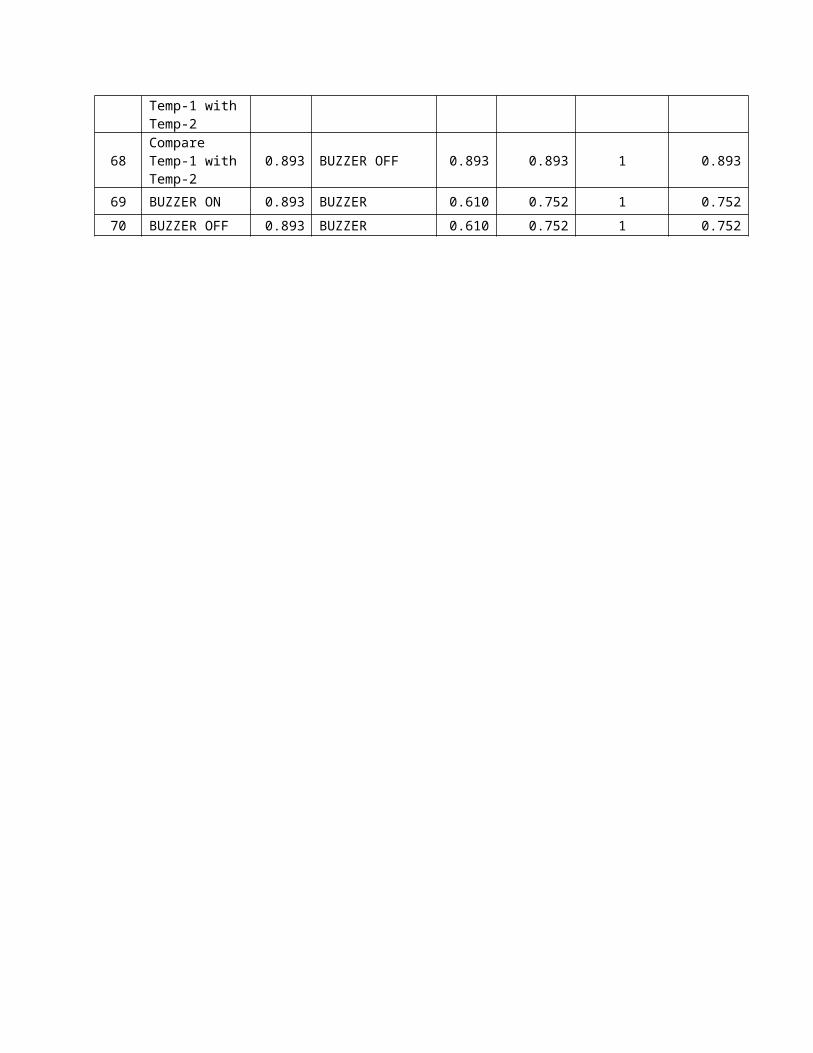
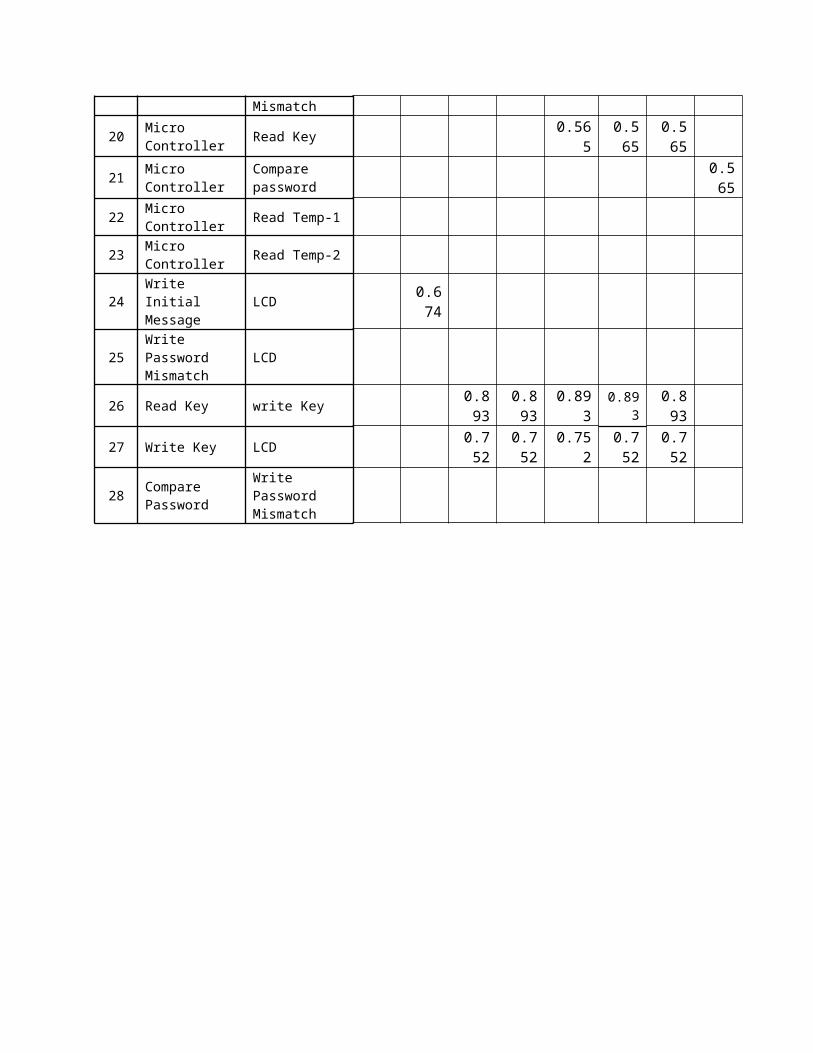
where Fi.jisthe failure rate and N (i.j)is the occurrence count ofan arc in the path. Table 5.1 shows the details of reliabilityestimation of the arcs contained in the Markov model related toTMCNRS.
The reliability of a path in a Markov model has been computedconsidering the arc reliability. The number of times an arc has
been traced is dependent on the number of test case that covers apath which contains the arc. The probability of occurrence of apath is the joint probability of occurrence of arcs situated onthe path. The arc failure rates may be sampled independentlybecause they are independent. As the sample size j grows, theaverage value of the sample approaches the expected value of thesample space, which in this case is E Rn [Kirk Sayre et al.,2002].
The reliability computations are shown in the Table 5.1. Thereliability of the Markov model is the minimum of reliability ofall the paths contained in a Markov model which is computed to be0.752.
6.0 Comparative analysis of the computed reliabilities and conclusions
The reliability of the TMCNRS has been computed considering threedifferent methods which include Comprehensive testing, FTanalysis and Model based estimations which are shown in the Table6.1.
Table 6.1 Comparative analysis of reliability estimations
SerialNumber
Computational Method Reliabilityestimation
1. Comprehensive Testing 0.9912. Fault Tree Analysis of HW 0.6103. Fault Tree Analysis of SW 0.8934. Model based estimation 0.752
The comprehensive testing, considering both HW and software,yielded the highest reliability of TMCNRS when compared withother methods. It is also seen that Model based reliabilitycomputation has yielded 0.752 which is primarily because of thehigher failure rates of HW arcs which can be improved byselecting HW devices of higher quality that will automaticallyimprove the FTA related to HW. Thus, it can be concluded that HWplays a vital role, compared to SW, in making the system more
reliable. Choice of highly reliable HW components makes thesystem more reliable. HW wears out but not software and as HWwears out, the reliability of the system keeps falling down. Itis necessary that the condition of the HW must be continuouslymonitored and maintained in tact so that the reliability of anembedded system can be maintained steadily at the same level.Certification of the end product developed using the CRSEmethodology can be undertaken using the computed reliabilityvalues.
References
[1]. D.Bala Krishna Kamesh, Prof. A.K. Vasishtha, Dr. JKR. Sastry and Dr. V.Chandra Prakash, “Estimating the Failure rates of Embedded Softwarethrough Program Slices”, International Journal of Systems andTechnology, Vol. 6, Issue 1, pp. 49-58, 2013-1.
[2]. D. Bala Krishna Kamesh, Dr. A. K. Vasist, Dr. JKR Sastry and Dr. V.Chandra Prakash, “Developing Usage Models through Stimulus ResponseSequences”, International Journal of Advances in Science and Technology,Vol. 7, No. 4, pp. 20-36, October, 2013-2.
[3]. D. Bala Krishna Kamesh, Dr. A. K. Vasist, Dr. JKR Sastry and Dr. V.Chandra Prakash, "Assessment of Failure rates of usage paths throughHardware Fault Tree Analysis", International Journal of Mathematics andComputational Methods in Science & Technology, Vol. 3, No. 2, 64-74, 2013-3.
[4]. D. Bala Krishna Kamesh, Dr. A. K. Vasist, Dr. JKR Sastry and Dr. V.Chandra Prakash, "Generating Test cases through Markov Models forundertaking Comprehensive Testing of Embedded Systems", International Journalof P2P Network Trends and Technology (IJPTT) , 2013-4.
[5]. D. Bala Krishna Kamesh, Dr. A. K. Vasist, Dr. JKR Sastry and Dr. V.Chandra Prakash, "Enriching the Test Cases for Testing the CriticalRegions of Embedded Systems", International Journal of Research andReviews in Applicable Mathematics & Computer Science, Vol. 3, No.2,2013-5.
[6]. Keith W. Miller, Larry J. Morell, Robert E. Noonan, Stephen K. Park,David M. Nicol, Branson W. Murrill, and Jeffrey M. Voas , "Estimatingthe Probability of Failure When Testing Reveals No Failures", IEEETransactions on Software Engineering, Vol. 18, Issue:1, pp. 33-43, 1992.
[7]. Kirk Sayre, "Improved Techniques for Software Testing based on MarkovChain Usage Models", Ph.D. dissertation, Dept. of Computer Science andEngg, University of Tennessee, Knoxville, Dec, 1999.
[8]. Kirk Sayre,Jesse Poore, "A reliability estimator for model basedsoftware testing", Proceedings. 13th International Symposium on SoftwareReliability Engineering, pp. 53-62, 2002.
[9]. Mark Weiser, “Program Slicing”, IEEE Transactions on Software Engineering, Vol.SE-10, No.4, pp. 352-357, July, 1984.
[10]. Peter Liggesmeyer and Oliver Maeckel, "Quantifying the reliability ofembedded systems by automated analysis", International Conference on DependableSystems and Networks , pp. 89-94 1-4 July, 2001
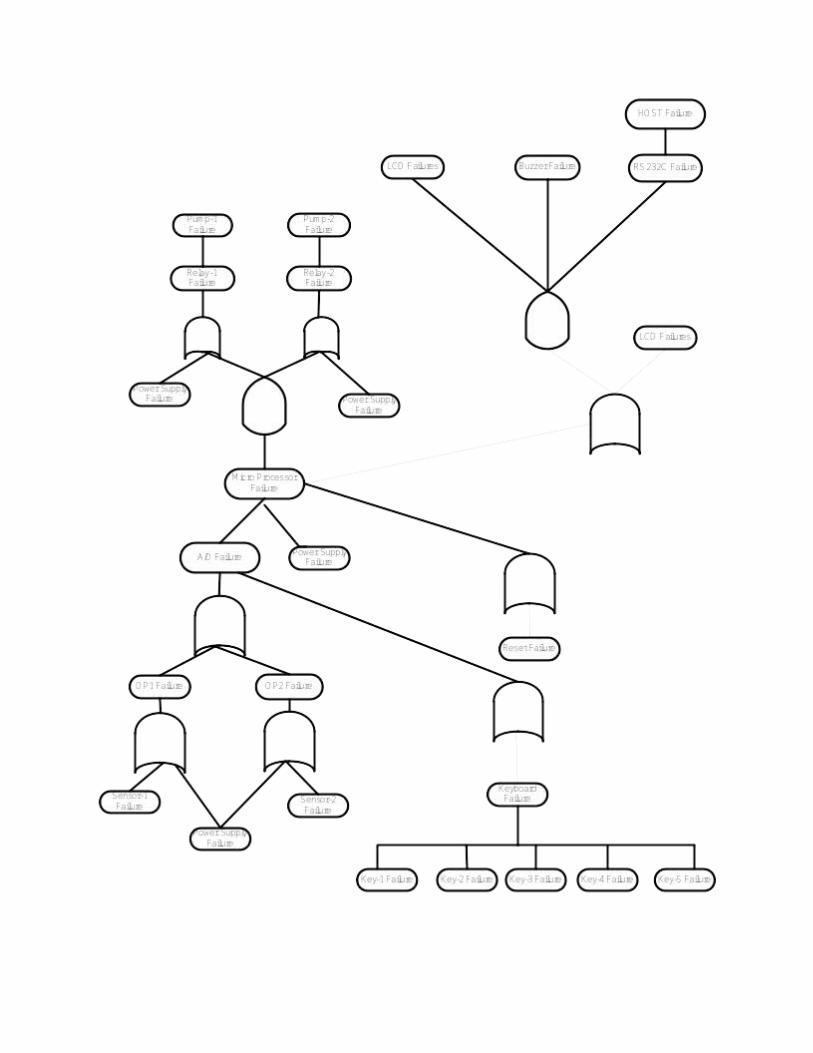

Figure 3.1 HW Fault Tree
Figure 4.1 Software Fault tree
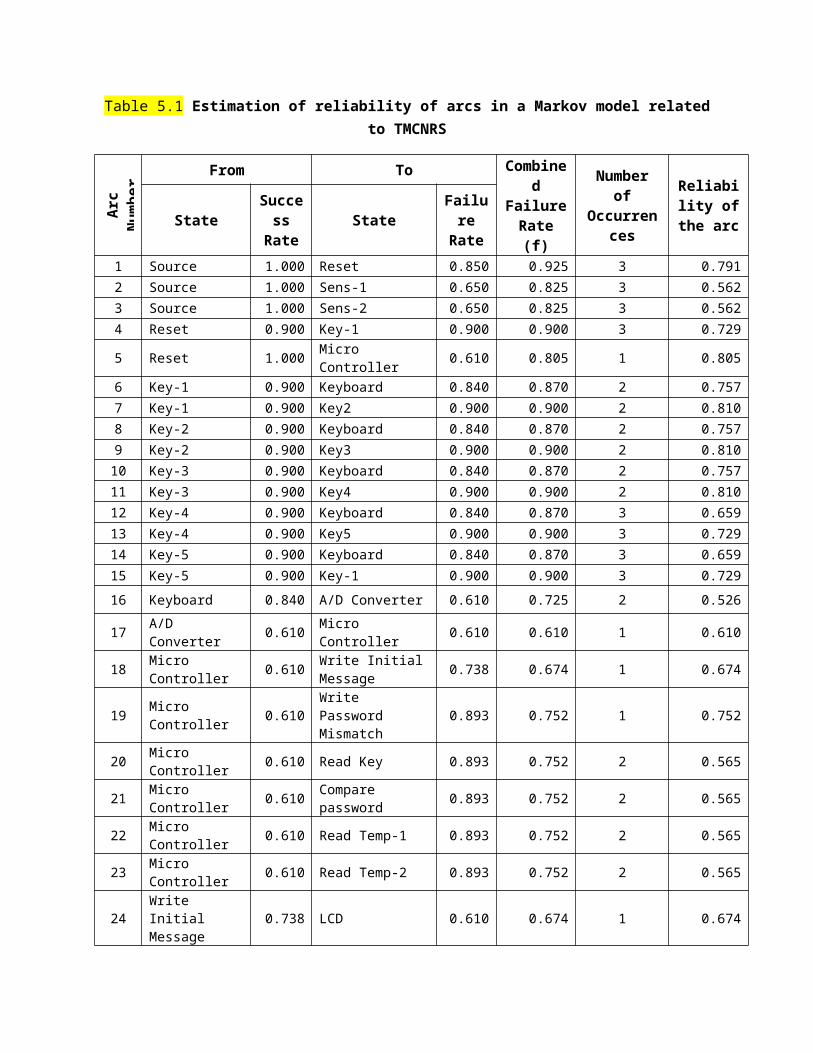
Table 5.1 Estimation of reliability of arcs in a Markov model relatedto TMCNRS
Arc
Numb
er
From To Combined
FailureRate(f)
Numberof
Occurrences
Reliability ofthe arcState
SuccessRate
StateFailure
Rate1 Source 1.000 Reset 0.850 0.925 3 0.7912 Source 1.000 Sens-1 0.650 0.825 3 0.5623 Source 1.000 Sens-2 0.650 0.825 3 0.5624 Reset 0.900 Key-1 0.900 0.900 3 0.729
5 Reset 1.000 Micro Controller 0.610 0.805 1 0.805
6 Key-1 0.900 Keyboard 0.840 0.870 2 0.7577 Key-1 0.900 Key2 0.900 0.900 2 0.8108 Key-2 0.900 Keyboard 0.840 0.870 2 0.7579 Key-2 0.900 Key3 0.900 0.900 2 0.81010 Key-3 0.900 Keyboard 0.840 0.870 2 0.75711 Key-3 0.900 Key4 0.900 0.900 2 0.81012 Key-4 0.900 Keyboard 0.840 0.870 3 0.65913 Key-4 0.900 Key5 0.900 0.900 3 0.72914 Key-5 0.900 Keyboard 0.840 0.870 3 0.65915 Key-5 0.900 Key-1 0.900 0.900 3 0.72916 Keyboard 0.840 A/D Converter 0.610 0.725 2 0.526
17 A/D Converter 0.610 Micro
Controller 0.610 0.610 1 0.610
18 Micro Controller 0.610 Write Initial
Message 0.738 0.674 1 0.674
19 Micro Controller 0.610
Write Password Mismatch
0.893 0.752 1 0.752
20 Micro Controller 0.610 Read Key 0.893 0.752 2 0.565
21 Micro Controller 0.610 Compare
password 0.893 0.752 2 0.565
22 Micro Controller 0.610 Read Temp-1 0.893 0.752 2 0.565
23 Micro Controller 0.610 Read Temp-2 0.893 0.752 2 0.565
24Write Initial Message
0.738 LCD 0.610 0.674 1 0.674

25Write Password Mismatch
0.893 LCD 0.610 0.752 1 0.752
26 Read Key 0.893 write Key 0.893 0.893 1 0.89327 Write Key 0.893 LCD 0.610 0.752 1 0.752
28 Compare Password 0.893
Write Password Mismatch
0.893 0.893 1 0.893
29 Compare Password 0.893 Request HOST
for REF1 0.893 0.893 2 0.797
30Write Password Mismatch
0.893 LCD 0.610 0.752 1 0.752
Arc
Numb
er
From To Combined
FailureRate(f)
Numberof
Occurrences
Reliability ofthe arcState
SuccessRate
StateFailure
Rate
31Request HOST for REF1
0.893 RS232C 0.430 0.662 1 0.662
32 RS232C 0.430 HOST 0.610 0.520 1 0.520
33 HOST 0.610 Read Ref1 from HOST 0.893 0.752 2 0.565
34 Read Ref1 from HOST 0.893 Write Ref-1
to LCD 0.893 0.893 2 0.797
35 Write Ref1 0.893 LCD 0.610 0.752 2 0.565
36 Write Ref1 0.893 Request Ref2 from HOST 0.893 0.893 2 0.797
37Request Ref2 from HOST
0.893 RS232C 0.430 0.662 2 0.438
38 RS232C 0.430 HOST 0.610 0.520 1 0.520
39 HOST 0.610 Read Ref2 from HOST 0.893 0.752 1 0.752
40 Read Ref2 from HOST 0.893 Write Ref2 0.893 0.893 1 0.893
41 Write Ref2 0.893 LCD 0.610 0.752 1 0.75242 Sens-1 0.650 AMP-1 0.640 0.645 2 0.41643 AMP-1 0.640 A/D Converter 0.610 0.625 2 0.391
44 Read Temp-1 0.893 Write Temp-1 to LCD 0.893 0.893 1 0.893
45 Read Temp-1 0.893 Send Temp-1 to HOST 0.893 0.893 1 0.893
46 Read Temp-1 0.893 Compare Temp-1 With Ref1 0.893 0.893 2 0.797
47 Write Temp-1 to LCD 0.893 LCD 0.610 0.752 1 0.752
48 Send Temp-1HOST 0.893 RS232C 0.430 0.662 1 0.662
49 Compare Temp-1 WithRef1
0.893 Pump-1 ON 0.893 0.893 1 0.893
50 Compare Temp-1 WithRef1
0.893 Pimp-1 OFF 0.893 0.893 1 0.893
51 PUMP-1 ON 0.893 Realy-1 0.590 0.742 1 0.74252 PUMP-1 OFF 0.893 Relay-1 0.590 0.742 1 0.74253 Relay-1 0.590 Pump-1 0.580 0.585 1 0.58554 Sens-2 0.650 AMP-2 0.630 0.640 1 0.64055 AMP-2 0.630 A/D Converter 0.610 0.620 2 0.384
56 Read Temp-2 0.893 Write Temp-2 to LCD 0.890 0.892 1 0.892
57 Read Temp-2 0.893 Send Temp-2 to HOST 0.890 0.892 1 0.892
Arc
Numb
er
From To Combined
FailureRate(f)
Numberof
Occurrences
Reliability ofthe arcState
SuccessRate
StateFailure
Rate
58 Read Temp-2 0.893 Compare Temp-2 With Ref2 0.890 0.892 2 0.795
59 Read Temp-2 0.893 Compare Temp-1 with Temp-2 0.890 0.892 2 0.795
60 Write Temp-2 to LCD 0.893 LCD 0.610 0.752 1 0.752
61 Send Temp-2HOST 0.893 RS232C 0.430 0.662 1 0.662
62Compare Temp-2 WithRef2
0.893 Pump-2 ON 0.893 0.893 1 0.893
63Compare Temp-2 WithRef2
0.893 Pimp-2 OFF 0.893 0.893 1 0.893
64 PUMP-2 ON 0.893 Realy-2 0.540 0.717 1 0.71765 PUMP-2 OFF 0.893 Relay-2 0.540 0.717 1 0.71766 Relay-2 0.540 Pump 2 0.540 0.540 1 0.54067 Compare 0.893 BUZZER ON 0.893 0.893 1 0.893
Temp-1 withTemp-2
68Compare Temp-1 withTemp-2
0.893 BUZZER OFF 0.893 0.893 1 0.893
69 BUZZER ON 0.893 BUZZER 0.610 0.752 1 0.75270 BUZZER OFF 0.893 BUZZER 0.610 0.752 1 0.752
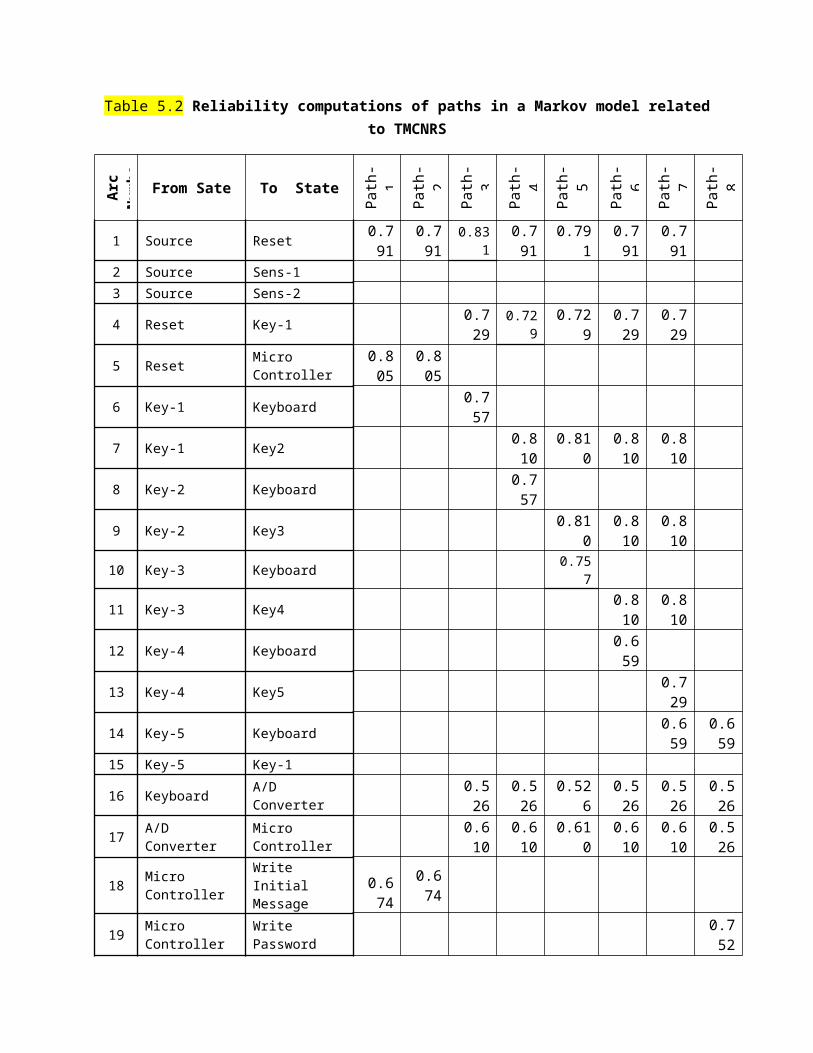
Table 5.2 Reliability computations of paths in a Markov model relatedto TMCNRS
Arc
Numb
e
From Sate To State
Path
-1
Path
-2
Path
-3
Path
-4
Path
-5
Path
-6
Path
-7
Path
-8
1 Source Reset 0.791
0.791
0.831
0.791
0.791
0.791
0.791
2 Source Sens-13 Source Sens-2
4 Reset Key-1 0.729
0.729
0.729
0.729
0.729
5 Reset Micro Controller
0.805
0.805
6 Key-1 Keyboard 0.757
7 Key-1 Key2 0.810
0.810
0.810
0.810
8 Key-2 Keyboard 0.757
9 Key-2 Key3 0.810
0.810
0.810
10 Key-3 Keyboard 0.757
11 Key-3 Key4 0.810
0.810
12 Key-4 Keyboard 0.659
13 Key-4 Key5 0.729
14 Key-5 Keyboard 0.659
0.659
15 Key-5 Key-1
16 Keyboard A/D Converter
0.526
0.526
0.526
0.526
0.526
0.526
17 A/D Converter
Micro Controller
0.610
0.610
0.610
0.610
0.610
0.526
18 Micro Controller
Write Initial Message
0.674
0.674
19 Micro Controller
Write Password
0.752
Mismatch
20 Micro Controller Read Key 0.56
50.565
0.565
21 Micro Controller
Compare password
0.565
22 Micro Controller Read Temp-1
23 Micro Controller Read Temp-2
24Write Initial Message
LCD 0.674
25Write Password Mismatch
LCD
26 Read Key write Key 0.893
0.893
0.893
0.893
0.893
27 Write Key LCD 0.752
0.752
0.752
0.752
0.752
28 Compare Password
Write Password Mismatch
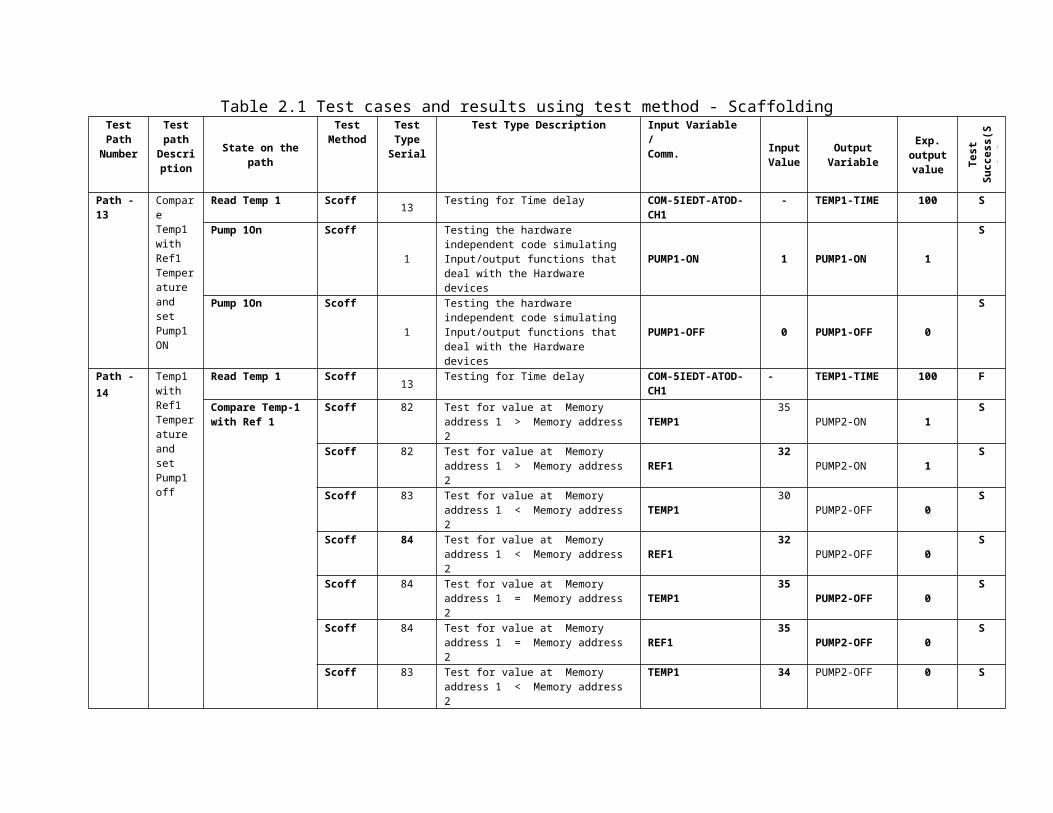
Table 2.1 Test cases and results using test method - ScaffoldingTestPathNumber
Testpath
Description
State on thepath
TestMethod
TestTypeSerial
Test Type Description Input Variable/Comm. Input
ValueOutputVariable
Exp.outputvalue Te
stSu
ccess(
S)
/
Path -13
Compare Temp1 with Ref1 Temperature and set Pump1 ON
Read Temp 1 Scoff 13 Testing for Time delay COM-5IEDT-ATOD-CH1
- TEMP1-TIME 100 S
Pump 1On Scoff
1
Testing the hardware independent code simulating Input/output functions that deal with the Hardware devices
PUMP1-ON 1 PUMP1-ON 1
S
Pump 1On Scoff
1
Testing the hardware independent code simulating Input/output functions that deal with the Hardware devices
PUMP1-OFF 0 PUMP1-OFF 0
S
Path -14
Temp1 with Ref1 Temperature and set Pump1 off
Read Temp 1 Scoff 13 Testing for Time delay COM-5IEDT-ATOD-CH1
- TEMP1-TIME 100 F
Compare Temp-1 with Ref 1
Scoff 82 Test for value at Memory address 1 > Memory address 2
TEMP135
PUMP2-ON 1S
Scoff 82 Test for value at Memory address 1 > Memory address 2
REF132
PUMP2-ON 1S
Scoff 83 Test for value at Memory address 1 < Memory address 2
TEMP130
PUMP2-OFF 0S
Scoff 84 Test for value at Memory address 1 < Memory address 2
REF132
PUMP2-OFF 0S
Scoff 84 Test for value at Memory address 1 = Memory address 2
TEMP135
PUMP2-OFF 0S
Scoff 84 Test for value at Memory address 1 = Memory address 2
REF135
PUMP2-OFF 0S
Scoff 83 Test for value at Memory address 1 < Memory address 2
TEMP1 34 PUMP2-OFF 0 S

Scoff 83 Test for value at Memory address 1 < Memory address 2
REF135
PUMP2-OFF 0S
Scoff 84 Test for value at Memory address 1 = Memory address 2
TEMP135
PUMP2-OFF 0S
Scoff 84 Test for value at Memory address 1 = Memory address 2
REF135
PUMP2-OFF 0S
Scoff 82 Test for value at Memory address 1 > Memory address 2
TEMP136
PUMP2-ON 1S
Scoff 82 Test for value at Memory address 1 > Memory address 2
REF135
PUMP2-ON 1S
Scoff 82 Test for value at Memory address 1 > Memory address 2
TEMP137
PUMP2-ON 1S
Table 3.1 Failure rates of the Hardware Components of TMCNRS
SerialNumber Name of the Hardware
MTBF
as
supp
lied
by
the
Connec
ted
Devi
ce1
MTBF
of
Devi
ce-1
Connec
ted
Devi
ce-2
MTBF
of De
vice
-2
Conn
ecte
dDe
vice
3
MTBF
of
Devi
ce-
3
Conn
ecte
dDe
vice
4
MTBF
of De
vice
-4
Conn
ecte
dDevi
ce-5
MTBF
of De
vice
-5
Rela
tion
type
Failur
e ra
te
1. Temperature – 1Sensor
0.65 - - - - - - - - - - - 0.65
2. Temperature -2Sensor
0.65 - - - - - - - - - - - 0.65
3. OperationalAmplifier-1
0.63 Sense-1 0.65 Power supply
0.64 - - - - - - OR 0.64
4. OperationalAmplifier-2
0.63 Sense-2 0.65 Power supply
0.64 OR 0.63
5. A/D Converter 0.61 OP-1 0.64 OP-2 0.64 Key Board
0.84 - - - - - 0.61
6. µProcessor 0.80 A/D 0.61 Reset
0.77 Powersupply
0.64 OR 0.61
7. LCD 0.65 MP 0.61 - - - - - - - - AND 0.618. Buzzer 0.63 MP 0.61 - - - - - - - - AND 0.619. RS-232C Interface 0.43 MP 0.61 - - - - - - - - AND 0.4310. Relay-1 0.59 MP 0.61 Powe
rsupp
ly
0.64 - - - - - - OR 0.59
11. Relay-2 0.54 MP 0.61 Power
supply
0.64 - - - - - - OR 0.54
12. Pump-1 0.58 Relay-1 0.59 - - - - - - - - OR 0.5813. Pump-2 0.54 Relay-2 0.54 - - - - - - - - OR 0.54
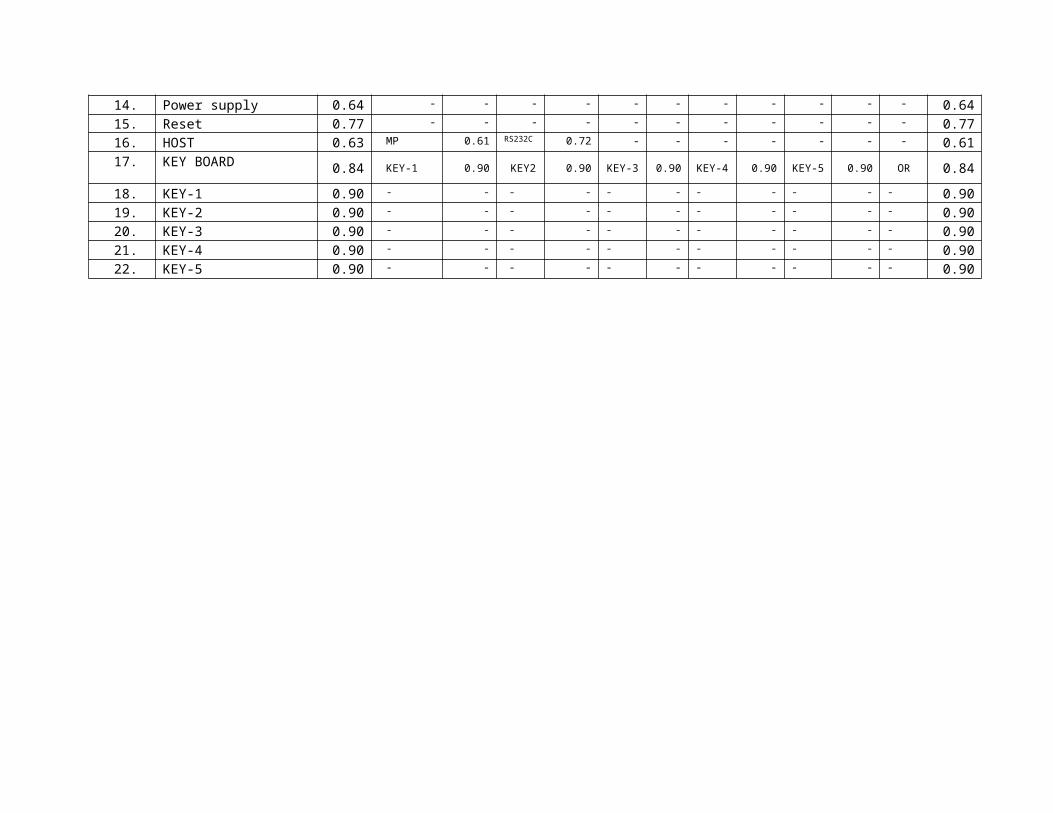
14. Power supply 0.64 - - - - - - - - - - - 0.6415. Reset 0.77 - - - - - - - - - - - 0.7716. HOST 0.63 MP 0.61 RS232C 0.72 - - - - - - - 0.6117. KEY BOARD 0.84 KEY-1 0.90 KEY2 0.90 KEY-3 0.90 KEY-4 0.90 KEY-5 0.90 OR 0.8418. KEY-1 0.90 - - - - - - - - - - - 0.9019. KEY-2 0.90 - - - - - - - - - - - 0.9020. KEY-3 0.90 - - - - - - - - - - - 0.9021. KEY-4 0.90 - - - - - - - - - - - 0.9022. KEY-5 0.90 - - - - - - - - - - - 0.90
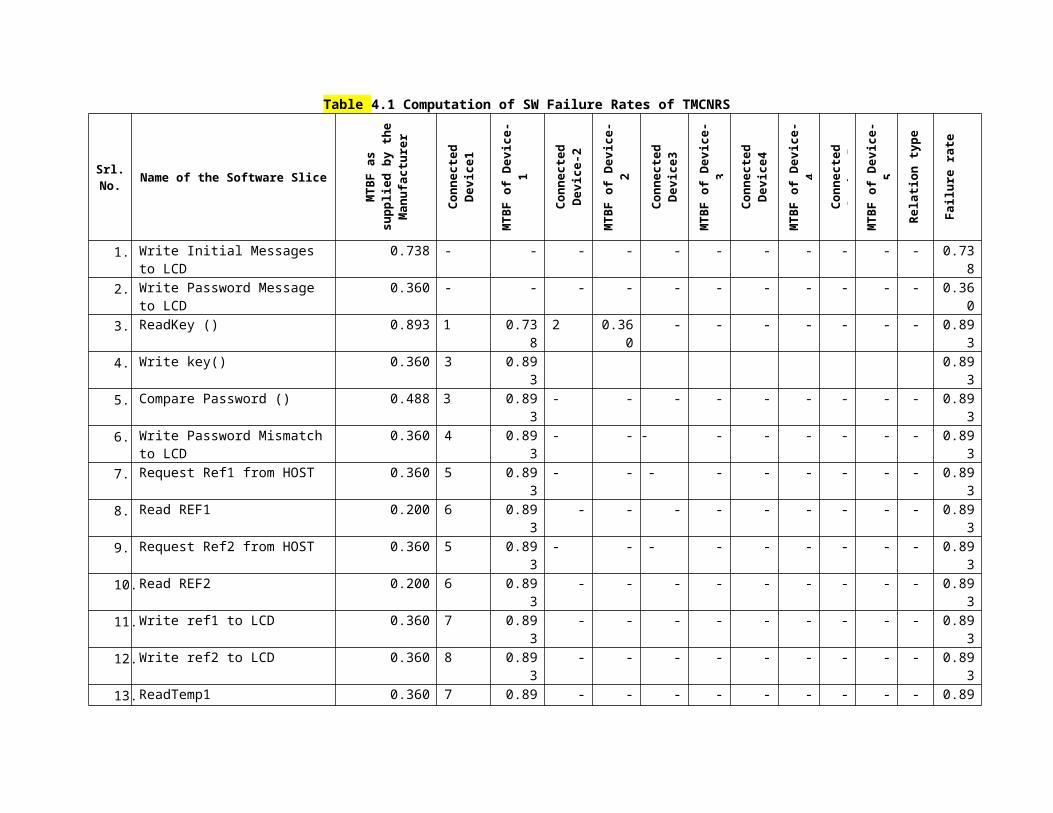
Table 4.1 Computation of SW Failure Rates of TMCNRS
Srl.No. Name of the Software Slice
MTBF as
suppli
ed by
the
Manufact
urer
Conn
ecte
dDe
vice1
MTBF o
f Devi
ce-
1
Conn
ecte
dDevice
-2
MTBF o
f Devi
ce-
2
Conn
ecte
dDe
vice3
MTBF o
f Devi
ce-
3
Conn
ecte
dDe
vice4
MTBF o
f Devi
ce-
4
Conn
ecte
dDevice
-5MT
BF o
f Devi
ce-
5
Relati
on t
ype
Failure
rate
1. Write Initial Messages to LCD
0.738 - - - - - - - - - - - 0.738
2. Write Password Message to LCD
0.360 - - - - - - - - - - - 0.360
3. ReadKey () 0.893 1 0.738
2 0.360
- - - - - - - 0.893
4. Write key() 0.360 3 0.893
0.893
5. Compare Password () 0.488 3 0.893
- - - - - - - - - 0.893
6. Write Password Mismatchto LCD
0.360 4 0.893
- - - - - - - - - 0.893
7. Request Ref1 from HOST 0.360 5 0.893
- - - - - - - - - 0.893
8. Read REF1 0.200 6 0.893
- - - - - - - - - 0.893
9. Request Ref2 from HOST 0.360 5 0.893
- - - - - - - - - 0.893
10.Read REF2 0.200 6 0.893
- - - - - - - - - 0.893
11.Write ref1 to LCD 0.360 7 0.893
- - - - - - - - - 0.893
12.Write ref2 to LCD 0.360 8 0.893
- - - - - - - - - 0.893
13.ReadTemp1 0.360 7 0.89 - - - - - - - - - 0.89
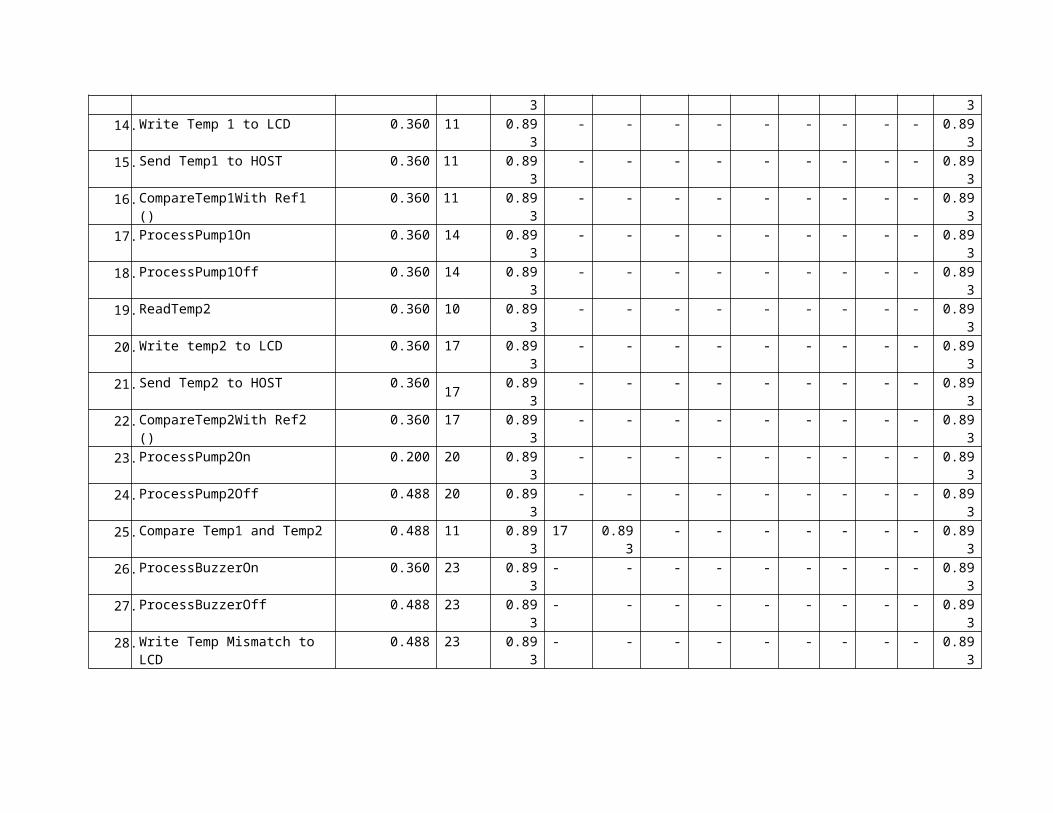
3 314.Write Temp 1 to LCD 0.360 11 0.89
3- - - - - - - - - 0.89
315.Send Temp1 to HOST 0.360 11 0.89
3- - - - - - - - - 0.89
316.CompareTemp1With Ref1
()0.360 11 0.89
3- - - - - - - - - 0.89
317.ProcessPump1On 0.360 14 0.89
3- - - - - - - - - 0.89
318.ProcessPump1Off 0.360 14 0.89
3- - - - - - - - - 0.89
319.ReadTemp2 0.360 10 0.89
3- - - - - - - - - 0.89
320.Write temp2 to LCD 0.360 17 0.89
3- - - - - - - - - 0.89
321.Send Temp2 to HOST 0.360 17 0.89
3- - - - - - - - - 0.89
322.CompareTemp2With Ref2
()0.360 17 0.89
3- - - - - - - - - 0.89
323.ProcessPump2On 0.200 20 0.89
3- - - - - - - - - 0.89
324.ProcessPump2Off 0.488 20 0.89
3- - - - - - - - - 0.89
325.Compare Temp1 and Temp2 0.488 11 0.89
317 0.89
3- - - - - - - 0.89
326.ProcessBuzzerOn 0.360 23 0.89
3- - - - - - - - - 0.89
327.ProcessBuzzerOff 0.488 23 0.89
3- - - - - - - - - 0.89
328.Write Temp Mismatch to
LCD0.488 23 0.89
3- - - - - - - - - 0.89
3
Related Documents