Enhanced Historical Installation Assessment Volunteer Army Ammunition Plant Chattanooga, TN Environmental Research and Mapping Facility Division of Superfund

Enhanced Historical Installation Assessment
Aug 19, 2015
Welcome message from author
This document is posted to help you gain knowledge. Please leave a comment to let me know what you think about it! Share it to your friends and learn new things together.
Transcript

Enhanced Historical Installation Assessment
Volunteer Army Ammunition Plant
Chattanooga, TN
Environmental Research and Mapping Facility Division of Superfund

Overview
Ammunition Plant Background Regulatory/Remediation Needs GIS Solution Benefits from Project
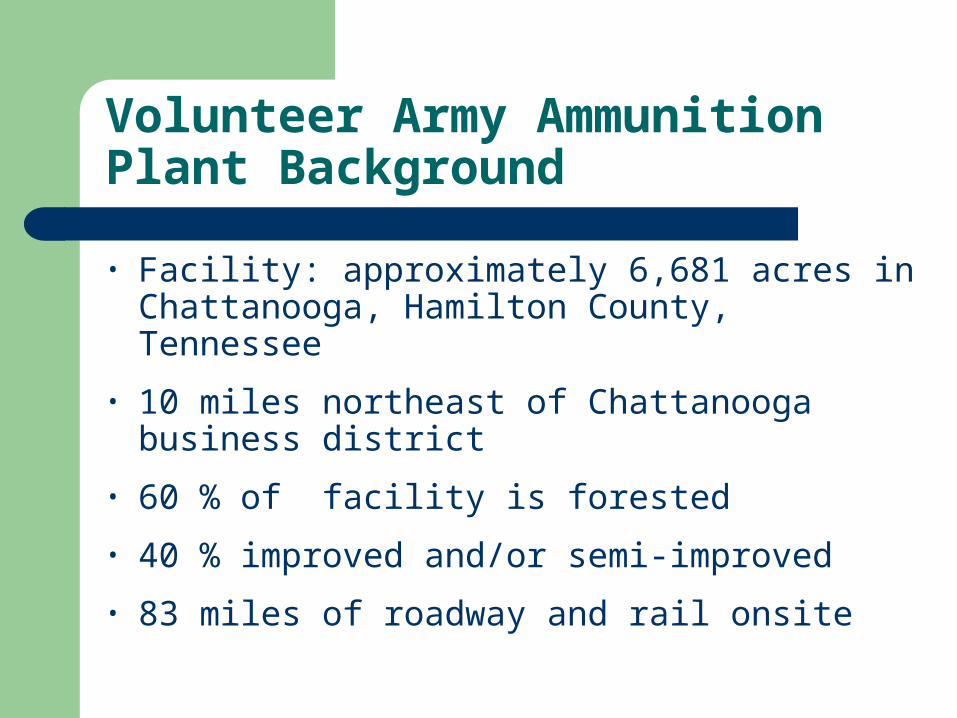
Volunteer Army Ammunition Plant Background
• Facility: approximately 6,681 acres in Chattanooga, Hamilton County, Tennessee
• 10 miles northeast of Chattanooga business district
• 60 % of facility is forested
• 40 % improved and/or semi-improved
• 83 miles of roadway and rail onsite

Location of Volunteer Army Ammunition Plant

2,4,6-trinitrotoluene (TNT)
Toluene a product of fossil fuel refining, was converted to TNT through a nitration process using nitric and sulfuric acid. These acids were produced onsite.
Site view
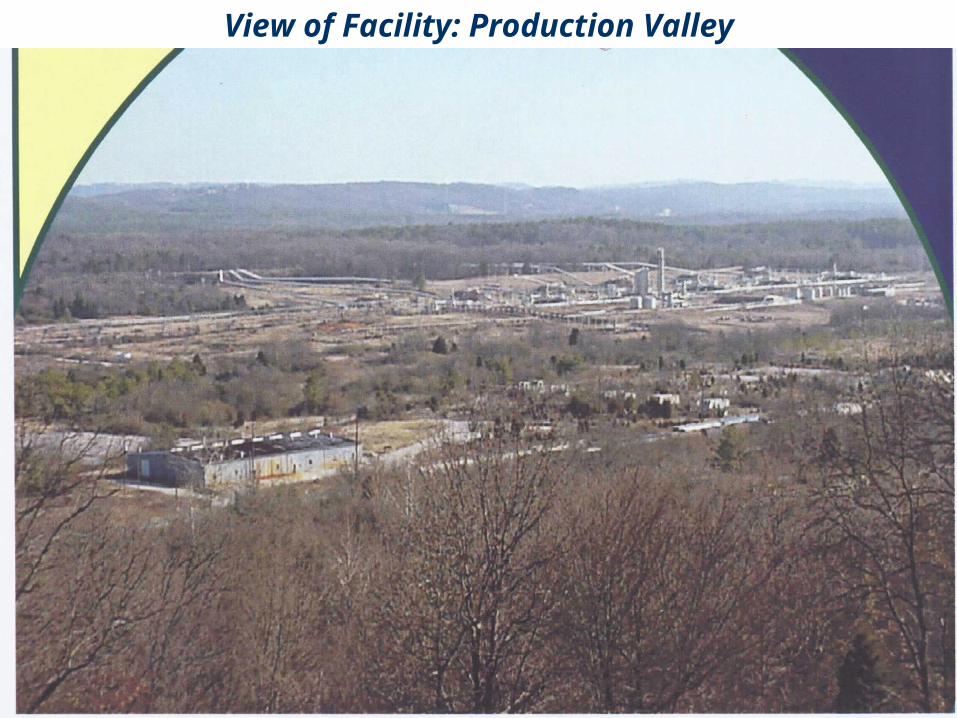
View of Facility: Production Valley

TNT Production Valley
Production Valley

Site History
1942-1943: facility constructed 1942-1945: 800 million lbs. of TNT produced
(WWII) 1953-1957: 283 million lbs. TNT produced
(Korean War) 1965-1977: 1.8 billion lbs of TNT produced
(Vietnam Conflict)

Site History Continued
1977: TNT production discontinued 1962-1982: private industries leased sections
of the plant for ammonium nitrate production Total TNT produced: ~ 3 billion pounds

Environmental Concern
Three major categories of Environmental Concern
1) TNT related pollutants and wastes
2) Acid manufacturing byproducts and wastes
3) Miscellaneous wastes chemicals generated by plant operation
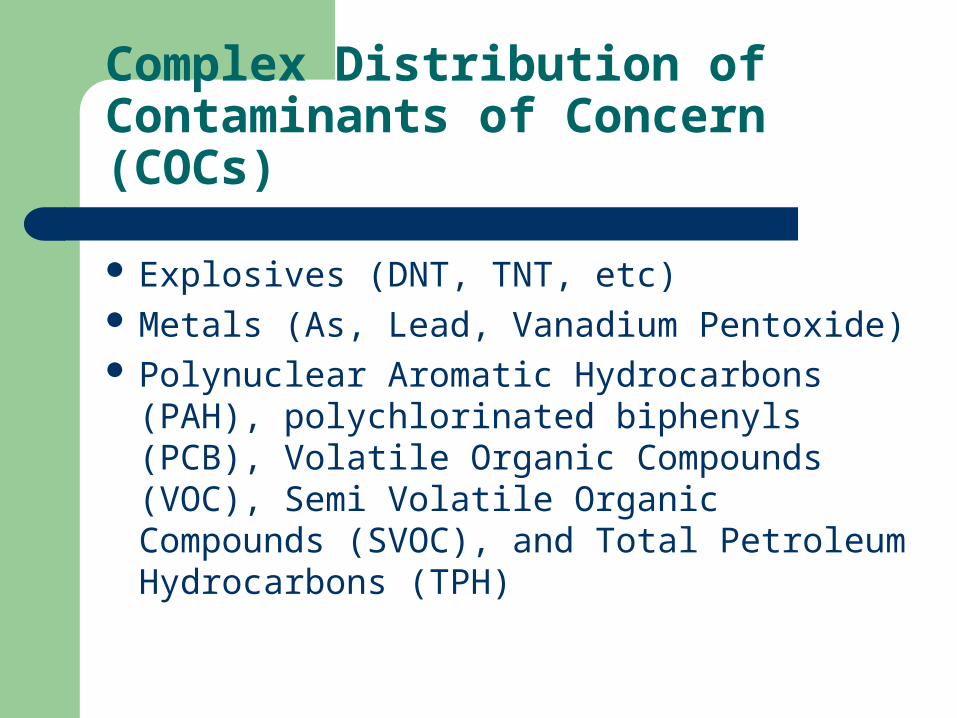
Complex Distribution of Contaminants of Concern (COCs)
Explosives (DNT, TNT, etc) Metals (As, Lead, Vanadium Pentoxide) Polynuclear Aromatic Hydrocarbons (PAH),
polychlorinated biphenyls (PCB), Volatile Organic Compounds (VOC), Semi Volatile Organic Compounds (SVOC), and Total Petroleum Hydrocarbons (TPH)
Contamination Media
Soil Sediment Groundwater
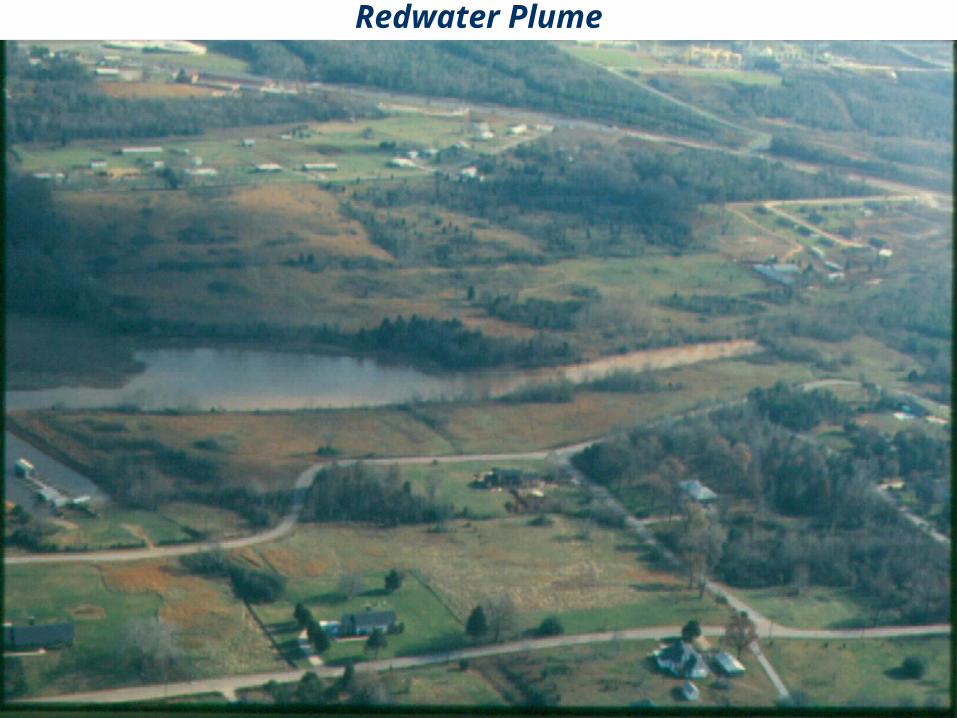
Redwater Plume

Environmental Areas of Concern (AOCs)
• 1 TNT Production Area • 5 Landfill/Disposal Areas • 3 Acid Areas and 3 Storage Areas• 1 Spill Site and 1 Burn Area• 1 Pistol Range and 2 Facility Areas

Regulatory History
1985 Site promulgated as Superfund site through the Tennessee Department of Environment and Conservation (TDEC)
2001 the United States Environmental Protection Agency (EPA) issues Resource Conservation and Recovery Act (RCRA) order for facility.

Multi- Agency Management
2000, Tier 1 Team established to oversee investigations, cleanups, and property transfers
Reuse or Restoration of property “The Bottom Line”
Team composed of federal, state, local, and private agencies and organizations: >10 representatives
Tier I Team Needs
Coordination of information and idea exchange between agencies and organizations
Unified site management system An inventory of existing data A means for identifying AOCs

Team Limitations due to lack of Technology
Hardware and software discrepancies between team members
Certain materials not available to all team members due to physical limitations:
Only 1 available copy of a 1984 report produced by the Environmental Photographic Interpretation Center (EPIC) of EPA

Process Management: Pre-GIS Days
The GIS Solution
March of 2002 TDEC begins effort to create standardized digital environmental management system
All Tier I team partners would gain access to this system
Project Challenges
System must be simple enough for non-GIS professionals to use
However data must be available for complex analysis
Hardware for digitization and GIS product deliverables scattered among 3 entities
(limited local technology budgets)
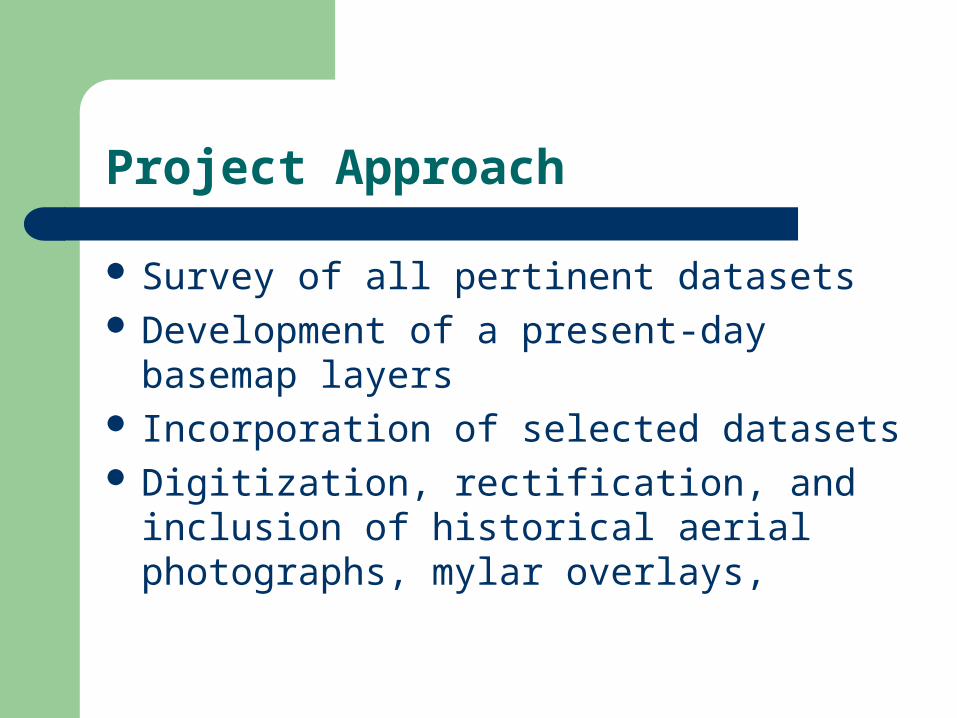
Project Approach
Survey of all pertinent datasets Development of a present-day basemap layers Incorporation of selected datasets Digitization, rectification, and inclusion of
historical aerial photographs, mylar overlays,
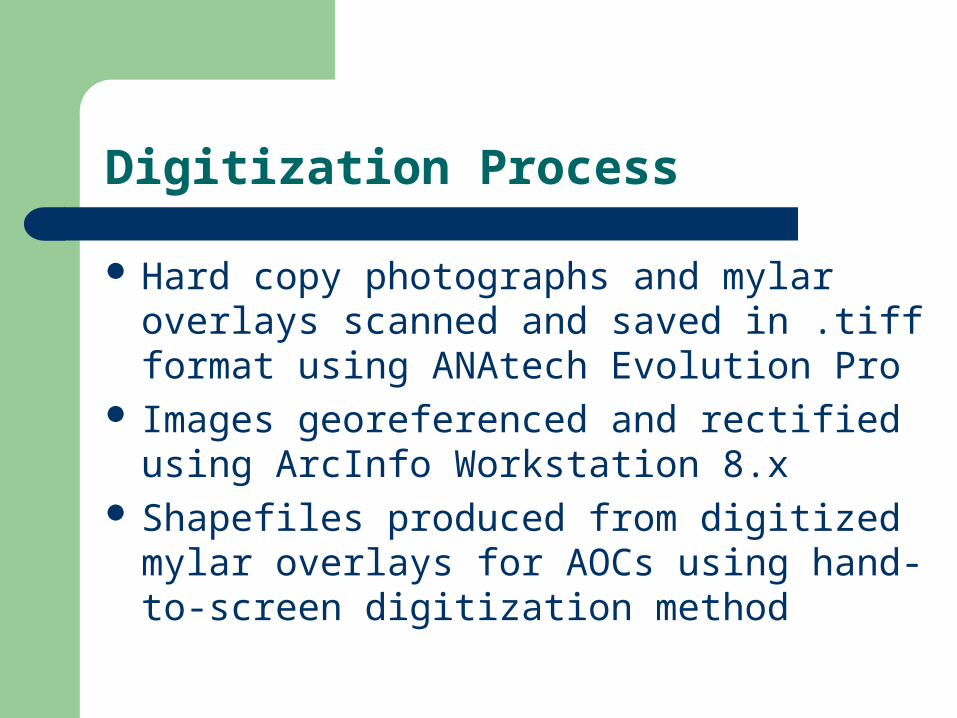
Digitization Process
Hard copy photographs and mylar overlays scanned and saved in .tiff format using ANAtech Evolution Pro
Images georeferenced and rectified using ArcInfo Workstation 8.x
Shapefiles produced from digitized mylar overlays for AOCs using hand-to-screen digitization method
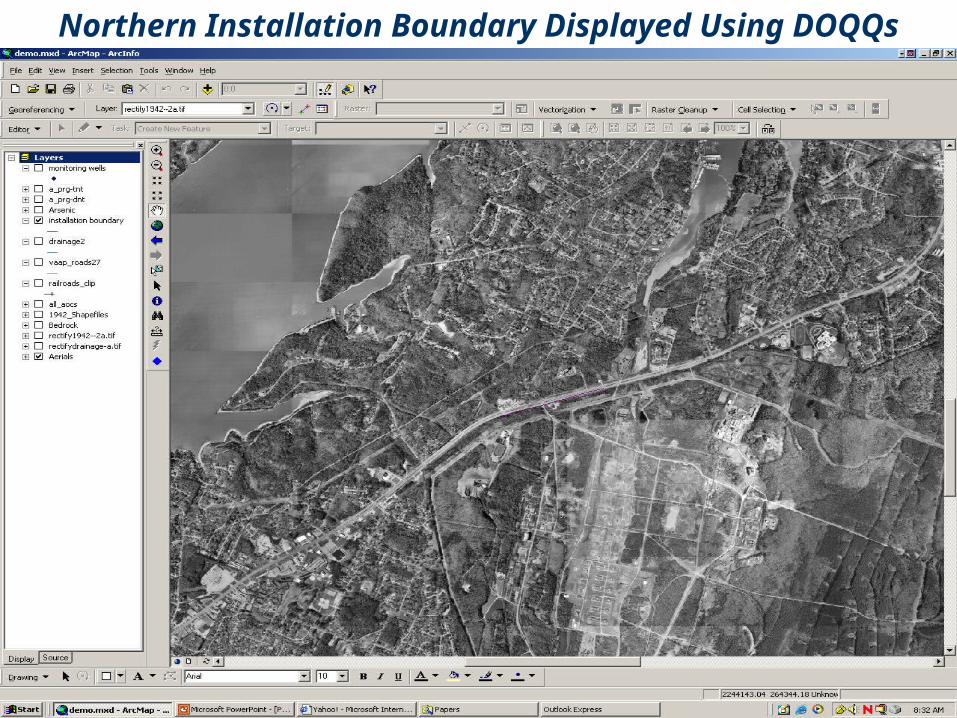
Northern boundary
Northern Installation Boundary Displayed Using DOQQs

1935 Aerial Photography Georeferenced and Rectified
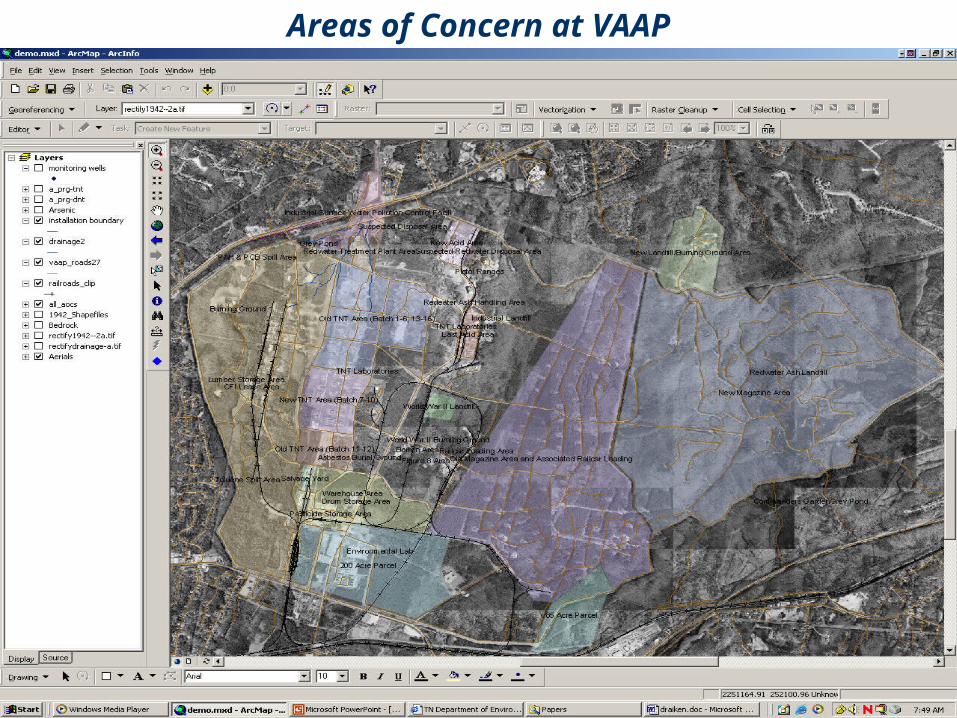
Areas of Concern at VAAP

Digitized 1:24,000 Geologic Map Incorporated

Groundwater Monitoring Well Data Analysis

Deliverables
An interactive autorun application used to install, launch, and run projects
Projects saved in ArcExplorer 2 disks included: applications, shapefiles,
existing assessment reports, links, and the entire digitized EPIC study

Example of Autorun Application

Project Benefits
Enhanced identification and assessment of areas of concern
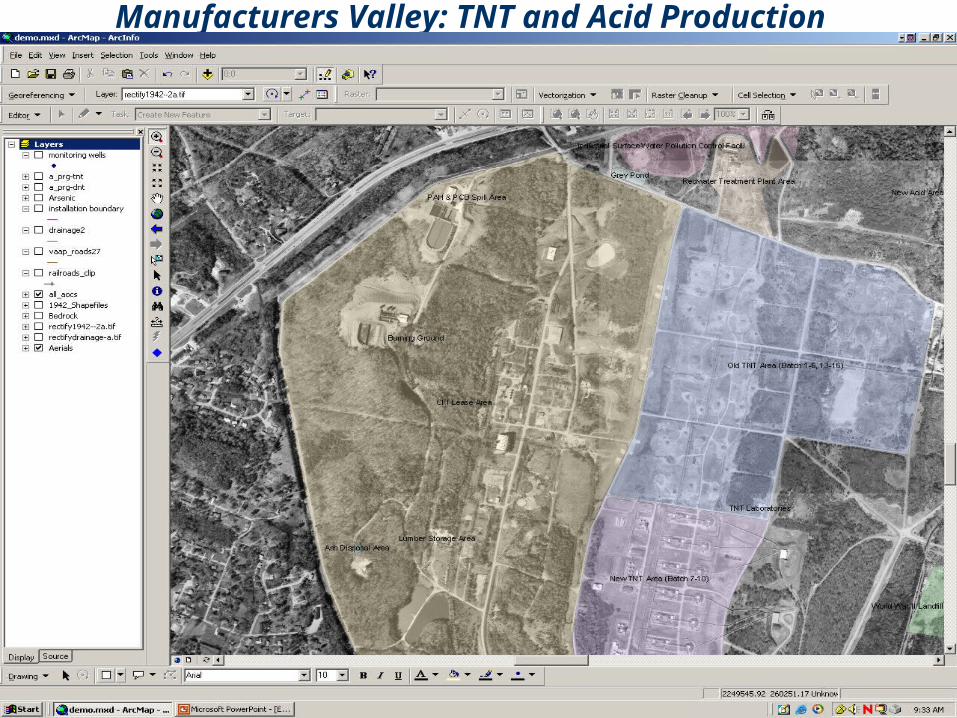
Manufacturers Valley: TNT and Acid Production

North Acid Plant Area & 1942 mylar shapefiles

1942 Aerial Photography Added

Impoundment Identified

Impoundment Located Using 1942 Photograph
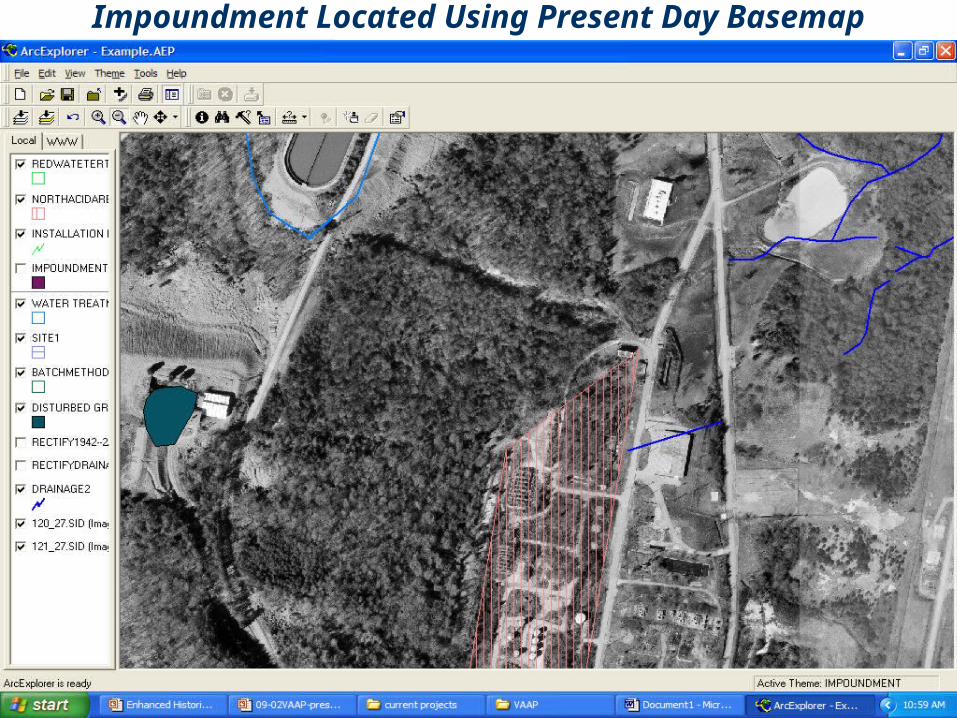
Impoundment Located Using Present Day Basemap

Impoundment Located

GIS Improves Precision of Remedial Investigations
Benefits to Installation Restoration Program (IRP)
Relationship fostered between agencies by a dynamic data exchange
Distribution of standardized data Powerful tool for inventory and assessment of
AOCs Enormous savings
Facilitation of Property Transfer
Reuse of property “The Bottom Line” GIS used to locate “clean” areas for transfer
Example: scanned 8 ½” x 11” fax digitized, rectified, and used with historical photography to ID underground storage tanks (USTs) on day of property transfer to county

Digitized Fax Showing Facility Infrastructure

Location of USTs Prior to Transfer

Location of USTs Prior to Transfer

Savings Analysis
An estimated 10 years of regulatory process saved by identification of “hot spots” using aerial photography
Savings for this regulatory reduction estimated at $300,000
Market-based cost for GIS deliverables: $50,000
Actual costs to TDEC: ~ $4,000

Next for VAAP
2002 Transfer of 285 acres Formation of “Enterprise South” a City and
County redevelopment initiative
In Conclusion
Using Historical Aerial Photography in GIS format can enhance and expedite the ID and assessment of AOCs
This data can be used as a framework for a unified site management system
Data distribution extended beyond the “GIS Specialist” can expedite site management
Related Documents