Crack closure under high load-ratio conditions for Inconel-718 near threshold behavior Y. Yamada, J.C. Newman Jr. * Department of Aerospace Engineering, Mississippi State University, Mississippi State, MS 39762, United States article info Article history: Received 2 July 2008 Received in revised form 26 September 2008 Accepted 27 September 2008 Available online 17 October 2008 Keywords: Fatigue-crack growth Crack closure K max effect Threshold Compression precracking Load ratio abstract Fatigue-crack-growth (FCG) rate tests were conducted on compact specimens made of an Inconel-718 alloy to study the behavior over a wide range in load ratios (0.1 6 R 6 0.95) and a constant K max test condition. Previous research had indicated that high R (>0.7) and constant K max test conditions near threshold conditions were suspected to be crack-clo- sure-free and that any differences were attributed to K max effects. During a test at a load ratio of 0.7, strain gages were placed near and ahead of the crack tip to measure crack-open- ing loads from local load-strain records during crack growth. In addition, a back-face strain (BFS) gage was also used to monitor crack lengths and to measure crack-opening loads from remote load-strain records during the same test. The BFS gage indicated that the crack was fully open (no crack closure), but the local load-strain records indicated significant amounts of crack closure. The crack-opening loads were increasing as the crack approached threshold conditions at R = 0.7. Based on these measurements, crack-closure-free FCG data (DK eff against rate) were calculated. The DK eff -rate data fell at lower DK values and higher rates than the constant K max test results. In addition, constant R tests at extremely high R (0.9 and 0.95) were also performed and compared with the constant K max test results. The con- stant R test results at 0.95 agreed well with the DK eff -rate data, while the R = 0.9 data agreed well with constant K max test data in the low-rate regime. These results imply that the R = 0.7 test had a significant amount of crack closure as the threshold was approached, while the R = 0.9 and K max test results may have had a small amount of crack closure, and may not be closure free, as originally suspected. Under the high load-ratio conditions (R P 0.7), it is suspected that the crack surfaces are developing debris-induced crack closure from con- tacting surfaces, which corresponded to darkening of the fatigue surfaces in the near- threshold regime. Tests at low R also showed darkening of the fatigue surfaces only in the near-threshold regime. These results suggest that the DK eff against rate relation may be nearly a unique function over a wide range of R in the threshold regime. Ó 2008 Elsevier Ltd. All rights reserved. 1. Introduction Cracks in high-cycle fatigue (HCF) components spend a large portion of their fatigue life near threshold conditions. In or- der to characterize the evolution of damage and crack propagation during these conditions, fatigue-crack-growth (FCG) rate data at threshold and near-threshold conditions are essential in predicting service life and in determining the proper inspec- tion intervals. Based on linear elastic fracture mechanics, FCG rate (dc/dN) data are quantified in terms of the stress-intensity factor range, DK, at a given load ratio (R = minimum to maximum load ratio) [1]. The relation between DK and dc/dN was shown to be nearly linear on a log(DK)log(dc/dN) scale. The relationship becomes nonlinear when the crack approaches 0013-7944/$ - see front matter Ó 2008 Elsevier Ltd. All rights reserved. doi:10.1016/j.engfracmech.2008.09.009 * Corresponding author. Tel.: +1 662 325 1521; fax: +1 662 325 7730. E-mail address: [email protected] (J.C. Newman). Engineering Fracture Mechanics 76 (2009) 209–220 Contents lists available at ScienceDirect Engineering Fracture Mechanics journal homepage: www.elsevier.com/locate/engfracmech

Welcome message from author
This document is posted to help you gain knowledge. Please leave a comment to let me know what you think about it! Share it to your friends and learn new things together.
Transcript

Engineering Fracture Mechanics 76 (2009) 209–220
Contents lists available at ScienceDirect
Engineering Fracture Mechanics
journal homepage: www.elsevier .com/locate /engfracmech
Crack closure under high load-ratio conditions for Inconel-718 nearthreshold behavior
Y. Yamada, J.C. Newman Jr. *
Department of Aerospace Engineering, Mississippi State University, Mississippi State, MS 39762, United States
a r t i c l e i n f o
Article history:Received 2 July 2008Received in revised form 26 September2008Accepted 27 September 2008Available online 17 October 2008
Keywords:Fatigue-crack growthCrack closureKmax effectThresholdCompression precrackingLoad ratio
0013-7944/$ - see front matter � 2008 Elsevier Ltddoi:10.1016/j.engfracmech.2008.09.009
* Corresponding author. Tel.: +1 662 325 1521; faE-mail address: [email protected] (J
a b s t r a c t
Fatigue-crack-growth (FCG) rate tests were conducted on compact specimens made of anInconel-718 alloy to study the behavior over a wide range in load ratios (0.1 6 R 6 0.95)and a constant Kmax test condition. Previous research had indicated that high R (>0.7) andconstant Kmax test conditions near threshold conditions were suspected to be crack-clo-sure-free and that any differences were attributed to Kmax effects. During a test at a loadratio of 0.7, strain gages were placed near and ahead of the crack tip to measure crack-open-ing loads from local load-strain records during crack growth. In addition, a back-face strain(BFS) gage was also used to monitor crack lengths and to measure crack-opening loads fromremote load-strain records during the same test. The BFS gage indicated that the crack wasfully open (no crack closure), but the local load-strain records indicated significant amountsof crack closure. The crack-opening loads were increasing as the crack approached thresholdconditions at R = 0.7. Based on these measurements, crack-closure-free FCG data (DKeff
against rate) were calculated. The DKeff-rate data fell at lower DK values and higher ratesthan the constant Kmax test results. In addition, constant R tests at extremely high R (0.9and 0.95) were also performed and compared with the constant Kmax test results. The con-stant R test results at 0.95 agreed well with the DKeff-rate data, while the R = 0.9 data agreedwell with constant Kmax test data in the low-rate regime. These results imply that the R = 0.7test had a significant amount of crack closure as the threshold was approached, while theR = 0.9 and Kmax test results may have had a small amount of crack closure, and may notbe closure free, as originally suspected. Under the high load-ratio conditions (R P 0.7), itis suspected that the crack surfaces are developing debris-induced crack closure from con-tacting surfaces, which corresponded to darkening of the fatigue surfaces in the near-threshold regime. Tests at low R also showed darkening of the fatigue surfaces only in thenear-threshold regime. These results suggest that the DKeff against rate relation may benearly a unique function over a wide range of R in the threshold regime.
� 2008 Elsevier Ltd. All rights reserved.
1. Introduction
Cracks in high-cycle fatigue (HCF) components spend a large portion of their fatigue life near threshold conditions. In or-der to characterize the evolution of damage and crack propagation during these conditions, fatigue-crack-growth (FCG) ratedata at threshold and near-threshold conditions are essential in predicting service life and in determining the proper inspec-tion intervals. Based on linear elastic fracture mechanics, FCG rate (dc/dN) data are quantified in terms of the stress-intensityfactor range, DK, at a given load ratio (R = minimum to maximum load ratio) [1]. The relation between DK and dc/dN wasshown to be nearly linear on a log(DK)�log(dc/dN) scale. The relationship becomes nonlinear when the crack approaches
. All rights reserved.
x: +1 662 325 7730..C. Newman).

Nomenclature
B thickness, mmc crack length, mmcf crack length at failure, mmdc/dN crack growth rate, m/cycleE modulus of elasticity, MPaKcp compressive (minimum) stress-intensity factor during pre-cracking, MPa m1/2
KF elastic–plastic fracture toughness, MPa m1/2
KIe elastic fracture toughness or maximum stress-intensity factor at failure, MPa m1/2
Kmax maximum stress-intensity factor, MPa m1/2
m fracture toughness parameterPmax maximum applied load, NPmin minimum applied load, NPo crack opening load, NRload (Pmin/Pmax) ratioU crack-opening function, (1 – Po/Pmax)/(1 – R)W specimen width, mmDK stress-intensity factor range, MPa m1/2
DKc critical stress-intensity factor range at failure, MPa m1/2
DKeff effective stress-intensity factor range (U DK), MPa m1/2
rys yield stress (0.2% offset), MParu ultimate tensile strength, MPaBFS back-face strain gageCPCA compression pre-cracking and constant-amplitude test methodCPLR compression pre-cracking and load-reduction test methodC(T) compact specimenDICC debris-induced crack closureFCG fatigue-crack growthOPn crack-opening load (Po/Pmax) ratio at n% compliance offsetPICC plasticity-induced crack closureRICC roughness-induced crack closure
210 Y. Yamada, J.C. Newman Jr. / Engineering Fracture Mechanics 76 (2009) 209–220
fracture [2] or when the FCG rate is very slow [3]. One of the significant mechanisms that influences crack-growth behavior iscrack closure, which is partly caused by residual plastic deformations remaining in the wake of an advancing crack [4,5],roughness of the crack surfaces [6], and debris created along the crack surfaces [7]. The discovery of the crack-closure mech-anism and development of the crack-closure concept led to a better understanding of FCG behavior, like the load-ratio (R)effect on crack growth. The crack-closure concept has been used to correlate crack-growth-rate data under constant-ampli-tude loading over a wide range in rates from threshold to fracture over a wide range in load ratios and load levels [8]. Dif-ficulties have occurred in the threshold and near-threshold regimes using only plasticity-induced crack-closure modeling[9]. The load range where the crack tip is fully open is considered to be the effective range controlling crack growth. To cal-culate the effective stress-intensity factor range, DKeff, the crack-opening load, Po, was initially determined from load-dis-placement records using a local displacement gage placed near the crack tip [4,5]. For convenience, however, more recentmeasurement methods have used either remote crack-mouth-opening-displacement (CMOD) gages or back-face strain gages(BFS). These remote measurement methods have indicated that cracks are fully open under high load-ratio conditions. Thus,high load ratio (R P 0.7) data have been considered to be closure free, even in the threshold regime, and R-ratio effects wereattributed to Kmax effects. In the low rate regime, at and near threshold conditions, roughness-induced crack closure (RICC)[6,10] and debris-induced crack closure (DICC) [7,11], have been considered more relevant, but plasticity-induced crack clo-sure (PICC) [8,9] is still relevant under low load-ratio conditions.
The crack-closure concept has not yet been able to correlate data in the threshold regime, either from load-reduction tests atconstant R or constant Kmax tests. Variations in the threshold and near-threshold behavior with load ratio cannot be explainedfrom PICC alone [9], but RICC and DICC mechanisms may be needed to correlate these data. The constant Kmax test procedure[12] also produces what has been referred to as the ‘‘Kmax effect”, in that, lower thresholds are obtained using higher Kmax values[13–15]. Compared with the constant R test method, constant Kmax tests gradually decrease Pmax and increase Pmin to obtain areduction in DK as the crack grows. One advantage of this test method is that it is commonly considered to produce crack-clo-sure-free data (R P 0.7). But constant Kmax testing also produces data at variable load ratios (R) and fatigue-crack-growththresholds at high load ratios (>0.8). For aluminum alloys and larger Kmax values, more dimpling and tunneling on the fatiguesurfaces were observed [14], as the threshold was approached. This behavior indicated a change in the damage mechanismfrom classical fatigue-crack growth to more of a tensile fracture mode due to the Kmax levels approaching the elastic fracturetoughness. But extensive literature data reviewed by Vasudevan et al [16] and test data by Marci [17] on a wide variety of

Y. Yamada, J.C. Newman / Engineering Fracture Mechanics 76 (2009) 209–220 211
materials do not show the so-called Kmax effect. These mixed results suggest that something is different in either the test pro-cedures or test specimens that exhibit different behavior in the near-threshold regime.
Most of the test data reviewed by Vasudevan et al. [16] was determined by European and Japanese authors from 1979 to1984 on unspecified crack configurations. These data may have been determined from different test methods and/or othercrack configurations than those currently used in ASTM E647-05 (method approved about 1983) [18]. The so-called Kmax ef-fects have been observed on a number of materials using the constant-Kmax test procedures on C(T) and ESE(T) specimens, asspecified in E647-05, where larger Kmax values have produced lower thresholds [13–15]. But what has caused this behavior?Was Kmax close to the elastic fracture toughness, which would induce a static fracture mode [14] on cyclic crack growth? Isthere a Kmax effect for values much lower than the elastic fracture toughness, as currently used in the two-parameter, DKm
Kmaxn, curve-fitting equations [1,19]? Could crack-closure behavior at high-R (>0.7) explain the variations in the DK-rate
curves for different Kmax values? This paper will address these issues by conducting local and remote measurements ofcrack-closure behavior in the threshold regime.
To generate constant load-ratio data in the threshold and near-threshold regimes, ASTM E647-05 [18] proposes the load-reduction test method. This method is basically a K-reduction scheme to maintain a constant load ratio. But the load-reduc-tion test method has been shown to produce higher thresholds and lower rates in the near-threshold regime than steady-state constant-amplitude data on a wide variety of materials [20–22]. In addition, the load-reduction test method producesfanning with the load ratio in the threshold regime for some materials. It has been shown that the test method induces aload-history effect, which may be caused by remote closure [9,23]. Thus, the load-reduction test method does not, in general,produce constant-amplitude FCG data, as was originally intended in ASTM E647-05. In order to produce steady-state con-stant-amplitude data, compression–compression pre-cracking methods have been proposed [24–27]. A pre-notched speci-men is cycled under compression–compression loading to produce an initial crack, which naturally stops growing (athreshold is reached under compression–compression loading). (Standard notches, as specified in E647-05, are satisfactorywith either a 45� or 60� included notch angle with a notch-root radius of about 0.1-mm. Notch surfaces do not contact duringcompressive loading, as specified herein.) Then the specimen is subjected to the desired constant-amplitude loading. If thecrack has not grown after a million or so cycles, then the load is slightly increased (few percent). This process is repeateduntil the crack has begun to grow. Then the constant-amplitude loading is held constant and FCG rate data is generatedat the desired stress ratio. The crack must be grown a small amount (about three compressive plastic-zone sizes) to eliminatethe crack-starter notch and tensile residual-stress effects, and to stabilize the crack-closure behavior [21,27]. This method iscalled compression pre-cracking constant-amplitude (CPCA) loading threshold testing. Another method is to grow the crackat a low DK value, after compression pre-cracking, and then use the standard load-reduction test method. Compression pre-cracking allows the initial DK value or rate, before load reduction, to be much lower than would be needed or allowed in theASTM standard load-reduction test method. This method is called the compression pre-cracking load-reduction (CPLR)threshold test method. Both the CPCA and CPLR methods are used herein.
In this paper, FCG tests were conducted on compact specimens made of an Inconel-718 alloy to study the behavior overa wide range in load ratios (0.1 6 R 6 0.95) and a constant Kmax test condition from threshold to near fracture conditions.During a test at a load ratio of 0.7, strain gages (about 3-mm gage length) were placed near and ahead of the crack tip tomeasure crack-opening loads from local load-strain records during crack growth, as shown in Fig. 1. The placement of thelocal strain gages was about one-half of a thickness away from the crack tip, so that an average value of crack-opening loadcould be measured. In addition, a BFS gage (3-mm) was also used to monitor crack lengths and to measure remote load-strain records during the same test. Based on the load-strain measurements (BFS and local), crack-opening loads weredetermined and crack-closure-free FCG data, DKeff, were calculated. In addition, constant R test at extremely high R (0.9and 0.95) conditions were also performed and compared with the constant Kmax test results and the DKeff against rate
Fig. 1. Compact specimen with local (crack tip) and remote (BFS) strain gages beveled holes.

212 Y. Yamada, J.C. Newman Jr. / Engineering Fracture Mechanics 76 (2009) 209–220
relation. For low R (0.1 and 0.4), only the BFS gage was used to determine crack-opening loads using the 1% compliance-offset method [18]. Crack surface appearances in the threshold regime are discussed in relation to the measured crack-opening behavior.
2. Material and test procedures
Compact, C(T), specimens (B = 9.5 mm) were used to generate FCG rate data on Inconel-718 alloy. The specimens wereobtained from Boeing-Rockwell (Ken Garr) and he had tested some of the specimens under the ASTM load-reduction methodand constant-amplitude loading. He had previously tested a similar material [28], which had shown a width effect on thresh-old behavior using C(T) specimens and the load-reduction method. The chemical composition was: Al 0.53, C 0.03, Cb + Ta5.03, Co 0.84, Cr 18.23, Mo 3.01, Ti 1.02, Ni 53.01% and balance Fe. The yield stress and the ultimate tensile strength were1060 and 1350 MPa, respectively, with an elongation of 27.9%. Specimens had a width (W) of 76.2 mm and an initial notchlength (measured from the pin-hole centerline) of 26 mm, as shown in Fig. 1. In addition, the edges of the pin holes in thespecimens were beveled to avoid or minimize undesired out-of-plane bending moments (pins forced to contact near mid-thickness of specimen), see Fig. 1b. The load sequences applied to the C(T) specimens are shown in Fig. 2. All specimens werepre-cracked under constant-amplitude compression–compression loading (R � 20–24) to initiate a crack at the machinedcrack-starter V-notch with a 60�-included angle (|Kcp|/E � 0.00032 m1/2). FCG rate tests were then conducted using eitherconstant Kmax testing (shed rate of �0.4 mm�1), constant-amplitude (CPCA) loading, or load reduction (CPLR) at constantR after a small amount of crack extension under constant-amplitude (CPCA) loading. Load-reduction tests were conductedwhen the FCG rate was 8E-10 to 2E-9 m/cycle, which is nearly an order of magnitude lower than the maximum rate allowedin the ASTM E647-05 standard [18]. FCG tests were performed under computer control on servo hydraulic testing machines
Fig. 2. Load sequences for threshold and constant-amplitude testing.
Y. Yamada, J.C. Newman / Engineering Fracture Mechanics 76 (2009) 209–220 213
(25 kN capacity) in laboratory air at room temperature and humidity (30–50% RH). The loads were applied in sinusoidalwaveform at 18 Hz in the low-rate regime and about 3 Hz in the high-rate regime. Crack lengths were monitored by usinga BFS gage and occasionally calibrated with measurements made from a traveling optical microscope.
To measure load-strain records near the crack tip, strain gages were mounted close to the crack path for the specimentested at a load ratio of 0.7 only. The locations of the strain gages were chosen to be slightly off the anticipated crack pathby about the crack-starter notch height (�2 mm) and about 5 mm away from the crack tip after compression–compressionpre-cracking (Fig. 1). A number of strain gages were mounted along the anticipated crack path to record load-strain re-cords as the crack approached these gages. The optimum signals were obtained when the crack tip was about 2–3 mmaway from the strain gage during threshold testing. Approximately 20 load-strain records were recorded when the targetFCG rates were achieved. During measurements, the frequency of cyclic loadings was reduced to 0.5 Hz to minimize exter-nal noise.
3. Experimental results
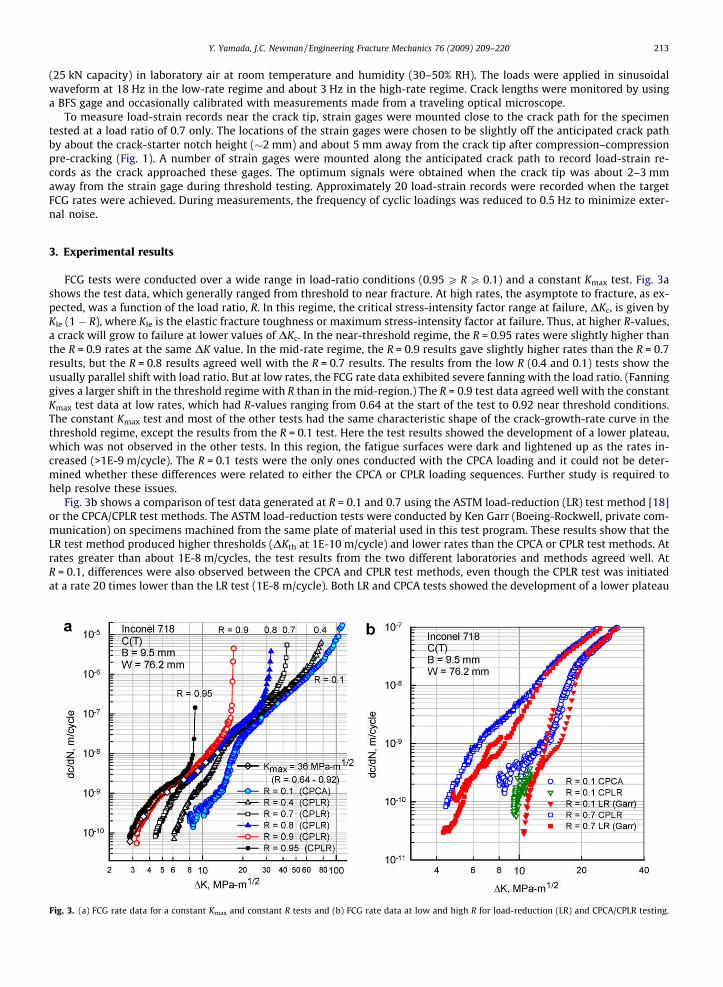
FCG tests were conducted over a wide range in load-ratio conditions (0.95 P R P 0.1) and a constant Kmax test. Fig. 3ashows the test data, which generally ranged from threshold to near fracture. At high rates, the asymptote to fracture, as ex-pected, was a function of the load ratio, R. In this regime, the critical stress-intensity factor range at failure, DKc, is given byKIe (1 � R), where KIe is the elastic fracture toughness or maximum stress-intensity factor at failure. Thus, at higher R-values,a crack will grow to failure at lower values of DKc. In the near-threshold regime, the R = 0.95 rates were slightly higher thanthe R = 0.9 rates at the same DK value. In the mid-rate regime, the R = 0.9 results gave slightly higher rates than the R = 0.7results, but the R = 0.8 results agreed well with the R = 0.7 results. The results from the low R (0.4 and 0.1) tests show theusually parallel shift with load ratio. But at low rates, the FCG rate data exhibited severe fanning with the load ratio. (Fanninggives a larger shift in the threshold regime with R than in the mid-region.) The R = 0.9 test data agreed well with the constantKmax test data at low rates, which had R-values ranging from 0.64 at the start of the test to 0.92 near threshold conditions.The constant Kmax test and most of the other tests had the same characteristic shape of the crack-growth-rate curve in thethreshold regime, except the results from the R = 0.1 test. Here the test results showed the development of a lower plateau,which was not observed in the other tests. In this region, the fatigue surfaces were dark and lightened up as the rates in-creased (>1E-9 m/cycle). The R = 0.1 tests were the only ones conducted with the CPCA loading and it could not be deter-mined whether these differences were related to either the CPCA or CPLR loading sequences. Further study is required tohelp resolve these issues.
Fig. 3b shows a comparison of test data generated at R = 0.1 and 0.7 using the ASTM load-reduction (LR) test method [18]or the CPCA/CPLR test methods. The ASTM load-reduction tests were conducted by Ken Garr (Boeing-Rockwell, private com-munication) on specimens machined from the same plate of material used in this test program. These results show that theLR test method produced higher thresholds (DKth at 1E-10 m/cycle) and lower rates than the CPCA or CPLR test methods. Atrates greater than about 1E-8 m/cycles, the test results from the two different laboratories and methods agreed well. AtR = 0.1, differences were also observed between the CPCA and CPLR test methods, even though the CPLR test was initiatedat a rate 20 times lower than the LR test (1E-8 m/cycle). Both LR and CPCA tests showed the development of a lower plateau
Fig. 3. (a) FCG rate data for a constant Kmax and constant R tests and (b) FCG rate data at low and high R for load-reduction (LR) and CPCA/CPLR testing.

214 Y. Yamada, J.C. Newman Jr. / Engineering Fracture Mechanics 76 (2009) 209–220
below a rate less than about 1E-9 m/cycle. The plateau region also corresponded to a darkening of the fatigue surfaces, whichmay indicate the accumulation of fretting debris. At higher rates, the fatigue surfaces did not show the dark regions.
Because high R and constant Kmax tests were conducted, the ratio of Kmax to the elastic fracture toughness (KIe) was ofconcern, since previous research [14] had shown that lower thresholds were obtained as the Kmax values approach the frac-ture toughness. The series of C(T) specimens that were cycled to failure at various load ratios was used to determine the frac-ture toughness. Here, the critical stress-intensity factor range, asymptote to fracture, DKc was used to determine the elasticfracture toughness, KIe. The KIe value is the Kmax value at failure and was calculated from DKc/(1 � R). These results are shownin Fig. 4. The KIe values ranged from 125 to 175 MPa m1/2 depending on the ratio of final crack-length-to-specimen-width (cf/W) ratio at failure. From the Two-Parameter Fracture Criterion (TPFC) [29], the elastic–plastic fracture toughness, KF, was650 MPa m1/2 and the fracture toughness parameter, m, was 0.6. These values were selected to fit the test data in Fig. 4.The TPFC equation is
KF ¼ K Ie=ð1�mSn=SuÞ for Sn < rys; ð1Þ
where KF and m are the two fracture parameters, KIe is the elastic fracture toughness (elastic stress-intensity factor at failure),Sn is the net-section stress and Su is the plastic-hinge stress based on the ultimate tensile strength. For example, for a centercrack in a finite-width specimen, Su is equal to ru, the ultimate tensile strength; for a pure bend cracked specimen, Su = 1.5ru;and for a C(T) specimen, Su � 1.62ru. A similar equation was derived for Sn > rys, see Ref. [29]. Once KF and m are known for amaterial, thickness and specimen configuration, then KIe is calculated as
K Ie ¼ KF=f1�mKF=½SupðpcÞFn�g for Sn < rys ð2Þ
for a given crack length and specimen width. (Note that Fn is the usual boundary-correction factor, F, on the stress-intensityfactor with a net-to-gross section conversion [29], because the net-section stress is used in Eq. (1).) For Sn > rys, a more com-plicated equation, which is a function of the stress–strain behavior, is given in Ref. [29]. The TPFC fit the test results quitewell and predicted that the KIe values are a function of the crack length and width; and approaches zero as the crack lengthapproaches the width. Later, the TPFC will be used to calculate the elastic fracture toughness to compare with the Kmax valuesused in the tests near threshold.
Fig. 5 shows the results of only the constant Kmax test and the CPLR/CA test at R = 0.7. (After CP, the LR test was initiated ata rate of 1E-9 m/cycle. Once reaching threshold conditions, CA loading was applied for rates greater than 1E-9 m/cycle.) Alarge difference was observed between these two data sets, even though the constant Kmax and R test data were both con-sidered crack-closure-free data. The Kmax test exhibited a lower threshold than the R = 0.7 tests, which may be considered asa Kmax effect. However, the Kmax value was only about 15% of the calculated elastic fracture toughness (KIe = 240 MPa m1/2),so it is highly unlikely that this low value would have caused a Kmax effect. The constant Kmax test data started deviating fromthe R = 0.7 data at a rate of about 2.5E-09 m/cycle. Several FCG rates were then selected to make near crack-tip load-strainmeasurements to determine crack-opening loads. They were chosen as 2.5E-09, 9.0E-10, 5.0E-10, 3.6E-10, 2.5E-10 and 1.5E-10 m/cycle. Thus, the change in crack-opening loads could be captured as the FCG rate approaches the threshold condition.
Fig. 6 shows typical load-reduced-strain records measured from a near crack-tip strain gage (local) and the BFS gage (re-mote) at a FCG rate of 9.0E-10 m/cycle (The method used to generate the load-reduced-strain, or load-reduced-displacement,
Fig. 4. Elastic fracture toughness (KIe) as a function of crack length and width.
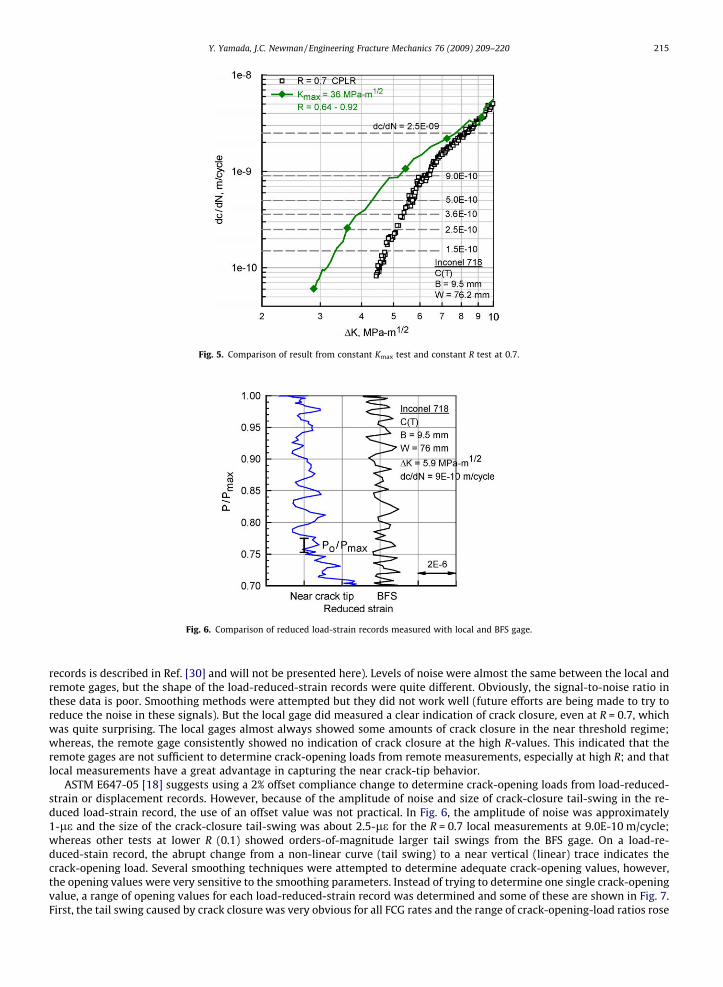
Fig. 5. Comparison of result from constant Kmax test and constant R test at 0.7.
Fig. 6. Comparison of reduced load-strain records measured with local and BFS gage.
Y. Yamada, J.C. Newman / Engineering Fracture Mechanics 76 (2009) 209–220 215
records is described in Ref. [30] and will not be presented here). Levels of noise were almost the same between the local andremote gages, but the shape of the load-reduced-strain records were quite different. Obviously, the signal-to-noise ratio inthese data is poor. Smoothing methods were attempted but they did not work well (future efforts are being made to try toreduce the noise in these signals). But the local gage did measured a clear indication of crack closure, even at R = 0.7, whichwas quite surprising. The local gages almost always showed some amounts of crack closure in the near threshold regime;whereas, the remote gage consistently showed no indication of crack closure at the high R-values. This indicated that theremote gages are not sufficient to determine crack-opening loads from remote measurements, especially at high R; and thatlocal measurements have a great advantage in capturing the near crack-tip behavior.
ASTM E647-05 [18] suggests using a 2% offset compliance change to determine crack-opening loads from load-reduced-strain or displacement records. However, because of the amplitude of noise and size of crack-closure tail-swing in the re-duced load-strain record, the use of an offset value was not practical. In Fig. 6, the amplitude of noise was approximately1-le and the size of the crack-closure tail-swing was about 2.5-le for the R = 0.7 local measurements at 9.0E-10 m/cycle;whereas other tests at lower R (0.1) showed orders-of-magnitude larger tail swings from the BFS gage. On a load-re-duced-stain record, the abrupt change from a non-linear curve (tail swing) to a near vertical (linear) trace indicates thecrack-opening load. Several smoothing techniques were attempted to determine adequate crack-opening values, however,the opening values were very sensitive to the smoothing parameters. Instead of trying to determine one single crack-openingvalue, a range of opening values for each load-reduced-strain record was determined and some of these are shown in Fig. 7.First, the tail swing caused by crack closure was very obvious for all FCG rates and the range of crack-opening-load ratios rose

Fig. 7. Reduced-load strain records for several FCG rates near threshold conditions.
Fig. 8. Region of calculated DKeff based on crack-opening measurements using local gages.
216 Y. Yamada, J.C. Newman Jr. / Engineering Fracture Mechanics 76 (2009) 209–220
as the rate approached the threshold condition. Based on the ranges of crack-opening load determined for each rate, a regionof DKeff was calculated and this region is shown in Fig. 8. Surprisingly, the region of DKeff was located at DK values lower thanthe constant Kmax test. At the ASTM defined threshold (1E-10 m/cycle), the (DKeff)th ranged from 2.7 to 3.1 MPa m1/2, whereasDKth from the constant Kmax test was 3.15 MPa m1/2. This is a very minor difference, but constant Kmax tests were believed togenerate crack-closure-free test data at high R. But the crack-closure-free region indicated that varying amounts of crack clo-sure may be present in the constant Kmax test results from R = 0.64 to 0.92.
Since differences where observed between the constant Kmax test and the DKeff-rate region, constant R tests at extremelyhigh R conditions (0.9 and 0.95) were conducted to search for a proper R-value to obtain crack-closure-free data. The testresults for R = 0.9 and 0.95 are shown on Fig. 9. Again, the Kmax values in these two high R tests were 14% and 25% of thecorresponding calculated elastic fracture toughness at threshold and, thus, Kmax effects are unlikely. The results fromthe R = 0.95 test, which were analyzed by the secant method, agreed well with the DKeff-rate region determined from theR = 0.7 test. Likewise, the test results at R = 0.9 agreed well with the Kmax test data in the low-rate regime (<1.0E-9 m/cycle),and merged with the DKeff region at higher rates. Unfortunately, the number of specimens was depleted and further studieswith the local strain gages on specimens tested under constant Kmax, low and high R conditions could not be tested.
However, for the low R ratio tests at 0.1 and 0.4, the BFS and crack-monitoring software had recorded various compliance-offset values using Elber’s reduced-strain approach [30]. Comparisons between the BFS and local-strain gages could not be

Fig. 10. Local and BFS load-against –reduced strain for low R = 0.1 test on 7075-T651 alloy.
Fig. 9. Comparison of high R, constant Kmax test data and DKeff rate behaviour.
Y. Yamada, J.C. Newman / Engineering Fracture Mechanics 76 (2009) 209–220 217
made on the Inconel-718 alloy, but a comparison could be made on a 7075-T651 alloy. Fig. 10 shows the load-reduced-strainrecords measured on a test at R = 0.1. The results from the BFS shows the tail-swing associated with crack closure and thecompliance-offset values from 1% (OP1) to 16% (OP16). The solid horizontal line shows the crack-opening-load ratio fromFASTRAN [31] for a constraint factor of 2, which was required to correlate the FCG rate data over a wide range in load ratios[32]. The compliance-offset values gave progressively lower values of the crack-opening-load ratio. The near crack-tip gageshowed a similar load-reduced-strain record as the BFS gage, but showed a slightly larger tail-swing and indicated that thecrack-opening load would be slightly higher than the 1% offset value, like that shown by FASTRAN.
The 1% offset values were then used from the Inconel-718 alloy tests at R = 0.1 and 0.4; and the results of these measure-ments and calculations are shown in Fig. 11. Several DK-rate values were selected from the R = 0.1 and 0.4 tests, and the OP1values were used to calculate the corresponding DKeff values. In general, the DKeff values fell short of the DKeff-rate regiondetermined from the R = 0.7 local-strain measurements, except for the lowest rates from the CPLR tests. The R = 0.4 CPLR dataagreed fairly well with the DKeff-rate curve, while the R = 0.4 CA data fell short. The 1% offset values underestimated the truecrack-opening values (as shown in Fig. 10) and that the true opening loads would have resulted in a closer agreement. Theseresults suggest that the DKeff against rate relation may be nearly a unique function over a wide range of R in the thresholdregime, if the true crack-opening values could have been measured.

Fig. 11. High R constant Kmax test and appropriate low-R DKeff data on Inconel-718 alloy.
Fig. 12. Photographs of fatigue surfaces showing darkened surfaces in the near-threshold regimes.
218 Y. Yamada, J.C. Newman Jr. / Engineering Fracture Mechanics 76 (2009) 209–220

Y. Yamada, J.C. Newman / Engineering Fracture Mechanics 76 (2009) 209–220 219
4. Discussion of results
Crack-opening measurements made on a C(T) specimen test at a load ratio (R) of 0.7 indicated a significant amount ofcrack closure as the threshold condition was approached. The test method was compression–compression pre-cracking withload reduction (CPLR), but the FCG rate at the start of the load-reduction procedure was an order-of-magnitude less than themaximum rate allowed in the ASTM E647-05 standard. Thus, load-history effects may not have been present in the data atR = 0.7. During all tests, the fatigue-crack surfaces were very flat and straight, as shown in Fig. 12. The fatigue-crack surfacefrom one of the R = 0.1 tests is shown in Fig. 12a, which shows a dark surface in the rate regime from 3E-10 to 3E-9 m/cycle(near-threshold regime). Fig. 12b shows the fatigue surface for the R = 0.7 test, which did ‘‘not” show a darkened surface inthe near-threshold regime, but appeared to have a ‘‘white” metallic powder. But the R = 0.9 test did show a slight darkeningon the fatigue surface in the near threshold regime (Fig. 12c). Why the R = 0.7 test did not show the darkened fatigue surfacesas seen on both the R = 0.1 and 0.9 tests was not known. Based on these limited data, the constant Kmax and R = 0.9 test mayhave also developed some slight amounts of crack closure. For the R = 0.9 test, the U-value (DKeff = UDK) would have rangedfrom 1 at 2E-9 m/cycle to 0.92 at the threshold condition to agree with the DKeff-rate region. Even the R = 0.1 and 0.4 testsmay have agreed with the DKeff-rate region, if local-strain-gage measurements could have been made. The BFS gage method(OP1) under estimates the true crack-opening-load behavior for low R and was not able to determine any closure behaviorfor high R tests.
5. Concluding remarks
Fatigue-crack-growth (FCG) rate tests were conducted on compact specimens made of an Inconel-718 alloy to study thebehavior over a wide range in load ratios (0.1 6 R 6 0.95) and a constant Kmax test condition. During a test at a load ratioof 0.7, strain gages were placed near and ahead of the crack tip to measure crack-opening loads from local load-strain recordsduring crack growth. In addition, a back-face strain (BFS) gage was also used to monitor crack lengths and to measure crack-opening loads from remote load-strain records during the same test. The BFS gage indicated that the crack was fully open (nocrack closure), but the local load-strain records indicated significant amounts of crack closure. These results imply that theR = 0.7 test had a significant amount of crack closure as the threshold condition was approached, while the R = 0.9 and Kmax
test results may have had a small amount of crack closure, and may not be closure free, as originally suspected. Under the highload-ratio conditions (R P 0.7), it is suspected that the crack surfaces are developing debris-induced crack closure from con-tacting surfaces, which corresponded to darkening of the fatigue surfaces only in the near-threshold regime. Tests at lower Ralso showed darkening of the fatigue surfaces on most of the tests only in the near-threshold regime, which may be caused bya combination of plasticity and fretting-product-debris induced crack closure. Crack-opening measurements made at low Rusing the back-face strain gage and the 1% compliance offset values nearly correlated the crack-growth-rate date on a DKeff
against rate basis. These results suggest that the DKeff against rate relation may be nearly a unique function over a wide rangeof R in the threshold regime. Further studies on the Inconel-718 alloy and other materials using local load-strain records mayprovide further verification of high-R crack closure from DICC and RICC mechanisms in the near-threshold regimes.
Acknowledgements
The authors thank Mr. Ken Garr, Pratt-Whitney Corporation, for providing the Inconel-718 alloy C(T) specimens and thetest data on similar C(T) specimens using the ASTM standard load-reduction test method. Thanks to Dr. A. Vasudevan, Officeof Naval Research, for supporting development of the compression pre-cracking test procedures at MSU under grantN00014-05-1-0871; and to Dr. Keith Donald, Fracture Technology Associates, for his valuable advice on the use of hiscrack-monitoring software.
References
[1] Paris PC, Erdogan F. A critical analysis of crack propagation laws. J Basic Engng 1963;85(3):528–34.[2] Barsom JM. Fatigue-crack propagation in steels of various yield strengths. J Engng Ind 1971;93(4):1190–6.[3] McEvily Jr AJ, Illg W. The rate of fatigue-crack propagation in two aluminum alloys. NACA TN 1958;4394.[4] Elber W. Fatigue crack closure under cyclic tension. Engng Fract Mech 1970;2(1):37–45.[5] Elber W. The significance of fatigue crack closure damage tolerance in aircraft structures ASTM STP 486. American Society for Testing and Materials
1971;22:230–42.[6] Walker N, Beevers CJ. A fatigue crack closure mechanism in titanium. Fatigue Engng Mater Struct 1979;1(1):135–48.[7] Paris PC, Bucci RJ, Wessel ET, Clark WG, Mager TR. Extensive study of low fatigue crack growth rates in A533 and A508 steels. ASTM STP-513
1972:141–76.[8] Newman Jr JC. Effects of constraint on crack growth under aircraft spectrum loading. Fatigue of Aircraft Materials. The Netherlands: Delft University
Press; 1992.[9] Newman Jr JC. Analysis of fatigue crack growth and closure near threshold conditions. ASTM STP-1372 2000:227–51.
[10] Kirby BR, Beevers CJ. Slow fatigue crack growth and threshold behaviour in air and vacuum of commercial aluminium alloys. Fatigue Fract Engng MaterStruct 1979;1:203–16.
[11] Suresh S, Zaminski GF, Ritchie RO. Oxide induced crack closure: an explanation for near-threshold corrosion fatigue crack growth behavior. MetallTrans 1981;A12A:1435–43.
[12] Herman W, Hertzberg R, Jaccard R. A simplified laboratory approach for the prediction of short crack behavior in engineering structures. Fatigue EngngMater Struct 1988;11(4):303–20.

220 Y. Yamada, J.C. Newman Jr. / Engineering Fracture Mechanics 76 (2009) 209–220
[13] Donald JK, Bray GH, Bush RW. An evaluation of the adjusted compliance ratio technique for determining the effective stress intensity factor ASTM STP1332. West Conshohocken, PA: American Society for Testing and Materials; 1999. p. 674–95.
[14] Newman JA, Riddell WT, Piascik RS. Effects of Kmax on fatigue crack growth threshold in aluminum alloys. ASTM STP-1372 2000:63–77.[15] Smith SW, Piascik RS. An indirect technique for determining closure-free fatigue crack growth behavior ASTM STP 1372. West Conshohocken,
PA: American Society for Testing and Materials; 2000. p. 109–22.[16] Vasudevan AK, Sadananda K, Louat N. A review of crack closure, fatigue crack threshold and related phenomena. Mater Sci Engng 1994;A188:1–22.[17] Marci G. Fatigue crack growth threshold concept and test results for al- and ti-alloys. ASTM STP-1372 2000:81–95.[18] Standard test method for measurement of fatigue crack growth rates, ASTM E-647; 2005.[19] Bray GH, Donald JK. Separating the influence of Kmax from closure-related stress ratio effects using the adjusted compliance ratio technique ASTM STP
1343. West Conshohocken, PA: American Society for Testing and Materials; 1999. p. 57–78.[20] Forth SC, Newman Jr JC, Forman RG. On generating fatigue crack growth thresholds. Int J Fatigue 2003;25:9–15.[21] Newman Jr JC, Schneider J, Daniel A, McKnight D. Compression pre-cracking to generate near threshold fatigue-crack-growth rates in two aluminum
alloys. Int J Fatigue 2005;27:1432–40.[22] Ruschau J, Newman Jr JC. Compression precracking to generate near threshold fatigue crack growth rates in an aluminum and titanium alloy. In:
Fatigue and fracture mechanics: 36th symposium, Tampa, FL; November 2007.[23] McClung RC. Analysis of fatigue crack closure during simulated threshold testing. ASTM STP-1372 2000:209–26.[24] Pippan R. The growth of short cracks under cyclic compression. Fatigue Fract Eng Mater Struct J 1987;9:319–28.[25] Pippan R, Plöchl L, Klanner F, Stüwe HP. The use of fatigue specimens precracked in compression for measuring threshold values and crack growth.
ASTM J Test Evaluat 1994;22:98.[26] Topper TH, Au P. Fatigue test methodology AGARD Lecture Series 118. Fatigue test methodology. AGARD Lecture Series 118. Berlin: The Technical
University of Denmark; 1981.[27] Yamada Y, Newman JC, III, Newman Jr JC. Elastic–plastic finite-element analyses of compression precracking and its influence on subsequent fatigue-
crack growth. In: Fatigue and fracture mechanics: 36th symposium, Tampa, FL; November 2007.[28] Garr KR, Hresko GC. A size effect on the fatigue crack growth rate threshold of alloy 718. W. Conshohocken, PA: ASTM STP-1372; 2000. p. 155–74.[29] Newman Jr JC. Fracture analysis of various cracked configurations in sheet and plate materials. Properties related to fracture toughness, ASTM STP-605;
1976. p. 104–23.[30] Elber W. Crack-closure and crack-growth measurements in surface-flawed titanium alloy Ti–6Al–4V. NASA TN D-8010 1975;12:21. September.[31] Newman Jr JC. FASTRAN II – a fatigue crack growth structural analysis program. NASA TM 104159 1992.[32] Newman Jr JC, Jordon JB, Anagnostou EL, Fridline D, Rusk, D. Fatigue and crack-growth analyses on specimens simulating details in wing panels of
naval aircraft. In: Aging aircraft conference, Phoenix, AZ; April 2008.
Related Documents