Engineering and Technology Labour Market Study Engineers Canada and Canadian Council of Technicians and Technologists Trends in Licensure and Certification March 2009

Welcome message from author
This document is posted to help you gain knowledge. Please leave a comment to let me know what you think about it! Share it to your friends and learn new things together.
Transcript
Engineering and TechnologyLabour Market Study
Engineers Canadaand Canadian Council of Technicians and Technologists
Trends in Licensure and Certification
March 2009

Trends in Licensure and Certifi cation
Prism Economics and Analysis
Suite 404
160 Eglinton Avenue East
Toronto, ON
M4P 3B5
Tel: (416)-484-6996
Fax: (416)-484-4147
website: www.prismeconomics.com
John O’Grady
Partner, Prism Economics and Analysis
Direct Phone: (416)-652-0456
Direct Fax: (416)-652-3083
Email: [email protected]
website: www.ogrady.on.ca
E c o n o m i c s a n d A n a l y s i s
P R I S M
Trends in Licensure and Certifi cation
About Engineers CanadaEstablished in 1936, Engineers Canada is the national organization of the 12 provincial and territorial
associations and ordre that regulate the practice of engineering in Canada and license the country’s
more than 160,000 professional engineers. Engineers Canada serves the associations and ordre,
which are its constituent and sole members, by delivering national programs that ensure the highest
standards of engineering education, professional qualifi cations and professional practice.
About the Canadian Council of Technicians and TechnologistsThe Canadian Council of Technicians and Technologists (CCTT) establishes and maintains national
competency standards for certifying members with a ‘quality seal of approval’ in 14 applied science
and engineering technology disciplines: bioscience, industrial, building, instrumentation, chemical,
mechanical, civil, mining, electrical, petroleum, electronics, geomatics, forestry, and information
technology. CCTT’s provincial associations are responsible for issuing these highly regarded
credentials, which are recognized by provincial statute in many Canadian provinces.

Contents
Engineering and Technology Labour Market Study
Engineering and TechnologyLabour Market Study:
Trends in Licensure and Certifi cation
Executive Summary . . . . . . . . . . . . . . . . . . . . . . . . . . . . . . . . . . . . 1
Trends in Licensure and Certifi cation . . . . . . . . . . . . . . . . . . . . . . . . . . . 3
Recommendations . . . . . . . . . . . . . . . . . . . . . . . . . . . . . . . . . . . . 20
Appendix A: Methodology . . . . . . . . . . . . . . . . . . . . . . . . . . . . . . . . 23
Appendix B: Steering Committee Members. . . . . . . . . . . . . . . . . . . . . . . . 27
1 Trends in Licensure and Certifi cation
Executive Summary
Engineers:
• Around 70% of the persons in engineering occupations are either professional engineers or
interns.
• Only 31% of engineering graduates are licensed professional engineers or registered as interns.
• Depending on how ‘engineering jobs’ are defi ned, the proportion of graduates working in these
jobs is between 25% and 45%. In other words, the majority of engineering graduates are not
working in engineering jobs.
• Six sectors account for 85% of engineering employment in Canada. The manufacturing sector
stands out as having a comparatively low incidence of employer policies requiring engineers to
be licensed (29.2%).
• Fewer than 20% of organizations that employ 5 or fewer engineers require their engineers to be
licensed. By contrast, approximately 36% of organizations that employ more than 50 engineers
require licensure.
• Encouraging professionalism and complying with legal requirements are the leading reasons for
employers to require or prefer licensure. Philosophical opposition to licensure on the part of
employers is negligible.
• The most important factor infl uencing employers that do not require or prefer a licence is
concern about restricting their ability to recruit graduates who are not licensed.
• Attitudes towards licensure among engineering graduates are strongly favourable. Age has
almost no effect on attitudes towards licensure. However, graduates under age 35 are less likely
to work in organizations that require a licence.
• Civil (and related) engineers assign the greatest importance to licensure. Electronics engineers
and other engineers working in IT assign lower importance to licensure. Aerospace engineers
also assign generally lower importance to licensure.
Technicians and Technologists:
• Between 17% and 20% of persons working as engineering technicians or technologists are
certifi ed.
• There may have been a modest strengthening of employer support for certifi cation over the past
fi ve years. Of 367 employers that provided information, 6 reported weakening their policy on
certifi cation in the past fi ve years, while 30 reported strengthening their policy. Fewer than 2%
of employers reported that they were philosophically opposed to certifi cation.
• There is a strong correlation between employers’ policies on licensure for professional engineers
and their policies on certifi cation for technicians and technologists. Governments and the
consulting sector show greater support for certifi cation than other sectors.
• ‘Encouraging sound professional attitudes and conduct’ is by far the most important factor cited
by employers that support certifi cation.

Engineering and Technology Labour Market Study 2
• Large employers are signifi cantly more likely to support certifi cation.
• Among employers that do not support certifi cation, the most important consideration is the
desire to avoid restrictions on their ability to hire.
• On all criteria, regardless of age group, technologists attach greater importance to certifi cation
than technicians. Age does not affect technologists’ attitudes toward certifi cation. By contrast,
technicians under the age of 35 are less likely to have positive attitudes toward certifi cation than
technicians over the age of 35.
• Support for certifi cation is notably weaker among technologists working in bio-systems,
geo-science, computer, and chemical technology. By contrast, certifi cation is more strongly
supported by technologists in the geological, metallurgical, civil and environmental fi elds.
• Two important policy issues need to be addressed by professional associations: the viability
of continuing to certify two distinct levels of professional competence (i.e., technicians
and technologists) and the need to establish a simplifi ed, national system of professional
designations.
3 Trends in Licensure and Certifi cation
Trends in Licensure and Certifi cation
IntroductionThis report examines trends in licensure for engineers and in certifi cation for engineering technicians
and technologists.
This study is part of the Engineering and Technology Labour Market Study commissioned by
Engineers Canada and the Canadian Council of Technicians and Technologists, with support from
Human Resources and Skills Development Canada. Additional information on the Engineering and
Technology Labour Market Study is available from the study’s website: www.engineerscanada.ca/
etlms/index.cfm
The fi ndings presented in this study are based on a national survey of engineering and technology
employers (701 respondents), a national survey of engineers, and engineering technicians and
technologists (15,585 respondents) and interviews with 41 senior engineering executives. A more
detailed description of the methodology is set out in Appendix A.
Trends in Licensure for EngineersComparing Employment Trends to Registration Trends:
The 2006 Census identifi ed 184,540 persons as employed in engineering occupations. In principle,
all of these jobs would fall within the ambit of regulatory statutes, except in Ontario, where the
‘industrial exemption’ allows employers to hire unregistered persons in certain circumstances.1
Administrative data provided by the provincial and territorial associations indicate that in 2006
there were around 159,000 registered professional engineers (excluding retirees) and interns. This
overestimates the actual total, since it includes some persons who were registered in more than one
province. Some of these registered professional engineers were in management positions. Others
were in teaching positions or in jobs that were not directly related to engineering. Survey data
suggest that about 17% of registered professional engineers were not working in an engineering
occupation. In approximate terms, therefore, the effective coverage of the licensure system
(including interns) would appear to be around 70%. That is to say, around 70% of the persons in
engineering occupations are registered professional engineers or interns, while around 30% of
persons in those occupations are neither registered professional engineers nor interns.
1. Section 12(3) of Ontario’s Professional Engineers Act lists the allowed exceptions to the requirement for professional
engineering to be done solely by licensed professional engineers. The fi rst of these exempts “doing an act that is within
the practice of professional engineering in relation to machinery or equipment, other than equipment of a structural
nature, for use in the facilities of the person’s employer in the production of products by the person’s employer.”
[emphasis added.] Professional Engineers Ontario (PEO) explains that, an industrial facility does not need to employ
or retain a professional engineer for the purpose of designing or evaluating production equipment and processes or
for supervising its use. However, the exemption is not a permit for non-licensed persons to assume total control over
design of production equipment and process. Other legislation imposes requirements for a professional engineer to be
involved in aspects of the work. For instance, the Occupational Health and Safety Act, Regulation for Industrial Facilities
requires all new or modifi ed production equipment to be reviewed by a professional engineer to confi rm its compliance
with all health and safety standards prior to use. Non-engineers can design the equipment or process but a P. Eng. must
attest that it is safe to use. There is similar legislation specifying that professional engineers design electrical systems,
buildings or other structures, and pressure vessels. The exemption does not pertain to persons designing, evaluating,
commissioning or otherwise practising engineering in relation to production equipment and facilities for someone other
than their employer. Custom equipment builders and others must have the design done by professional engineers.
Engineering and Technology Labour Market Study 4
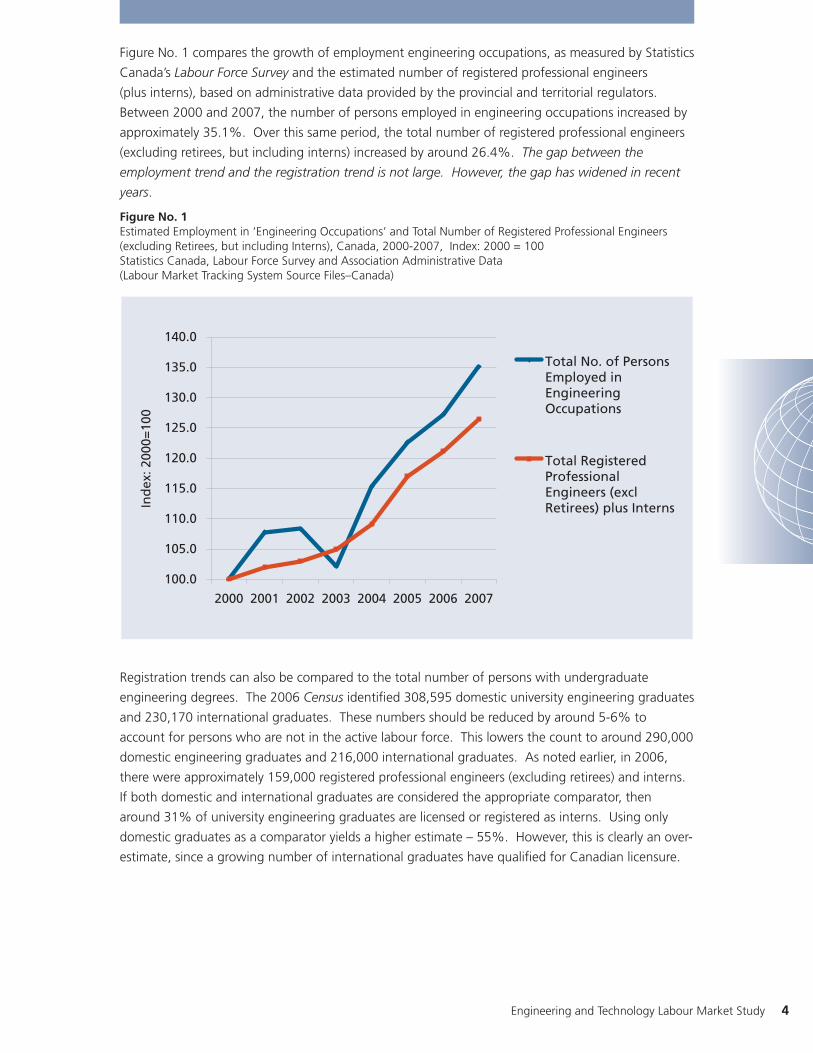
Figure No. 1 compares the growth of employment engineering occupations, as measured by Statistics
Canada’s Labour Force Survey and the estimated number of registered professional engineers
(plus interns), based on administrative data provided by the provincial and territorial regulators.
Between 2000 and 2007, the number of persons employed in engineering occupations increased by
approximately 35.1%. Over this same period, the total number of registered professional engineers
(excluding retirees, but including interns) increased by around 26.4%. The gap between the
employment trend and the registration trend is not large. However, the gap has widened in recent
years.
Figure No. 1Estimated Employment in ‘Engineering Occupations’ and Total Number of Registered Professional Engineers (excluding Retirees, but including Interns), Canada, 2000-2007, Index: 2000 = 100Statistics Canada, Labour Force Survey and Association Administrative Data(Labour Market Tracking System Source Files–Canada)
100.0
105.0
110.0
115.0
120.0
125.0
130.0
135.0
140.0
2000 2001 2002 2003 2004 2005 2006 2007
Ind
ex: 2
000=
100
Total No. of PersonsEmployed inEngineeringOccupations
Total RegisteredProfessionalEngineers (exclRetirees) plus Interns
Registration trends can also be compared to the total number of persons with undergraduate
engineering degrees. The 2006 Census identifi ed 308,595 domestic university engineering graduates
and 230,170 international graduates. These numbers should be reduced by around 5-6% to
account for persons who are not in the active labour force. This lowers the count to around 290,000
domestic engineering graduates and 216,000 international graduates. As noted earlier, in 2006,
there were approximately 159,000 registered professional engineers (excluding retirees) and interns.
If both domestic and international graduates are considered the appropriate comparator, then
around 31% of university engineering graduates are licensed or registered as interns. Using only
domestic graduates as a comparator yields a higher estimate – 55%. However, this is clearly an over-
estimate, since a growing number of international graduates have qualifi ed for Canadian licensure.
5 Trends in Licensure and Certifi cation
Who are the unregistered graduates? The unregistered graduates fall chiefl y into four categories.
The fi rst are engineering graduates who are working in engineering jobs, but who are either non-
compliant with licensure requirements or are working under an exemption permitted by the relevant
engineering statute, such as the ‘industrial exemption’ in Ontario. The second group comprises
international graduates whose qualifi cations are not commensurate with Canadian standards. These
individuals would not be eligible for full licensure, although some may be eligible for restricted
licenses. The third group is graduates who took their bachelor’s degree in engineering, but who
subsequently pursued career interests that are not directly related to engineering. Interviews suggest
that for domestic graduates, this constitutes about 10% of each graduating class. And fi nally, the
fourth group comprises engineering graduates who are not working in engineering jobs. Census
data suggests that the latter three groups account for somewhere between 55% and 75% of all
graduates, depending on how ‘engineering jobs’ are defi ned. 2
These coverage ratios suggest that the profession may wish to consider alternative modes of
registration that allow graduates who wish to retain an association with the profession to register
under different terms from those graduates who intend to practice engineering. Establishing this
alternative mode of registration could facilitate the return to the profession of graduates who moved
from engineering into other types of employment.
Employers’ Policies:
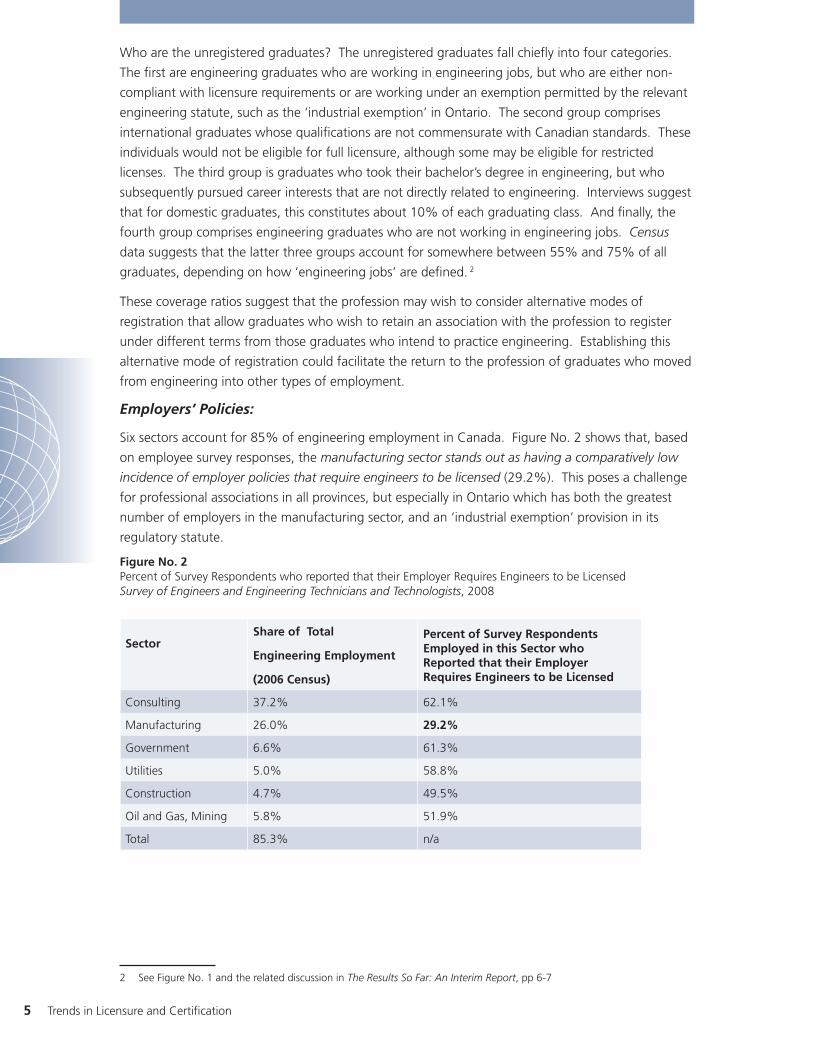
Six sectors account for 85% of engineering employment in Canada. Figure No. 2 shows that, based
on employee survey responses, the manufacturing sector stands out as having a comparatively low
incidence of employer policies that require engineers to be licensed (29.2%). This poses a challenge
for professional associations in all provinces, but especially in Ontario which has both the greatest
number of employers in the manufacturing sector, and an ‘industrial exemption’ provision in its
regulatory statute.
Figure No. 2Percent of Survey Respondents who reported that their Employer Requires Engineers to be LicensedSurvey of Engineers and Engineering Technicians and Technologists, 2008
SectorShare of Total
Engineering Employment
(2006 Census)
Percent of Survey Respondents Employed in this Sector who Reported that their Employer Requires Engineers to be Licensed
Consulting 37.2% 62.1%
Manufacturing 26.0% 29.2%
Government 6.6% 61.3%
Utilities 5.0% 58.8%
Construction 4.7% 49.5%
Oil and Gas, Mining 5.8% 51.9%
Total 85.3% n/a
2 See Figure No. 1 and the related discussion in The Results So Far: An Interim Report, pp 6-7

Engineering and Technology Labour Market Study 6
Figure No. 3 shows that there is a correlation between the number of engineers employed and the
likelihood of an employer requiring professional licensure. In the 2007 Engineering and Technology
Employers Survey, fewer that 20% of organizations that employ 5 or fewer engineers reported
that they required a licence. This proportion increased with the number of engineers employed.
Approximately 36% of organizations that employed more than 50 engineers had a policy requiring
licensure.
Figure No. 3Percent of Employers, based on Number of Engineers they employ, that require Engineers to be Licensed 2007 Survey of Engineering and Technology Employers
0%
5%
10%
15%
20%
25%
30%
35%
40%
1-5 6-10 11-15 16-25 26-50 >50
No. of Engineers Employed
Per
Cen
t o
f Em
plo
yers
in T
his
Siz
e C
ateg
ory
Req
uir
ing
a L
icen
ce
Trend Line
Survey data also indicate that a sizeable majority of engineers are employed in organizations with 50
or more engineers. Thirty-six percent of employers in these large organizations reported that they have
a policy to require licensure, 26% described themselves as preferring licensure, and 22% had a policy
that requires licensure for some engineers, but not for others. (Sixteen percent declined to answer
the survey question). Maintaining support for licensure among large engineering and technology
employers, therefore, is critical to the long-term role of the system of professional licensure.
Companies that participate in co-op programs are more likely to require licensure. The likelihood of
participating in a co-op (or internship) program increases signifi cantly with the number of engineers
an organization employs. If it is feasible, strengthening the links between employers’ policies on
licensure and their participation in the co-op programs would be of considerable benefi t to the
licensure system. 3
3 The following table, based on data from the 2007 Engineering and Technology Employers Survey shows the percentage of
employers within each size category that reported formally participating in co-op or internship programs.
No. of Engineers EmployedParticipate in Co-op Programs
Yes No1-5 28% 72%6-10 56% 44%11-15 72% 28%16-25 80% 20%26-50 88% 12%>50 95% 5%
7 Trends in Licensure and Certifi cation
Survey data suggest a high degree of stability in policy towards licensure. Ten percent of employers
in the 2007 Survey of Engineering and Technology Employers reported that they had changed their
policy in the past fi ve years. About half of these indicated that they moved from a policy of ‘no
requirements or preferences for licensure’ to a policy of preference.
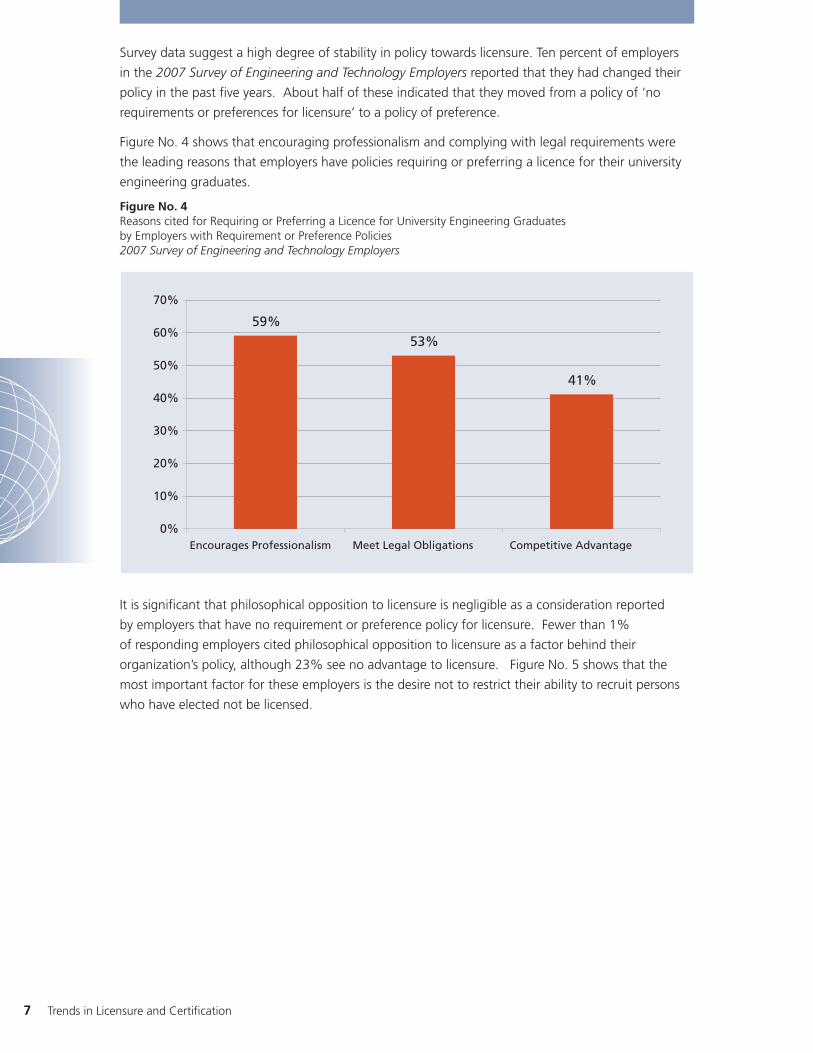
Figure No. 4 shows that encouraging professionalism and complying with legal requirements were
the leading reasons that employers have policies requiring or preferring a licence for their university
engineering graduates.
Figure No. 4Reasons cited for Requiring or Preferring a Licence for University Engineering Graduates by Employers with Requirement or Preference Policies2007 Survey of Engineering and Technology Employers
59%53%
41%
0%
10%
20%
30%
40%
50%
60%
70%
Encourages Professionalism Meet Legal Obligations Competitive Advantage
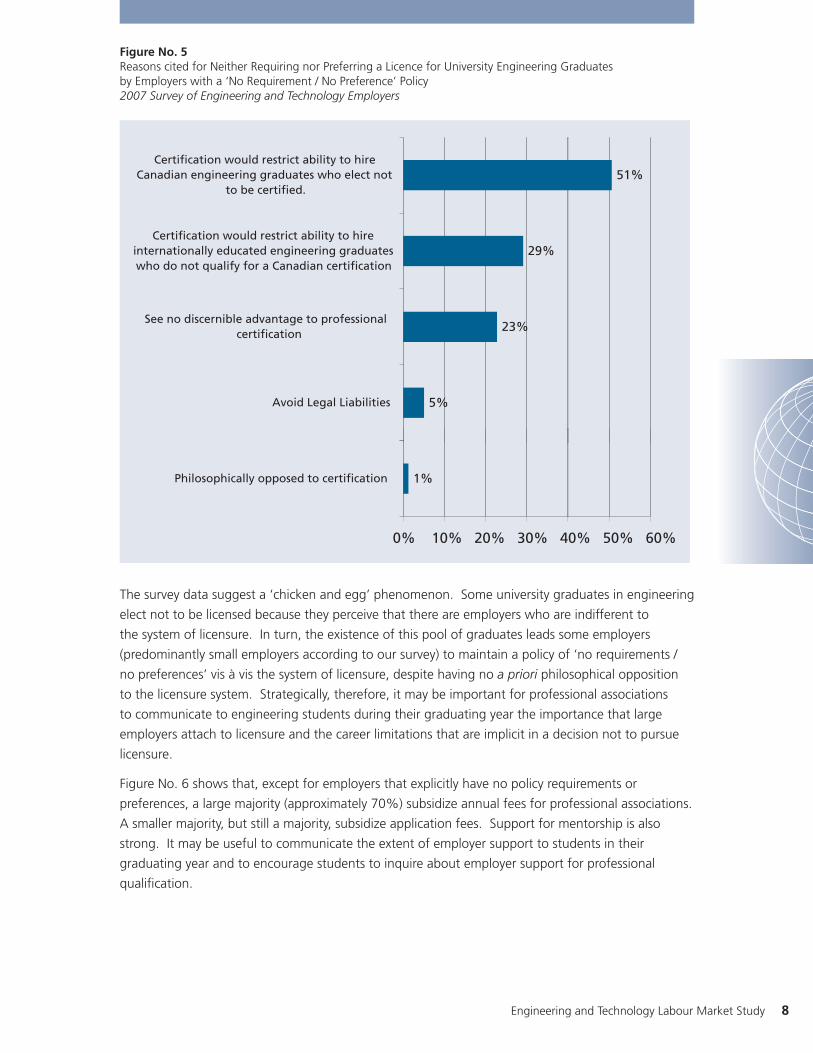
It is signifi cant that philosophical opposition to licensure is negligible as a consideration reported
by employers that have no requirement or preference policy for licensure. Fewer than 1%
of responding employers cited philosophical opposition to licensure as a factor behind their
organization’s policy, although 23% see no advantage to licensure. Figure No. 5 shows that the
most important factor for these employers is the desire not to restrict their ability to recruit persons
who have elected not be licensed.
Engineering and Technology Labour Market Study 8
Figure No. 5Reasons cited for Neither Requiring nor Preferring a Licence for University Engineering Graduates by Employers with a ‘No Requirement / No Preference’ Policy2007 Survey of Engineering and Technology Employers
5%
23%
29%
51%
Avoid Legal Liabilities
See no discernible advantage to professionalcertification
Certification would restrict ability to hireinternationally educated engineering graduateswho do not qualify for a Canadian certification
Certification would restrict ability to hireCanadian engineering graduates who elect not
to be certified.
1%
0% 10% 20% 30% 40% 50% 60%
Philosophically opposed to certification
The survey data suggest a ‘chicken and egg’ phenomenon. Some university graduates in engineering
elect not to be licensed because they perceive that there are employers who are indifferent to
the system of licensure. In turn, the existence of this pool of graduates leads some employers
(predominantly small employers according to our survey) to maintain a policy of ‘no requirements /
no preferences’ vis à vis the system of licensure, despite having no a priori philosophical opposition
to the licensure system. Strategically, therefore, it may be important for professional associations
to communicate to engineering students during their graduating year the importance that large
employers attach to licensure and the career limitations that are implicit in a decision not to pursue
licensure.
Figure No. 6 shows that, except for employers that explicitly have no policy requirements or
preferences, a large majority (approximately 70%) subsidize annual fees for professional associations.
A smaller majority, but still a majority, subsidize application fees. Support for mentorship is also
strong. It may be useful to communicate the extent of employer support to students in their
graduating year and to encourage students to inquire about employer support for professional
qualifi cation.

9 Trends in Licensure and Certifi cation
Figure No. 6Types of Support Provided for Licensure2007 Survey of Engineering and Technology Employers
0%
10%
20%
30%
40%
50%
60%
70%
80%
Application FeesSubsidized
Annual DuesSubsidized
Time Off forExaminations
Assigns Mentor No FormalSupport
Licence Required Licence Preferred
No Requirement or Preference Required or Preferred for Some
Attitudes of Engineering Graduates:
Age has virtually no infl uence on attitudes towards licensure. Figure No. 7 shows that on
all attitudinal factors measured in the Survey of Engineers and Engineering Technicians and
Technologists, there was only an inconsequential difference between respondents age 35 or under
and those over age 35.
Figure No. 7Attitudes towards Licensure among Engineering Graduates, based on AgeSurvey of Engineers and Engineering Technicians and Technologists, 2008
0%
20%
40%
60%
80%
100%
ProvidesProfessionalRecognition
Meets ClientExpectations
Broadens CareerOptions
IncreasesEmployability
Leads to a LikelyIncrease inEarnings
< Age 35 > Age 35

Engineering and Technology Labour Market Study 10
Graduates under age 35 were, however, somewhat less likely to be employed by organizations that
require a licence. Forty-three percent of survey respondents age 35 or under were employed by an
organization without a mandatory licensure policy, compared to 52% of those over age 35.
Figure No. 8 compares attitudes toward licensure, based on technical fi eld.
Figure No. 8Attitudes towards Licensure among Engineering Graduates, based on Technical FieldSurvey of Engineers and Engineering Technicians and Technologists, 2008
Provides Professional Recognition
Meets Client Expectations
Broadens Career Opportunities
Increases Employability
Leads to a Likely Increase in Earnings
Aerospace / Aeronautical 74% 39% 74% 78% 39%
Agricultural / Bio-resource 91% 78% 96% 96% 63%
Architectural / Building / Structural 96% 85% 92% 93% 77%
Bio-Sci. / Bio-Med. / Bio-Chem. 87% 63% 74% 79% 47%
Chemical 89% 61% 81% 86% 51%
Civil 95% 86% 90% 94% 75%
Electrical 82% 60% 78% 81% 52%
Electronics 83% 50% 72% 74% 47%
Engineering Sci. / Engineering Physics
86% 64% 79% 81% 49%
Environmental 93% 78% 89% 91% 66%
Geological and Related 93% 78% 87% 92% 71%
Industrial / Manufacturing 86% 52% 80% 86% 56%
IT / Computer / Software 77% 43% 69% 70% 39%
Instrumentation / Control Systems
88% 67% 80% 82% 57%
Marine / Naval 83% 64% 75% 81% 48%
Materials 86% 64% 76% 78% 51%
Mechanical 87% 63% 81% 86% 59%
Metallurgical 84% 62% 69% 74% 42%
Mineral Resources / Mining 89% 75% 83% 89% 62%
Nuclear 91% 63% 66% 83% 36%
Petroleum and Gas 83% 76% 83% 88% 64%
Systems 84% 57% 74% 70% 38%
Survey / Geomatics 90% 71% 85% 87% 66%
Average 87% 66% 81% 85% 58%
Underlined cells indicate signifi cantly above the ‘all fi elds’ average Bolded cells indicate signifi cantly below the ‘all fi elds’ average

11 Trends in Licensure and Certifi cation
There are some divergences from the average trend which should be noted:
• Civil engineers and Architectural/Structural/Building engineers assign greater importance to
licensure on most criteria.
• By contrast, Electronics engineers and IT/Computer/Software engineers assign lower importance
to licensure on most criteria.
• Aerospace/Aeronautical engineers also assign generally lower importance to licensure.
• Attitudes are close to the mean (as measured by the standard deviation) for all disciplines on
three criteria:
• providing professional recognition,
• broadening career options, and
• increases employability.
• By contrast, there is greater dispersion of attitudes across disciplines for two criteria:
• meets clients’ expectations, and
• leads to a likely increase in earnings.
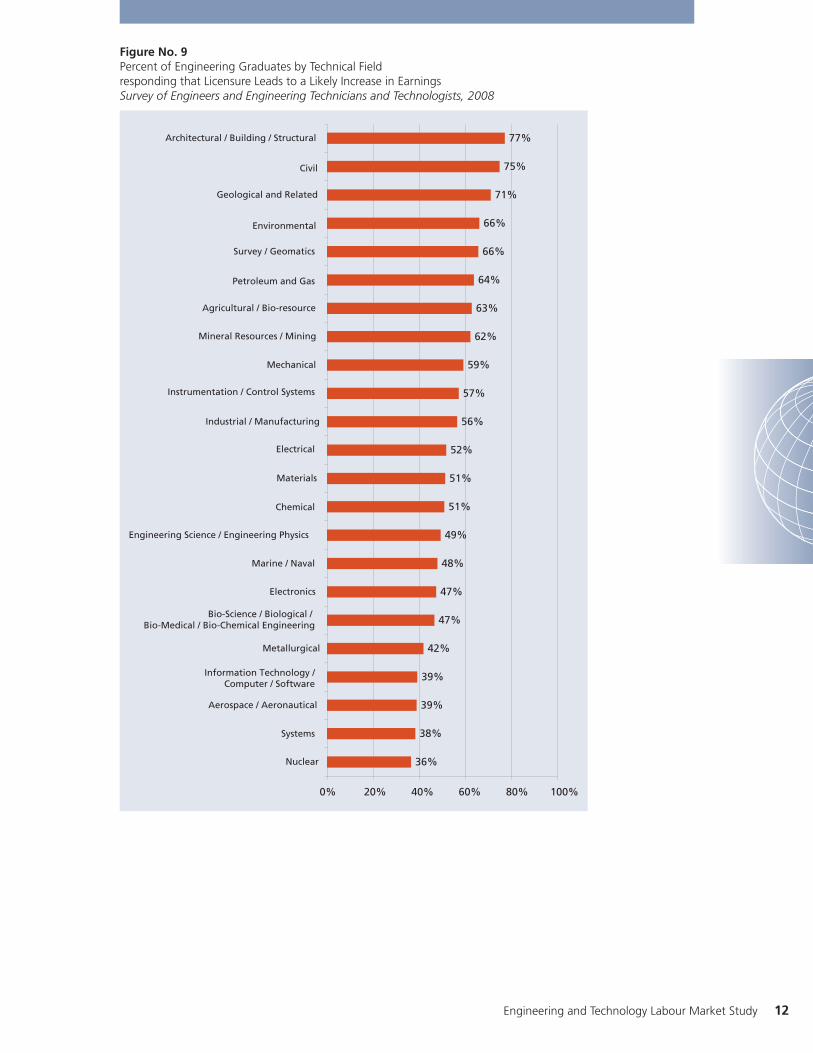
Figure No. 9 illustrates the signifi cant dispersion of attitudes across technical fi elds on attitudes
towards whether licensure ‘leads to a likely increase in earnings’. The lowest association of
licensure with a likely increase in earnings is among nuclear engineers (36%). The highest is among
architectural/building/ structural engineers (77%).
Engineering and Technology Labour Market Study 12
Figure No. 9Percent of Engineering Graduates by Technical Field responding that Licensure Leads to a Likely Increase in EarningsSurvey of Engineers and Engineering Technicians and Technologists, 2008
36%
38%
39%
39%
42%
47%
47%
48%
49%
51%
51%
52%
56%
57%
59%
62%
63%
64%
66%
66%
71%
75%
77%
0% 20% 40% 60% 80% 100%
Nuclear
Aerospace / Aeronautical
Metallurgical
Electronics
Engineering Science / Engineering Physics
Materials
Industrial / Manufacturing
Mechanical
Agricultural / Bio-resource
Survey / Geomatics
Geological and Related
Architectural / Building / Structural
Civil
Environmental
Petroleum and Gas
Mineral Resources / Mining
Instrumentation / Control Systems
Electrical
Chemical
Marine / Naval
Bio-Science / Biological / Bio-Medical / Bio-Chemical Engineering
Information Technology /Computer / Software
Systems

13 Trends in Licensure and Certifi cation
Trends in Certifi cation for Engineering Technicians and TechnologistsComparing Employment Trends to Certifi cation Trends:
The 2006 Census identifi ed 245,510 persons as employed in engineering technician and technologist
occupations. Data supplied by the Canadian Council of Technicians and Technologists show that
there were approximately 52,000 certifi ed technicians and technologists. All provinces, except
Quebec certify both technologists and technicians. Quebec certifi es only technologists. The 2006
Census identifi ed 245,510 engineering technology jobs. Since 2006, this number has increased by
about 6-7%. While most of the 52,000 certifi ed technicians and technologists were employed in
technician and technologist occupations, some were working in management, teaching, technical
sales or other jobs. A reasonable estimate of the coverage of certifi cation with respect to the
number of technician and technologist jobs is, therefore, around one in fi ve or one in six. That is to
say, around 17-20% of engineering technicians and technologists are certifi ed.
Employers’ Policies:Figure No. 10 shows that, while only a quarter of respondents in the Survey of Engineers and
Engineering Technicians and Technologists reported that their employer required a technologist to
be certifi ed, somewhat more than 40% have a policy of preferring certifi cation. For technicians the
percentage is lower.
Figure No. 10Percent of Technicians and Technologists who reported that their Employer Requires or Prefers Technicians and Technologists to be Certifi ed Survey of Engineers and Engineering Technicians and Technologists, 2008
25%
42%
33%
26% 26%
48%
0%
10%
20%
30%
40%
50%
60%
Required Preferred Neither required norpreferred
Technologists Technicians
The 2007 Engineering and Technology Employers Survey suggests that there may have been a
strengthening of support for certifi cation over the past fi ve years. Of 701 respondents to the survey,
367 provided information on their certifi cation policies. Of these, 6 reported a weakening of their
policy in the previous fi ve years, while 30 reported a strengthening of their policy. (Given the large
proportion of non-respondents, care should be taken when interpreting these fi ndings.) This trend
is encouraging and suggests that the professional associations should consider a national strategy to
promote certifi cation in targeted sectors and to larger employers that are more likely to benchmark
themselves against similar organizations.
Engineering and Technology Labour Market Study 14
As would be expected there is a strong correlation between an employer’s policy on certifi cation for
technicians and technologists and its policy on licensure for professional engineers. Organizations
that are weak supporters or non-supporters of licensure for engineers generally do not require or
prefer certifi cation for technicians and technologists. Governments and the consulting sector show
a greater support for certifi cation than other sectors. This is consistent with the advantages to
certifi cation cited by those organizations that require or prefer certifi cation. Seventy-one per cent
require or prefer certifi cation because it ‘encourages sound professional attitudes and conduct’.
Forty-seven percent agree that ‘certifi cation is a competitive advantage in dealing with customers
or clients, even when it is not required by law’. Other considerations account for only 17% of
the reasons for requiring or supporting certifi cation.4 These fi ndings are strongly aligned with the
fi ndings for licensure. They suggest professionalism is by far the strongest appeal of certifi cation and
that efforts to market certifi cation to employers should focus on this appeal.
As with the engineering profession, employer size is also an important correlate with employer policy
on requiring professional qualifi cations. Large employers are signifi cantly more likely to support
certifi cation. This is important to bear in mind when developing marketing strategies.
Among those employers that do not support certifi cation, the reasons cited are similar to the reasons
for not supporting licensure for engineers. Figure No. 11 compares the survey data.
Figure No. 11Reasons for not Requiring or Preferring Licensure/Certifi cation among Employerswith Policies of Not Requiring or Preferring Licensure/Certifi cation2007 Survey of Engineering and Technology Employers
52%
26%
5%
22%
22%
57%
22%
2%
37%
13%
0% 10% 20% 30% 40% 50% 60%
Do not wish to restrict ability torecruit Canadian educated
engineers/technicians/technologists who elect not be licensed/certified
Do not wish to restrict ability torecruit internationally educated
engineers/technicians/technologists who elect not be licensed/certified
Philosophically opposed tolicensure/certification
See no discernible advantages tolicensure/certification
Other reasons
Engineers Technicians/Technologists
4 Data based on 2007 Engineering and Technology Employer Survey

15 Trends in Licensure and Certifi cation
As can be seen from Figure No. 11, there is a close alignment on all factors except the perception
of ‘no discernible advantage’ which is greater in regard to certifi cation of technicians/technologists
than for licensure of engineers. This may also refl ect the different legal environment, since one
of the possible advantages of licensure is legal compliance. However, the data also suggest that
professional associations representing technicians and technologists may need to highlight the
distinguishing attributes of a certifi ed technician/technologist in their marketing efforts. This
highlighting may also suggest ways of introducing or strengthening distinguishing attributes in areas
such as continuing professional development.
Particular note also should be given to the trivial number of employers (2%) that reported
philosophical opposition to certifi cation.
The 2007 Engineering and Technology Employers Survey shows that the most important reason for
not having a policy to support certifi cation is concern over restricting the ability to hire persons who
elect not to be certifi ed. As discussed in the earlier section, this is a ‘chicken and egg’ problem.
Many qualifi ed technicians and technologists elect not to be certifi ed because they perceive that
there are many employers who are indifferent to the system of certifi cation and that there is no
reason to go through the process and incur the expense of becoming certifi ed. In turn, the existence
of this pool of uncertifi ed persons leads some employers (predominantly small employers according
to our survey) to neither require nor prefer certifi cation because they fear that by doing so, they
would cut themselves off from this labour pool.
Opinions of Technicians and Technologists on Certifi cation
Figure Nos. 12a and 12b show opinions on certifi cation among technicians and technologists based
on age group.
Figure No. 12a Technicians’ Attitudes towards Certifi cation, based on AgeSurvey of Engineers and Engineering Technicians and Technologists, 2008
Technicians
0%
20%
40%
60%
80%
ProvidesProfessionalRecognition
Meets ClientExpectations or
Preferences
BroadensCareeerOptions
IncreasesEmployability
Leads to aLikely Increase
in Earnings
<35
>35
Engineering and Technology Labour Market Study 16
Figure No. 12b Technologists’ Attitudes towards Certifi cation , based on AgeSurvey of Engineers and Engineering Technicians and Technologists, 2008
Technologists
0%
20%
40%
60%
80%
ProvidesProfessionalRecognition
Meets ClientExpectations or
Preferences
BroadensCareeerOptions
IncreasesEmployability
Leads to aLikely Increase
in Earnings
<35
>35
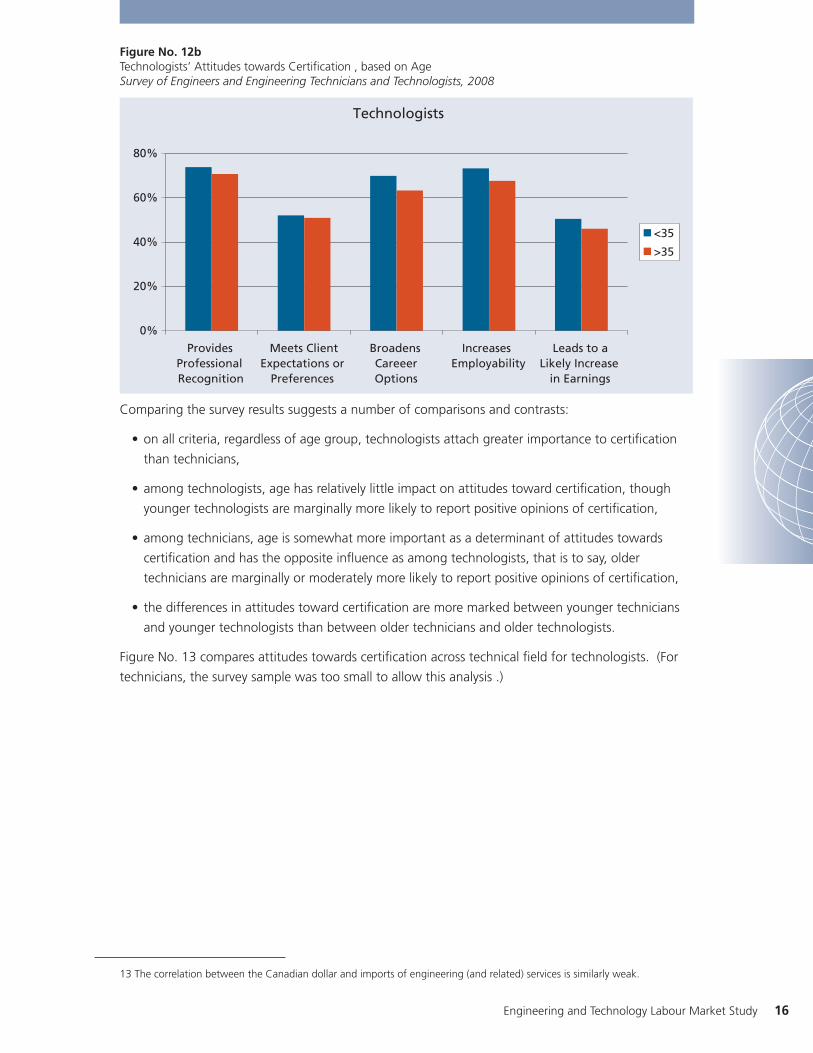
Comparing the survey results suggests a number of comparisons and contrasts:
• on all criteria, regardless of age group, technologists attach greater importance to certifi cation
than technicians,
• among technologists, age has relatively little impact on attitudes toward certifi cation, though
younger technologists are marginally more likely to report positive opinions of certifi cation,
• among technicians, age is somewhat more important as a determinant of attitudes towards
certifi cation and has the opposite infl uence as among technologists, that is to say, older
technicians are marginally or moderately more likely to report positive opinions of certifi cation,
• the differences in attitudes toward certifi cation are more marked between younger technicians
and younger technologists than between older technicians and older technologists.
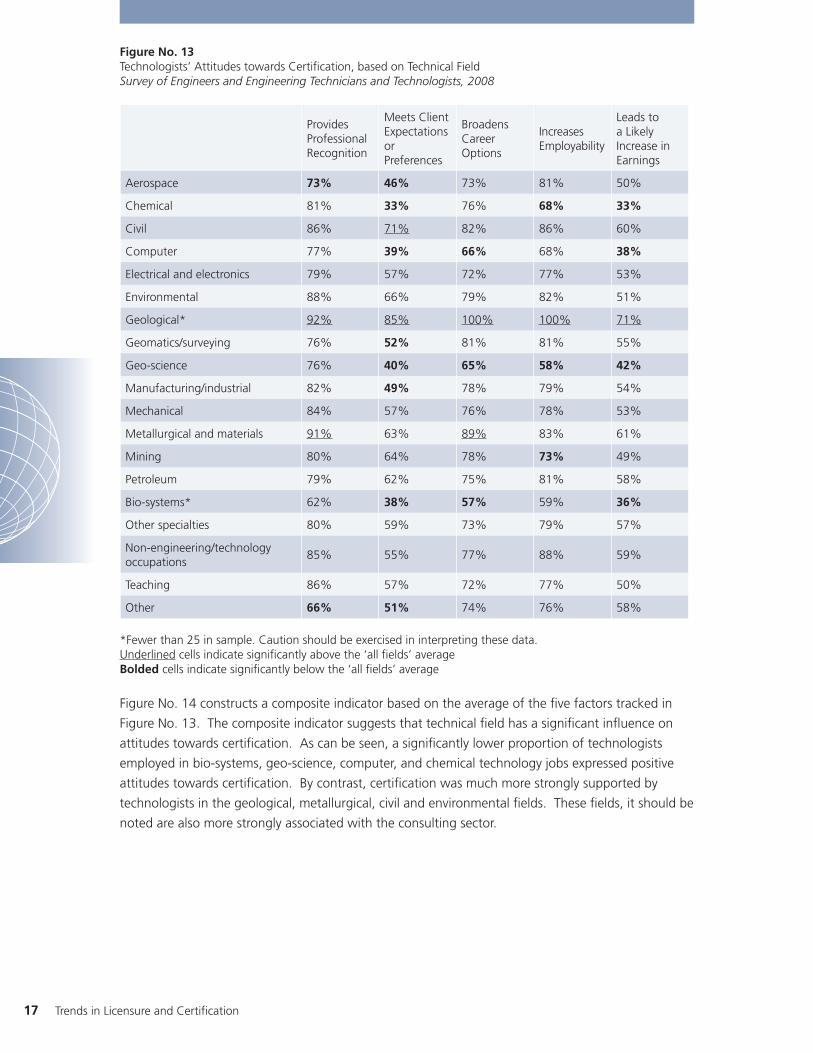
Figure No. 13 compares attitudes towards certifi cation across technical fi eld for technologists. (For
technicians, the survey sample was too small to allow this analysis .)
13 The correlation between the Canadian dollar and imports of engineering (and related) services is similarly weak.
17 Trends in Licensure and Certifi cation
Figure No. 13Technologists’ Attitudes towards Certifi cation, based on Technical FieldSurvey of Engineers and Engineering Technicians and Technologists, 2008
Provides Professional Recognition
Meets Client Expectations or Preferences
Broadens Career Options
Increases Employability
Leads to a Likely Increase in Earnings
Aerospace 73% 46% 73% 81% 50%
Chemical 81% 33% 76% 68% 33%
Civil 86% 71% 82% 86% 60%
Computer 77% 39% 66% 68% 38%
Electrical and electronics 79% 57% 72% 77% 53%
Environmental 88% 66% 79% 82% 51%
Geological* 92% 85% 100% 100% 71%
Geomatics/surveying 76% 52% 81% 81% 55%
Geo-science 76% 40% 65% 58% 42%
Manufacturing/industrial 82% 49% 78% 79% 54%
Mechanical 84% 57% 76% 78% 53%
Metallurgical and materials 91% 63% 89% 83% 61%
Mining 80% 64% 78% 73% 49%
Petroleum 79% 62% 75% 81% 58%
Bio-systems* 62% 38% 57% 59% 36%
Other specialties 80% 59% 73% 79% 57%
Non-engineering/technology occupations
85% 55% 77% 88% 59%
Teaching 86% 57% 72% 77% 50%
Other 66% 51% 74% 76% 58%
*Fewer than 25 in sample. Caution should be exercised in interpreting these data.Underlined cells indicate signifi cantly above the ‘all fi elds’ averageBolded cells indicate signifi cantly below the ‘all fi elds’ average
Figure No. 14 constructs a composite indicator based on the average of the fi ve factors tracked in
Figure No. 13. The composite indicator suggests that technical fi eld has a signifi cant infl uence on
attitudes towards certifi cation. As can be seen, a signifi cantly lower proportion of technologists
employed in bio-systems, geo-science, computer, and chemical technology jobs expressed positive
attitudes towards certifi cation. By contrast, certifi cation was much more strongly supported by
technologists in the geological, metallurgical, civil and environmental fi elds. These fi elds, it should be
noted are also more strongly associated with the consulting sector.

Engineering and Technology Labour Market Study 18
Figure No. 14Composite Indicator of Technologists’ Attitudes towards Certifi cation, based on Technical Field(Percent expressing a Positive View of Certifi cation – Average of Five Factors)Survey of Engineers and Engineering Technicians and Technologists, 2008
50% 55% 60% 65% 70% 75% 80% 85% 90% 95%
Biosystems*
Geoscience
Computer
Chemical
Aerospace
Other
Electrical andelectronics
Teaching
Manufacturing/industrial
Mining
Geomatics/surveying
Mechanical
Other specialties
Petroleum
Non-engineering/technology
Environmental
Civil
Metallurgical andmaterials
Geological*
19 Trends in Licensure and Certifi cation
Designations:
Increasing employer support for certifi cation is one of the central challenges facing the professional
associations that represent and certify technicians and technologists. Two policy challenges make
achieving this goal more diffi cult. The fi rst pertains to occupational terminology; the second, to the
structure of professional designations.
As discussed in Changing Roles, the terms ‘technician’ and ‘technologist’ lack clarity. The distinctions
in competence and qualifi cations that professional associations intend by these occupational
terms does not conform to the way that industry uses the terms. Many employers use the terms
‘technician’ and ‘technologist’ interchangeably. In other words, for many employers the two terms
are equivalent. Other employers use the terms to connote distinctions in job responsibilities, but
these distinctions do not necessarily accord with the distinctions in competence and qualifi cations
that the professional associations intend. In some provinces, the qualifi cation norm is a two-year
college program in technology. In other provinces, there are both two-year and three-year programs.
And fi nally, to complicate matters, some provinces are debating whether to phase out their two-
year program. All of the professional associations certify both technicians and technologists, except
Quebec, which certifi es only technologists.
Promoting adoption of voluntary certifi cations is itself a diffi cult challenge. The desire to certify two
distinct levels of competence is understandable. The question that professional associations must ask
themselves, however, is whether it is practical to promote two levels of voluntary certifi cation when
industry practice and industry nomenclature are so often inconsistent with certifi cation standards.
The second policy issue which makes it more challenging to promote employer adoption of
certifi cation standards is the multiplicity of designations. For the Survey of Engineers and
Engineering Technicians and Technologists we identifi ed a veritable welter of designations – 7 for
technologists and 3 for technicians. About 4% of certifi ed respondents in the survey held more
than one designation. The problem of simplifying the designation structure has been discussed
by the Canadian Council of Technicians and Technologists. Recent amendments to the federal-
provincial Agreement on Internal Trade (AIT) may make it more urgent to resolve this problem. The
amendments to the AIT are intended to eliminate, or radically reduce, the remaining barriers to inter-
provincial mobility in Canada. As voluntary certifi cations, the engineering technology certifi cations
are not the primary focus of the AIT amendments. However, the AIT will increasingly bring all
professional designations under scrutiny. Employers, as well as technicians and technologists, will
rightly ask why there are no nationally accepted designations.

Engineering and Technology Labour Market Study 20
Recommendations
EngineersA comparison of Census data with registration data indicates that around 30% of persons working
in engineering occupations are neither licensed nor registered as interns. Some of these individuals
may be working under the supervision of a qualifi ed professional engineer. Others may be working
under permitted exemptions, such as Ontario’s ‘industrial exemption’. Nevertheless, the 30%
proportion is too high; it is inconsistent with the philosophy of professional regulation.
Over the coming years, all regions of Canada will see major investments in infrastructure. As well,
globalization will make the maintenance of high professional standards even more important than
it already is. These are appropriate circumstances for those jurisdictions that have not updated their
regulatory statutes to consider doing so. Three issues are of central importance. The fi rst of these
is the defi nition of engineering, which should explicitly take account of the importance of IT systems
and of emerging fi elds, like bio-engineering. The second issue of importance is the offshoring
of engineering work and the implications for employer liability when that work is relied upon in
Canada. Until recently, offshoring was a relatively modest phenomenon. That is changing rapidly.
The regulatory system should not lag behind this important change in business practice. And
fi nally, exemptions from compulsory licensing, whether of individuals or engineering practices, also
should be re-examined to determine whether they are still appropriate. In particular, the continuing
appropriateness of Ontario’s ‘industrial exemption’ needs to be re-considered.
Recommendation No. 1
The engineering associations/ordre should consider whether the current circumstances
make it timely to update their engineering statute particularly, but not solely, in regard to
(1) expanding and making more current the scope of regulated practice, with particular
reference to IT systems and bio-engineering, (2) clarifying employer responsibilities and
liabilities, especially in regard to off-shored engineering work, and (3) eliminating or
narrowing exemptions from compulsory licensure.
Data from the 2006 Census suggest that somewhere between 55% and 75% of university
engineering graduates are not working in engineering jobs. The estimate depends on how
‘engineering jobs’ are defi ned. Even the most inclusive defi nition, however, implies that the
majority of engineering graduates are working in non-engineering occupations. This trend poses
two challenges. Many engineering graduates continue to identify with the engineering profession,
notwithstanding that their current employment is not in an engineering fi eld. Overall support for
professional values would be enhanced if these individuals were able to maintain a formal link
to the engineering profession. Addressing this gap would also contribute to meeting a second
challenge. The demand for engineering professionals is strongly cyclical, owing to the importance
of capital spending as a demand driver. Given this, it is inevitable that some individuals will move
out of engineering jobs when capital spending turns down. When the cycle reverses, some of
these individuals return to engineering work. This movement in and out of engineering work
could weaken the system of licensure, if individuals drop their registration when they move out
of engineering work and do not become re-licensed when they return to engineering work. It
is much easier to ensure that individuals maintain their professional registration if it is never fully
abandoned in the fi rst place. A system which allowed qualifi ed individuals to have non-practising

21 Trends in Licensure and Certifi cation
status when they are in non-engineering occupations would enable engineering graduates to retain
their professional affi liation and also would make it more likely that these individuals would seek full
licensure status when they return to engineering work.
Recommendation No. 2
The engineering associations/ordre should consider options for allowing qualifi ed
individuals who are not working in engineering to hold a non-practising registration which
they could subsequently seek to have upgraded to full licensure when they are doing
engineering work.
While the system of professional licensure is robust, there is evidence of weakness in some areas.
As noted earlier, smaller employers and employers in the manufacturing sector evidence somewhat
weaker support for licensure. As well, the immigration into Canada of international engineering
graduates will continue to alter the composition of the engineering work force. While immigration
numbers have come down from the peak in 2001 and 2002, they are still substantially higher than
in the early 1990s. Both the Census and the Survey of Engineers and Engineering Technicians and
Technologists also show that many of these individuals have graduate degrees in engineering. Both
the evidence of some weakness in employer support for licensure and trends in immigration suggest
that the profession might benefi t from a rigorous marketing study that identifi es the perceived
strengths and weaknesses of the system of professional licensure. Such a study might also provide
greater insight into how engineering careers are perceived.
Recommendation No. 3
Engineers Canada, in collaboration with the professional associations/ordre should consider
undertaking a marketing study as part of a process to develop a strategy for promoting
licensure to engineering employers and to all engineering graduates, including international
graduates. This study might also consider how engineering careers are perceived.
Technicians and TechnologistsIn the previous section, it was estimated that, around 17-20% of engineering technicians
and technologists are certifi ed. Clearly the greatest challenges facing engineering technology
professionals is to achieve increased employer support for the system of certifi cation and to foster
greater support for that system among persons currently employed in engineering technology jobs.
Two policy obstacles impede the achievement of these goals.
The fi rst policy issue that needs to be addressed is the ambiguity that surrounds the terms
‘technician’ and ‘technologist’. It is always challenging to promote and maintain a system of
voluntary certifi cation. It is doubly challenging when the occupational terminology used by the
certifi cation system is ‘out of sync’ with industry practice. The Canadian Council of Technicians
and Technologists and the provincial associations/ordre need to review the viability of two distinct
levels of certifi cation. In the long run, a system of voluntary certifi cation cannot operate at odds
with industry practice. Either industry practice will have to be brought into line with certifi cation
standards or certifi cation standards will have to refl ect industry practice.

Engineering and Technology Labour Market Study 22
Recommendation No. 4
The Canadian Council of Technicians and Technologists and the provincial associations/
ordre should systematically review the viability of continuing to certify two distinct levels
of technical competence, namely ‘technicians’ and ‘technologists’.
The second policy issue of importance is the system of designations. A system of voluntary
certifi cation requires simplicity. The current system of professional designations for engineering
technicians and technologists is anything but simple. There are too many designations applicable
to essentially the same competencies - 7 designations for technologists and 3 for technicians.
Employers, as well as technicians and technologists, can rightly ask why there are no nationally
accepted designations. The recent amendments to the federal-provincial Agreement on Internal
Trade (AIT) should be an impetus to resolving this problem.
Recommendation No. 5
In light of recent amendments to the federal-provincial Agreement on Internal Trade, the
Canadian Council of Technicians and Technologists and the associations/ordre certifying
technicians and technologists should make it a priority to create a simplifi ed, national
structure for the certifi cation of technology professionals. The engineering profession is a
relevant comparator. In engineering, there is only one professional designation in English
(P Eng) and an equivalent designation (ing.) in Quebec.
Any system of voluntary certifi cation is vulnerable to changes in employer and individual sentiment.
It is important, therefore, for the Canadian Council of Technicians and Technologists and the
associations/ ordre to carefully monitor employer attitudes towards certifi cation, especially among the
large organizations that employ the preponderance of engineering technicians and technologists. A
consistent methodology would fl ag changes in employer sentiment in a timely manner that would
allow professional associations to respond. Marketing certifi cation to individual technicians and
technologists is also an important challenge. Survey data show considerably different attitudes
towards certifi cation based on technical fi eld. Among technicians, the under-35 age group appears
to be somewhat less supportive of certifi cation.
Recommendation No. 6
After reviewing the viability of two levels of certifi cation (i.e., for technicians and for
technologists) and professional designations and addressing the need for a simplifi ed
national system of designations, Canadian Council of Technicians and Technologists (CCTT)
and the associations/ordre that certify technicians and technologists should develop a
consistent methodology to track employer attitudes toward certifi cation. CCTT and the
associations/ordre should also consider a marketing study as part of a process to develop a
strategy for promoting professional standards and professional certifi cation to employers
and to qualifi ed technology professionals.
23 Trends in Licensure and Certifi cation
Appendix AMethodology
Employer Survey:
The 2007 Engineering and Technology Employer Survey was a web-based survey of engineering
and technology intensive employers. The survey was conducted in 2007 and early 2008. A total of
701 valid responses were received. Of these respondents, 339 (48%) conducted operations in more
than one province, at the time of the survey. In total, the respondents reported that they employed
23,367 engineers, 10,285 technologists, and 8,276 technicians. Based on the 2006 Census, the
respondents to the survey accounted for approximately 11.6% of the total estimated employment of
engineers and 7.1% of technicians and technologists.
More detailed information on the survey sample is available in the report, 2007 Engineering and
Technology Employer Survey, which is available on the Engineering and Technology Labour Market
Study website: http://www.engineerscanada.ca/etlms/index.cfm
Employee Survey:
The Survey of Engineers and Engineering Technicians and Technologists was conducted throughout
2008. A total of 15,585 persons participated in the survey. These comprised 8,700 respondents
with an undergraduate degree in engineering (earned either in Canada or abroad), 5,809 persons
with a Canadian or external college qualifi cation (and no university qualifi cation), 490 persons
with a university science degree (and no other qualifi cation), 547 persons with a graduate degree
in engineering (but who did not report an undergraduate degree5), and 312 persons whose
qualifi cations could not be determined. Approximately 85% of the survey respondents reported
that they were working in engineering or technology when they completed the survey. The
regional, gender and age distribution of respondents approximates the Census distribution. Among
respondents with an undergraduate degree in engineering, 87.9% were either licensed or registered
with their professional association as engineers-in-training. Among respondents with a college
qualifi cation in technology, 62% held a technologist or technician certifi cation.
More detailed information on the survey sample is available in the report, Survey of Engineers and
Engineering Technicians and Technologists, which is available on the Engineering and Technology
Labour Market Study website: http://www.engineerscanada.ca/etlms/index.cfm
Executive Interviews:
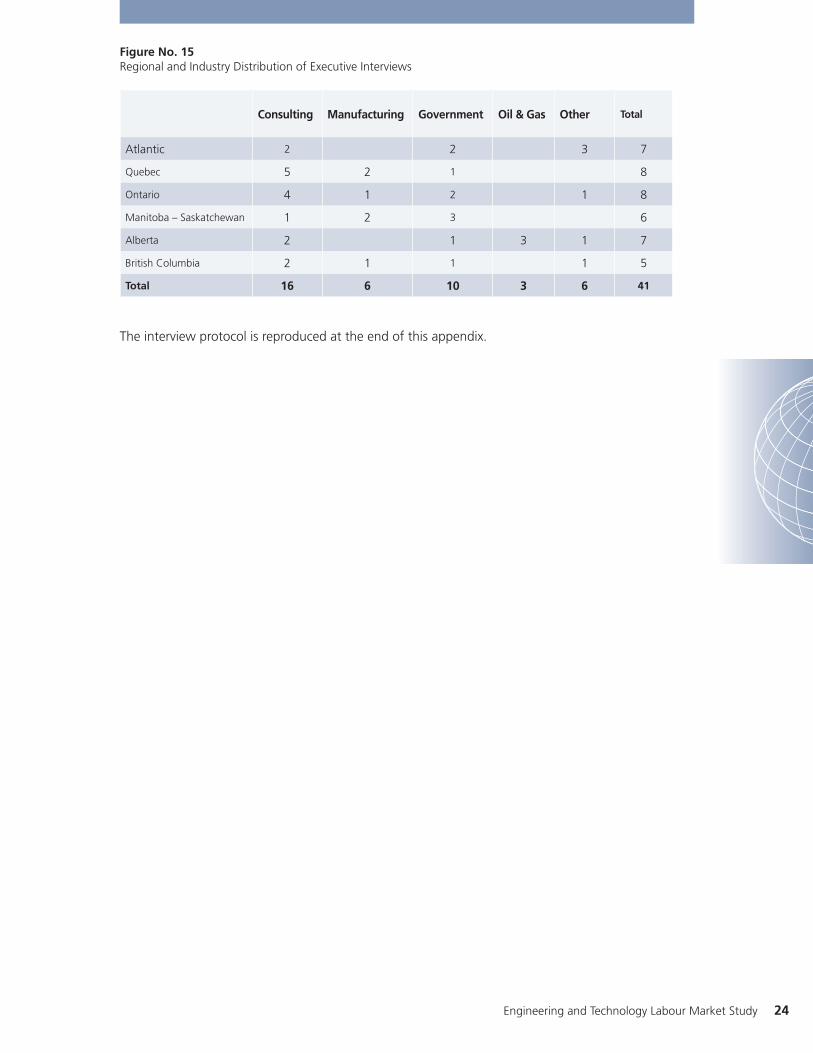
Figure No. 15 summarizes the regional and industry distribution of the executive interviews. Persons
interviewed were generally chief engineers, chief technology offi cers, CEO’s or directors of human
resources. The interviews were conducted in the spring and summer of 2008.
5 The respondents who reported a graduate qualifi cation in engineering, but no undergraduate degree probably reported
only their highest degree.
Engineering and Technology Labour Market Study 24
Figure No. 15Regional and Industry Distribution of Executive Interviews
Consulting Manufacturing Government Oil & Gas Other Total
Atlantic 2 2 3 7
Quebec 5 2 1 8
Ontario 4 1 2 1 8
Manitoba – Saskatchewan 1 2 3 6
Alberta 2 1 3 1 7
British Columbia 2 1 1 1 5
Total 16 6 10 3 6 41
The interview protocol is reproduced at the end of this appendix.

25 Trends in Licensure and Certifi cation
Executive Interview Outline
1. What are your fi rm’s policies regarding continuing professional development for engineers,
technologists and technicians? Do you have a budget allocation for continuing professional
development? Do you have a benchmark in terms of the number of days allowed for continuing
professional development? Does your company maintain records on the continuing professional
development of its engineering and technology employees? Do requirements by professional
associations for continuing professional development affect your company/organization’s policies
or practices?
2. Do your engineers or technicians/technologists tend to belong to professional associations (i.e.,
the provincial and territorial associations that undertake licensure of engineers or certifi cation of
technicians/technologists)? Are there any advantages to you, as an employer, that you associate
with your engineers or technicians/technologists having membership in professional associations
(e.g., differences in professional attitudes, differences in involvement in continuing professional
development, etc.)? Does your company subsidize membership fees, sponsor association
activities, or subsidize attendance at association conferences, seminars, etc.?
3. Do your engineers or technologists tend to belong to technical associations? (e.g., Canadian
Society for Civil Engineering, Canadian Society for Chemical Engineering, Institute of Electrical
and Electronics Engineers – IEEE, etc.)? If so, does your company subsidize membership fees,
sponsor association activities, or subsidize attendance at association conferences, seminars, etc.?
4. What channels does your company rely on for continuing professional development for
engineering and technology employees? (e.g., University-based professional development
centres, colleges, private seminars, technical associations, in-house seminars, etc.). Does your
company/ organization have a preference for any particular channel?
5. Are there any broad trends that you observe in terms of the strengths or weaknesses of the skills
of recent graduates? - technical skills, non-technical skills?
6. Should participation in continuing professional development be a requirement for renewal of
an engineer’s professional license? for renewal of a technologist’s or technician’s certifi cation?
(Note: this is a requirement in some provinces.)
7. In terms of supporting the cost of continuing professional development, where do you see
the balance across individual responsibility, employer responsibility, and government support
(through the tax system)?
8. In your experience, have there been any trends in shifting responsibilities between engineers and
technologists? between technologists and technicians? between technologists and technicians,
on the one hand, and tradespersons on the other? If so, what is behind these changes? (e.g.,
cost pressures, differences in training, internationally trained professionals who are educated as
technologists, but employed as technicians)
9. Do you see any implications of these shifting responsibilities for the system licensing engineers or
certifying technicians or technologists?
10. What is your company’s policy towards professional licensure for engineers and professional
certifi cation for technologists and technicians? Do you provide fi nancial support for annual
registration or membership fees?

Engineering and Technology Labour Market Study 26
• If policy is to require licensure and certifi cation: what are the main reasons that you
require licensure and certifi cation?
• If policy is to prefer licensure and certifi cation: what are the main reasons that you
encourage licensure and certifi cation? Why do you opt for a policy of encouraging, rather
than requiring?
• If policy is mixed, i.e., require for some employees, but not for all: what factors determine
where you draw the line between requiring licensure or certifi cation vs. not requiring?
• If policy is non-supportive: why does your company not see value in licensure or
certifi cation?
• Have there been any changes in your company’s policy or attitude towards licensure or
certifi cation? If so, what was behind these changes?

27 Trends in Licensure and Certifi cation
Appendix B: Steering Committee Members
Kim AllenProfessional Engineers Ontario
Jean Luc ArchambaultOrder des Technologues Professionels du Quebec
Michelle BraniganElectricity Sector Council
David ChalcroftAssociation of Professional Engineers, Geologists and Geophysicists of Alberta
Samantha ColasanteEngineers Canada
Manjeet DhimanACCES Employment Services
Brian GeorgeNorthwest Territories and Nunavut Association of Professional Engineers, Geoscientists
Stephen GouldCanadian Council of Technicians and Technologists
Kevin HodginsNorthwest Territories and Nunavut Association of Professional Engineers, Geoscientists
Cheryl JensenMohawk College
Ellie KhaksarDiversity Integration and Retention Services Inc.
Lise LauzonRéseau des ingénieurs du Québec
Edward LeslieNew Brunswick Society of Certifi ed Engineering Technicians and Technologists
Andrew McLeodEngineers and Geoscientists New Brunswick
Perry NelsonThe Association of Science and Engineering Technology Professionals of Alberta
Robert OkabeCity of Winnipeg
D’Arcy PhillipsManitoba Aerospace
Pat Quinn Professional Engineers Ontario
Colette RivetBioTalent Canada
Tom RoemerCamosun College
Kyle RuttanCanadian Federation of Engineering Students
Deborah Shaman Human Resources and Skills Development Canada
Len Shrimpton Association of Professional Engineers, Geologists and Geophysicists of Alberta
Andrew SteevesADI Ltd.
Al Stewart Royal Military College of Canada
Richard Tachuk Electric Strategies Inc.
Jean-Pierre TrudeauOrdre des ingénieurs du Québec
Gina van den BurgOntario Society of Professional Engineers
Deborah Wolfe Engineers Canada
Bruce WornellEngineers Nova Scotia
Yaroslav Zajac Canadian Council of Technicians and Technologists
Related Documents