2011 ANNUAL REPORT ENERGY TO MOVE FORWARD

Welcome message from author
This document is posted to help you gain knowledge. Please leave a comment to let me know what you think about it! Share it to your friends and learn new things together.
Transcript

2 0 11 A n n u A l R e p o R t
EnErgy to Move FoRwARd
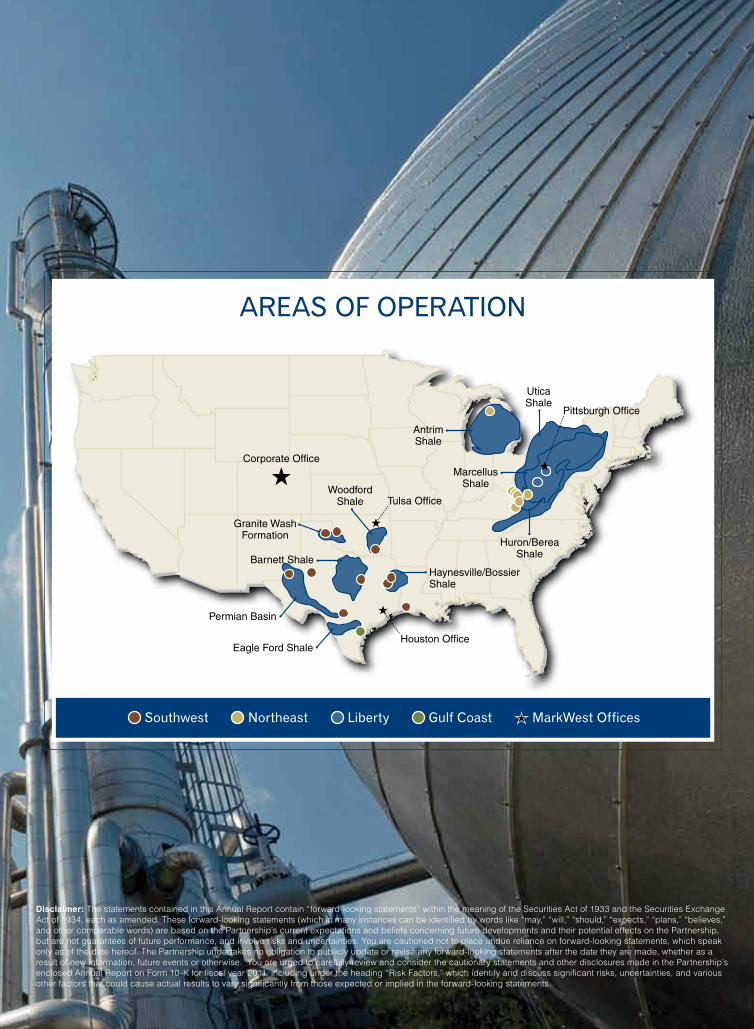
Granite WashFormation
Corporate Office
Houston Office
Tulsa Office
MarcellusShale
Huron/BereaShale
Haynesville/BossierShale
UticaShale
WoodfordShale
Barnett Shale
Eagle Ford Shale
Permian Basin
AntrimShale
Pittsburgh Office
AreAs of operAtion
southwest northeast Liberty Gulf Coast MarkWest offices
Disclaimer: The statements contained in this Annual Report contain “forward-looking statements” within the meaning of the Securities Act of 1933 and the Securities Exchange Act of 1934, each as amended. These forward-looking statements (which in many instances can be identified by words like “may,” “will,” “should,” “expects,” “plans,” “believes,” and other comparable words) are based on the Partnership’s current expectations and beliefs concerning future developments and their potential effects on the Partnership, but are not guarantees of future performance, and involve risks and uncertainties. You are cautioned not to place undue reliance on forward-looking statements, which speak only as of the date hereof. The Partnership undertakes no obligation to publicly update or revise any forward-looking statements after the date they are made, whether as a result of new information, future events or otherwise. You are urged to carefully review and consider the cautionary statements and other disclosures made in the Partnership’s enclosed Annual Report on Form 10-K for fiscal year 2011, including under the heading “Risk Factors,” which identify and discuss significant risks, uncertainties, and various other factors that could cause actual results to vary significantly from those expected or implied in the forward-looking statements.
$100
$150
$200
$250
$50$100
$200
$300
$500
$400
0
100
200
300
400
500
0
50
100
150
200
250
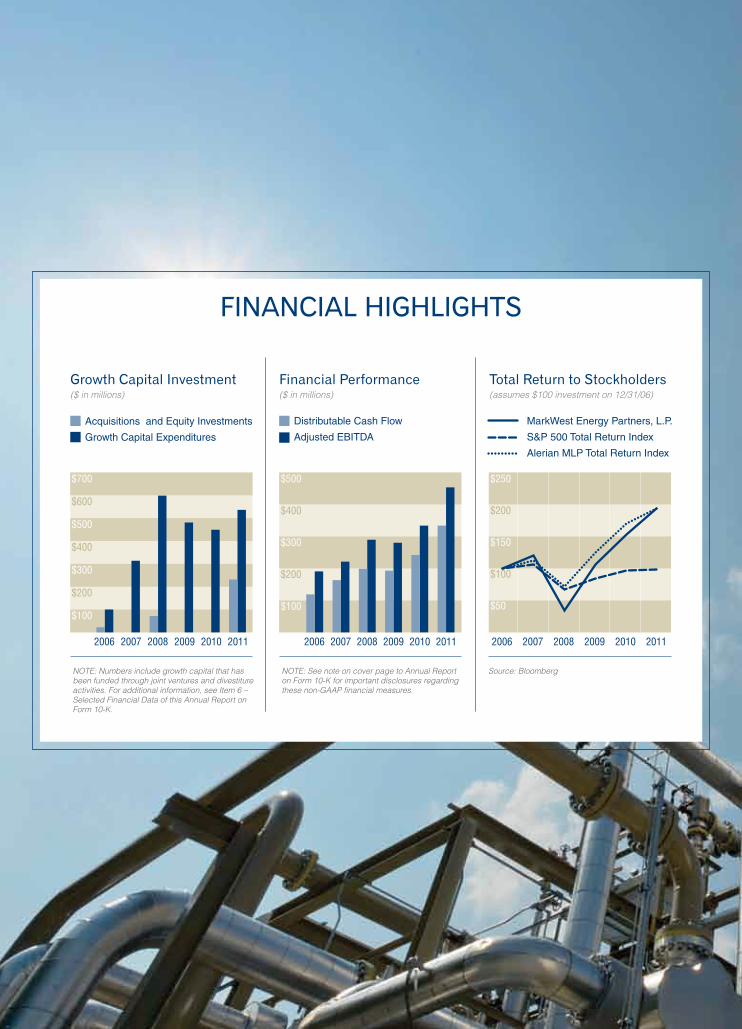
MarkWest Energy Partners, L.P.
S&P 500 Total Return Index
Alerian MLP Total Return Index
NOTE: See note on cover page to Annual Report on Form 10-K for important disclosures regarding these non-GAAP financial measures.
Financial Performance($ in millions)
Distributable Cash Flow
Adjusted EBITDA
Source: Bloomberg
Total Return to Stockholders(assumes $100 investment on 12/31/06)
Performance Graph(assumes $100 invested on 12/31/06)
2006 2007 2008 2009 2010 20112006 2007 2008 2009 2010 2011
$100
$200
$300
$400
$500
$600
$700
NOTE: Numbers include growth capital that has been funded through joint ventures and divestiture activities. For additional information, see Item 6 – Selected Financial Data of this Annual Report on Form 10-K.
0
100
200
300
400
500
600
700
Growth Capital Investment($ in millions)
Acquisitions and Equity Investments
Growth Capital Expenditures
2006 2007 2008 20112009 2010
finAnCiAL HiGHLiGHts
Granite WashFormation
Corporate Office
Houston Office
Tulsa Office
MarcellusShale
Huron/BereaShale
Haynesville/BossierShale
UticaShale
WoodfordShale
Barnett Shale
Eagle Ford Shale
Permian Basin
AntrimShale
Pittsburgh Office
AreAs of operAtion
southwest northeast Liberty Gulf Coast MarkWest offices
Disclaimer: The statements contained in this Annual Report contain “forward-looking statements” within the meaning of the Securities Act of 1933 and the Securities Exchange Act of 1934, each as amended. These forward-looking statements (which in many instances can be identified by words like “may,” “will,” “should,” “expects,” “plans,” “believes,” and other comparable words) are based on the Partnership’s current expectations and beliefs concerning future developments and their potential effects on the Partnership, but are not guarantees of future performance, and involve risks and uncertainties. You are cautioned not to place undue reliance on forward-looking statements, which speak only as of the date hereof. The Partnership undertakes no obligation to publicly update or revise any forward-looking statements after the date they are made, whether as a result of new information, future events or otherwise. You are urged to carefully review and consider the cautionary statements and other disclosures made in the Partnership’s enclosed Annual Report on Form 10-K for fiscal year 2011, including under the heading “Risk Factors,” which identify and discuss significant risks, uncertainties, and various other factors that could cause actual results to vary significantly from those expected or implied in the forward-looking statements.
$100
$150
$200
$250
$50$100
$200
$300
$500
$400
0
100
200
300
400
500
0
50
100
150
200
250
MarkWest Energy Partners, L.P.
S&P 500 Total Return Index
Alerian MLP Total Return Index
NOTE: See note on cover page to Annual Report on Form 10-K for important disclosures regarding these non-GAAP financial measures.
Financial Performance($ in millions)
Distributable Cash Flow
Adjusted EBITDA
Source: Bloomberg
Total Return to Stockholders(assumes $100 investment on 12/31/06)
Performance Graph(assumes $100 invested on 12/31/06)
2006 2007 2008 2009 2010 20112006 2007 2008 2009 2010 2011
$100
$200
$300
$400
$500
$600
$700
NOTE: Numbers include growth capital that has been funded through joint ventures and divestiture activities. For additional information, see Item 6 – Selected Financial Data of this Annual Report on Form 10-K.
0
100
200
300
400
500
600
700
Growth Capital Investment($ in millions)
Acquisitions and Equity Investments
Growth Capital Expenditures
2006 2007 2008 20112009 2010
finAnCiAL HiGHLiGHts

In the Southwest Segment, we gather, process, treat, and transport natural gas and natural gas liquids (NGLs) in four operating areas, including East Texas, Southeast Oklahoma, Western Oklahoma, and Other Southwest.
Our assets in the Southwest include numerous natural gas gathering systems, seven natural gas processing/treating plants, three intrastate gas pipelines, and two interstate gas pipelines.
SouthweSt
AreAs of operAtionOklahoma, Texas, New Mexico, and Louisiana
resource plAysWoodford Shale, Granite Wash, Haynesville Shale, Anadarko Basin, and the Cotton Valley, Travis Peak, and Petit Formations
GAtherinG1.6 Billion cubic feet per day (Bcf/d) gathering capacity
processinG655 Million cubic feet per day (MMcf/d) processing capacity
trAnsportAtion1.5 Bcf/d intrastate transportation capacity
otherArkoma Connector Pipeline JV with ArcLight Capital Partners
Under ConstructionprocessinG120 MMcf/d cryogenic processing capacity in East Texas
% of MArkwest’s net operAtinG MArGin*
49%
We are the largest processor and fractionator of natural gas and NGLs in the southern Appalachian basin. In addition to natural gas processing and fractionation, and NGL transportation, storage, and marketing in Appalachia, we also operate a crude-oil transportation pipeline in Michigan.
Our Appalachian assets include five natural gas processing plants, and one fractionation and storage facility.
NortheaSt
AreAs of operAtionKentucky, West Virginia, and Michigan
resource plAysAppalachian Basin, Huron/Berea Shale, and the Niagaran Reef
processinG505 MMcf/d processing capacity
frActionAtion24,000 Barrels per day (Bbl/d) NGL fractionator
storAGe285,000 barrel propane storage capacity
otherNGL marketing by truck, rail, and barge
Under ConstructionprocessinG150 MMcf/d cryogenic processing capacity at Langley, Kentucky, complex
% of MArkwest’s net operAtinG MArGin*
20%
The Liberty Segment provides natural gas mid-stream services in the liquids-rich area of the Marcellus Shale. We are the largest processor of natural gas with fully integrated processing, fractionation, storage, and marketing operations that are critical to the development of the Marcellus Shale.
Liberty
AreAs of operAtionSouthwest Pennsylvania and northern West Virginia
resource plAyMarcellus Shale
GAtherinG325 MMcf/d gathering capacity
processinG625 MMcf/d cryogenic processing capacity
frActionAtion60,000 Bbl/d C3+ fractionation
Under ConstructionprocessinG1.1 Bcf/d cryogenic processing capacity at Majorsville, Mobley, and Sherwood complexes
frActionAtion115,000 Bbl/d de-ethanization capacity at Houston, PA and Majorsville, WV complexes
other50,000 Bbl/d Mariner West purity ethane pipeline project
Rail loading for 200 railcars
Multiple NGL and ethane pipelines
% of MArkwest’s net operAtinG MArGin*
19%
The Gulf Coast Segment consists of the Javelina gas processing and fractionation facility in Corpus Christi, Texas. Javelina treats, processes, and fractionates off-gas from six local crude-oil refineries.
GuLf CoaSt
AreA of operAtionCorpus Christi, Texas
processinG140 MMcf/d processing capacity
frActionAtion29,000 Bbl/d NGL fractionation capacity
otherNGL marketing and transportation, including ethane, ethylene, propane, propylene, isobutene, normal butane, butylenes, and pentanes
High-purity hydrogen production
* See note on cover page to Annual Report on Form 10-K for important disclosures regarding this non-GAAP financial measure.
% of MArkwest’s net operAtinG MArGin*
12%
We continued to execute significant growth projects while maintaining our focus on some of the best resource plays in the United States, which we believe will continue to provide long-term, dependable distribution growth for our unitholders.
In 2011, we achieved record distrib-utable cash flow (DCF) of $333 million and record Adjusted EBITDA of $451 million, which represent year-over-year increases of approximately 38 percent and 36 percent, respectively. DCF per unit grew by more than 20 percent in 2011 and we maintained a full-year distribution coverage ratio of 1.38. We raised $2.3 billion in capital from the public equity and debt mar-kets to support our significant growth while simultaneously lowering our long-term weighted average cost of capital. As a result, we achieved upgrades from the ratings agencies in 2011, and we are well capitalized to fund our capital program. Overall, we delivered strong financial perfor-mance in 2011 and our significant growth capital forecast, including our development plans for the Utica shale, are confirmation that we are not slowing down in 2012.
We continue to execute our hedging program to manage the risks associ-ated with commodity prices and to provide stability of cash flows. For 2012 we are currently hedged at approximately 65 percent of our com-modity price exposure, measured vol-umetrically; and for 2013 and 2014, we are hedged at approximately
55 percent and 20 percent, respec-tively. This hedg ing philosophy continues to be a key priority given our long-term objective to protect and grow our distributions.
A key part of our operational strategy is to provide exceptional customer service. In 2011, we were again
ranked number one in the Energy Point midstream industry survey. Energy Point compiles rankings in eight major categories, as well as service-specific and region-specific rankings. Of the eight major cate-gories, we were ranked first in five of the categories, including total
customer satisfaction, pricing and contract terms, project development, service and professionalism, and personnel. We also ranked first in natural gas liquid (NGL) transpor-tation and storage, and first in the Marcellus and East Texas regions. We are very proud of these rankings because they validate the hard work of our employees, who consistently work to understand our customer’s needs and deliver best-in-class midstream services.
Our Southwest Segment includes operations in Texas and Oklahoma. Gathering volumes in this segment increased approximately 2 percent in 2011, driven primarily by a 38 percent increase in volumes in the Granite Wash. A 75 million cubic feet per day (MMcf/d) cryogenic expan-sion at our Arapaho processing com-plex came online in 2011 to support the growth in liquids-rich volumes from the Granite Wash. Our process-ing capacity in Western Oklahoma is now 235 MMcf/d, and we are currently operating near capacity.
In Southeast Oklahoma, our gathered volumes remained strong at more than 500 MMcf/d, and our processed vol-umes were greater than 100 MMcf/d. The volume of gas that we processed in Southeast Oklahoma increased by nearly 30 percent compared to 2010, which continues to provide a healthy uplift in operating margin.
There are tremendous reserves yet to be drilled in the unconventional plays
ExcEptional customEr sErvicE oncE again drovE strong opErational pErformancE and anothEr yEar of rEcord financial rEsults in 2011.
Letter to UnithoLders
With our diverse set of assets in growing
resource plays, managed by a team
recognized for exceptional customer service, we are very well positioned to
continue developing midstream solutions
for our producer customers.
2 II

in which we operate in Oklahoma, and we continue to be ideally positioned to further expand our presence in the Southwest.
In East Texas, we recently signed new long-term agreements with Anadarko, Chevron, PetroQuest, and Samson Lone Star, which have plans to aggressively develop the liquids-rich areas of the horizontal Cotton Valley and the Haynesville Shale. As a result, we are adding processing capacity of 120 MMcf/d with the Carthage East plant expected to come online in early 2013, increasing total processing in East Texas to 400 MMcf/d. Our East Texas assets continue to be among the most profitable in the company, and we look forward to many more years of strong operational and finan-cial performance from these assets.
Our Javelina plant in Corpus Christi, Texas, continues to be a solid performer, both operationally and financially. Processed volumes and fractionated barrels were relatively flat in 2011, while segment operating income increased by more than 10 percent, primarily as a result of strong prices for purity products. Javelina continues to be a key part of our oper-ations and provides important diver-sity and stability to our cash flows.
Our Appalachian operations include our Liberty and Northeast segments. We are the largest processor and fractionator in Appalachia. Today we have processing capacity in excess of 1 billion cubic feet per day (Bcf/d), fractionation capacity of 84,000 bar-rels per day (Bbl/d), and a significant NGL pipeline network, essentially
all of which is supported by long-term contracts.
In the Northeast Segment, our pro-cessed volumes increased significantly in 2011, primarily as a result of our acquisition of the Langley processing facilities in southern Kentucky from EQT. We are currently increasing the processing capacity at the Langley plant, which will come online later this year. While certain producers have indicated plans to curtail drilling in the short-term, we remain focused on staying ahead of our customers’ long-term requirements by continuing to invest in strategic, high-return mid-stream projects.
In the Liberty Segment, we continued to see significant volume growth in 2011 highlighted by gathered volumes increasing by more than 70 percent,
processed volumes increasing by 50 percent, and fractionated volumes increasing by nearly three times. Today we operate an extensive and expand-ing gathering system, 625 MMcf/d of processing capacity, and a 60,000 Bbl/d fractionator. In December we acquired the 49 percent of the Liberty joint venture previously owned by the Energy and Minerals Group (EMG). While EMG has been a great partner for three years, we are very pleased to now own 100 percent of the Liberty assets in one of the best shale plays in the United States.
We continue to execute on projects critical to the full development of liquids-rich Marcellus acreage. Our current projects include the construction of six additional cryogenic processing plants supported by long-term agreements with Antero, Consol, EQT, Magnum
Hunter, Noble, and Range. Other sig-nificant projects under construction include three de-ethanization facilities at Majorsville and Houston, with com-bined capacity to produce approxi-mately 115,000 Bbl/d of purity ethane; approximately 400 miles of gas gath-ering, NGL, and purity ethane pipe-lines; and a 200-car rail facility at our Houston complex. When these proj-ects are completed, our processing capacity will increase to more than 1.7 Bcf/d, and our total fractionation capacity will increase to approximately 175,000 Bbl/d.
Capturing premium natural gas liquid pricing is critical for producers in the Marcellus, and we are in a very favor-able position to leverage premium price opportunities for our producer customers because of our large-scale NGL infrastructure.
In addition, we formed a joint venture with EMG to develop the liquids-rich region of the Utica Shale in eastern Ohio. We will develop large, inte-grated, full-service midstream infra-structure similar to our approach in the Marcellus. Our initial development plans include extensive natural gas gathering infrastructure primarily in Harrison, Guernsey, and Belmont counties, which is expected to come online beginning in 2012. In addition, we are developing 200 MMcf/d pro-cessing complexes in Noble and Harrison counties and 100,000 Bbl/d of fractionation capacity in Harrison County. The Noble and Harrison pro-cessing plants will be connected to the fractionator by an NGL pipeline. The Harrison County facility will frac-tionate NGLs from both the Marcellus
2011 ANNUAL REPORT II 3
$333mrecord distributable
Cash Flow in 2011
and the Utica, which will allow us to cost-effectively expand our Marcellus fractionation capacity under long-term contracts and create world-class midstream facilities in the heart of the Utica, the majority of which will be base-loaded by Marcellus NGL pro-duction. Houston and Harrison will be the two largest fractionation complexes in the Northeast, and by connecting the two through an NGL gathering pipeline, we will have tre-mendous operating flexibility and reli-ability, as well as market access. The Harrison fractionator will be owned jointly by MarkWest Liberty and the Utica joint venture, and the capital required to build the complex will be shared accordingly.
It’s important to note that up to the first $500 million of capital expenditures for the Utica joint venture will be funded by EMG, after which MarkWest will fund 100 percent of capital require-ments until we achieve 70 percent ownership. However, MarkWest will receive 60 percent of the distribu-tions for the first five years or until our ownership exceeds 60 percent. Although we are still in the early stages of development of the Utica shale, we are very excited about the play, which we believe will drive significant long-term, high-quality investment opportunities.
With our existing NGL infrastructure and the completion of our ethane and fractionation facilities, our plants will be key supply sources for Northeast
ethane pipeline projects. Our Mariner projects are being developed in partnership with Sunoco Logistics. Mariner West will transport purity ethane to Sarnia, Ontario, Canada beginning in mid-2013. Mariner East is under development and would transport an ethane/propane mix to Philadelphia. The ethane could be shipped to Gulf Coast or international markets, including Europe, and the propane could be exported to Caribbean, South American, and
European markets. In addition, we will deliver ethane to the Enterprise ATEX Express pipeline that will trans-port ethane to the Gulf Coast and is expected to be in service in the first quarter of 2014. We believe that these projects adequately address the necessary ethane takeaway capacity from the Northeast and provide exciting opportunities for exporting propane.
By 2014, our operations in the Marcellus, Utica, and Huron/Berea resource plays will have total pro-cessing capacity of more than 2.5 Bcf/d and fractionation capacity
of approximately 300,000 Bbl/d, including the capacity to produce 155,000 Bbl/d of purity ethane. We have a long history of constructing and operating integrated midstream facilities and providing reliable and flexible solutions for our producer customers. Appalachia is where MarkWest started almost 25 years ago, and it is exciting to be a part of the long-term development of these resource plays, which is creating tre-mendous economic benefits and thousands of jobs in Pennsylvania, West Virginia, Ohio, and Kentucky.
In summary, 2011 was another very strong year, both operationally and financially. With our diverse set of assets in growing resource plays, managed by a team recognized for exceptional customer service, we are very well positioned to continue developing midstream solutions for our producer customers. These growth opportunities, coupled with the strength of our balance sheet, continue to support our objective to provide superior and sustainable total returns for our unitholders.
Thank you for your continued support.
Frank m. SempleChairman, President and Chief Executive Officer
April 15, 2012
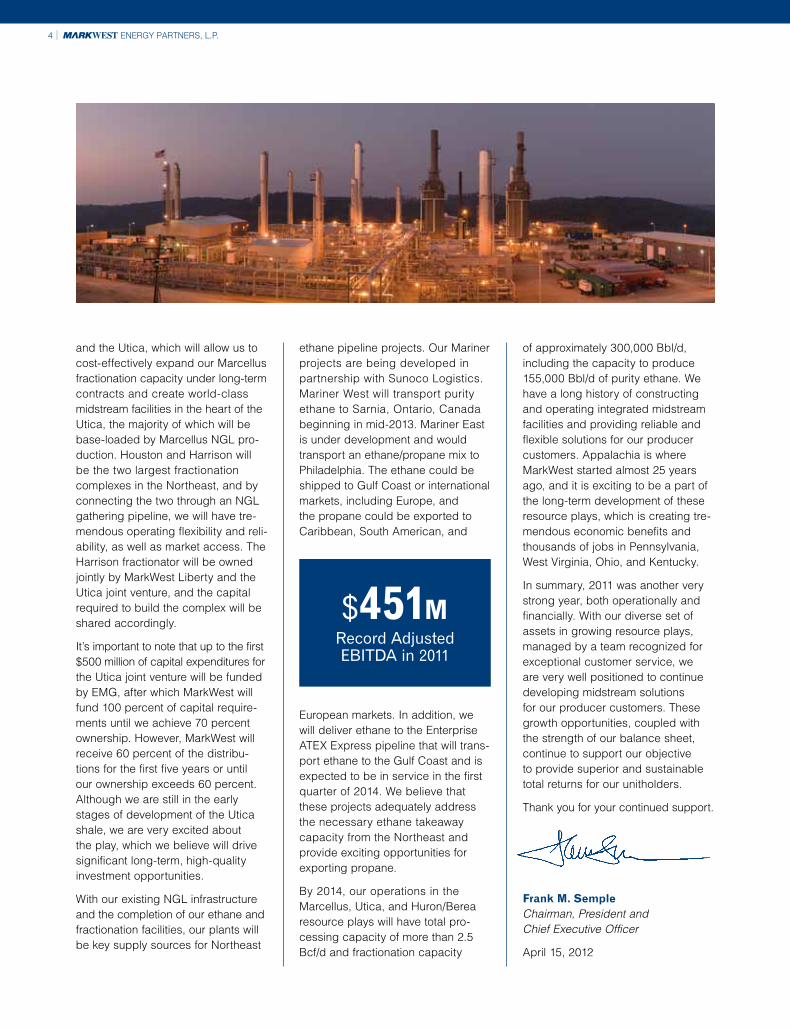
$451mrecord Adjusted eBitdA in 2011
4 II

2011 Annual Report on Form 10-K
Net operating margin is a non-GAAP financial measure. Please read “Business - Non-GAAP Measures” in Item 1 of the enclosed Annual Report on Form 10-K for further discussion and reconciliation of this financial measure.
Distributable Cash Flow (DCF) and Adjusted EBITDA are non-GAAP financial measures. The GAAP measure most directly comparable to DCF and Adjusted EBITDA is net income (loss). In general, we define DCF as net income (loss) adjusted for (i) depreciation, amortization, accretion, and other non-cash expense; (ii) amortization of deferred financing costs; (iii) loss on redemption of debt net of current tax benefit; (iv) non-cash (earnings) loss from unconsolidated affiliates; (v) distributions from (contributions to) unconsolidated affiliates (net of affiliate growth capital expenditures); (vi) non-cash compensation expense; (vii) non-cash derivative activity; (viii) losses (gains) on the disposal of property, plant, and equipment (PP&E) and unconsolidated affiliates; (ix) provision for deferred income taxes; (x) cash adjustments for non-controlling interest in consolidated subsidiaries; (xi) revenue deferral adjustment; (xii) losses (gains) relating to other miscellaneous non-cash amounts affecting net income for the period; and (xiii) maintenance capital expenditures. We define Adjusted EBITDA as net income (loss) adjusted for (i) depreciation, amortization, accretion, and other non-cash expense; (ii) interest expense; (iii) amortization of deferred financing costs; (iv) loss on redemption of debt; (v) losses (gains) on the disposal of PP&E and unconsolidated affiliates; (vi) non-cash derivative activity; (vii) non-cash compensation expense; (viii) provision for income taxes; (ix) adjustments for cash flow from unconsolidated affiliates; (x) adjustment related to non-guarantor, consolidated subsidiaries; and (xi) losses (gains) relating to other miscellaneous non-cash amounts affecting net income for the period. Please see the Form 8-K we filed concurrently with our 2011 Proxy Statement for our calculations of DCF and Adjusted EBITDA, along with the corresponding reconciliations to net income and management’s reasons for including such financial measures in this Annual Report.

UNITED STATESSECURITIES AND EXCHANGE COMMISSION
Washington, D.C. 20549
FORM 10-K� ANNUAL REPORT PURSUANT TO SECTION 13 OR 15(d) OF THE
SECURITIES EXCHANGE ACT OF 1934For the fiscal year ended December 31, 2011
or
� TRANSITION REPORT PURSUANT TO SECTION 13 OR 15(d) OF THESECURITIES EXCHANGE ACT OF 1934
for the transition period from to
Commission File Number 001-31239
MARKWEST ENERGY PARTNERS, L.P.(Exact name of registrant as specified in its charter)
Delaware 27-0005456(State or other jurisdiction of (I.R.S. Employerincorporation or organization) Identification No.)
1515 Arapahoe Street, Tower 1, Suite 1600, Denver, CO 80202-2137(Address of principal executive offices)
Registrant’s telephone number, including area code: 303-925-9200
Securities registered pursuant to Section 12(b) of the Act: Common units representing limited partner interests,New York Stock Exchange
Securities registered pursuant to Section 12(g) of the Act: None
Indicate by check mark whether the registrant is a well-known seasoned issuer, as defined in Rule 405 of theSecurities Act. Yes � No �
Indicate by check mark if the registrant is not required to file reports pursuant to Section 13 or Section 15(d) of theAct. Yes � No �
Indicate by check mark whether the registrant (1) has filed all reports required to be filed by Section 13 or 15(d) ofthe Securities Exchange Act of 1934 during the preceding 12 months (or for such shorter period that the registrant wasrequired to file such reports), and (2) has been subject to such filing requirements for the past 90 days. Yes � No �
Indicate by check mark whether the registrant has submitted electronically and posted on its corporate Web site, ifany, every Interactive Data File required to be submitted and posted pursuant to Rule 405 of Regulation S-T (§232.405of this chapter) during the preceding 12 months (or for such shorter period that the registrant was required to submitand post such files). Yes � No �
Indicate by check mark if disclosure of delinquent filers pursuant to Item 405 of Regulation S-K is not containedherein, and will not be contained, to the best of registrant’s knowledge, in definitive proxy or information statementsincorporated by reference in Part III of this Form 10-K or any amendment to this Form 10-K. �
Indicate by check mark whether the registrant is a large accelerated filer, an accelerated filer, a non-acceleratedfiler or a smaller reporting company. See the definitions of ‘‘large accelerated filer,’’ ‘‘accelerated filer’’ and ‘‘smallerreporting company’’ in Rule 12b-2 of the Exchange Act.
Large accelerated filer � Accelerated filer � Non-accelerated filer � Smaller reporting company �(Do not check if a
smaller reporting company)
Indicate by check mark whether the registrant is a shell company (as defined in Rule 12b-2 of the Act).Yes � No �
The aggregate market value of common units held by non-affiliates of the registrant on June 30, 2011 wasapproximately $3.6 billion. As of February 17, 2012, the number of the registrant’s common units and Class B unitsoutstanding were 95,908,615 and 19,954,389, respectively.
DOCUMENTS INCORPORATED BY REFERENCE:
The information required by Part III of this Report, to the extent not set forth herein, is incorporated herein byreference from the registrant’s definitive proxy statement relating to the Annual Meeting of Unitholders to be held in2012, which definitive proxy statement shall be filed with the Securities and Exchange Commission within 120 days afterthe end of the fiscal year to which this Report relates.

MarkWest Energy Partners, L.P.Form 10-K
Table of Contents
PART IItem 1. Business . . . . . . . . . . . . . . . . . . . . . . . . . . . . . . . . . . . . . . . . . . . . . . . . . . . . . . . 5Item 1A. Risk Factors . . . . . . . . . . . . . . . . . . . . . . . . . . . . . . . . . . . . . . . . . . . . . . . . . . . . 33Item 1B. Unresolved Staff Comments . . . . . . . . . . . . . . . . . . . . . . . . . . . . . . . . . . . . . . . . . 53Item 2. Properties . . . . . . . . . . . . . . . . . . . . . . . . . . . . . . . . . . . . . . . . . . . . . . . . . . . . . . 54Item 3. Legal Proceedings . . . . . . . . . . . . . . . . . . . . . . . . . . . . . . . . . . . . . . . . . . . . . . . . 58Item 4. Mine Safety Disclosures . . . . . . . . . . . . . . . . . . . . . . . . . . . . . . . . . . . . . . . . . . . . 58
PART IIItem 5. Market for Registrant’s Common Units, Related Unitholder Matters and Issuer
Purchases of Equity Securities . . . . . . . . . . . . . . . . . . . . . . . . . . . . . . . . . . . . . . 59Item 6. Selected Financial Data . . . . . . . . . . . . . . . . . . . . . . . . . . . . . . . . . . . . . . . . . . . . 61Item 7. Management’s Discussion and Analysis of Financial Condition and Results of
Operations . . . . . . . . . . . . . . . . . . . . . . . . . . . . . . . . . . . . . . . . . . . . . . . . . . . . 64Item 7A. Quantitative and Qualitative Disclosures About Market Risk . . . . . . . . . . . . . . . . . 87Item 8. Financial Statements and Supplementary Data . . . . . . . . . . . . . . . . . . . . . . . . . . . 93Item 9. Changes in and Disagreements with Accountants on Accounting and Financial
Disclosure . . . . . . . . . . . . . . . . . . . . . . . . . . . . . . . . . . . . . . . . . . . . . . . . . . . . 161Item 9A. Controls and Procedures . . . . . . . . . . . . . . . . . . . . . . . . . . . . . . . . . . . . . . . . . . . 161Item 9B. Other Information . . . . . . . . . . . . . . . . . . . . . . . . . . . . . . . . . . . . . . . . . . . . . . . . 163
PART IIIItem 10. Directors, Executive Officers and Corporate Governance . . . . . . . . . . . . . . . . . . . . 163Item 11. Executive Compensation . . . . . . . . . . . . . . . . . . . . . . . . . . . . . . . . . . . . . . . . . . . 163Item 12. Security Ownership of Certain Beneficial Owners and Management and Related
Unitholder Matters . . . . . . . . . . . . . . . . . . . . . . . . . . . . . . . . . . . . . . . . . . . . . . 163Item 13. Certain Relationships and Related Transactions, and Director Independence . . . . . . 163Item 14. Principal Accountant Fees and Services . . . . . . . . . . . . . . . . . . . . . . . . . . . . . . . . . 163
PART IVItem 15. Exhibits and Financial Statement Schedules . . . . . . . . . . . . . . . . . . . . . . . . . . . . . . 163
SIGNATURES . . . . . . . . . . . . . . . . . . . . . . . . . . . . . . . . . . . . . . . . . . . . . . . . . . . . . . . . . . . . . 171
Throughout this document we make statements that are classified as ‘‘forward-looking.’’ Pleaserefer to the ‘‘Forward-Looking Statements’’ included later in this section for an explanation of thesetypes of assertions. Also, in this document, unless the context requires otherwise, references to ‘‘we,’’‘‘us,’’ ‘‘our,’’ ‘‘MarkWest Energy’’ or the ‘‘Partnership’’ are intended to mean MarkWest EnergyPartners, L.P., and its consolidated subsidiaries owned as of December 31, 2011. References to‘‘MarkWest Hydrocarbon’’ or the ‘‘Corporation’’ are intended to mean MarkWest Hydrocarbon, Inc., awholly-owned taxable subsidiary of the Partnership. References to ‘‘General Partner’’ are intended tomean MarkWest Energy GP, L.L.C., the general partner of the Partnership.
2

Glossary of Terms
The abbreviations, acronyms and industry technology used in this report are defined as follows.
Bbl . . . . . . . . . . . . . . . . . . . . . . . . . . . BarrelBbl/d . . . . . . . . . . . . . . . . . . . . . . . . . . Barrels per dayBcf/d . . . . . . . . . . . . . . . . . . . . . . . . . . Billion cubic feet per dayBtu . . . . . . . . . . . . . . . . . . . . . . . . . . . One British thermal unit, an energy measurementDth/d . . . . . . . . . . . . . . . . . . . . . . . . . . Dekatherms per dayEBITDA (a non-GAAP financial
measure) . . . . . . . . . . . . . . . . . . . . . Earnings Before Interest, Taxes, Depreciation andAmortization
EPA . . . . . . . . . . . . . . . . . . . . . . . . . . . Environmental Protection AgencyERCOT . . . . . . . . . . . . . . . . . . . . . . . . Electric Reliability Council of TexasFASB . . . . . . . . . . . . . . . . . . . . . . . . . . Financial Accounting Standards BoardFERC . . . . . . . . . . . . . . . . . . . . . . . . . Federal Energy Regulatory CommissionGAAP . . . . . . . . . . . . . . . . . . . . . . . . . Accounting principles generally accepted in the United
States of AmericaGal . . . . . . . . . . . . . . . . . . . . . . . . . . . GallonGal/d . . . . . . . . . . . . . . . . . . . . . . . . . . Gallons per dayIFRS . . . . . . . . . . . . . . . . . . . . . . . . . . International Financial Reporting StandardsLIBOR . . . . . . . . . . . . . . . . . . . . . . . . London Interbank Offered RateMcf . . . . . . . . . . . . . . . . . . . . . . . . . . . One thousand cubic feet of natural gasMcf/d . . . . . . . . . . . . . . . . . . . . . . . . . . One thousand cubic feet of natural gas per dayMMBtu . . . . . . . . . . . . . . . . . . . . . . . . One million British thermal units, an energy measurementMMBtu/d . . . . . . . . . . . . . . . . . . . . . . . One million British thermal units per dayMMcf/d . . . . . . . . . . . . . . . . . . . . . . . . One million cubic feet of natural gas per dayNet operating margin (a non-GAAP
financial measure) . . . . . . . . . . . . . . . Segment revenue, excluding any derivative gain (loss), lesspurchased product costs, excluding any derivative gain (loss)
NGL . . . . . . . . . . . . . . . . . . . . . . . . . . Natural gas liquids, such as ethane, propane, butanes andnatural gasoline
N/A . . . . . . . . . . . . . . . . . . . . . . . . . . . Not applicableOTC . . . . . . . . . . . . . . . . . . . . . . . . . . Over-the-CounterSEC . . . . . . . . . . . . . . . . . . . . . . . . . . . Securities and Exchange CommissionSMR . . . . . . . . . . . . . . . . . . . . . . . . . . Steam methane reformer, operated by a third party and
located at the Javelina gas processing and fractionationfacility in Corpus Christi, Texas
TSR Performance Units . . . . . . . . . . . . Phantom units containing performance vesting criteriarelated to the Partnership’s total shareholder return
VIE . . . . . . . . . . . . . . . . . . . . . . . . . . . Variable interest entityWTI . . . . . . . . . . . . . . . . . . . . . . . . . . West Texas Intermediate
3

Forward-Looking Statements
Certain statements and information included in this Annual Report on Form 10-K may constitute‘‘forward-looking statements.’’ The words ‘‘could,’’ ‘‘may,’’ ‘‘predict,’’ ‘‘should,’’ ‘‘expect,’’ ‘‘hope,’’‘‘continue,’’ ‘‘potential,’’ ‘‘plan,’’ ‘‘intend,’’ ‘‘anticipate,’’ ‘‘project,’’ ‘‘believe,’’ ‘‘estimate’’ and similarexpressions are intended to identify forward-looking statements, which are generally not historical innature. These forward-looking statements are based on current expectations, estimates, assumptionsand beliefs concerning future events impacting us and therefore involve a number of risks anduncertainties. While management believes that these forward-looking statements are reasonable as andwhen made, there can be no assurance that future developments affecting us will be those that weanticipate. All comments concerning our expectations for future revenues and operating results arebased on our forecasts for our existing operations and do not include the potential impact of any futureacquisitions. Our forward-looking statements involve significant risks and uncertainties (some of whichare beyond our control) and assumptions that could cause actual results to differ materially from ourhistorical experience and our present expectations or projections. Important factors that could causeactual results to differ materially from those in the forward-looking statements include those describedin (i) Item 1A. Risk Factors of this Form 10-K and elsewhere in this report, (ii) our reports andregistration statements filed from time to time with the SEC and (iii) other announcements we makefrom time to time. Investors are cautioned not to place undue reliance on forward-looking statements,which speak only as of the date hereof. We undertake no obligation to publicly update or revise anyforward-looking statements after the date they are made, whether as a result of new information, futureevents or otherwise.
4

PART I
ITEM 1. Business
General
MarkWest Energy Partners, L.P. is a publicly traded Delaware limited partnership formed inJanuary 2002. We are a master limited partnership engaged in the gathering, processing andtransportation of natural gas; the transportation, fractionation, storage and marketing of NGLs; and thegathering and transportation of crude oil. We conduct our operations in the following operatingsegments: Southwest, Northeast, Liberty and Gulf Coast. Maps detailing the individual assets can befound on our Internet website, www.markwest.com. For more information on these segments, see OurOperating Segments discussion below.
The following table summarizes the operating performance for each segment for the year endedDecember 31, 2011 (amounts in thousands). For further discussion of our segments and a reconciliationto our consolidated statement of operations, see Note 24 of the accompanying Notes to ConsolidatedFinancial Statements included in Item 8 of this Form 10-K.
Southwest Northeast Liberty Gulf Coast Total
Revenue . . . . . . . . . . . . . . . . . . . . . . . . . . . $935,513 $268,884 $248,949 $96,473 $1,549,819Purchased product costs . . . . . . . . . . . . . . . . 506,911 91,612 83,847 — 682,370
Net operating margin(1) . . . . . . . . . . . . . . 428,602 177,272 165,102 96,473 867,449Facility expenses . . . . . . . . . . . . . . . . . . . . . 82,761 27,126 34,913 38,436 183,236Portion of operating income attributable to
non-controlling interests . . . . . . . . . . . . . . 5,431 — 63,731 — 69,162
Operating income before items notallocated to segments . . . . . . . . . . . . . . $340,410 $150,146 $ 66,458 $58,037 $ 615,051
(1) Net operating margin is a non-GAAP financial measure. For a reconciliation of net operatingmargin to income from operations, the most comparable GAAP financial measure, see Non-GAAPMeasures discussion below.
Organizational Structure
We are a master limited partnership with outstanding common units, Class A units and Class Bunits.
• Our common units are publicly traded on the New York Stock Exchange under the symbol‘‘MWE.’’.
• All of our Class A units are owned by MarkWest Hydrocarbon and our General Partner, whichare our wholly-owned subsidiaries. The unregistered Class A units represent limited partnerinterests in the Partnership and have identical rights and obligations of the Partnership commonunits except that Class A units (i) do not have the right to vote on, approve or disapprove, orotherwise consent to or not consent to any matter (including mergers, share exchanges andsimilar statutory authorizations) except as otherwise required by any non-waivable provision oflaw and (ii) do not share in any cash and cash equivalents on hand, income, gains, losses,deductions and credits that are derived from or attributable to the Partnership’s ownership of, orsale or disposition of, the shares of MarkWest Hydrocarbon common stock. The Class A unitsshare, on a pro-rata basis, in the income or loss of the Partnership except for those itemsdescribed in (ii) above. The ownership structure, whereby our Class A units are held by
5

MarkWest Hydrocarbon and the General Partner, was adopted upon the merger of thePartnership and MarkWest Hydrocarbon in February 2008 (the ‘‘Merger’’).
• All of our Class B units were issued to and are held by M&R MWE Liberty, LLC (‘‘M&R’’), anaffiliate of The Energy and Minerals Group (‘‘EMG’’) as part of our December 31, 2011acquisition of the non-controlling interest in MarkWest Liberty Midstream & Resources, L.L.C.(‘‘MarkWest Liberty Midstream’’). See Recent Developments below for further discussion. Theunregistered Class B units will convert to common units on a one-for-one basis (the ‘‘ConvertedUnits’’) in five equal installments beginning on July 1, 2013 and each of the first fouranniversaries of such date. Class B units (i) are not entitled to participate in any distributions ofavailable cash prior to their conversion and (ii) do not have the right to vote on, approve ordisapprove, or otherwise consent to or not consent to any matter (including mergers, shareexchanges and similar statutory authorizations) other than those matters that disproportionatelyand adversely affect the rights and preferences of the Class B units. Upon conversion of theClass B units, the right of M&R and certain of its affiliates to vote as a common unitholder ofthe Partnership will be limited to a maximum of 5% of the Partnership’s outstanding commonunits. Once converted, M&R and certain of its affiliates will have the right to participate inunderwritten offerings of our Partnership in an amount up to 20% of the total number ofcommon units offered and will have comparable 20% participation and sale rights if thePartnership adopts a continuous equity or similar program in the future. M&R also has limitedrights to distribute an aggregate of 2,500,000 common units to its members and their limitedpartners beginning in 2016, and M&R and certain of its affiliates will have the right to demandthat we conduct up to three underwritten offerings beginning in 2017, but restricted to no morethan one offering in any twelve-month period. Except as described above, M&R is not permittedto transfer its Class B units or Converted Units without the prior written consent of the GeneralPartner’s board of directors (the ‘‘Board’’).
The following table provides the aggregate number of units and relative ownership interests of theClass A and B units and common units as of February 17, 2012 (units in millions):
Units %
Common units . . . . . . . . . . . . . . . . . . . . . . . . . . . . . . . . . . . . . . . . . 95.9 69.2%Class A units . . . . . . . . . . . . . . . . . . . . . . . . . . . . . . . . . . . . . . . . . . 22.6 16.3%Class B units . . . . . . . . . . . . . . . . . . . . . . . . . . . . . . . . . . . . . . . . . . 20.0 14.5%
Total units . . . . . . . . . . . . . . . . . . . . . . . . . . . . . . . . . . . . . . . . . . . 138.5 100%
The Class A units held by MarkWest Hydrocarbon and the General Partner are not treated asoutstanding common units in the accompanying Consolidated Balance Sheets. The ownershippercentages as of February 17, 2012 in the graphic depicted below reflect the Partnership structure
6

22FEB201222023474
from the basis of the consolidated financial statements with the Class A units eliminated inconsolidation. All Class B units are owned by the public.
Current Ownership Structure
MarkWest EnergyPartners, L.P.
95.9 MM Common Units20.0 MM Class B Units
Public
MarkWest EnergyGP, L.L.C.
100% Interest
Officers /Directors
1.2% L.P.Interest
98.8% L.P.Interest
MarkWestOperating
Subsidiaries
MarkWestHydrocarbon, Inc.
The primary benefit of our organizational structure is the absence of incentive distribution rights,which prior to our Merger, represented the General Partner’s right to receive an increasing percentageof quarterly distributions of available cash after a minimum quarterly distribution and certain targetdistribution levels had been achieved. The absence of incentive distribution rights substantially lowersour cost of equity capital and increases the cash available to be distributed to our common unitholders.This enhances our ability to compete for new acquisitions and improves the returns to our unitholderson all future expansion projects.
Recent Developments
Acquisition of Non-controlling Interest in MarkWest Liberty Midstream
Effective December 31, 2011, we acquired the 49% interest in MarkWest Liberty Midstream heldby M&R for consideration of approximately $994 million of cash and the issuance of approximately19,954,000 unregistered Class B units valued at approximately $753 million. We also incurredapproximately $4 million in third-party transaction costs. As a result, we own 100% of MarkWestLiberty Midstream as of December 31, 2011. Please refer to the Organizational Structure for adescription of the Class B units and refer to Note 4 of the accompanying Notes to ConsolidatedFinancial Statements included in Item 8 of this Form 10-K for further discussion of the accountingtreatment of the acquisition.
Utica Shale Joint Venture
Effective January 1, 2012, we and EMG Utica, LLC (‘‘EMG Utica’’), an affiliate of EMG,executed agreements to form a Utica Shale midstream joint venture (the ‘‘Utica Joint Venture’’)operated through MarkWest Utica EMG, L.L.C. (‘‘MarkWest Utica EMG’’) to develop significantnatural gas processing and NGL fractionation, transportation and marketing infrastructure in EasternOhio beginning in 2012. Under the terms of the agreements, EMG Utica is obligated to fund the initialcapital expenditures of MarkWest Utica EMG, up to the first $500 million.
7

The first phase of the Utica development plan includes two new processing complexes and100,000 Bbl/d of fractionation, storage and marketing capacity. The initial processing plant in HarrisonCounty is expected to have a capacity of 200 MMcf/d and begin initial operations in mid-2013.MarkWest is finalizing the design capacity and the location of the second processing complex, which isalso expected to begin operations in 2013. Both processing complexes are expected be connected via anNGL gathering system to the fractionation facilities in Harrison County that are anticipated to beoperational in 2013.
Common Unit Offerings
On December 19, 2011, we completed a public offering of 10.0 million newly issued common unitsrepresenting limited partner interests. On January 13, 2012, we issued an additional 0.7 million unitspursuant to the underwriters’ exercise of their option to purchase additional common units. The totalnet proceeds of the offering, including the exercise of the underwriters’ option, were approximately$559 million and were primarily used to partially fund the cash consideration for the acquisition of the49% non-controlling interest in MarkWest Liberty Midstream. We completed additional public offeringsearlier in 2011 and, in total, issued 23.2 million common units receiving net proceeds of approximately$1.1 billion. Refer to Note 17 of the accompanying Notes to Consolidated Financial Statementsincluded in Item 8 of this Form 10-K for further discussion of the accounting treatment of the commonunit offering.
Credit Facility
On December 29, 2011, we amended our revolving credit facility as provided under the Amendedand Restated Revolving Credit Agreement dated July 1, 2010, as amended (‘‘Credit Facility’’) toincrease the borrowing capacity to $900 million, and to reset the uncommitted accordion feature of$250 million, providing us with the additional financial flexibility to continue to execute our growthstrategy. Earlier in 2011, we had amended the Credit Facility to reduce the interest rates and extendthe maturity date to September 2016. See Note 16 of the accompanying Notes to ConsolidatedFinancial Statements included in Item 8 of this Form 10-K for further details of our Credit Facility.
Senior Notes Offerings and Tender Offers
During 2011, we completed a public offering for $500 million in aggregate principal amount of6.5% senior notes due in August 2021 (‘‘2021 Senior Notes’’) and a public offering for $700 million inaggregate principal amount of 6.25% senior notes due in June 2022 (‘‘2022 Senior Notes’’). A portionof the $1.2 billion combined net proceeds from these offerings was used to repurchase $275 millionaggregate principal amount of our 8.5% senior notes due in July 2016 and approximately $419 millionaggregate principal amount of our 8.75% senior notes due in April 2018, with the remainder used toprovide additional capital for general partnership purposes and to fund our capital expenditures. As aresult of these refinancing activities, we have significantly reduced the interest rates and extended theterms of our long-term financing. See Note 16 of the accompanying Notes to the ConsolidatedFinancial Statements included in Item 8 of this Form 10-K for more details of these senior notestransactions and discussion of the accounting impacts.
Expansion of Marcellus Shale Operations
During the third quarter of 2011, we began operations of our fractionation facility at our Houston,Pennsylvania processing complex (‘‘Houston Complex’’) with a design capacity of 60,000 barrels perday. This was a significant milestone in our continued development of our fully integrated midstreamservices in the Marcellus Shale.
8

In January 2012, we announced the 400 MMcf/d expansion of our processing facilities inMajorsville, West Virginia (‘‘Majorsville Complex’’), which would bring the total cryogenic processingcapacity at the Majorsville Complex to 670 MMcf/d. The expansion of the Majorsville Complex includestwo, 200 MMcf/d processing trains that are expected to begin operations in 2013 and will be supportedby long-term agreements with CONSOL Energy, Noble Energy and Range Resources.
In February 2012, we announced plans to expand the capacity of our processing facilities inSherwood, West Virginia (‘‘Sherwood Complex’’) with an additional 200 MMcf/d cryogenic processingplant that is expected to be completed in 2013. The expansion plans are based, in part, on a producercustomer’s decision to support the additional capacity under a long-term processing agreement. Theproducer customer has publicly stated its intent to move forward with the project but must make itsfinal decision on whether to proceed with the additional plant at the Sherwood Complex by July 1,2012.
See Our Operating Segments below for additional discussion of our existing operations and plannedexpansion in Liberty and other segments.
Business Strategy
Our primary business strategy is to provide top-tier midstream services by developing andoperating high-quality, strategically located assets in the liquids-rich areas of the emerging resourceplays in the United States. We plan to accomplish this through the following:
• Developing long-term integrated relationships with our producer customers. As a top-ratedmidstream service provider, we develop long-term, integrated relationships with key producercustomers as evidenced by our relationships with the primary producers in the Woodford Shale,the Haynesville Shale, the Granite Wash, the Marcellus Shale and the Huron/Berea Shale. Weintend to continue to develop relationships that are characterized by joint planning for thedevelopment of the emerging resource plays, such as the Utica Shale, and our commitment togrow to meet the specific needs of our customers.
• Expanding operations through organic growth projects. By expanding our existing infrastructureand customer relationships, we intend to continue growing in our primary areas of operation tomeet the anticipated demand for additional midstream services. During 2011, we spentapproximately $551 million of total capital to develop midstream infrastructure in the MarcellusShale and to expand several of our gathering and processing operations in our Southwestsegment, including the Western Oklahoma gas processing plant.
• Expanding operations through strategic acquisitions. We intend to continue pursuing strategicacquisitions of assets and businesses in our existing areas of operation that leverage our currentasset base, personnel and customer relationships. We may also seek to acquire assets in certainregions outside of our current areas of operation. We believe that our capital structure, which nolonger includes incentive distribution rights, positions us to compete more effectively for futureacquisitions. For example, during 2011, we completed the Langley Acquisition for approximately$231 million to acquire natural gas processing and NGL pipeline assets located in Kentucky andWest Virginia for processing gas produced in the Huron/Berea Shale and transporting NGLs toour Siloam fractionation facility. In addition, we acquired the non-controlling 49% interest inMarkWest Liberty Midstream for consideration of $994 million in cash and approximately19,954,000 unregistered Class B units valued at approximately $753 million. Please refer toNote 4 of the accompanying Notes to the Consolidated Financial Statements included in Item 8of this Form 10-K for further discussion of the acquisition of non-controlling interest.
• Maintaining our financial flexibility. Our goal is to maintain a capital structure with approximatelyequal amounts of debt and equity financing on a long-term prospective basis. During 2011, we
9
22FEB201222023248
raised approximately $2.3 billion by strategically accessing the debt and equity markets to fundour planned expansion projects and to effectively refinance a significant portion of our seniornotes to realize lower interest rates and to extend the maturity dates. See Note 16 of theaccompanying Notes to Consolidated Financial Statements included in Item 8 of this Form 10-Kfor further discussion of the recent transactions related to our senior notes. We also entered intoamendments to our Credit Facility to expand the borrowing capacity from $705 million to$900 million and to extend the term to September 2016. As of December 31, 2011, we and ourwholly-owned subsidiaries had approximately $117 million of cash and cash equivalents and wehad approximately $815 million available for borrowing under our Credit Facility. We believethat our Credit Facility, our ability to issue additional partnership units and long-term debt andour strong relationships with our existing joint venture partners will provide us with the financialflexibility to facilitate the execution of our business strategy.
• Reducing the sensitivity of our cash flows to commodity price fluctuations. We intend to continueto secure long-term, fee-based contracts in order to further reduce our exposure to short-termchanges in commodity prices. We estimate that fee-based contracts will account for greater than50% of our net operating margin in 2013. We also engage in risk management activities in orderto reduce the effect of commodity price volatility related to future sales of natural gas, NGLsand crude oil. We may utilize a combination of fixed-price forward contracts, fixed-for-floatingprice swaps and options available in the over-the-counter market. We monitor these activitiesthrough enforcement of our commodity risk management policy. Please refer to Note 6 of theaccompanying Notes to the Consolidated Financial Statements included in Item 8 of thisForm 10-K for further discussion of our commodity risk management policy.
• Increasing utilization of our facilities. We seek to increase the utilization of our existing facilitiesby providing additional services to our existing customers and by establishing relationships withnew customers. We also continue to develop additional capacity at many of our facilities, whichenables us to increase throughput with minimal incremental costs.
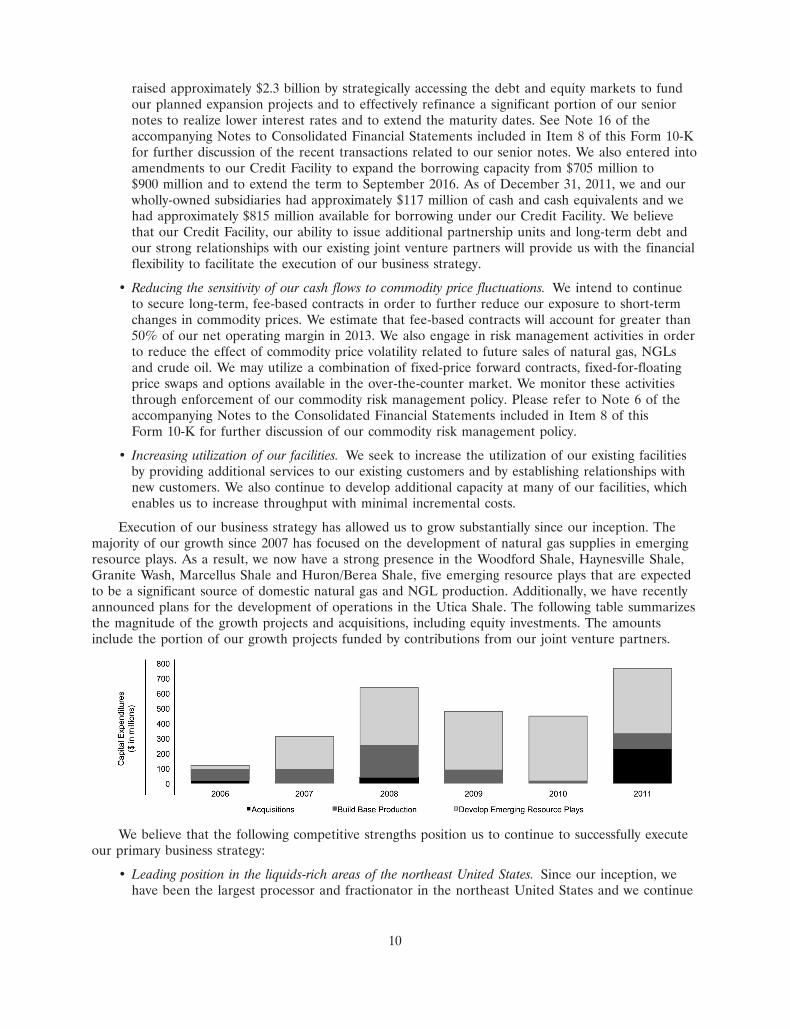
Execution of our business strategy has allowed us to grow substantially since our inception. Themajority of our growth since 2007 has focused on the development of natural gas supplies in emergingresource plays. As a result, we now have a strong presence in the Woodford Shale, Haynesville Shale,Granite Wash, Marcellus Shale and Huron/Berea Shale, five emerging resource plays that are expectedto be a significant source of domestic natural gas and NGL production. Additionally, we have recentlyannounced plans for the development of operations in the Utica Shale. The following table summarizesthe magnitude of the growth projects and acquisitions, including equity investments. The amountsinclude the portion of our growth projects funded by contributions from our joint venture partners.
We believe that the following competitive strengths position us to continue to successfully executeour primary business strategy:
• Leading position in the liquids-rich areas of the northeast United States. Since our inception, wehave been the largest processor and fractionator in the northeast United States and we continue
10

to strengthen our position in this critical growth area that is driven by the development of theMarcellus, Huron/Berea, and Utica shale formations. Currently, our Northeast and Libertysegments have combined processing capacity in excess of 1.1 Bcf/d and combined fractionationcapacity of nearly 85,000 barrels per day, as well as an integrated NGL pipeline, storage andmarketing infrastructure. Our processing and fractionation capacity is supported by strategiclong-term agreements that include significant acreage dedications from key producers. Webelieve our significant presence and asset base provide us with a competitive advantage incapturing and contracting for new supplies of natural gas as the production from these shaleformations continues to be developed, particularly in the liquids-rich area of the region asevidenced by the recently announced development plans for the Utica Shale.
• Strategic and growing position with high-quality assets in the Southwest and the Gulf Coast. Ouracquisitions and internal growth projects since inception have allowed us to establish and expandour presence in several long-lived natural gas supply basins in the Southwest, particularly inTexas and Oklahoma. In late 2006, we expanded this strategy through our agreement withNewfield Exploration Mid-Continent Inc. (‘‘Newfield’’) by building the largest gathering systemto date in the Woodford Shale in southeast Oklahoma. We have continued this strategy throughthe current development of our gathering system in the Granite Wash area under a similararrangement with Newfield. All of our major acquisitions and growth projects in this region havebeen characterized by several common critical success factors that include:
• an existing strong competitive position;
• access to a significant reserve or customer base with a stable or growing production profile;
• ample opportunities for long-term continued organic growth;
• ready access to markets; and
• close proximity to other acquisition or expansion opportunities.
Specifically, our East Texas and Appleby gathering systems are located in the East Texas Basin,producing from or with direct access to the Cotton Valley, Pettit and Travis Peak reservoirs aswell as the Haynesville and Bossier Shales. Our Foss Lake gathering system and the associatedArapaho gas processing plants are located in the Anadarko Basin in Oklahoma and areconnected to the Granite Wash area in the Texas panhandle that is currently being developed asmentioned above. Additionally, as described above, our Woodford gathering system is located inthe Woodford Shale reservoir. Our gathering systems are relatively new and provide producerswith low-pressure and fuel-efficient service, a significant competitive advantage for us over manycompeting gathering systems in those areas.
Our Gulf Coast assets provide high quality processing and fractionation service to sixstrategically located gulf coast refineries that we believe will continue to play a key role insupporting the long-term U.S. demand for refined petroleum products.
• Long-term Contracts. We believe our long-term contracts, which we define as contracts withremaining terms of four years or more, lend greater stability to our cash flow profile. In EastTexas, approximately 43% of our current gathering volumes are under contract for longer than4 years as of December 31, 2011. Approximately 59% of our current daily throughput in theWestern Oklahoma gathering system and Arapaho processing plants are subject to contracts withremaining terms of more than 6 years. Approximately 93% of our throughput in the Woodfordgathering system is subject to contracts with remaining terms of more than 5 years. Also in theSouthwest segment, two of our lateral pipelines operate under fixed-fee contracts for thetransmission of natural gas that expire in approximately 9 and 17 years. In Appalachia, ournatural gas processing and NGL fractionation and exchange contracts with remaining terms of
11

20FEB201211131474
more than 4 years account for approximately 77% of our volumes, with 60% of volumes subjectto contracts with terms of at least 10 years. In the Gulf Coast segment, approximately 74% ofour volumes are under contract for more than 7 years. In the Liberty segment, all of our currentgathering and processing agreements with significant dedicated acreage have remaining terms ofat least 9 years.
• Experienced management with operational, technical and acquisition expertise. Each member of ourexecutive management team, whose interests are aligned with those of our common unitholders,has substantial experience in the energy industry. Our facility managers have extensiveexperience operating our facilities. Our operational and technical expertise has enabled us toupgrade our existing facilities, as well as to design and build new midstream infrastructurefacilities. Since our initial public offering in May 2002, our management team has utilized adisciplined approach to analyze and evaluate numerous acquisition opportunities, and hascompleted 13 acquisitions as of December 31, 2011, including the acquisition of thenon-controlling interest in MarkWest Liberty Midstream effective December 31, 2011.
Industry Overview
We provide services in the midstream sector of the natural gas industry which includes natural gasgathering, transportation, processing and fractionation. The following diagram illustrates the typicalnatural gas gathering, natural gas processing and NGL fractionation processes:
Raw NaturalGas Production
Gathering andCompression
ProcessingPlants
MixedNGLs
FractionationFacility
Interstate andIntrastate GasTransmission
Pipelines
Pipeline Quality Natural Gas toUtilities. Homeowners and Factories
NGL Products
Ethane
Propane
Normal Butane
Isobutane
Natural Gasoline
The natural gas production process begins with the drilling of wells into gas-bearing rockformations. The gathering process begins when a producing well is connected to a gathering system.Gathering systems typically consist of a network of small diameter pipelines and, if necessary,compression systems that collect natural gas from points near producing wells and transport it to largerpipelines for further transmission.
Historically, the majority of the domestic on-shore natural gas supply has been produced fromconventional reservoirs that are characterized by large pockets of natural gas that are accessedsuccessfully using vertical drilling techniques. In the past decade, the supply of natural gas productionfrom the conventional sources has declined as these reservoirs are being depleted. Due to advances inwell completion technology and horizontal drilling techniques, unconventional sources such as shale,tight sand and coal bed methane formations have become the most significant source of current andexpected future natural gas production.
Natural gas has a widely varying composition, depending on the field, the formation reservoir orfacility from which it is produced. The principal constituents of natural gas are methane and ethane.Most natural gas also contains varying amounts of heavier components, such as propane, butane,natural gasoline and inert substances that may be removed by any number of processing methods.
12

20FEB201211131648
Most natural gas produced at the wellhead is not suitable for long-haul pipeline transportation orcommercial use. It must be gathered, compressed and transported via pipeline to a central facility, andthen processed and treated. Natural gas processing and treating involves the separation of raw naturalgas into pipeline-quality natural gas, principally methane, and a mixed NGL stream, as well as theremoval of contaminants that may interfere with pipeline transportation or the end-use of the gas. Ourbusiness includes providing these services either for a fee or a percentage of the NGLs removed or gasunits processed. The industry as a whole is characterized by regional competition, based on theproximity of gathering systems and processing plants to producing natural gas wells, or to facilities thatproduce natural gas as a byproduct of refining crude oil. Due to the shift in the source of natural gasproduction, midstream providers with a significant presence in the emerging resource plays will likelyhave a competitive advantage.
We also provide processing and fractionation services to crude oil refineries in the Corpus Christi,Texas area through our Javelina gas processing and fractionation facility. While similar to the naturalgas industry discussion above, the natural gas delivered to our Javelina processing plant is a product ofthe crude oil refining process. The following diagram illustrates the significant gas processing andfractionation processes at the Javelina facility:
Off-Gasfrom Crude Oil
Refineries
Processing andTreating Facilities
FractionationFacility
Fuel Quality Natural Gas toRefinery Customers
NGL Products
Natural Gasoline
Hydrogen to RefineryCustomers
MixedNGLs
Carbon Dioxide, HydrogenSulfide, and OtherContaminants
EthanePropane
Other Products
EthylenePropylene
Mixed Butanes
The removal and separation of individual hydrocarbons and other constituents by processing ispossible because of differences in physical properties. Each component has a distinctive weight, boilingpoint, vapor pressure and other physical characteristics. Natural gas may also be diluted orcontaminated by water, sulfur compounds, carbon dioxide, nitrogen, helium or other components.
After being separated from natural gas at the processing plant, the mixed NGL stream is typicallytransported to a centralized facility for fractionation. Fractionation is the process by which NGLs arefurther separated into individual, more marketable components, primarily ethane, propane, normalbutane, isobutane and natural gasoline. Fractionation systems typically exist either as an integral part ofa gas processing plant or as a ‘‘central fractionator,’’ often located many miles from the primaryproduction and processing facility. A central fractionator may receive mixed streams of NGLs frommany processing plants.
Basic NGL products and their typical uses are discussed below. The basic products are sold in allof our segments except as noted.
• Ethane is used primarily as feedstock in the production of ethylene, one of the basic buildingblocks for a wide range of plastics and other chemical products.
Ethane is not currently recovered from the natural gas stream in our Northeast and Libertysegments. However, we are developing projects that would allow us to recover ethane andprovide our producer customers with access to markets for the ethane produced in the Liberty
13

segment, which are expected to begin operations in mid-2013. See Our Operating Segments—Liberty Segment below in this Item 1 for further discussion of our ethane solution.
• Propane is used for heating, engine and industrial fuels, agricultural burning and drying and as apetrochemical feedstock for the production of ethylene and propylene. Propane is principallyused as a fuel in our operating areas.
• Normal butane is mainly used for gasoline blending, as a fuel gas, either alone or in a mixturewith propane, and as a feedstock for the manufacture of ethylene and butadiene, a keyingredient of synthetic rubber.
• Isobutane is primarily used by refiners to enhance the octane content of motor gasoline.
• Natural gasoline is principally used as a motor gasoline blend stock or petrochemical feedstock.
The other primary products produced and sold from our Javelina facility are discussed below.
• Ethylene is primarily used in the production of a wide range of plastics and other chemicalproducts.
• Propylene is primarily used in manufacturing plastics, synthetic fibers and foams. It is also usedin the manufacture of polypropylene, which has a variety of end-uses including packaging film,carpet and upholstery fibers and plastic parts for appliances, automobiles, houseware andmedical products.
Our Operating Segments
We conduct our operations in the following operating segments: Southwest, Northeast, Liberty andGulf Coast. Our assets and operations in each of these segments are described below. In addition, weinclude a description of the initial planned development of the Utica segment.
Southwest Segment
• East Texas. We own a system in East Texas that consists of natural gas gathering pipelines,centralized compressor stations, a natural gas processing facility and an NGL pipeline. The EastTexas system is located in Panola, Harrison and Rusk Counties and services the Carthage Field.Producing formations in Panola County consist of the Cotton Valley, Pettit, Travis Peak andHaynesville formations. For natural gas that is processed in this area, we purchase the NGLsfrom the producers primarily under percent-of-proceeds arrangements or we transport volumesfor a fee.
Approximately 77% of our natural gas volumes in the East Texas System result from contractswith 6 producers in 2011. We sell substantially all of the purchased and retained NGLs producedat our East Texas processing facility to Targa Resources Partners, L.P. (‘‘Targa’’) under along-term contract. Such sales represent approximately 19.4% of our consolidated revenue in2011. The initial term of the Targa agreement expires in December 2015.
• Oklahoma. We own a natural gas gathering system in the Woodford Shale play in the ArkomaBasin of southeast Oklahoma. The liquids-rich natural gas gathered in the Woodford system isprocessed through Centrahoma Processing LLC (‘‘Centrahoma’’), our equity investment, or otherthird-party processors. In addition, we own the Foss Lake natural gas gathering system and theWestern Oklahoma natural gas processing complex, all located in Roger Mills, Beckham, Custerand Ellis Counties of western Oklahoma. The gathering portion consists of a pipeline systemthat is connected to natural gas wells and associated compression facilities. The majority of thegathered gas ultimately is compressed and delivered to the processing plants. We also own agathering system in the Granite Wash formation in Wheeler County in the Texas panhandle that
14
is connected to our Western Oklahoma processing complex. We completed the expansion of theWestern Oklahoma natural gas processing plant in October 2011, which increased our processingcapacity at the Western Oklahoma complex by 75 MMcf/d to a total of 235 MMcf/d. Thegathering and processing expansions are supported by long-term agreements with producercustomers.
Approximately 70% of our Oklahoma volumes result from contracts with 3 producers in 2011.We sell substantially all of the NGLs produced in the Western Oklahoma processing complex toONEOK Hydrocarbon L.P. (‘‘ONEOK’’) under a long-term contract. Such sales representapproximately 13.2% of our consolidated revenue in 2011. The initial term of the ONEOKagreement expires in October 2021.
Through our joint venture, MarkWest Pioneer, we operate the Arkoma Connector Pipeline, a50-mile FERC-regulated pipeline that interconnects with the Midcontinent Express Pipeline andGulf Crossing Pipeline at Bennington, Oklahoma and is designed to provide approximately638,000 Dth/d of Woodford Shale takeaway capacity. We plan to complete an additionalinterconnect with the NGPL Pipeline in Bennington, Oklahoma in April 2012. For a completediscussion of the formation of, and accounting treatment for, MarkWest Pioneer, see Note 4 ofthe accompanying Notes to Consolidated Financial Statements included in Item 8 of thisForm 10-K.
• Other Southwest. We own a number of natural gas gathering systems located in Texas, Louisiana,Mississippi and New Mexico, including the Appleby gathering system in Nacogdoches County,Texas. We gather a significant portion of the gas produced from fields adjacent to our gatheringsystems, including from wells targeting the Haynesville Shale. In many areas we are the primarygatherer, and in some of the areas served by our smaller systems we are the sole gatherer. Inaddition, we own four lateral pipelines in Texas and New Mexico. Our Hobbs, New Mexiconatural gas pipeline is subject to regulation by FERC.
The Other Southwest area does not have any customers that we consider to be significant to theSouthwest segment revenue or our consolidated revenue.
Northeast Segment
• Kentucky and southern West Virginia. Our Northeast segment assets include the Kenova,Boldman, Cobb, Kermit and Langley (acquired in the first quarter of 2011) natural gasprocessing plants, an NGL pipeline and the Siloam NGL fractionation plant. In connection withthe acquisition of the Langley processing plants, related facilities, and partially completedRanger pipeline, we completed the construction of the Ranger Pipeline to extend our existingNGL pipeline and connect the Langley Processing Facilities to our Siloam fractionation facility.We also plan to complete an additional cryogenic natural gas processing plant with a capacity of150 MMcf/d by the fourth quarter of 2012. In addition, we have two caverns for storing propaneat our Siloam facility and additional propane storage capacity under a long-term firm-capacityagreement with a third party. The Northeast segment operations include fractionation andmarketing services on behalf of the Liberty segment through the end of the third quarter 2011.Including our presence in the Marcellus shale (see Liberty Segment below), we are the largestprocessor and fractionator of natural gas in the Northeast, with fully integrated processing,fractionation, storage and marketing operations.
• Michigan. We own and operate a FERC-regulated crude oil pipeline in Michigan (‘‘MichiganCrude Pipeline’’) providing transportation service for three shippers.
15

The Northeast Segment has one customer that accounts for a significant portion of its segmentrevenue, but this customer does not account for a significant portion of our consolidatedrevenue.
Liberty Segment
• Marcellus Shale. We provide extensive natural gas midstream services in southwesternPennsylvania and northern West Virginia through MarkWest Liberty Midstream. With gatheringcapacity of 325 MMcf/d and current processing capacity of 625 MMcf/d, we are the largestprocessor of natural gas in the Marcellus Shale, with fully integrated gathering, processing,fractionation, storage and marketing operations that are critical to the liquids-rich gasdevelopment in the northeast United States.
The processing and fractionation facilities currently operating and under construction in ourLiberty segment include the following:
Processing
• 355 MMcf/d of current cryogenic processing capacity at our Houston Complex, whichincludes a 200 MMcf/d cryogenic plant that began operations in the second quarter of 2011.
• 270 MMcf/d of current cryogenic processing capacity at our Majorsville Complex, whichincludes a 135 MMcf/d cryogenic plant that began operations in the second quarter of 2011.
• 400 MMcf/d expansion of our Majorsville Complex, expected to commence operation in2013, bringing our total cryogenic processing capacity at Majorsville to 670 MMcf/d. TheMajorsville expansion includes two, 200 MMcf/d processing trains that are and will besupported by long-term agreements with CONSOL Energy, Noble Energy and RangeResources.
• 320 MMcf/d cryogenic processing capacity under construction in Mobley, West Virginia(‘‘Mobley Complex’’) where cryogenic plants with capacity of 120 MMcf/d and 200 MMcf/dare expected to be completed in the first and second half of 2012, respectively.
• 200 MMcf/d cryogenic processing capacity under construction at our Sherwood Complexthat is expected to be completed in the second half of 2012. We recently announced plansto expand the capacity at our Sherwood Complex with an additional 200 MMcf/d cryogenicprocessing plant that is expected to be completed in 2013. The expansion plans are based,in part, on a producer customer’s decision to support the additional capacity under a long-term processing agreement. The producer customer has publicly stated its intent to moveforward with the project but must make its final decision on whether to proceed with theadditional plant at the Sherwood Complex by July 1, 2012.
By the end of 2013, MarkWest Liberty Midstream is expected to have between 1.5 Bcf/d and1.7 Bcf/d of cryogenic processing capacity that is supported by long-term agreements with ourproducer customers. NGLs produced at the Majorsville Complex are delivered through an NGLpipeline (‘‘Majorsville Pipeline’’) to the Houston Complex for exchange for fractionated products.We also plan to complete an NGL pipeline connecting each of the planned processing facilities tothe Majorsville Pipeline allowing for fractionation at the Houston Complex. By the end of 2012,MarkWest Liberty Midstream expects to have approximately 100 miles of NGL transportationpipeline.
16
Fractionation and Market Outlets
• Existing fractionation facility at our Houston Complex with a design capacity of60,000 Bbl/d that was placed into service in the third quarter of 2011. Prior to thecompletion of the Houston fractionation facility, only propane was recovered at ourHouston Complex and further fractionation of the remaining portion of the NGL streamproduced at the Liberty processing plants was performed at the Siloam NGL fractionationplant in our Northeast segment.
• Existing interconnect with a key interstate pipeline providing a market outlet for thepropane produced from this region.
• Existing extension of our Majorsville Pipeline to receive NGLs produced at a third-party’sFort Beeler processing plant. This project allows certain producers to benefit from ourintegrated NGL fractionation and marketing operations.
• Railcar loading facility under construction at our Houston Complex that is expected to becompleted in the first half of 2012.
We continue to evaluate additional projects to expand our gathering, processing, fractionationand marketing operations in the Marcellus Shale.
Ethane Recovery and Associated Market Outlets
Due to the increased production of natural gas from the liquids-rich area of the MarcellusShale, natural gas processors must begin to recover a significant amount of ethane from the rawNGL stream to continue to meet the pipeline gas quality specifications for residue gas. We havebeen developing a solution that will have the capability to recover and fractionate the requiredethane, be scalable to recover and fractionate additional ethane at the option of our producercustomers and provide access to attractive ethane markets in North America and Europe. Theprimary components of our ethane recovery solution consist of the following:
• 75,000 Bbl/d de-ethanization facilities under construction at our Houston and MajorsvilleComplexes that are expected to be completed by mid-2013.
• A third de-ethanization facility is planned that would increase production capacity of purityethane to 115,000 Bbl/d by 2014.
• A joint pipeline project with Sunoco Logistics, L.P. (‘‘Sunoco’’) that is currently underconstruction to deliver Marcellus ethane to Sarnia, Ontario, Canada markets (‘‘MarinerWest’’). Mariner West will utilize new and existing pipelines and is anticipated to have aninitial capacity to transport up to 50,000 Bbl/d of ethane by mid-2013 with the ability toexpand to support higher volumes as needed. Sunoco completed an open season forMariner West and received binding commitments from shippers that would enable theproject to proceed as designed.
• An additional joint project with Sunoco is under consideration (‘‘Mariner East’’). MarinerEast, a pipeline and marine project, is intended to deliver Marcellus purity ethane to theGulf Coast and international markets. Mariner East is anticipated to have initial capacity totransport up to 50,000 Bbl/d of ethane.
We continue to evaluate additional projects that would support a comprehensive ethanesolution for producers in the Marcellus Shale.
The majority of the volumes currently processed in the Liberty segment result from contracts with threeproducers. The resulting NGLs are sold to numerous customers in the northeast United States. There
17

is one individual customer that we consider to be significant to the Liberty segment revenue but not toour consolidated revenue.
Utica Segment
Effective January 1, 2012, MarkWest and EMG formed MarkWest Utica EMG, a joint venturefocused on the development of significant natural gas processing and NGL fractionation,transportation and marketing infrastructure to serve producers’ drilling programs in the Utica shalein eastern Ohio. The first phase of the Utica development plan includes two new processingcomplexes and a 100,000 Bbl/d fractionation, storage, and marketing facility. The initial processingcomplex will be in Harrison County (‘‘Harrison Complex’’), and is expected to begin initialoperations in mid-2013. MarkWest is finalizing the design capacity and the location of the secondprocessing complex, which is also expected to begin operations in 2013.
Both processing complexes are expected to be connected via an NGL pipeline system to thefractionation facilities at the Harrison Complex that is expected to be operational in 2013. Creatinga large network of processing complexes connected through an extensive NGL gathering systemhas been critical to the full development of the Marcellus, and the announced Ohio facilitiesrepresent the first major step in providing Utica producers with the same benefits. Additionally,the Harrison Complex fractionation facilities, which would be able to market NGLs by truck, railand pipeline, is expected to be connected to our extensive processing and NGL pipeline network inour Liberty segment and provide for the integrated operation of the two largest fractionationcomplexes in the Northeastern United States.
The Utica Segment did not have any assets, liabilities, equity or operations as of, or for theyear ending, December 31, 2011. As such, it is not considered a reportable segment as described inNote 24 of the accompanying Notes to the Consolidated Financial Statements included in Item 8of this Form 10-K.
Gulf Coast Segment
• Javelina. We own and operate the Javelina processing facility, a natural gas processingfacility in Corpus Christi, Texas that treats and processes off-gas from six local refineriesoperated by three different refinery customers. We have a product supply agreementcreating a long-term contractual obligation for the payment of processing fees in exchangefor all of the product processed by the SMR (see Note 5 of the accompanying Notes toConsolidated Financial Statements for further discussion of this agreement and the relatedSMR Transaction). The product received under this agreement is sold to a refinerycustomer pursuant to a corresponding long-term agreement.
The following summarizes the percentage of our revenue and net operating margin (a non-GAAPfinancial measure, see Non-GAAP Measures discussion below) generated by our assets, by segment, forthe year ended December 31, 2011:
Southwest Northeast Liberty Gulf Coast Total
Revenue . . . . . . . . . . . . . . . . . . . . . 60% 17% 16% 7% 100%Net operating margin . . . . . . . . . . . . 49% 20% 19% 12% 100%
For further financial information regarding our segments, see Item 7. Management’s Discussionand Analysis of Financial Condition and Results of Operations and Item 8. Financial Statements andSupplementary Data included in this Form 10-K.
18

Equity Investment in Unconsolidated Affiliate
We own a 40% non-operating membership interest in Centrahoma, a joint venture with CardinalMidstream, LLC (‘‘Cardinal’’) that is accounted for using the equity method. Centrahoma owns certainprocessing plants in the Arkoma Basin and Cardinal operates an additional processing plant that is notowned by Centrahoma but is located adjacent to and operates in conjunction with the Centrahomaplants. We have signed long-term agreements to dedicate the processing rights for our natural gasgathering system in the Woodford Shale to Centrahoma and to Cardinal’s independently ownedprocessing facility. The financial results for Centrahoma are included in Earnings from unconsolidatedaffiliates and are not included in our segment results.
Our Contracts
We generate the majority of our revenues and net operating margin (a non-GAAP financialmeasure, see Non-GAAP Measures below for discussion and reconciliation of net operating margin)from natural gas gathering, transportation and processing; NGL transportation, fractionation, exchange,marketing and storage; and crude oil gathering and transportation. We enter into a variety of contracttypes. In many cases, we provide services under contracts that contain a combination of more than oneof the arrangements described below. We provide services under the following types of arrangements:
• Fee-based arrangements: Under fee-based arrangements, we receive a fee or fees for one or moreof the following services: gathering, processing and transportation of natural gas; transportation,fractionation, exchange, marketing and storage of NGLs; and gathering and transportation ofcrude oil. The revenue we earn from these arrangements is generally directly related to thevolume of natural gas, NGLs or crude oil that flows through our systems and facilities and is notdirectly dependent on commodity prices. If a sustained decline in commodity prices were toresult in a decline in volumes, however, our revenues from these arrangements would bereduced. In certain cases, our arrangements provide for minimum annual payments, fixeddemand charges or fixed returns on gathering system expenditures.
• Percent-of-proceeds arrangements: Under percent-of-proceeds arrangements, we gather andprocess natural gas on behalf of producers, sell the resulting residue gas, condensate and NGLsat market prices and remit to producers an agreed-upon percentage of the proceeds. In othercases, instead of remitting cash payments to the producer, we deliver an agreed-upon percentageof the residue gas and NGLs to the producer and sell the volumes we keep to third parties atmarket prices. The percentage of volumes that we retain can be either fixed or variable.Generally, under these types of arrangements, our revenues and gross margins increase asnatural gas, condensate and NGL prices increase and our revenues and net operating marginsdecrease as natural gas, condensate and NGL prices decrease.
• Percent-of-index arrangements: Under percent-of-index arrangements, we purchase natural gas ateither (i) a percentage discount to a specified index price, (ii) a specified index price less a fixedamount or (iii) a percentage discount to a specified index price less an additional fixed amount.We then gather and deliver the natural gas to pipelines where we resell the natural gas at theindex price, or at a different percentage discount to the index price. With respect to (i) and(iii) above, the net operating margins we realize under the arrangements decrease in periods oflow natural gas prices because these net operating margins are based on a percentage of theindex price. Conversely, our net operating margins increase during periods of high natural gasprices.
• Keep-whole arrangements: Under keep-whole arrangements, we gather natural gas for theproducer, process the natural gas and sell the resulting condensate and NGLs to third parties atmarket prices. Because the extraction of NGLs from the natural gas during processing reducesthe Btu content of the natural gas, we must either purchase natural gas at market prices for
19

return to producers or make cash payment to the producers equal to the energy content of thisnatural gas. Certain keep-whole arrangements also have provisions that require us to share apercentage of the keep-whole profits with the producers based on the oil to gas ratio or therelative price of NGLs to natural gas. Accordingly, under these arrangements our revenues andnet operating margins increase as the price of condensate and NGLs increases relative to theprice of natural gas and decrease as the price of natural gas increases relative to the price ofcondensate and NGLs.
• Settlement margin: Typically, we are allowed to retain a fixed percentage of the volume gatheredto cover the compression fuel charges and deemed-line losses. To the extent that we operate ourgathering systems more or less efficiently than specified per contract allowance, we retain thebenefit or loss for our own account.
The terms of our contracts vary based on gas quality conditions, the competitive environment whenthe contracts are signed and customer requirements. Our contract mix and, accordingly, our exposureto natural gas and NGL prices, may change as a result of changes in producer preferences, ourexpansion in regions where some types of contracts are more common and other market factors,including current market and financial conditions which have increased the risk of volatility in oil,natural gas and NGL prices. Any change in mix may influence our long-term financial results.
Non-GAAP Measures
In evaluating the Partnership’s financial performance, management utilizes the segmentperformance measures, segment revenues and operating income before items not allocated to segments.These financial measures are presented in Note 24 to the accompanying condensed consolidatedfinancial statements and are considered non-GAAP financial measures when presented outside of thenotes to the condensed consolidated financial statements. The use of these measures allows investors tounderstand how management evaluates financial performance to make operating decisions and allocateresources. See Note 24 to the accompanying condensed consolidated financial statements for thereconciliations of segment revenue and operating income before items not allocated to segments to therespective most comparable GAAP measure.
Management evaluates contract performance on the basis of net operating margin (a non-GAAPfinancial measure), which is defined as revenue, excluding any derivative gain (loss), less purchasedproduct costs, excluding any derivative gain (loss). These charges have been excluded for the purposeof enhancing the understanding by both management and investors of the underlying baseline operatingperformance of our contractual arrangements, which management uses to evaluate our financialperformance for purposes of planning and forecasting. Net operating margin does not have anystandardized definition and, therefore, is unlikely to be comparable to similar measures presented byother reporting companies. Net operating margin results should not be evaluated in isolation of, or as asubstitute for, our financial results prepared in accordance with GAAP. Our use of net operatingmargin and the underlying methodology in excluding certain charges is not necessarily an indication ofthe results of operations expected in the future, or that we will not, in fact, incur such charges in futureperiods.
20

The following is a reconciliation of net operating margin to income (loss) from operations, themost comparable GAAP financial measure of this non-GAAP financial measure (in thousands):
Year ended December 31,
2011 2010 2009
Segment revenue . . . . . . . . . . . . . . . . . . . . . . . . $1,549,819 $1,241,563 $ 858,635Purchased product costs . . . . . . . . . . . . . . . . . . . (682,370) (578,627) (408,826)
Net operating margin . . . . . . . . . . . . . . . . . . . 867,449 662,936 449,809Facility expenses . . . . . . . . . . . . . . . . . . . . . . . . . (173,598) (151,449) (126,977)Derivative loss . . . . . . . . . . . . . . . . . . . . . . . . . . (75,515) (80,350) (188,862)Revenue deferral adjustment . . . . . . . . . . . . . . . . (15,385) — —Selling, general and administrative expenses . . . . . (81,229) (75,258) (63,728)Depreciation . . . . . . . . . . . . . . . . . . . . . . . . . . . (149,954) (123,198) (95,537)Amortization of intangible assets . . . . . . . . . . . . . (43,617) (40,833) (40,831)Loss on disposal of property, plant and
equipment . . . . . . . . . . . . . . . . . . . . . . . . . . . (8,797) (3,149) (1,677)Accretion of asset retirement obligations . . . . . . . (1,190) (237) (198)Impairment of goodwill and long-lived assets . . . . — — (5,855)
Income (loss) from operations . . . . . . . . . . . . . $ 318,164 $ 188,462 $ (73,856)
The following table does not give effect to our active commodity risk management program. Forfurther discussion of how we have reduced the downside volatility to the portion of our net operatingmargin that is not fee-based, see Note 6 of the accompanying Notes to the Consolidated FinancialStatements included in Item 8 of this Form 10-K. For the year ended December 31, 2011, we calculatedthe following approximate percentages of our revenue and net operating margin from the followingtypes of contracts:
Percent-of- Percent-of- Keep-Fee-Based Proceeds(1) Index(2) Whole(3) Total
Revenue . . . . . . . . . . . . . . . . . . . 21% 38% 4% 37% 100%Net operating margin(4) . . . . . . . 38% 29% 0% 33% 100%
(1) Includes condensate sales and other types of arrangements tied to NGL prices.
(2) Includes arrangements tied to natural gas prices.
(3) Includes condensate sales and other types of arrangements tied to both NGL and naturalgas prices.
(4) We manage our business by taking into account the partial offset of short natural gaspositions by long positions primarily in our Southwest segment. The calculatedpercentages for the net operating margin for percent-of-proceeds, percent-of-index andkeep-whole contracts reflect the partial offset of our natural gas positions.
Competition
In each of our operating segments, we face competition for natural gas gathering and crude oiltransportation and in obtaining natural gas supplies for our processing and related services; in obtainingunprocessed NGLs for fractionation; and in marketing our products and services. Competition fornatural gas supplies is based primarily on the location of gas-gathering facilities and gas-processingplants, operating efficiency and reliability and the ability to obtain a satisfactory price for productsrecovered. Competitive factors affecting our fractionation services include availability of capacity,
21

proximity to supply and industry marketing centers and cost efficiency and reliability of service.Competition for customers to purchase our natural gas and NGLs is based primarily on price, deliverycapabilities, flexibility and maintenance of high-quality customer relationships.
Our competitors include:
• a large number of natural gas midstream providers, of varying financial resources andexperience, that gather, process and market natural gas and NGLs;
• major integrated oil companies;
• medium and large sized independent exploration and production companies;
• major interstate and intrastate pipelines; and
Some of our competitors operate as master limited partnerships and may enjoy a cost of capitalcomparable to and, in some cases, lower than ours. Other competitors, such as major oil and gas andpipeline companies, have capital resources and contracted supplies of natural gas substantially greaterthan ours. Smaller local distributors may enjoy a marketing advantage in their immediate service areas.
We believe that our customer focus in all segments, demonstrated by our ability to offer anintegrated package of services and our flexibility in considering various types of contractualarrangements, allows us to compete more effectively. Additionally, we have critical connections to thekey market outlets for NGLs and natural gas in each of our segments. In the Southwest segment, ourmajor gathering systems are relatively new, are located primarily in the heart of shale plays withsignificant growth opportunities and provide producers with low-pressure and fuel-efficient service,which differentiates us from many competing gathering systems in those areas. In the Northeastsegment, our operational experience of more than 20 years as the largest processor and fractionator inthe region and our existing presence in the Appalachian Basin provide a significant competitiveadvantage. In the Liberty segment, our early entrance in the liquids-rich corridor of the MarcellusShale through our strategic gathering and processing agreements with key producers enhances ourcompetitive position to participate in the further development of the Marcellus Shale and thedevelopment of the Utica Shale. In our Gulf Coast segment, the strategic location of our assets and thelong-term nature of our contracts provide a significant competitive advantage.
Seasonality
Our business is affected by seasonal fluctuations in commodity prices. Sales volumes also areaffected by various other factors such as fluctuating and seasonal demands for products, changes intransportation and travel patterns and variations in weather patterns from year to year. Our Northeastsegment is particularly impacted by seasonality. In our Northeast segment operations, we store aportion of the propane that is produced in the summer to be sold in the winter months. As a result ofour seasonality, we generally expect the sales volumes in our Northeast segment to be higher in thefirst quarter and fourth quarter. These seasonal factors also impact our Liberty segment; however, theexpected growth and expansion in our Liberty segment may counteract this seasonality impact.
Regulatory Matters
Our operations are subject to extensive regulations. The failure to comply with applicable laws andregulations or to obtain, maintain and comply with requisite permits and authorizations can result insubstantial penalties and other costs to the Partnership. The regulatory burden on our operationsincreases our cost of doing business and, consequently, affects our profitability. However, we do notbelieve that we are affected in a significantly different manner by these laws and regulations than areour competitors. Due to the myriad of complex federal, state, provincial and local regulations that may
22

affect us, directly or indirectly, reliance on the following discussion of certain laws and regulationsshould not be considered an exhaustive review of all regulatory considerations affecting our operations.
FERC-Regulated Natural Gas Pipelines. Our natural gas pipeline operations are subject to federal,state and local regulatory authorities. Specifically, our Hobbs, New Mexico natural gas pipeline and ourArkoma Connector natural gas pipeline in Oklahoma are subject to regulation by FERC, and it ispossible that we may construct additional gas pipelines in the future that may be subject to suchregulation. Federal regulation extends to various matters including:
• rates and rate structures;
• return on equity;
• recovery of costs;
• the services that our regulated assets are permitted to perform;
• the acquisition, construction, expansion, operation and disposition of assets;
• Affiliate interactions; and
• to an extent, the level of competition in that regulated industry.
Under the Natural Gas Act (‘‘NGA’’), FERC has authority to regulate natural gas companies thatprovide natural gas pipeline transportation services in interstate commerce. Its authority to regulatethose services includes the rates charged for the services, terms and conditions of service, certificationand construction of new facilities, the extension or abandonment of services and facilities, themaintenance of accounts and records, the acquisition and disposition of facilities, the initiation anddiscontinuation of services and various other matters. Natural gas companies may not charge rates thathave been determined not to be just and reasonable by FERC. In addition, FERC prohibits FERCregulated natural gas facilities from unduly preferring, or unduly discriminating against, any person withrespect to pipeline rates or terms and conditions of service or other matters. The rates and terms andconditions for our service will be found in FERC-approved tariffs. Pursuant to FERC’s jurisdiction overrates, existing rates may be challenged by complaint and proposed rate increases may be challenged byprotest. We cannot be assured that FERC will continue to pursue its approach of pro-competitivepolicies as it considers matters such as pipeline rates and rules and policies that may affect rights ofaccess to natural gas transportation capacity and transportation facilities. Any successful complaint orprotest against our rates or loss of market-based rate authority by FERC could have an adverse impacton our revenues associated with providing interstate gas transportation services.
Energy Policy Act of 2005. On August 8, 2005, President Bush signed into law the Domenici-Barton Energy Policy Act of 2005 (‘‘2005 EPAct’’). Under the 2005 EPAct, FERC may impose civilpenalties of up to $1,000,000 per day for each current violation of the NGA or the Natural Gas PolicyAct of 1978. The 2005 EPAct also amends the NGA to add an anti-market manipulation provision,which makes it unlawful for any entity to engage in prohibited behavior in contravention of rules andregulations to be prescribed by FERC. FERC issued Order No. 670 to implement the anti-marketmanipulation provision of 2005 EPAct. This order makes it unlawful for gas pipelines and storagecompanies that provide interstate services to: (i) directly or indirectly, to use or employ any device,scheme or artifice to defraud in connection with the purchase or sale of natural gas subject to thejurisdiction of FERC, or the purchase or sale of transportation services subject to the jurisdiction ofFERC; (ii) make any untrue statement of material fact or omit to make any such statement necessaryto make the statements made not misleading; or (iii) engage in any act or practice that operates as afraud or deceit upon any person. The anti-market manipulation rule and enhanced civil penaltyauthority reflect an expansion of FERC’s enforcement authority.
23

Standards of Conduct. On October 16, 2008, FERC issued new standards of conduct fortransmission providers (Order 717) to regulate the manner in which interstate natural gas pipelines mayinteract with their marketing affiliates based on an employee separation approach. A ‘‘TransmissionProvider’’ includes an interstate natural gas pipeline that provides open access transportation pursuantto FERC’s regulations. Under these rules, a Transmission Provider’s transmission function employees(including the transmission function employees of any of its affiliates) must function independentlyfrom the Transmission Provider’s marketing function employees (including the marketing functionemployees of any of its affiliates). FERC issued Order 717-A, an order on rehearing and clarification ofOrder 717, on October 15, 2009. FERC further clarified Order 717-A in a rehearing order,Order 717-B, on November 16, 2009, in Order 717-C, on April 16, 2010, and in Order 717-D, onApril 8, 2011. However, Orders 717-B, 717-C, and 717-D did not substantively alter the rulespromulgated under Orders 717 and 717-A.
Market Transparency Rulemakings. In 2007, FERC issued Order 704, whereby wholesale buyersand sellers of more than 2.2 million MMBtu of physical natural gas in the previous calendar year,including interstate and intrastate natural gas pipelines, natural gas gatherers, natural gas processorsand natural gas marketers, are now required to report, on May 1 of each year beginning in 2009,aggregate volumes of natural gas purchased or sold at wholesale in the prior calendar year to theextent such transactions utilize, contribute to or may contribute to the formation of price indices. It isthe responsibility of the reporting entity to determine which transactions should be reported based onthe guidance of Order 704. Order 704 requires most, if not all of our natural gas pipelines to reportannual volumes of relevant transactions to FERC.
Intrastate Natural Gas Pipeline Regulation. Some of our intrastate gas pipeline facilities are subjectto various state laws and regulation that affect the rates we charge and terms of service. Although stateregulation is typically less onerous than FERC, state regulation typically requires pipelines to chargejust and reasonable rates and to provide service on a non-discriminatory basis. The rates and service ofan intrastate pipeline generally are subject to challenge by complaint.
Additional proposals and proceedings that might affect the natural gas industry are pending beforeCongress, FERC and the courts. We cannot predict the ultimate impact of these or the aboveregulatory changes to our natural gas operations. We do not believe that we would be affected by anysuch FERC action materially differently than other midstream natural gas companies with whom wecompete.
Natural Gas Gathering Pipeline Regulation. Section 1(b) of the NGA exempts natural gasgathering facilities from the jurisdiction of FERC if the primary function of the facilities is gatheringnatural gas. We own a number of facilities that we believe meet the traditional tests FERC has used toestablish a pipeline’s status as a gatherer not subject to FERC jurisdiction. We cannot provideassurance, however, that FERC will not at some point assert that transportation on these facilities iswithin its jurisdiction or that such an assertion would not adversely affect our results of operations. Insuch a case, we would be required to file a tariff with FERC and provide a cost justification for thetransportation charge.
In the states in which we operate, regulation of gathering facilities and intrastate pipeline facilitiesgenerally includes various safety, environmental and, in some circumstances, open access,nondiscriminatory take requirement and complaint-based rate regulation. For example, some of ournatural gas gathering facilities are subject to state ratable take and common purchaser statutes andregulations. Ratable take statutes and regulations generally require gatherers to take, without unduediscrimination, natural gas production that may be tendered to the gatherer for handling. Similarly,common purchaser statutes and regulations generally require gatherers to purchase gas without unduediscrimination as to source of supply or producer. These statutes are designed to prohibitdiscrimination in favor of one producer over another producer or one source of supply over another
24

source of supply. Although state regulation is typically less onerous than at FERC, these statutes andregulations have the effect of restricting our right as an owner of gathering facilities to decide withwhom we contract to purchase or transport natural gas.
Natural gas gathering may receive greater regulatory scrutiny at both the state and federal levelsnow that FERC has taken a less stringent approach to regulation of the gathering activities of interstatepipeline transmission companies and a number of such companies have transferred gathering facilitiesto unregulated affiliates. Our gathering operations could be adversely affected should they be subject inthe future to the application of state or federal regulation of rates and services or regulated as a publicutility. Our gathering operations also may be or become subject to safety and operational regulationsand permitting relating to the design, siting, installation, testing, construction, operation, replacementand management of gathering facilities. Additional rules and legislation pertaining to these matters areconsidered or adopted from time to time. We cannot predict what effect, if any, such changes mighthave on our operations, but the industry could be required to incur additional capital expenditures andincreased costs depending on future legislative and regulatory changes.
NGL Gathering Pipelines. Several of our NGL gathering pipelines carry NGLs across state lines;however, we do not operate these pipelines as common carrier pipelines or hold them out for serviceto the public because there are no third-party shippers on the pipelines and we do not expect third-party shippers to seek to use these NGL pipelines. Accordingly, we believe these pipelines would meetthe qualifications for a waiver from FERC’s applicable regulatory requirements. We cannot, however,provide assurance that FERC will not, at some point, either at the request of other entities or on itsown initiative, assert that some or all of such transportation is within its jurisdiction or that such anassertion would not adversely affect our results of operations. In the event FERC were to determinethat these NGL pipelines would not qualify for a waiver from FERC’s applicable regulatoryrequirements, we would likely be required to file a tariff with FERC, provide a cost justification for thetransportation charge and provide service to all potential shippers without undue discrimination. Wealso may elect to construct one or more common carrier NGL product pipelines to transport NGLproducts for third-party shippers across state lines or otherwise in interstate commerce, in which eventwe would be required to comply with FERC requirements for such common carrier pipelines, includingthe filing of a tariff. Our NGL pipelines are subject to safety regulation by the Department ofTransportation under 49 C.F.R. Part 195 for operators of hazardous liquid pipelines. Our NGLgathering pipelines and operations may also be or become subject to state public utility or relatedjurisdiciton which could impose additional safety and operational regulations relating to the design,siting, installation, testing, construction, operation, replacement and management of NGL gatheringfacilities.
Propane Regulation. National Fire Protection Association Pamphlets No. 54 and No. 58, whichestablish rules and procedures governing the safe handling of propane or comparable regulations, havebeen adopted as the industry standard in all of the states in which we operate. In some states theselaws are administered by state agencies and in others they are administered on a municipal level. Withrespect to the transportation of propane by truck, we are subject to regulations promulgated under theFederal Motor Carrier Safety Act. These regulations cover the transportation of hazardous materialsand are administered by the DOT. We conduct ongoing training programs to help ensure that ouroperations are in compliance with applicable regulations. We maintain various permits that arenecessary to operate our facilities, some of which may be material to our propane operations. Webelieve that the procedures currently in effect at all of our facilities for the handling, storage anddistribution of propane are consistent with industry standards and are in compliance in all materialrespects with applicable laws and regulations.
Common Carrier Crude Pipeline Operations. Our Michigan Crude Pipeline is a crude oil pipelinethat is a common carrier and subject to regulation by FERC under the October 1, 1977 version of the
25

Interstate Commerce Act (‘‘ICA’’) and the Energy Policy Act of 1992 (‘‘EPAct 1992’’). The ICA and itsimplementing regulations give FERC authority to regulate the rates charged for service on theinterstate common carrier liquids pipelines and generally require the rates and practices of interstateliquids pipelines to be just and reasonable and nondiscriminatory. The ICA also requires thesepipelines to keep tariffs on file with FERC that set forth the rates the pipeline charges for providingtransportation services and the rules and regulations governing these services. EPAct 1992 and itsimplementing regulations allow interstate common carrier oil pipelines to annually index their rates upto a prescribed ceiling level. FERC retains cost-of-service ratemaking, market-based rates andsettlement rates as alternatives to the indexing approach.
On February 24, 2009, we filed to increase our rates on the Michigan Crude Pipeline, effectiveApril 1, 2009, to incorporate index increases that were not fully taken over the prior three yearsbecause of a previously effective settlement that had since expired. FERC rejected the filing and denieda request for rehearing. We filed an appeal of FERC’s decision at the Court of Appeals for the Districtof Columbia Circuit. On July 1, 2011, the Court denied our petition for review of the FERC’s decision.
On July 30, 2010, we made a cost-of-service filing at FERC to increase our rates for transportationon the Michigan Crude Pipeline. Several parties protested this filing and on August 31, 2010, FERCaccepted the filing, effective September 1, 2010, subject to refund. FERC also established a hearing toinvestigate the issues raised by the protestors, but ordered the hearing to be held in abeyance pendingthe result of settlement discussions between the parties. On July 25, 2011, the parties submitted anoffer of settlement to FERC in this proceeding and on December 16, 2011, FERC issued an orderaccepting that settlement. MarkWest began charging the settlement rates effective August 1, 2011 andexpects to pay refunds related to the initial filing once the FERC’s December 2011 order becomes finaland is no longer subject to appeal.
Environmental Matters
General.
Our processing and fractionation plants, pipelines and associated facilities are subject to multipleobligations and potential liabilities under a variety of stringent and comprehensive federal, state andlocal laws and regulations governing discharges of materials into the environment or otherwise relatingto environmental protection. Such laws and regulations affect many aspects of our present and futureoperations, such as requiring the acquisition of permits or other approvals to conduct regulatedactivities that may impose burdensome conditions or potentially cause delays, restricting the manner inwhich we handle or dispose of our wastes, limiting or prohibiting activities in environmentally sensitiveareas such as wetlands or areas inhabited by endangered species, requiring us to incur capital costs toconstruct, maintain and upgrade equipment and facilities, restricting the locations in which we mayconstruct our compressor stations and other facilities or requiring the relocation of existing stations andfacilities and requiring remedial actions to mitigate pollution caused by our operations or attributableto former operations. Failure to comply with these stringent and comprehensive requirements mayexpose us to the assessment of administrative, civil and criminal penalties, the imposition of remedialrequirements and the issuance of orders enjoining or limiting some or all of our operations.
We believe that our operations and facilities are in substantial compliance with applicableenvironmental laws and regulations and that the cost of continued compliance with such laws andregulations will not have a material adverse effect on our results of operations or financial condition.We cannot assure, however, that existing environmental laws and regulations will not be reinterpretedor revised or that new laws and regulations will not be adopted or become applicable to us. The trendin environmental law is to place more restrictions and limitations on activities that may be perceived toaffect the environment. Thus there can be no assurance as to the amount or timing of futureexpenditures for compliance with environmental laws and regulations, permits and permitting
26

requirements, or remediation pursuant to such laws and regulations, and actual future expendituresmay be different from the amounts we currently anticipate. Revised or additional environmentalrequirements that result in increased compliance costs or additional operating restrictions, particularlyif those costs are not fully recoverable from our customers, could have a material adverse effect on ourbusiness, financial condition, results of operations and cash flow. We may not be able to recover someor any of these costs from insurance. Such revised or additional environmental requirements may alsoresult in material delays in the construction or expansion of our facilities, which may materially impactour ability to meet our construction obligations with our producer customers.
Hazardous Substance and Waste.
To a large extent, the environmental laws and regulations affecting our operations relate to therelease of hazardous substances or solid wastes into soils, groundwater and surface water and includemeasures to control pollution of the environment. For instance, the Comprehensive EnvironmentalResponse, Compensation, and Liability Act, as amended, or CERCLA, also known as the ‘‘Superfund’’law, and comparable state laws impose liability without regard to fault or the legality of the originalconduct on certain classes of persons. These persons include current and prior owners or operators of asite where a release occurred and companies that transported or disposed or arranged for the off-sitetreatment or disposal of the hazardous substances found at the site. Under CERCLA, these personsmay be subject to strict and, under certain circumstances, joint and several liability for the costs ofremoving or remediating hazardous substances that have been released into the environment, forrestoration costs and damages to natural resources and for the costs of certain health studies.Additionally, it is not uncommon for neighboring landowners and other third parties to file claims forpersonal injury and property damage allegedly caused by hazardous substances or other pollutantsreleased into the environment. While we generate materials in the course of our operations that aredefined as hazardous substances under CERCLA or similar state statutes, we do not believe that wehave any current material liability for cleanup costs under such laws, or for third party claims orpersonal injury or property damage. We also may incur liability under the Resource Conservation andRecovery Act, as amended, or RCRA, and comparable state statutes, which impose requirementsrelating to the handling and disposal of hazardous wastes and nonhazardous solid wastes. Under theauthority of the EPA, most states administer some or all of the provisions of the RCRA, sometimes inconjunction with their own, more stringent requirements. We are not currently required to comply witha substantial portion of the RCRA requirements because our operations generate minimal quantities ofhazardous wastes. However, it is possible that some wastes generated by us that are currently classifiedas nonhazardous may in the future be designated as hazardous wastes, resulting in the wastes beingsubject to more rigorous and costly transportation, storage, treatment and/or disposal requirements.
We currently own or lease, and have in the past owned or leased, properties that have been usedover the years for natural gas gathering, processing and transportation, for NGL fractionation or forthe storage, gathering and transportation of crude oil. Although solid waste disposal practices withinthe NGL industry and other oil and natural gas related industries have improved over the years, apossibility exists that petroleum hydrocarbons and other nonhazardous wastes or hazardous wastes mayhave been disposed of on or under various properties owned or leased by us during the operatinghistory of those facilities. In addition, a number of these properties may have been operated by thirdparties whose treatment and disposal or release of petroleum hydrocarbons or other wastes was notunder our control. These properties and wastes disposed thereon may be subject to CERCLA, RCRAand analogous state laws. Under these laws, we could be required to remove or remediate previouslydisposed wastes or property contamination, including groundwater contamination or to performremedial operations to prevent future contamination. We do not believe that there presently existssignificant surface and subsurface contamination of our properties by petroleum hydrocarbons or othersolid wastes for which we are currently responsible.
27
Ongoing Remediation and Indemnification from Third Parties.
The prior third-party owner or operator of our Cobb, Boldman, Kenova, and Majorsville facilities,who is also the prior owner and current operator of the Kermit facility, has been, or is currentlyinvolved in, investigatory or remedial activities with respect to the real property underlying thesefacilities. These investigatory and remedial obligations arise out of a September 1994 ‘‘AdministrativeOrder by Consent for Removal Actions’’ with EPA Regions II, III, IV and V; and with respect to theBoldman facility, an ‘‘Agreed Order’’ entered into by the third-party owner/operator with the KentuckyNatural Resources and Environmental Protection Cabinet in October 1994. The third party hasaccepted sole liability and responsibility for, and indemnifies us against, any environmental liabilitiesassociated with the EPA Administrative Order, the Kentucky Agreed Order or any other environmentalcondition related to the real property prior to the effective dates of our lease or purchase of the realproperty. In addition, the third party has agreed to perform all the required response actions at itsexpense in a manner that minimizes interference with our use of the properties. We understand that todate, all actions required under these agreements have been or are being performed and, accordingly,we do not believe that the remediation obligation of these properties will have a material adverseimpact on our financial condition or results of operations.
In addition, the prior third-party owner and/or operator of certain facilities on the real property onwhich our rail facility is being constructed near Houston, Pennsylvania has been, or is currentlyinvolved in, investigatory or remedial activities related to acid mine drainage (‘‘AMD’’) with respect tothe real property underlying these facilities. These investigatory and remedial obligations arise out of anarrangement entered into between the Pennsylvania Department of Environmental Protection and thethird party, which has accepted liability and responsibility for, and indemnifies us against, anyenvironmental liabilities associated with the AMD that are not exacerbated by us in connection withour operations. In addition, the third party has agreed to perform all of the required response actionsat its expense in a manner that minimizes interference with our use of the property. We understandthat to date, all actions required under these agreements have been or are being performed and,accordingly, we do not believe that the remediation obligation of these properties will have a materialadverse impact on our financial condition or results of operations.
Water Discharges.
The Federal Water Pollution Control Act of 1972, as amended, also known as the ‘‘Clean WaterAct,’’ and analogous state laws impose restrictions and controls on the discharge of pollutants intofederal and state waters. Such discharges are prohibited, except in accord with the terms of a permitissued by the EPA or the analogous state agency. Spill prevention, control and countermeasurerequirements under federal law require appropriate containment berms and similar structures to helpprevent the contamination of navigable waters in the event of a hydrocarbon tank spill, rupture or leak.Any unpermitted release of pollutants, including oil, natural gas liquids or condensates, could result inpenalties as well as significant remedial obligations. In addition, the Clean Water Act and analogousstate law may also require individual permits or coverage under general permits for discharges ofstormwater from certain types of facilities, but these requirements are subject to several exemptionsspecifically related to oil and gas operations and facilities. We conduct regular review of the applicablelaws and regulations, and maintain discussions with the various federal, state and local agencies withregard to the application of those laws and regulations to our facilities, including the permitting processand categories of applicable permits for stormwater or other discharges, stream crossings and wetlanddisturbances that may be required for the construction or operation of certain of our facilities in thevarious states. We believe that we are in substantial compliance with the Clean Water Act andanalogous state laws. However, new permitting requirements or reinterpretations of existingrequirements may be implemented that could materially increase our operating costs or materially delaythe construction or expansion of our facilities.
28

Hydraulic Fracturing.
Hydraulic fracturing is an important and common practice that is used to stimulate production ofnatural gas and/or oil from dense subsurface rock formations. The hydraulic fracturing process involvesthe injection of water, sand and additives under pressure into the formation to fracture the surroundingrock and stimulate production. Hydraulic fracturing typically is regulated by state oil and natural gascommissions, but the EPA has asserted federal regulatory authority pursuant to the Safe DrinkingWater Act, as amended (‘‘SDWA’’) over certain hydraulic fracturing activities involving the use of dieselfuel. In addition, legislation has been introduced before Congress to provide for federal regulation ofhydraulic fracturing under the SDWA and to require disclosure of the chemicals used in the hydraulicfracturing process. At the state level, several states have already adopted laws and/or regulation thatrequire disclosure of the chemicals used in hydraulic fracturing and many states are considering legalrequirements that could impose more stringent permitting, disclosure and well constructionrequirements on natural gas drilling activities. In the event that new or more stringent federal, state orlocal legal restrictions relating to natural gas drilling activities or to the hydraulic fracturing process areadopted in areas where our producer customers operate, those customers could incur potentiallysignificant added costs to comply with such requirements and experience delays or curtailment in thepursuit of production or development activities, which could reduce demand for our gathering,transportation and processing services and/or our NGL fractionation services.
In addition, certain governmental reviews are either underway or being proposed that focus onpotential environmental aspects of hydraulic fracturing practices. The White House Council onEnvironmental Quality is coordinating an administration-wide review of hydraulic fracturing practices,and a committee of the U.S. House of Representatives has conducted an investigation of hydraulicfracturing practices. The EPA has commenced a study of the potential environmental effects ofhydraulic fracturing on drinking water and groundwater, with initial results expected to be available bylate 2012 and final results by 2014. Moreover, the EPA is developing effluent limitations for thetreatment and discharge of wastewater resulting from hydraulic fracturing activities and plans topropose these standards by 2014. Other governmental agencies, including the U.S. Department ofEnergy and the U.S. Department of the Interior, are evaluating various other aspects of hydraulicfracturing. These ongoing or proposed studies, depending on their degree of pursuit and anymeaningful results obtained, could spur initiatives to further regulate hydraulic fracturing under theSDWA or other regulatory mechanisms, which events could delay or curtail production of natural gas,and thus reduce demand for our midstream services.
Air Emissions.
The Clean Air Act, as amended and comparable state laws restrict the emission of air pollutantsfrom many sources in the U.S., including processing plants and compressor stations, and also imposevarious monitoring and reporting requirements. These laws and any implementing regulations mayrequire us to obtain pre-approval for the construction or modification of certain projects or facilitiesexpected to produce or significantly increase air emissions, obtain and strictly comply with stringent airpermit requirements, utilize specific equipment or technologies to control emissions, or aggregate twoor more of our facilities into one application for permitting purposes. Amendments, expansions orre-interpretations of the Clean Air Act or comparable state laws may cause us to incur capitalexpenditures for installation of air pollution control equipment and to encounter construction oroperational delays while applying for, or awaiting the review, processing and issuance of new oramended permits. For example, on July 28, 2011, the EPA proposed a range of new regulations thatwould establish new air emission controls for oil and natural gas production and natural gas processing,including, among other things, new leak detection requirements for natural gas processing plants. TheEPA is under a court order to finalize these proposed regulations by April 3, 2012. We have been indiscussions with various state agencies in the areas in which we operate with respect to their guidance,
29

policies, rules and regulations regarding the permitting process, source determination, categories ofapplicable permits and control technology that may be required for the construction or operation ofcertain of our facilities. We believe that our operations are in substantial compliance with applicable airpermitting and control technology requirements.
Climate Change.
As a consequence to an EPA administrative conclusion that emissions of carbon dioxide, methaneand other greenhouse gases, or GHGs, into the ambient air endangers public health and welfare, theEPA has adopted regulations that require a reduction in emissions of GHGs from motor vehicles andalso trigger construction and operating permit review for GHG emissions from certain large stationarysources. The EPA has published its final rule to address the permitting of GHG emissions fromstationary sources under the Prevention of Significant Deterioration (‘‘PSD’’) and Title V permittingprograms, pursuant to which these permitting programs have been ‘‘tailored’’ to apply to certainstationary sources of GHG emissions in a multi-step process, with the largest sources first subject topermitting. In addition, the EPA adopted rules requiring the monitoring and reporting of greenhousegas emissions from specified greenhouse gas emission sources in the United States, including, amongothers, certain onshore and offshore oil and natural gas production and onshore oil and natural gasprocessing, fractionation, transmission, storage and distribution facilities, which may include certain ofour operations. As a result of these requirements—all of which are currently subject to judicial reviewin the Court of Appeals for the District of Columbia—we may be required to incur potentiallysignificant added costs to comply with the new regulatory requirements or added capital expendituresfor air pollution control equipment, or we experience delays or possible curtailment of construction orprojects in connection with maintaining or in applying or obtaining preconstruction and operatingpermits and we may encounter limitations to the design capacities or size of facilities as a result of therequirements and consequences of the EPA GHG regulations.
In addition to the EPA regulations, Congress has from time to time considered legislation toreduce emissions of GHGs, and almost one-half of the states have already taken legal measures toreduce emissions of GHGs, primarily through the planned development of GHG emission inventoriesand/or regional GHG cap and trade programs. The adoption of any legislation or regulations thatrequires reporting of GHGs or otherwise limits emissions of GHGs from our equipment and operationscould require us to incur potentially significant added costs to comply with the new regulatoryrequirements or to reduce emissions of GHGs associated with our operations or could adversely affectdemand for the oil and natural gas. It is not possible at this time to predict the full or final scope oflegislation or new regulations that may be adopted to address greenhouse gas emissions or the impactof such legislation or regulations on our business. However, any such new federal, regional or staterestrictions on emissions of carbon dioxide or other greenhouse gases that may be imposed in areas inwhich we conduct business could have an adverse affect on our cost of doing business and on thedemand for the natural gas and crude oil we gather as well as the natural gas and natural gas liquidswe process, which in turn could adversely affect our cash available for distribution to our unitholders.Finally, for a variety of reasons, natural and/or anthropogenic, climate changes could occur and havesignificant physical effects, such as increased frequency and severity of storms, droughts and floods andother climatic events; if such effects were to occur, they could have an adverse effect on our operations,which in turn could adversely affect our cash available for distribution to our unitholders.
Anti-Terrorism Measures.
Our operations and the operations of the natural gas and oil industry in general may be subject tolaws and regulations regarding the security of industrial facilities, including natural gas and oil facilities.The Department of Homeland Security Appropriations Act of 2007 required the Department ofHomeland Security (‘‘DHS’’) to issue regulations establishing risk-based performance standards for the
30

security of chemical and industrial facilities, including oil and gas facilities that are deemed to present‘‘high levels of security risk.’’ The DHS issued an interim final rule, known as the Chemical FacilityAnti-Terrorism Standards interim rule, in April 2007 regarding risk-based performance standards to beattained pursuant to the act and, on November 20, 2007, further issued an Appendix A to the interimrule that established the chemicals of interest and their respective threshold quantities that will triggercompliance with these interim rules. Covered facilities that are determined by DHS to pose a high levelof security risk are required to prepare and submit Security Vulnerability Assessments and Site SecurityPlans as well as comply with other regulatory requirements, including those regarding inspections,audits, recordkeeping and protection of chemical-terrorism vulnerability information. In January 2008,we prepared and submitted to the DHS initial screening surveys for facilities operated by us thatpossess regulated chemicals of interest in excess of the Appendix A threshold levels. During 2008, theDHS requested that we perform a Security Vulnerability Assessment for our Javelina plant. The DHSdid not require us to perform any assessments with respect to our other facilities. We completed theassessment for our Javelina plant and submitted the assessment to the DHS for review in December2008. We were also required to develop a written security plan for our Javelina plant and train ouremployees accordingly. In March 2010, we received a response from the DHS approving our SecurityVulnerability Assessment and requesting that we develop and submit a Site Security Plan for theJavelina plant. We submitted the Site Security Plan to the DHS for review in June 2010. While we donot currently anticipate incurring significant costs in connection with complying with theserequirements, we have not yet received a response from the DHS regarding our Site Security Plan. It ispossible that additional requirements could be imposed by the DHS in connection with this programand complying with such requirements could result in additional costs that may be substantial.
Endangered Species Act Considerations.
The federal Endangered Species Act (‘‘ESA’’) restricts activities that may affect endangered orthreatened species or their habitats. If endangered species are located in areas where we propose toconstruct new gathering or transportation pipelines or processing or fractionation facilities, such workcould be prohibited or delayed or expensive mitigation may be required. Additionally, construction andoperational activities could result in inadvertent impact to habitats of listed species and could result inalleged takings under the ESA, exposing the Partnership to civil or criminal enforcement actions andfines or penalties. Moreover, as a result of a settlement approved by the U.S. District Court for theDistrict of Columbia on September 9, 2011, the U.S. Fish and Wildlife Service is required to make adetermination on listing of more than 250 species as endangered or threatened under the ESA over thenext six years, through the agency’s 2017 fiscal year. The designation of previously unprotected speciesas threatened or endangered in areas where we conduct operations or plan to construct pipelines orfacilities could cause us to incur increased costs arising from species protection measures or couldresult in limitations on our customer’s exploration and production activities, which could have anadverse impact on demand for our midstream operations.
Pipeline Safety Regulations
Our pipelines are subject to regulation by the U.S. Department of Transportation (‘‘DOT’’) underthe Natural Gas Pipeline Safety Act of 1986, as amended (‘‘NGPSA’’), with respect to natural gas, andthe Hazardous Pipeline Safety Act of 1979, as amended (‘‘HLPSA’’), with respect to crude oil, NGLsand condensates. The NGPSA and HLPSA govern the design, installation, testing, construction,operation, replacement and management of natural gas, oil and NGL pipeline facilities. The NGPSAand HLPSA require any entity that owns or operates pipeline facilities to comply with the regulationsimplemented under these acts, permit access to and allow copying of records and to make certainreports and provide information as required by the Secretary of Transportation. We believe that ourpipeline operations are in substantial compliance with applicable existing NGPSA and HLPSArequirements; however, these laws are subject to further amendment, with the potential for more
31

onerous obligations and stringent standards being imposed on pipeline owners and operators. Forexample, on January 3, 2012, President Obama signed the Pipeline Safety, Regulatory Certainty, andJob Creation Act of 2011 (‘‘2011 Pipeline Safety Act’’), which requires increased safety measures forgas and hazardous liquids transportation pipelines. Among other things, the 2011 Pipeline Safety Actdirects the Secretary of Transportation to promulgate rules or standards relating to expanded integritymanagement requirements, automatic or remote-controlled valve use, excess flow valve use and leakdetection system installation. The 2011 Pipeline Safety Act also directs owners and operators ofinterstate and intrastate gas transmission pipelines to verify their records confirming the maximumallowable pressure of pipelines in certain class locations and high consequence areas, requirespromulgation of regulations for conducting tests to confirm the material strength of pipe operatingabove 30% of specified minimum yield strength in high consequence areas and increases the maximumpenalty for violation of pipeline safety regulations from $1 million to $2 million. The safetyenhancement requirements and other provisions of the 2011 Pipeline Safety Act could require us toinstall new or modified safety controls, pursue additional capital projects or conduct maintenanceprograms on an accelerated basis, any or all of which tasks could result in our incurring increasedoperating costs that could be significant and have a material adverse effect on our results of operationsor financial position.
Our pipelines are also subject to regulation by the DOT under the Pipeline Safety ImprovementAct of 2002, which was amended by the Pipeline Inspection, Protection, Enforcement and Safety Act of2006. The DOT, through the Pipeline and Hazardous Materials Safety Administration (‘‘PHMSA’’), hasestablished a series of rules under 49 C.F.R. Part 192 that require pipeline operators to develop andimplement integrity management programs for gas transmission pipelines that, in the event of a failure,could affect high consequence areas. ‘‘High consequence areas’’ are currently defined to include highpopulation areas, areas unusually sensitive to environmental damage and commercially navigablewaterways. Similar rules are also in place under 49 C.F.R. Part 195 for operators of hazardous liquidpipelines including lines transporting NGLs and condensates. The DOT also has adopted rules thatamend the pipeline safety regulations to extend regulatory coverage to certain rural onshore hazardousliquid gathering lines and low stress pipelines, including those pipelines located in non-populated areasrequiring extra protection because of the presence of sole source drinking water resources, endangeredspecies or other ecological sources. While we believe that our pipeline operations are in substantialcompliance with applicable requirements, due to the possibility of new or amended laws andregulations, or reinterpretation of existing laws and regulations, there can be no assurance that futurecompliance with the requirements will not have a material adverse effect on our results of operationsor financial position. For instance, in August 2011, PHMSA published an advance notice of proposedrulemaking in which the agency is seeking public comment on a number of changes to regulationsgoverning the safety of gas transmission pipelines and gathering lines, including, for example,(i) revising the definitions of ‘‘high consequence areas’’ and ‘‘gathering lines’’; (ii) strengtheningintegrity management requirements as they apply to existing regulated operators and to currentlyexempt operators should certain exemptions be removed; (iii) strengthening requirements on the typesof gas transmission pipeline integrity assessment methods that may be selected for use by operators;(iv) imposing gas transmission integrity management requirements on onshore gas gathering lines;(v) requiring the submission of annual, incident and safety-related conditions reports by operators of allgathering lines; and (vi) enhancing the current requirements for internal corrosion control of gatheringlines.
Employee Safety
The workplaces associated with the processing and storage facilities and the pipelines we operateare also subject to oversight pursuant to the federal Occupational Safety and Health Act, as amended,(‘‘OSHA’’), as well as comparable state statutes that regulate the protection of the health and safety ofworkers. In addition, the OSHA hazard-communication standard requires that we maintain information
32

about hazardous materials used or produced in operations, and that this information be provided toemployees, state and local government authorities and citizens. We believe that we have conducted ouroperations in substantial compliance with OSHA requirements, including general industry standards,record-keeping requirements and monitoring of occupational exposure to regulated substances.
In general, we expect industry and regulatory safety standards to become stricter over time,resulting in increased compliance expenditures. While these expenditures cannot be accuratelyestimated at this time, we do not expect such expenditures will have a material adverse effect on ourresults of operations.
Employees
Through our subsidiary MarkWest Hydrocarbon, we employ approximately 683 individuals tooperate our facilities and provide general and administrative services. We have no employeesrepresented by unions.
Available Information
Our principal executive office is located at 1515 Arapahoe Street, Tower 1, Suite 1600, Denver,Colorado 80202-2137. Our telephone number is 303-925-9200. Our common units trade on the NewYork Stock Exchange under the symbol ‘‘MWE.’’ You can find more information about us at ourInternet website, www.markwest.com. Our annual reports on Form 10-K, our quarterly reports onForm 10-Q, our current reports on Form 8-K and any amendments to those reports are available freeof charge on or through our Internet website as soon as reasonably practicable after we electronicallyfile or furnish such material with the Securities and Exchange Commission. The filings are alsoavailable through the SEC at the SEC’s Public Reference Room at 100 F Street, N.E., Washington,D.C. 20549 or by calling 1-800-SEC-0330. Also, these filings are available on the Internet websitewww.sec.gov.
ITEM 1A. Risk Factors
In addition to the other information set forth elsewhere in this Form 10-K, you should carefullyconsider the following factors when evaluating us.
Risks Inherent in Our Business
Our substantial debt and other financial obligations could impair our financial condition, results ofoperations and cash flow, and our ability to fulfill our debt obligations.
We have substantial indebtedness and other financial obligations. Subject to the restrictionsgoverning our indebtedness and other financial obligations, including the indentures governing ouroutstanding notes, we may incur significant additional indebtedness and other financial obligations.
Our substantial indebtedness and other financial obligations could have important consequences.For example, they could:
• make it more difficult for us to satisfy our obligations with respect to our existing debt;
• impair our ability to obtain additional financings in the future for working capital, capitalexpenditures, acquisitions or general partnership and other purposes;
• have a material adverse effect on us if we fail to comply with financial and restrictive covenantsin our debt agreements and an event of default occurs as a result of that failure that is notcured or waived;
33

• require us to dedicate a substantial portion of our cash flow to payments on our indebtednessand other financial obligations, thereby reducing the availability of our cash flow to fundworking capital, capital expenditures, distributions and other general partnership requirements;
• limit our flexibility in planning for, or reacting to, changes in our business and the industry inwhich we operate; and
• place us at a competitive disadvantage compared to our competitors that have proportionatelyless debt.
Furthermore, these consequences could limit our ability, and the ability of our subsidiaries, toobtain future financings, make needed capital expenditures, withstand any future downturn in ourbusiness or the economy in general, conduct operations or otherwise take advantage of businessopportunities that may arise.
Our obligations under our Credit Facility are secured by substantially all of our assets andguaranteed by all of our wholly-owned subsidiaries other than MarkWest Liberty Midstream, butincluding our operating company (please read Item 7. Management’s Discussion and Analysis ofFinancial Condition and Results of Operations—Liquidity and Capital Resources). Our Credit Facilityand our indentures contain covenants requiring us to maintain specified financial ratios and satisfyother financial conditions, which may limit our ability to grant liens on our assets, make or own certaininvestments, enter into any swap contracts other than in the ordinary course of business, merge,consolidate or sell assets, incur indebtedness senior to the Credit Facility, make distributions on equityinvestments and declare or make, directly or indirectly, any distribution on our common units. We maybe unable to meet those ratios and conditions. Any future breach of any of these covenants or ourfailure to meet any of these ratios or conditions could result in a default under the terms of our CreditFacility, which could result in acceleration of our debt and other financial obligations. If we wereunable to repay those amounts, the lenders could initiate a bankruptcy or liquidation proceeding orproceed against the collateral.
Global economic conditions may have adverse impacts on our business and financial condition.
Changes in economic conditions could adversely affect our financial condition and results ofoperations. A number of economic factors, including, but not limited to, gross domestic product,consumer interest rates, strength of U.S. currency, consumer confidence and debt levels, retail trends,housing starts, sales of existing homes, the level of mortgage refinancing, inflation and foreign currencyexchange rates, may generally affect our business. Recessionary economic cycles, higher unemploymentrates, higher fuel and other energy costs and higher tax rates may adversely affect demand for naturalgas, NGLs and crude oil. Also, tightening of the capital markets could adversely impact our ability toexecute our long-term organic growth projects and meet our obligations to our producer customers andlimit our ability to otherwise take advantage of business opportunities or react to changing economicand business conditions. These factors could have a material adverse effect on our revenues, incomefrom operations, cash flows and our quarterly distribution on the common units.
We may not have sufficient cash after the establishment of cash reserves and payment of our expenses toenable us to pay distributions at the current level.
The amount of cash we can distribute on our units depends principally on the amount of cash wegenerate from our operations, which may fluctuate from quarter to quarter based on, among otherthings:
• the fees we charge and the margins we realize for our services and sales;
• the prices of, level of production of and demand for natural gas and NGLs;
34
• the relative prices of NGLs and crude oil, which impact the effectiveness of our hedgingprogram;
• the volumes of natural gas we gather, process and transport;
• the level of our operating costs; and
• prevailing economic conditions.
In addition, the actual amount of cash available for distribution may depend on other factors,some of which are beyond our control, including:
• our debt service requirements;
• fluctuations in our working capital needs;
• our ability to borrow funds and access capital markets;
• restrictions contained in our debt agreements;
• restrictions contained in our joint venture agreements;
• the level of capital expenditures we make, including capital expenditures incurred in connectionwith our enhancement projects;
• the cost of acquisitions, if any; and
• the amount of cash reserves established by our general partner.
Unitholders should be aware that the amount of cash we have available for distribution dependsprimarily on our cash flow and not solely on profitability, which is affected by non-cash items. As aresult, we may make cash distributions during periods when we record losses and may not make cashdistributions during periods when we record net income.
Our profitability and cash flows are affected by the volatility of NGL product and natural gas prices.
We are subject to significant risks associated with frequent and often substantial fluctuations incommodity prices. In the past, the prices of natural gas and NGLs have been volatile and we expectthis volatility to continue. The New York Mercantile Exchange (‘‘NYMEX’’) daily settlement price ofnatural gas for the prompt month contract in 2010 ranged from a high of $6.01 per MMBtu to a low of$3.29 per MMBtu. In 2011, the same index ranged from a high of $4.85 per MMBtu to a low of $2.99per MMBtu. Also as an example, the composite of the weighted monthly average NGLs price at ourAppalachian facilities based on our average NGLs composition in 2010 ranged from a high ofapproximately $1.55 per gallon to a low of approximately $1.11 per gallon. In 2011, the same compositeranged from a high of approximately $2.18 per gallon to a low of approximately $1.51 per gallon. Themarkets and prices for natural gas and NGLs depend upon factors beyond our control. These factorsinclude demand for oil, natural gas and NGLs, which fluctuate with changes in market and economicconditions and other factors, including:
• the level of domestic oil, natural gas and NGL production;
• demand for natural gas and NGL products in localized markets;
• changes in interstate pipeline gas quality specifications;
• imports of crude oil, natural gas and NGLs;
• seasonality;
• the condition of the U.S. economy;
35

• political conditions in other oil-producing and natural gas-producing countries; and
• government regulation, legislation and policies.
Our net operating margins under various types of commodity-based contracts are directly affectedby changes in NGL product prices and natural gas prices and thus are more sensitive to volatility incommodity prices than our fee-based contracts. Additionally, our purchase and resale of gas in theordinary course of business exposes us to significant risk of volatility in gas prices due to the potentialdifference in the time of the purchases and sales and the potential existence of a difference in the gasprice associated with each transaction. Significant declines in commodity prices could have an adverseimpact on cash flows from operations that could result in noncash impairments of long-lived assets, aswell as other-than-temporary noncash impairments of our equity method investments.
Relative changes in NGL product and natural gas prices may adversely impact our results due to frac spread,natural gas and NGL exposure.
Under our keep-whole arrangements, our principal cost is delivering dry gas of an equivalent Btucontent to replace Btus extracted from the gas stream in the form of NGLs or consumed as fuel duringprocessing. The spread between the NGL product sales price and the purchase price of natural gas withan equivalent Btu content is called the ‘‘frac spread.’’ Generally, the frac spread and, consequently, thenet operating margins are positive under these contracts. In the event natural gas becomes moreexpensive on a Btu equivalent basis than NGL products, the cost of keeping the producer ‘‘whole’’results in operating losses.
Additionally, due to the timing of purchases and sales of natural gas and NGLs, direct exposure tochanges in market prices of either gas or NGLs can be created because there is no longer an offsettingpurchase or sale that remains exposed to market pricing. Direct exposure may occur naturally as resultof our production processes or we may create exposure through purchases of NGLs or natural gas.Given that we have derivative positions, adverse movement in prices to the positions we have takenmay negatively impact results.
Our commodity derivative activities may reduce our earnings, profitability and cash flows.
Our operations expose us to fluctuations in commodity prices. We utilize derivative financialinstruments related to the future price of crude oil, natural gas and certain NGLs with the intent ofreducing volatility in our cash flows due to fluctuations in commodity prices.
The extent of our commodity price exposure is related largely to the effectiveness and scope of ourderivative activities. We have a policy to enter into derivative transactions related to only a portion ofthe volume of our expected production or fuel requirements and, as a result, we expect to continue tohave direct commodity price exposure to the unhedged portion. Our actual future production or fuelrequirements may be significantly higher or lower than we estimate at the time we enter into derivativetransactions for such period. If the actual amount is higher than we estimate, we will have greatercommodity price exposure than we intended. If the actual amount is lower than the amount that issubject to our derivative financial instruments, we might be forced to settle all or a portion of ourderivative transactions without the benefit of the cash flow from our sale or purchase of the underlyingphysical commodity, which could result in a substantial diminution of our liquidity. Additionally,because we primarily use derivative financial instruments relating to the future price of crude oil tomitigate our exposure to NGL price risk, the volatility or our future cash flows and net income mayincrease if there is a change in the pricing relationship between crude oil and NGLs. As a result ofthese factors, our hedging activities may not be as effective as we intend in reducing the downsidevolatility of our cash flows and, in certain circumstances, may actually increase the volatility of our cashflows. In addition, our hedging activities are subject to the risks that a counterparty may not perform itsobligation under the applicable derivative instrument, the terms of the derivative instruments are
36

imperfect and our risk management policies and procedures are not properly followed. It is possiblethat the steps we take to monitor our derivative financial instruments may not detect and preventviolations of our risk management policies and procedures, particularly if deception or other intentionalmisconduct is involved. For further information about our risk management policies and procedures,please read Note 6 of the accompanying Notes to the Consolidated Financial Statements included inItem 8 of this Form 10-K.
We conduct risk management activities but we may not accurately predict future commodity price fluctuationsand, therefore, expose us to financial risks and reduce our opportunity to benefit from price increases.
We evaluate our exposure to commodity price risk from an overall portfolio basis. We havediscretion in determining whether and how to manage the commodity price risk associated with ourphysical and derivative positions.
To the extent that we do not manage the commodity price risk relating to a position that is subjectto commodity price risk and commodity prices move adversely, we could suffer losses. Such losses couldbe substantial and could adversely affect our operations and cash flows available for distribution to ourunitholders. In addition, managing the commodity risk may actually reduce our opportunity to benefitfrom increases in the market or spot prices.
The enactment of the Dodd-Frank Act and promulgation of regulations thereunder, could have an adverseimpact on our ability to manage risks associated with our business.
Congress adopted comprehensive financial reform legislation that establishes federal oversight andregulation of the OTC derivatives market and entities, such as us, that participate in that market. Thenew legislation, known as the Dodd-Frank Wall Street Reform and Consumer Protection Act (the‘‘Dodd-Frank Act’’), was signed into law on July 21, 2010 and requires the Commodities FuturesTrading Commission (the ‘‘CFTC’’), the SEC and other regulators to promulgate rules and regulationsimplementing the new legislation. The agencies have taken administrative action to defer theeffectiveness of the Dodd-Frank Act as they continue to work on finalizing rules. The CFTC has alsoproposed a phased implementation in which entities such as the Partnership will have a furtherdeferred compliance date. Among the regulations the CFTC has finalized are regulations to setaggregate federal position limits for futures and option contracts for crude oil, natural gas, heating oiland gasoline and for swaps that are their economic equivalents. Certain bona fide hedging transactionsor positions would be exempt from these position limits. This regulation will be effective for ‘‘spotmonths’’ 60 days after the definition of the term ‘‘Swap’’ is finalized and for ‘‘all months’’ after theCFTC obtains approximately one year’s data for swap open interest in such contracts. While it is notpossible at this time to predict when the CFTC and the SEC will finalize or make these regulationseffective, the agencies have issued estimated timeframes which indicate that significant elements of theregulations will be addressed in the first half of 2012. The financial reform regulations may also requireus to comply with margin requirements and with certain clearing and trade-execution requirements inconnection with our derivative activities either through direct regulation of us or indirectly throughregulation of our derivative counterparties, although the specifics of those provisions are uncertain atthis time. The financial reform legislation also requires the counterparties to our derivative instrumentsto spin off some of their derivatives activities to a separate entity, which may not be as creditworthy asthe current counterparty. The new legislation and any new regulations could significantly increase thecost of derivative contracts (including through requirements to post collateral which could adverselyaffect our available liquidity), materially alter the terms of derivative contracts, reduce the availabilityof derivatives to protect against risks that we encounter, reduce our ability to monetize or restructureour existing derivative contracts and increase our exposure to less creditworthy counterparties. If wereduce our use of derivatives as a result of the legislation and regulations, our results of operationsmay become more volatile and our cash flows may be less predictable, which could adversely affect ourability to plan for and fund capital expenditures. Any of these consequences could have a material,adverse effect on our income from operations, cash flows and quarterly distribution to commonunitholders.
37
A significant decrease in natural gas production in our areas of operation would reduce our ability to makedistributions to our unitholders.
Our gathering systems are connected to natural gas reserves and wells, from which the productionwill naturally decline over time, which means that our cash flows associated with these wells will alsodecline over time. To maintain or increase throughput levels on our gathering systems and theutilization rate at our processing plants, treating facilities and fractionation facilities, we mustcontinually obtain new natural gas supplies. Our ability to obtain additional sources of natural gasdepends in part on the level of successful drilling activity near our gathering systems.
We have no control over the level of drilling activity in the areas of our operations, the amount ofreserves associated with the wells or the rate at which production from a well will decline. In addition,we have no control over producers or their production decisions, which are affected by, among otherthings, prevailing and projected energy prices, drilling costs per Mcf, demand for hydrocarbons, thelevel of reserves, geological considerations, governmental regulations and the availability and cost ofcapital. In addition, fluctuations in energy prices can greatly affect production rates and investments bythird parties in the development of new oil and natural gas reserves. Drilling activity generallydecreases as oil and natural gas prices decrease. During 2011, we saw decreases in the prices of naturalgas, leading some producers to announce significant reductions to their drilling plans specifically in drygas areas. If sustained over the long-term, low gas prices could lead to a material reduction in volumesin certain areas of our operations.
Because of these factors, even if new natural gas reserves are discovered in areas served by ourassets, producers may choose not to develop those reserves. If we are not able to obtain new suppliesof natural gas to replace the natural decline in volumes from existing wells due to reductions in drillingactivity or competition, throughput on our pipelines and the utilization rates of our facilities woulddecline, which could have a material adverse effect on our business, results of operations, financialcondition and ability to make cash distributions.
We depend on third parties for the natural gas and refinery off-gas we process, and the NGLs we fractionateat our facilities, and a reduction in these quantities could reduce our revenues and cash flow.
Although we obtain our supply of natural gas, refinery off-gas and NGLs from numerous third-party producers, a significant portion comes from a limited number of key producers/suppliers who arecommitted to us under processing contracts. According to these contracts or other supply arrangements,however, the producers are usually under no obligation to deliver a specific quantity of natural gas orNGLs to our facilities. If these key suppliers, or a significant number of other producers, were todecrease the supply of natural gas or NGLs to our systems and facilities for any reason, we couldexperience difficulty in replacing those lost volumes. Because our operating costs are primarily fixed, areduction in the volumes of natural gas or NGLs delivered to us would result not only in a reduction ofrevenues, but also a decline in net income and cash flow.
Growing our business by constructing new pipelines and processing and treating facilities subjects us toconstruction risks and risks that natural gas or NGL supplies may not be available upon completion of thefacilities.
One of the ways we intend to grow our business is through the construction of, or additions to, ourexisting, gathering, treating, processing, and fractionation facilities. The construction of gathering,processing, fractionation and treating facilities requires the expenditure of significant amounts ofcapital, which may exceed our expectations, and involves numerous regulatory, environmental, political,legal and inflationary uncertainties, and stringent, lengthy and occasionally unreasonable or impracticalfederal, state and local permitting, consent, or authorizations requirements, which may cause us toincur additional capital expenditures for meeting certain conditions or requirements or which maydelay, interfere with or impair our construction activities. As a result, new facilities may not be
38

constructed as scheduled or as originally designed, which may require redesign and additionalequipment, relocations of facilities or rerouting of pipelines, which in turn could subject us toadditional capital costs, additional expenses or penalties and may adversely affect our operations andcash flows available for distribution to unitholders. In addition, the coordination and monitoring of thisdiverse group of projects requires skilled and experienced labor. If we undertake these projects, we maynot be able to complete them on schedule, or at all, or at the budgeted cost. In addition, certainagreements with our producer customers contain substantial financial penalties and/or give theproducer the right to repurchase certain assets and terminate their contracts with us if constructiondeadlines are not achieved. Any such penalty or contract termination could have a material adverseeffect on our income from operations, cash flows and quarterly distribution to common unitholders.Moreover, our revenues may not increase immediately upon the expenditure of funds on a particularproject. For instance, if we build a new pipeline, the construction may occur over an extended period oftime, and we may not receive any material increases in revenues until after completion of the project, ifat all. Our ability to successfully manage these projects depends on obtaining skilled labor, projectmanagers and engineers.
Furthermore, we may have only limited natural gas or NGL supplies committed to these facilitiesprior to their construction. Moreover, we may construct facilities to capture anticipated future growthin production or satisfy anticipated market demand in a region in which anticipated production growthor market demand does not materialize, the facilities may not operate as planned or may not be usedat all. We may also rely on estimates of proved reserves in our decision to construct new pipelines andfacilities, which may prove to be inaccurate because there are numerous uncertainties inherent inestimating quantities of proved reserves. As a result, new facilities may not be able to attract enoughnatural gas or NGLs to achieve our expected investment return, which could adversely affect ouroperations and cash flows available for distribution to our unitholders.
The fees charged to third parties under our gathering, processing, transmission, transportation, fractionationand storage agreements may not escalate sufficiently to cover increases in costs, or the agreements may not berenewed or may be suspended in some circumstances.
Our costs may increase at a rate greater than the fees we charge to third parties. Furthermore,third parties may not renew their contracts with us. Additionally, some third parties’ obligations undertheir agreements with us may be permanently or temporarily reduced due to certain events, some ofwhich are beyond our control, including force majeure events wherein the supply of either natural gas,NGLs or crude oil are curtailed or cut off. Force majeure events include (but are not limited to):revolutions, wars, acts of enemies, embargoes, import or export restrictions, strikes, lockouts, fires,storms, floods, acts of God, explosions and mechanical or physical failures of equipment affecting ourfacilities or facilities of third parties. If the escalation of fees is insufficient to cover increased costs, orif third parties do not renew or extend their contracts with us or if third parties suspend or terminatetheir contracts with us, our financial results would suffer.
We are exposed to the credit risks of our key customers and derivative counterparties, and any materialnonpayment or nonperformance by our key customers or derivative counterparties could reduce our ability tomake distributions to our unitholders.
We are subject to risks of loss resulting from nonpayment or nonperformance by our customers,which risks may increase during periods of economic uncertainty. Furthermore, some of our customersmay be highly leveraged and subject to their own operating and regulatory risks, which increases therisk that they may default on their obligations to us. In addition, our risk management activities aresubject to the risks that a counterparty may not perform its obligation under the applicable derivativeinstrument, the terms of the derivative instruments are imperfect, and our risk management policiesand procedures are not properly followed. Any material nonpayment or nonperformance by our key
39

customers or our derivative counterparties could reduce our ability to make distributions to ourunitholders.
We may not be able to retain existing customers, or acquire new customers, which would reduce our revenuesand limit our future profitability.
The renewal or replacement of existing contracts with our customers at rates sufficient to maintaincurrent revenues and cash flows depends on a number of factors beyond our control, includingcompetition from other gatherers, processors, pipelines, fractionators, and the price of, and demand for,natural gas, NGLs and crude oil in the markets we serve. Our competitors include large oil, naturalgas, refining and petrochemical companies, some of which have greater financial resources, morenumerous or greater capacity pipelines, processing and other facilities, and greater access to natural gasand NGL supplies than we do. Additionally, our customers that gather gas through facilities that arenot otherwise dedicated to us may develop their own processing and fractionation facilities in lieu ofusing our services. Certain of our competitors may also have advantages in competing for acquisitions,or other new business opportunities, because of their financial resources and synergies in operations.
As a consequence of the increase in competition in the industry, and the volatility of natural gasprices, end-users and utilities are reluctant to enter into long-term purchase contracts. Many end-userspurchase natural gas from more than one natural gas company and have the ability to change providersat any time. Some of these end-users also have the ability to switch between gas and alternative fuels inresponse to relative price fluctuations in the market. Because there are numerous companies of greatlyvarying size and financial capacity that compete with us in the marketing of natural gas, we oftencompete in the end-user and utilities markets primarily on the basis of price. The inability of ourmanagement to renew or replace our current contracts as they expire and to respond appropriately tochanging market conditions could affect our profitability. For more information regarding ourcompetition, please read Item 1. Business—Competition of Part I of this report.
Transportation on certain of our pipelines may be subject to federal or state rate and service regulation, andthe imposition and/or cost of compliance with such regulation could adversely affect our operations and cashflows available for distribution to our unitholders.
Some of our gas, NGL and crude oil transmission operations are or may in the future be, subjectto siting, public necessity, rate and service regulations by FERC or various state regulatory bodies,depending upon jurisdiction. FERC generally regulates the transportation of natural gas, NGLs and oilin interstate commerce and FERC’s regulatory authority includes: facilities construction, acquisition,extension or abandonment of services or facilities; accounts and records; and depreciation andamortization policies. FERC’s action in any of these areas or modifications of its current regulationscan adversely impact our ability to compete for business, the costs we incur in our operations, theconstruction of new facilities or our ability to recover the full cost of operating our pipelines. We alsoown or are constructing pipelines that are carrying or are expected to carry NGLs owned by us acrossstate lines. We currently are, and expect in the future to be, the only shipper on these pipelines and donot operate, and do not expect in the future to operate, these pipelines as a common carrier or holdthem out for service to the public. We do not expect third-party entities to seek to utilize our NGLpipelines; therefore, we believe these pipelines would meet the qualifications for a waiver from FERC’sapplicable regulatory requirements. However, we cannot provide assurance that FERC will not at somepoint assert that some or all of such transportation is within its jurisdiction. If FERC were successfulwith any such assertion, FERC’s rate-making methodologies may subject us to potentially burdensomeand expensive operational, reporting and other requirements. We may also elect to construct in thefuture NGL common carrier pipelines to carry NGLs of third parties across state lines or otherwise ininterstate commerce, and in such event we would be required to comply with FERC rate, operational,reporting and other requirements which may increase our cost of operations.
40
Intrastate natural gas pipeline operations and transportation on proprietary natural gas orpetroleum products pipelines are generally not subject to regulation by FERC, and the NGAspecifically exempts some gathering systems. Yet, such operations may still be subject to regulation byvarious state agencies. The applicable statutes and regulations generally require that our rates andterms and conditions of service provide no more than a fair return on the aggregate value of thefacilities used to render services. We cannot assure unitholders that FERC will not at some pointdetermine that such gathering and transportation services are within its jurisdiction, and regulate suchservices, which could limit the rates that we may charge and increase our costs of operation. FERC ratecases can involve complex and expensive proceedings. For more information regarding regulatorymatters that could affect our business, please read Item 1. Business—Regulatory Matters as set forth inthis report.
Some of our natural gas, NGL and crude oil transportation operations are subject to FERC’s rate-makingpolicies that could have an adverse impact on our ability to establish rates that would allow us to recover thefull cost of operating our pipelines including a reasonable return.
Action by FERC could adversely affect our ability to establish reasonable rates that coveroperating costs and allow for a reasonable return. An adverse determination in any future rateproceeding brought by or against us could have a material adverse effect on our business, financialcondition and results of operations.
For example, one such matter relates to FERC’s policy regarding allowances for income taxes indetermining a regulated entity’s cost of service. In May 2005, FERC adopted a policy statement(‘‘Policy Statement’’), stating that it would permit entities owning public utility assets, including oilpipelines, to include an income tax allowance in such utilities’ cost-of-service rates to reflect actual orpotential tax liability attributable to their public utility income, regardless of the form of ownership.Pursuant to the Policy Statement, a tax pass-through entity seeking such an income tax allowance wouldhave to establish that its partners or members have an actual or potential income tax obligation on theentity’s public utility income. This tax allowance policy was upheld by the D.C. Circuit in May 2007.Whether a pipeline’s owners have actual or potential income tax liability may be reviewed by FERC ona case-by-case basis. How the Policy Statement is applied in practice to pipelines owned by publiclytraded partnerships could impose limits on our ability to include a full income tax allowance in cost ofservice.
If we are unable to obtain new rights-of-way or other property rights, or the cost of renewing existingrights-of-way or property rights increases, then we may be unable to fully execute our growth strategy, whichmay adversely affect our operations and cash flows available for distribution to unitholders.
The construction of additions to our existing gathering assets and the expansion of our gathering,processing and fractionation assets may require us to obtain new rights-of-way or other property rightsprior to constructing new plants, pipelines and other transportation facilities. We may be unable toobtain such rights-of-way or other property rights to connect new natural gas supplies to our existinggathering lines, to connect our existing or future facilities to new natural gas or natural gas liquidsmarkets, or capitalize on other attractive expansion opportunities. Additionally, it may become moreexpensive for us to obtain new rights-of-way or other property rights or to renew existing rights-of-wayor property rights. If the cost of obtaining new or renewing existing rights-of-way or other propertyrights increases, it may adversely affect our operations and cash flows available for distribution tounitholders.
41
We are indemnified for liabilities arising from an ongoing remediation of property on which certain of ourfacilities are located and our results of operation and our ability to make distributions to our unitholderscould be adversely affected if the indemnifying party fails to perform its indemnification obligation.
Columbia Gas is the previous owner of the property on which our Kenova, Boldman, Cobb,Kermit and Majorsville facilities are located and is the previous operator of our Boldman and Cobbfacilities and current operator of our Kermit facility. Columbia Gas has been or is currently involved ininvestigatory or remedial activities with respect to the real property underlying the Boldman, Cobb andMajorsville facilities pursuant to an ‘‘Administrative Order by Consent for Removal Actions’’ enteredinto by Columbia Gas and the U.S. Environmental Protection Agency and, in the case of the Boldmanfacility, an ‘‘Agreed Order’’ with the Kentucky Natural Resources and Environmental ProtectionCabinet.
Columbia Gas has agreed to retain sole liability and responsibility for, and to indemnify us against,any environmental liabilities associated with these regulatory orders or the real property underlyingthese facilities to the extent such liabilities arose prior to the effective date of the agreements pursuantto which such properties were acquired or leased from Columbia Gas.
In addition, Consol Coal is the previous owner and/or operator of certain facilities on the realproperty on which our rail facility is being constructed near Houston, Pennsylvania, and has been or iscurrently involved in, investigatory or remedial activities related to AMD with respect to the realproperty underlying these facilities. Consol Coal has accepted liability and responsibility for, and hasagreed to indemnify us against, any environmental liabilities associated with the AMD that are notexacerbated by us in connection with our operations.
Our results of operation and our ability to make cash distributions to our unitholders could beadversely affected if in the future either Columbia Gas or Consol Coal fails to perform under theindemnification provisions of which we are the beneficiary.
Our business is subject to laws and regulations with respect to environmental, occupational, safety, nuisance,zoning, land use and other regulatory matters, and the violation of, or the cost of compliance with, such lawsand regulations could adversely affect our operations and cash flows available for distribution to ourunitholders.
Numerous governmental agencies enforce comprehensive and stringent federal, state, regional andlocal laws and regulations on a wide range of environmental, occupational, safety, nuisance, zoning,land use, and other regulatory matters. We could be adversely affected by increased costs due tostricter pollution-control requirements or liabilities resulting from non-compliance with operating orother regulatory permits. Strict and, under certain circumstances, joint and several liability may beincurred without regard to fault, or the legality of the original conduct, under certain of theenvironmental laws for remediation of contaminated areas, including CERCLA, RCRA, and analogousstate laws. Private parties, including the owners of properties located near our storage, fractionationand processing facilities or through which our pipeline systems pass, also may have the right to pursuelegal actions to enforce compliance, as well as seek damages for non-compliance with environmentallaws and regulations or for personal injury or property damage. New, more stringent environmentallaws, regulations and enforcement policies, and new, amended or re-interpreted permittingrequirements and processes, might adversely affect our products and activities, and existing laws,regulations and policies could be reinterpreted or modified to impose additional requirements, delaysor constraints on our construction of facilities or on our operations. For example, certain requirementsunder amendments, expansions or re-interpretations of existing laws may include more stringentpermitting requirements if two or more of our facilities are aggregated into one application forpermitting purposes or the use of certain types of pollution-control equipment for emissions purposesthat may increase our costs. Federal, state and local agencies also could impose additional safetyrequirements, any of which could affect our profitability. Local governments may adopt more stringent
42

local permitting and zoning ordinances that impose additional requirements, delays or constraints onour activities to construct and operate our facilities, require the relocation of our facilities or increaseour costs to construct and operate our facilities, including the construction of sound mitigationfacilities. In addition, we face the risk of accidental releases or spills associated with our operations.These could result in material costs and liabilities, including those relating to claims for damages toproperty, natural resources and persons, environmental remediation and restoration costs, andgovernmental fines and penalties. Our failure to comply with environmental or safety-related laws andregulations could result in administrative, civil and criminal penalties, the imposition of investigatoryand remedial obligations and even injunctions that restrict or prohibit some or all of our operations.For more information regarding the environmental, safety and other regulatory matters that couldaffect our business, please read Item 1. Business—Regulatory Matters, Item 1. Business—EnvironmentalMatters, and Item 1. Business—Pipeline Safety Regulations, each as set forth in this report.
The adoption of legislation by Congress or states, or additional regulations by the EPA, to control and reducethe emissions of greenhouse gases could increase our operating costs and adversely affect the cash flowsavailable for distribution to our unitholders.
As a consequence to an EPA administrative conclusion that GHGs present an endangerment topublic health and the environment, the EPA has adopted regulations that require a reduction inemissions of GHGs from motor vehicles and also trigger PSD and Title V permit requirements forGHG emissions from certain large stationary sources when the motor vehicle standards took effect onJanuary 2, 2011. The EPA rules have tailored the PSD and Title V permitting programs to apply tocertain stationary sources of GHG emissions in a multi-step process, with the largest sources firstsubject to permitting. Also, the EPA adopted rules regulating the monitoring and reporting ofgreenhouse gas emissions from specified large greenhouse gas emission sources in the United States,including, among others, certain natural onshore and offshore oil and natural gas production andonshore oil and natural gas processing, fractionation, transmission, storage and distribution facilities. Inaddition, Congress has from time to time considered legislation to reduce emissions of GHGs, andalmost one-half of the states have already taken legal measures to reduce emissions of GHGs, primarilythrough the planned development of GHG emission inventories and/or regional GHG cap and tradeprograms. As a result of these requirements—all of which are currently subject to judicial review in theCourt of Appeals for the District of Columbia—or the adoption of any new legislation or regulationsthat requires additional reporting, monitoring or recordkeeping of GHGs, or otherwise limits emissionsof GHGs from our equipment and operations, could adversely affect our operations and materiallyrestrict or delay our ability to obtain air permits for new or modified facilities, could require us to incurcosts to reduce emissions of GHGs associated with our operations or could adversely affect demand forthe oil and natural gas we process or fractionate. For more information regarding greenhouse gasemission and regulation, please read Item 1. Business—Environmental Matters—Air and GreenhouseGases. Finally, for a variety of reasons, natural and/or anthropogenic, climate changes could occurwhich could have significant physical effects, such as increased frequency and severity of storms,droughts and floods and other climatic events; if any such effects were to occur, they could have anadverse effect on our assets and operations, which in turn could adversely affect our cash available fordistribution to our unitholders.
Federal legislation and state legislative and regulatory initiatives relating to hydraulic fracturing could resultin reduced volumes available for us to gather, process and fractionate.
Hydraulic fracturing is an important and common practice that is used to stimulate production ofhydrocarbons, particularly natural gas, from tight formations such as shales. The process involves theinjection of water, sand and chemicals under pressure into formations to fracture the surrounding rockand stimulate production. The process is typically regulated by state oil and gas commissions. However,due to public concerns raised regarding potential impacts of hydraulic fracturing on groundwater
43

quality, legislation has been introduced before Congress to provide for federal regulation of hydraulicfracturing under the SDWA and to require disclosure of the chemicals used in the hydraulic fracturingprocess. At the state level, several states have adopted or are considering legal requirements that couldimpose more stringent permitting, disclosure, and well construction requirements on hydraulicfracturing activities. Also, certain governmental reviews are either underway or being proposed thatfocus on environmental aspects of hydraulic fracturing practices, with the EPA commencing a study ofthe potential environmental effects of hydraulic fracturing on drinking water and groundwater, withinitial results expected to be available by late 2012 and final results by 2014 and, more recently,announcing the proposed development of effluent limitations for the treatment and discharge ofwastewater resulting from hydraulic fracturing activities by 2014. Other governmental agencies,including the U.S. Department of Energy and the U.S. Department of the Interior, are evaluatingvarious other aspects of hydraulic fracturing. Moreover, the White House Council on EnvironmentalQuality is coordinating an administration-wide review of hydraulic fracturing practices, and a committeeof the United States House of Representatives has conducted an investigation of hydraulic fracturingpractices. If new federal or state laws or regulations that significantly restrict hydraulic fracturing areadopted, such legal requirements could make it more difficult to complete natural gas wells in shaleformations and increase our producers’ costs of compliance. This could significantly reduce the volumesof natural gas that we gather and process and NGLs that we gather and fractionate which couldadversely impact our earnings, profitability and cash flows.
The amount of gas we process, gather and transmit, or the NGLs and crude oil we gather and transport, maybe reduced if the pipelines to which we deliver the natural gas, NGLs or crude oil cannot, or will not, acceptthe gas, NGLs or crude oil.
All of the natural gas we process, gather and transmit is delivered into pipelines for furtherdelivery to end-users. If these pipelines cannot, or will not, accept delivery of the gas due todownstream constraints on the pipeline or changes in interstate pipeline gas quality specifications, wemay be forced to limit or stop the flow of gas through our pipelines and processing systems. Inaddition, interruption of pipeline service upstream of our processing facilities would limit or stop flowthrough our processing and fractionation facilities. Likewise, if the pipelines into which we deliverNGLs or crude oil are interrupted, we may be limited in, or prevented from conducting, our crude oilor NGL transportation operations. Any number of factors beyond our control could cause suchinterruptions or constraints on pipeline service, including necessary and scheduled maintenance, orunexpected damage to the pipeline. Because our revenues and net operating margins depend upon(i) the volumes of natural gas we process, gather and transmit, (ii) the throughput of NGLs throughour transportation, fractionation and storage facilities and (iii) the volume of crude oil we gather andtransport, any reduction of volumes could adversely affect our operations and cash flows available fordistribution to our unitholders.
Interruptions in operations at any of our facilities may adversely affect our operations and cash flowsavailable for distribution to our unitholders.
Our operations depend upon the infrastructure that we have developed, including processing andfractionation plants, storage facilities, various means of transportation and marketing services. Anysignificant interruption at these facilities or pipelines, or our inability to transmit natural gas or NGLs,or to transport crude oil to or from these facilities or pipelines for any reason, or to market the naturalgas or NGL’s, would adversely affect our operations and cash flows available for distribution to ourunitholders.
Operations at our facilities could be partially or completely shut down, temporarily or permanently,as the result of circumstances not within our control, such as:
• unscheduled turnarounds or catastrophic events at our physical plants or facilities;
44

• restrictions imposed by governmental authorities or court proceedings;
• labor difficulties that result in a work stoppage or slowdown;
• a disruption in the supply of crude oil to our crude oil pipeline, natural gas to our processingplants or gathering pipelines, or a disruption in the supply of NGLs to our NGL pipelines andfractionation facilities; and
• inadequate storage capacity or market access to support production volumes.
In addition, the construction and operation of certain of our facilities in our Northeast and Libertysegments may be impacted by subsurface mining operations. One or more third parties may havepreviously engaged in, or may in the future engage in, subsurface mining operations near or under ourfacilities, which could cause subsidence or other damage to our facilities. In such event, our operationsat such facilities may be impaired or interrupted, and we may not be able to recover the costs incurredto repair our facilities from such third parties.
Due to our lack of asset diversification, adverse developments in our gathering, processing, transportation,transmission, fractionation and storage businesses could reduce our operations and cash flows available fordistribution to our unitholders.
We rely exclusively on the revenues generated from our gathering, processing, transportation,transmission, fractionation and storage businesses. An adverse development in one of these businesseswould have a significantly greater impact on our operations and cash flows available for distribution toour unitholders than if we maintained more diverse assets.
We may not be able to successfully execute our business plan and may not be able to grow our business, whichcould adversely affect our operations and cash flows available for distribution to our unitholders.
Our ability to successfully operate our business, generate sufficient cash to pay the quarterly cashdistributions to our unitholders and to allow for growth, is subject to a number of risks anduncertainties. Similarly, we may not be able to successfully expand our business through acquiring orgrowing our assets, because of various factors, including economic and competitive factors beyond ourcontrol. If we are unable to grow our business, or execute on our business plan including increasing ormaintaining distributions, the market price of the common units is likely to decline.
Alternative financing strategies may not be successful.
Periodically, we may consider the use of alternative financing strategies such as joint venturearrangements and the sale of non-strategic assets. Joint venture arrangements may not share the risksand rewards of ownership in proportion to the voting interests. Joint venture arrangements may requireus to pay certain costs or to make certain capital investments and we may have little control over theamount or the timing of these payments and investments. We may not be able to negotiate terms thatadequately reimburse us for our costs to fulfill service obligations for those joint ventures where we arethe operator. In addition, our joint venture partners may be unable to meet their economic or otherobligations and we may be required to fulfill those obligations alone.
We may periodically sell assets or portions of our business. Separating the existing operations fromour assets or operations of which we dispose may result in significant expense and accounting charges,disrupt our business or divert management’s time and attention. We may not achieve expected costsavings from these dispositions or the proceeds from sales of assets or portions of our business may belower than the net book value of the assets sold. We may not be relieved of all of our obligationsrelated to the assets or businesses sold. These factors could have a material adverse effect on ourrevenues, income from operations, cash flows and our quarterly distribution on our common units.
45
We are subject to operating and litigation risks that may not be covered by insurance.
Our industry is subject to numerous operating hazards and risks incidental to processing,transporting, fractionating and storing natural gas and NGLs and to transporting and storing crude oil.These include:
• damage to pipelines, plants, related equipment and surrounding properties caused by floods,hurricanes and other natural disasters and acts of terrorism;
• inadvertent damage from vehicles and construction and farm equipment;
• leakage of crude oil, natural gas, NGLs and other hydrocarbons into the environment, includinggroundwater;
• fires and explosions; and
• other hazards and conditions, including those associated with various hazardous pollutantemissions, high-sulfur content, or sour gas, and proximity to businesses, homes, or otherpopulated areas, that could also result in personal injury and loss of life, pollution andsuspension of operations.
As a result, we may be a defendant in various legal proceedings and litigation arising from ouroperations. We may not be able to maintain or obtain insurance of the type and amount we desire atreasonable rates. Market conditions could cause certain insurance premiums and deductibles to becomeunavailable, or available only for reduced amounts of coverage. For example, insurance carriers nowrequire broad exclusions for losses due to war risk and terrorist acts. If we were to incur a significantliability for which we were not fully insured, it could have a material adverse effect on our operationsand cash flows available for distribution to our unitholders.
Our business may suffer if any of our key senior executives or other key employees discontinues employmentwith us or if we are unable to recruit and retain highly skilled staff.
Our future success depends to a large extent on the services of our key employees. Our businessdepends on our continuing ability to recruit, train and retain highly qualified employees, includingaccounting, field operations, finance and other key back-office and mid-office personnel. Thecompetition for these employees is intense, and the loss of these employees could harm our business.Our equity based long-term incentive plans are a significant component of our strategy to retain keyemployees. Further, our ability to successfully integrate acquired companies or handle complexitiesrelated to managing joint ventures depends in part on our ability to retain key management andexisting employees at the time of the acquisition.
A shortage of skilled labor may make it difficult for us to maintain labor productivity, and competitive costscould adversely affect our operations and cash flows available for distribution to our unitholders.
Our operations require skilled and experienced laborers with proficiency in multiple tasks. Inrecent years, a shortage of workers trained in various skills associated with the midstream energybusiness has caused us to conduct certain operations without full staff, which decreases our productivityand increases our costs. This shortage of trained workers is the result of the previous generation’sexperienced workers reaching the age for retirement, combined with the difficulty of attracting newlaborers to the midstream energy industry. Thus, this shortage of skilled labor could continue over anextended period. If the shortage of experienced labor continues or worsens, it could have an adverseimpact on our labor productivity and costs and our ability to expand production in the event there is anincrease in the demand for our products and services, which could adversely affect our operations andcash flows available for distribution to our unitholders.
46

If we do not make acquisitions on economically acceptable terms, our future growth may be limited.
Our ability to grow depends in part on our ability to make acquisitions that result in an increase inthe cash generated from operations per unit. If we are unable to make these accretive acquisitionsbecause we are (i) unable to identify attractive acquisition candidates or negotiate acceptable purchasecontracts with them, (ii) unable to obtain financing for these acquisitions on economically acceptableterms, or (iii) outbid by competitors, then our future growth and ability to increase distributions may belimited.
If we are unable to timely and successfully integrate our future acquisitions, our future financial performancemay suffer, and we may fail to realize all of the anticipated benefits of the transaction.
Our future growth may depend in part on our ability to integrate our future acquisitions. Wecannot guarantee that we will successfully integrate any acquisitions into our existing operations, or thatwe will achieve the desired profitability and anticipated results from such acquisitions. Failure toachieve such planned results could adversely affect our operations and cash flows available fordistribution to our unitholders.
The integration of acquisitions with our existing business involves numerous risks, including:
• operating a significantly larger combined organization and integrating additional midstreamoperations into our existing operations;
• difficulties in the assimilation of the assets and operations of the acquired businesses, especiallyif the assets acquired are in a new business segment or geographical area;
• the loss of customers or key employees from the acquired businesses;
• the diversion of management’s attention from other existing business concerns;
• the failure to realize expected synergies and cost savings;
• coordinating geographically disparate organizations, systems and facilities;
• integrating personnel from diverse business backgrounds and organizational cultures; and
• consolidating corporate and administrative functions.
Further, unexpected costs and challenges may arise whenever businesses with different operationsor management are combined, and we may experience unanticipated delays in realizing the benefits ofan acquisition. Following an acquisition, we may discover previously unknown liabilities including thoseunder the same stringent environmental laws and regulations relating to releases of pollutants into theenvironment and environmental protection as are applicable to our existing plants, pipelines andfacilities. If so, our operation of these new assets could cause us to incur increased costs to addressthese liabilities or to attain or maintain compliance with such requirements. If we consummate anyfuture acquisition, our capitalization and results of operation may change significantly, and unitholderswill not have the opportunity to evaluate the economic, financial and other relevant information thatwe may consider in determining the application of these funds and other resources.
We have partial ownership interests in a number of joint venture legal entities, including Pioneer, MarkWestUtica EMG, Bright Star, Wirth and Centrahoma, which could adversely affect our ability to control certaindecisions of these entities. In addition, we may be unable to control the amount of cash we receive from theoperation of these entities and where we do not have control, we could be required to contribute significantcash to fund our share of their operations, which could adversely affect our ability to distribute cash to ourunitholders.
Our inability, or limited ability, to control certain aspects of management of joint venture legalentities that we have a partial ownership interest in may mean that we will not receive the amount ofcash we expect to be distributed to us. In addition, for entities where we have a non-controlling
47

ownership interest, such as in Centrahoma, we will be unable to control ongoing operational decisions,including the incurrence of capital expenditures that we may be required to fund. Specifically,
• We may have limited ability to influence certain management decisions with respect to theseentities and their subsidiaries, including decisions with respect to incurrence of expenses anddistributions to us;
• These entities may establish reserves for working capital, capital projects, environmental mattersand legal proceedings, which would otherwise reduce cash available for distribution to us;
• These entities may incur additional indebtedness, and principal and interest made on suchindebtedness may reduce cash otherwise available for distribution to us; and
• These entities may require us to make additional capital contributions to fund working capitaland capital expenditures, our funding of which could reduce the amount of cash otherwiseavailable for distribution.
All of these things could significantly and adversely impact our ability to distribute cash to ourunitholders.
Certain changes in accounting and/or financial reporting standards issued by the FASB, the SEC or otherstandard-setting bodies could have a material adverse impact on our financial position or results ofoperations.
We are subject to the application of GAAP, which periodically is revised and/or expanded. As such,we periodically are required to adopt new or revised accounting and/or financial reporting standardsissued by recognized accounting standard setters or regulators, including the FASB and the SEC. It ispossible that future requirements, including the proposed implementation of, or convergence with,IFRS, could change our current application of GAAP. Changes in the application of GAAP and thecosts of implementing such changes could result in a material adverse impact on our financial positionor results of operations.
The potential requirement to convert our financial statements from being prepared in conformity with GAAPto IFRS may strain our resources and increase our annual expenses.
The SEC may require in the future that we report our financial results under IFRS instead ofGAAP. IFRS is a set of accounting principles that has been gaining acceptance on a worldwide basis.These standards are published by the London-based International Accounting Standards Board and aremore focused on objectives and principles and less reliant on detailed rules than GAAP. Today, thereremain significant and material differences in several key areas between GAAP and IFRS which wouldaffect us. Additionally, GAAP provides specific guidance in classes of accounting transactions for whichequivalent guidance in IFRS does not exist. The adoption of IFRS is highly complex and would havean impact on many aspects and operations of us, including but not limited to financial accounting andreporting systems, internal controls, taxes, borrowing covenants and cash management. It is expectedthat a significant amount of time, internal and external resources and expenses over a multi-year periodwould be required for this conversion.
48

Risks Related to Our Partnership Structure
We may issue additional common units without unitholder approval, which would dilute current unitholderownership interests.
The General Partner, without your approval, may cause us to issue additional common units orother equity securities of equal rank with or senior to the common units.
The issuance of additional common units or other equity securities of equal or senior rank willhave the following effects:
• the unitholders’ proportionate ownership interest will decrease;
• the amount of cash available for distribution on each common unit may decrease;
• the relative voting strength of each previously outstanding common unit may be diminished;
• the market price of the common units may decline; and
• the ratio of taxable income to distributions may increase.
Unitholders have less ability to influence management’s decisions than holders of common stock in acorporation.
Unlike the holders of common stock in a corporation, unitholders have more limited voting rightson matters affecting our business, and therefore a more limited ability to influence management’sdecisions regarding our business. The amended and restated partnership agreement provides that theGeneral Partner may not withdraw and may not be removed at any time for any reason whatsoever.Furthermore, if any person or group other than the General Partner and its affiliates acquiresbeneficial ownership of 20% or more of any class of units (without the prior approval of the Board),that person or group loses voting rights on all of its units. However, if unitholders are dissatisfied withthe performance of our General Partner, they have the right to annually elect its board of directors.
Unitholders may not have limited liability if a court finds that unitholder action constitutes control of ourbusiness.
Under Delaware law, unitholders could be held liable for our obligations as a general partner if acourt determined that the right or the exercise of the right by unitholders as a group to approve certaintransactions or amendments to the agreement of limited partnership, or to take other action under thePartnership Agreement, was considered participation in the ‘‘control’’ of our business. Unitholders electthe members of the Board, which may be deemed to be participation in the ‘‘control’’ of our business.This could subject unitholders to liability as a general partner.
In addition, Section 17-607 of the Delaware Revised Uniform Limited Partnership Act providesthat, under some circumstances, a unitholder may be liable to us for the amount of a distribution for aperiod of three years from the date of the distribution.
Tax Risks Related to Owning our Common Units
Our tax treatment depends on our status as a partnership for federal income tax purposes. If the InternalRevenue Service (‘‘IRS’’) were to treat us as a corporation for federal income tax purposes or we were tobecome subject to a material amount of entity-level taxation, then our cash available for distribution tounitholders would be substantially reduced.
The anticipated after-tax benefit of an investment in the common units depends largely on ourbeing treated as a partnership for federal income tax purposes. We have not requested, and do not planto request, a ruling from the IRS on this or any other matter affecting us.
49

Despite the fact that we are a limited partnership under Delaware law, it is possible in certaincircumstances for a partnership such as ours to be treated as a corporation for federal income taxpurposes. Although we do not believe, based on our current operations that we are so treated, achange in our business or a change in current law could cause us to be treated as a corporation forfederal income tax purposes or otherwise subject us to taxation as an entity.
If we were treated as a corporation for federal income tax purposes, we would pay federal incometax on our income at the corporate tax rate, which is currently a maximum of 35%, and would likelypay state income tax at varying rates. Distributions to our unitholders would generally be taxed again ascorporate distributions, and no income, gains, losses, deductions or credits would flow through to ourunitholders. Because a tax would be imposed upon us as a corporation, our cash available fordistribution to our unitholders would be substantially reduced. Therefore, our treatment as acorporation would result in a material reduction in the anticipated cash flow and after-tax return to ourunitholders, likely causing a substantial reduction in the value of the common units.
Current law may change, causing us to be treated as a corporation for federal income tax purposesor otherwise subjecting us to entity-level taxation. The present federal income tax treatment of publiclytraded partnerships, including us, or an investment in our common units may be modified by legislative,judicial or administrative changes and differing interpretations at any time. Any modification to thefederal income tax laws and interpretations thereof may or may not be applied retroactively. Forexample, members of Congress have considered substantive changes to the existing U.S. tax laws thatwould have affected certain publicly traded partnerships. Although the proposed legislation would notaffect our tax treatment as a partnership, we are unable to predict whether any of these changes orother proposals, will be reintroduced or will ultimately be enacted. Any such changes could negativelyimpact the value of an investment in our common units.
The partnership agreement provides that if a law is enacted or existing law is modified orinterpreted in a manner that subjects us to taxation as a corporation or otherwise subjects us to entity-level taxation for federal, state or local income tax purposes, then the minimum quarterly distributionamount and the target distribution amounts may be reduced to reflect the impact of that law on us.
If we were subjected to a material amount of additional entity-level taxation or other fees by individual states,it would reduce our cash available for distribution to unitholders.
Changes in current state law may subject us to additional entity-level taxation or fees imposed byindividual states. Because of widespread state budget deficits and other reasons, several states areevaluating ways to subject partnerships to entity-level taxation through the imposition of state income,franchise, use, property, ad valorem and other forms of taxation or permit, impact, throughput andmiscellaneous other fees. Imposition of any such taxes or fees may substantially reduce the cashavailable for distribution to our unitholders. For example, the state of Texas has instituted an income-based tax that results in an entity level tax for us. We are required to pay a Texas franchise tax of 1.0%of our gross margin that is apportioned to Texas in the prior year. The imposition of entity level taxeson us by any other state may reduce the cash available for distribution to our unitholders.
If the IRS contests the federal income tax positions we take, the market for our common units may beadversely impacted and the cost of any IRS contest will reduce our cash available for distribution to ourunitholders.
We have not requested a ruling from the IRS with respect to our treatment as a partnership forfederal income tax purposes or any other matter affecting us. The IRS may adopt positions that differfrom the positions we take. It may be necessary to resort to administrative or court proceedings tosustain some or all of the positions we take. A court may not agree with some or all of the positionswe take. Any contest with the IRS may materially and adversely impact the market for our common
50

units and the price at which they trade. In addition, our costs of any contest with the IRS will be borneindirectly by our unitholders and the General Partner because the costs will reduce our cash availablefor distribution.
A unitholder may be required to pay taxes on his share of our income even if the unitholder does not receiveany cash distributions from us.
Because our unitholders will be treated as partners to whom we will allocate taxable income whichcould be different in amount than the cash we distribute, each unitholder will be required to pay anyfederal income taxes and, in some cases, state and local income taxes on his share of our taxableincome even if the unitholder receives no cash distributions from us. A unitholder may not receive cashdistributions from us equal to his share of our taxable income or even equal to the actual tax liabilitythat results from that income.
Tax gain or loss on the disposition of our common units could be more or less than expected.
If a unitholder sells his common units, he will recognize a gain or loss equal to the differencebetween the amount realized and his tax basis in those common units. Because distributions in excessof the unitholder’s allocable share of our net taxable income decrease the unitholder’s tax basis in hiscommon units, the amount, if any, of such prior excess distributions with respect to the common unitsthe unitholder sells will, in effect, become taxable income to the unitholder if the unitholder sells suchcommon units at a price greater than his tax basis in those common units, even if the price theunitholder receives is less than his original cost. Furthermore, a substantial portion of the amountrealized, whether or not representing gain, may be taxed as ordinary income due to potential recaptureitems, including depreciation recapture. In addition, because the amount realized includes aunitholder’s share of our nonrecourse liabilities, if a unitholder sells common units, the unitholder mayincur a tax liability in excess of the amount of cash the unitholder receives from the sale.
Tax-exempt entities and non-U.S. persons face unique tax issues from owning our common units that mayresult in adverse tax consequences to them.
Investment in our common units by tax-exempt entities, such as employee benefit plans, individualretirement accounts (known as IRAs), and non-U.S. persons raises issues unique to them. For example,virtually all of our income allocated to organizations that are exempt from federal income tax, includingIRAs and other retirement plans, will be unrelated business taxable income and could be taxable tothem. Distributions to non-U.S. persons will be reduced by withholding taxes at the highest applicabletax rate, and non-U.S. persons will be required to file federal tax returns and pay tax on their share ofour taxable income. If a unitholder is a tax exempt entity or a non-U.S. person, the unitholder shouldconsult a tax advisor before investing in our common units.
We treat each purchaser of our common units as having the same tax benefits without regard to the actualcommon units purchased. The IRS may challenge this treatment, which could adversely affect the value of ourcommon units.
To maintain the uniformity of the economic and tax characteristics of our common units, we haveadopted depreciation and amortization positions that may not conform to all aspects of existingTreasury Regulations. A successful IRS challenge to those positions could adversely affect the amountof tax benefits available to our unitholders. It also could affect the timing of these tax benefits or theamount of gain from a unitholder’s sale of our common units and could have a negative impact on thevalue of our common units or result in audit adjustments to a unitholder’s tax returns.
51
We prorate our items of income, gain, loss and deduction between transferors and transferees of our commonunits each month based upon the ownership of the common units on the first day of each month, instead ofon the basis of the date a particular common unit is transferred. The IRS may challenge this treatment, whichcould change the allocation of items of income, gain, loss and deduction among our unitholders.
We prorate our items of income, gain, loss and deduction between transferors and transferees ofour units each month based upon the ownership of the units on the first day of each month, instead ofon the basis of the date a particular common unit is transferred. The use of this proration method maynot be permitted under existing Treasury Regulations. Recently, however, the U.S. Treasury Departmentissued proposed Treasury Regulations that provide a safe harbor pursuant to which a publicly tradedpartnership may use a similar monthly simplifying convention to allocate tax items among transferorand transferee unitholders. Nonetheless, the proposed regulations do not specifically authorize the useof the proration method we have adopted. If the IRS were to challenge our proration method or newTreasury Regulations were issued, we may be required to change the allocation of items of income,gain, loss and deduction among our unitholders.
A unitholder whose common units are loaned to a ‘‘short seller’’ to cover a short sale of common units maybe considered as having disposed of those common units. If so, the unitholder would no longer be treated, fortax purposes, as a partner with respect to those common units during the period of the loan and mayrecognize gain or loss from the disposition.
Because a unitholder whose common units are loaned to a ‘‘short seller’’ to cover a short sale ofcommon units may be considered as having disposed of the loaned units, the unitholder may no longerbe treated for tax purposes as a partner with respect to those common units during the period of theloan to the short seller and the unitholder may recognize gain or loss from such disposition. Moreover,during the period of the loan to the short seller, any of our income, gain, loss or deduction with respectto those common units may not be reportable by the unitholder and any cash distributions received bythe unitholder as to those common units could be fully taxable as ordinary income. Unitholdersdesiring to assure their status as partners and avoid the risk of gain recognition from a loan to a shortseller are urged to modify any applicable brokerage account agreements to prohibit their brokers fromlending their common units.
We have adopted certain valuation methodologies that may result in a shift of income, gain, loss anddeduction between the Class A and Class B unitholders and our common unitholders. The IRS may challengethis treatment, which could adversely affect the value of our common units.
When we issue additional common units or engage in certain other transactions, we determine thefair market value of our assets and allocate any unrealized gain or loss attributable to our assets to thecapital accounts of our common unitholders, the Class A unitholders and Class B unitholders. Ourmethodology may be viewed as understating the value of our assets. In that case, there may be a shiftof income, gain, loss and deduction between certain unitholders, which may have an unfavorable effect.Moreover, under our valuation methods, subsequent purchasers of common units may have a greaterportion of their Internal Revenue Code Section 743(b) adjustment allocated to our tangible assets anda lesser portion allocated to our intangible assets. The IRS may challenge our valuation methods, orour allocation of the Section 743(b) adjustment attributable to our tangible and intangible assets, andallocations of income, gain, loss and deduction between our unitholders.
A successful IRS challenge to these methods or allocations could adversely affect the amount oftaxable income or loss being allocated to our unitholders. It also could affect the amount of gain fromthe sale of common units by our unitholders and could have a negative impact on the value of ourcommon units or result in audit adjustments to the tax returns of our unitholders without the benefit ofadditional deductions.
52
The sale or exchange of 50% or more of our capital and profits interests during any twelve-month period willresult in the termination of our partnership for federal income tax purposes.
We will be considered to have technically terminated, for federal income tax purposes, if there is asale or exchange of 50% or more of the total interests in our capital and profits within a twelve-monthperiod. For purposes of determining whether the 50% threshold has been met, multiple sales of thesame interest will be counted only once. Our termination would, among other things, result in theclosing of our taxable year for all unitholders, which would result in our filing two tax returns for onefiscal year and may result in a significant deferral of depreciation deductions allowable in computingour taxable income. In the case of a unitholder reporting on a taxable year other than a calendar year,the closing of our taxable year may also result in more than twelve months of our taxable income orloss being includable in his taxable income for the year of termination. Our termination currently wouldnot affect our classification as a partnership for federal income tax purposes, but would result in ourbeing treated as a new partnership for tax purposes. If we were treated as a new partnership, we wouldbe required to make new tax elections and could be subject to penalties if we were unable to determinethat a termination occurred. The IRS has recently announced a relief procedure whereby if a publiclytraded partnership that has technically terminated requests and the IRS grants special relief, amongother things, the partnership may be permitted to provide only a single Schedule K-1 to unitholders forthe tax years in which the termination occurs.
Our unitholders will likely be subject to state and local taxes and return filing requirements in states wherethe unitholders do not live as a result of investing in common units.
In addition to federal income taxes, our unitholders will likely be subject to other taxes, includingforeign, state and local taxes, unincorporated business taxes and estate, inheritance or intangible taxesthat are imposed by the various jurisdictions in which we conduct business or own property now or inthe future, even if our unitholders do not live in any of those jurisdictions. Our unitholders will likelybe required to file foreign, state and local income tax returns and pay state and local income taxes insome or all of these various jurisdictions. Further, our unitholders may be subject to penalties forfailure to comply with those requirements. We currently do business or own property in nine states,most of which, other than Texas, impose personal income taxes. Most of these states also impose anincome tax on corporations and other entities. As we make acquisitions or expand our business, wemay own assets or conduct business in additional states that impose a personal income tax. It is ourunitholder’s responsibility to file all United States federal, foreign, state and local tax returns.
ITEM 1B. Unresolved Staff Comments
None.
53
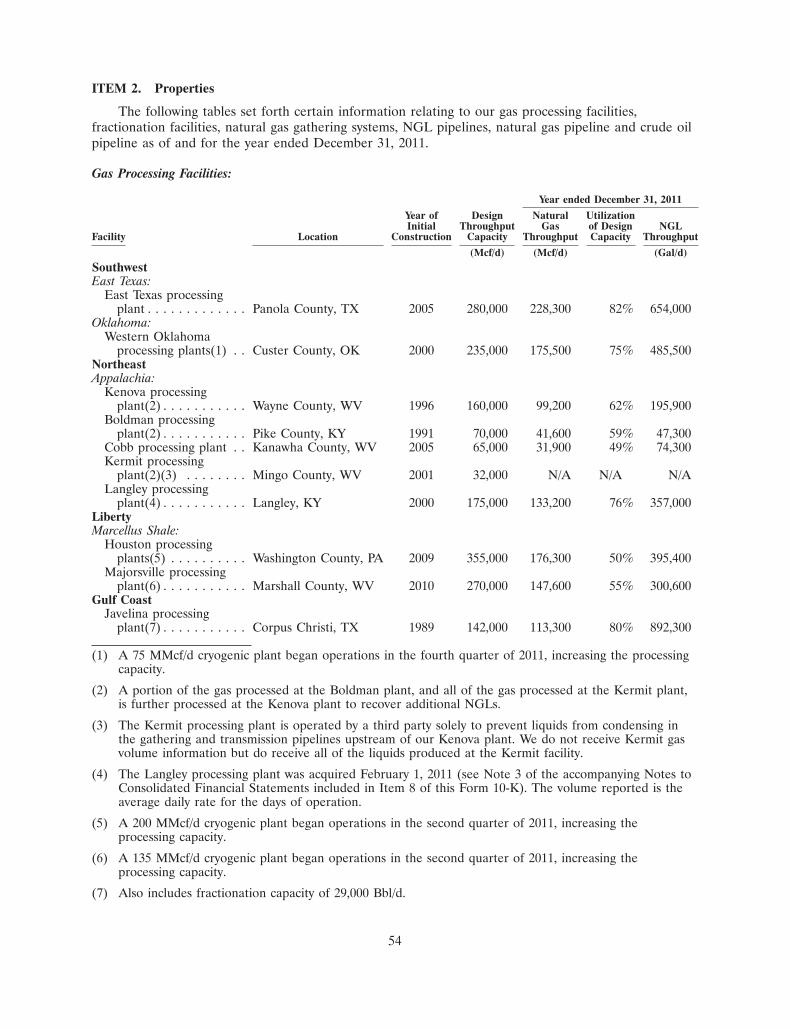
ITEM 2. Properties
The following tables set forth certain information relating to our gas processing facilities,fractionation facilities, natural gas gathering systems, NGL pipelines, natural gas pipeline and crude oilpipeline as of and for the year ended December 31, 2011.
Gas Processing Facilities:
Year ended December 31, 2011
Year of Design Natural UtilizationInitial Throughput Gas of Design NGL
Facility Location Construction Capacity Throughput Capacity Throughput
(Mcf/d) (Mcf/d) (Gal/d)SouthwestEast Texas:
East Texas processingplant . . . . . . . . . . . . . Panola County, TX 2005 280,000 228,300 82% 654,000
Oklahoma:Western Oklahoma
processing plants(1) . . Custer County, OK 2000 235,000 175,500 75% 485,500NortheastAppalachia:
Kenova processingplant(2) . . . . . . . . . . . Wayne County, WV 1996 160,000 99,200 62% 195,900
Boldman processingplant(2) . . . . . . . . . . . Pike County, KY 1991 70,000 41,600 59% 47,300
Cobb processing plant . . Kanawha County, WV 2005 65,000 31,900 49% 74,300Kermit processing
plant(2)(3) . . . . . . . . Mingo County, WV 2001 32,000 N/A N/A N/ALangley processing
plant(4) . . . . . . . . . . . Langley, KY 2000 175,000 133,200 76% 357,000LibertyMarcellus Shale:
Houston processingplants(5) . . . . . . . . . . Washington County, PA 2009 355,000 176,300 50% 395,400
Majorsville processingplant(6) . . . . . . . . . . . Marshall County, WV 2010 270,000 147,600 55% 300,600
Gulf CoastJavelina processing
plant(7) . . . . . . . . . . . Corpus Christi, TX 1989 142,000 113,300 80% 892,300
(1) A 75 MMcf/d cryogenic plant began operations in the fourth quarter of 2011, increasing the processingcapacity.
(2) A portion of the gas processed at the Boldman plant, and all of the gas processed at the Kermit plant,is further processed at the Kenova plant to recover additional NGLs.
(3) The Kermit processing plant is operated by a third party solely to prevent liquids from condensing inthe gathering and transmission pipelines upstream of our Kenova plant. We do not receive Kermit gasvolume information but do receive all of the liquids produced at the Kermit facility.
(4) The Langley processing plant was acquired February 1, 2011 (see Note 3 of the accompanying Notes toConsolidated Financial Statements included in Item 8 of this Form 10-K). The volume reported is theaverage daily rate for the days of operation.
(5) A 200 MMcf/d cryogenic plant began operations in the second quarter of 2011, increasing theprocessing capacity.
(6) A 135 MMcf/d cryogenic plant began operations in the second quarter of 2011, increasing theprocessing capacity.
(7) Also includes fractionation capacity of 29,000 Bbl/d.
54
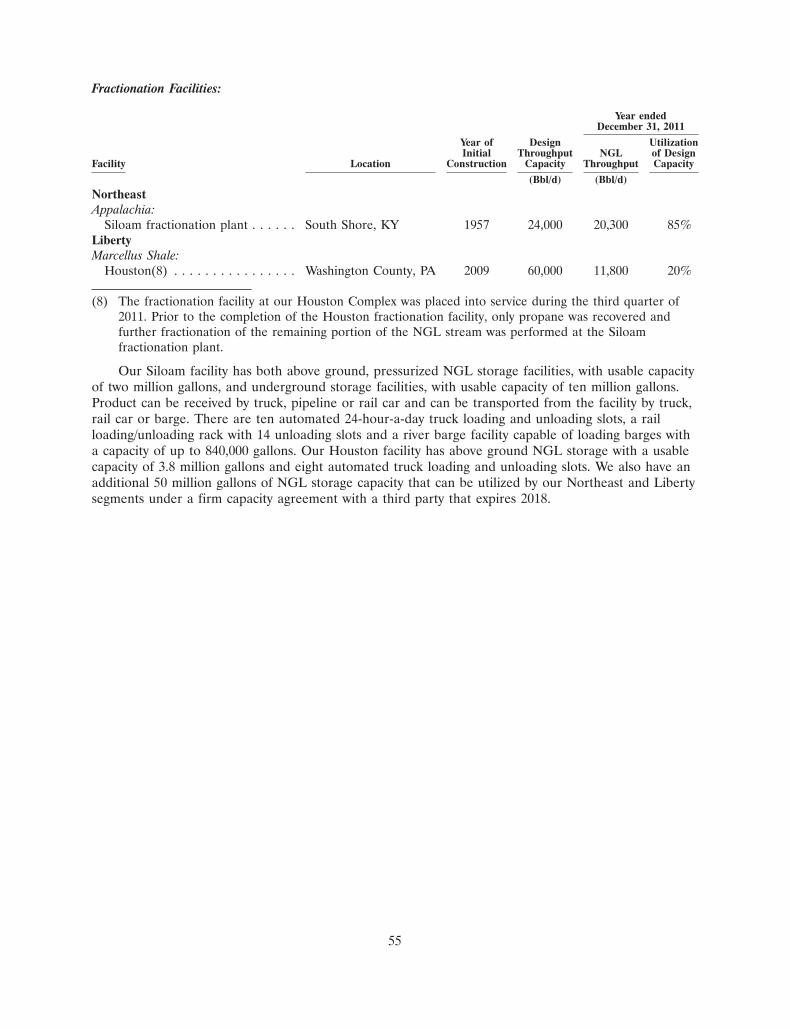
Fractionation Facilities:
Year endedDecember 31, 2011
Year of Design UtilizationInitial Throughput NGL of Design
Facility Location Construction Capacity Throughput Capacity
(Bbl/d) (Bbl/d)NortheastAppalachia:
Siloam fractionation plant . . . . . . South Shore, KY 1957 24,000 20,300 85%LibertyMarcellus Shale:
Houston(8) . . . . . . . . . . . . . . . . Washington County, PA 2009 60,000 11,800 20%
(8) The fractionation facility at our Houston Complex was placed into service during the third quarter of2011. Prior to the completion of the Houston fractionation facility, only propane was recovered andfurther fractionation of the remaining portion of the NGL stream was performed at the Siloamfractionation plant.
Our Siloam facility has both above ground, pressurized NGL storage facilities, with usable capacityof two million gallons, and underground storage facilities, with usable capacity of ten million gallons.Product can be received by truck, pipeline or rail car and can be transported from the facility by truck,rail car or barge. There are ten automated 24-hour-a-day truck loading and unloading slots, a railloading/unloading rack with 14 unloading slots and a river barge facility capable of loading barges witha capacity of up to 840,000 gallons. Our Houston facility has above ground NGL storage with a usablecapacity of 3.8 million gallons and eight automated truck loading and unloading slots. We also have anadditional 50 million gallons of NGL storage capacity that can be utilized by our Northeast and Libertysegments under a firm capacity agreement with a third party that expires 2018.
55

Natural Gas Gathering Systems:
Year endedDecember 31, 2011
Year of Design Natural UtilizationInitial Throughput Gas of Design
Facility Location Construction Capacity Throughput Capacity
(Mcf/d) (Mcf/d)SouthwestEast Texas:
East Texas gathering system . . . . . Panola County, TX 1990 500,000 423,600 85%Oklahoma:
Western Oklahoma gatheringsystem . . . . . . . . . . . . . . . . . . . Wheeler County, TX 1998 405,000 237,900 59%
and Roger Mills, Ellis,Custer and BeckhamCounties, OK
Southeast Oklahoma gatheringsystem . . . . . . . . . . . . . . . . . . . Hughes, Pittsburg and 2006 550,000 511,900 93%
Coal Counties, OKOther Southwest:
Other Southwest gatheringsystems(9) . . . . . . . . . . . . . . . . Various Various 121,500 29,900 25%
LibertyMarcellus Shale:
Gas gathering system . . . . . . . . . . Washington County, PA 2008 325,000 245,700 76%
(9) Excludes lateral pipelines where revenue is not based on throughput.
NGL Pipelines:
Year ended December 31,2011
Year of Design UtilizationInitial Throughput NGL of Design
Pipeline Location Construction Capacity Throughput Capacity
(Bbl/d) (Bbl/d)NortheastAppalachia:
Langley to Siloam(10) . . . . . . . . . Langley, KY to 1957 19,000 12,600 66%South Shore, KY
SouthwestEast Texas:
East Texas liquid line . . . . . . . . . . Panola County, 2005 25,000 15,600 62%TX
LibertyMarcellus Shale:
Majorsville to Houston . . . . . . . . Washington 2010 43,400 7,200 17%County, PA
Fort Beeler to Majorsville(11) . . . . Marshall County, 2011 45,000 1,700 4%WV to WashingtonCounty, PA
(10) NGLs transported through the Langley to Ranger and Ranger to Kenova pipelines are combined withNGLs recovered at the Kenova facility. The volume reported for the Langley to Siloam pipelinerepresents the combined NGL stream.
(11) The Fort Beeler to Majorsville pipeline was placed into service during the fourth quarter of 2011. Thevolume reported is the average daily rate for the days of operation.
56

Natural Gas Pipeline:
Year ended December 31,2011
Year of Design UtilizationInitial Throughput Natural Gas of Design
Pipeline Location Construction Capacity Throughput Capacity
(Dth/d) (Dth/d)
SouthwestOklahoma:
Arkoma ConnectorPipeline(12) . . . . . . . . . . Coal County, OK to 2009 638,000 271,400 43%
Bryan County, OK
(12) The Arkoma Connector Pipeline is a joint venture with Arkoma Pipeline Partners, LLC(‘‘ArcLight’’), an affiliate of ArcLight Capital Partners, LLC. One of our wholly-owned subsidiariesserves as the operator (see Note 4 of the accompanying Notes to Consolidated FinancialStatements included in Item 8 of this Form 10-K).
Crude Oil Pipeline:
Year ended December 31,2011
Year of Design UtilizationInitial Throughput NGL of Design
Pipeline Location Construction Capacity Throughput Capacity
(Bbl/d) (Bbl/d)
NortheastMichigan:
Michigan crude pipeline . . . . . . Manistee County, 1973 60,000 10,300 17%MI to CrawfordCounty, MI
Title to Properties
Substantially all of our pipelines are constructed on rights-of-way granted by the owners of recordof the property. Lands over which pipeline rights-of-way have been obtained may be subject to priorliens that have not been subordinated to the right-of-way grants. We have obtained, where determinednecessary, permits, leases, license agreements and franchise ordinances from public authorities to crossover or under, or to lay facilities in or along water courses, county roads, municipal streets and statehighways, as applicable. We also have obtained easements and license agreements from railroadcompanies to cross over or under railroad properties or rights-of-way. Many of these authorizations andgrants are revocable at the election of the grantor. In some cases, property on which our pipelines werebuilt was purchased in fee or held under long-term leases. Certain of our facilities, including ourSiloam and Houston fractionation plants and several of our processing plants, are on land that we ownin fee.
Some of the leases, easements, rights-of-way, permits, licenses and franchise ordinances that weretransferred to us required the consent of the then-current landowner to transfer these rights, which insome instances was a governmental entity. We believe that we have obtained sufficient third-partyconsents, permits and authorizations for the transfer of the assets necessary for us to operate ourbusiness. We also believe we have satisfactory title or other right to all of our material land assets. Titleto these properties is subject to encumbrances in some cases; however, we believe that none of these
57
burdens will materially detract from the value of these properties or from our interest in theseproperties, or will materially interfere with their use in the operation of our business.
We have pledged substantially all of our assets and those of our wholly-owned subsidiaries, otherthan MarkWest Liberty Midstream, as collateral for borrowings under our Credit Facility.
ITEM 3. Legal Proceedings
We are subject to a variety of risks and disputes, and are a party to various legal and regulatoryproceedings in the normal course of our business. We maintain insurance policies in amounts and withcoverage and deductibles as we believe reasonable and prudent. However, we cannot be assured thatthe insurance companies will promptly honor their policy obligations or that the coverage or levels ofinsurance will be adequate to protect us from all material expenses related to future claims for propertyloss or business interruption to us, or for third-party claims of personal and property damage or thatthe coverages or levels of insurance we currently have will be available in the future at economicalprices. While it is not possible to predict the outcome of the legal actions with certainty, managementis of the opinion that appropriate provisions and accruals for potential losses associated with all legalactions have been made in the consolidated financial statements and that none of these actions, eitherindividually or in the aggregate, will have a material adverse effect on our financial condition, liquidityor results of operation.
In June 2006, the Office of Pipeline Safety (‘‘OPS’’) issued a Notice of Probable Violation andProposed Civil Penalty (‘‘NOPV’’) (CPF No. 2-2006-5001) to both MarkWest Hydrocarbon andEquitable Production Company (‘‘Equitable’’). The NOPV is associated with the pipeline leak and anensuing explosion and fire that occurred on November 8, 2004 in Ivel, Kentucky on an NGL pipelineowned by Equitable and leased and operated by a subsidiary of the Partnership, MarkWest EnergyAppalachia, L.L.C. The NOPV sets forth six counts of violations of applicable regulations, and aproposed civil penalty in the aggregate amount of $1.1 million. In March 2011, MarkWest received anorder assessing a penalty solely against Equitable for count one of the NOPV in the amount of$0.5 million and assessing a penalty jointly and severally against MarkWest and Equitable for four ofthe other counts in the NOPV in the amount of $0.2 million. In March 2011, the parties filed separatepetitions for reconsideration. In January 2012, the Agency issued an order that dismissed the penaltyassessed solely against Equitable but retained the $0.2 million penalty assessed jointly and severallyagainst MarkWest and Equitable. MarkWest did not appeal the Agency’s decision and paid the entirepenalty.
ITEM 4. Mine Safety Disclosures
Not applicable.
58

PART II
ITEM 5. Market for Registrant’s Common Units, Related Unitholder Matters and Issuer Purchasesof Equity Securities
Our common units have been listed on the New York Stock Exchange (‘‘NYSE’’), under thesymbol ‘‘MWE,’’ since May 2, 2007. Our common units had been traded on the American StockExchange, under the symbol ‘‘MWE,’’ from May 24, 2002 to May 2, 2007. Prior to May 24, 2002, ourequity securities were not listed on any exchange or traded on any public trading market.
The following table sets forth the high and low sales prices of the common units as reported byNYSE, as well as the amount of cash distributions paid per quarter for 2011 and 2010:
Unit Price Distributions PerQuarter Ended High Low Common Unit Declaration Date Record Date Payment Date
December 31, 2011 . . $56.82 $42.18 $0.76 January 26, 2012 February 6, 2012 February 14, 2012September 30, 2011. . 50.06 39.00 0.73 October 18, 2011 November 7, 2011 November 14, 2011June 30, 2011 . . . . . . 51.70 42.80 0.70 July 21, 2011 August 1, 2011 August 12, 2011March 31, 2011 . . . . . 48.50 40.80 0.67 April 21, 2011 May 2, 2011 May 13, 2011December 31, 2010 . . 43.51 35.70 0.65 January 27, 2011 February 7, 2011 February 14, 2011September 30, 2010. . 37.00 31.50 0.64 October 27, 2010 November 8, 2010 November 12, 2010June 30, 2010 . . . . . . 33.45 20.96 0.64 July 22, 2010 August 2, 2010 August 13, 2010March 31, 2010 . . . . . 32.00 26.05 0.64 April 22, 2010 May 3, 2010 May 14, 2010December 31, 2009 . . 29.94 22.20 0.64 January 26, 2010 February 5, 2010 February 12, 2010
As of February 17, 2012, there were approximately 177 holders of record of our common units.
Distributions of Available Cash
Within 45 days after the end of each quarter, we distribute all of our ‘‘Available Cash’’ tounitholders of record on the applicable record date. We make distributions of ‘‘Available Cash’’ to allcommon and Class A unitholders, pro rata and we make distributions of Hydrocarbon Available Cash(as defined in our amended and restated partnership agreement) pro rata to common unitholders.Class B unitholders do not receive cash distributions. We define ‘‘Available Cash’’ in our amended andrestated partnership agreement, and we generally mean, for each fiscal quarter:
• all cash and cash equivalents on hand at the end of the quarter;
• less the amount of cash that the General Partner determines, in its reasonable discretion, isnecessary or appropriate to:
• provide for the proper conduct of our business;
• comply with applicable law, any of our debt instruments or other agreements; or
• provide funds for distributions to unitholders for any one or more of the next four quarters;
• plus all cash and cash equivalents on hand on the date of determination of available cash for thequarter resulting from working capital borrowings made after the end of the quarter. Workingcapital borrowings are generally borrowings that are made under our Credit Facility and in allcases are used solely for working capital purposes or to pay distributions to partners.
Generally, Hydrocarbon Available Cash is defined as all cash and cash equivalents on hand derivedfrom or attributable to our ownership of, or sale or other disposition of, the shares of common stock ofMarkWest Hydrocarbon.
Our ability to distribute available cash is contractually restricted by the terms of our creditagreement. Our credit agreement contains covenants requiring us to maintain certain financial ratios
59

and a minimum net worth. We are prohibited from making any distribution to unitholders if suchdistribution would cause an event of default or otherwise violate a covenant under our creditagreement. There is no guarantee that we will pay a quarterly distribution on the common units in anyquarter.
Distributions of Cash Upon Liquidation
If we dissolve in accordance with the amended and restated partnership agreement, we will sell orotherwise dispose of our assets in a process called liquidation. We will first apply the proceeds ofliquidation to the payment of our creditors. We will distribute any remaining proceeds to theunitholders, which will include the holders of Class B units that convert upon liquidation, in accordancewith their capital account balances, as adjusted to reflect any gain or loss upon the sale or otherdisposition of our assets in liquidation.
Securities Authorized for Issuance under Equity Compensation Plans
The following table provides information as of December 31, 2011, regarding our common unitsthat may be issued upon conversion of outstanding phantom units granted under all of our existingequity compensation plans that have been approved by security holders. There are no active plans thathave not been approved by security holders.
Number ofNumber of Weighted securities
securities to be average remainingissued upon exercise price available forexercise of of outstanding future issuance
outstanding options, under equityoptions, warrants warrants and compensation
and rights(1) rights(2) plans
Equity compensation plans approved bysecurity holders:2008 Long-Term Incentive Plan . . . . . 935,509 $— 858,438
(1) Includes 282,000 units that vest if we achieve various performance or market-basedtargets determined by the Compensation Committee of the Board. 141,000 of theseperformance based units vested in January 2012 and 141,000 units were forfeited.
(2) Phantom units are granted with no exercise price.
Recent Sales of Unregistered Units
The Partnership issued approximately 19,954,000 Class B Units to EMG as part of our acquisitionof the non-controlling interest in MarkWest Liberty Midstream which was effective December 31, 2011.See Note 4 of the accompanying Notes to Consolidated Financial Statements included in Item 8 of thisForm 10-K for further discussion of the acquisition of non-controlling interest.
Repurchase of Equity by MarkWest Energy Partners, L.P.
None.
60
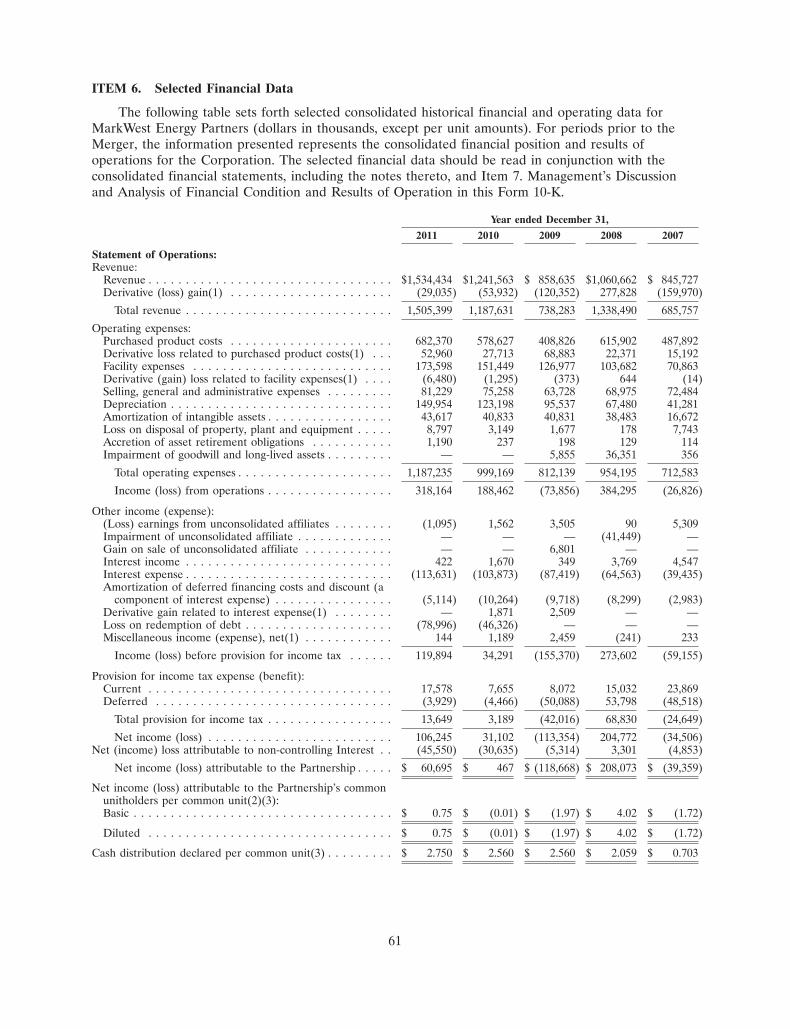
ITEM 6. Selected Financial Data
The following table sets forth selected consolidated historical financial and operating data forMarkWest Energy Partners (dollars in thousands, except per unit amounts). For periods prior to theMerger, the information presented represents the consolidated financial position and results ofoperations for the Corporation. The selected financial data should be read in conjunction with theconsolidated financial statements, including the notes thereto, and Item 7. Management’s Discussionand Analysis of Financial Condition and Results of Operation in this Form 10-K.
Year ended December 31,
2011 2010 2009 2008 2007
Statement of Operations:Revenue:
Revenue . . . . . . . . . . . . . . . . . . . . . . . . . . . . . . . . . $1,534,434 $1,241,563 $ 858,635 $1,060,662 $ 845,727Derivative (loss) gain(1) . . . . . . . . . . . . . . . . . . . . . . (29,035) (53,932) (120,352) 277,828 (159,970)
Total revenue . . . . . . . . . . . . . . . . . . . . . . . . . . . . 1,505,399 1,187,631 738,283 1,338,490 685,757
Operating expenses:Purchased product costs . . . . . . . . . . . . . . . . . . . . . . 682,370 578,627 408,826 615,902 487,892Derivative loss related to purchased product costs(1) . . . 52,960 27,713 68,883 22,371 15,192Facility expenses . . . . . . . . . . . . . . . . . . . . . . . . . . . 173,598 151,449 126,977 103,682 70,863Derivative (gain) loss related to facility expenses(1) . . . . (6,480) (1,295) (373) 644 (14)Selling, general and administrative expenses . . . . . . . . . 81,229 75,258 63,728 68,975 72,484Depreciation . . . . . . . . . . . . . . . . . . . . . . . . . . . . . . 149,954 123,198 95,537 67,480 41,281Amortization of intangible assets . . . . . . . . . . . . . . . . . 43,617 40,833 40,831 38,483 16,672Loss on disposal of property, plant and equipment . . . . . 8,797 3,149 1,677 178 7,743Accretion of asset retirement obligations . . . . . . . . . . . 1,190 237 198 129 114Impairment of goodwill and long-lived assets . . . . . . . . . — — 5,855 36,351 356
Total operating expenses . . . . . . . . . . . . . . . . . . . . . 1,187,235 999,169 812,139 954,195 712,583
Income (loss) from operations . . . . . . . . . . . . . . . . . 318,164 188,462 (73,856) 384,295 (26,826)
Other income (expense):(Loss) earnings from unconsolidated affiliates . . . . . . . . (1,095) 1,562 3,505 90 5,309Impairment of unconsolidated affiliate . . . . . . . . . . . . . — — — (41,449) —Gain on sale of unconsolidated affiliate . . . . . . . . . . . . — — 6,801 — —Interest income . . . . . . . . . . . . . . . . . . . . . . . . . . . . 422 1,670 349 3,769 4,547Interest expense . . . . . . . . . . . . . . . . . . . . . . . . . . . . (113,631) (103,873) (87,419) (64,563) (39,435)Amortization of deferred financing costs and discount (a
component of interest expense) . . . . . . . . . . . . . . . . (5,114) (10,264) (9,718) (8,299) (2,983)Derivative gain related to interest expense(1) . . . . . . . . — 1,871 2,509 — —Loss on redemption of debt . . . . . . . . . . . . . . . . . . . . (78,996) (46,326) — — —Miscellaneous income (expense), net(1) . . . . . . . . . . . . 144 1,189 2,459 (241) 233
Income (loss) before provision for income tax . . . . . . 119,894 34,291 (155,370) 273,602 (59,155)
Provision for income tax expense (benefit):Current . . . . . . . . . . . . . . . . . . . . . . . . . . . . . . . . . 17,578 7,655 8,072 15,032 23,869Deferred . . . . . . . . . . . . . . . . . . . . . . . . . . . . . . . . (3,929) (4,466) (50,088) 53,798 (48,518)
Total provision for income tax . . . . . . . . . . . . . . . . . 13,649 3,189 (42,016) 68,830 (24,649)
Net income (loss) . . . . . . . . . . . . . . . . . . . . . . . . . 106,245 31,102 (113,354) 204,772 (34,506)Net (income) loss attributable to non-controlling Interest . . (45,550) (30,635) (5,314) 3,301 (4,853)
Net income (loss) attributable to the Partnership . . . . . $ 60,695 $ 467 $ (118,668) $ 208,073 $ (39,359)
Net income (loss) attributable to the Partnership’s commonunitholders per common unit(2)(3):Basic . . . . . . . . . . . . . . . . . . . . . . . . . . . . . . . . . . . $ 0.75 $ (0.01) $ (1.97) $ 4.02 $ (1.72)
Diluted . . . . . . . . . . . . . . . . . . . . . . . . . . . . . . . . . $ 0.75 $ (0.01) $ (1.97) $ 4.02 $ (1.72)
Cash distribution declared per common unit(3) . . . . . . . . . $ 2.750 $ 2.560 $ 2.560 $ 2.059 $ 0.703
61

Year ended December 31,
2011 2010 2009 2008 2007
Balance Sheet Data (at December 31):Working capital . . . . . . . . . . . . . . . . . . . . . . . . . . . . $ 4,234 $ (43,296) $ 13,536 $ 51,237 $ 21,932Property, plant and equipment, net . . . . . . . . . . . . . . . 2,864,307 2,319,024 1,981,644 1,569,525 830,809Total assets . . . . . . . . . . . . . . . . . . . . . . . . . . . . . . . 4,070,425 3,333,362 3,014,737 2,673,054 1,524,695Total long-term debt . . . . . . . . . . . . . . . . . . . . . . . . . 1,846,062 1,273,434 1,170,072 1,172,965 552,695Total equity . . . . . . . . . . . . . . . . . . . . . . . . . . . . . . . 1,502,067 1,458,566 1,309,553 1,148,155 563,974
Cash Flow Data:Net cash flow provided by (used in):
Operating activities . . . . . . . . . . . . . . . . . . . . . . . . $ 414,698 $ 312,328 $ 223,101 $ 226,995 $ 133,237Investing activities . . . . . . . . . . . . . . . . . . . . . . . . . (776,553) (485,936) (461,753) (909,265) (314,792)Financing activities . . . . . . . . . . . . . . . . . . . . . . . . 411,421 143,306 333,083 647,896 170,406
Other Financial Data:Maintenance capital expenditures(4) . . . . . . . . . . . . . . $ 16,067 $ 10,286 $ 7,483 $ 7,161 $ 4,140Growth capital expenditures(4) . . . . . . . . . . . . . . . . . . 535,214 448,382 479,140 568,137 312,499
Total capital expenditures . . . . . . . . . . . . . . . . . . . . $ 551,281 $ 458,668 $ 486,623 $ 575,298 $ 316,639
(1) As discussed further in Note 6 of the accompanying Notes to Consolidated Financial Statements included in Item 8of this Form 10-K, volatility in any given period related to unrealized gains and losses on our derivative positionscan be significant. The following table summarizes the realized and unrealized gains and losses impacting Revenue,Purchased product costs, Facility expenses, Interest expense and Miscellaneous income (expense), net (in thousands):
Year ended December 31,
2011 2010 2009 2008 2007
Realized (loss) gain—revenue . . . . . . . . . . . . . $(48,093) $(33,560) $ 87,289 $(15,704) $ (15,901)Unrealized gain (loss)—revenue . . . . . . . . . . . 19,058 (20,372) (207,641) 293,532 (144,069)Realized (loss) gain—purchased product costs . . (27,711) (21,909) (53,052) 7,368 (8,829)Unrealized loss—purchased product costs . . . . . (25,249) (5,804) (15,831) (29,739) (6,363)Unrealized gain (loss)—facility expenses . . . . . . 6,480 1,295 373 (644) 14Realized gain—interest expense . . . . . . . . . . . . — 2,380 2,000 — —Unrealized (loss) gain—interest expense . . . . . . — (509) 509 — —Unrealized gain—miscellaneous income
(expense), net . . . . . . . . . . . . . . . . . . . . . . — 190 336 — —
Total derivative (loss) gain . . . . . . . . . . . . . . $(75,515) $(78,289) $(186,017) $254,813 $(175,148)
(2) For the calculation of Net (loss) income attributable to the Partnership’s common unitholders per common unit, seeNote 23 of the accompanying Notes to Consolidated Financial Statements included in Item 8 of this Form 10-K.
(3) All per unit data, where applicable, has been adjusted to give effect to the Merger.
(4) Maintenance capital includes capital expenditures made to maintain our operating capacity and asset base. Growthcapital includes expenditures made to expand the existing operating capacity, to increase the efficiency of ourexisting assets, and to facilitate an increase in volumes within our operations. Growth capital also includes costsassociated with new well connections. Growth capital excludes expenditures for third-party acquisitions and equityinvestment.
62

Operating Data
Year ended December 31,
2011 2010 2009 2008 2007
SouthwestEast Texas gathering systems throughput (Mcf/d) . . . . . 423,600 430,300 454,400 442,900 413,700East Texas natural gas processed (Mcf/d) . . . . . . . . . . . 228,300 233,100 246,600 189,300 175,400East Texas NGL sales (gallons, in thousands) . . . . . . . . 238,700 245,800 245,800 193,500 179,600Western Oklahoma gathering system throughput
(Mcf/d)(1) . . . . . . . . . . . . . . . . . . . . . . . . . . . . . . . 237,900 191,100 185,600 193,500 116,500Western Oklahoma natural gas processed (Mcf/d) . . . . 175,500 134,700 148,000 105,300 104,000Western Oklahoma NGL sales (gallons, in thousands) . 177,200 134,100 126,900 79,400 87,500Southeast Oklahoma gathering systems throughput
(Mcf/d) . . . . . . . . . . . . . . . . . . . . . . . . . . . . . . . . . 511,900 521,400 416,800 318,700 114,000Southeast Oklahoma natural gas processed (Mcf/d)(2) . 103,400 81,600 39,400 46,300 6,300Southeast Oklahoma NGL sales (gallons, in thousands) 125,100 102,300 48,400 31,000 900Arkoma Connector Pipeline throughput (Mcf/d)(3) . . . 307,300 375,900 277,300 N/A N/AOther Southwest gathering system throughput
(Mcf/d)(4) . . . . . . . . . . . . . . . . . . . . . . . . . . . . . . . 29,900 39,500 57,600 69,400 67,400
Northeast(5)Natural gas processed (Mcf/d) . . . . . . . . . . . . . . . . . . 305,900 188,700 194,600 202,200 200,200NGLs fractionated (Bbl/d)(6) . . . . . . . . . . . . . . . . . . . 20,300 20,700 18,300 12,400 10,800
Keep-whole sales (gallons, in thousands) . . . . . . . . . . . 113,800 136,700 145,500 140,800 126,200Percent-of-proceeds sales (gallons, in thousands) . . . . . 130,300 120,300 99,900 54,000 43,800
Total NGL sales (gallons, in thousands)(7) . . . . . . . . . 244,100 257,000 245,400 194,800 170,000Crude oil transported for a fee (Bbl/d) . . . . . . . . . . . . 10,300 12,800 12,300 13,300 14,000
Liberty(8)Natural gas processed (Mcf/d) . . . . . . . . . . . . . . . . . . 323,900 215,700 51,800 18,700 N/AGathering system throughput (Mcf/d) . . . . . . . . . . . . . 245,700 142,200 53,500 18,700 N/ANGLs fractionated (Bbl/d)(9) . . . . . . . . . . . . . . . . . . . 11,800 4,200 1,100 N/A N/ANGL sales (gallons, in thousands)(10) . . . . . . . . . . . . . 241,200 119,900 34,400 N/A N/A
Gulf CoastRefinery off-gas processed (Mcf/d) . . . . . . . . . . . . . . . 113,300 118,600 120,200 122,900 114,500Liquids fractionated (Bbl/d) . . . . . . . . . . . . . . . . . . . . 21,200 22,500 23,200 24,400 25,000NGL sales (gallons excluding hydrogen, in thousands) . 325,700 345,500 356,300 376,000 382,800
(1) Includes natural gas gathered in Western Oklahoma and from the Granite Wash formation in theTexas Panhandle as management considers this one integrated area of operations.
(2) The natural gas processing in Southeast Oklahoma is outsourced to Centrahoma, our equityinvestment, or other third-party processors.
(3) The Arkoma Connector Pipeline was placed into service in July 2009. The volume reported is theaverage daily rate for the days of operation.
(4) Excludes lateral pipelines where revenue is not based on throughput.
(5) Includes throughput from the Kenova, Cobb, Boldman and Langley processing plants. We acquiredthe Langley processing plant in February 2011. The volumes reported are the average daily ratesfor the days of operation.
63
(6) Amount includes 3,900 barrels per day, 4,000 barrels per day and 1,500 barrels per dayfractionated on behalf of Liberty for 2011, 2010 and 2009, respectively. Beginning in the fourthquarter of 2011, Siloam no longer fractionates NGLs on behalf of Liberty due to the operation ofLiberty’s fractionation facility that began in September 2011.
(7) Represents sales at the Siloam fractionator. The total sales exclude approximately59,200,000 gallons, 60,900,000 gallons, and 23,300,000 gallons sold by the Northeast on behalf ofLiberty for 2011, 2010 and 2009, respectively. These volumes are included as part of NGLs sold atLiberty.
(8) The 2009 and 2008 volumes represent the average daily rate for the period of operation.
(9) Amount includes all NGLs that were produced at the Liberty processing facilities and fractionatedinto purity products at our Liberty fractionation facility. Through August 2011, only propane wasrecovered at our Liberty facilities. In September 2011, Liberty’s fractionation facility commencedoperations and Liberty now has full fractionation capabilities.
(10) Includes sale of all purity products fractionated at the Liberty facilities and sale of allunfractionated NGLs. Also includes the sale of purity products fractionated and sold at the Siloamfacilities on behalf of Liberty.
ITEM 7. Management’s Discussion and Analysis of Financial Condition and Results of Operations
Management’s Discussion and Analysis (‘‘MD&A’’) contains statements that are forward-lookingand should be read in conjunction with Selected Financial Data and our consolidated financialstatements and accompanying notes included elsewhere in this report. Statements that are not historicalfacts are forward-looking statements. We use words such as ‘‘could,’’ ‘‘may,’’ ‘‘predict,’’ ‘‘should,’’‘‘expect,’’ ‘‘hope,’’ ‘‘continue,’’ ‘‘potential,’’ ‘‘plan,’’ ‘‘intend,’’ ‘‘anticipate,’’ ‘‘project,’’ ‘‘believe,’’‘‘estimate’’ and similar expressions to identify forward-looking statements. These statements are basedon current expectations, estimates, assumptions and beliefs concerning future events impacting us andtherefore involve a number of risks and uncertainties. Forward-looking statements are not guaranteesand actual results could differ materially from those expressed or implied in the forward-lookingstatements as a result of a number of factors. We do not update publicly any forward-looking statementwith new information or future events. Undue reliance should not be placed on forward-lookingstatements as many of these factors are beyond our ability to control or predict.
Overview
We are a master limited partnership engaged in the gathering, transportation and processing ofnatural gas; the transportation, fractionation, marketing and storage of NGLs; and the gathering andtransportation of crude oil. We have extensive natural gas gathering, processing and transmissionoperations in the southwest, Gulf Coast and northeast regions of the United States, including theMarcellus Shale, and are the largest natural gas processor and fractionator in the Appalachian region.
Significant Financial and Other Highlights
Significant financial and other highlights for the year ended December 31, 2011 are listed below.Refer to Results of Operations and Liquidity and Capital Resources for further details.
• Total segment operating income before items not allocated to segments increased approximately$143 million, or 30%, for the year ended December 31, 2011 compared to the same period in2010. The increase is primarily due to higher commodity prices in 2011, expanding operations inthe Liberty segment and increased volumes processed in the Southwest segment. The increase insegment income was partially offset by a $20 million decrease in net cash flow from thesettlement of commodity derivative positions.
64
• We acquired the remaining 49% interest in MarkWest Liberty Midstream effective December 31,2011 for approximately $998 million of cash, including transaction costs, and the issuance ofapproximately 19,954,000 unregistered Class B units valued at approximately $753 million.
• We increased the borrowing capacity under our Credit Facility from $705 million to $900 million.
• We received net proceeds of approximately $1.2 billion from public offerings of senior notes andredeemed $419 million aggregate principal amount of our 8.75% 2018 Senior Notes and$275 million aggregate principal amount of our 8.5% 2016 Senior Notes.
• We received net proceeds of approximately $1.1 billion from public offerings of common units.
• We entered into a new Utica Shale midstream joint venture to develop natural gas processingand NGL fractionation, transportation and marketing infrastructure in eastern Ohio beginning in2012.
Impact of Business Combination on Comparability of Financial Results
In reviewing our historical results of operations, investors should consider the impact of ourbusiness combinations, which fundamentally affect the comparability of our results of operations overthe periods discussed.
One business combination occurred in 2011 and is included in the results of operations from theacquisition date. The Langley Processing Facilities and Ranger Pipeline acquisition closed onFebruary 1, 2011 for consideration of $230.7 million. As a result, eleven months of activity for theLangley Processing Facilities and Ranger Pipeline is reflected in the accompanying ConsolidatedStatements of Operations for the year ended December 31, 2011. The revenue and income beforeprovision for income tax were approximately $21.8 million and $6.8 million, respectively, for the yearended December 31, 2011.
Results of Operations
Segment Reporting
We classify our business in the following reportable segments: Southwest, Northeast, Liberty andGulf Coast. We capture information in MD&A by geographical segment. Items below Income (loss)from operations in the accompanying Consolidated Statements of Operations, certain compensationexpense, certain other non-cash items and any unrealized gains (losses) from derivative instruments arenot allocated to individual business segments. Management does not consider these items allocable toor controllable by any individual business segment and therefore excludes these items when evaluatingsegment performance. The segment results are also adjusted to exclude the portion of operatingincome attributable to the non-controlling interests.
Year Ended December 31, 2011 Compared to Year Ended December 31, 2010
The tables below present financial information, as evaluated by management, for the reportedsegments for the years ended December 31, 2011 and 2010. The information includes net operatingmargin, a non-GAAP financial measure. For a reconciliation of net operating margin to Income (loss)from operations, the most comparable GAAP financial measure, see Our Contracts discussion in Item 1.Business.
65

Southwest
Year endedDecember 31,
2011 2010 $ Change % Change
(in thousands)
Segment revenue . . . . . . . . . . . . . . . . . . . . . . . . . . . . . . . $935,513 $665,768 $269,745 41%Purchased product costs . . . . . . . . . . . . . . . . . . . . . . . . . . 506,911 308,960 197,951 64%
Net operating margin . . . . . . . . . . . . . . . . . . . . . . . . . . 428,602 356,808 71,794 20%Facility expenses . . . . . . . . . . . . . . . . . . . . . . . . . . . . . . . 82,761 81,772 989 1%Portion of operating income attributable to non-controlling
interests . . . . . . . . . . . . . . . . . . . . . . . . . . . . . . . . . . . 5,431 6,440 (1,009) (16)%
Operating income before items not allocated tosegments . . . . . . . . . . . . . . . . . . . . . . . . . . . . . . . . . $340,410 $268,596 $ 71,814 27%
Segment Revenue. Segment revenue increased primarily due to higher commodity prices for allareas of the segment, higher condensate revenue and an overall increase in the volume of natural gasprocessed and NGLs produced in Oklahoma, due in part to the expansion of the processing facilities.
Purchased Product Costs. Purchased product costs increased primarily due to higher commodityprices and an increase in the volume of natural gas processed and NGLs produced in Oklahoma.
Northeast
Year endedDecember 31,
2011 2010 $ Change % Change
(in thousands)
Segment revenue . . . . . . . . . . . . . . . . . . . . . . . . . . . . . . $268,884 $384,724 $(115,840) (30)%Purchased product costs . . . . . . . . . . . . . . . . . . . . . . . . . 91,612 252,827 (161,215) (64)%
Net operating margin . . . . . . . . . . . . . . . . . . . . . . . . . 177,272 131,897 45,375 34%Facility expenses . . . . . . . . . . . . . . . . . . . . . . . . . . . . . . . 27,126 19,513 7,613 39%
Operating income before items not allocated tosegments . . . . . . . . . . . . . . . . . . . . . . . . . . . . . . . . . $150,146 $112,384 $ 37,762 34%
Segment Revenue. Segment revenue decreased primarily due to a contract change related to theLangley Acquisition. Subsequent to the Langley Acquisition, we continue to market the NGLs relatedto natural gas processed at the Langley Processing Facilities; however we are acting as an agent andtherefore record revenue net of purchase product costs. Prior to the contract change, we were acting asthe principal. Segment revenue also decreased due to a decrease in volumes processed underkeep-whole terms primarily due to the required repairs of a significant third-party transmission pipelinefeeding our Kenova plant. The repairs of the transmission pipeline were completed in the fourthquarter of 2011, after which volumes returned to normal levels.
Purchased Product Costs. Purchased product costs decreased due to the contract change related tothe Langley Acquisition discussed in the Segment Revenue section above. In addition, purchased productcosts decreased as a percentage of revenue due to an increase in the spread between NGL and naturalgas prices.
Facility Expenses. Facility expenses increased primarily due to the Langley Acquisition onFebruary 1, 2011.
66

Liberty
Year endedDecember 31,
2011 2010 $ Change % Change
(in thousands)
Segment revenue . . . . . . . . . . . . . . . . . . . . . . . . . . . . . . . $248,949 $105,911 $143,038 135%Purchased product costs . . . . . . . . . . . . . . . . . . . . . . . . . . 83,847 16,840 67,007 398%
Net operating margin . . . . . . . . . . . . . . . . . . . . . . . . . . 165,102 89,071 76,031 85%Facility expenses . . . . . . . . . . . . . . . . . . . . . . . . . . . . . . . 34,913 24,028 10,885 45%Portion of operating income attributable to non-controlling
interests . . . . . . . . . . . . . . . . . . . . . . . . . . . . . . . . . . . 63,731 26,126 37,605 144%
Operating income before items not allocated tosegments . . . . . . . . . . . . . . . . . . . . . . . . . . . . . . . . . $ 66,458 $ 38,917 $ 27,541 71%
Segment Revenue. Segment revenue increased due to ongoing expansion of the Liberty operationsand higher NGL prices. Segment revenue increased approximately $43.7 million related to gatheringand processing fees and approximately $89.0 million related to NGL product sales.
Purchased Product Costs. Purchased product costs increased primarily due to the purchase andsale of propane from certain producers at market prices less a discount, which began in the second halfof 2010.
Facility Expenses. Facility expenses increased due to costs related to the expansion of Libertyoperations. The increase in costs related to expansion were partially offset by a reduction in compressorrental expense as compressors were purchased in the first quarter of 2010 and by environmental andremediation costs incurred in 2010 that did not recur in 2011.
Portion of Operating Income Attributable to Non-controlling Interests. Portion of operating incomeattributable to non-controlling interests represents M&R’s interest in net operating income ofMarkWest Liberty Midstream. The increase is the result of ongoing expansion of the Libertyoperations, as well as M&R’s interest increasing from 40% to 49% effective January 1, 2011. Due toour acquisition of M&R’s interest effective December 31, 2011, going forward there will be nooperating income allocated to non-controlling interest.
Gulf Coast
Year endedDecember 31,
2011 2010 $ Change % Change
(in thousands)
Segment revenue . . . . . . . . . . . . . . . . . . . . . . . . . . . . . . . . . $96,473 $85,160 $11,313 13%Purchased product costs . . . . . . . . . . . . . . . . . . . . . . . . . . . . — — — N/A
Net operating margin . . . . . . . . . . . . . . . . . . . . . . . . . . . . 96,473 85,160 11,313 13%Facility expenses . . . . . . . . . . . . . . . . . . . . . . . . . . . . . . . . . . 38,436 33,337 5,099 15%
Operating income before items not allocated to segments . . $58,037 $51,823 $ 6,214 12%
Segment Revenue. Segment revenue increased primarily due to increases in commodity prices andthe revenues earned from the SMR which did not begin until March 2010. The increases were partiallyoffset by a decrease in volumes due to increased maintenance activities of our refinery customers.
Facility Expenses. Facility expenses increased primarily due to operating expenses of the SMRwhich began in March 2010.
67
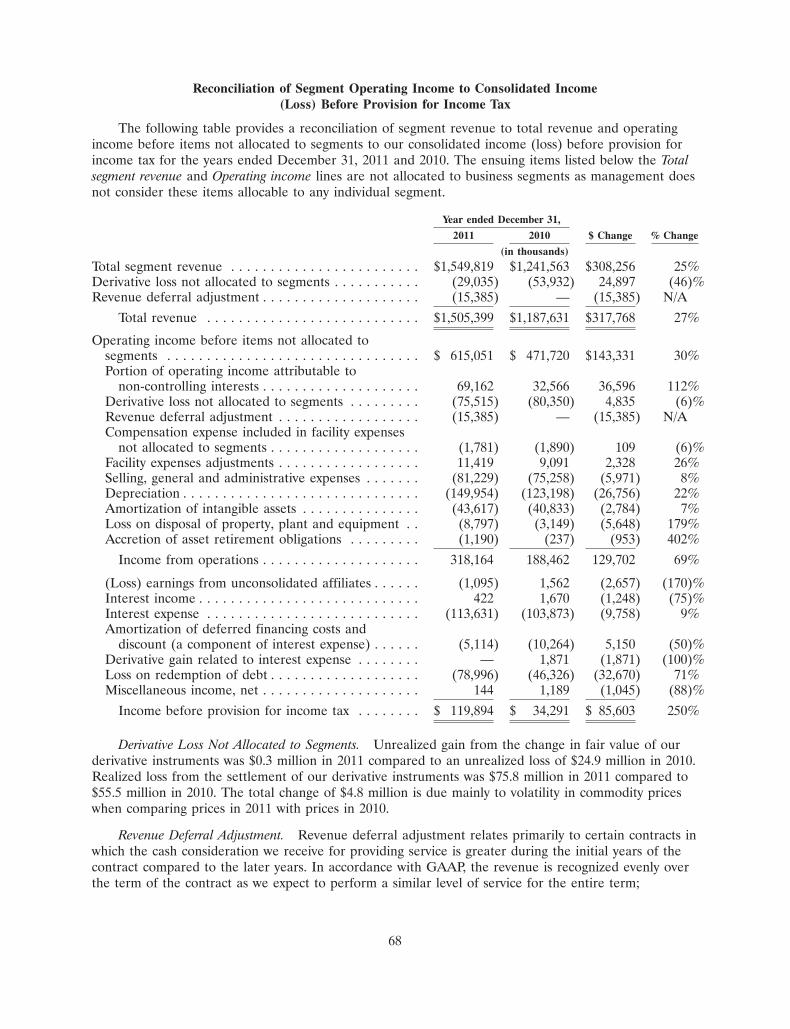
Reconciliation of Segment Operating Income to Consolidated Income(Loss) Before Provision for Income Tax
The following table provides a reconciliation of segment revenue to total revenue and operatingincome before items not allocated to segments to our consolidated income (loss) before provision forincome tax for the years ended December 31, 2011 and 2010. The ensuing items listed below the Totalsegment revenue and Operating income lines are not allocated to business segments as management doesnot consider these items allocable to any individual segment.
Year ended December 31,
2011 2010 $ Change % Change
(in thousands)
Total segment revenue . . . . . . . . . . . . . . . . . . . . . . . . $1,549,819 $1,241,563 $308,256 25%Derivative loss not allocated to segments . . . . . . . . . . . (29,035) (53,932) 24,897 (46)%Revenue deferral adjustment . . . . . . . . . . . . . . . . . . . . (15,385) — (15,385) N/A
Total revenue . . . . . . . . . . . . . . . . . . . . . . . . . . . $1,505,399 $1,187,631 $317,768 27%
Operating income before items not allocated tosegments . . . . . . . . . . . . . . . . . . . . . . . . . . . . . . . . $ 615,051 $ 471,720 $143,331 30%Portion of operating income attributable to
non-controlling interests . . . . . . . . . . . . . . . . . . . . 69,162 32,566 36,596 112%Derivative loss not allocated to segments . . . . . . . . . (75,515) (80,350) 4,835 (6)%Revenue deferral adjustment . . . . . . . . . . . . . . . . . . (15,385) — (15,385) N/ACompensation expense included in facility expenses
not allocated to segments . . . . . . . . . . . . . . . . . . . (1,781) (1,890) 109 (6)%Facility expenses adjustments . . . . . . . . . . . . . . . . . . 11,419 9,091 2,328 26%Selling, general and administrative expenses . . . . . . . (81,229) (75,258) (5,971) 8%Depreciation . . . . . . . . . . . . . . . . . . . . . . . . . . . . . . (149,954) (123,198) (26,756) 22%Amortization of intangible assets . . . . . . . . . . . . . . . (43,617) (40,833) (2,784) 7%Loss on disposal of property, plant and equipment . . (8,797) (3,149) (5,648) 179%Accretion of asset retirement obligations . . . . . . . . . (1,190) (237) (953) 402%
Income from operations . . . . . . . . . . . . . . . . . . . . 318,164 188,462 129,702 69%
(Loss) earnings from unconsolidated affiliates . . . . . . (1,095) 1,562 (2,657) (170)%Interest income . . . . . . . . . . . . . . . . . . . . . . . . . . . . 422 1,670 (1,248) (75)%Interest expense . . . . . . . . . . . . . . . . . . . . . . . . . . . (113,631) (103,873) (9,758) 9%Amortization of deferred financing costs and
discount (a component of interest expense) . . . . . . (5,114) (10,264) 5,150 (50)%Derivative gain related to interest expense . . . . . . . . — 1,871 (1,871) (100)%Loss on redemption of debt . . . . . . . . . . . . . . . . . . . (78,996) (46,326) (32,670) 71%Miscellaneous income, net . . . . . . . . . . . . . . . . . . . . 144 1,189 (1,045) (88)%
Income before provision for income tax . . . . . . . . $ 119,894 $ 34,291 $ 85,603 250%
Derivative Loss Not Allocated to Segments. Unrealized gain from the change in fair value of ourderivative instruments was $0.3 million in 2011 compared to an unrealized loss of $24.9 million in 2010.Realized loss from the settlement of our derivative instruments was $75.8 million in 2011 compared to$55.5 million in 2010. The total change of $4.8 million is due mainly to volatility in commodity priceswhen comparing prices in 2011 with prices in 2010.
Revenue Deferral Adjustment. Revenue deferral adjustment relates primarily to certain contracts inwhich the cash consideration we receive for providing service is greater during the initial years of thecontract compared to the later years. In accordance with GAAP, the revenue is recognized evenly overthe term of the contract as we expect to perform a similar level of service for the entire term;
68

therefore, the revenue recognized in the current reporting period is less than the cash received.However, the chief operating decision maker and management evaluate the segment performancebased on the cash consideration received and therefore the impact of the revenue deferrals is excludedfor segment reporting purposes. For the year ended December 31, 2011, approximately $7.2 million and$8.2 million of the revenue deferral adjustment is attributable to the Southwest segment and Northeastsegment, respectively. There were no revenue deferral adjustments in 2010 or 2009. Beginning in 2015,the cash consideration received from these contracts will decline and the reported segment revenue willbe less than the revenue recognized for GAAP purposes.
Facility Expenses Adjustments. Facility expenses adjustments consist of the reallocation of theMarkWest Pioneer field services fee and the reallocation of the interest expense related to the SMR,which is included in facility expenses for the purposes of evaluating the performance of the Gulf Coastsegment. The increase is due to a full year of interest expense related to the SMR in 2011 compared toapproximately nine months of SMR interest expense in 2010.
Selling, General and Administrative. Selling, general and administrative expenses increasedprimarily due to higher labor, benefits and professional services necessary to support the overall growthof our operations.
Depreciation. Depreciation increased due to additional projects completed and placed into serviceduring 2010 and 2011, as well as the Langley Acquisition.
Loss on Disposal of Property, Plant and Equipment. Loss relates to disposals of miscellaneousequipment, primarily in the Northeast segment.
Interest Expense. Interest expense increased primarily due to increased borrowings under ourCredit Facility and a net increase in our borrowings resulting from our senior notes offerings andrelated redemptions in order to fund our capital plan. Interest expense also increased approximately$1.8 million related to payments of the liability associated with the SMR Transaction that began inMarch 2010.
Amortization of Deferred Financing Costs and Discount. Amortization of deferred financing costsand discount decreased primarily due to the write-off of the unamortized discount associated with our6.875% senior notes due 2014 (‘‘2014 Senior Notes’’), which were redeemed in the fourth quarter of2010. The decrease was partially offset by the amortization of deferred financing costs related to notesissued in the fourth quarter of 2010 and 2011.
Loss on Redemption of Debt. Loss on redemption of debt relates to the redemption ofapproximately $275 million of our 2016 Senior Notes and approximately $419 million of our 2018Senior Notes. Approximately $7.6 million relates to the non-cash write-off of the unamortized discountand deferred finance costs associated with these senior notes and approximately $71.4 million relates tothe payment of the related call and tender premiums. See Note 16 of the accompanying Notes toConsolidated Financial Statements included in Item 8 of this Form 10-K for further details.
Derivative Gain Related to Interest Expense. Derivative gain related to interest expense reflectschanges in the fair value of interest rate swaps which we used to manage the interest rate riskassociated with the fair value of our fixed rate borrowings. The interest rate swaps effectively converteda portion of the underlying cash flows related to our long-term fixed rate debt securities into variablerate cash flows in order to achieve a desired mix of fixed and variable rate debt. We settled all of theoutstanding interest rate swaps in January 2010. See Note 6 of the accompanying Notes toConsolidated Financial Statements included in Item 8 of this Form 10-K for further details.
Provision for Income Tax. The total provision for income tax for the year ended December 31,2011 was $13.7 million. Refer to Note 22 of the accompanying Notes to Consolidated FinancialStatements included in Item 8 of this Form 10-K for a discussion of the significant changes in theprovision.
69

MarkWest Hydrocarbon pays tax based on enacted and applicable corporate and state tax rates onits pro-rata share of income and deductions allocated to the Class A units by the Partnership.
The current provision for income tax was $17.6 million for the year ended December 31, 2011.Approximately $16.0 million is attributable to MarkWest Hydrocarbon, Inc. Of this amount,$8.5 million is attributable to MarkWest Hydrocarbon’s ownership of Class A units, and the remainingexpense of $7.5 million is related to the Corporation’s NGL marketing business. The remaining$1.6 million is related to taxes payable by the Partnership associated with the Texas Margin tax andMichigan Business Taxes. We expect the current provision for income tax to increase in 2012 due toexpected increases in net income from MarkWest Hydrocarbon’s NGL sales as well as additionalincome allocated to MarkWest Hydrocarbon as a result of its ownership of Class A units due toincreases in earnings and additional income expected to be allocated by the Partnership in accordancewith the Internal Revenue Code.
If the Partnership was to cause the Class A units to be disposed of (through sale or otherwise) orretired as a class of units, MarkWest Hydrocarbon would pay income taxes on the recognized gain tothe full extent of the proceeds received or implied as received in excess of its tax basis. We currently donot have a plan to dispose of Class A units. During 2011, the Partnership determined it hadunderstated its deferred tax liability related to its investment in consolidated subsidiaries for timingdifferences created as a result of items charged or credited directly to equity. We recorded a deferredtax liability of $90.8 million, of which $77.5 million related to prior years. See Note 22 to theconsolidated financial statements.
Year Ended December 31, 2010 Compared to Year Ended December 31, 2009
The tables below present financial information, as evaluated by management, for the reportedsegments for the years ended December 31, 2010 and 2009. The information includes net operatingmargin, a non-GAAP financial measure. For a reconciliation of net operating margin to Income (loss)from operations, the most comparable GAAP financial measure, see Our Contracts discussion in Item 1.Business.
Southwest
Year endedDecember 31,
2010 2009 $ Change % Change
(in thousands)
Segment revenue . . . . . . . . . . . . . . . . . $665,768 $492,369 $173,399 35%Purchased product costs . . . . . . . . . . . . 308,960 221,021 87,939 40%
Net operating margin . . . . . . . . . . . . 356,808 271,348 85,460 31%Facility expenses . . . . . . . . . . . . . . . . . . 81,772 73,621 8,151 11%Portion of operating income attributable
to non-controlling interests . . . . . . . . . 6,440 2,613 3,827 146%
Operating income before items notallocated to segments . . . . . . . . . . . $268,596 $195,114 $ 73,482 38%
Segment Revenue. Segment revenue increased primarily due to higher NGL prices. Segmentrevenue from NGL and condensate sales increased approximately $149.3 million across the segment,partially offset by a $2.5 million decrease in revenue from natural gas sales. An increase in volumesfrom a large producer in our Woodford Shale operations also contributed to the increase in productsales. Gathering, treating, and compression fee revenue also increased $23.6 million due to a full yearof the Arkoma Connector Pipeline operations that began in mid-July 2009 and higher volumes in the
70
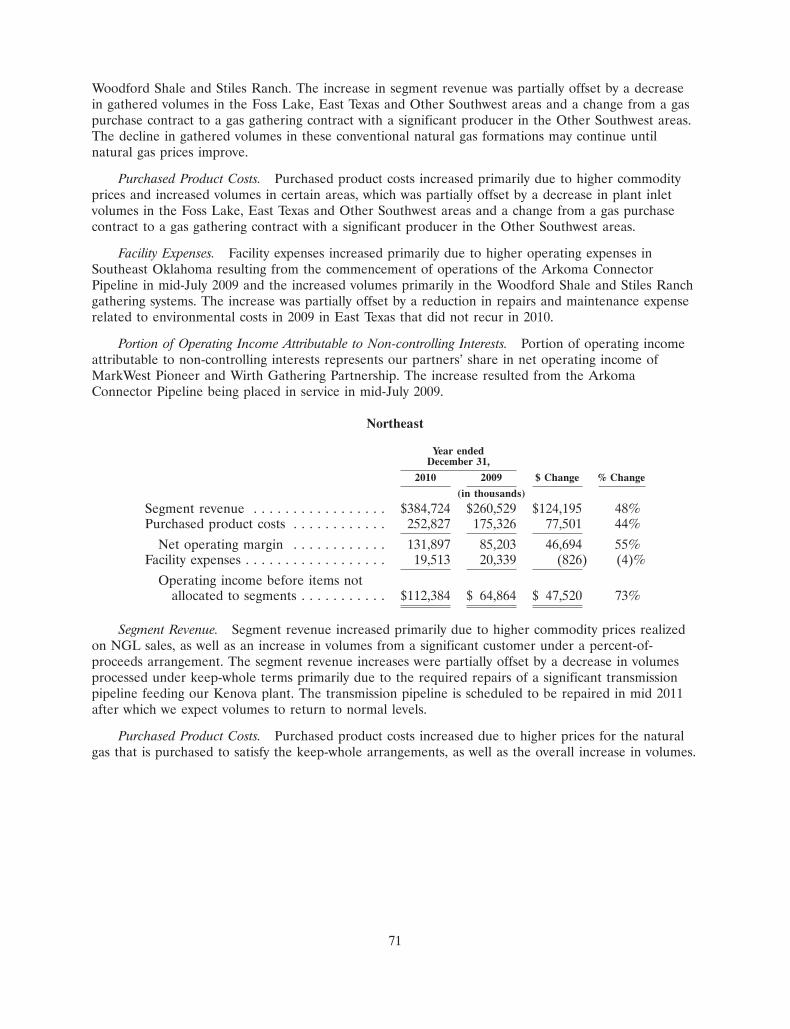
Woodford Shale and Stiles Ranch. The increase in segment revenue was partially offset by a decreasein gathered volumes in the Foss Lake, East Texas and Other Southwest areas and a change from a gaspurchase contract to a gas gathering contract with a significant producer in the Other Southwest areas.The decline in gathered volumes in these conventional natural gas formations may continue untilnatural gas prices improve.
Purchased Product Costs. Purchased product costs increased primarily due to higher commodityprices and increased volumes in certain areas, which was partially offset by a decrease in plant inletvolumes in the Foss Lake, East Texas and Other Southwest areas and a change from a gas purchasecontract to a gas gathering contract with a significant producer in the Other Southwest areas.
Facility Expenses. Facility expenses increased primarily due to higher operating expenses inSoutheast Oklahoma resulting from the commencement of operations of the Arkoma ConnectorPipeline in mid-July 2009 and the increased volumes primarily in the Woodford Shale and Stiles Ranchgathering systems. The increase was partially offset by a reduction in repairs and maintenance expenserelated to environmental costs in 2009 in East Texas that did not recur in 2010.
Portion of Operating Income Attributable to Non-controlling Interests. Portion of operating incomeattributable to non-controlling interests represents our partners’ share in net operating income ofMarkWest Pioneer and Wirth Gathering Partnership. The increase resulted from the ArkomaConnector Pipeline being placed in service in mid-July 2009.
Northeast
Year endedDecember 31,
2010 2009 $ Change % Change
(in thousands)
Segment revenue . . . . . . . . . . . . . . . . . $384,724 $260,529 $124,195 48%Purchased product costs . . . . . . . . . . . . 252,827 175,326 77,501 44%
Net operating margin . . . . . . . . . . . . 131,897 85,203 46,694 55%Facility expenses . . . . . . . . . . . . . . . . . . 19,513 20,339 (826) (4)%
Operating income before items notallocated to segments . . . . . . . . . . . $112,384 $ 64,864 $ 47,520 73%
Segment Revenue. Segment revenue increased primarily due to higher commodity prices realizedon NGL sales, as well as an increase in volumes from a significant customer under a percent-of-proceeds arrangement. The segment revenue increases were partially offset by a decrease in volumesprocessed under keep-whole terms primarily due to the required repairs of a significant transmissionpipeline feeding our Kenova plant. The transmission pipeline is scheduled to be repaired in mid 2011after which we expect volumes to return to normal levels.
Purchased Product Costs. Purchased product costs increased due to higher prices for the naturalgas that is purchased to satisfy the keep-whole arrangements, as well as the overall increase in volumes.
71
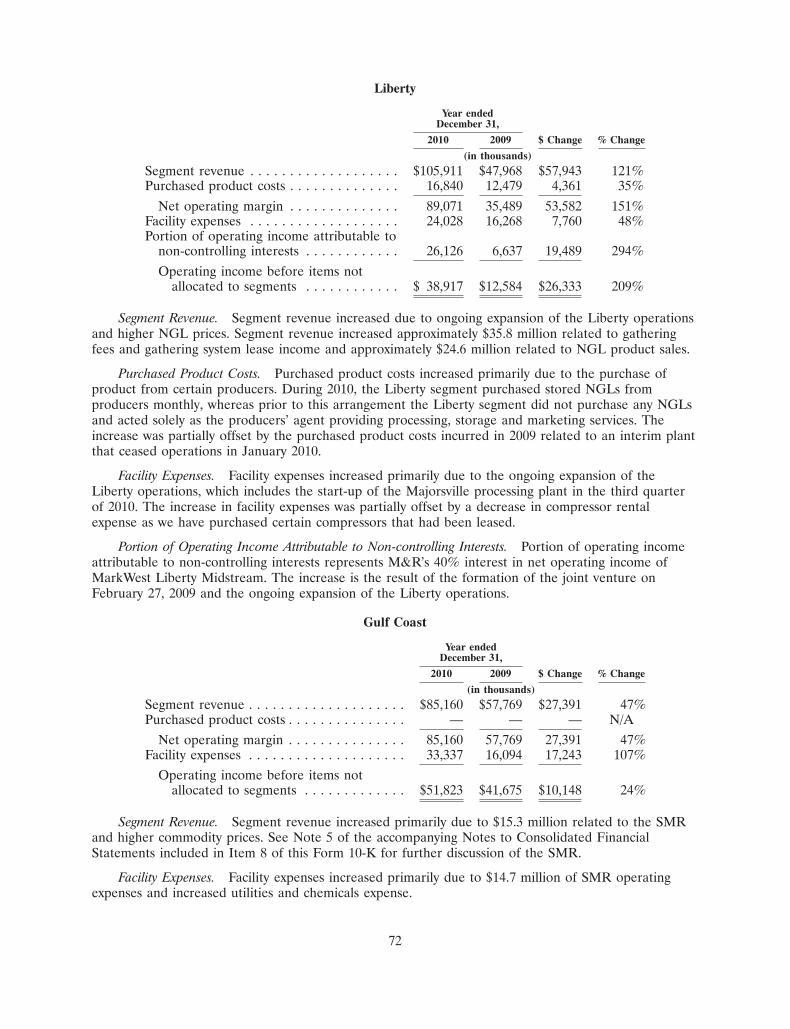
Liberty
Year endedDecember 31,
2010 2009 $ Change % Change
(in thousands)
Segment revenue . . . . . . . . . . . . . . . . . . . $105,911 $47,968 $57,943 121%Purchased product costs . . . . . . . . . . . . . . 16,840 12,479 4,361 35%
Net operating margin . . . . . . . . . . . . . . 89,071 35,489 53,582 151%Facility expenses . . . . . . . . . . . . . . . . . . . 24,028 16,268 7,760 48%Portion of operating income attributable to
non-controlling interests . . . . . . . . . . . . 26,126 6,637 19,489 294%
Operating income before items notallocated to segments . . . . . . . . . . . . $ 38,917 $12,584 $26,333 209%
Segment Revenue. Segment revenue increased due to ongoing expansion of the Liberty operationsand higher NGL prices. Segment revenue increased approximately $35.8 million related to gatheringfees and gathering system lease income and approximately $24.6 million related to NGL product sales.
Purchased Product Costs. Purchased product costs increased primarily due to the purchase ofproduct from certain producers. During 2010, the Liberty segment purchased stored NGLs fromproducers monthly, whereas prior to this arrangement the Liberty segment did not purchase any NGLsand acted solely as the producers’ agent providing processing, storage and marketing services. Theincrease was partially offset by the purchased product costs incurred in 2009 related to an interim plantthat ceased operations in January 2010.
Facility Expenses. Facility expenses increased primarily due to the ongoing expansion of theLiberty operations, which includes the start-up of the Majorsville processing plant in the third quarterof 2010. The increase in facility expenses was partially offset by a decrease in compressor rentalexpense as we have purchased certain compressors that had been leased.
Portion of Operating Income Attributable to Non-controlling Interests. Portion of operating incomeattributable to non-controlling interests represents M&R’s 40% interest in net operating income ofMarkWest Liberty Midstream. The increase is the result of the formation of the joint venture onFebruary 27, 2009 and the ongoing expansion of the Liberty operations.
Gulf Coast
Year endedDecember 31,
2010 2009 $ Change % Change
(in thousands)
Segment revenue . . . . . . . . . . . . . . . . . . . . $85,160 $57,769 $27,391 47%Purchased product costs . . . . . . . . . . . . . . . — — — N/A
Net operating margin . . . . . . . . . . . . . . . 85,160 57,769 27,391 47%Facility expenses . . . . . . . . . . . . . . . . . . . . 33,337 16,094 17,243 107%
Operating income before items notallocated to segments . . . . . . . . . . . . . $51,823 $41,675 $10,148 24%
Segment Revenue. Segment revenue increased primarily due to $15.3 million related to the SMRand higher commodity prices. See Note 5 of the accompanying Notes to Consolidated FinancialStatements included in Item 8 of this Form 10-K for further discussion of the SMR.
Facility Expenses. Facility expenses increased primarily due to $14.7 million of SMR operatingexpenses and increased utilities and chemicals expense.
72

Reconciliation of Segment Operating Income to Consolidated Income(Loss) Before Provision for Income Tax
The following table provides a reconciliation of segment revenue to total revenue and operatingincome before items not allocated to segments to our consolidated income (loss) before provision forincome tax for the years ended December 31, 2010 and 2009. The ensuing items listed below the Totalsegment revenue and Operating income lines are not allocated to business segments as management doesnot consider these items allocable to any individual segment.
Year ended December 31,
2010 2009 $ Change % Change
(in thousands)
Total segment revenue . . . . . . . . . . . . . . . . . . . . . . . . . $1,241,563 $ 858,635 $382,928 45%Derivative loss not allocated to segments . . . . . . . . . . (53,932) (120,352) 66,420 (55)%
Total revenue . . . . . . . . . . . . . . . . . . . . . . . . . . . . $1,187,631 $ 738,283 $449,348 61%
Operating income before items not allocated tosegments . . . . . . . . . . . . . . . . . . . . . . . . . . . . . . . . . $ 471,720 $ 314,237 $157,483 50%Portion of operating income attributable to
non-controlling interests . . . . . . . . . . . . . . . . . . . . 32,566 9,250 23,316 252%Derivative loss not allocated to segments . . . . . . . . . . (80,350) (188,862) 108,512 (57)%Compensation expense included in facility expenses
not allocated to segments . . . . . . . . . . . . . . . . . . . (1,890) (1,032) (858) 83%Facility expenses adjustments . . . . . . . . . . . . . . . . . . 9,091 377 8,714 2,311%Selling, general and administrative expenses . . . . . . . . (75,258) (63,728) (11,530) 18%Depreciation . . . . . . . . . . . . . . . . . . . . . . . . . . . . . . (123,198) (95,537) (27,661) 29%Amortization of intangible assets . . . . . . . . . . . . . . . . (40,833) (40,831) (2) 0%Loss on disposal of property, plant and equipment . . . (3,149) (1,677) (1,472) 88%Accretion of asset retirement obligations . . . . . . . . . . (237) (198) (39) 20%Impairment of long-lived assets . . . . . . . . . . . . . . . . . — (5,855) 5,855 (100)%
Income (loss) from operations . . . . . . . . . . . . . . . . 188,462 (73,856) 262,318 (355)%Earnings from unconsolidated affiliates . . . . . . . . . . . 1,562 3,505 (1,943) (55)%Gain on sale of unconsolidated affiliate . . . . . . . . . . . — 6,801 (6,801) (100)%Interest income . . . . . . . . . . . . . . . . . . . . . . . . . . . . 1,670 349 1,321 379%Interest expense . . . . . . . . . . . . . . . . . . . . . . . . . . . . (103,873) (87,419) (16,454) 19%Amortization of deferred financing costs and discount
(a component of interest expense) . . . . . . . . . . . . . (10,264) (9,718) (546) 6%Derivative gain related to interest expense . . . . . . . . . 1,871 2,509 (638) (25)%Loss on redemption of debt . . . . . . . . . . . . . . . . . . . (46,326) — (46,326) N/AMiscellaneous income, net . . . . . . . . . . . . . . . . . . . . 1,189 2,459 (1,270) (52)%
Income (loss) before provision for income tax . . . . . $ 34,291 $(155,370) $189,661 (122)%
Derivative Loss Not Allocated to Segments. Unrealized loss from the mark-to-market of ourderivative instruments was $24.9 million in 2010 compared to $223.1 million in 2009. Realized loss fromthe settlement of our derivative instruments was $55.5 million in 2010 compared to realized gain of$34.2 million in 2009. The total change of $108.5 million is due mainly to volatility in commodity priceswhen comparing prices in 2010 with 2009. Realized gains in 2009 also include net gains of $15.2 milliondue to the early settlement of certain positions as discussed in Note 6 of the accompanying Notes toConsolidated Financial Statements included in Item 8 of this Form 10-K.
Facility Expenses Adjustments. Facility expenses adjustments consist of the reallocation of theMarkWest Pioneer field services fee and the reallocation of the interest expense related to the SMR
73

which is included in facility expenses for the purposes of evaluating the performance of the Gulf Coastsegment.
Selling, General and Administrative Expenses. Selling, general and administrative expensesincreased primarily due to higher share-based compensation expense related to the January 2010unrestricted unit grant, as well as increases in headcount, short-term incentive compensation, insuranceand corporate office rent. These increases were partially offset by a decrease in professional servicesexpense.
Depreciation. Depreciation increased due to depreciation on additional projects completed during2010 and 2009.
Impairment of Long-Lived Assets. During the year ended December 31, 2009, we recognized animpairment of $5.9 million related to certain gas-gathering and intangible assets in the Southwestsegment.
Gain on Sale of Unconsolidated Affiliate. During the year ended December 31, 2009, we sold ourequity investment in Starfish. See Note 5 of the accompanying Notes to Consolidated FinancialStatements included in Item 8 of this Form 10-K for further discussion.
Interest Expense. Interest expense increased primarily due to additional borrowings in May 2009and the net increase in our borrowings resulting from our 2020 Senior Notes offering and relatedredemption of our 2014 Senior Notes. Interest expense of $7.1 million related to the SMR alsocontributed to the increase.
Loss on Redemption of Debt. Loss on redemption of debt relates to the redemption of$375 million of our 2014 Senior Notes in the fourth quarter of 2010. Approximately $36.6 millionrelates to the non-cash write-off of the unamortized discount and deferred finance costs associated withthese senior notes and approximately $9.7 million relates to the payment of the related call and tenderpremiums. See Note 16 of the accompanying Notes to Consolidated Financial Statements included inItem 8 of this Form 10-K for further details.
Derivative Gain Related to Interest Expense. Derivative gain related to interest expense relates tochanges in the fair value of interest rate swaps which we used to manage the interest rate riskassociated with the fair value of our fixed rate borrowings. The interest rate swaps effectively converteda portion of the underlying cash flows related to our long-term fixed rate debt securities into variablerate cash flows in order to achieve a desired mix of fixed and variable rate debt. We settled all of theoutstanding interest rate swaps in January 2010. See Note 6 of the accompanying Notes toConsolidated Financial Statements included in Item 8 of this Form 10-K for further details.
Liquidity and Capital Resources
Our primary strategy is to expand our asset base through organic growth projects and acquisitionsthat are accretive to our cash available for distribution per common unit.
74

Our 2011 capital expenditures and our 2012 capital plan are summarized in the table below (inmillions):
Actual2012 Full Year endedYear Plan December 31,
Low High 2011
Consolidated growth capital . . . . . . . . . . . . . . . . . . . $1,050 $1,500 $ 535Liberty joint venture partner’s share of growth capital — — (130)Utica joint venture partner’s estimated share of
growth capital . . . . . . . . . . . . . . . . . . . . . . . . . . . (150) (200) —
Partnership share of growth capital . . . . . . . . . . . . . . 900 1,300 405Langley Acquisition . . . . . . . . . . . . . . . . . . . . . . . . . — — 231
Partnership share of growth capital and acquisition . . 900 1,300 636
Consolidated maintenance capital . . . . . . . . . . . . . . . $ 20 $ 20 $ 16
In addition to the capital expenditures in the above table, we spent approximately $998 million ofcash, including transaction costs, and issued approximately 19,954,000 Class B units with a value ofapproximately $753 million for the purchase of the 49% interest in MarkWest Liberty Midstream fromEMG.
Our primary sources of liquidity to meet operating expenses, pay distributions to our unitholdersand fund capital expenditures are cash flows generated by our operations, our Credit Facility and accessto debt and equity markets, both public and private. We may also consider the use of alternativefinancing strategies such as entering into additional joint venture arrangements.
Management believes that expenditures for our currently planned capital projects will be fundedwith cash flows from operations, current cash balances, contributions by our joint venture partners, ourcurrent borrowing capacity under the Credit Facility, additional long-term borrowings and proceedsfrom equity offerings. Our access to capital markets can be impacted by factors outside our control,including economic conditions; however, we believe that our strong cash flows and balance sheet, ourCredit Facility and our credit rating will provide us with adequate access to funding given our expectedcash needs. Any new borrowing cost would be affected by market conditions and long-term debt ratingsassigned by independent rating agencies. As of February 17, 2012, our credit ratings were Ba2 with aStable outlook by Moody’s Investors Service, BB with a Stable outlook by Standard & Poor’s, whichboth reflect upgrades during 2011, and BB with a Stable outlook by Fitch Ratings. Changes in ouroperating results, cash flows or financial position could impact the ratings assigned by the various ratingagencies. Should our credit ratings be adjusted downward, we may incur higher costs to borrow, whichcould have a material impact on our financial condition and results of operations.
Credit Facility
On December 29, 2011, we amended our Credit Facility to increase the borrowing capacity to$900 million and to reset the uncommitted accordion feature to $250 million, providing us with theadditional financial flexibility to continue to execute our growth strategy. Earlier in 2011, we hadamended the Credit Facility to reduce the interest rates and extend the maturity date to September2016. See Note 16 of the accompanying Notes to Consolidated Financial Statements included in Item 8of this Form 10-K for further details of our Credit Facility.
As of February 17, 2012, we had no borrowings outstanding and $22.3 million of letters of creditoutstanding under the Credit Facility, leaving approximately $877.7 million available for borrowing.
75

Senior Notes Offerings and Tender Offers
During 2011, we completed a public offering for $500 million in aggregate principal amount of6.5% senior notes due in August 2021 (‘‘2021 Senior Notes’’) and a public offering for $700 million inaggregate principal amount of 6.25% senior notes due in June 2022 (‘‘2022 Senior Notes’’). A portionof the $1.2 billion combined net proceeds from these offerings was used to repurchase $275 millionaggregate principal amount of 8.5% senior notes due in July 2016 and approximately $419 millionaggregate principal amount of 8.75% senior notes due in April 2018, with the remainder used toprovide additional capital for general partnership purposes.
As of December 31, 2011, we had four series of senior notes outstanding: $81 million in aggregateprincipal issued in April and May 2008 and due April 2018; $500 million in aggregate principal issuedin November 2010 and due November 2020; $500 million in aggregate principal issued in February andMarch 2011 and due August 2021; and $700 million aggregate principal issued in October 2011 and dueJune 2022 (altogether ‘‘Senior Notes’’). For further discussion of the Senior Notes and the accountingimpacts, see Note 16 of the accompanying Notes to Consolidated Financial Statements included inItem 8 of this Form 10-K.The Credit Facility and indentures governing the Senior Notes limit theactivity of the Partnership and its restricted subsidiaries. The Credit Facility and indentures place limitson the ability of the Partnership and its restricted subsidiaries to incur additional indebtedness; declareor pay dividends or distributions or redeem, repurchase or retire equity interests or subordinatedindebtedness; make investments; incur liens; create any consensual limitation on the ability of thePartnership’s restricted subsidiaries to pay dividends or distributions, make loans or transfer property tothe Partnership; engage in transactions with the Partnership’s affiliates; sell assets, including equityinterests of the Partnership’s subsidiaries; make any payment on or with respect to, or purchase,redeem, defease or otherwise acquire or retire for value any subordinated obligation or guarantorsubordination obligation (except principal and interest at maturity); and consolidate, merge or transferassets.
The Credit Facility limits our ability to enter into transactions with parties that require margin callsunder certain derivative instruments. Under the Credit Facility, neither we nor the bank can requiremargin calls for outstanding derivative positions. As of February 17, 2012, all of our derivative positionsare with members of the participating bank group and are not subject to margin deposit requirements.We believe this arrangement gives us additional liquidity as it allows us to enter into derivativeinstruments without utilizing cash for margin calls or requiring the use of letters of credit.
Equity Offerings
On December 19, 2011, we completed a public offering of 10.0 million newly issued common unitsrepresenting limited partner interests. On January 13, 2012, we issued an additional 0.7 million unitspursuant to the underwriters’ exercise of their option to purchase additional common units. The totalnet proceeds, including the exercise of the underwriters’ option, were approximately $559 million andwere used to partially fund the cash consideration for the acquisition of the 49% non-controllinginterest in MarkWest Liberty Midstream. We completed three additional public offerings earlier in2011. In total, we issued 23.2 million common units and received net proceeds of approximately$1.1 billion. Refer to Note 17 of the accompanying Notes to Consolidated Financial Statementsincluded in Item 8 of this Form 10-K for further discussion of the accounting treatment of the commonunit offerings.
Utica Shale Joint Venture
Effective January 1, 2012, we and EMG Utica, LLC executed agreements to form the Utica JointVenture, operated through MarkWest Utica EMG, to develop significant natural gas processing andNGL fractionation, transportation and marketing infrastructure in Eastern Ohio beginning in 2012.
76
Under the terms of the agreements, we will make an initial contribution to MarkWest Utica EMGin a nominal amount in exchange for a 60% membership interest in MarkWest Utica EMG, and EMGUtica will make an initial contribution in a nominal amount and will agree to contribute to MarkWestUtica EMG $350 million in cash on an as needed basis (the ‘‘Initial EMG Contribution’’) in exchangefor a 40% membership interest in MarkWest Utica EMG. Following the funding of the Initial EMGContribution, either (i) EMG Utica will fund, as needed, all capital required to develop projects withinthe Utica Joint Venture until such time as EMG Utica’s total investment balance reaches $500 million(the ‘‘Minimum EMG Investment’’) or (ii) following the Initial EMG Contribution but prior to the firstcapital call requiring funds in excess of the Initial EMG Contribution, we will have the one time rightto elect to fund 60% of all capital required to develop projects within the Utica Joint Venture untilsuch time as EMG Utica’s total investment balance equals the Minimum EMG Investment and EMGUtica will be required to fund the remaining 40% of all such capital. Once EMG Utica has fundedcapital equal to the Minimum EMG Investment, we will be required to fund, as needed, 100% of allcapital required to develop projects within the Utica Joint Venture until such time as the totalinvestment balances of us and EMG Utica are in the ratio of 60% and 40%, respectively (such timebeing referred to as the ‘‘First Equalization Date’’).
Following the First Equalization Date, we shall have the right to elect to continue to fund up to100% of any additional capital required until such time as the investment balances of us and EMGUtica are in the ratio of 70% and 30%, respectively (such time being referred to as the ‘‘SecondEqualization Date’’). To the extent we do not fully exercise such right at any time prior to the SecondEqualization Date, EMG Utica shall have the right, but not the obligation, to contribute suchadditional capital that is requested and that is not contributed by us. After the Second EqualizationDate, EMG Utica shall have the right, but not the obligation, to maintain a 30% interest in MarkWestUtica EMG by funding 30% of any additional required capital.
Liquidity Risks and Uncertainties
Our ability to pay distributions to our unitholders, to fund planned capital expenditures and tomake acquisitions depends upon our future operating performance. That, in turn, may be affected byprevailing economic conditions in our industry, as well as financial, business and other factors, some ofwhich are beyond our control. Although NGL prices increased throughout 2010 and 2011, ouroperating performance could be negatively impacted if the increases in NGL prices are not sustained.Natural gas prices remained at low levels during 2010 and decreased further during the second half of2011. Although low natural gas prices, combined with high and increasing NGL prices increase ourearnings under keep-whole contracts in the short term, our long-term earnings could be adverselyimpacted, particularly from areas dependant on dry gas volumes, if the low natural gas prices do notincrease resulting in decreased drilling and production from producers. Additionally, legislationcurrently being written and new legislation recently enacted by Congress could limit our ability toexecute our hedging strategy, which would increase our exposure to adverse changes in commodityprices.
Cash Flow
The following table summarizes cash inflows (outflows) (in thousands).
Year endedDecember 31,
2011 2010 Change
Net cash provided by operating activities . . . . . . $ 414,698 $ 312,328 $ 102,370Net cash used in investing activities . . . . . . . . . . (776,553) (485,936) (290,617)Net cash provided by financing activities . . . . . . 411,421 143,306 268,115
77

Net cash provided by operating activities increased primarily due to a $143.3 million increase inoperating income, excluding derivative gains and losses, in our operating segments and an increase inoperating cash flows resulting from changes in working capital, which was partially offset by a$20.3 million decrease in net cash flow from the settlement of commodity derivative positions.
Net cash used in investing activities increased primarily due to the $230.7 million LangleyAcquisition.
Net cash provided by financing activities increased primarily due to:
• $953.2 million increase in proceeds from public equity offerings, and
• $505.4 million increase in net borrowings.
These increases were partially offset by:
• $997.6 million used to acquire EMG’s interest in MarkWest Liberty Midstream,
• $31.9 million decrease in cash contributions received from our joint venture partners,
• $60.7 million increase in distributions to non-controlling interest holders due to the increasedcash flow from MarkWest Liberty Midstream,
• $61.6 million increase in premiums paid for the redemption of our 2016 Senior Notes and 2018Senior Notes, and
• $37.3 million increase in distributions to common unitholders due to additional units outstandingand growth in the per unit distribution.
Total Contractual Cash Obligations
A summary of our total contractual cash obligations as of December 31, 2011, is as follows (inthousands):
Payment Due by Period
Total Due in Due in Due inType of obligation Obligation 2012 2013 - 2014 2015 - 2016 Thereafter
Long-term debt . . . . . . . . . . . . . . . . . . . . . . . . . . . . . $1,847,112 $ — $ — $ 66,000 $1,781,112Interest payments on long-term debt(1) . . . . . . . . . . . . . 1,131,969 119,737 239,475 238,815 533,942Operating leases and long-term storage agreement(2) . . . 59,383 10,299 16,481 14,940 17,663Purchase obligations(3) . . . . . . . . . . . . . . . . . . . . . . . . 192,382 180,971 11,411 — —Natural gas purchase obligations(4) . . . . . . . . . . . . . . . . 351,987 26,470 53,735 65,526 206,256SMR Liability(5) . . . . . . . . . . . . . . . . . . . . . . . . . . . . 317,089 17,412 34,824 34,824 230,029
Other long-term liabilities reflected on the ConsolidatedBalance Sheets:Asset retirement obligation(6) . . . . . . . . . . . . . . . . . . 6,818 — — — 6,818
Total contractual cash obligations . . . . . . . . . . . . . . . . . $3,906,740 $354,889 $355,926 $420,105 $2,775,820
(1) Assumes that our outstanding borrowing at December 31, 2011 remain outstanding until their respectivematurity dates and we incur interest at 4.0% on the Credit Facility, 8.75% on the 2018 Senior Notes, 6.75%on the 2020 Senior Notes, 6.5% on the 2021 Senior Notes and 6.25% on the 2022 Senior Notes.
(2) Amounts relate primarily to a long-term propane storage agreement and our office and vehicle leases.
(3) Represents purchase orders and contracts related to purchase of property, plant and equipment. Purchaseobligations exclude current and long-term unrealized losses on derivative instruments included on theaccompanying Consolidated Balance Sheets, which represent the current fair value of various derivativecontracts and do not represent future cash purchase obligations. These contracts are generally settled
78
financially at the difference between the future market price and the contractual price and may result in cashpayments or cash receipts in the future, but generally do not require delivery of physical quantities of theunderlying commodity.
(4) Natural gas purchase obligations consist primarily of a purchase agreement with a producer in the Northeastsegment. The contract provides for the purchase of keep-whole volumes at a specific price and is acomponent of a broader regional arrangement. The contract price is designed to share a portion of the fracspread with the producer and as a result, the amounts reflected for the obligation exceed the cost ofpurchasing the keep-whole volumes at a market price. The contract is considered an embedded derivative (seeNote 6 of the accompanying Notes to Consolidated Financial Statements included in Item 8 for the fair valueof the frac spread sharing component).
(5) Represents amounts due under a product supply agreement (see Note 18 of the accompanying Notes toConsolidated Financial Statements included in Item 8 of this Form 10-K).
(6) Excludes estimated accretion expense of $18.5 million. The total amount to be paid is approximately$25.3 million.
Off-Balance Sheet Arrangements
We do not engage in off-balance sheet financing activities.
Effects of Inflation
Inflation did not have a material impact on our results of operations for the years endedDecember 31, 2011, 2010 or 2009. Although the impact of inflation has been insignificant in recentyears, it is still a factor in the United States economy and may increase the cost to acquire or replaceproperty, plant and equipment. It may also increase the costs of labor and supplies. To the extentpermitted by competition, regulation and our existing agreements, we have and expect to continue topass along increased costs to our customers in the form of higher fees.
Critical Accounting Policies and Estimates
The preparation of financial statements in conformity with GAAP requires management to makeestimates and assumptions that affect the reported amounts of assets and liabilities, disclosure ofcontingent assets and liabilities at the date of the financial statements, and the reported amounts ofrevenues and expenses during the reporting period. Actual results could differ from those estimates.
The policies and estimates discussed below are considered by management to be critical to anunderstanding of our financial statements, because their application requires the most significantjudgments from management in estimating matters for financial reporting that are inherently uncertain.See Note 2 of the accompanying Notes to the Consolidated Financial Statements included in Item 8 of
79

this Form 10-K for additional information on these policies and estimates, as well as a discussion ofadditional accounting policies and estimates.
Effect if Actual Results Differ fromDescription Judgments and Uncertainties Estimates and Assumptions
Intangible Assets
Intangible assets are comprised of The fair value of customer contracts If the actual results differcustomer contracts and relationships is generally calculated using the significantly from the assumptionsacquired in business combinations, income approach discounted future used to determine the fair valuerecorded under the purchase cash flows. The key assumptions and economic lives of intangiblemethod of accounting at their include contract renewals, historical assets, the carrying value of theestimated fair values at the date of volumes, current and future capacity intangible asset may be over/acquisition. Using relevant of the gathering system, pricing understated resulting in an over/information and assumptions, volatility and the discount rate. understatement of amortizationmanagement determines the fair expense as the over/understatement
Amortization of intangibles withvalue of acquired identifiable of the intangible assets would createdefinite lives is calculated using theintangible assets. an under/overstatement of otherstraight-line method over the assets (i.e. goodwill).estimated useful life of theintangible asset. We consideralternative methods of amortizationwhen the intangibles assets areinitially recorded, however havepreviously determined thatalternative amortization methods donot create material differences inamortization expense each year andtherefore concluded straight-liningmethodology to be appropriate. Theestimated economic life isdetermined by assessing the life ofthe assets to which the contractsand relationships relate, likelihoodof renewals, the projected reserves,competitive factors, regulatory orlegal provisions and maintenanceand renewal costs.
80
Effect if Actual Results Differ fromDescription Judgments and Uncertainties Estimates and Assumptions
Impairment of Long-Lived Assets
Management evaluates our Management considers the volume As of December 31, 2011, therelong-lived assets, including of reserves dedicated to be were no indicators of impairmentintangibles, for impairment when processed by the asset and future for any of our asset groups.certain events have taken place that NGL product and natural gas prices
A significant variance in any of theindicate that the carrying value may to estimate cash flows for each assetassumptions or factors used tonot be recoverable from the group. The amount of additionalestimate future cash flows couldexpected undiscounted future cash reserves developed by future drillingresult in the impairment of an asset.flows. Qualitative and quantitative activity depends, in part, onA 10% decrease in the estimatedinformation is reviewed in order to expected commodity prices.future cash flows used in ourdetermine if a triggering event has Projections of reserves, drillingimpairment analysis would indicateoccurred or an impairment indicator activity and future commodity pricesa potential impairment for assetexists. If we determine that a are inherently subjective andgroups with a total carrying value oftriggering event has occurred we contingent upon a number ofapproximately $60 million.would complete a full impairment variable factors, many of which are
analysis. If we determine that the difficult to forecast.carrying value of an asset group isnot recoverable, a loss is recordedfor the difference between the fairvalue and the carrying value. Weevaluate our property, plant andequipment and intangibles on atleast a segment level and at lowerlevels where cash flows for specificassets can be identified.
81
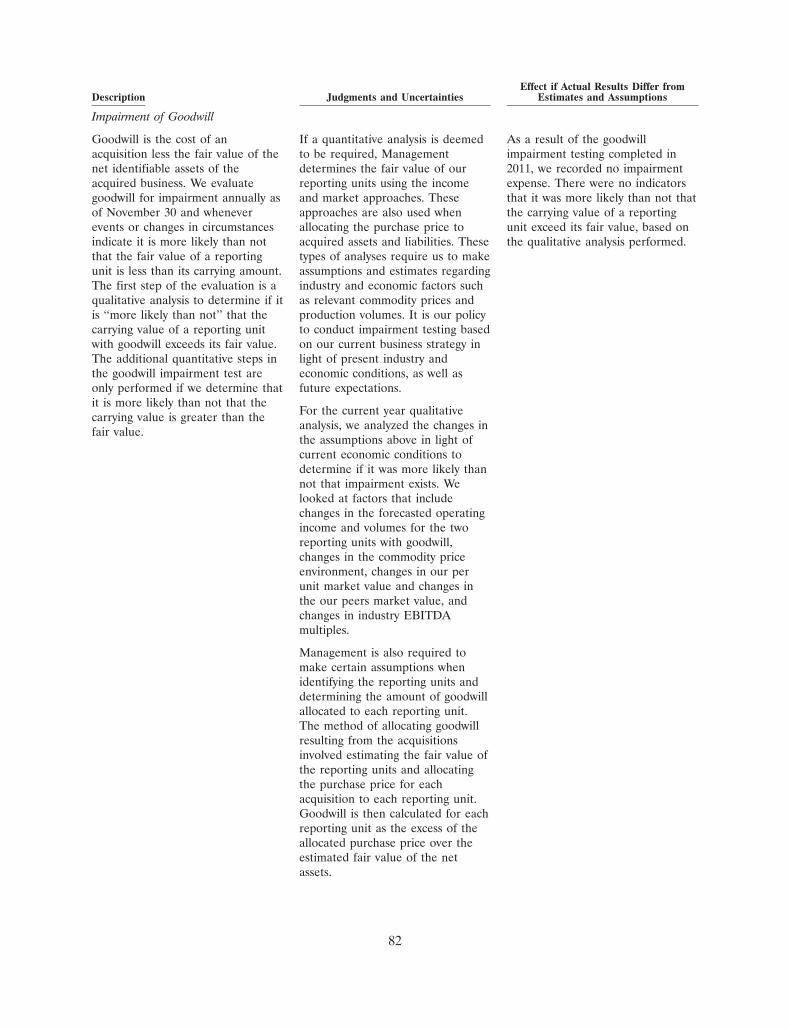
Effect if Actual Results Differ fromDescription Judgments and Uncertainties Estimates and Assumptions
Impairment of Goodwill
Goodwill is the cost of an If a quantitative analysis is deemed As a result of the goodwillacquisition less the fair value of the to be required, Management impairment testing completed innet identifiable assets of the determines the fair value of our 2011, we recorded no impairmentacquired business. We evaluate reporting units using the income expense. There were no indicatorsgoodwill for impairment annually as and market approaches. These that it was more likely than not thatof November 30 and whenever approaches are also used when the carrying value of a reportingevents or changes in circumstances allocating the purchase price to unit exceed its fair value, based onindicate it is more likely than not acquired assets and liabilities. These the qualitative analysis performed.that the fair value of a reporting types of analyses require us to makeunit is less than its carrying amount. assumptions and estimates regardingThe first step of the evaluation is a industry and economic factors suchqualitative analysis to determine if it as relevant commodity prices andis ‘‘more likely than not’’ that the production volumes. It is our policycarrying value of a reporting unit to conduct impairment testing basedwith goodwill exceeds its fair value. on our current business strategy inThe additional quantitative steps in light of present industry andthe goodwill impairment test are economic conditions, as well asonly performed if we determine that future expectations.it is more likely than not that the
For the current year qualitativecarrying value is greater than theanalysis, we analyzed the changes infair value.the assumptions above in light ofcurrent economic conditions todetermine if it was more likely thannot that impairment exists. Welooked at factors that includechanges in the forecasted operatingincome and volumes for the tworeporting units with goodwill,changes in the commodity priceenvironment, changes in our perunit market value and changes inthe our peers market value, andchanges in industry EBITDAmultiples.
Management is also required tomake certain assumptions whenidentifying the reporting units anddetermining the amount of goodwillallocated to each reporting unit.The method of allocating goodwillresulting from the acquisitionsinvolved estimating the fair value ofthe reporting units and allocatingthe purchase price for eachacquisition to each reporting unit.Goodwill is then calculated for eachreporting unit as the excess of theallocated purchase price over theestimated fair value of the netassets.
82

Effect if Actual Results Differ fromDescription Judgments and Uncertainties Estimates and Assumptions
Impairment of Equity Investments
We evaluate our equity method Our impairment assessment requires Based on the current forecasts, ourinvestment in Centrahoma for us to apply judgment in estimating ownership in Centrahoma willimpairment whenever events or future cash flows from Centrahoma. generate cash flows with a presentchanges in circumstances indicate, The primary estimates include the value in excess of the currentin management’s judgment, that the expected volumes to be processed carrying value of the investment.carrying value of such investment by Centrahoma, the terms of the Management determined that theremay have experienced a decline in related processing agreements, and were no material events or changesvalue. When evidence of an future commodity prices. We in circumstances that would indicateother-than-temporary loss in value determined that there were no an other-than-temporary decline inhas occurred, we compare the material events or changes in value of our investment inestimated fair value of the circumstances that would indicate Centrahoma.investment to the carrying value of an other-than-temporary loss inthe investment to determine value has occurred.whether an impairment has
Our impairment assessment requiresoccurred.us to apply judgment in estimatingfuture cash flows. The primaryestimates include the expectedvolumes to be processed byCentrahoma, the terms of therelated processing agreements, andfuture commodity prices.
Accounting for Risk ManagementActivities and Derivative FinancialInstruments
Our derivative financial instruments When available, quoted market If the assumptions used in theare recorded at fair value in the prices or prices obtained through pricing models for our Level 2 andaccompanying Consolidated Balance external sources are used to 3 financial instruments areSheets. Changes in fair value and determine a financial instrument’s inaccurate or if we had used ansettlements are reflected in our fair value. The valuation of Level 2 alternative valuation methodology,earnings in the accompanying financial instruments is based on the estimated fair value may haveConsolidated Statements of quoted market prices for similar been different, and we may beOperations as gains and losses assets and liabilities in active exposed to unrealized losses orrelated to revenue, purchased markets and other inputs that are gains that could be material. A 10%product costs, facility expenses observable. However, for other difference in our estimated fairand/or miscellaneous income. financial instruments for which value of Level 2 and 3 derivatives at
quoted market prices are not December 31, 2011 would haveavailable, the fair value is based on affected net income beforeinputs that are largely unobservable provision for income tax bysuch as option volatilities and NGL approximately $18.1 million for theprices that are interpolated and year ended December 31, 2011.extrapolated due to inactivemarkets. These instruments areclassified as Level 3 under the fairvalue hierarchy. All fair valuemeasurements are appropriatelyadjusted for nonperformance risk.
83

Effect if Actual Results Differ fromDescription Judgments and Uncertainties Estimates and Assumptions
Accounting for Significant EmbeddedDerivative Instruments
We have a Gas Purchase We carry the EQT embedded The EQT Embedded Derivative isAgreement with Equitable derivative at fair value with changes an instrument that is not exchange-(‘‘EQT’’), in which we are required in fair value recognized in income traded. The valuation of theto purchase natural gas based on a each period. The valuation requires instrument is complex and requirescomplex formula designed to share significant judgment when forming significant judgment. The inputssome of the frac-spread with EQT, the assumptions used. Third-party used in the valuation model requirethrough December 31, 2022. This forward curves for certain specialized knowledge, as NGLcontract has been identified as an commodity prices utilized in the price curves do not exist for theembedded derivative and requires a valuation do not extend through the entire term of the arrangement.complex valuation based on term of the arrangement. Thus,
The valuation is sensitive to NGLsignificant judgment. pricing is required to beand natural gas future price curves.extrapolated for those periods. We
The agreement has a primary term Holding the natural gas curvesutilize multiple cash flow techniquesthat expires on December 31, 2022 constant, a 10% increase (decrease)to extrapolate NGL pricing. Due toand contains two successive in NGL price curves causes a 30%the illiquidity of future markets, weterm-extending options under which increase (decrease) in the liability asdo not believe one method is moreEQT can extend the purchase of December 31, 2011. Holding theindicative of fair value than theagreement an additional five years. NGL curves constant, a 10%other methods. The fair value isSuch options are part of the increase (decrease) in the naturalalso appropriately adjusted forembedded feature and thus are gas curves causes a 10% decreasenonperformance risk each period.required to be considered in the (increase) in the liability as ofvaluation of the embedded We evaluated various factors in December 31, 2011.derivative. We are required to make order to determine the probability
The determination of the fair valuea significant judgment about the that the term-extending optionsof the option to extend is based onprobability that the options would would be exercised by EQT such asour judgment about the probabilitybe exercised when determining the estimates of future gas reserves inof EQT exercising the extension. Ifvalue of the extension options. the region, the competitiveit were determined that theenvironment in which the contractprobability of exercise was not 0%operates, the commodity priceas of December 31, 2011, theenvironment, and EQT’s businessliability would be understated.strategy. We have asserted that the
probability that EQT will exercisetheir option to extend theagreement is 0% as ofDecember 31, 2011 based on thehigh degree of uncertainty.
84

Effect if Actual Results Differ fromDescription Judgments and Uncertainties Estimates and Assumptions
Variable Interest Entities
We evaluate all legal entities in Significant judgment is exercised in MarkWest Pioneer is a VIE and wewhich we hold an ownership or determining that a legal entity is a are considered the primaryother pecuniary interest to VIE and in evaluating our interest beneficiary. We have a controllingdetermine if the entity is a VIE. in a VIE. interest in the Wirth Gathering
Partnership and the Bright StarOur interests in a VIE are referred We use primarily qualitative analysis Partnership, which are less-thanto as variable interests. Variable to determine if an entity is a VIE. wholly-owned but are consolidatedinterests can be contractual, We evaluate the entity’s need for under the voting interest model. Allownership or other pecuniary continuing financial support; the of these entities are consolidatedinterests in an entity that change equity holder’s lack of a controlling subsidiaries. Changes in the designwith changes in the fair value of the financial interest; and/or if an equity or nature of the activities of any ofVIE’s assets. holder’s voting interests are these entities, or our involvement
disproportionate to its obligation to with an entity may require us toWhen we conclude that we hold an absorb expected losses or receive reconsider our conclusions on theinterest in a VIE we must residual returns. entity’s status as a VIE and/or ourdetermine if we are the entity’sstatus as the primary beneficiary.primary beneficiary. A primary We evaluate our interests in a VIESuch reconsideration requiresbeneficiary is deemed to have a to determine whether we are thesignificant judgment andcontrolling financial interest in a primary beneficiary. We useunderstanding of the organization.VIE. This controlling financial primarily qualitative analysis toThis could result in theinterest is evidenced by both (a) the determine if we are deemed to havedeconsolidation of the affectedpower to direct the activities of the a controlling financial interest in thesubsidiary. The deconsolidation of aVIE that most significantly impact VIE.subsidiary would have a significantthe VIE’s economic performance
We continually monitor our impact on our financial statements.and (b) the obligation to absorbinterests in legal entities for changeslosses that could potentially be We account for our ownershipin the design or activities of ansignificant to the VIE or the right interest in Centrahoma under theentity and changes in our interests,to receive benefits that could equity method and have determinedincluding our status as the primarypotentially be significant to the it is not a VIE. However, changesbeneficiary to determine if theVIE. in the design or nature of thechanges require us to revise our
activities of the entity may requireWe consolidate any VIE when we previous conclusions.us to reconsider our conclusions.determine that we are the primarySuch reconsideration would requirebeneficiary. We must disclose thethe identification of the variablenature of any interests in a VIEinterests in the entity and athat is not consolidated.determination on which party is theentity’s primary beneficiary. IfCentrahoma were considered a VIEand we were determined to be theprimary beneficiary, the changecould cause us to consolidate theentity. The consolidation of anentity that is currently accounted forunder the equity method could havea significant impact on our financialstatements.
85

Effect if Actual Results Differ fromDescription Judgments and Uncertainties Estimates and Assumptions
Acquisitions—Purchase PriceAllocation
We allocate the purchase price of Purchase price allocation If estimates or assumptions used toan acquired business to its methodology requires management complete the purchase priceidentifiable assets and liabilities to make assumptions and apply allocation and estimate the fairbased on estimated fair values. The judgment to estimate the fair value value of acquired assets andexcess of the purchase price over of acquired assets and liabilities. liabilities significantly differed fromthe amount allocated to the assets Management estimates the fair assumptions made, the allocation ofand liabilities is recorded as value of assets and liabilities purchase price between goodwill,goodwill. primarily using a market approach, intangibles and property plant and
income approach, or cost approach, equipment could significantly differ.For significant acquisitions, we as appropriate. Key inputs into the Such a difference would impactengage outside appraisal firms to fair value determinations include future earnings throughassist in the fair value determination estimates and assumptions related depreciation and amortizationof identifiable intangible assets such to future volumes, commodity expense. In addition, if forecastsas customer relationships, trade prices, operating costs, replacement supporting the valuation of thenames and any other significant costs and construction costs, as well intangibles or goodwill are notassets or liabilities. We adjust the as an estimate of the expected term achieved, impairments could arise.preliminary purchase price and profits of the related customerallocation, as necessary, after the contract or contracts.acquisition closing date through theend of the measurement period ofup to one year as we finalizevaluations for the assets acquiredand liabilities assumed.
86

Recent Accounting Pronouncements
Refer to Note 2—Recent Accounting Pronouncements of the accompanying Notes to ConsolidatedFinancial Statements included in Item 8 of this Form 10-K for information regarding recent accountingpronouncements.
ITEM 7A. Quantitative and Qualitative Disclosures About Market Risk
Market risk includes the risk of loss arising from adverse changes in market rates and prices. Weface market risk from commodity price changes and, to a lesser extent, interest rate changes andnonperformance by our customers and counterparties.
Commodity Price Risk
NGL and natural gas prices are volatile and are impacted by changes in fundamental supply anddemand, as well as market uncertainty, availability of natural gas and NGL transportation, NGLfractionation capacity and a variety of additional factors that are beyond our control. Our profitabilityis directly affected by prevailing commodity prices primarily as a result of processing or conditioning atour or third-party processing plants, purchasing and selling, or gathering and transporting volumes ofnatural gas at index-related prices and the cost of third-party transportation and fractionation services.To the extent that commodity prices influence the level of drilling activity, such prices also affectprofitability. To protect ourselves financially against adverse price movements and to maintain morestable and predictable earnings so that we can meet our cash distribution objectives, debt service andcapital expenditures, we execute a strategy governed by the risk management policy approved by theBoard. We have a committee comprised of senior management that oversees risk managementactivities, continually monitors the risk management program and adjusts our strategy as conditionswarrant. We enter into certain derivative contracts to reduce the risks associated with unfavorablechanges in the prices of natural gas, NGLs and crude oil. Derivative contracts utilized are swaps,options and fixed price forward contracts traded on the OTC market. The risk management policy doesnot allow speculative derivative contracts.
To mitigate our cash flow exposure to fluctuations in the price of NGLs, we have entered intoderivative financial instruments relating to the future price of NGLs and crude oil. Generally wemanage our NGL price risk using crude oil as NGL financial markets lack adequate liquidity andhistorically there has been a strong relationship between changes in NGL and crude oil prices. Thepricing relationship between NGLs and crude oil may vary in certain periods because crude oil pricingis generally based on worldwide demand and the level of production of major crude oil exportingcountries while NGL prices are correlated to North America supply and petrochemical demand. Inperiods where NGL prices and crude oil prices are not consistent with the historical relationship, weincur increased risk and additional gains or losses. We enter into NGL derivative contracts whenadequate market liquidity exists.
To mitigate our cash flow exposure to fluctuations in the price of natural gas, we primarily utilizederivative financial instruments relating to the future price of natural gas. and take into account thepartial offset of our long and short gas positions resulting from normal operating activities.
As a result of our current derivative positions, we have mitigated a portion of our expectedcommodity price risk through the fourth quarter of 2014. We would be exposed to additionalcommodity risk in certain situations such as if producers under deliver or over deliver product or whenprocessing facilities are operated in different recovery modes. In the event we have derivative positionsin excess of the product delivered or expected to be delivered, the excess derivative positions may beterminated.
87

We enter into derivative contracts primarily with financial institutions that are participatingmembers of the Credit Facility as collateral is not posted by us as the participating members have acollateral position in substantially all of our wholly-owned assets other than MarkWest LibertyMidstream. All of our financial derivative positions are currently with participating bank groupmembers. Management conducts a standard credit review on counterparties. For all participating bankgroup members, collateral requirements do not exist when a derivative contract favors us. We usestandardized agreements that allow for offset of positive and negative exposures (master nettingarrangements).
Outstanding Derivative Contracts
The following tables provide information on the volume of our derivative activity for positionsrelated to long liquids and keep-whole price risk at December 31, 2011, including the weighted-averageprices (‘‘WAVG’’):
Volumes WAVG Floor WAVG Cap Fair ValueWTI Crude Collars (Bbl/d) (Per Bbl) (Per Bbl) (in thousands)
2012 . . . . . . . . . . . . . . . . . . . . . . . . 2,634 $75.65 $ 97.22 $(7,557)2013 . . . . . . . . . . . . . . . . . . . . . . . . 3,714 88.08 107.45 2,1142014 . . . . . . . . . . . . . . . . . . . . . . . . 734 95.36 114.81 2,359
Volumes WAVG Price Fair ValueWTI Crude Swaps (Bbl/d) (Per Bbl) (in thousands)
2012 . . . . . . . . . . . . . . . . . . . . . . . . . . . . . . . . 6,555 $87.21 $(33,561)2013 . . . . . . . . . . . . . . . . . . . . . . . . . . . . . . . . 4,665 92.70 (5,080)2014 . . . . . . . . . . . . . . . . . . . . . . . . . . . . . . . . 746 99.89 1,751
Volumes WAVG Price Fair ValueNatural Gas Swaps (MMBtu/d) (Per MMBtu) (in thousands)
2012 . . . . . . . . . . . . . . . . . . . . . . . . . . . . . . 14,377 $4.41 $(6,941)2013 . . . . . . . . . . . . . . . . . . . . . . . . . . . . . . 980 5.13 (469)
Volumes WAVG Price Fair ValuePropane Swaps (Gal/d) (Per Gal) (in thousands)
2012 (Jan - Mar) . . . . . . . . . . . . . . . . . . . . . . . 140,047 $1.42 $1,571
Volumes WAVG Price Fair ValueIsoButane Swaps (Gal/d) (Per Gal) (in thousands)
2012 (Jan - Mar) . . . . . . . . . . . . . . . . . . . . . . . 25,051 $1.85 $(547)
Volumes WAVG Price Fair ValueNormal Butane Swaps (Gal/d) (Per Gal) (in thousands)
2012 (Jan - Mar) . . . . . . . . . . . . . . . . . . . . . . . 40,083 $1.79 $(272)
Volumes WAVG Price Fair ValueNatural Gasoline Swaps (Gal/d) (Per Gal) (in thousands)
2012 (Jan - Mar) . . . . . . . . . . . . . . . . . . . . . . . 92,847 $2.29 $632
88

The following tables provide information on the volume of our taxable subsidiary’s commodityderivative activity for positions related to keep-whole price risk at December 31, 2011, including theWAVG:
Volumes WAVG Floor WAVG Cap Fair ValueWTI Crude Collars (Bbl/d) (Per Bbl) (Per Bbl) (in thousands)
2012 . . . . . . . . . . . . . . . . . . . . . . . . 1,122 $78.49 $101.71 $(2,261)
Volumes WAVG Price Fair ValueWTI Crude Swaps (Bbl/d) (Per Bbl) (in thousands)
2012(1) . . . . . . . . . . . . . . . . . . . . . . . . . . . . . . 1,083 $87.11 $(7,946)2013 . . . . . . . . . . . . . . . . . . . . . . . . . . . . . . . . 1,304 94.32 (638)
Volumes WAVG Price Fair ValueNatural Gas Swaps (MMBtu/d) (Per MMBtu) (in thousands)
2012 . . . . . . . . . . . . . . . . . . . . . . . . . . . . . . 14,419 $6.02 $(14,435)2013 . . . . . . . . . . . . . . . . . . . . . . . . . . . . . . 9,793 5.34 (4,956)2014 . . . . . . . . . . . . . . . . . . . . . . . . . . . . . . 4,249 5.69 (2,023)
Volumes WAVG Price Fair ValuePropane Swaps (Gal/d) (Per Gal) (in thousands)
2012 (Jan - Mar) . . . . . . . . . . . . . . . . . . . . . . . 152,569 $1.46 $1,1132013 (Jan - Mar, Oct - Dec) . . . . . . . . . . . . . . . 36,885 1.29 (190)2014 (Jan - Mar, Oct - Dec) . . . . . . . . . . . . . . . 87,837 1.25 (522)
Volumes WAVG Price Fair ValueIsoButane Swaps (Gal/d) (Per Gal) (in thousands)
2012 (Jan - Mar) . . . . . . . . . . . . . . . . . . . . . . . 8,282 $1.82 $(254)2013 . . . . . . . . . . . . . . . . . . . . . . . . . . . . . . . . 3,081 1.70 (102)2014 . . . . . . . . . . . . . . . . . . . . . . . . . . . . . . . . 3,885 1.67 (91)
Volumes WAVG Price Fair ValueNormal Butane Swaps (Gal/d) (Per Gal) (in thousands)
2012 (Jan - Mar) . . . . . . . . . . . . . . . . . . . . . . . 22,944 $1.75 $(342)2013 . . . . . . . . . . . . . . . . . . . . . . . . . . . . . . . . 8,512 1.61 (225)2014 . . . . . . . . . . . . . . . . . . . . . . . . . . . . . . . . 10,711 1.61 (115)
Volumes WAVG Price Fair ValueNatural Gasoline Swaps (Gal/d) (Per Gal) (in thousands)
2012 (Jan - Mar) . . . . . . . . . . . . . . . . . . . . . . . 14,969 $2.28 $ 332013 . . . . . . . . . . . . . . . . . . . . . . . . . . . . . . . . 5,600 2.26 3272014 . . . . . . . . . . . . . . . . . . . . . . . . . . . . . . . . 7,106 2.32 683
(1) During the second quarter of 2011, we effectively converted our swap hedges related toour first quarter 2012 NGL exposure from crude proxy hedges to direct NGL producthedges by purchasing crude swaps to offset the existing crude swap positions. The volumeof offsetting crude swaps outstanding as of December 31, 2011 was 277,095 barrels for Q12012. The outstanding positions were being used to manage price risk on NGL products.To continue to manage price risk on NGL products, we sold NGL product swaps throughthe first quarter of 2012.
89

The following table provides information on the volume of MarkWest Liberty Midstream’scommodity derivative activity positions related to long liquids price risk at December 31, 2011,including the WAVG:
Volumes WAVG Price Fair ValuePropane Swaps (Gal/d) (Per Gal) (in thousands)
2012 (Jan - Mar) . . . . . . . . . . . . . . . . . . . . . . . 49,010 $1.54 $684
The following table provides information on the derivative positions related to long liquids andkeep-whole price risk that we have entered into subsequent to December 31, 2011, including theWAVG:
Volumes WAVG Floor WAVG CapWTI Crude Collars (Bbl/d) (Per Bbl) (Per Bbl)
2012 . . . . . . . . . . . . . . . . . . . . . . . . . . . . . . . . . . 638 $90.00 $108.82
Volumes WAVG PriceWTI Crude Swaps (Bbl/d) (Per Bbl)
2013 . . . . . . . . . . . . . . . . . . . . . . . . . . . . . . . . . . . . . . . . . . . 796 $98.462014 . . . . . . . . . . . . . . . . . . . . . . . . . . . . . . . . . . . . . . . . . . . 1,027 $95.03
Volumes WAVG PriceNatural Gas Swaps (MMBtu/d) (Per MMBtu)
2012 . . . . . . . . . . . . . . . . . . . . . . . . . . . . . . . . . . . . . . . . 2,767 $2.722013 (Jan - Sep) . . . . . . . . . . . . . . . . . . . . . . . . . . . . . . . . 634 $3.70
The following tables provide information on the derivative positions of MarkWest LibertyMidstream related to long liquids price risk that we have entered into subsequent to December 31,2011, including the WAVG:
Volumes WAVG Floor WAVG CapWTI Crude Collars (Bbl/d) (Per Bbl) (Per Bbl)
2012 (Apr - Dec) . . . . . . . . . . . . . . . . . . . . . . . . . 682 $90.00 $108.992013 . . . . . . . . . . . . . . . . . . . . . . . . . . . . . . . . . . 494 92.00 108.67
We have a commodity contract with a producer in the Appalachia region that creates a floor onthe frac spread for gas purchases of 9,000 Dth/d. The commodity contract is a component of a broaderregional arrangement that also includes a keep-whole processing agreement. This contract is accountedfor as an embedded derivative and is recorded at fair value. The changes in fair value of thiscommodity contract are based on the difference between the contractual and index pricing and arerecorded in earnings through Derivative loss related to purchased product costs. In February 2011, weexecuted agreements with the producer to extend the commodity contract and the related processingagreement from March 31, 2015 to December 31, 2022. As of December 31, 2011, the estimated fairvalue of this contract was a liability of $114.9 million and the recorded value was a liability of$61.4 million. The recorded liability does not include the inception fair value of the commodity contractrelated to the extended period from April 1, 2015 to December 31, 2022. In accordance with GAAP fornon-option embedded derivatives, the fair value of this extended portion of the commodity contract atits inception of February 1, 2011 is deemed to be allocable to the host processing contract and,
90

therefore, not recorded as a derivative liability. See the following table for a reconciliation of theliability recorded for the embedded derivative as of December 31, 2011 (in thousands):
Fair value of commodity contract . . . . . . . . . . . . . . . . . . . . . . . . . . . . . . $114,928Inception value for period from April 1, 2015 to December 31, 2022 . . . . (53,507)
Derivative liability as of December 31, 2011 . . . . . . . . . . . . . . . . . . . . . . $ 61,421
We have a commodity contract that gives us an option to fix a component of the utilities cost to anindex price on electricity at one of our plant locations through the fourth quarter of 2014. The changesin the fair value of the derivative component of this contract is recognized as Derivative (gain) lossrelated to facility expenses. As of December 31, 2011, the estimated fair value of this contract was anasset of $7.5 million.
Interest Rate Risk
Our primary interest rate risk exposure results from our Credit Facility which has a borrowingcapacity of $900 million. As of February 17, 2012, we have no borrowings outstanding on the CreditFacility. The debt related to this agreement bears interest at variable rates that are tied to either theU.S. prime rate or LIBOR at the time of borrowing.
We may make use of interest rate swap agreements in the future to adjust the ratio of fixed andfloating rates in our debt portfolio. In July 2009, we entered into fixed-to-variable interest rate swapagreements having a combined notional principal amount of $275 million. The swaps were intended tomitigate the effects of changes in fair value due to changes in the benchmark interest rate (one-monthLIBOR). We managed the fair value risk on a portion of our 2014 Senior Notes that were redeemed inthe fourth quarter of 2010. All outstanding interest rate swaps were settled in January 2010.
Outstanding atLong-Term Debt Interest Rate Lending Limit Due Date December 31, 2011
Credit Facility . . . . . Variable $900 million September 2016 $ 66 million2018 Senior Notes . . Fixed $ 81 million April 2018 $ 81 million2020 Senior Notes . . Fixed $500 million November 2020 $500 million2021 Senior Notes . . Fixed $500 million August 2021 $500 million2022 Senior Notes . . Fixed $700 million June 2022 $700 million
Based on our overall interest rate exposure at December 31, 2011, a hypothetical increase ordecrease of one percentage point in interest rates applied to borrowings under our Credit Facilitywould change earnings by approximately $0.7 million over a 12-month period. Based on our overallinterest rate exposure at February 17, 2012, a hypothetical increase or decrease of one percentage pointin interest rates applied to borrowings under our Credit Facility would not change earnings.
Credit Risk
We are subject to risk of loss resulting from nonpayment or nonperformance by the counterpartiesto our derivative contracts. Our credit exposure related to commodity derivative instruments isrepresented by the fair value of contracts with a net positive fair value at the reporting date. Theseoutstanding instruments expose us to credit loss in the event of nonperformance by the counterpartiesto the agreements. Should the creditworthiness of one or more of our counterparties decline, ourability to mitigate nonperformance risk is limited to a counterparty agreeing to either a voluntarytermination and subsequent cash settlement or a novation of the derivative contract to a third party. Inthe event of a counterparty default, we may sustain a loss and our cash receipts could be negativelyimpacted.
91

We are subject to risk of loss resulting from nonpayment by our customers to whom we providemidstream services or sell natural gas or NGLs. Our credit exposure related to these customers isrepresented by the value of our trade receivables. Where exposed to credit risk, we analyze thecustomer’s financial condition prior to entering into a transaction or agreement, establish credit termsand monitor the appropriateness of these terms on an ongoing basis. In the event of a customerdefault, we may sustain a loss and our cash receipts could be negatively impacted.
92

ITEM 8. Financial Statements and Supplementary Data
Index to Consolidated Financial Statements
Report of Deloitte & Touche LLP, Independent Registered Public Accounting Firm . . . . . . . . . . . 94Consolidated Balance Sheets at December 31, 2011 and 2010 . . . . . . . . . . . . . . . . . . . . . . . . . . . 95Consolidated Statements of Operations for the years ended December 31, 2011, 2010 and 2009 . . . 96Consolidated Statements of Changes in Equity and Comprehensive Income for the years ended
December 31, 2011, 2010 and 2009 . . . . . . . . . . . . . . . . . . . . . . . . . . . . . . . . . . . . . . . . . . . . . 97Consolidated Statements of Cash Flows for the years ended December 31, 2011, 2010 and 2009 . . 98Notes to Consolidated Financial Statements for the years ended December 31, 2011, 2010 and
2009 . . . . . . . . . . . . . . . . . . . . . . . . . . . . . . . . . . . . . . . . . . . . . . . . . . . . . . . . . . . . . . . . . . . 99
All schedules have been omitted because they are not required or because the requiredinformation is contained in the financial statements or notes thereto.
93

REPORT OF INDEPENDENT REGISTERED PUBLIC ACCOUNTING FIRM
To the Board of Directors ofMarkWest Energy GP, L.L.C.Denver, Colorado
We have audited the accompanying consolidated balance sheets of MarkWest Energy Partners, L.P.and subsidiaries (the ‘‘Partnership’’) as of December 31, 2011 and 2010, and the related consolidatedstatements of operations, changes in equity, and cash flows for each of the three years in the periodended December 31, 2011. These financial statements are the responsibility of the Partnership’smanagement. Our responsibility is to express an opinion on these financial statements based on ouraudits.
We conducted our audits in accordance with the standards of the Public Company AccountingOversight Board (United States). Those standards require that we plan and perform the audit to obtainreasonable assurance about whether the financial statements are free of material misstatement. Anaudit includes examining, on a test basis, evidence supporting the amounts and disclosures in thefinancial statements. An audit also includes assessing the accounting principles used and significantestimates made by management, as well as evaluating the overall financial statement presentation. Webelieve that our audits provide a reasonable basis for our opinion.
In our opinion, such consolidated financial statements present fairly, in all material respects, thefinancial position of MarkWest Energy Partners, L.P. and subsidiaries as of December 31, 2011 and2010, and the results of their operations and their cash flows for each of the three years in the periodended December 31, 2011, in conformity with accounting principles generally accepted in the UnitedStates of America.
We have also audited, in accordance with the standards of the Public Company AccountingOversight Board (United States), the Partnership’s internal control over financial reporting as ofDecember 31, 2011, based on the criteria established in Internal Control—Integrated Framework issuedby the Committee of Sponsoring Organizations of the Treadway Commission and our report datedFebruary 28, 2012 expressed an unqualified opinion on the Partnership’s internal control over financialreporting.
/s/ DELOITTE & TOUCHE LLP
Denver, ColoradoFebruary 28, 2012
94

MARKWEST ENERGY PARTNERS, L.P.
CONSOLIDATED BALANCE SHEETS
(in thousands)
December 31, 2011 December 31, 2010
ASSETSCurrent assets:
Cash and cash equivalents ($2,684 and $2,913, respectively) . . . . . . . . . . . . . $ 117,016 $ 67,450Restricted cash . . . . . . . . . . . . . . . . . . . . . . . . . . . . . . . . . . . . . . . . . . 26,193 —Receivables, net ($1,569 and $43,783, respectively) . . . . . . . . . . . . . . . . . . . 226,561 179,209Inventories ($0 and $8,431) . . . . . . . . . . . . . . . . . . . . . . . . . . . . . . . . . . 41,006 23,432Fair value of derivative instruments . . . . . . . . . . . . . . . . . . . . . . . . . . . . . 8,698 4,345Deferred income taxes . . . . . . . . . . . . . . . . . . . . . . . . . . . . . . . . . . . . . 14,885 16,090Other current assets ($169 and $272, respectively) . . . . . . . . . . . . . . . . . . . 11,748 8,020
Total current assets . . . . . . . . . . . . . . . . . . . . . . . . . . . . . . . . . . . . . . 446,107 298,546
Property, plant and equipment ($156,808 and $849,986, respectively) . . . . . . . . . 3,302,369 2,613,027Less: accumulated depreciation ($15,551 and $38,169, respectively) . . . . . . . . . . (438,062) (294,003)
Total property, plant and equipment, net . . . . . . . . . . . . . . . . . . . . . . . . 2,864,307 2,319,024
Other long-term assets:Restricted cash ($0 and $28,001) . . . . . . . . . . . . . . . . . . . . . . . . . . . . . . — 28,001Investment in unconsolidated affiliate . . . . . . . . . . . . . . . . . . . . . . . . . . . 27,853 28,688Intangibles, net of accumulated amortization of $168,168 and $124,568,
respectively . . . . . . . . . . . . . . . . . . . . . . . . . . . . . . . . . . . . . . . . . . . 603,767 613,578Goodwill . . . . . . . . . . . . . . . . . . . . . . . . . . . . . . . . . . . . . . . . . . . . . . 67,918 9,421Deferred financing costs, net of accumulated amortization of $13,194 and
$11,445, respectively . . . . . . . . . . . . . . . . . . . . . . . . . . . . . . . . . . . . . 41,798 32,901Deferred contract cost, net of accumulated amortization of $2,262 and $1,950,
respectively . . . . . . . . . . . . . . . . . . . . . . . . . . . . . . . . . . . . . . . . . . . 988 1,300Fair value of derivative instruments . . . . . . . . . . . . . . . . . . . . . . . . . . . . . 16,092 417Other long-term assets ($102 and $383, respectively) . . . . . . . . . . . . . . . . . 1,595 1,486
Total assets . . . . . . . . . . . . . . . . . . . . . . . . . . . . . . . . . . . . . . . . . . . $4,070,425 $3,333,362
LIABILITIES AND EQUITYCurrent liabilities:
Accounts payable ($96 and $5,945, respectively) . . . . . . . . . . . . . . . . . . . . . $ 179,871 $ 122,473Accrued liabilities ($1,144 and $64,713, respectively) . . . . . . . . . . . . . . . . . . 171,451 153,869Deferred income taxes . . . . . . . . . . . . . . . . . . . . . . . . . . . . . . . . . . . . . — 11Fair value of derivative instruments . . . . . . . . . . . . . . . . . . . . . . . . . . . . . 90,551 65,489
Total current liabilities . . . . . . . . . . . . . . . . . . . . . . . . . . . . . . . . . . . . 441,873 341,842
Deferred income taxes . . . . . . . . . . . . . . . . . . . . . . . . . . . . . . . . . . . . . . . 93,664 87,881Fair value of derivative instruments . . . . . . . . . . . . . . . . . . . . . . . . . . . . . . 65,403 66,290Long-term debt, net of discounts of $1,050 and $1,566, respectively . . . . . . . . . 1,846,062 1,273,434Other long-term liabilities ($73 and $154, respectively) . . . . . . . . . . . . . . . . . . 121,356 105,349
Commitments and contingencies (see Note 18)
Equity:Common units (94,940 and 71,440 common units issued and outstanding,
respectively) . . . . . . . . . . . . . . . . . . . . . . . . . . . . . . . . . . . . . . . . . . 679,309 993,049Class B units (19,954 and 0 units issued and outstanding, respectively) . . . . . . 752,531 —Non-controlling interest in consolidated subsidiaries . . . . . . . . . . . . . . . . . . 70,227 465,517
Total equity . . . . . . . . . . . . . . . . . . . . . . . . . . . . . . . . . . . . . . . . . . . 1,502,067 1,458,566
Total liabilities and equity . . . . . . . . . . . . . . . . . . . . . . . . . . . . . . . . . $4,070,425 $3,333,362
Asset and liability amounts in parentheses represent the portion of the consolidated balanceattributable to variable interest entities.
The accompanying notes are an integral part of these consolidated financial statements.
95
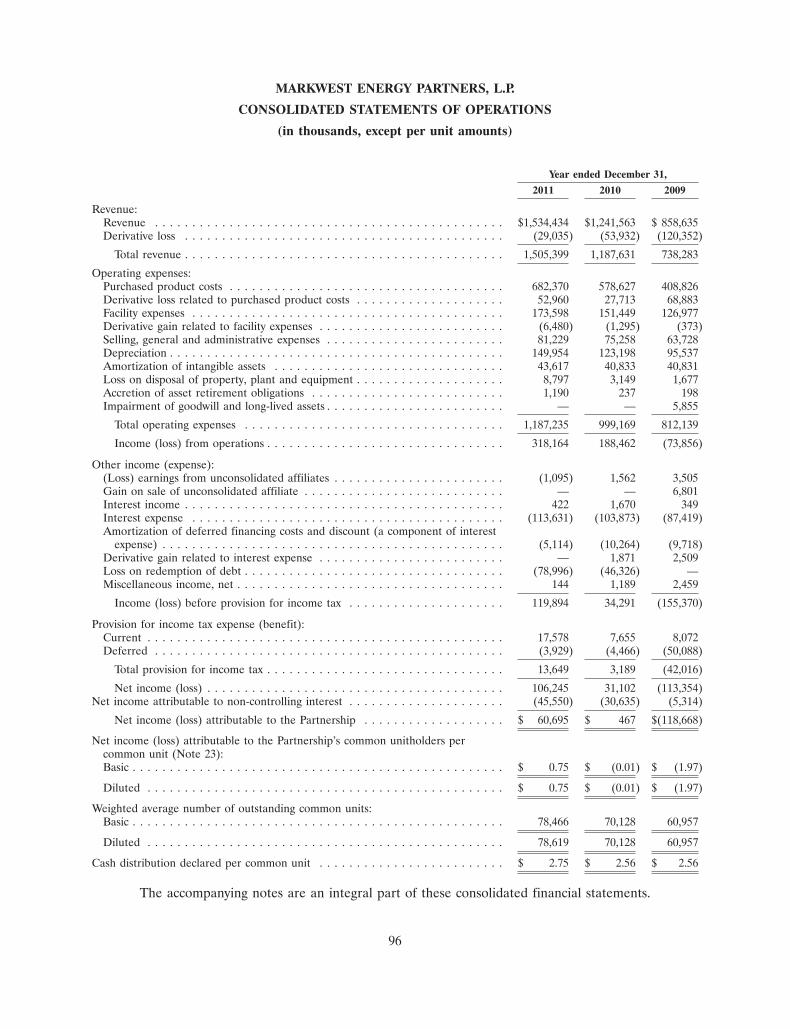
MARKWEST ENERGY PARTNERS, L.P.
CONSOLIDATED STATEMENTS OF OPERATIONS
(in thousands, except per unit amounts)
Year ended December 31,
2011 2010 2009
Revenue:Revenue . . . . . . . . . . . . . . . . . . . . . . . . . . . . . . . . . . . . . . . . . . . . . . . $1,534,434 $1,241,563 $ 858,635Derivative loss . . . . . . . . . . . . . . . . . . . . . . . . . . . . . . . . . . . . . . . . . . . (29,035) (53,932) (120,352)
Total revenue . . . . . . . . . . . . . . . . . . . . . . . . . . . . . . . . . . . . . . . . . . . 1,505,399 1,187,631 738,283
Operating expenses:Purchased product costs . . . . . . . . . . . . . . . . . . . . . . . . . . . . . . . . . . . . . 682,370 578,627 408,826Derivative loss related to purchased product costs . . . . . . . . . . . . . . . . . . . . 52,960 27,713 68,883Facility expenses . . . . . . . . . . . . . . . . . . . . . . . . . . . . . . . . . . . . . . . . . . 173,598 151,449 126,977Derivative gain related to facility expenses . . . . . . . . . . . . . . . . . . . . . . . . . (6,480) (1,295) (373)Selling, general and administrative expenses . . . . . . . . . . . . . . . . . . . . . . . . 81,229 75,258 63,728Depreciation . . . . . . . . . . . . . . . . . . . . . . . . . . . . . . . . . . . . . . . . . . . . . 149,954 123,198 95,537Amortization of intangible assets . . . . . . . . . . . . . . . . . . . . . . . . . . . . . . . 43,617 40,833 40,831Loss on disposal of property, plant and equipment . . . . . . . . . . . . . . . . . . . . 8,797 3,149 1,677Accretion of asset retirement obligations . . . . . . . . . . . . . . . . . . . . . . . . . . 1,190 237 198Impairment of goodwill and long-lived assets . . . . . . . . . . . . . . . . . . . . . . . . — — 5,855
Total operating expenses . . . . . . . . . . . . . . . . . . . . . . . . . . . . . . . . . . . 1,187,235 999,169 812,139
Income (loss) from operations . . . . . . . . . . . . . . . . . . . . . . . . . . . . . . . . 318,164 188,462 (73,856)
Other income (expense):(Loss) earnings from unconsolidated affiliates . . . . . . . . . . . . . . . . . . . . . . . (1,095) 1,562 3,505Gain on sale of unconsolidated affiliate . . . . . . . . . . . . . . . . . . . . . . . . . . . — — 6,801Interest income . . . . . . . . . . . . . . . . . . . . . . . . . . . . . . . . . . . . . . . . . . . 422 1,670 349Interest expense . . . . . . . . . . . . . . . . . . . . . . . . . . . . . . . . . . . . . . . . . . (113,631) (103,873) (87,419)Amortization of deferred financing costs and discount (a component of interest
expense) . . . . . . . . . . . . . . . . . . . . . . . . . . . . . . . . . . . . . . . . . . . . . . (5,114) (10,264) (9,718)Derivative gain related to interest expense . . . . . . . . . . . . . . . . . . . . . . . . . — 1,871 2,509Loss on redemption of debt . . . . . . . . . . . . . . . . . . . . . . . . . . . . . . . . . . . (78,996) (46,326) —Miscellaneous income, net . . . . . . . . . . . . . . . . . . . . . . . . . . . . . . . . . . . . 144 1,189 2,459
Income (loss) before provision for income tax . . . . . . . . . . . . . . . . . . . . . 119,894 34,291 (155,370)
Provision for income tax expense (benefit):Current . . . . . . . . . . . . . . . . . . . . . . . . . . . . . . . . . . . . . . . . . . . . . . . . 17,578 7,655 8,072Deferred . . . . . . . . . . . . . . . . . . . . . . . . . . . . . . . . . . . . . . . . . . . . . . . (3,929) (4,466) (50,088)
Total provision for income tax . . . . . . . . . . . . . . . . . . . . . . . . . . . . . . . . 13,649 3,189 (42,016)
Net income (loss) . . . . . . . . . . . . . . . . . . . . . . . . . . . . . . . . . . . . . . . . 106,245 31,102 (113,354)Net income attributable to non-controlling interest . . . . . . . . . . . . . . . . . . . . . (45,550) (30,635) (5,314)
Net income (loss) attributable to the Partnership . . . . . . . . . . . . . . . . . . . $ 60,695 $ 467 $(118,668)
Net income (loss) attributable to the Partnership’s common unitholders percommon unit (Note 23):Basic . . . . . . . . . . . . . . . . . . . . . . . . . . . . . . . . . . . . . . . . . . . . . . . . . . $ 0.75 $ (0.01) $ (1.97)
Diluted . . . . . . . . . . . . . . . . . . . . . . . . . . . . . . . . . . . . . . . . . . . . . . . . $ 0.75 $ (0.01) $ (1.97)
Weighted average number of outstanding common units:Basic . . . . . . . . . . . . . . . . . . . . . . . . . . . . . . . . . . . . . . . . . . . . . . . . . . 78,466 70,128 60,957
Diluted . . . . . . . . . . . . . . . . . . . . . . . . . . . . . . . . . . . . . . . . . . . . . . . . 78,619 70,128 60,957
Cash distribution declared per common unit . . . . . . . . . . . . . . . . . . . . . . . . . $ 2.75 $ 2.56 $ 2.56
The accompanying notes are an integral part of these consolidated financial statements.
96

MARKWEST ENERGY PARTNERS, L.P.
CONSOLIDATED STATEMENTS OF CHANGES IN EQUITY
(in thousands)
Non-Common Units Class B Units controllingUnits Amount Units Amount Interest Total
December 31, 2008 . . . . . . . . . . . . . . . . . . . . . . 56,640 $ 1,144,854 — $ — $ 3,301 $ 1,148,155Share-based compensation activity . . . . . . . . . . . . 275 5,204 — — — 5,204Distributions paid . . . . . . . . . . . . . . . . . . . . . . . — (155,307) — — (155) (155,462)Issuance of units in public offerings, net of
offering costs . . . . . . . . . . . . . . . . . . . . . . . . 9,360 178,565 — — — 178,565Contributions to MarkWest Liberty Midstream
joint venture, net . . . . . . . . . . . . . . . . . . . . . . — (5,464) — — 200,000 194,536Proceeds from sale of equity interest in joint
venture, net . . . . . . . . . . . . . . . . . . . . . . . . . — (1,846) — — 62,500 60,654Transfer to non-controlling interest from sale of
equity interest in joint venture, net of tax . . . . . — (10,288) — — 11,779 1,491Deferred income tax impact from changes in
equity . . . . . . . . . . . . . . . . . . . . . . . . . . . . . — (10,236) — — — (10,236)Net (loss) income . . . . . . . . . . . . . . . . . . . . . . . — (118,668) — — 5,314 (113,354)
December 31, 2009 . . . . . . . . . . . . . . . . . . . . . . 66,275 1,026,814 — — 282,739 1,309,553Share-based compensation activity . . . . . . . . . . . . 278 12,087 — — — 12,087Excess tax benefits related to share-based
compensation . . . . . . . . . . . . . . . . . . . . . . . . — 98 — — — 98Distributions paid . . . . . . . . . . . . . . . . . . . . . . . — (181,058) — — (6,150) (187,208)Issuance of units in public offering, net of offering
costs . . . . . . . . . . . . . . . . . . . . . . . . . . . . . . 4,887 142,255 — — — 142,255Contributions to MarkWest Liberty Midstream
joint venture, . . . . . . . . . . . . . . . . . . . . . . . . — — — — 158,293 158,293Deferred income tax impact from changes in
equity . . . . . . . . . . . . . . . . . . . . . . . . . . . . . — (7,614) — — — (7,614)Net income . . . . . . . . . . . . . . . . . . . . . . . . . . . — 467 — — 30,635 31,102
December 31, 2010 . . . . . . . . . . . . . . . . . . . . . . 71,440 993,049 — — 465,517 1,458,566Share-based compensation activity . . . . . . . . . . . . 275 8,083 — — — 8,083Excess tax benefits related to share-based
compensation . . . . . . . . . . . . . . . . . . . . . . . . — 1,084 — — — 1,084Distributions paid . . . . . . . . . . . . . . . . . . . . . . . — (218,398) — — (66,887) (285,285)Issuance of units in public offerings, net of
offering costs . . . . . . . . . . . . . . . . . . . . . . . . 23,225 1,095,488 — — — 1,095,488Issuance of Class B units . . . . . . . . . . . . . . . . . . — — 19,954 752,531 — 752,531Contributions to MarkWest Liberty Midstream
joint venture . . . . . . . . . . . . . . . . . . . . . . . . . — — — — 126,392 126,392Purchase of non-controlling interest of MarkWest
Liberty M&R, net of tax benefit . . . . . . . . . . . — (1,198,465) — — (500,345) (1,698,810)Deferred income tax impact from changes in
equity . . . . . . . . . . . . . . . . . . . . . . . . . . . . . — (62,227) — — — (62,227)Net income . . . . . . . . . . . . . . . . . . . . . . . . . . . — 60,695 — — 45,550 106,245
December 31, 2011 . . . . . . . . . . . . . . . . . . . . . . 94,940 $ 679,309 19,954 $752,531 $ 70,227 $ 1,502,067
The accompanying notes are an integral part of these consolidated financial statements.
97
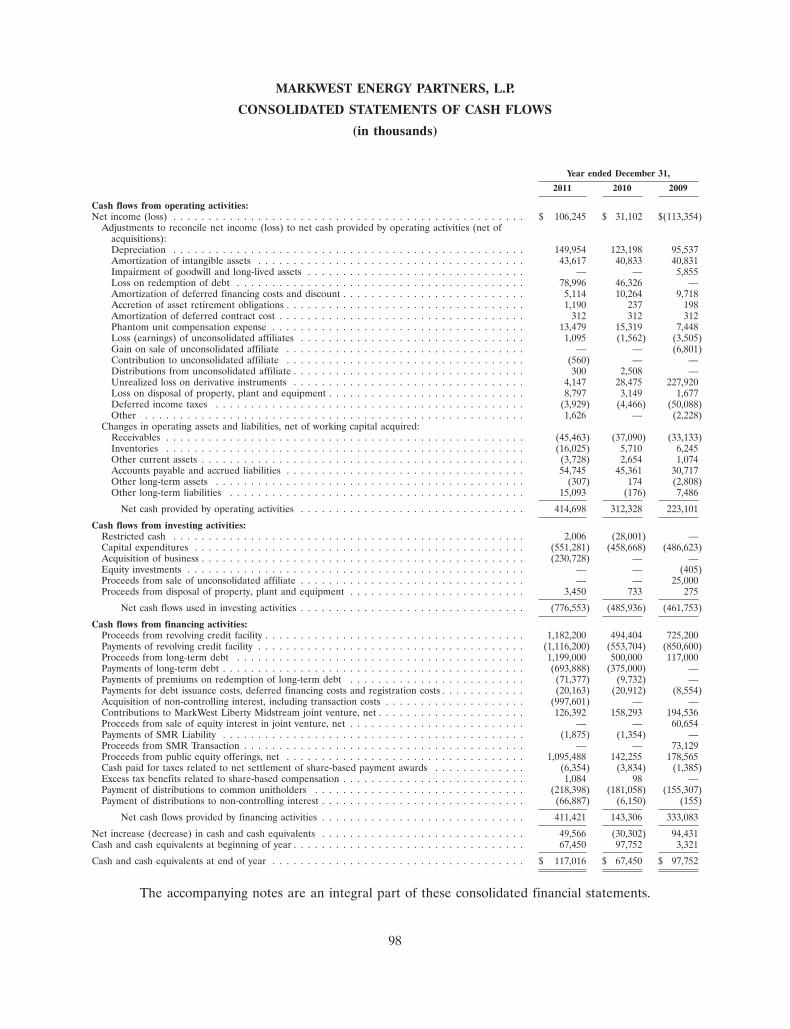
MARKWEST ENERGY PARTNERS, L.P.
CONSOLIDATED STATEMENTS OF CASH FLOWS
(in thousands)
Year ended December 31,
2011 2010 2009
Cash flows from operating activities:Net income (loss) . . . . . . . . . . . . . . . . . . . . . . . . . . . . . . . . . . . . . . . . . . . . . . . . . . $ 106,245 $ 31,102 $(113,354)
Adjustments to reconcile net income (loss) to net cash provided by operating activities (net ofacquisitions):Depreciation . . . . . . . . . . . . . . . . . . . . . . . . . . . . . . . . . . . . . . . . . . . . . . . . . . 149,954 123,198 95,537Amortization of intangible assets . . . . . . . . . . . . . . . . . . . . . . . . . . . . . . . . . . . . . . 43,617 40,833 40,831Impairment of goodwill and long-lived assets . . . . . . . . . . . . . . . . . . . . . . . . . . . . . . . — — 5,855Loss on redemption of debt . . . . . . . . . . . . . . . . . . . . . . . . . . . . . . . . . . . . . . . . . 78,996 46,326 —Amortization of deferred financing costs and discount . . . . . . . . . . . . . . . . . . . . . . . . . . 5,114 10,264 9,718Accretion of asset retirement obligations . . . . . . . . . . . . . . . . . . . . . . . . . . . . . . . . . . 1,190 237 198Amortization of deferred contract cost . . . . . . . . . . . . . . . . . . . . . . . . . . . . . . . . . . . 312 312 312Phantom unit compensation expense . . . . . . . . . . . . . . . . . . . . . . . . . . . . . . . . . . . . 13,479 15,319 7,448Loss (earnings) of unconsolidated affiliates . . . . . . . . . . . . . . . . . . . . . . . . . . . . . . . . 1,095 (1,562) (3,505)Gain on sale of unconsolidated affiliate . . . . . . . . . . . . . . . . . . . . . . . . . . . . . . . . . . — — (6,801)Contribution to unconsolidated affiliate . . . . . . . . . . . . . . . . . . . . . . . . . . . . . . . . . . (560) — —Distributions from unconsolidated affiliate . . . . . . . . . . . . . . . . . . . . . . . . . . . . . . . . . 300 2,508 —Unrealized loss on derivative instruments . . . . . . . . . . . . . . . . . . . . . . . . . . . . . . . . . 4,147 28,475 227,920Loss on disposal of property, plant and equipment . . . . . . . . . . . . . . . . . . . . . . . . . . . . 8,797 3,149 1,677Deferred income taxes . . . . . . . . . . . . . . . . . . . . . . . . . . . . . . . . . . . . . . . . . . . . (3,929) (4,466) (50,088)Other . . . . . . . . . . . . . . . . . . . . . . . . . . . . . . . . . . . . . . . . . . . . . . . . . . . . . . 1,626 — (2,228)
Changes in operating assets and liabilities, net of working capital acquired:Receivables . . . . . . . . . . . . . . . . . . . . . . . . . . . . . . . . . . . . . . . . . . . . . . . . . . . (45,463) (37,090) (33,133)Inventories . . . . . . . . . . . . . . . . . . . . . . . . . . . . . . . . . . . . . . . . . . . . . . . . . . . (16,025) 5,710 6,245Other current assets . . . . . . . . . . . . . . . . . . . . . . . . . . . . . . . . . . . . . . . . . . . . . . (3,728) 2,654 1,074Accounts payable and accrued liabilities . . . . . . . . . . . . . . . . . . . . . . . . . . . . . . . . . . 54,745 45,361 30,717Other long-term assets . . . . . . . . . . . . . . . . . . . . . . . . . . . . . . . . . . . . . . . . . . . . (307) 174 (2,808)Other long-term liabilities . . . . . . . . . . . . . . . . . . . . . . . . . . . . . . . . . . . . . . . . . . 15,093 (176) 7,486
Net cash provided by operating activities . . . . . . . . . . . . . . . . . . . . . . . . . . . . . . . . 414,698 312,328 223,101
Cash flows from investing activities:Restricted cash . . . . . . . . . . . . . . . . . . . . . . . . . . . . . . . . . . . . . . . . . . . . . . . . . . 2,006 (28,001) —Capital expenditures . . . . . . . . . . . . . . . . . . . . . . . . . . . . . . . . . . . . . . . . . . . . . . . (551,281) (458,668) (486,623)Acquisition of business . . . . . . . . . . . . . . . . . . . . . . . . . . . . . . . . . . . . . . . . . . . . . . (230,728) — —Equity investments . . . . . . . . . . . . . . . . . . . . . . . . . . . . . . . . . . . . . . . . . . . . . . . . — — (405)Proceeds from sale of unconsolidated affiliate . . . . . . . . . . . . . . . . . . . . . . . . . . . . . . . . — — 25,000Proceeds from disposal of property, plant and equipment . . . . . . . . . . . . . . . . . . . . . . . . . 3,450 733 275
Net cash flows used in investing activities . . . . . . . . . . . . . . . . . . . . . . . . . . . . . . . . (776,553) (485,936) (461,753)
Cash flows from financing activities:Proceeds from revolving credit facility . . . . . . . . . . . . . . . . . . . . . . . . . . . . . . . . . . . . . 1,182,200 494,404 725,200Payments of revolving credit facility . . . . . . . . . . . . . . . . . . . . . . . . . . . . . . . . . . . . . . (1,116,200) (553,704) (850,600)Proceeds from long-term debt . . . . . . . . . . . . . . . . . . . . . . . . . . . . . . . . . . . . . . . . . 1,199,000 500,000 117,000Payments of long-term debt . . . . . . . . . . . . . . . . . . . . . . . . . . . . . . . . . . . . . . . . . . . (693,888) (375,000) —Payments of premiums on redemption of long-term debt . . . . . . . . . . . . . . . . . . . . . . . . . (71,377) (9,732) —Payments for debt issuance costs, deferred financing costs and registration costs . . . . . . . . . . . . (20,163) (20,912) (8,554)Acquisition of non-controlling interest, including transaction costs . . . . . . . . . . . . . . . . . . . . (997,601) — —Contributions to MarkWest Liberty Midstream joint venture, net . . . . . . . . . . . . . . . . . . . . . 126,392 158,293 194,536Proceeds from sale of equity interest in joint venture, net . . . . . . . . . . . . . . . . . . . . . . . . . — — 60,654Payments of SMR Liability . . . . . . . . . . . . . . . . . . . . . . . . . . . . . . . . . . . . . . . . . . . (1,875) (1,354) —Proceeds from SMR Transaction . . . . . . . . . . . . . . . . . . . . . . . . . . . . . . . . . . . . . . . . — — 73,129Proceeds from public equity offerings, net . . . . . . . . . . . . . . . . . . . . . . . . . . . . . . . . . . 1,095,488 142,255 178,565Cash paid for taxes related to net settlement of share-based payment awards . . . . . . . . . . . . . (6,354) (3,834) (1,385)Excess tax benefits related to share-based compensation . . . . . . . . . . . . . . . . . . . . . . . . . . 1,084 98 —Payment of distributions to common unitholders . . . . . . . . . . . . . . . . . . . . . . . . . . . . . . (218,398) (181,058) (155,307)Payment of distributions to non-controlling interest . . . . . . . . . . . . . . . . . . . . . . . . . . . . . (66,887) (6,150) (155)
Net cash flows provided by financing activities . . . . . . . . . . . . . . . . . . . . . . . . . . . . . 411,421 143,306 333,083
Net increase (decrease) in cash and cash equivalents . . . . . . . . . . . . . . . . . . . . . . . . . . . . . 49,566 (30,302) 94,431Cash and cash equivalents at beginning of year . . . . . . . . . . . . . . . . . . . . . . . . . . . . . . . . . 67,450 97,752 3,321
Cash and cash equivalents at end of year . . . . . . . . . . . . . . . . . . . . . . . . . . . . . . . . . . . . $ 117,016 $ 67,450 $ 97,752
The accompanying notes are an integral part of these consolidated financial statements.
98

MARKWEST ENERGY PARTNERS, L.P.
NOTES TO CONSOLIDATED FINANCIAL STATEMENTS
1. Organization and Basis of Presentation
MarkWest Energy Partners, L.P. (‘‘MarkWest Energy Partners’’) was formed in January 2002 as aDelaware limited partnership. In February 2008, MarkWest Energy Partners completed its Merger withMarkWest Hydrocarbon, Inc. (the ‘‘Corporation’’ or ‘‘MarkWest Hydrocarbon’’) and MWEP, L.L.C,whereby MarkWest Hydrocarbon became a wholly-owned subsidiary of MarkWest Energy Partners.MarkWest Energy Partners and its majority-owned subsidiaries (collectively, the ‘‘Partnership’’) areengaged in the gathering, transportation and processing of natural gas; the transportation, fractionation,marketing and storage of NGLs and the gathering and transportation of crude oil. The Partnership hasestablished a significant presence in the Southwest through strategic acquisitions and strong organicgrowth opportunities stemming from those acquisitions. The Partnership is also the largest processorand fractionator of natural gas in the Appalachian Basin and continues to expand this position throughthe growth of its operations in the Marcellus Shale. Finally, the Partnership owns a crude oiltransportation pipeline in Michigan. The Partnership’s principal executive office is located in Denver,Colorado.
The Partnership’s consolidated financial statements include all majority-owned or majority-controlled subsidiaries. In addition, MarkWest Liberty Midstream and MarkWest Pioneer, variableinterest entities for which the Partnership has been determined to be the primary beneficiary, areincluded in the consolidated financial statements. Effective December 31, 2011, the Partnershipacquired the remaining 49% interest of MarkWest Liberty Midstream. As a result, as of December 31,2011, MarkWest Liberty Midstream is not a variable interest entity but is consolidated as a wholly-owned subsidiary (see Note 4 for further discussion of MarkWest Pioneer and MarkWest LibertyMidstream). For non-wholly-owned subsidiaries, the interests owned by third parties have beenrecorded as Non-controlling interest in consolidated subsidiaries in the accompanying ConsolidatedBalance Sheets. All significant intercompany investments, accounts and transactions have beeneliminated. Investments in which the Partnership exercises significant influence but does not control, oris not the primary beneficiary, are accounted for using the equity method. The accompanyingconsolidated financial statements include the accounts of the Partnership and have been prepared inaccordance with GAAP.
2. Summary of Significant Accounting Policies
Use of Estimates
The preparation of financial statements in conformity with GAAP requires management to makeestimates and assumptions that affect the reported amounts of assets and liabilities, disclosure ofcontingent assets and liabilities at the date of the financial statements and the reported amounts ofrevenues and expenses during the reporting period. Actual results could differ from those estimates.Estimates affect, among other items, valuing identified intangible assets; determining the fair value ofderivative instruments; valuing inventory; evaluating impairments of long-lived assets, goodwill andequity investments; establishing estimated useful lives for long-lived assets; recognition of share-basedcompensation expense; estimating revenues and expense accruals; valuing asset retirement obligations;and in determining liabilities, if any, for legal contingencies.
99

MARKWEST ENERGY PARTNERS, L.P.
NOTES TO CONSOLIDATED FINANCIAL STATEMENTS (Continued)
2. Summary of Significant Accounting Policies (Continued)
Cash and Cash Equivalents
The Partnership considers investments in highly liquid financial instruments purchased with anoriginal maturity of 90 days or less to be cash equivalents. Such investments include money marketaccounts.
Restricted Cash
Restricted cash includes cash and investments that must be held in escrow until certain capitalprojects are completed and the third party releases the restriction. Restricted cash balances for whichthe restrictions will not be released within a period of twelve months are classified as a long-term assetin the Consolidated Balance Sheets.
Inventories
Inventories, which consist primarily of natural gas, propane, other NGLs and spare parts andsupplies, are valued at the lower of weighted-average cost or market. Processed natural gas inventoriesinclude material, labor and overhead. Shipping and handling costs related to purchases of natural gasand NGLs are included in inventory.
Property, Plant and Equipment
Property, plant and equipment are recorded at cost. Expenditures that extend the useful lives ofassets are capitalized. Repairs, maintenance and renewals that do not extend the useful lives of theassets are expensed as incurred. Interest costs for the construction or development of long-lived assetsare capitalized and amortized over the related asset’s estimated useful life. Leasehold improvementsare depreciated over the shorter of the useful life or lease term. Depreciation is provided, principallyon the straight-line method, over a period of 20 to 25 years for all assets, with the exception ofmiscellaneous equipment and vehicles, which are depreciated over a period of three to ten years.
The Partnership evaluates transactions involving the sale of property, plant and equipment todetermine if they are, in-substance, the sale of real estate. Tangible assets may be considered real estateif the costs to relocate them for use in a different location exceeds 10% of the asset’s fair value.Financial assets, primarily in the form of ownership interests in an entity, may be in-substance realestate based on the significance of the real estate in the entity. Sales of real estate are not consideredconsummated if the Partnership maintains an interest in the asset after it is sold or has certain otherforms of continuing involvement. Significant judgment is required to determine if a transaction is a saleof real estate and if a transaction has been consummated. If a sale of real estate is not consideredconsummated, the Partnership cannot record the transaction as a sale and must account for thetransaction under an alternative method of accounting such as a financing or leasing arrangement. ThePartnership’s 2009 sale of the SMR, which was considered in-substance real estate, was not considereda sale due to the Partnership’s continuing involvement and was accounted for as a financingarrangement. The Partnership’s sale of equity interest in MarkWest Pioneer in 2009 was considered thesale of in-substance real estate. See Note 5 and Note 4, respectively, for a description of eachtransaction and its impact on the financial statements.
100
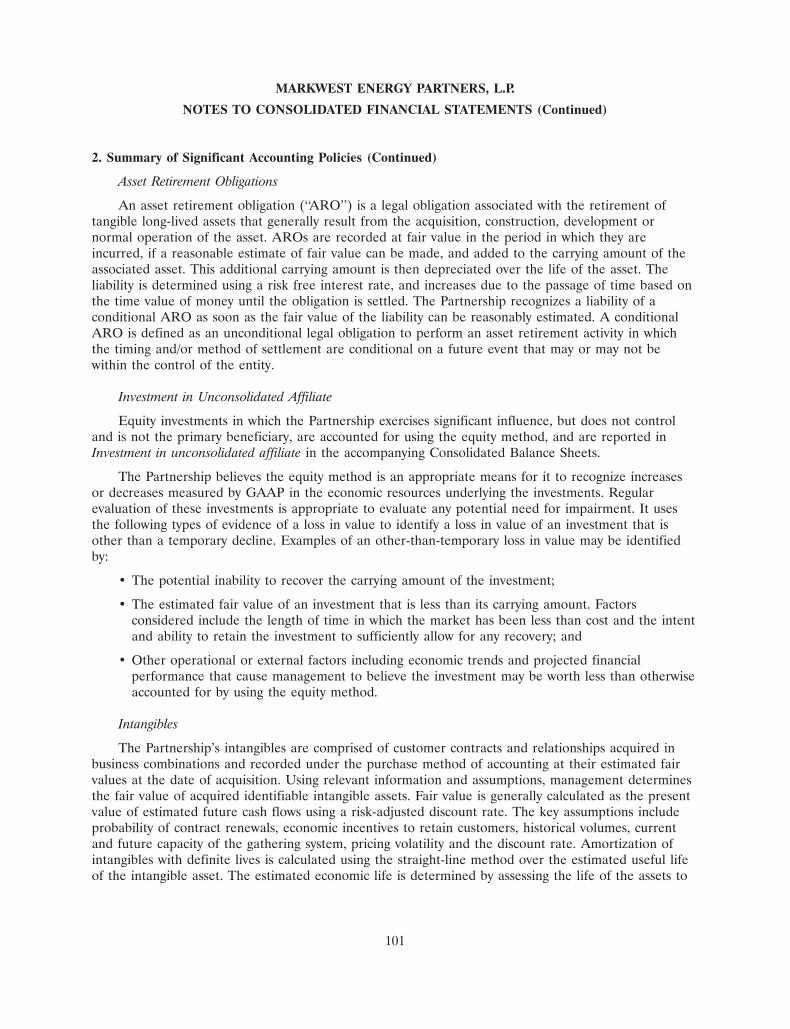
MARKWEST ENERGY PARTNERS, L.P.
NOTES TO CONSOLIDATED FINANCIAL STATEMENTS (Continued)
2. Summary of Significant Accounting Policies (Continued)
Asset Retirement Obligations
An asset retirement obligation (‘‘ARO’’) is a legal obligation associated with the retirement oftangible long-lived assets that generally result from the acquisition, construction, development ornormal operation of the asset. AROs are recorded at fair value in the period in which they areincurred, if a reasonable estimate of fair value can be made, and added to the carrying amount of theassociated asset. This additional carrying amount is then depreciated over the life of the asset. Theliability is determined using a risk free interest rate, and increases due to the passage of time based onthe time value of money until the obligation is settled. The Partnership recognizes a liability of aconditional ARO as soon as the fair value of the liability can be reasonably estimated. A conditionalARO is defined as an unconditional legal obligation to perform an asset retirement activity in whichthe timing and/or method of settlement are conditional on a future event that may or may not bewithin the control of the entity.
Investment in Unconsolidated Affiliate
Equity investments in which the Partnership exercises significant influence, but does not controland is not the primary beneficiary, are accounted for using the equity method, and are reported inInvestment in unconsolidated affiliate in the accompanying Consolidated Balance Sheets.
The Partnership believes the equity method is an appropriate means for it to recognize increasesor decreases measured by GAAP in the economic resources underlying the investments. Regularevaluation of these investments is appropriate to evaluate any potential need for impairment. It usesthe following types of evidence of a loss in value to identify a loss in value of an investment that isother than a temporary decline. Examples of an other-than-temporary loss in value may be identifiedby:
• The potential inability to recover the carrying amount of the investment;
• The estimated fair value of an investment that is less than its carrying amount. Factorsconsidered include the length of time in which the market has been less than cost and the intentand ability to retain the investment to sufficiently allow for any recovery; and
• Other operational or external factors including economic trends and projected financialperformance that cause management to believe the investment may be worth less than otherwiseaccounted for by using the equity method.
Intangibles
The Partnership’s intangibles are comprised of customer contracts and relationships acquired inbusiness combinations and recorded under the purchase method of accounting at their estimated fairvalues at the date of acquisition. Using relevant information and assumptions, management determinesthe fair value of acquired identifiable intangible assets. Fair value is generally calculated as the presentvalue of estimated future cash flows using a risk-adjusted discount rate. The key assumptions includeprobability of contract renewals, economic incentives to retain customers, historical volumes, currentand future capacity of the gathering system, pricing volatility and the discount rate. Amortization ofintangibles with definite lives is calculated using the straight-line method over the estimated useful lifeof the intangible asset. The estimated economic life is determined by assessing the life of the assets to
101

MARKWEST ENERGY PARTNERS, L.P.
NOTES TO CONSOLIDATED FINANCIAL STATEMENTS (Continued)
2. Summary of Significant Accounting Policies (Continued)
which the contracts and relationships relate, likelihood of renewals, the projected reserves, competitivefactors, regulatory or legal provisions and maintenance and renewal costs.
Goodwill
Goodwill is the cost of an acquisition less the fair value of the net identifiable assets of theacquired business. The Partnership evaluates goodwill for impairment annually as of November 30, andwhenever events or changes in circumstances indicate it is more likely than not that the fair value of areporting unit is less than its carrying amount. The Partnership first assesses qualitative factors toevaluate whether it is more likely than not that the fair value of a reporting unit is less than its carryingamount as the basis for determining whether it is necessary to perform the two-step goodwillimpairment test. If a two-step process goodwill impairment test is required, the first step involvescomparing the fair value of the reporting unit, to which goodwill has been allocated, with its carryingamount. If the carrying amount of a reporting unit exceeds its fair value, the second step of the processinvolves comparing the implied fair value to the carrying value of the goodwill for that reporting unit.If the carrying value of the goodwill of a reporting unit exceeds the implied fair value of that goodwill,the excess of the carrying value over the implied fair value is recognized as an impairment loss.
Impairment of Long-Lived Assets
The Partnership’s policy is to evaluate whether there has been an impairment in the value oflong-lived assets when certain events indicate that the remaining balance may not be recoverable. ThePartnership evaluates the carrying value of its property, plant and equipment on at least a segmentlevel and at lower levels where the cash flows for specific assets can be identified and are largelyindependent from other asset groups. A long-lived asset group is considered impaired when theestimated undiscounted cash flows from such asset group are less than the asset group’s carrying value.In that event, a loss is recognized to the extent that the carrying value exceeds the fair value of thelong-lived asset group. Fair value is determined primarily using estimated discounted cash flows.Management considers the volume of reserves behind the asset and future NGL product and naturalgas prices to estimate cash flows. The amount of additional reserves developed by future drillingactivity depends, in part, on expected natural gas prices. Projections of reserves, drilling activity andfuture commodity prices are inherently subjective and contingent upon a number of variable factors,many of which are difficult to forecast. Any significant variance in any of these assumptions or factorscould materially affect future cash flows, which could result in the impairment of an asset group.
For assets identified to be disposed of in the future, the carrying value of these assets is comparedto the estimated fair value, less the cost to sell, to determine if impairment is required. Until the assetsare disposed of, an estimate of the fair value is re-determined when related events or circumstanceschange.
Deferred Financing Costs
Deferred financing costs are amortized over the contractual term of the related obligations or, incertain circumstances, accelerated if the obligation is refinanced, using the effective interest method.
102

MARKWEST ENERGY PARTNERS, L.P.
NOTES TO CONSOLIDATED FINANCIAL STATEMENTS (Continued)
2. Summary of Significant Accounting Policies (Continued)
Deferred Contract Cost
The Partnership may pay consideration to a producer upon entering a long-term arrangement toprovide midstream services to the producer. In such cases, the amount of consideration paid isrecorded as Deferred contract cost, net of accumulated amortization on the accompanying ConsolidatedBalance Sheets and is amortized over the term of the arrangement.
Derivative Instruments
Derivative instruments (including derivative instruments embedded in other contracts) are recordedat fair value and included in the consolidated balance sheet as assets or liabilities. Assets and liabilitiesrelated to derivative instruments with the same counterparty are not netted in the consolidated balancesheet. The Partnership discloses the fair value of all of its derivative instruments separate from otherassets and liabilities under the caption Fair value of derivative instruments in the Consolidated BalanceSheet, inclusive of option premiums (net of amortization). Changes in the fair value of derivativeinstruments are reported in the Statement of Operations in accounts related to the item whose value orcash flows are being managed. Substantially all derivative instruments were marked to market throughRevenue, Purchased product costs, Facility expenses, Interest expense or Miscellaneous income (expense),net. Revenue gains and losses relate to contracts utilized to manage the cash flow for the sale of aproduct and the amortization of associated option premiums. Option premiums are amortized over theeffective term of the corresponding option contract. Purchased product costs gains and losses relate tocontracts utilized to manage costs, typically in a keep-whole arrangement. Facility expenses gains andlosses relate to a contract utilized to manage electricity costs. Interest expense gains relate to contractsto manage the interest rate risk associated with the fair value of its fixed rate borrowings.Miscellaneous income (expense), net relate to changes in the fair value of certain embedded putoptions (see Note 6). Changes in risk management activities are reported as an adjustment to netincome in computing cash flow from operating activities on the accompanying Consolidated Statementsof Cash Flows.
During 2011, 2010 and 2009, the Partnership did not designate any hedges or designate anycontracts as normal purchases and normal sales.
Fair Value of Financial Instruments
Management believes the carrying amount of financial instruments, including cash, accountsreceivable, accounts payable and accrued expenses approximates fair value because of the short-termmaturity of these instruments. The recorded value of the amounts outstanding under the Credit Facilityapproximates fair value due to the variable interest rate that approximates current market rates.Derivative instruments are recorded at fair value, based on available market information (see Note 6).The following table shows the carrying value and related fair value of financial instruments that are notrecorded in the financial statements at fair value as of December 31, 2011 and 2010 (in thousands):
December 31, 2011 December 31, 2010
Carrying Value Fair Value Carrying Value Fair Value
Long-term debt . . . . . . . . . . . $1,846,062 $1,880,710 $1,273,434 $1,333,875SMR Liability . . . . . . . . . . . . 93,909 119,887 95,784 125,600
103

MARKWEST ENERGY PARTNERS, L.P.
NOTES TO CONSOLIDATED FINANCIAL STATEMENTS (Continued)
2. Summary of Significant Accounting Policies (Continued)
The fair value of the long-term debt is estimated based on recent market quotes. The fair value ofthe SMR Liability is estimated using a discounted cash flow approach based on the contractual cashflows and the Partnership’s unsecured borrowing rate.
Fair Value Measurement
Financial assets and liabilities recorded at fair value in the Consolidated Balance Sheet arecategorized based upon a fair value hierarchy established by GAAP, which classifies the inputs used tomeasure fair value into the following levels:
• Level 1—inputs to the valuation methodology are quoted prices (unadjusted) for identicalassets or liabilities in active markets.
• Level 2—inputs to the valuation methodology include quoted prices for similar assets andliabilities in active markets, and inputs that are observable for the asset or liability, eitherdirectly or indirectly, for substantially the full term of the financial instrument.
• Level 3—inputs to the valuation methodology are unobservable and significant to the fairvalue measurement.
A financial instrument’s categorization within the valuation hierarchy is based upon the lowestlevel of input that is significant to the fair value measurement.
The determination to classify a financial instrument with Level 3 of the valuation hierarchy isbased upon the significance of the unobservable inputs to the overall fair value measurement. However,Level 3 financial instruments typically include, in addition to the unobservable or Level 3 inputs,observable inputs (that is, inputs that are actively quoted and can be validated to external sources);accordingly, the gains and losses for Level 3 financial instruments include changes in fair value due inpart to observable inputs that are part of the valuation methodology. Level 3 financial instrumentsinclude interest rate swaps, crude oil options, all NGL derivatives, the embedded derivatives incommodity contracts and the embedded put options discussed in Note 6 and Note 16 as they havesignificant unobservable inputs.
The methods and assumptions described above may produce a fair value that may not be realizedin future periods upon settlement. Furthermore, while the Partnership believes its valuation methodsare appropriate and consistent with other market participants, the use of different methodologies orassumptions to determine the fair value of certain financial instruments could result in a differentestimate of fair value at the reporting date. For further discussion see Note 7.
Revenue Recognition
The Partnership generates the majority of its revenues from natural gas gathering, transportationand processing; NGL transportation, fractionation, marketing and storage; and crude oil gathering andtransportation. It enters into a variety of contract types. The Partnership provides services under thefollowing different types of arrangements:
• Fee-based arrangements—Under fee-based arrangements, the Partnership receives a fee or feesfor one or more of the following services: gathering, processing and transmission of natural gas;transportation, fractionation exchange and storage of NGLs; and gathering and transportation ofcrude oil. The revenue the Partnership earns from these arrangements is generally directly
104

MARKWEST ENERGY PARTNERS, L.P.
NOTES TO CONSOLIDATED FINANCIAL STATEMENTS (Continued)
2. Summary of Significant Accounting Policies (Continued)
related to the volume of natural gas, NGLs or crude oil that flows through the Partnership’ssystems and facilities and is not directly dependent on commodity prices. In certain cases, thePartnership’s arrangements provide for minimum annual payments or fixed demand charges.
• Percent-of-proceeds arrangements—Under percent-of-proceeds arrangements, the Partnershipgathers and processes natural gas on behalf of producers, sells the resulting residue gas,condensate and NGLs at market prices and remits to producers an agreed-upon percentage ofthe proceeds. In other cases, instead of remitting cash payments to the producer, the Partnershipdelivers an agreed-upon percentage of the residue gas and NGLs to the producer and sell thevolumes the Partnership keeps to third parties.
• Percent-of-index arrangements—Under percent-of-index arrangements, the Partnership purchasesnatural gas at either (1) a percentage discount to a specified index price, (2) a specified indexprice less a fixed amount, or (3) a percentage discount to a specified index price less anadditional fixed amount. The Partnership then gathers and delivers the natural gas to pipelineswhere the Partnership resells the natural gas at the index price or at a different percentagediscount to the index price.
• Keep-whole arrangements—Under keep-whole arrangements, the Partnership gathers natural gasfrom the producer, processes the natural gas and sells the resulting condensate and NGLs tothird parties at market prices. Because the extraction of the condensate and NGLs from thenatural gas during processing reduces the Btu content of the natural gas, the Partnership musteither purchase natural gas at market prices for return to producers or make cash payment tothe producers equal to the energy content of this natural gas. Certain keep-whole arrangementsalso have provisions that require the Partnership to share a percentage of the keep-whole profitswith the producers based on the oil to gas ratio or the NGL to gas ratio.
• Settlement margin—Typically, the Partnership is allowed to retain a fixed percentage of thevolume gathered to cover the compression fuel charges and deemed-line losses. To the extentthe Partnership’s gathering systems are operated more or less efficiently than specified percontract allowance, the Partnership is entitled to retain the benefit or loss for its own account.
In many cases, the Partnership provides services under contracts that contain a combination ofmore than one of the arrangements described above. The terms of the Partnership’s contracts varybased on gas quality conditions, the competitive environment when the contracts are signed andcustomer requirements. It is upon delivery and title transfer that the Partnership meets all four revenuerecognition criteria and it is at such time that the Partnership recognizes revenue.
The Partnership’s assessment of each of the revenue recognition criteria as they relate to itsrevenue producing activities is as follows:
Persuasive evidence of an arrangement exists. The Partnership’s customary practice is to enter intoa written contract, executed by both the customer and the Partnership.
Delivery. Delivery is deemed to have occurred at the time the product is delivered and title istransferred or, in the case of fee-based arrangements, when the services are rendered.
The fee is fixed or determinable. The Partnership negotiates the fee for its services at the outset ofits fee-based arrangements. In these arrangements, the fees are nonrefundable. For other arrangements,
105

MARKWEST ENERGY PARTNERS, L.P.
NOTES TO CONSOLIDATED FINANCIAL STATEMENTS (Continued)
2. Summary of Significant Accounting Policies (Continued)
the amount of revenue is determinable when the sale of the applicable product has been completedupon delivery and transfer of title.
Collectability is reasonably assured. Collectability is evaluated on a customer-by-customer basis.New and existing customers are subject to a credit review process, which evaluates a customer’sfinancial position (e.g. cash position and credit rating) and its ability to pay. If collectability is notconsidered reasonably assured at the outset of an arrangement in accordance with the Partnership’scredit review process, revenue is recognized when the fee is collected.
The Partnership enters into revenue arrangements where it sells customers’ gas and/or NGLs anddepending on the nature of the arrangement acts as the principal or agent. Revenue from such sales isrecognized gross where the Partnership acts as the principal, as the Partnership takes title to the gasand/or NGLs, has physical inventory risk and does not earn a fixed amount. Revenue is recognized netwhen the Partnership acts as an agent and earns a fixed amount and does not take ownership of thegas and/or NGLs.
Amounts billed to customers for shipping and handling, including fuel costs, are included inRevenue. Shipping and handling costs associated with product sales are included in operating expenses.Taxes collected from customers and remitted to the appropriate taxing authority are excluded fromrevenue.
Revenue and Expense Accruals
The Partnership routinely makes accruals based on estimates for both revenues and expenses dueto the timing of compiling billing information, receiving certain third party information and reconcilingthe Partnership’s records with those of third parties. The delayed information from third partiesincludes, among other things, actual volumes purchased, transported or sold, adjustments to inventoryand invoices for purchases, actual natural gas and NGL deliveries and other operating expenses. ThePartnership makes accruals to reflect estimates for these items based on its internal records andinformation from third parties. Estimated accruals are adjusted when actual information is receivedfrom third parties and the Partnership’s internal records have been reconciled.
Incentive Compensation Plans
The Partnership issues phantom units under its share-based compensation plans as describedfurther in Note 20. A phantom unit entitles the grantee to receive a common unit upon the vesting ofthe phantom unit. Phantom units are treated as equity awards and compensation expense is measuredfor these phantom unit grants based on the fair value of the units on the grant date, as defined byGAAP. The fair value of the units awarded is amortized into earnings, reduced for an estimate ofexpected forfeitures, over the period of service corresponding with the vesting period. For certain plans,the awards are accounted for as liability awards and the compensation expense is adjusted monthly forthe change in the fair value of the unvested units granted.
To satisfy common unit awards, the Partnership may issue new common units, acquire commonunits in the open market, or use common units already owned by the general partner.
106

MARKWEST ENERGY PARTNERS, L.P.
NOTES TO CONSOLIDATED FINANCIAL STATEMENTS (Continued)
2. Summary of Significant Accounting Policies (Continued)
Income Taxes
The Partnership is not a taxable entity for federal income tax purposes. As such, the Partnershipdoes not directly pay federal income tax. The Partnership’s taxable income or loss, which may varysubstantially from the net income or loss reported in the Consolidated Statements of Operations, isincludable in the federal income tax returns of each partner. The Partnership is, however, a taxableentity under certain state jurisdictions. The Corporation is a tax paying entity for both federal and statepurposes.
The Partnership and the Corporation account for income taxes under the asset and liabilitymethod. Deferred income taxes are recognized for the future tax consequences attributable todifferences between the financial statement carrying amounts of existing assets and liabilities and theirrespective tax basis, capital loss carryforwards and net operating loss and credit carryforwards. Deferredtax assets and liabilities are measured using enacted tax rates applied to taxable income in the years inwhich those temporary differences are expected to be recovered or settled. The effect of any tax ratechange on deferred taxes is recognized in the period that includes the enactment date of the tax ratechange. Realizability of deferred tax assets is assessed and, if not more likely than not, a valuationallowance is recorded to reflect the deferred tax assets at net realizable value as determined bymanagement. Deferred tax balances that are expected to be settled within twelve months are classifiedas current and all other deferred tax balances are classified as long-term in the accompanyingConsolidated Balance Sheets. All changes in the tax bases of assets and liabilities are allocated amongcontinued operations and items charged or credited directly to equity.
The Corporation recognizes a tax expense or a tax benefit on its proportionate share ofPartnership income or loss resulting from the Corporation’s ownership of Class A units of thePartnership even though for financial reporting purposes said income or loss is eliminated inconsolidation. The Class A units were issued to the Corporation as part of the Merger and representlimited partner interests with the same rights as common units except that the Class A units do nothave voting rights, except as required by law. Class A units are not treated as outstanding commonunits in the Consolidated Balance Sheet as they are eliminated in the consolidation of the Corporation.The deferred income tax component relates to the change in the temporary book to tax basis differencein the carrying amount of the investment in the Partnership which results primarily from its timingdifferences in the Corporation’s proportionate share of the book income or loss as compared with theCorporation’s proportionate share of the taxable income or loss of the Partnership.
Earnings (Loss) Per Unit
The Partnership’s outstanding phantom units are considered to be participating securities and theClass B units are considered to be a separate class of common units that do not participate in cashdistributions. Therefore, basic and diluted earnings per common unit are calculated pursuant to thetwo-class method described in the generally accepted accounting principles for earnings per share. Inaccordance with the two-class method, basic earnings per common unit is calculated by dividing netincome attributable to the Partnership, after deducting amounts that are allocable to the outstandingphantom units and Class B units, by the weighted average number of common units outstanding duringthe period. The amount allocable to the phantom units and Class B units is generally calculated as ifall of the net income attributable to the Partnership were distributed and not on the basis of actualcash distributions for the period. However, no earnings are allocable to Class B units as they do not
107
MARKWEST ENERGY PARTNERS, L.P.
NOTES TO CONSOLIDATED FINANCIAL STATEMENTS (Continued)
2. Summary of Significant Accounting Policies (Continued)
participate in cash distributions. During periods in which a net loss attributable to the Partnership isreported or periods in which the total distributions exceed the reported net income attributable to thePartnership, the amount allocable to the phantom units and Class B units is based on actualdistributions to the phantom units and Class B unitholders. Diluted earnings per unit is calculated bydividing net income attributable to the Partnership, after deducting amounts allocable to theoutstanding phantom units and Class B units, by the weighted average number of potential commonunits outstanding during the period. Potential common units are excluded from the calculation ofdiluted earnings per unit during periods in which net income attributable to the Partnership, afterdeducting amounts that are allocable to the outstanding phantom units and Class B units, is a loss asthe impact would be anti-dilutive.
Business Combinations
Transactions in which the Partnership acquires control of a business are accounted for under theacquisition method. The identifiable assets, liabilities and any non-controlling interests are recorded atthe estimated fair market values as of the acquisition date. The purchase price in excess of the fairvalue acquired is recorded as goodwill.
Accounting for Changes in Ownership Interests in Subsidiaries
The Partnership’s ownership interest in a consolidated subsidiary may change if it sells a portion ofits interest, or acquires additional interest or if the subsidiary issues or repurchases its own shares. Ifthe transaction does not result in a change in control over the subsidiary, the transaction is accountedfor as an equity transaction. If a sale results in a change in control, it would result in thedeconsolidation of a subsidiary with a gain or loss recognized in the statement of operations. If thepurchase of additional interest occurs which changes the acquirer’s ownership interest fromnon-controlling to controlling, the acquirer’s preexisting interest in the acquiree is remeasured to its fairvalue, with a resulting gain or loss recorded in earnings upon consummation of the businesscombination. Once an entity has control of a subsidiary, its acquisitions of some or all of thenoncontrolling interests in that subsidiary are accounted for as equity transactions and are notconsidered to be a business combination. See Note 4 for a description of the transactions that resultedin a change in the Partnership’s ownership interest in a subsidiary and the impact of these transactionsto the financial statements.
Recent Accounting Pronouncements
In September 2009, the FASB amended the accounting guidance for revenue recognition formultiple-deliverable arrangements. The amended guidance establishes a hierarchy for determining theselling price of each individual deliverable and eliminates the residual value method of allocating theselling price. The amended guidance is effective for the Partnership prospectively for all revenuearrangements entered into or materially modified on or after January 1, 2011. The amendment did nothave a material effect on the Partnership’s consolidated financial statements.
In May 2011, the FASB amended the accounting guidance for fair value measurement and disclosure.The amended guidance was intended to converge the fair value measurement and disclosure requirementsunder GAAP and IFRS. The amendment primarily clarifies the application of the existing guidance andprovides for increased disclosures, particularly related to Level 3 fair value measurements. The amended
108

MARKWEST ENERGY PARTNERS, L.P.
NOTES TO CONSOLIDATED FINANCIAL STATEMENTS (Continued)
2. Summary of Significant Accounting Policies (Continued)
guidance is effective for the Partnership prospectively as of January 1, 2012. Except for the additionaldisclosures, the adoption of the amended guidance is not expected to have a material effect on thePartnership’s consolidated financial statements.
In September 2011, the FASB amended the accounting guidance for goodwill impairment testing.The amended guidance provides an entity with an option to first assess qualitative factors to evaluatewhether it is more likely than not that the fair value of a reporting unit is less than its carrying amountas the basis for determining whether it is necessary to perform the two-step goodwill impairment test.The Partnership elected early adoption for the period ended December 31, 2011 and the adoption didnot have a material effect on the Partnership’s consolidated financial statements.
In December 2011, the FASB amended the accounting guidance for balance sheet offsetting forfinancial assets and financial liabilities. The amended guidance was intended to help investors andother financial statement users to better assess the effect or potential effect of offsetting arrangementson a company’s financial position and provides for increased disclosures. The amended guidance iseffective for the Partnership prospectively as of January 1, 2013. Except for the additional disclosures,the adoption of the amended guidance is not expected to have a material effect on the Partnership’sconsolidated financial statements.
3. Business Combination
On February 1, 2011, the Partnership acquired natural gas processing and NGL pipeline assetsfrom EQT for a cash purchase price of approximately $230.7 million. The assets acquired includenatural gas processing facilities located near Langley, Kentucky, consisting of a cryogenic natural gasprocessing plant with a capacity of approximately 100 MMcf/d and a refrigeration natural gasprocessing plant with a capacity of approximately 75 MMcf/d, the partially constructed Ranger pipelinethat extends through parts of Kentucky and West Virginia, and certain other related assets. Theacquired assets do not include certain residue gas compression and transportation facilities at the samelocation as the Langley Processing Facilities. This acquisition is referred to as the Langley Acquisition.In connection with the Langley Acquisition, the Partnership completed the construction of the RangerPipeline to connect the Langley Processing Facilities to the Partnership’s existing pipeline thattransports NGLs to its Siloam fractionation facility in South Shore, Kentucky.
Concurrently with the closing of the Langley Acquisition, the Partnership entered into a long-termagreement to process certain natural gas owned or controlled by EQT at the Langley ProcessingFacilities. The processing agreement requires the Partnership to install an additional cryogenic naturalgas processing plant with a capacity of at least 60 MMcf/d in 2012. The Partnership exchanges theNGLs produced at the Langley Processing Facilities for fractionated products from its Siloam facilityand markets the fractionated products on behalf of EQT in accordance with a long-term NGLexchange and marketing agreement. As a result of the acquisition, the Partnership has significantlyexpanded its midstream operations in the liquids-rich gas areas of the Appalachian Basin.
The Langley Acquisition is accounted for as a business combination. The total purchase price isallocated to the identifiable assets acquired and liabilities assumed based on the estimated fair values atthe acquisition date. The remaining purchase price in excess of the fair value of the identifiable assetsand liabilities is recorded as goodwill. The acquired assets and the related results of operations areincluded in the Partnership’s Northeast segment.
109

MARKWEST ENERGY PARTNERS, L.P.
NOTES TO CONSOLIDATED FINANCIAL STATEMENTS (Continued)
3. Business Combination (Continued)
The following table summarizes the purchase price allocation for the Langley Acquisition (inthousands):
Property, plant and equipment . . . . . . . . . . . . . . . . . . . . . . . . . . . . . . . . $136,525Goodwill . . . . . . . . . . . . . . . . . . . . . . . . . . . . . . . . . . . . . . . . . . . . . . . . 58,497Intangible asset . . . . . . . . . . . . . . . . . . . . . . . . . . . . . . . . . . . . . . . . . . . 33,900Inventory . . . . . . . . . . . . . . . . . . . . . . . . . . . . . . . . . . . . . . . . . . . . . . . 1,806
Total . . . . . . . . . . . . . . . . . . . . . . . . . . . . . . . . . . . . . . . . . . . . . . . . . $230,728
The goodwill recognized from the Langley Acquisition results primarily from the Partnership’sability to continue to grow its business in the liquids-rich gas areas of the Appalachian Basin and accessadditional markets in a competitive environment as a result of securing the processing rights for a largearea of dedicated acreage and acquiring expanded midstream infrastructure in the acquisition. All ofthe goodwill is deductible for tax purposes.
The intangible asset consists of an identifiable customer contract. The acquired intangible will beamortized on a straight-line basis over the estimated remaining customer contract useful life ofapproximately twelve years.
The results of operations from the Langley Acquisition are included in the consolidated financialstatements from the acquisition date. Revenue and income before provision for income tax related tothe Langley Acquisition were approximately $21.8 million and $6.8 million, respectively, for the yearended December 31, 2011.
Pro forma financial results that give effect to the Langley Acquisition are not presented as it isimpracticable to obtain the necessary information. EQT did not operate the acquired assets as a stand-alone business and, therefore, historical financial information that is consistent with the operationsunder the current agreements is not available.
4. Variable Interest Entities
MarkWest Liberty Midstream
On February 27, 2009, the Partnership entered into a joint venture with M&R, an affiliate of TheEnergy & Minerals Group and its affiliated funds, which is a private equity firm focused on investmentsin selected areas of the energy infrastructure and natural resources sectors. The joint venture entity,MarkWest Liberty Midstream, operates in the natural gas midstream business in and around theMarcellus Shale in western Pennsylvania and northern West Virginia. Under the original joint ventureagreement, MarkWest Liberty Midstream was owned 60% by the Partnership and 40% by M&R. Uponclosing, the Partnership contributed its existing Marcellus Shale natural gas gathering and processingassets with an agreed to value of $107.5 million and M&R contributed cash of $50.0 million toMarkWest Liberty Midstream. M&R also committed to fund the next $150 million of MarkWestLiberty Midstream’s capital requirements after which time the Partnership agreed to fund the futurecapital requirements until each member’s contributed capital was proportionate to its ownershipinterest (‘‘Equalization’’). Effective November 1, 2009, the Partnership and M&R executed the SecondAmended and Restated Limited Liability Company Agreement of MarkWest Liberty Midstream &Resources L.L.C. pursuant to which M&R increased its participation in MarkWest Liberty Midstream.
110

MARKWEST ENERGY PARTNERS, L.P.
NOTES TO CONSOLIDATED FINANCIAL STATEMENTS (Continued)
4. Variable Interest Entities (Continued)
The Partnership and M&R agreed to maintain a 60%/40% respective ownership interest in MarkWestLiberty Midstream until January 1, 2011, at which time M&R’s ownership interest increased from 40%to 49%. In addition to its initial contribution of assets at closing, the Partnership contributed anadditional $252.4 million, $171.1 million, and $8.0 million during 2011, 2010, and 2009 respectively. Inaddition to its $50 million contribution at closing, M&R contributed $126.4 million, $158.3 million, and$150.0 million during 2011, 2010 and 2009, respectively.
The cumulative capital contributed by M&R exceeded its ownership interest until the third quarterof 2011. Under the terms of the joint venture agreement, M&R received a special $1.3 million,$11.4 million, and $3.4 million allocation of net income from MarkWest Liberty Midstream during theyears ended December 31, 2011, 2010 and 2009, respectively, due to its excess contributions. Theallocation is recorded in Net income attributable to non-controlling interest in the ConsolidatedStatements of Operations.
The Partnership determined that MarkWest Liberty Midstream was a VIE until December 31,2011, primarily due to the Partnership’s disproportionate economic interests as compared to its votinginterests in the entity. Additionally, MarkWest Liberty Midstream had insufficient equity at risk, asevidenced by the additional capital funding requirements discussed above. Although voting interestswere shared equally between the respective members of MarkWest Liberty Midstream untilDecember 31, 2011, the Partnership had concluded that it was the primary beneficiary based on itsaffiliate’s role as the operator. The Partnership believes that its role as the operator along with itsequity interests gave it the power to direct the activities that most significantly affected the economicperformance of MarkWest Liberty Midstream. As the primary beneficiary of a VIE, the Partnershipconsolidated MarkWest Liberty Midstream for all periods presented in the accompanying financialstatements.
Effective December 31, 2011, the Partnership acquired M&R’s 49% non-controlling interest ofMarkWest Liberty Midstream for total consideration of approximately $1,746.5 million, which includescash of $994.0 million and approximately 19,954,000 Class B units valued at approximately$752.5 million (see Note 17 for discussion of Class B units). The Partnership paid transaction fees ofapproximately $3.6 million related to this transaction. As a result of the transaction, MarkWest LibertyMidstream is a wholly-owned subsidiary of the Partnership and is no longer a VIE. However, thePartnership continues to consolidate MarkWest Liberty Midstream.
In accordance with GAAP, a change in the Partnership’s ownership interest in a subsidiary while itretains a controlling interest is recorded as an equity transaction. As such, the fair value of theconsideration paid in excess of the $500.3 million carrying amount of the non-controlling interestacquired and the related transaction costs of approximately $3.6 million are recognized as a reductionof equity attributable to the Partnership’s common units. See table below in this Note 4 for a summaryof the impact on equity attributable to the Partnership’s common units as of December 31, 2011.
As the accompanying Consolidated Statements of Operations include the historical results ofMarkWest Liberty Midstream, pro forma results of operations are not presented for this acquisition ofnon-controlling interest. The primary impact of the transaction on the financial statements is that noneof MarkWest Liberty Midstream’s net income will be allocable to a non-controlling interest in futureperiods as 100% of MarkWest Liberty Midstream’s net income will be attributable to the Partnership.During the years ended December 31, 2011, 2010 and 2009, the portion of MarkWest Liberty
111
MARKWEST ENERGY PARTNERS, L.P.
NOTES TO CONSOLIDATED FINANCIAL STATEMENTS (Continued)
4. Variable Interest Entities (Continued)
Midstream’s net income attributable to non-controlling interest was $44.0 million, $27.9 million and$6.3 million, respectively.
MarkWest Pioneer
MarkWest Pioneer is the owner and operator of the Arkoma Connector Pipeline, a 50-mileFERC-regulated pipeline that was placed in service in mid-July 2009. The Arkoma Connector Pipelineis designed to provide approximately 638,000 Dth/d of Arkoma Basin takeaway capacity andinterconnects with the Midcontinent Express Pipeline and the Gulf Crossing Pipeline. In 2009, thePartnership sold a 50% interest in MarkWest Pioneer to ArcLight Capital Partners, LLC. Under theterms of the sale, the Partnership was required to fund all of the capital expenditures required tocomplete construction of the Arkoma Connector Pipeline in excess of $125 million, and as a result thePartnership has made capital contributions to MarkWest Pioneer in excess of its stated ownership andvoting interests. A wholly-owned subsidiary of the Partnership serves as the operator and provides fieldoperating and general and administrative services for fixed fees. The Partnership has determined thatMarkWest Pioneer is a VIE primarily due to the Partnership’s disproportionate economic interests ascompared to its voting interests. Although voting interests are shared equally between the respectivemembers of MarkWest Pioneer, the Partnership has concluded that it is the primary beneficiary basedon its role as the operator. The Partnership believes that its role as the operator along with its equityinterests give it the power to direct the activities that most significantly affect the economicperformance of MarkWest Pioneer.
Financial Statement Impact of VIEs
As of December 31, 2011, MarkWest Pioneer is the only VIE included in the Partnership’sconsolidated financial statements. The assets and liabilities attributable to MarkWest Pioneer as ofDecember 31, 2011 are disclosed parenthetically on the accompanying Consolidated Balance Sheets. Asof December 31, 2010, MarkWest Pioneer and MarkWest Liberty Midstream were both consolidated
112

MARKWEST ENERGY PARTNERS, L.P.
NOTES TO CONSOLIDATED FINANCIAL STATEMENTS (Continued)
4. Variable Interest Entities (Continued)
VIEs. The following table shows the assets and liabilities attributable to VIEs reflected in theConsolidated Balance Sheets as of December 31, 2010 (in thousands):
MarkWest LibertyMidstream MarkWest Pioneer Total
ASSETSCash and cash equivalents . . . . . . . . . . . . . . . . . . . . . . . $ — $ 2,913 $ 2,913Receivables, net . . . . . . . . . . . . . . . . . . . . . . . . . . . . . . 42,181 1,602 43,783Inventories . . . . . . . . . . . . . . . . . . . . . . . . . . . . . . . . . . 8,431 — 8,431Other current assets . . . . . . . . . . . . . . . . . . . . . . . . . . . 271 1 272Property, plant and equipment, net of accumulated
depreciation of $28,869 and $9,300, respectively . . . . . . 664,778 147,039 811,817Restricted cash . . . . . . . . . . . . . . . . . . . . . . . . . . . . . . . 28,001 — 28,001Other long-term assets . . . . . . . . . . . . . . . . . . . . . . . . . . 281 102 383
Total assets . . . . . . . . . . . . . . . . . . . . . . . . . . . . . . . . $743,943 $151,657 $895,600
LIABILITIESAccounts payable . . . . . . . . . . . . . . . . . . . . . . . . . . . . . $ 5,945 $ — $ 5,945Accrued liabilities . . . . . . . . . . . . . . . . . . . . . . . . . . . . . 63,450 1,263 64,713Other long-term liabilities . . . . . . . . . . . . . . . . . . . . . . . 86 68 154
Total liabilities . . . . . . . . . . . . . . . . . . . . . . . . . . . . . . $ 69,481 $ 1,331 $ 70,812
The assets of MarkWest Pioneer are not available to the Partnership for any other purpose,including collateral for its secured debt (see Note 16 and Note 25). MarkWest Pioneer’s asset balancescan only be used to settle it own obligations and not those of the Partnership or any other subsidiariesof the Partnership. The liabilities of MarkWest Pioneer do not represent additional claims against thePartnership’s general assets and the creditors or beneficial interest holders of MarkWest Pioneer do nothave recourse to the general credit of the Partnership. The Partnership’s maximum exposure to loss asa result of its involvement with the MarkWest Pioneer includes its equity investment and any operatingexpense incurred by the subsidiary operator in excess of its subsidiary’s compensation for theperformance of those services.
For the years ended December 31, 2011, 2010 and 2009, the results of operations and cash flowinformation of MarkWest Liberty Midstream and MarkWest Pioneer comprise substantially all of theresults of operations and cash flow information of the non-guarantor subsidiaries (see Note 25).Individually, the results of operations and cash flow of MarkWest Pioneer, the remaining VIE, are notmaterial to the Partnership. The Partnership did not provide any financial support to the MarkWestLiberty Midstream or MarkWest Pioneer that it was not contractually obligated to provide during theyears ended December 31, 2011, 2010 and 2009.
113

MARKWEST ENERGY PARTNERS, L.P.
NOTES TO CONSOLIDATED FINANCIAL STATEMENTS (Continued)
4. Variable Interest Entities (Continued)
As discussed above, the Partnership’s ownership interest in MarkWest Liberty Midstream andMarkWest Pioneer changed as a result of transactions completed in 2009 and 2011.The following tablesummarizes the effect of these changes of ownership interest on the equity attributable to thePartnership’s common units (in thousands):
Year ended December 31,
2011 2010 2009
Net income (loss) attributable to the Partnership . . . . . . . . . . . . . . . . $ 60,695 $467 $(118,668)
Transfers to the non-controlling interests:
Decrease in common unit equity for 2011 acquisition of equityinterest in MarkWest Liberty Midstream, net of $51,321 incometax benefit . . . . . . . . . . . . . . . . . . . . . . . . . . . . . . . . . . . . . . . (1,194,865) — —
Decrease in common unit equity for transaction costs related to2011 acquisition of equity interest in MarkWest LibertyMidstream . . . . . . . . . . . . . . . . . . . . . . . . . . . . . . . . . . . . . . . (3,600) — —
Decrease in common unit equity for transfer to non- controllinginterest from 2009 sale of equity interest in MarkWest Pioneer,net of $1,491 income tax benefit . . . . . . . . . . . . . . . . . . . . . . . — — (10,288)
Decrease in common unit equity for transaction costs related to2009 sales of equity interests in MarkWest Liberty Midstreamand MarkWest Pioneer . . . . . . . . . . . . . . . . . . . . . . . . . . . . . . — — (7,310)
Net (loss) income attributable to the Partnership and transfers to thenon-controlling interest . . . . . . . . . . . . . . . . . . . . . . . . . . . . . . . . . $(1,137,770) $467 $(136,266)
114

MARKWEST ENERGY PARTNERS, L.P.
NOTES TO CONSOLIDATED FINANCIAL STATEMENTS (Continued)
5. Divestitures
SMR Transaction
On September 1, 2009, the Partnership completed the sale of the steam methane reformer (‘‘SMRTransaction’’) the Partnership began constructing at its Javelina gas processing and fractionation facilityin Corpus Christi, Texas. Under the terms of the agreement, the Partnership received proceeds of$73.1 million and the purchaser completed the construction of the SMR. The Partnership and thepurchaser also executed a related product supply agreement under which the Partnership will receive allof the product produced by the SMR through 2030 in exchange for processing fees and thereimbursement of certain other expenses. The processing fee payments began when the SMRcommenced operations in March 2010. The Partnership is deemed to have continuing involvement withthe SMR as a result of certain provisions in the related agreements. Therefore, the transaction istreated as a financing arrangement under GAAP. The Partnership has continued to report an asset, andthe related depreciation, for the total capitalized costs of constructing the SMR and has recorded aliability equal to the proceeds from the transaction plus the estimated costs incurred by the buyer tocomplete construction (‘‘SMR Liability’’). The Partnership imputes interest on the SMR Liability at9.35% annually, its incremental borrowing rate at transaction consummation. The accrued interest onthe SMR Liability was capitalized until the SMR commenced operations and the Partnership beganpayment of the processing fee under the product supply agreement. Each processing fee payment hasmultiple elements: reduction of principal of the SMR Liability, interest expense associated with theSMR Liability, and facility expense related to the operation of the SMR. As of December 31, 2011 and2010, the following amounts related to the SMR are included in the accompanying ConsolidatedBalance Sheets (in thousands):
December 31, 2011 December 31, 2010
ASSETSProperty, plant and equipment, net of
accumulated depreciation of $9,658 and$4,390, respectively . . . . . . . . . . . . . . . . . . . $95,705 $100,973
LIABILITIESAccrued liabilities . . . . . . . . . . . . . . . . . . . . . . $ 2,058 $ 1,875Other long-term liabilities . . . . . . . . . . . . . . . . 91,851 93,909
Sale of Starfish
Effective December 31, 2009, the Partnership sold its 50% equity interest in Starfish PipelineCompany, LLC (‘‘Starfish’’) to Enbridge Offshore (Gas Transmission), L.L.C. for a purchase price of$25.0 million. The Partnership recorded a $6.8 million gain on the sale of its equity interest in Starfish.
6. Derivative Financial Instruments
Commodity Contracts
NGL and natural gas prices are volatile and are impacted by changes in fundamental supply anddemand, as well as market uncertainty, availability of NGL transportation and fractionation capacityand a variety of additional factors that are beyond the Partnership’s control. The Partnership’sprofitability is directly affected by prevailing commodity prices primarily as a result of processing or
115

MARKWEST ENERGY PARTNERS, L.P.
NOTES TO CONSOLIDATED FINANCIAL STATEMENTS (Continued)
6. Derivative Financial Instruments (Continued)
conditioning at its or third-party processing plants, purchasing and selling or gathering and transportingvolumes of natural gas at index-related prices and the cost of third-party transportation andfractionation services. To the extent that commodity prices influence the level of drilling activity, suchprices also affect profitability. To protect itself financially against adverse price movements and tomaintain more stable and predictable cash flows so the Partnership can meet its cash distributionobjectives, debt service requirements and fund its capital expenditures, the Partnership executes astrategy governed by the risk management policy approved by the Board. The Partnership has acommittee comprised of senior management that oversees risk management activities, continuallymonitors the risk management program and adjusts its strategy as conditions warrant. The Partnershipenters into certain derivative contracts to reduce the risks associated with unfavorable changes in theprices of natural gas, NGLs and crude oil. Derivative contracts utilized are swaps, options and fixedprice forward contracts traded on the OTC market. The risk management policy does not allow fortrading derivative contracts.
To mitigate its cash flow exposure to fluctuations in the price of NGLs, the Partnership hasentered into derivative financial instruments relating to the future price of NGLs and crude oil.Generally the Partnership manages its NGL price risk using crude oil as NGL financial markets lackadequate liquidity and historically there has been a strong relationship between changes in NGL andcrude oil prices. The pricing relationship between NGLs and crude oil may vary in certain periods dueto various market conditions. In periods where NGL prices and crude oil prices are not consistent withthe historical relationship, the Partnership incurs increased risk and additional gains or losses. ThePartnership enters into NGL derivative contracts when adequate market liquidity exists.
To mitigate its cash flow exposure to fluctuations in the price of natural gas, the Partnershipprimarily utilizes derivative financial instruments relating to the future price of natural gas and takesinto account the partial offset of its long and short gas positions resulting from normal operatingactivities.
As a result of its derivative positions outstanding on December 31, 2011, the Partnership hasmitigated a portion of its expected commodity price risk through the fourth quarter of 2014. ThePartnership would be exposed to additional commodity risk in certain situations that include, but arenot limited to, when producers under deliver or over deliver product or when processing facilities areoperated in different recovery modes. In the event the Partnership has derivative positions in excess ofthe product delivered or expected to be delivered, the excess derivative positions will be terminated.
The Partnership enters into derivative contracts primarily with financial institutions that areparticipating members of the amended and restated credit agreement as collateral is not posted by thePartnership as the participating members have a collateral position in substantially all the wholly-ownedassets of the Partnership other than MarkWest Liberty Midstream. All of the Partnership’s financialderivative positions are currently with participating bank group members. Management conducts astandard credit review on counterparties and the Partnership has agreements containing collateralrequirements. For all participating bank group members, collateral requirements do not exist when aderivative contract favors the Partnership. The Partnership uses standardized agreements that allow foroffset of positive and negative exposures (master netting arrangements).
The Partnership records derivative contracts at fair value in the Consolidated Balance Sheets andhas not elected hedge accounting or the normal purchases and normal sales designation which may
116

MARKWEST ENERGY PARTNERS, L.P.
NOTES TO CONSOLIDATED FINANCIAL STATEMENTS (Continued)
6. Derivative Financial Instruments (Continued)
cause volatility in the Statement of Operations as the Partnership recognizes in current earnings allunrealized gains and losses from the changes in the fair value of its derivatives.
Embedded Derivative in Debt Contract
On May 26, 2009, the Partnership completed the private placement of senior notes with contingentwritten put options as described in Note 16. The written put options were considered embeddedderivatives and were not considered clearly and closely related to the indenture governing the notes.When a hybrid contract contains multiple embedded derivatives requiring separate accounting, theembedded derivatives must be aggregated and accounted for as a compound embedded derivative.These senior notes were redeemed in the fourth quarter of 2010 and the put options no longer exist asof December 31, 2010.
Interest Rate Contracts
The Partnership borrows funds using a combination of fixed and variable rate debt. ThePartnership may utilize interest rate swap contracts to manage the interest rate risk associated with thefair value of its fixed rate borrowings and to effectively convert a portion of the underlying cash flowsrelated to its long-term fixed rate debt securities into variable rate cash flows in order to achieve itsdesired mix of fixed and variable rate debt. As a result, the Partnership’s future cash flows from theseagreements will vary with the market rate of interest.
During the first quarter of 2010, the Partnership terminated all of its outstanding interest rateswap contracts. The financial statement impact is disclosed in the tables below.
Financial Statement Impact of Derivative Contracts
See Note 2 for a description of how the Partnership values its derivative financial instruments andhow the instruments impact its financial statements. The impact of the Partnership’s derivative
117

MARKWEST ENERGY PARTNERS, L.P.
NOTES TO CONSOLIDATED FINANCIAL STATEMENTS (Continued)
6. Derivative Financial Instruments (Continued)
instruments on its Consolidated Balance Sheets and Statements of Operations are summarized below(in thousands):
Assets Liabilities
Fair Value at Fair Value at Fair Value at Fair Value atDerivative contracts not designated as hedging December 31, December 31, December 31, December 31,instruments and their balance sheet location 2011 2010 2011 2010
Commodity contracts(1)Fair value of derivative instruments—current . . $ 8,698 $4,345 $ (90,551) $ (65,489)Fair value of derivative instruments—long-term 16,092 417 (65,403) (66,290)
Total . . . . . . . . . . . . . . . . . . . . . . . . . . . . . $24,790 $4,762 $(155,954) $(131,779)
(1) Includes Embedded Derivatives in Commodity Contracts as discussed below.
Year ended December 31,Derivative contracts not designated as hedging instrumentsand the location of gain or (loss) recognized in income 2011 2010 2009
Revenue: Derivative lossRealized (loss) gain . . . . . . . . . . . . . . . . . . . . . . . . . . . . . . . . . . . $(48,093) $(33,560) $ 87,289Unrealized gain (loss) . . . . . . . . . . . . . . . . . . . . . . . . . . . . . . . . . 19,058 (20,372) (207,641)
Total revenue: derivative loss . . . . . . . . . . . . . . . . . . . . . . . . . . (29,035) (53,932) (120,352)
Derivative loss related to purchased product costsRealized loss . . . . . . . . . . . . . . . . . . . . . . . . . . . . . . . . . . . . . . . . (27,711) (21,909) (53,052)Unrealized loss . . . . . . . . . . . . . . . . . . . . . . . . . . . . . . . . . . . . . . (25,249) (5,804) (15,831)
Total derivative loss related to purchase product costs . . . . . . . . (52,960) (27,713) (68,883)
Derivative gain related to facility expensesUnrealized gain . . . . . . . . . . . . . . . . . . . . . . . . . . . . . . . . . . . . . . 6,480 1,295 373
Derivative gain related to interest expenseRealized gain . . . . . . . . . . . . . . . . . . . . . . . . . . . . . . . . . . . . . . . — 2,380 2,000Unrealized (loss) gain . . . . . . . . . . . . . . . . . . . . . . . . . . . . . . . . . — (509) 509
Total derivative gain related to interest expense . . . . . . . . . . . . . — 1,871 2,509
Miscellaneous income, netUnrealized gain . . . . . . . . . . . . . . . . . . . . . . . . . . . . . . . . . . . . . . — 190 336
Total loss . . . . . . . . . . . . . . . . . . . . . . . . . . . . . . . . . . . . . . . . . $(75,515) $(78,289) $(186,017)
At December 31, 2011 and 2010, the fair value of the Partnership’s commodity derivative contractsis inclusive of premium payments of zero and $4.4 million, net of amortization, respectively. For 2011,2010 and 2009, the Realized (loss) gain—revenue includes amortization of premium payments of$4.4 million, $3.3 million and $5.7 million, respectively.
During the first quarter of 2009, the Partnership settled a portion of its derivative positionscovering 2009, 2010 and 2011 for $15.2 million of net realized gains. The settlement was completedprior to the contractual settlement to improve liquidity and to mitigate credit risk with certain
118

MARKWEST ENERGY PARTNERS, L.P.
NOTES TO CONSOLIDATED FINANCIAL STATEMENTS (Continued)
6. Derivative Financial Instruments (Continued)
counterparties, and as such does not represent trading activity. The settlement was recorded as$26.5 million of realized gains in Revenue: Derivative loss and $11.3 million of loss included in Derivativeloss related to purchased product costs in the accompanying Consolidated Statements of Operations.
Volume of Derivative Activity
As of December 31, 2011, the Partnership had the following outstanding commodity contracts thatwere executed to manage the cash flow risk associated with future sales of NGLs or future purchases ofnatural gas.
Derivative contracts not designated as hedging instruments Position Notional Quantity (net)
Crude Oil (bbl) . . . . . . . . . . . . . . . . . . . . . . . . . . . . Short 8,244,902Natural Gas (MMBtu) . . . . . . . . . . . . . . . . . . . . . . . Long 16,021,887NGLs (gal) . . . . . . . . . . . . . . . . . . . . . . . . . . . . . . . . Short 86,563,841
Embedded Derivatives in Commodity Contracts
The Partnership has a commodity contract with a producer in the Appalachia region that creates afloor on the frac spread for gas purchases of 9,000 Dth/d. The commodity contract is a component of abroader regional arrangement that also includes a keep-whole processing agreement. This contract isaccounted for as an embedded derivative and is recorded at fair value. The changes in fair value of thiscommodity contract are based on the difference between the contractual and index pricing and arerecorded in earnings through Derivative loss related to purchased product costs. In February 2011, thePartnership executed agreements with the producer to extend the commodity contract and the relatedprocessing agreement from March 31, 2015 to December 31, 2022, with the producer’s option to extendthe agreement for successive five year terms through December 31, 2032. As of December 31, 2011, theestimated fair value of this contract was a liability of $114.9 million and the recorded value was aliability of $61.4 million. The recorded liability does not include the inception fair value of thecommodity contract related to the extended period from April 1, 2015 to December 31, 2022. Inaccordance with GAAP for non-option embedded derivatives, the fair value of this extended portion ofthe commodity contract at its inception of February 1, 2011 is deemed to be allocable to the hostprocessing contract and, therefore, not recorded as a derivative liability. See the following table for areconciliation of the liability recorded for the embedded derivative as of December 31, 2011 (inthousands).
Fair value of commodity contract . . . . . . . . . . . . . . . . . . . . . . . . . . . . . . $114,928Inception value for period from April 1, 2015 to December 31, 2022. . . . . (53,507)
Derivative liability as of December 31, 2011 . . . . . . . . . . . . . . . . . . . . . . $ 61,421
The Partnership has a commodity contract that gives it an option to fix a component of theutilities cost to an index price on electricity at its plant location in the Gulf Coast segment through thefourth quarter of 2014. Changes in the fair value of the derivative component of this contract arerecognized as Derivative gain related to facility expenses. As of December 31, 2011 and 2010, theestimated fair value of this contract was an asset of $7.5 million and $1.0 million, respectively.
119

MARKWEST ENERGY PARTNERS, L.P.
NOTES TO CONSOLIDATED FINANCIAL STATEMENTS (Continued)
7. Fair Value
Fair Value Measurement
Fair value measurements and disclosures relate primarily to the Partnership’s derivative positionsdiscussed in Note 6. See Note 2 for a description of the guidance and the fair value hierarchy.
The derivative contracts are measured at fair value on a recurring basis and classified withinLevel 2 and Level 3 of the valuation hierarchy. The Level 2 and Level 3 measurements are obtainedusing a market approach. LIBOR rates are an observable input for the measurement of all derivativecontracts. The measurements for all commodity contracts contain observable inputs in the form offorward prices based on WTI crude oil prices; Columbia Appalachia, Henry Hub, PEPL and HoustonShip Channel natural gas prices; Mont Belvieu and Conway NGL prices; and ERCOT electricity prices.Level 2 instruments include crude oil and natural gas swap contracts. The valuations are based on theappropriate commodity prices and contain no significant unobservable inputs. Level 3 instrumentsinclude crude oil options, all NGL transactions, embedded derivatives in commodity contracts and theembedded put options. The significant unobservable inputs for crude oil options, NGL transactions andembedded derivatives in commodity contracts include option volatilities and commodity pricesinterpolated and extrapolated due to inactive markets. The significant unobservable inputs for theembedded put options are option volatilities and management’s assumptions about the probability ofspecific events occurring in the future. The following table presents the financial instruments carried atfair value as of December 31, 2011 and 2010, and by the valuation hierarchy (in thousands):
As of December 31, 2011 Assets Liabilities
Significant other observable inputs (Level 2)Commodity contracts . . . . . . . . . . . . . . . . . . . . . . . . . . . . . $ 5,063 $ (79,358)
Significant unobservable inputs (Level 3)Commodity contracts . . . . . . . . . . . . . . . . . . . . . . . . . . . . . 12,210 (15,175)Embedded derivatives in commodity contracts . . . . . . . . . . . 7,517 (61,421)
Total carrying value in Consolidated Balance Sheet . . . . . . . . . $24,790 $(155,954)
As of December 31, 2010 Assets Liabilities
Significant other observable inputs (Level 2)Commodity contracts . . . . . . . . . . . . . . . . . . . . . . . . . . . . . . $ 52 $ (77,776)
Significant unobservable inputs (Level 3)Commodity contracts . . . . . . . . . . . . . . . . . . . . . . . . . . . . . . 3,674 (18,031)Embedded derivatives in commodity contracts . . . . . . . . . . . . 1,036 (35,972)
Total carrying value in Consolidated Balance Sheet . . . . . . . . . . $4,762 $(131,779)
120

MARKWEST ENERGY PARTNERS, L.P.
NOTES TO CONSOLIDATED FINANCIAL STATEMENTS (Continued)
7. Fair Value (Continued)
Changes in Level 3 Fair Value Measurements
The tables below include a rollforward of the balance sheet amounts for the years endedDecember 31, 2011 and 2010 (including the change in fair value) for assets and liabilities classified bythe Partnership within Level 3 of the valuation hierarchy (in thousands):
Year Ended December 31, 2011
Commodity Embedded DerivativesDerivative in Commodity
Contracts (net) Contracts (net)
Fair value at beginning of period . . . . . . . . . . . . . . . . . . . $(14,357) $(34,936)Total gain or loss (realized and unrealized) included in
earnings(1) . . . . . . . . . . . . . . . . . . . . . . . . . . . . . . . . . 3,182 (30,827)Settlements . . . . . . . . . . . . . . . . . . . . . . . . . . . . . . . . . . . 8,210 11,859
Fair value at end of period . . . . . . . . . . . . . . . . . . . . . . . . $ (2,965) $(53,904)
The amount of total gains or losses for the period includedin earnings attributable to the change in unrealized gainsor losses relating to assets still held at end of period . . . $ 6,241 $(29,556)
Year Ended December 31, 2010
EmbeddedCommodity Derivatives in EmbeddedDerivative Commodity Interest Rate Derivative in Debt
Contracts (net) Contracts (net) Contracts Contract
Fair value at beginning of period . $(11,340) $(34,199) $ 509 $(190)Total gain or loss (realized and
unrealized) included inearnings(1) . . . . . . . . . . . . . . . (11,093) (11,792) 1,871 190
Purchases, sales, issuances andsettlements (net) . . . . . . . . . . . 8,076 11,055 (2,380) —
Fair value at end of period . . . . . $(14,357) $(34,936) $ — $ —
The amount of total gains orlosses for the period includedin earnings attributable to thechange in unrealized gains orlosses relating to assets stillheld at December 31(1) . . . . . . $(13,101) $ (9,329) $ — $ —
(1) Gains and losses on Commodity Derivative Contracts classified as Level 3 are recorded inDerivative (loss) gain related to revenue. Gains and losses on Embedded Derivatives inCommodity Contracts are recorded in Purchased product costs, Derivative loss related topurchased product costs and Derivative gain related to facility expenses. Gains on EmbeddedDerivative in Debt Contract are recorded in Miscellaneous income (expense), net. Gains andlosses on Interest Rate Contracts are recorded in Derivative gain related to interest expense.
121

MARKWEST ENERGY PARTNERS, L.P.
NOTES TO CONSOLIDATED FINANCIAL STATEMENTS (Continued)
7. Fair Value (Continued)
Assets and liabilities measured at fair value on a nonrecurring basis
Certain assets and liabilities are remeasured at fair value on a nonrecurring basis; that is, theinstruments are not measured at fair value on an ongoing basis but are subject to fair valueadjustments in certain circumstances. During 2009, certain long-lived assets of Wirth Gathering, aconsolidated subsidiary, were required to be measured at fair value in conjunction with thePartnership’s impairment evaluation for long-lived assets. Property, plant and equipment and intangibleassets with a net book value of $5.2 million and $0.7 million, respectively, were written down to anestimated fair value of zero, resulting in an impairment charge of $5.9 million in 2009. The Partnershipestimated the fair value of these assets based on an income approach using significant unobservableinputs (Level 3). See Note 13 for further discussion of the 2009 impairment. During the three yearsended December 31, 2011, there were no other assets or liabilities to be measured at fair value on anonrecurring basis.
8. Significant Customers and Concentration of Credit Risk
For the years ended December 31, 2011, 2010 and 2009, revenues from a single customer totaled$297.8 million, $198.6 million and $134.8 million, representing 19.4%, 16.0% and 15.7% of Revenue,respectively. Revenues from this customer are for NGL sales made primarily in the Southwest segment.As of December 31, 2011 and 2010, the Partnership had $8.0 million and $5.1 million of accountsreceivable from this customer, respectively.
For the years ended December 31, 2011, 2010 and 2009, revenues from another customer totaled$203.3 million, $115.0 million and $81.6 million, representing 13.2%, 9.3% and 9.5% of Revenue,respectively. Revenues from this customer are for NGL sales made primarily from the Southwestsegment. As of December 31, 2011 and 2010, the Partnership had $21.9 million and $13.1 million ofaccounts receivable from this customer, respectively.
9. Receivables
Receivables consist of the following (in thousands):
December 31, 2011 December 31, 2010
Trade, net . . . . . . . . . . . . . . . . . . . . . . . . . . . . . $221,343 $174,216Other . . . . . . . . . . . . . . . . . . . . . . . . . . . . . . . . 5,218 4,993
Total receivables . . . . . . . . . . . . . . . . . . . . . . . $226,561 $179,209
10. Inventories
Inventories consist of the following (in thousands):
December 31, 2011 December 31, 2010
NGLs . . . . . . . . . . . . . . . . . . . . . . . . . . . . . . . . $32,352 $15,930Spare parts, materials and supplies . . . . . . . . . . . 8,654 7,502
Total inventories . . . . . . . . . . . . . . . . . . . . . . . $41,006 $23,432
122

MARKWEST ENERGY PARTNERS, L.P.
NOTES TO CONSOLIDATED FINANCIAL STATEMENTS (Continued)
11. Property, Plant and Equipment
Property, plant and equipment consist of the following (in thousands):
December 31, 2011 December 31, 2010
Natural gas gathering and NGL transportationpipelines and facilities . . . . . . . . . . . . . . . . . . . $2,039,524 $1,625,170
Processing plants . . . . . . . . . . . . . . . . . . . . . . . . 660,928 584,886Fractionation and storage facilities . . . . . . . . . . . 120,474 81,317Crude oil pipelines . . . . . . . . . . . . . . . . . . . . . . . 16,678 16,810Land, building, office equipment and other . . . . . 185,462 155,437Construction in progress . . . . . . . . . . . . . . . . . . . 279,303 149,407
Property, plant and equipment . . . . . . . . . . . . 3,302,369 2,613,027Less: accumulated depreciation . . . . . . . . . . . . . . (438,062) (294,003)
Total property, plant and equipment, net . . . . . $2,864,307 $2,319,024
12. Goodwill and Intangible Assets
Goodwill. The table below shows the gross amount of goodwill acquired and the cumulativeimpairment loss recognized as of December 31, 2011 (in thousands). There was no activity related togoodwill during 2009 or 2010.
Southwest Northeast Gulf Coast Total
Gross goodwill as of December 31, 2010 . $ 24,324 $ 3,948 $ 9,854 $ 38,126Acquisition(1) . . . . . . . . . . . . . . . . . . . . — 58,497 — 58,497
Gross Goodwill as of December 31, 2011 24,324 62,445 9,854 96,623Cumulative impairment(2) . . . . . . . . . . . (18,851) — (9,854) (28,705)
Balance as of December 31, 2011 . . . . . . $ 5,473 $62,445 $ — $ 67,918
(1) Represents goodwill associated with the Langley Acquisition (see Note 3).
(2) All impairments recorded in the fourth quarter of 2008.
Intangible Assets. The Partnership’s intangible assets as of December 31, 2011 and 2010 arecomprised of customer contracts and relationships, as follows (in thousands):
December 31, 2011 December 31, 2010
Accumulated AccumulatedDescription Gross Amortization Net Gross Amortization Net Useful Life
Southwest . . . . . . . $406,690 $ (92,340) $314,350 $406,801 $ (69,655) $337,146 10 - 20 yrsNortheast . . . . . . . 102,473 (29,037) 73,436 68,573 (19,590) 48,983 12 yrsGulf Coast . . . . . . 262,772 (46,791) 215,981 262,772 (35,323) 227,449 20 - 25 yrs
Total . . . . . . . . . $771,935 $(168,168) $603,767 $738,146 $(124,568) $613,578
123

MARKWEST ENERGY PARTNERS, L.P.
NOTES TO CONSOLIDATED FINANCIAL STATEMENTS (Continued)
12. Goodwill and Intangible Assets (Continued)
Estimated future amortization expense related to the intangible assets at December 31, 2011 is asfollows (in thousands):
Year ending December 31,
2012 . . . . . . . . . . . . . . . . . . . . . . . . . . . . . . . . . . . . . . . . . . . . . . . . . . . $ 43,9402013 . . . . . . . . . . . . . . . . . . . . . . . . . . . . . . . . . . . . . . . . . . . . . . . . . . . 43,9402014 . . . . . . . . . . . . . . . . . . . . . . . . . . . . . . . . . . . . . . . . . . . . . . . . . . . 43,9402015 . . . . . . . . . . . . . . . . . . . . . . . . . . . . . . . . . . . . . . . . . . . . . . . . . . . 43,9402016 . . . . . . . . . . . . . . . . . . . . . . . . . . . . . . . . . . . . . . . . . . . . . . . . . . . 43,940Thereafter . . . . . . . . . . . . . . . . . . . . . . . . . . . . . . . . . . . . . . . . . . . . . . . 384,067
$603,767
13. Impairment of Long-Lived Assets
The Partnership’s policy is to evaluate whether there has been an impairment in the value oflong-lived assets when certain events have taken place that indicate that the remaining balance may notbe recoverable. The Partnership evaluates the carrying value of its property, plant and equipment andintangibles on a segment level and at lower levels where cash flows for specific assets can be identified.
An analysis completed during 2009 indicated that the future estimated operating cash flows couldbe at or below zero for Wirth Gathering. Wirth Gathering’s expected future cash flows were adverselyimpacted by a significant reduction to the primary producer’s drilling plan disclosed in the secondquarter of 2009, as well as increased operating expenses resulting from an agreement reached in May2009 with the non-controlling partner. The Partnership used the income approach for determining theassets’ fair value and recognized an impairment of long-lived assets of approximately $5.9 million foryear ended December 31, 2009. After considering the impact of the non-controlling interest, theimpairment increased the net loss attributable to the Partnership for the year ended December 31, 2009by approximately $2.9 million, before provision for income tax expense.
14. Accrued Liabilities and Other Long-Term Liabilities
Accrued liabilities as of December 31, 2011 and 2010 consist of the following (in thousands):
December 31, 2011 December 31, 2010
Accrued property, plant and equipment . . . . . . . . $ 87,098 $ 65,908Interest . . . . . . . . . . . . . . . . . . . . . . . . . . . . . . . 27,458 26,607Product and operations . . . . . . . . . . . . . . . . . . . 22,969 31,241Employee compensation . . . . . . . . . . . . . . . . . . . 12,600 9,167Taxes (other than income tax) . . . . . . . . . . . . . . . 9,914 8,670Other . . . . . . . . . . . . . . . . . . . . . . . . . . . . . . . . 11,412 12,276
Total accrued liabilities . . . . . . . . . . . . . . . . . . $171,451 $153,869
124
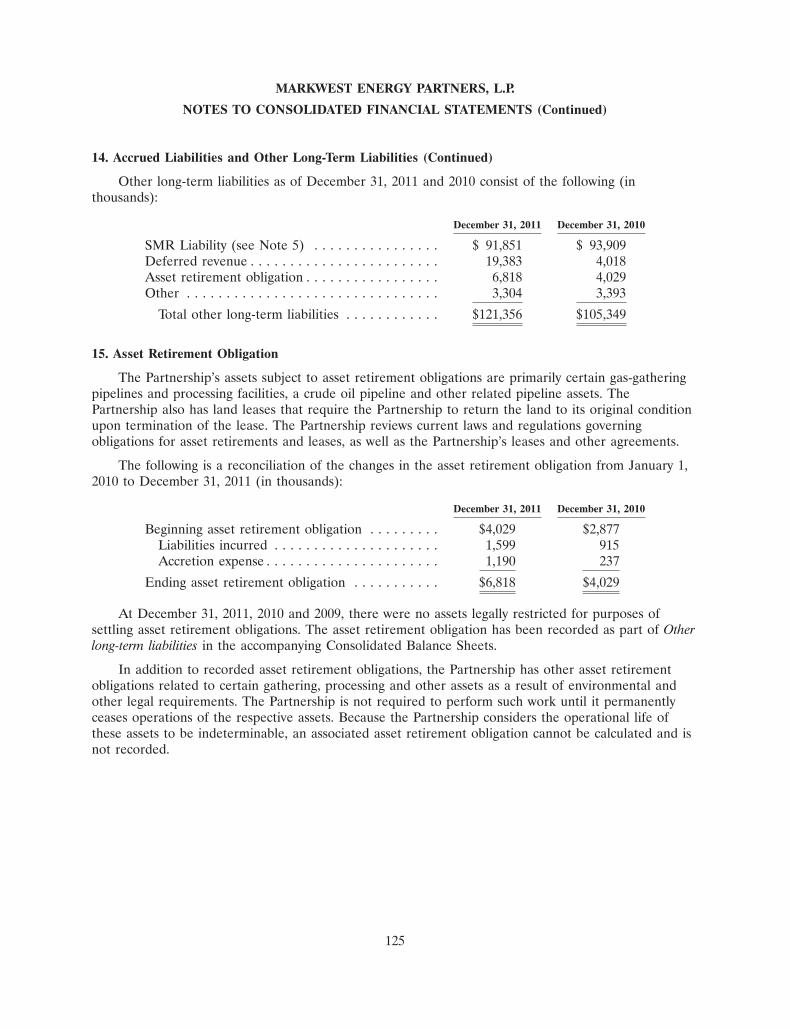
MARKWEST ENERGY PARTNERS, L.P.
NOTES TO CONSOLIDATED FINANCIAL STATEMENTS (Continued)
14. Accrued Liabilities and Other Long-Term Liabilities (Continued)
Other long-term liabilities as of December 31, 2011 and 2010 consist of the following (inthousands):
December 31, 2011 December 31, 2010
SMR Liability (see Note 5) . . . . . . . . . . . . . . . . $ 91,851 $ 93,909Deferred revenue . . . . . . . . . . . . . . . . . . . . . . . . 19,383 4,018Asset retirement obligation . . . . . . . . . . . . . . . . . 6,818 4,029Other . . . . . . . . . . . . . . . . . . . . . . . . . . . . . . . . 3,304 3,393
Total other long-term liabilities . . . . . . . . . . . . $121,356 $105,349
15. Asset Retirement Obligation
The Partnership’s assets subject to asset retirement obligations are primarily certain gas-gatheringpipelines and processing facilities, a crude oil pipeline and other related pipeline assets. ThePartnership also has land leases that require the Partnership to return the land to its original conditionupon termination of the lease. The Partnership reviews current laws and regulations governingobligations for asset retirements and leases, as well as the Partnership’s leases and other agreements.
The following is a reconciliation of the changes in the asset retirement obligation from January 1,2010 to December 31, 2011 (in thousands):
December 31, 2011 December 31, 2010
Beginning asset retirement obligation . . . . . . . . . $4,029 $2,877Liabilities incurred . . . . . . . . . . . . . . . . . . . . . 1,599 915Accretion expense . . . . . . . . . . . . . . . . . . . . . . 1,190 237
Ending asset retirement obligation . . . . . . . . . . . $6,818 $4,029
At December 31, 2011, 2010 and 2009, there were no assets legally restricted for purposes ofsettling asset retirement obligations. The asset retirement obligation has been recorded as part of Otherlong-term liabilities in the accompanying Consolidated Balance Sheets.
In addition to recorded asset retirement obligations, the Partnership has other asset retirementobligations related to certain gathering, processing and other assets as a result of environmental andother legal requirements. The Partnership is not required to perform such work until it permanentlyceases operations of the respective assets. Because the Partnership considers the operational life ofthese assets to be indeterminable, an associated asset retirement obligation cannot be calculated and isnot recorded.
125

MARKWEST ENERGY PARTNERS, L.P.
NOTES TO CONSOLIDATED FINANCIAL STATEMENTS (Continued)
16. Long-Term Debt
Debt is summarized below (in thousands):
December 31, 2011 December 31, 2010
Credit Facility
Revolving credit facility, 4.0% interest dueSeptember 2016 . . . . . . . . . . . . . . . . . . . . . . . $ 66,000 $ —
Senior Notes
2016 Senior Notes, 8.5% interest, net of discountof $0 and $642, respectively, issued July 2006and due July 2016 . . . . . . . . . . . . . . . . . . . . . . — 274,358
2018 Senior Notes, 8.75% interest, net ofdiscount of $129 and $924, respectively, issuedApril and May 2008 and due April 2018 . . . . . 80,983 499,076
2020 Senior Notes, 6.75% interest, issuedNovember 2010 and due November 2020 . . . . . 500,000 500,000
2021 Senior Notes, 6.5% interest, net of discountof $921, issued February and March 2011 anddue August 2021 . . . . . . . . . . . . . . . . . . . . . . . 499,079 —
2022 Senior Notes, 6.25% interest, issued October2011 and due June 2022 . . . . . . . . . . . . . . . . . 700,000 —
Total long-term debt . . . . . . . . . . . . . . . . . . . . $1,846,062 $1,273,434
Credit Facility
The Partnership’s Credit Facility has a current lending capacity of $900 million and provides for anuncommitted accordion feature whereby the Credit Facility may be increased from time to time by thePartnership upon the satisfaction of certain requirements by up to an aggregate of $250 million. TheCredit Facility matures on September 7, 2016. The Partnership incurred approximately $2.1 million,$11.2 million, and $4.4 million of deferred financing costs associated with modifications of the CreditFacility during the years ended December 31, 2011, 2010 and 2009, respectively.
The borrowings under the Credit Facility bear interest at a variable interest rate, plus basis points.The variable interest rate is based either on the London interbank market rate (‘‘LIBO Rate Loans’’),or the higher of (a) the prime rate set by the Facility’s administrative agent, (b) the Federal Funds Rateplus 0.50% and (c) the rate for LIBO Rate Loans for a one month interest period plus 1% (‘‘AlternateBase Rate Loans’’). The basis points correspond to the Partnership’s Total Leverage Ratio (which is theratio of the Partnership’s consolidated funded debt to the Partnership’s adjusted consolidatedEBITDA), ranging from 0.75% to 1.75% for Alternate Base Rate Loans and from 1.75% to 2.75% forLIBO Rate Loans. The Partnership may utilize up to $150 million of the Credit Facility for theissuance of letters of credit and $10 million for shorter-term swingline loans.
126

MARKWEST ENERGY PARTNERS, L.P.
NOTES TO CONSOLIDATED FINANCIAL STATEMENTS (Continued)
16. Long-Term Debt (Continued)
Under the provisions of the Credit Facility, the Partnership is subject to a number of restrictionsand covenants. Significant financial covenants under the Credit Facility include the Interest CoverageRatio (as defined in the Credit Facility), which must be greater than 2.75 to 1.0, and the Total LeverageRatio (as defined in the Credit Facility), which must be less than 5.25 to 1.0. As of December 31, 2011,the Partnership was in compliance with these covenants. These covenants are used to calculate theavailable borrowing capacity on a quarterly basis. The Credit Facility is guaranteed by the Partnership’swholly-owned subsidiaries other than MarkWest Liberty Midstream and collateralized by substantiallyall of the Partnership’s assets and those of its wholly-owned subsidiaries other than MarkWest LibertyMidstream. As of December 31, 2011, the Partnership had $66.0 million of borrowings outstanding and$19.3 million of letters of credit outstanding under the Credit Facility, leaving approximately$814.7 million available for borrowing.
Senior Notes
As of December 31, 2011, MarkWest Energy Partners, L.P. in conjunction with its wholly-ownedsubsidiary MarkWest Energy Finance Corporation (the ‘‘Issuers’’), had the following series of seniornotes outstanding: $81.1 million aggregate principal issued in April and May 2008 and due in April2018; $500.0 million aggregate principal issued in November 2010 and due in November 2020;$500.0 million aggregate principal issued in February and March 2011, due August 2021; and$700.0 million of Senior aggregate principal issued in November 2011, due June 2022.
2014 Senior Notes. In October 2004, the Issuers completed a private placement, subsequentlyregistered, of $225 million in senior notes at a fixed rate of 6.875%, payable semi-annually in arrearson May 1 and November 1, commencing May 1, 2005. In May 2009, the Issuers completed anadditional private placement, subsequently registered, of $150 million in aggregate principal amount of6.875% senior unsecured notes to qualified institutional buyers under Rule 144A under an indenturesubstantially similar to the indenture relating to the notes issued in October 2004. The 2014 SeniorNotes were redeemed in the fourth quarter of 2010.
2016 Senior Notes. In July and October 2006, the Issuers completed a private placement,subsequently registered, of $275 million in aggregate principal amount of 8.5% senior unsecured notesdue 2016 (‘‘2016 Senior Notes’’) to qualified institutional buyers. The 2016 Senior Notes wereredeemed in the first and third quarters of 2011.
2018 Senior Notes. In April 2008, the Issuers completed a private placement, subsequentlyregistered, of $400 million in aggregate principal amount of 8.75% senior unsecured notes to qualifiedinstitutional buyers under Rule 144A. The 2018 Senior Notes mature on April 15, 2018, and interest ispayable semi-annually in arrears on April 15 and October 15, commencing October 15, 2008. In May2008, the Partnership completed the placement of an additional $100 million pursuant to the indentureto the 2018 Senior Notes. The notes issued in the April 2008 and May 2008 offerings are treated asingle class of debt under this same indenture. The Partnership received combined proceeds ofapproximately $488.5 million, after including initial purchasers’ premium and deducting theunderwriting fees and the other expenses of the offering. Approximately $253.3 million and$165.6 million of the 2018 Senior Notes were redeemed in the fourth quarter and first quarter of 2011,respectfully.
127

MARKWEST ENERGY PARTNERS, L.P.
NOTES TO CONSOLIDATED FINANCIAL STATEMENTS (Continued)
16. Long-Term Debt (Continued)
2020 Senior Notes. In November 2010, the Issuers completed a public offering of $500 million inaggregate principal amount of 6.75% senior unsecured notes. The 2020 Senior Notes mature onNovember 1, 2020, and interest is payable semi-annually in arrears on May 1 and November 1,commencing May 1, 2011. The Partnership received proceeds of approximately $490.3 million afterdeducting the underwriting fees and the other third-party expenses associated with the offering.
2021 Senior Notes. On February 24, 2011, the Issuers completed a public offering of $300 millionin aggregate principal amount of 6.5% senior unsecured notes, which were issued at par. On March 10,2011, the Issuers completed a follow-on public offering of an additional $200 million in aggregateprincipal amount of 2021 Senior Notes, which were issued at 99.5% of par and are treated as a singleclass of debt securities under the same indenture as the 2021 Senior Notes issued on February 24, 2011.The 2021 Senior Notes mature on August 15, 2021, and interest is payable semi-annually in arrears onFebruary 15 and August 15, commencing August 15, 2011. The Partnership received aggregate netproceeds of approximately $492 million from the 2021 Senior Notes offerings after deducting theunderwriting fees and other third-party expenses associated with the offerings.
2022 Senior Notes. On November 3, 2011, the Issuers completed a public offering of $700 millionin aggregate principal amount of 6.25% senior unsecured notes due June 2022. Interest on the 2022Notes is payable semi-annually in arrears on June 15 and December 15, commencing June 15, 2012.The Partnership received aggregate net proceeds of approximately $688 million from the 2022 SeniorNotes offerings, after deducting the underwriting fees and other third-party expenses.
The proceeds from the issuance of the 2021 and 2022 Senior Notes were used to redeem$275 million of 2016 Senior Notes and $419 million of 2018 Senior Notes and to provide additionalworking capital for general partnership purposes. The proceeds from the issuance of the 2020 SeniorNotes were used to redeem the 2014 Senior Notes, repay the Credit Facility and to provide additionalworking capital for general partnership purposes.
The Partnership recorded a total pre-tax loss of approximately $79.0 million during 2011 related tothe redemption of the 2016 Senior Notes and 2018 Senior Notes. The pre-tax loss consisted ofapproximately $7.6 million related to the non-cash write-off of the unamortized discount and deferredfinance costs and approximately $71.4 million related to the payment of tender premiums and thirdparty expenses. The loss is recorded in Loss on redemption of debt in the accompanying ConsolidatedStatements of Operations.
The Partnership recorded a total pre-tax loss of approximately $46.3 million in the fourth quarterof 2010 related to the redemption of the senior notes issued in October 2004 and May 2009. Thepre-tax loss consisted of approximately $36.6 million related to the non-cash write-off of theunamortized discount and deferred finance costs and approximately $9.7 million related to the paymentof premiums. The loss is recorded in Loss on redemption of debt in the accompanying ConsolidatedStatements of Operations.
The Issuers have no independent operating assets or operations. All wholly-owned subsidiaries,other than MarkWest Energy Finance Corporation and MarkWest Liberty Midstream, guarantee theSenior Notes, jointly and severally and fully and unconditionally. The Partnership’s less than wholly-owned subsidiaries do not guarantee the Senior Notes (see Note 25 for required consolidating financialinformation). The notes are senior unsecured obligations equal in right of payment with all of thePartnership’s existing and future senior debt. These notes are senior in right of payment to all of the
128

MARKWEST ENERGY PARTNERS, L.P.
NOTES TO CONSOLIDATED FINANCIAL STATEMENTS (Continued)
16. Long-Term Debt (Continued)
Partnership’s future subordinated debt but effectively junior in right of payment to its secured debt tothe extent of the assets securing the debt, including the Partnership’s obligations in respect of theCredit Facility.
The indentures governing the Senior Notes limit the activity of the Partnership and the restrictedsubsidiaries identified in the indentures. Subject to compliance with certain covenants, the Partnershipmay issue additional notes from time to time under the indentures pursuant to Rule 144A andRegulation S under the Securities Act of 1933. If at any time the Senior Notes are rated investmentgrade by both Moody’s Investors Service, Inc. and Standard & Poor’s Rating Services and no default(as defined in the indentures) has occurred and is continuing, many of such covenants will terminate, inwhich case the Partnership and its subsidiaries will cease to be subject to such terminated covenants.
As of December 31, 2011, there are no minimum principal payments on Senior Notes due duringthe next five years. The full $1,781 million principal amounts for Senior Notes are due between 2018and 2022. The $66 million of borrowings outstanding under the Credit Facility as of December 31, 2011is due in 2016.
17. Equity
The Partnership Agreement stipulates the circumstances under which the Partnership is authorizedto issue new capital, maintain capital accounts and distribute cash and contains specific provisions forthe allocation of net income and losses to each of the partners for purposes of maintaining theirrespective partner capital accounts.
Distributions of Available Cash
The Partnership distributes all of its Available Cash (as defined) to unitholders of record within45 days after the end of each quarter. Available Cash is generally defined as all cash and cashequivalents of the Partnership on hand at the end of each quarter, less reserves established by thegeneral partner for future requirements, plus all cash for the quarter from working capital borrowingsmade after the end of the quarter. The general partner has the discretion to establish cash reserves thatare necessary or appropriate to (i) provide for the proper conduct of the Partnership’s business;(ii) comply with applicable law, any debt instruments or other agreements; or (iii) provide funds fordistributions to unitholders and the general partner for up to the next four quarters.
129
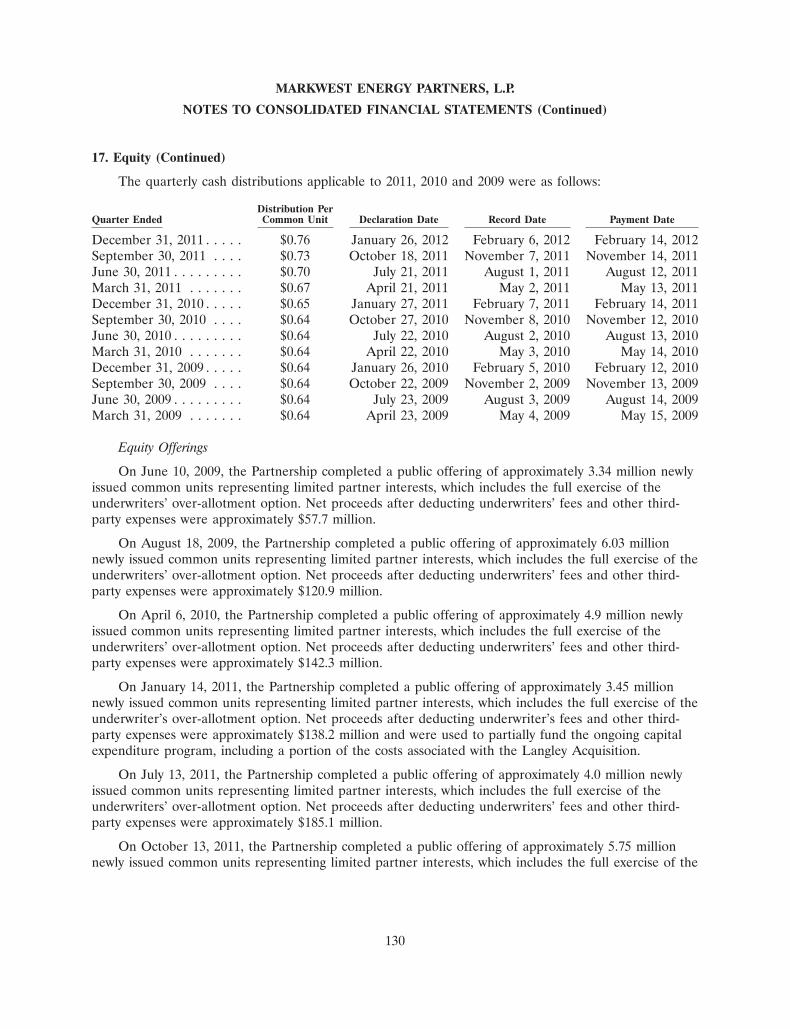
MARKWEST ENERGY PARTNERS, L.P.
NOTES TO CONSOLIDATED FINANCIAL STATEMENTS (Continued)
17. Equity (Continued)
The quarterly cash distributions applicable to 2011, 2010 and 2009 were as follows:
Distribution PerQuarter Ended Common Unit Declaration Date Record Date Payment Date
December 31, 2011 . . . . . $0.76 January 26, 2012 February 6, 2012 February 14, 2012September 30, 2011 . . . . $0.73 October 18, 2011 November 7, 2011 November 14, 2011June 30, 2011 . . . . . . . . . $0.70 July 21, 2011 August 1, 2011 August 12, 2011March 31, 2011 . . . . . . . $0.67 April 21, 2011 May 2, 2011 May 13, 2011December 31, 2010 . . . . . $0.65 January 27, 2011 February 7, 2011 February 14, 2011September 30, 2010 . . . . $0.64 October 27, 2010 November 8, 2010 November 12, 2010June 30, 2010 . . . . . . . . . $0.64 July 22, 2010 August 2, 2010 August 13, 2010March 31, 2010 . . . . . . . $0.64 April 22, 2010 May 3, 2010 May 14, 2010December 31, 2009 . . . . . $0.64 January 26, 2010 February 5, 2010 February 12, 2010September 30, 2009 . . . . $0.64 October 22, 2009 November 2, 2009 November 13, 2009June 30, 2009 . . . . . . . . . $0.64 July 23, 2009 August 3, 2009 August 14, 2009March 31, 2009 . . . . . . . $0.64 April 23, 2009 May 4, 2009 May 15, 2009
Equity Offerings
On June 10, 2009, the Partnership completed a public offering of approximately 3.34 million newlyissued common units representing limited partner interests, which includes the full exercise of theunderwriters’ over-allotment option. Net proceeds after deducting underwriters’ fees and other third-party expenses were approximately $57.7 million.
On August 18, 2009, the Partnership completed a public offering of approximately 6.03 millionnewly issued common units representing limited partner interests, which includes the full exercise of theunderwriters’ over-allotment option. Net proceeds after deducting underwriters’ fees and other third-party expenses were approximately $120.9 million.
On April 6, 2010, the Partnership completed a public offering of approximately 4.9 million newlyissued common units representing limited partner interests, which includes the full exercise of theunderwriters’ over-allotment option. Net proceeds after deducting underwriters’ fees and other third-party expenses were approximately $142.3 million.
On January 14, 2011, the Partnership completed a public offering of approximately 3.45 millionnewly issued common units representing limited partner interests, which includes the full exercise of theunderwriter’s over-allotment option. Net proceeds after deducting underwriter’s fees and other third-party expenses were approximately $138.2 million and were used to partially fund the ongoing capitalexpenditure program, including a portion of the costs associated with the Langley Acquisition.
On July 13, 2011, the Partnership completed a public offering of approximately 4.0 million newlyissued common units representing limited partner interests, which includes the full exercise of theunderwriters’ over-allotment option. Net proceeds after deducting underwriters’ fees and other third-party expenses were approximately $185.1 million.
On October 13, 2011, the Partnership completed a public offering of approximately 5.75 millionnewly issued common units representing limited partner interests, which includes the full exercise of the
130
MARKWEST ENERGY PARTNERS, L.P.
NOTES TO CONSOLIDATED FINANCIAL STATEMENTS (Continued)
17. Equity (Continued)
underwriters’ over-allotment option. Net proceeds after deducting underwriters’ fees and other third-party expenses were approximately $251 million.
On December 19, 2011, we completed a public offering of 10.0 million newly issued common unitsrepresenting limited partner interests. Total net proceeds of approximately $521 million were used topartially fund the cash consideration to acquire the remaining 49% interest in MarkWest LibertyMidstream. On January 13, 2012, we issued an additional 0.7 million units to cover the exercise of theunderwriters’ over-allotment option. Total net proceeds of approximately $38 million were used to fundour growth capital program.
Net proceeds from equity offerings, unless specifically identified otherwise, were used to repayborrowings under the Credit Facility and to provide working capital for general partnership purposes.
Class B Units Issuance
The Partnership issued approximately 19,954,000 Class B units to M&R as part of our acquisitionof the non-controlling interest in MarkWest Liberty Midstream which was effective December 31, 2011.See Note 4 for further discussion of the acquisition. The Class B units will convert to common units ona one-for-one basis in five equal installments beginning on July 1, 2013 and each of the first fouranniversaries of such date. Class B units (i) are not entitled to participate in any distributions ofavailable cash prior to their conversion and (ii) do not have the right to vote on, approve ordisapprove, or otherwise consent to or not consent to any matter (including mergers, share exchangesand similar statutory authorizations) other than those matters that disproportionately and adverselyaffect the rights and preferences of the Class B units. Upon conversion of the Class B units, M&R’sright to vote as a common unitholder of the Partnership will be limited to a maximum of 5% of thePartnership’s outstanding Common Units. Once converted, M&R has the right to participate inunderwritten offerings undertaken by the Partnership up to 20% of the total number of common unitsoffered. M&R also has limited rights to distribute an aggregate of 2,500,000 common units to itsmembers and their limited partners beginning in 2016, and EMG Liberty and certain of its affiliateswill have the right to demand that we conduct up to three underwritten offerings beginning in 2017, butrestricted to no more than one offering in any twelve-month period. Except as described above, M&Ris not permitted to transfer its Class B units or Converted Units without the prior written consent ofthe Board.
18. Commitments and Contingencies
Legal
The Partnership is subject to a variety of risks and disputes, and is a party to various legalproceedings in the normal course of its business. The Partnership maintains insurance policies inamounts and with coverage and deductibles as it believes reasonable and prudent. However, thePartnership cannot assure that the insurance companies will promptly honor their policy obligations orthat the coverage or levels of insurance will be adequate to protect the Partnership from all materialexpenses related to future claims for property loss or business interruption to the Partnership, or forthird-party claims of personal and property damage, or that the coverages or levels of insurance itcurrently has will be available in the future at economical prices. While it is not possible to predict theoutcome of the legal actions with certainty, management is of the opinion that appropriate provisionsand accruals for potential losses associated with all legal actions have been made in the consolidated
131

MARKWEST ENERGY PARTNERS, L.P.
NOTES TO CONSOLIDATED FINANCIAL STATEMENTS (Continued)
18. Commitments and Contingencies (Continued)
financial statements and that none of these actions, either individually or in the aggregate, will have amaterial adverse effect on our financial condition, liquidity or results of operation.
In June 2006, the Pipeline and Hazardous Materials Safety Administration issued a Notice ofProbable Violation and Proposed Civil Penalty (‘‘NOPV’’) (CPF No. 2-2006-5001) to both MarkWestHydrocarbon and Equitable Production Company (‘‘Equitable’’). The NOPV is associated with thepipeline leak and an ensuing explosion and fire that occurred on November 8, 2004 in Ivel, Kentuckyon an NGL pipeline owned by Equitable and leased and operated by a subsidiary of the Partnership,MarkWest Energy Appalachia, L.L.C. The NOPV sets forth six counts of violations of applicableregulations, and a proposed civil penalty in the aggregate amount of $1.1 million. In March 2011,MarkWest received an order assessing a penalty solely against Equitable for count one of the NOPV inthe amount of $0.5 million and assessing a penalty jointly and severally against MarkWest andEquitable for four of the other counts in the NOPV in the amount of $0.2 million. In March 2011, theparties filed separate petitions for reconsideration. In January 2012, the Agency issued an order thatdismissed the penalty assessed solely against Equitable but retained the $0.2 million penalty assessedjointly and severally against MarkWest and Equitable. MarkWest did not appeal the Agency’s decisionand paid the entire penalty.
Contract Contingencies
Certain natural gas processing arrangements in our Liberty and Northeast segments require thePartnership to construct new natural gas processing plants and NGL pipelines and contain certain feesand charges if specified construction milestones are not achieved for reasons other than force majeure.The Partnership has experienced a couple of months’ delays in the construction of one processingfacility in our Liberty Segment due to inabilities or delays in obtaining requisite permits, as well as dueto extreme weather events. The requisite permits have subsequently been issued and construction hasre-commenced. Delay charges could be up to $1.0 million for each month (pro-rated for partialmonths) that the Partnership does not achieve certain intermediate and final completion constructionmilestones, other than delays due to force majeure. The Partnership currently estimates theconstruction completion dates of the processing plant will occur approximately two months after themilestone dates specified in the applicable agreement, but the Partnership has made a force majeureclaim as the delays were a direct result of permit delays and weather which are force majeure eventsunder the applicable contract. The customer has reserved its rights to dispute the claim, but thePartnership’s management believes it has a convincing legal position and believes that it is unlikely thatits force majeure claim would not prevail if contested.
Lease and Other Contractual Obligations
The Partnership has various non-cancellable operating lease agreements and a long-term propanestorage agreement expiring at various times through fiscal year 2040. Annual expense under theseagreements was $15.0 million, $18.4 million and $18.6 million for the years ended December 31, 2011,
132

MARKWEST ENERGY PARTNERS, L.P.
NOTES TO CONSOLIDATED FINANCIAL STATEMENTS (Continued)
18. Commitments and Contingencies (Continued)
2010 and 2009, respectively. The minimum future payments under these agreements as ofDecember 31, 2011 are as follows (in thousands):
Year ending December 31,
2012 . . . . . . . . . . . . . . . . . . . . . . . . . . . . . . . . . . . . . . . . . . . . . . . . . . . . $10,2992013 . . . . . . . . . . . . . . . . . . . . . . . . . . . . . . . . . . . . . . . . . . . . . . . . . . . . 8,6882014 . . . . . . . . . . . . . . . . . . . . . . . . . . . . . . . . . . . . . . . . . . . . . . . . . . . . 7,7932015 . . . . . . . . . . . . . . . . . . . . . . . . . . . . . . . . . . . . . . . . . . . . . . . . . . . . 7,6062016 . . . . . . . . . . . . . . . . . . . . . . . . . . . . . . . . . . . . . . . . . . . . . . . . . . . . 7,3342017 and thereafter . . . . . . . . . . . . . . . . . . . . . . . . . . . . . . . . . . . . . . . . . 17,663
$59,383
SMR Transaction
On September 1, 2009, the Partnership entered into a product supply agreement creating along-term contractual obligation for the payment of processing fees in exchange for all of the productprocessed by the SMR (see Note 5 for further discussion of this agreement and the related SMRTransaction). The product received under this agreement is sold to a refinery customer pursuant to acorresponding long-term agreement. The minimum amounts payable annually under the product supplyagreement, excluding the potential impact of inflation adjustments per the agreement, are as follows (inthousands):
Year ending December 31,
2012 . . . . . . . . . . . . . . . . . . . . . . . . . . . . . . . . . . . . . . . . . . . . . . . . . . . $ 17,4122013 . . . . . . . . . . . . . . . . . . . . . . . . . . . . . . . . . . . . . . . . . . . . . . . . . . . 17,4122014 . . . . . . . . . . . . . . . . . . . . . . . . . . . . . . . . . . . . . . . . . . . . . . . . . . . 17,4122015 . . . . . . . . . . . . . . . . . . . . . . . . . . . . . . . . . . . . . . . . . . . . . . . . . . . 17,4122016 . . . . . . . . . . . . . . . . . . . . . . . . . . . . . . . . . . . . . . . . . . . . . . . . . . . 17,4122017 and thereafter . . . . . . . . . . . . . . . . . . . . . . . . . . . . . . . . . . . . . . . . 230,029
Total minimum payments . . . . . . . . . . . . . . . . . . . . . . . . . . . . . . . . . . . . 317,089Less: Services element . . . . . . . . . . . . . . . . . . . . . . . . . . . . . . . . . . . . . . 121,295Less: Interest . . . . . . . . . . . . . . . . . . . . . . . . . . . . . . . . . . . . . . . . . . . . 101,885
Total SMR liability . . . . . . . . . . . . . . . . . . . . . . . . . . . . . . . . . . . . . . . 93,909Less: Current portion of SMR Liability . . . . . . . . . . . . . . . . . . . . . . . . . . 2,058
Long-term portion of SMR Liability . . . . . . . . . . . . . . . . . . . . . . . . . . . . $ 91,851
19. Lease Operations
Based on the terms of certain natural gas gathering, transportation, and processing agreements, thePartnership is considered to be the lessor under several implicit operating lease arrangements inaccordance with GAAP. The Partnership’s primary implicit lease operations relate to a natural gasgathering agreement in the Liberty segment for which it earns a fixed-fee for providing gatheringservices to a single producer using a dedicated gathering system. As the gathering system is expandedthe fixed-fee charged to the producer is adjusted to include the additional gathering assets in the lease.
133

MARKWEST ENERGY PARTNERS, L.P.
NOTES TO CONSOLIDATED FINANCIAL STATEMENTS (Continued)
19. Lease Operations (Continued)
The primary term of the natural gas gathering arrangement expires in 2024 and will continue thereafteron a year to year basis until terminated by either party. Another significant implicit lease relates tonatural gas processing agreement in the Northeast segment for which the Partnership earns a minimummonthly fee for providing processing services to a single producer using a dedicated processing plant.The primary term of the natural gas processing agreement expires in 2022 and may be extended at theoption of the producer for up to two successive five year terms.
The Partnership’s revenue from its implicit lease arrangements, excluding executory costs, totaledapproximately $67.4 million, $32.2 million and $14.9 million for the years ended December 31, 2011,2010 and 2009, respectively. The Partnership’s implicit lease arrangements do not contain anysignificant contingent rental provisions. The following is a schedule of minimum future rentals on thenon-cancellable operating leases as of December 31, 2011 (in thousands):
Year ending December 31,
2012 . . . . . . . . . . . . . . . . . . . . . . . . . . . . . . . . . . . . . . . . . . . . . . . . . . . $ 61,0812013 . . . . . . . . . . . . . . . . . . . . . . . . . . . . . . . . . . . . . . . . . . . . . . . . . . . 61,0812014 . . . . . . . . . . . . . . . . . . . . . . . . . . . . . . . . . . . . . . . . . . . . . . . . . . . 61,0812015 . . . . . . . . . . . . . . . . . . . . . . . . . . . . . . . . . . . . . . . . . . . . . . . . . . . 59,7942016 . . . . . . . . . . . . . . . . . . . . . . . . . . . . . . . . . . . . . . . . . . . . . . . . . . . 59,7942017 and thereafter . . . . . . . . . . . . . . . . . . . . . . . . . . . . . . . . . . . . . . . . 352,760
Total minimum future rentals . . . . . . . . . . . . . . . . . . . . . . . . . . . . . . . $655,591
The following schedule provides an analysis of the Partnership’s investment in assets held foroperating lease by major classes as of December 31, 2011 and 2010 (in thousands):
December 31, 2011 December 31, 2010
Natural gas gathering and NGL transportationpipelines and facilities . . . . . . . . . . . . . . . . . . . $479,567 $264,669
Construction in progress . . . . . . . . . . . . . . . . . . . 38,386 60,170
Property, plant and equipment . . . . . . . . . . . . 517,953 324,839Less: accumulated depreciation . . . . . . . . . . . . . . (46,006) (21,742)
Total property, plant and equipment, net . . . . . $471,947 $303,097
134

MARKWEST ENERGY PARTNERS, L.P.
NOTES TO CONSOLIDATED FINANCIAL STATEMENTS (Continued)
20. Incentive Compensation Plans
The following table summarizes the share-based compensation plans administered by theCompensation Committee of the Board (‘‘Compensation Committee’’) that were active during theperiods presented in the accompanying Consolidated Statements of Operations:
Further awardsauthorized for Awardsissuance under outstanding
plan as of under the plan asAward December 31, of December 31, Final Year of
Share-based compensation plan Classification 2011 2011 Activity
2008 Long-Term Incentive Plan(‘‘2008 LTIP’’) . . . . . . . . . . . . . . Equity Yes Yes N/A
2006 Hydrocarbon Stock IncentivePlan (‘‘2006 Hydrocarbon Plan’’) . Equity No No 2010
Long-Term Incentive Plan (‘‘2002LTIP’’) . . . . . . . . . . . . . . . . . . . Liability No No 2011
1996 Hydrocarbon Stock IncentivePlan (‘‘1996 Hydrocarbon Plan’’) . Equity No No 2009
Compensation Expense
Total compensation expense recorded for share-based pay arrangements was as follows (inthousands):
Year ended December 31,
2011 2010 2009
Phantom units . . . . . . . . . . . . . . . . . . . . . . . . . . . . . . . $13,479 $15,319 $7,448Distribution equivalent rights(1) . . . . . . . . . . . . . . . . . . 446 1,465 1,324
Total compensation expense . . . . . . . . . . . . . . . . . . . $13,925 $16,784 $8,772
(1) A distribution equivalent right is a right, granted in tandem with a specific phantom unit,to receive an amount in cash equal to, and at the same time as, the cash distributionsmade by the Partnership with respect to a unit during the period such phantom unit isoutstanding. Payment of distribution equivalent rights associated with units that areexpected to vest are recorded as capital distributions, however, payments associated withunits that are not expected to vest are recorded as compensation expense.
Compensation expense under the share-based compensation plans has been recorded as eitherSelling, general and administrative expenses or Facility expenses in the accompanying ConsolidatedStatements of Operations.
As of December 31, 2011, total compensation expense not yet recognized related to the unvestedawards under the 2008 LTIP was approximately $12.1 million, with a weighted average remainingvesting period of approximately 0.8 years. Total compensation expense not yet recognized includesapproximately $0.2 million related to the TSR Performance Units (see discussion of TSR PerformanceUnits below).
135

MARKWEST ENERGY PARTNERS, L.P.
NOTES TO CONSOLIDATED FINANCIAL STATEMENTS (Continued)
20. Incentive Compensation Plans (Continued)
2008 LTIP
The 2008 LTIP was approved by unitholders on February 21, 2008. The 2008 LTIP provides2.5 million common units for issuance to the Corporation’s employees and affiliates as share-basedpayment awards. The 2008 LTIP was created to attract and retain highly qualified officers, directors,and other key individuals and to motivate them to serve the General Partner, the Partnership and theiraffiliates and to expend maximum effort to improve the business results and earnings of the Partnershipand its affiliates. Awards authorized under the 2008 LTIP include unrestricted units, restricted units,phantom units, distribution equivalent rights, and performance awards to be granted in anycombination.
TSR Performance Units. In April 2010, the Board granted 282,000 performance phantom units(‘‘TSR Performance Units’’) under the 2008 LTIP to senior executives and other key employees. TheTSR Performance Units are classified as equity awards and do not contain distribution equivalentrights. The TSR Performance Units were scheduled to vest in equal installments on January 31, 2011and January 31, 2012, subject to the Partnership’s relative total unitholder return (unit priceappreciation and distribution performance) over the three-year calendar period prior to the scheduledvesting date compared to the total unitholder return of a defined group of peer companies over thesame period (‘‘Market Criteria’’). Zero TSR Performance Units vest if the Partnership’s relativeranking is less than the 40th percentile; 50% of the TSR Performance Units vest if the Partnership’srelative ranking is in the 40th to 60th percentile; 75% of the TSR Performance Units vest if thePartnership’s relative ranking is in the 60th to 80th percentile; and 100% of the TSR Performance Unitsvest if the Partnership’s relative ranking is in the 80th to 100th percentile. Additionally, the Board canincrease or decrease the number of units to vest by up to 25% of the number of units that wouldotherwise vest based on the Performance Criteria. In January 2011 and 2012, 141,000 TSR performancevested based on the Market Criteria and the Board exercised its discretion to issue and immediatelyvest an additional 35,250 units.
The effect of vesting conditions is that 75% of the TSR Performance Units vested based solely onthe Partnership’s actual performance with regards to the Market Criteria. The remaining 25% of theTSR Performance Units vested based on a combination of the Market Criteria and the PerformanceCriteria. Compensation expense related to the TSR Performance Units that vested solely based on theMarket Criteria was recognized over the requisite service period based on the fair value of the units asof the grant date. However, a grant date, as defined by GAAP, was not established for the TSRPerformance Units that vest based on a combination of the Market Criteria and Performance Criteriauntil the Board exercised its discretion because the Performance Criteria prevents a mutualunderstanding of the key terms of the award. Therefore, compensation expense related to this portionof the TSR Performance Units was recognized over the requisite service period based on the fair valueof the units as of each reporting date. The requisite service period for all TSR Performance Unitsbegan in April 2010 when the Board approved the awards. TSR Compensation expense recognizedrelated to TSR Performance Units was approximately $4.8 million and $4.5 million for the years endedDecember 31, 2011 and 2010, respectively.
The fair value of the TSR Performance Units was measured at each appropriate measurement dateusing a Monte Carlo simulation model that estimated the most likely outcome based on the terms ofthe award. The key inputs in the model include the market price of the Partnership’s common units asof the valuation date, the historical volatility of the market price of the Partnership’s common units, the
136

MARKWEST ENERGY PARTNERS, L.P.
NOTES TO CONSOLIDATED FINANCIAL STATEMENTS (Continued)
20. Incentive Compensation Plans (Continued)
historical volatility of the market price of the common units or common stock of the peer companies,and the correlation between changes in the market price of the Partnership’s common units and thoseof the peer companies.
Unrestricted Units. In January 2010, the Board granted 166,000 unrestricted units to seniorexecutives and other key employees under the 2008 LTIP. The unrestricted units vested immediatelyand the Partnership recognized approximately $4.8 million of expense related to these units.
Performance Units. Phantom units containing performance vesting criteria (‘‘Performance Units’’)were granted to senior executives and other key employees under the 2008 LTIP in 2008 and 2009. ThePerformance Units vest on a performance-based schedule over a three-year period, and vesting of theseunits occurs if the Partnership achieves established financial performance goals determined by theCompensation Committee. Management conducts an analysis on an ongoing basis to assess theprobability of meeting the established performance goals and records compensation expense asrequired. As of December 31, 2011, there are 141,000 Performance Units outstanding with a grant datefair value of $1.2 million. The outstanding Performance Units did not vest. Compensation expenserecorded for the Performance Units expected to vest was zero for the years ended December 31, 2011and 2010, and approximately $0.5 million year ended December 31, 2009.
2006 Hydrocarbon Plan and 1996 Hydrocarbon Plan
On February 21, 2008, the 25,897 outstanding shares of restricted stock granted under the 2006Hydrocarbon Plan and 1996 Hydrocarbon Plan were converted to 49,354 phantom units in connectionwith the Merger. The converted phantom unit awards remained outstanding under the terms of the2006 Hydrocarbon Plan and 1996 Hydrocarbon Plan until their respective settlement dates. The lastconverted phantom units outstanding under the 2006 Hydrocarbon Plan or the 1996 Hydrocarbon Planvested on January 31, 2010 and 2009, respectively.
Summary of Equity Awards
Awards under the 2008 LTIP, and historically the 2006 Hydrocarbon Plan and the 1996Hydrocarbon Plan, qualify as equity awards. Accordingly, the fair value is measured at the grant dateusing the market price of the Partnership’s common units. A phantom unit entitles an employee toreceive a common unit upon vesting. The Partnership generally issues new common units upon vestingof phantom units. Phantom unit awards generally vest in equal tranches over a three-year period. Forservice-based awards, compensation expense related to each tranche is recognized over its requisiteservice period, reduced for an estimate of expected forfeitures. Compensation expense related toperformance-based awards is recognized when probability of vesting is established, as discussed below.As part of a net settlement option, employees may elect to surrender a certain number of phantomunits, and in exchange, the Partnership assumes the income tax withholding obligations related to thevesting. Phantom units surrendered for the payment of income tax withholdings will again becomeavailable for issuance under the plan from which the awards were initially granted, provided thatfurther awards are authorized for issuance under the plan. The Partnership was required to payapproximately $6.0 million, $3.4 million, and $1.1 million during the years ended December 31, 2011,2010 and 2009, respectively, for income tax withholdings related to the vesting of equity awards. ThePartnership received no proceeds from the issuance of phantom units, and none of the phantom unitsthat vested were redeemed by the Partnership for cash.
137
MARKWEST ENERGY PARTNERS, L.P.
NOTES TO CONSOLIDATED FINANCIAL STATEMENTS (Continued)
20. Incentive Compensation Plans (Continued)
The following is a summary of all phantom unit activity under the 2008 LTIP, 2006 HydrocarbonPlan and 1996 Hydrocarbon Plan for the years ended December 31, 2011, 2010 and 2009:
Weighted-averageNumber of Grant-date Fair
Units Value(1)
Unvested at January 1, 2009 . . . . . . . . . . . . . . . . . . . . . 909,306 $31.80Granted . . . . . . . . . . . . . . . . . . . . . . . . . . . . . . . . . . 442,035 8.64Vested . . . . . . . . . . . . . . . . . . . . . . . . . . . . . . . . . . . (309,052) 31.93Forfeited . . . . . . . . . . . . . . . . . . . . . . . . . . . . . . . . . (65,048) 20.96
Unvested at December 31, 2009 . . . . . . . . . . . . . . . . . . 977,241 22.00Granted (includes 282,000 TSR units) . . . . . . . . . . . . 736,688 30.25Vested . . . . . . . . . . . . . . . . . . . . . . . . . . . . . . . . . . . (363,502) 26.85Forfeited . . . . . . . . . . . . . . . . . . . . . . . . . . . . . . . . . (21,267) 19.28
Unvested at December 31, 2010 (includes 282,000 TSRunits) . . . . . . . . . . . . . . . . . . . . . . . . . . . . . . . . . . . . 1,329,160 25.29Granted (includes 35,250 TSR units) . . . . . . . . . . . . . 309,629 42.75Vested (includes 176,250 TSR units) . . . . . . . . . . . . . . (396,934) 27.04Forfeited . . . . . . . . . . . . . . . . . . . . . . . . . . . . . . . . . (306,346) 31.66
Unvested at December 31, 2011 (includes 141,000 TSRunits)(2) . . . . . . . . . . . . . . . . . . . . . . . . . . . . . . . . . . 935,509 28.50
(1) The calculation of the weighted average grant-date fair value for units granted during theyear ended December 31, 2010 and unvested as of December 2010 and December 2011 isrecalculated to include the fair value as of December 31, 2011 for 35,250 TSRPerformance Units. A grant date, as defined by GAAP, has not been established for theseunits.
(2) Includes 141,000 Performance Units that did not vest and were forfeited in January 2012.
The total fair value and intrinsic value of the phantom units vested under the 2008 LTIP was$10.7 million, $9.8 million, and $9.9 million during the years ended December 31, 2011, 2010, and 2009,respectively. The total fair value and intrinsic value of the TSR Performance Units vested during theyear ended December 31, 2011 was $4.9 million.
2002 LTIP
The phantom units awarded under the 2002 LTIP are classified as liability awards. Accordingly, thefair value of the outstanding awards is re-measured at the end of each reporting period using themarket price of the Partnership’s common units. The fair value of the phantom units awarded isamortized into earnings as compensation expense over the vesting period, which is generally threeyears. A phantom unit entitles an employee to receive a common unit upon vesting, or at the discretionof the Compensation Committee, the cash equivalent to the value of a common unit. The Partnershipgenerally issues new common units upon the vesting of phantom units. As part of a net settlementoption, employees may elect to surrender a certain number of phantom units, and in exchange, thePartnership assumes the income tax withholding obligations related to the vesting. The Partnership
138

MARKWEST ENERGY PARTNERS, L.P.
NOTES TO CONSOLIDATED FINANCIAL STATEMENTS (Continued)
20. Incentive Compensation Plans (Continued)
received no proceeds for issuing phantom units and none of the phantom units that vested wereredeemed by the Partnership for cash. The amounts paid by the Partnership for income taxwithholdings related to the vesting of awards under the 2002 LTIP were $0.4 million, $0.4 million and$0.2 million for the years ended December 31, 2011, 2010 and 2009, respectively.
The following is a summary of phantom unit activity under the 2002 LTIP:
Weighted-averageNumber of Grant-date Fair
Units Value
Unvested at January 1, 2009 . . . . . . . . . . . . . . . . . . . . . 145,927 $31.45Vested . . . . . . . . . . . . . . . . . . . . . . . . . . . . . . . . . . . . (69,652) 29.94Forfeited . . . . . . . . . . . . . . . . . . . . . . . . . . . . . . . . . . (6,720) 33.64
Unvested at December 31, 2009 . . . . . . . . . . . . . . . . . . . 69,555 32.75Vested . . . . . . . . . . . . . . . . . . . . . . . . . . . . . . . . . . . . (44,942) 32.15Forfeited . . . . . . . . . . . . . . . . . . . . . . . . . . . . . . . . . . (968) 34.00
Unvested at December 31, 2010 . . . . . . . . . . . . . . . . . . . 23,645 33.83Vested . . . . . . . . . . . . . . . . . . . . . . . . . . . . . . . . . . . . (23,645) 33.83
Unvested at December 31, 2011 . . . . . . . . . . . . . . . . . . . — —
The total fair value and intrinsic value of the phantom units vested under the 2002 LTIP was$1.0 million, $1.3 million, and $0.9 million during the years ended December 31, 2011, 2010, and 2009,respectively.
Tax effects of share-based compensation
The Partnership elected to adopt the simplified method to establish the beginning balance of theadditional paid-in capital pool (‘‘APIC Pool’’) related to the tax effects of employee share-basedcompensation, and to determine the subsequent impact on the APIC Pool and Consolidated Statementsof Cash Flows of the tax effects of share-based compensation awards that were outstanding uponadoption. Additional paid-in capital is reported as common units in the accompanying ConsolidatedBalance Sheets as a result of the Merger. Cash flows resulting from tax deductions in excess of thecumulative compensation cost recognized for share-based compensation awards exercised are classifiedas financing cash flows and are included as Excess tax benefits related to share-based compensation in theaccompanying Consolidated Statements of Cash Flows.
21. Employee Benefit Plan
All employees dedicated to, or otherwise principally supporting the Partnership are employees ofMarkWest Hydrocarbon, and substantially all of these employees are participants in MarkWestHydrocarbon’s defined contribution benefit plan. The employer matching contribution expense relatedto this plan was $2.7 million, $2.3 million and $1.8 million for the years ended December 31, 2011,2010 and 2009, respectively.
139
MARKWEST ENERGY PARTNERS, L.P.
NOTES TO CONSOLIDATED FINANCIAL STATEMENTS (Continued)
22. Income Tax
As discussed in Note 2, all changes in the tax bases of assets and liabilities are allocated amongcontinued operations and items charged or credited directly to equity. During the fourth quarter of2011, the Partnership determined it had understated its deferred tax liability related to its investment inconsolidated subsidiaries for timing differences created as a result of items charged or credited directlyto equity. The Partnership evaluated the materiality of the error from a qualitative and quantitativeperspective and concluded that the error was not material to any prior period.
In the accompanying Consolidated Balance Sheet as of December 31, 2010, the correction of theerror discussed above results in an increase in long-term deferred tax liabilities and a correspondingdecrease in equity of $77.5 million as compared to the amounts previously reported. In theaccompanying Consolidated Statement of Changes in Equity, the correction resulted in a cumulativedecrease in the balances associated with common units and total equity of $77.5 million, $69.8 million,and $59.6 million as of December 31, 2010, 2009, and 2008, respectively. This cumulative adjustmentgives effect to the Deferred tax impact of equity transactions, which was previously not reported, of$7.6 million and $10.2 million for the years ended December 31, 2010 and 2009, respectively.
The components of the provision for income tax expense (benefit) are as follows (in thousands):
Year ended December 31,
2011 2010 2009
Current income tax expense:Federal . . . . . . . . . . . . . . . . . . . . . . . . . . . . . . . . . $15,039 $ 5,850 $ 6,525State . . . . . . . . . . . . . . . . . . . . . . . . . . . . . . . . . . 2,539 1,805 1,547
Total current . . . . . . . . . . . . . . . . . . . . . . . . . . . . . 17,578 7,655 8,072
Deferred income tax (benefit) expense:Federal . . . . . . . . . . . . . . . . . . . . . . . . . . . . . . . . . (4,732) (3,870) (43,409)State . . . . . . . . . . . . . . . . . . . . . . . . . . . . . . . . . . 803 (596) (6,679)
Total deferred . . . . . . . . . . . . . . . . . . . . . . . . . . . . (3,929) (4,466) (50,088)
Provision for income tax . . . . . . . . . . . . . . . . . . . . . . $13,649 $ 3,189 $(42,016)
140

MARKWEST ENERGY PARTNERS, L.P.
NOTES TO CONSOLIDATED FINANCIAL STATEMENTS (Continued)
22. Income Tax (Continued)
A reconciliation of the provision for income tax and the amount computed by applying the federalstatutory rate of 35% to the income before income taxes for the years ended December 31, 2011, 2010and 2009 is as follows (in thousands):
Year ended December 31, 2011:
Corporation Partnership Eliminations Consolidated
Income before provision for income tax. . . $ 3,813 $124,087 $(8,006) $119,894
Federal statutory rate . . . . . . . . . . . . . . . . 35% 0% 0%
Federal income tax at statutory rate . . . . . . 1,335 — — 1,335Permanent items . . . . . . . . . . . . . . . . . . . . 36 — — 36State income taxes net of federal benefit . . 102 2,742 — 2,844Current year change in valuation allowance . (64) — — (64)Prior period adjustments and tax rate
changes . . . . . . . . . . . . . . . . . . . . . . . . . 163 — — 163Provision on income from Class A units(1) . 9,323 — — 9,323Other . . . . . . . . . . . . . . . . . . . . . . . . . . . . 12 — — 12
Provision for income tax . . . . . . . . . . . . . $10,907 $ 2,742 $ — $ 13,649
Year ended December 31, 2010:
Corporation Partnership Eliminations Consolidated
(Loss) income before provision for incometax . . . . . . . . . . . . . . . . . . . . . . . . . . . . $(8,120) $47,761 $(5,350) $34,291
Federal statutory rate . . . . . . . . . . . . . . . . 35% 0% 0%
Federal income tax at statutory rate . . . . . . (2,842) — — (2,842)Permanent items . . . . . . . . . . . . . . . . . . . . 20 — — 20State income taxes net of federal benefit . . (272) 1,299 — 1,027Current year change in valuation allowance . (1,022) — — (1,022)Prior period adjustments and tax rate
changes . . . . . . . . . . . . . . . . . . . . . . . . . 70 — — 70Provision on income from Class A units(1) . 5,753 — — 5,753Other . . . . . . . . . . . . . . . . . . . . . . . . . . . . 183 — — 183
Provision for income tax . . . . . . . . . . . . . $ 1,890 $ 1,299 $ — $ 3,189
141

MARKWEST ENERGY PARTNERS, L.P.
NOTES TO CONSOLIDATED FINANCIAL STATEMENTS (Continued)
22. Income Tax (Continued)
Year ended December 31, 2009:
Corporation Partnership Eliminations Consolidated
Loss before provision for income tax . . . . . $(112,506) $(32,800) $(10,064) $(155,370)
Federal statutory rate . . . . . . . . . . . . . . . . 35% 0% 0%
Federal income tax at statutory rate . . . . . . (39,377) — — (39,377)Permanent items . . . . . . . . . . . . . . . . . . . . 1 — — 1State income taxes net of federal benefit . . (4,186) (1,439) — (5,625)Current year change in valuation allowance . 1,562 — — 1,562Tax rate changes . . . . . . . . . . . . . . . . . . . . 1,497 — — 1,497Provision on income from Class A units(1) . (525) — — (525)Write-off of deferred income tax assets . . . . 293 — — 293Other . . . . . . . . . . . . . . . . . . . . . . . . . . . . 158 — — 158
Provision for income tax . . . . . . . . . . . . . $ (40,577) $ (1,439) $ — $ (42,016)
(1) The Corporation pays tax on its share of the Partnership’s income or loss as a result of itsownership of Class A units as discussed in Note 2. This amount includes intra periodallocations to continued operations and excludes allocations to equity.
142

MARKWEST ENERGY PARTNERS, L.P.
NOTES TO CONSOLIDATED FINANCIAL STATEMENTS (Continued)
22. Income Tax (Continued)
The deferred tax assets and liabilities resulting from temporary book-tax differences are comprisedof the following (in thousands):
December 31,
2011 2010
Current deferred tax assets:Accruals and reserves . . . . . . . . . . . . . . . . . . . . . . . . . . . . . $ 78 $ 64Derivative instruments . . . . . . . . . . . . . . . . . . . . . . . . . . . . 14,807 16,031
Current deferred tax assets . . . . . . . . . . . . . . . . . . . . . . . . . 14,885 16,095
Current deferred tax liabilities:Derivative instruments . . . . . . . . . . . . . . . . . . . . . . . . . . . . — 16
Current deferred tax liabilities . . . . . . . . . . . . . . . . . . . . . . — 16
Current subtotal . . . . . . . . . . . . . . . . . . . . . . . . . . . . . . . . . . 14,885 16,079
Long-term deferred tax assets:Accruals and reserves . . . . . . . . . . . . . . . . . . . . . . . . . . . . . 48 34Derivative instruments . . . . . . . . . . . . . . . . . . . . . . . . . . . . 20,301 14,241Phantom unit compensation . . . . . . . . . . . . . . . . . . . . . . . . 2,103 1,684Capital loss carryforward . . . . . . . . . . . . . . . . . . . . . . . . . . 971 975State net operating loss carryforward . . . . . . . . . . . . . . . . . 101 156
Long-term deferred tax assets . . . . . . . . . . . . . . . . . . . . . . . . 23,524 17,090
Valuation allowance . . . . . . . . . . . . . . . . . . . . . . . . . . . . . . (977) (1,036)
Net long-term deferred tax assets . . . . . . . . . . . . . . . . . . . . . . 22,547 16,054
Long-term deferred tax liabilities:Property, plant and equipment and intangibles . . . . . . . . . . 2,123 3,529Phantom unit compensation . . . . . . . . . . . . . . . . . . . . . . . . — 31
Investment in affiliated groups . . . . . . . . . . . . . . . . . . . . . . 114,088 100,345Derivative instruments . . . . . . . . . . . . . . . . . . . . . . . . . . . . — 30
Long-term deferred tax liabilities . . . . . . . . . . . . . . . . . . . . . . 116,211 103,935
Long-term subtotal . . . . . . . . . . . . . . . . . . . . . . . . . . . . . . . . (93,664) (87,881)
Net deferred tax liability . . . . . . . . . . . . . . . . . . . . . . . . . . . . $ (78,779) $(71,802)
Significant judgment is required in evaluating tax positions and determining the Corporation’sprovision for income taxes. During the ordinary course of business, there may be transactions andcalculations for which the ultimate tax determination is uncertain. However, the Corporation did nothave any material uncertain tax positions for the years ended December 31, 2011, 2010 or 2009. As ofDecember 31, 2011, the Corporation had state net operating loss carryforwards of approximately$0.1 million that expire between 2024 and 2027. The Corporation expects that future taxable incomewill likely be apportioned to states other than those in which the net operating loss was generated. As aresult, the Corporation believes it is more likely than not that the state net operating losses will not berealized and has provided a 100% valuation allowance against this long-term deferred tax asset. As of
143

MARKWEST ENERGY PARTNERS, L.P.
NOTES TO CONSOLIDATED FINANCIAL STATEMENTS (Continued)
22. Income Tax (Continued)
December 31, 2011, the Corporation had a capital loss carryforward of approximately $1.0 million thatexpires in 2014. The Corporation does not anticipate utilizing this carryforward and has provided a100% valuation allowance against this long-term deferred tax asset. While the Corporation’sconsolidated federal tax return and any significant state tax returns are not currently underexamination, the tax years 2007 through 2010 remain open to examination by the major taxingjurisdictions to which the Corporation is subject.
23. Earnings (Loss) Per Common Unit
The following table shows the computation of basic and diluted net (loss) income per commonunit, for the years ended December 31, 2011, 2010 and 2009, respectively, and the weighted averageunits used to compute diluted net (loss) income per common unit (in thousands, except per unit data):
Year ended December 31,
2011(2) 2010 2009
Net income (loss) attributable to the Partnership . . . $60,695 $ 467 $(118,668)Less: Income allocable to phantom units . . . . . . . . . 1,749 1,308 1,518
Income (loss) available for common unitholders . . . . $58,946 $ (841) $(120,186)
Weighted average common units outstanding—basic . 78,466 70,128 60,957Effect of dilutive instruments(1) . . . . . . . . . . . . . . . 153 — —
Weighted average common units outstanding—diluted . . . . . . . . . . . . . . . . . . . . . . . . . . . . . . . . 78,619 70,128 60,957
Net income (loss) attributable to the Partnership’scommon unitholders per common unit:Basic . . . . . . . . . . . . . . . . . . . . . . . . . . . . . . . . . $ 0.75 $ (0.01) $ (1.97)
Diluted . . . . . . . . . . . . . . . . . . . . . . . . . . . . . . . . $ 0.75 $ (0.01) $ (1.97)
(1) For the years ended December 31, 2011 and 2010, dilutive instruments include TSRPhantom Units and are based on the number of units, if any, that would be issuable atthe end of the respective reporting period, assuming that date was the end of thecontingency period. For the year ended December 31, 2010, 195 units were excluded fromthe calculation of diluted units because the impact was anti-dilutive. See Note 20 forfurther discussion of TSR Phantom Units.
(2) The Class B units had no impact to the earnings per unit calculation as they were issuedon December 31, 2011 and as such were not outstanding for any portion of the fiscal yearand were not allocated any of the Net income (loss) attributable to the Partnership.
144
MARKWEST ENERGY PARTNERS, L.P.
NOTES TO CONSOLIDATED FINANCIAL STATEMENTS (Continued)
24. Segment Information
The Partnership’s chief operating decision maker is the chief executive officer (‘‘CEO’’). The CEOreviews the Partnership’s discrete financial information on a geographic and operational basis, as theproducts and services are closely related within each geographic region and business operation.Accordingly, the CEO makes operating decisions, assesses financial performance and allocatesresources on a geographical basis. The Partnership has the following segments: Southwest, Northeast,Liberty and Gulf Coast. The Southwest segment provides gathering, processing, transportation andstorage services. The Northeast segment provides gathering, processing, transportation, fractionationand storage services. The Liberty segment provides gathering, processing, transportation, fractionationand storage services. The Gulf Coast segment provides processing, transportation, fractionation andstorage services.
The Partnership prepares segment information in accordance with GAAP. Certain items belowIncome (loss) from operations in the accompanying Consolidated Statements of Operations, certaincompensation expense, certain other non-cash items and any gains (losses) from derivative instrumentsare not allocated to individual segments. Management does not consider these items allocable to orcontrollable by any individual segment and, therefore, excludes these items when evaluating segmentperformance. Segment results are also adjusted to exclude the portion of operating income attributableto the non-controlling interests.
The tables below present information about operating income and capital expenditures for thereported segments for the years ended December 31, 2011, 2010 and 2009 (in thousands).
Year ended December 31, 2011:
Southwest Northeast Liberty Gulf Coast Total
Segment revenue . . . . . . . . . . . . . . . . . . . . . $935,513 $268,884 $248,949 $96,473 $1,549,819Purchased product costs . . . . . . . . . . . . . . . . 506,911 91,612 83,847 — 682,370
Net operating margin . . . . . . . . . . . . . . . . 428,602 177,272 165,102 96,473 867,449Facility expenses . . . . . . . . . . . . . . . . . . . . 82,761 27,126 34,913 38,436 183,236Portion of operating income attributable to
non-controlling interests . . . . . . . . . . . . 5,431 — 63,731 — 69,162
Operating income before items notallocated to segments . . . . . . . . . . . . . . $340,410 $150,146 $ 66,458 $58,037 $ 615,051
Capital expenditures . . . . . . . . . . . . . . . . . $103,968 $ 51,280 $388,850 $ 2,093 $ 546,191Capital expenditures not allocated to
segment . . . . . . . . . . . . . . . . . . . . . . . . 5,090
Total capital expenditures . . . . . . . . . . . $ 551,281
145

MARKWEST ENERGY PARTNERS, L.P.
NOTES TO CONSOLIDATED FINANCIAL STATEMENTS (Continued)
24. Segment Information (Continued)
Year ended December 31, 2010:
Southwest Northeast Liberty Gulf Coast Total
Segment revenue . . . . . . . . . . . . . . . . . . . . . $665,768 $384,724 $105,911 $85,160 $1,241,563Purchased product costs . . . . . . . . . . . . . . . . 308,960 252,827 16,840 — 578,627
Net operating margin . . . . . . . . . . . . . . . . 356,808 131,897 89,071 85,160 662,936Facility expenses . . . . . . . . . . . . . . . . . . . . . 81,772 19,513 24,028 33,337 158,650Portion of operating income attributable to
non-controlling interests . . . . . . . . . . . . . . 6,440 — 26,126 — 32,566
Operating income before items notallocated to segments . . . . . . . . . . . . . . $268,596 $112,384 $ 38,917 $51,823 $ 471,720
Capital expenditures . . . . . . . . . . . . . . . . . $114,109 $ 2,179 $332,793 $ 3,947 $ 453,028Capital expenditures not allocated to
segments . . . . . . . . . . . . . . . . . . . . . . . 5,640
Total capital expenditures . . . . . . . . . . . $ 458,668
Year ended December 31, 2009:
Southwest Northeast Liberty Gulf Coast Total
Segment revenue . . . . . . . . . . . . . . . . . . . . . . $492,369 $260,529 $ 47,968 $57,769 $858,635Purchased product costs . . . . . . . . . . . . . . . . . 221,021 175,326 12,479 — 408,826
Net operating margin . . . . . . . . . . . . . . . . . 271,348 85,203 35,489 57,769 449,809Facility expenses . . . . . . . . . . . . . . . . . . . . . . 73,621 20,339 16,268 16,094 126,322Portion of operating income attributable to
non-controlling interests . . . . . . . . . . . . . . . 2,613 — 6,637 — 9,250
Operating income before items not allocatedto segments . . . . . . . . . . . . . . . . . . . . . . . $195,114 $ 64,864 $ 12,584 $41,675 $314,237
Capital expenditures . . . . . . . . . . . . . . . . . . $236,705 $ 21,538 $181,142 $40,606 $479,991Capital expenditures not allocated to
segments . . . . . . . . . . . . . . . . . . . . . . . . . 6,632
Total capital expenditures . . . . . . . . . . . . . $486,623
146

MARKWEST ENERGY PARTNERS, L.P.
NOTES TO CONSOLIDATED FINANCIAL STATEMENTS (Continued)
24. Segment Information (Continued)
The following is a reconciliation of segment revenue to total revenue and operating income beforeitems not allocated to segments to income before provision for income tax for the three years endedDecember 31, 2011, 2010 and 2009 (in thousands):
Year ended December 31,
2011 2010 2009
Total segment revenue . . . . . . . . . . . . . . . . . . . . . . . . . . . . . . . . $1,549,819 $1,241,563 $ 858,635Derivative loss not allocated to segments . . . . . . . . . . . . . . . . (29,035) (53,932) (120,352)Revenue deferral adjustment(1) . . . . . . . . . . . . . . . . . . . . . . . (15,385) — —
Total revenue . . . . . . . . . . . . . . . . . . . . . . . . . . . . . . . . . . . $1,505,399 $1,187,631 $ 738,283
Operating income before items not allocated to segments . . . . . . $ 615,051 $ 471,720 $ 314,237Portion of operating income attributable to non-controlling
interests . . . . . . . . . . . . . . . . . . . . . . . . . . . . . . . . . . . . . . . 69,162 32,566 9,250Derivative loss not allocated to segments . . . . . . . . . . . . . . . . (75,515) (80,350) (188,862)Revenue deferral adjustment(1) . . . . . . . . . . . . . . . . . . . . . . . (15,385) — —Compensation expense included in facility expenses not
allocated to segments . . . . . . . . . . . . . . . . . . . . . . . . . . . . . (1,781) (1,890) (1,032)Facility expenses adjustments(2) . . . . . . . . . . . . . . . . . . . . . . . 11,419 9,091 377Selling, general and administrative expenses . . . . . . . . . . . . . . (81,229) (75,258) (63,728)Depreciation . . . . . . . . . . . . . . . . . . . . . . . . . . . . . . . . . . . . . (149,954) (123,198) (95,537)Amortization of intangible assets . . . . . . . . . . . . . . . . . . . . . . (43,617) (40,833) (40,831)Loss on disposal of property, plant and equipment . . . . . . . . . (8,797) (3,149) (1,677)Accretion of asset retirement obligations . . . . . . . . . . . . . . . . . (1,190) (237) (198)Impairment of goodwill and long-lived assets . . . . . . . . . . . . . . — — (5,855)
Income (loss) from operations . . . . . . . . . . . . . . . . . . . . . . . 318,164 188,462 (73,856)(Loss) earnings from unconsolidated affiliates . . . . . . . . . . . . . (1,095) 1,562 3,505Gain on sale of unconsolidated affiliate . . . . . . . . . . . . . . . . . — — 6,801Interest income . . . . . . . . . . . . . . . . . . . . . . . . . . . . . . . . . . . 422 1,670 349Interest expense . . . . . . . . . . . . . . . . . . . . . . . . . . . . . . . . . . (113,631) (103,873) (87,419)Amortization of deferred financing costs and discount (a
component of interest expense) . . . . . . . . . . . . . . . . . . . . . . (5,114) (10,264) (9,718)Derivative gain related to interest expense . . . . . . . . . . . . . . . — 1,871 2,509Loss on redemption of debt . . . . . . . . . . . . . . . . . . . . . . . . . . (78,996) (46,326) —Miscellaneous income, net . . . . . . . . . . . . . . . . . . . . . . . . . . . 144 1,189 2,459
Income (loss) before provision for income tax . . . . . . . . . . . $ 119,894 $ 34,291 $(155,370)
(1) Amount relates to certain contracts in which the cash consideration that the Partnership receivesfor providing service is greater during the initial years of the contract compared to the later years.In accordance with GAAP, the revenue is recognized evenly over the term of the contract as thePartnership expects to perform a similar level of service for the entire term; therefore, the revenuerecognized in the current reporting period is less than the cash received. However, the chiefoperating decision maker and management evaluate the segment performance based on the cashconsideration received and, therefore, the impact of the revenue deferrals is excluded for segmentreporting purposes. For the year ended December 31, 2011, approximately $7.2 million and
147

MARKWEST ENERGY PARTNERS, L.P.
NOTES TO CONSOLIDATED FINANCIAL STATEMENTS (Continued)
24. Segment Information (Continued)
$8.2 million of the revenue deferral adjustment is attributable to the Southwest segment andNortheast segment, respectively. Beginning in 2015, the cash consideration received from thesecontracts is expected to decline and the reported segment revenue will be less than the revenuerecognized for GAAP purposes.
(2) Facility expenses adjustments consist of the reallocation of the MarkWest Pioneer field services feeand the reallocation of the interest expense related to the SMR, which is included in facilityexpenses for the purposes of evaluating the performance of the Gulf Coast segment. The increaseis due to a full year of interest expense related to the SMR in 2011 compared to approximatelynine months of SMR interest expense in 2010.
The tables below present information about segment assets as of December 31, 2011, 2010, and2009 (in thousands):
December 31, 2011 December 31, 2010 December 31, 2009
Southwest . . . . . . . . . . . . . . . . $1,701,919 $1,646,607 $1,637,749Northeast . . . . . . . . . . . . . . . . 533,591 244,219 249,804Liberty . . . . . . . . . . . . . . . . . . 1,114,654 743,943 373,127Gulf Coast . . . . . . . . . . . . . . . 553,043 573,456 587,830
Total segment assets . . . . . . . . . 3,903,207 3,208,225 2,848,510Assets not allocated to
segments:Certain cash and cash
equivalents . . . . . . . . . . . . 66,212 49,776 73,184Fair value of derivatives . . . . 24,790 4,762 24,631Investment in unconsolidated
affiliate . . . . . . . . . . . . . . . 27,853 28,688 29,633Other(1) . . . . . . . . . . . . . . . 48,363 41,911 38,779
Total assets . . . . . . . . . . . . . . . $4,070,425 $3,333,362 $3,014,737
(1) As of December 31, 2011, includes corporate fixed assets, deferred financing costs,income tax receivable, deferred tax asset and other corporate assets not allocated tosegments. As of December 31, 2010 and 2009, includes corporate fixed assets, deferredfinancing costs, income tax receivable, receivables and other corporate assets not allocatedto segments.
25. Supplemental Condensed Consolidating Financial Information
MarkWest Energy Partners has no significant operations independent of its subsidiaries. As ofDecember 31, 2011, the Partnership’s obligations under the outstanding Senior Notes (see Note 16)were fully, jointly and severally guaranteed, by all of its wholly-owned subsidiaries other than MarkWestLiberty Midstream. The guarantees are unconditional except for certain customary circumstances inwhich a subsidiary would be released from the guarantee under the indentures. Separate financialstatements for each of the Partnership’s guarantor subsidiaries are not provided because suchinformation would not be material to its investors or lenders. As of February 2009, following the
148

MARKWEST ENERGY PARTNERS, L.P.
NOTES TO CONSOLIDATED FINANCIAL STATEMENTS (Continued)
25. Supplemental Condensed Consolidating Financial Information (Continued)
closing of the joint venture with M&R, and May 2009, following the closing of the joint venture withArcLight (see Note 4), MarkWest Liberty Midstream and MarkWest Pioneer, together with certain ofthe Partnership’s other subsidiaries that do not guarantee the outstanding Senior Notes, have significantassets and operations in aggregate. For the purpose of the following financial information, thePartnership’s investments in its subsidiaries and the guarantor subsidiaries’ investments in theirsubsidiaries are presented in accordance with the equity method of accounting. The financialinformation may not necessarily be indicative of results of operations, cash flows, or financial positionhad the subsidiaries operated as independent entities. The operations, cash flows and financial positionof the co-issuer, MarkWest Energy Finance Corporation, are not material and, therefore, have beenincluded with the Parent’s financial information. Condensed consolidating financial information forMarkWest Energy Partners and its combined guarantor and combined non-guarantor subsidiaries as of
149
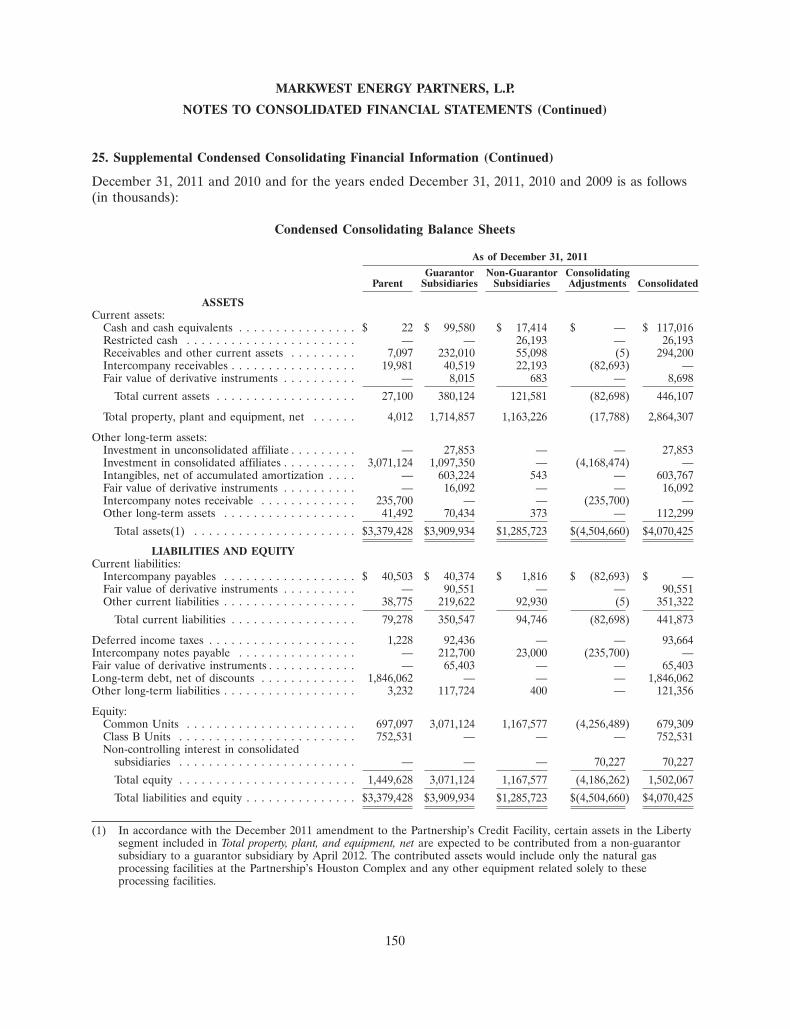
MARKWEST ENERGY PARTNERS, L.P.
NOTES TO CONSOLIDATED FINANCIAL STATEMENTS (Continued)
25. Supplemental Condensed Consolidating Financial Information (Continued)
December 31, 2011 and 2010 and for the years ended December 31, 2011, 2010 and 2009 is as follows(in thousands):
Condensed Consolidating Balance Sheets
As of December 31, 2011
Guarantor Non-Guarantor ConsolidatingParent Subsidiaries Subsidiaries Adjustments Consolidated
ASSETSCurrent assets:
Cash and cash equivalents . . . . . . . . . . . . . . . . $ 22 $ 99,580 $ 17,414 $ — $ 117,016Restricted cash . . . . . . . . . . . . . . . . . . . . . . . — — 26,193 — 26,193Receivables and other current assets . . . . . . . . . 7,097 232,010 55,098 (5) 294,200Intercompany receivables . . . . . . . . . . . . . . . . . 19,981 40,519 22,193 (82,693) —Fair value of derivative instruments . . . . . . . . . . — 8,015 683 — 8,698
Total current assets . . . . . . . . . . . . . . . . . . . 27,100 380,124 121,581 (82,698) 446,107
Total property, plant and equipment, net . . . . . . 4,012 1,714,857 1,163,226 (17,788) 2,864,307
Other long-term assets:Investment in unconsolidated affiliate . . . . . . . . . — 27,853 — — 27,853Investment in consolidated affiliates . . . . . . . . . . 3,071,124 1,097,350 — (4,168,474) —Intangibles, net of accumulated amortization . . . . — 603,224 543 — 603,767Fair value of derivative instruments . . . . . . . . . . — 16,092 — — 16,092Intercompany notes receivable . . . . . . . . . . . . . 235,700 — — (235,700) —Other long-term assets . . . . . . . . . . . . . . . . . . 41,492 70,434 373 — 112,299
Total assets(1) . . . . . . . . . . . . . . . . . . . . . . $3,379,428 $3,909,934 $1,285,723 $(4,504,660) $4,070,425
LIABILITIES AND EQUITYCurrent liabilities:
Intercompany payables . . . . . . . . . . . . . . . . . . $ 40,503 $ 40,374 $ 1,816 $ (82,693) $ —Fair value of derivative instruments . . . . . . . . . . — 90,551 — — 90,551Other current liabilities . . . . . . . . . . . . . . . . . . 38,775 219,622 92,930 (5) 351,322
Total current liabilities . . . . . . . . . . . . . . . . . 79,278 350,547 94,746 (82,698) 441,873
Deferred income taxes . . . . . . . . . . . . . . . . . . . . 1,228 92,436 — — 93,664Intercompany notes payable . . . . . . . . . . . . . . . . — 212,700 23,000 (235,700) —Fair value of derivative instruments . . . . . . . . . . . . — 65,403 — — 65,403Long-term debt, net of discounts . . . . . . . . . . . . . 1,846,062 — — — 1,846,062Other long-term liabilities . . . . . . . . . . . . . . . . . . 3,232 117,724 400 — 121,356
Equity:Common Units . . . . . . . . . . . . . . . . . . . . . . . 697,097 3,071,124 1,167,577 (4,256,489) 679,309Class B Units . . . . . . . . . . . . . . . . . . . . . . . . 752,531 — — — 752,531Non-controlling interest in consolidated
subsidiaries . . . . . . . . . . . . . . . . . . . . . . . . — — — 70,227 70,227
Total equity . . . . . . . . . . . . . . . . . . . . . . . . 1,449,628 3,071,124 1,167,577 (4,186,262) 1,502,067
Total liabilities and equity . . . . . . . . . . . . . . . $3,379,428 $3,909,934 $1,285,723 $(4,504,660) $4,070,425
(1) In accordance with the December 2011 amendment to the Partnership’s Credit Facility, certain assets in the Libertysegment included in Total property, plant, and equipment, net are expected to be contributed from a non-guarantorsubsidiary to a guarantor subsidiary by April 2012. The contributed assets would include only the natural gasprocessing facilities at the Partnership’s Houston Complex and any other equipment related solely to theseprocessing facilities.
150

MARKWEST ENERGY PARTNERS, L.P.
NOTES TO CONSOLIDATED FINANCIAL STATEMENTS (Continued)
25. Supplemental Condensed Consolidating Financial Information (Continued)
As of December 31, 2010
Guarantor Non-Guarantor ConsolidatingParent Subsidiaries Subsidiaries Adjustments Consolidated
ASSETSCurrent assets:
Cash and cash equivalents . . . . . . . . . $ — $ 63,850 $ 3,600 $ — $ 67,450Receivables and other current assets . 1,708 172,209 52,834 — 226,751Intercompany receivables . . . . . . . . . 1,440,302 1,099 7,635 (1,449,036) —Fair value of derivative instruments . . — 4,345 — — 4,345
Total current assets . . . . . . . . . . . . 1,442,010 241,503 64,069 (1,449,036) 298,546
Total property, plant and equipment,net . . . . . . . . . . . . . . . . . . . . . . . . 4,623 1,512,763 812,898 (11,260) 2,319,024
Other long-term assets:Restricted cash . . . . . . . . . . . . . . . . . — — 28,001 — 28,001Investment in unconsolidated affiliate — 28,688 — — 28,688Investment in consolidated affiliates . . 639,219 368,864 — (1,008,083) —Intangibles, net of accumulated
amortization . . . . . . . . . . . . . . . . . — 613,000 578 — 613,578Fair value of derivative instruments . . — 417 — — 417Intercompany notes receivable . . . . . . 197,710 — — (197,710) —Other long-term assets . . . . . . . . . . . 32,587 12,139 382 — 45,108
Total assets . . . . . . . . . . . . . . . . . . $2,316,149 $2,777,374 $905,928 $(2,666,089) $3,333,362
LIABILITIES AND EQUITYCurrent liabilities:
Intercompany payables . . . . . . . . . . . $ 672 $1,447,799 $ 565 $(1,449,036) $ —Fair value of derivative instruments . . — 65,489 — — 65,489Other current liabilities . . . . . . . . . . . 31,882 173,667 70,804 — 276,353
Total current liabilities . . . . . . . . . . 32,554 1,686,955 71,369 (1,449,036) 341,842
Deferred income taxes . . . . . . . . . . . . . 2,533 85,348 — — 87,881Intercompany notes payable . . . . . . . . . — 197,710 — (197,710) —Fair value of derivative instruments . . . . — 66,290 — — 66,290Long-term debt, net of discounts . . . . . 1,273,434 — — — 1,273,434Other long-term liabilities . . . . . . . . . . . 3,319 101,852 178 — 105,349
Equity:Common Units . . . . . . . . . . . . . . . . . 1,004,309 639,219 834,381 (1,484,860) 993,049Non-controlling interest in
consolidated subsidiaries . . . . . . . . — — — 465,517 465,517
Total equity . . . . . . . . . . . . . . . . . . 1,004,309 639,219 834,381 (1,019,343) 1,458,566
Total liabilities and equity . . . . . . . $2,316,149 $2,777,374 $905,928 $(2,666,089) $3,333,362
151
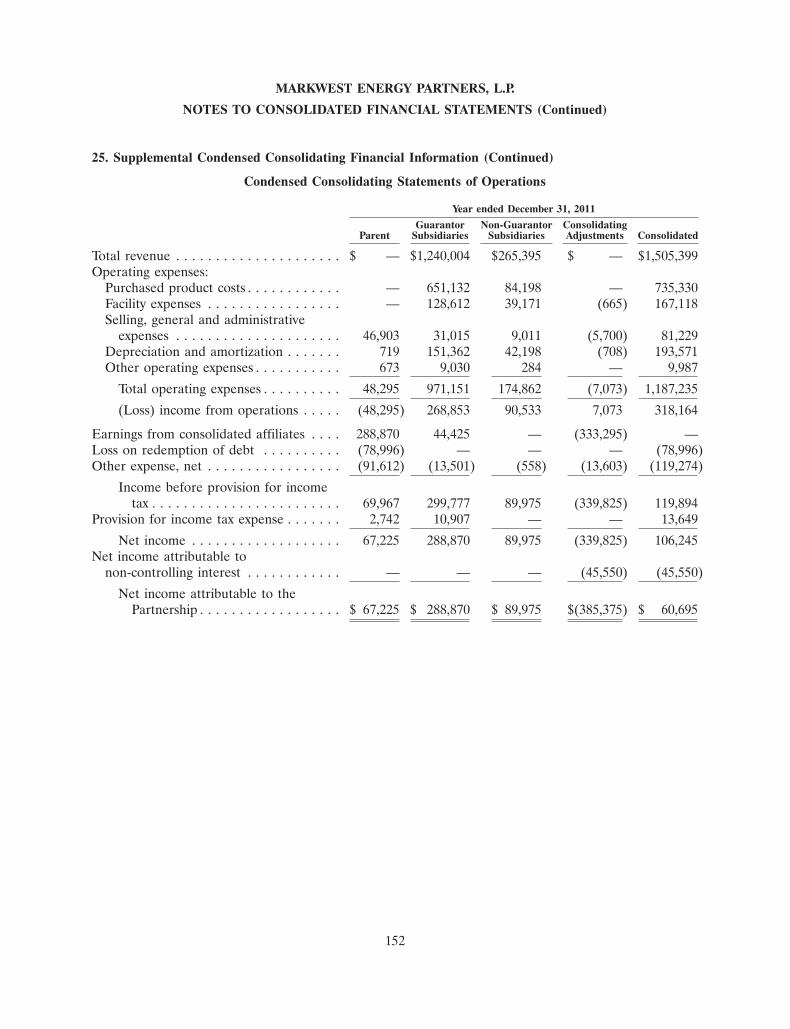
MARKWEST ENERGY PARTNERS, L.P.
NOTES TO CONSOLIDATED FINANCIAL STATEMENTS (Continued)
25. Supplemental Condensed Consolidating Financial Information (Continued)
Condensed Consolidating Statements of Operations
Year ended December 31, 2011
Guarantor Non-Guarantor ConsolidatingParent Subsidiaries Subsidiaries Adjustments Consolidated
Total revenue . . . . . . . . . . . . . . . . . . . . . $ — $1,240,004 $265,395 $ — $1,505,399Operating expenses:
Purchased product costs . . . . . . . . . . . . — 651,132 84,198 — 735,330Facility expenses . . . . . . . . . . . . . . . . . — 128,612 39,171 (665) 167,118Selling, general and administrative
expenses . . . . . . . . . . . . . . . . . . . . . 46,903 31,015 9,011 (5,700) 81,229Depreciation and amortization . . . . . . . 719 151,362 42,198 (708) 193,571Other operating expenses . . . . . . . . . . . 673 9,030 284 — 9,987
Total operating expenses . . . . . . . . . . 48,295 971,151 174,862 (7,073) 1,187,235
(Loss) income from operations . . . . . (48,295) 268,853 90,533 7,073 318,164
Earnings from consolidated affiliates . . . . 288,870 44,425 — (333,295) —Loss on redemption of debt . . . . . . . . . . (78,996) — — — (78,996)Other expense, net . . . . . . . . . . . . . . . . . (91,612) (13,501) (558) (13,603) (119,274)
Income before provision for incometax . . . . . . . . . . . . . . . . . . . . . . . . 69,967 299,777 89,975 (339,825) 119,894
Provision for income tax expense . . . . . . . 2,742 10,907 — — 13,649
Net income . . . . . . . . . . . . . . . . . . . 67,225 288,870 89,975 (339,825) 106,245Net income attributable to
non-controlling interest . . . . . . . . . . . . — — — (45,550) (45,550)
Net income attributable to thePartnership . . . . . . . . . . . . . . . . . . $ 67,225 $ 288,870 $ 89,975 $(385,375) $ 60,695
152

MARKWEST ENERGY PARTNERS, L.P.
NOTES TO CONSOLIDATED FINANCIAL STATEMENTS (Continued)
25. Supplemental Condensed Consolidating Financial Information (Continued)
Year ended December 31, 2010
Guarantor Non-Guarantor ConsolidatingParent Subsidiaries Subsidiaries Adjustments Consolidated
Total revenue . . . . . . . . . . . . . . . . . . . . . $ — $1,063,621 $124,010 $ — $1,187,631Operating expenses:
Purchased product costs . . . . . . . . . . . . — 589,403 16,937 — 606,340Facility expenses . . . . . . . . . . . . . . . . . — 122,240 28,566 (652) 150,154Selling, general and administrative
expenses . . . . . . . . . . . . . . . . . . . . . 46,549 27,339 6,317 (4,947) 75,258Depreciation and amortization . . . . . . . 594 136,781 27,054 (398) 164,031Other operating expenses . . . . . . . . . . . 753 2,342 291 — 3,386
Total operating expenses . . . . . . . . . . 47,896 878,105 79,165 (5,997) 999,169
(Loss) income from operations . . . . . (47,896) 185,516 44,845 5,997 188,462Earnings from consolidated affiliates . . . . 183,557 15,963 — (199,520) —Loss on redemption of debt . . . . . . . . . . (46,326) — — — (46,326)Other (expense) income, net . . . . . . . . . . (82,000) (16,032) 1,753 (11,566) (107,845)
Income before provision for incometax . . . . . . . . . . . . . . . . . . . . . . . . 7,335 185,447 46,598 (205,089) 34,291
Provision for income tax expense . . . . . . . 1,299 1,890 — — 3,189
Net income . . . . . . . . . . . . . . . . . . . 6,036 183,557 46,598 (205,089) 31,102Net income attributable to
non-controlling interest . . . . . . . . . . . . — — — (30,635) (30,635)
Net income attributable to thePartnership . . . . . . . . . . . . . . . . . . $ 6,036 $ 183,557 $ 46,598 $(235,724) $ 467
153

MARKWEST ENERGY PARTNERS, L.P.
NOTES TO CONSOLIDATED FINANCIAL STATEMENTS (Continued)
25. Supplemental Condensed Consolidating Financial Information (Continued)
Year ended December 31, 2009
Guarantor Non-Guarantor ConsolidatingParent Subsidiaries Subsidiaries Adjustments Consolidated
Total revenue . . . . . . . . . . . . . . . . . . . . . $ — $686,340 $51,943 $ — $ 738,283Operating expenses:
Purchased product costs . . . . . . . . . . . — 465,152 12,557 — 477,709Facility expenses . . . . . . . . . . . . . . . . . — 110,147 16,834 (377) 126,604Selling, general and administrative
expenses . . . . . . . . . . . . . . . . . . . . . 46,317 17,990 2,878 (3,457) 63,728Depreciation and amortization . . . . . . . 559 124,976 10,984 (151) 136,368Other operating expenses . . . . . . . . . . (161) 2,019 17 — 1,875Impairment of long-lived assets . . . . . . — — 5,855 — 5,855
Total operating expenses . . . . . . . . . 46,715 720,284 49,125 (3,985) 812,139
(Loss) income from operations . . . . . (46,715) (33,944) 2,818 3,985 (73,856)Earnings from consolidated affiliates . . . . 2,243 1,501 — (3,744) —Gain on sale of unconsolidated affiliate . . — 6,801 — — 6,801Other (expense) income, net . . . . . . . . . . (69,951) (12,692) 3,997 (9,669) (88,315)
(Loss) income before provision forincome tax . . . . . . . . . . . . . . . . . . (114,423) (38,334) 6,815 (9,428) (155,370)
Provision for income tax benefit . . . . . . . (1,439) (40,577) — — (42,016)
Net (loss) income . . . . . . . . . . . . . . (112,984) 2,243 6,815 (9,428) (113,354)Net income attributable to
non-controlling interest . . . . . . . . . . . . — — — (5,314) (5,314)
Net (loss) income attributable to thePartnership . . . . . . . . . . . . . . . . . $(112,984) $ 2,243 $ 6,815 $(14,742) $(118,668)
154

MARKWEST ENERGY PARTNERS, L.P.
NOTES TO CONSOLIDATED FINANCIAL STATEMENTS (Continued)
25. Supplemental Condensed Consolidating Financial Information (Continued)
Condensed Consolidating Statements of Cash Flows
Year ended December 31, 2011
Guarantor Non-Guarantor ConsolidatingParent Subsidiaries Subsidiaries Adjustments Consolidated
Net cash (used in) provided by operatingactivities . . . . . . . . . . . . . . . . . . . . . . . $ (126,782) $ 410,762 $ 137,961 $ (7,243) $ 414,698
Cash flows from investing activities:Restricted cash . . . . . . . . . . . . . . . . . . . — — 2,006 — 2,006Capital expenditures . . . . . . . . . . . . . . . (789) (162,517) (399,992) 12,017 (551,281)Acquisitions . . . . . . . . . . . . . . . . . . . . . — (230,728) — — (230,728)Equity investments . . . . . . . . . . . . . . . . (47,295) (252,367) — 299,662 —Distributions from consolidated affiliates . 50,718 68,651 — (119,369) —Investment in intercompany notes, net . . (37,990) — — 37,990 —Proceeds from disposal of property, plant
and equipment . . . . . . . . . . . . . . . . . — 606 7,617 (4,773) 3,450
Net cash flows used in investingactivities . . . . . . . . . . . . . . . . . . . . (35,356) (576,355) (390,369) 225,527 (776,553)
Cash flows from financing activities:Proceeds from revolving credit facility . . . 1,182,200 — — — 1,182,200Payments of revolving credit facility . . . . (1,116,200) — — — (1,116,200)Proceeds from long-term debt . . . . . . . . 1,199,000 — — — 1,199,000Payments of long-term debt . . . . . . . . . . (693,888) — — — (693,888)Payments of premiums on redemption of
long-term debt . . . . . . . . . . . . . . . . . (71,377) — — — (71,377)Proceeds from intercompany notes, net . . — 14,990 23,000 (37,990) —Payments for debt issuance costs,
deferred financing costs andregistration costs . . . . . . . . . . . . . . . . (20,163) — — — (20,163)
Acquisition of non-controlling interest,including transaction costs . . . . . . . . . (997,601) — — — (997,601)
Contributions from parent, net . . . . . . . . — 47,295 — (47,295) —Contributions to joint ventures, net . . . . . — — 378,759 (252,367) 126,392Payments of SMR Liability . . . . . . . . . . — (1,875) — — (1,875)Proceeds from public equity offerings, net 1,095,488 — — — 1,095,488Share-based payment activity . . . . . . . . . (6,354) 1,084 — — (5,270)Payment of distributions . . . . . . . . . . . . (218,398) (50,718) (135,537) 119,368 (285,285)Intercompany advances, net . . . . . . . . . . (190,547) 190,547 — — —
Net cash flows provided by financingactivities . . . . . . . . . . . . . . . . . . . . 162,160 201,323 266,222 (218,284) 411,421
Net increase in cash . . . . . . . . . . . . . . . . . 22 35,730 13,814 — 49,566Cash and cash equivalents at beginning of
year . . . . . . . . . . . . . . . . . . . . . . . . . . — 63,850 3,600 — 67,450
Cash and cash equivalents at end of period $ 22 $ 99,580 $ 17,414 $ — $ 117,016
155
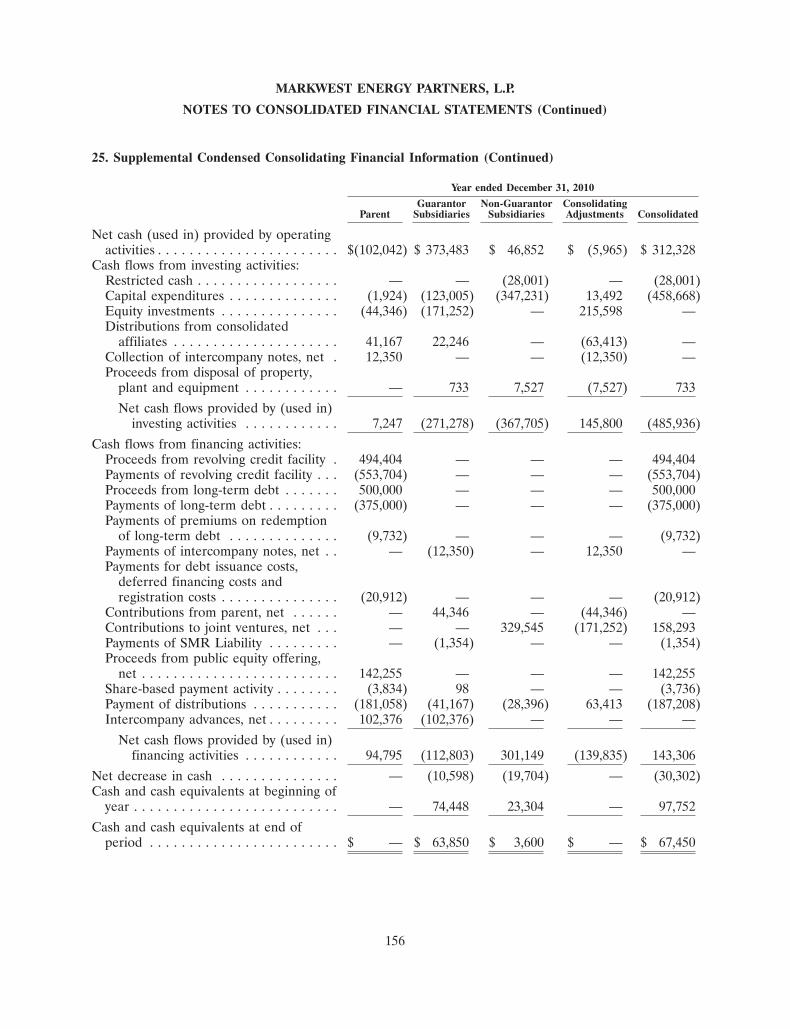
MARKWEST ENERGY PARTNERS, L.P.
NOTES TO CONSOLIDATED FINANCIAL STATEMENTS (Continued)
25. Supplemental Condensed Consolidating Financial Information (Continued)
Year ended December 31, 2010
Guarantor Non-Guarantor ConsolidatingParent Subsidiaries Subsidiaries Adjustments Consolidated
Net cash (used in) provided by operatingactivities . . . . . . . . . . . . . . . . . . . . . . . $(102,042) $ 373,483 $ 46,852 $ (5,965) $ 312,328
Cash flows from investing activities:Restricted cash . . . . . . . . . . . . . . . . . . — — (28,001) — (28,001)Capital expenditures . . . . . . . . . . . . . . (1,924) (123,005) (347,231) 13,492 (458,668)Equity investments . . . . . . . . . . . . . . . (44,346) (171,252) — 215,598 —Distributions from consolidated
affiliates . . . . . . . . . . . . . . . . . . . . . 41,167 22,246 — (63,413) —Collection of intercompany notes, net . 12,350 — — (12,350) —Proceeds from disposal of property,
plant and equipment . . . . . . . . . . . . — 733 7,527 (7,527) 733
Net cash flows provided by (used in)investing activities . . . . . . . . . . . . 7,247 (271,278) (367,705) 145,800 (485,936)
Cash flows from financing activities:Proceeds from revolving credit facility . 494,404 — — — 494,404Payments of revolving credit facility . . . (553,704) — — — (553,704)Proceeds from long-term debt . . . . . . . 500,000 — — — 500,000Payments of long-term debt . . . . . . . . . (375,000) — — — (375,000)Payments of premiums on redemption
of long-term debt . . . . . . . . . . . . . . (9,732) — — — (9,732)Payments of intercompany notes, net . . — (12,350) — 12,350 —Payments for debt issuance costs,
deferred financing costs andregistration costs . . . . . . . . . . . . . . . (20,912) — — — (20,912)
Contributions from parent, net . . . . . . — 44,346 — (44,346) —Contributions to joint ventures, net . . . — — 329,545 (171,252) 158,293Payments of SMR Liability . . . . . . . . . — (1,354) — — (1,354)Proceeds from public equity offering,
net . . . . . . . . . . . . . . . . . . . . . . . . . 142,255 — — — 142,255Share-based payment activity . . . . . . . . (3,834) 98 — — (3,736)Payment of distributions . . . . . . . . . . . (181,058) (41,167) (28,396) 63,413 (187,208)Intercompany advances, net . . . . . . . . . 102,376 (102,376) — — —
Net cash flows provided by (used in)financing activities . . . . . . . . . . . . 94,795 (112,803) 301,149 (139,835) 143,306
Net decrease in cash . . . . . . . . . . . . . . . — (10,598) (19,704) — (30,302)Cash and cash equivalents at beginning of
year . . . . . . . . . . . . . . . . . . . . . . . . . . — 74,448 23,304 — 97,752
Cash and cash equivalents at end ofperiod . . . . . . . . . . . . . . . . . . . . . . . . $ — $ 63,850 $ 3,600 $ — $ 67,450
156

MARKWEST ENERGY PARTNERS, L.P.
NOTES TO CONSOLIDATED FINANCIAL STATEMENTS (Continued)
25. Supplemental Condensed Consolidating Financial Information (Continued)
Year ended December 31, 2009
Guarantor Non-Guarantor ConsolidatingParent Subsidiaries Subsidiaries Adjustments Consolidated
Net cash (used in) provided by operatingactivities . . . . . . . . . . . . . . . . . . . . . . . $ (98,853) $ 322,540 $ 5,249 $ (5,835) $ 223,101
Cash flows from investing activities:Capital expenditures . . . . . . . . . . . . . . (1,688) (209,485) (281,285) 5,835 (486,623)Equity investments . . . . . . . . . . . . . . . (52,358) (127,806) — 179,759 (405)Distributions from consolidated
affiliates . . . . . . . . . . . . . . . . . . . . . 13,984 31,227 — (45,211) —Collection of intercompany notes, net . 21,340 — — (21,340) —Proceeds from sale of unconsolidated
affiliate . . . . . . . . . . . . . . . . . . . . . . — 25,000 — — 25,000Proceeds from disposal of property,
plant and equipment . . . . . . . . . . . . — 275 — — 275Proceeds from sale of equity interest in
consolidated subsidiary . . . . . . . . . . — 62,500 — (62,500) —
Net cash flows used in investingactivities . . . . . . . . . . . . . . . . . . . (18,722) (218,289) (281,285) 56,543 (461,753)
Cash flows from financing activities:Proceeds from revolving credit facility . 725,200 — — — 725,200Payments of revolving credit facility . . . (850,600) — — — (850,600)Proceeds from long-term debt . . . . . . . 117,000 — — — 117,000Payments of intercompany notes, net . . — (21,340) — 21,340 —Payments for debt issuance costs,
deferred financing costs andregistration costs . . . . . . . . . . . . . . . (8,054) (500) — — (8,554)
Contributions from parent, net . . . . . . — 52,358 — (52,358) —Contributions to joint ventures, net . . . (5,464) — 327,401 (127,401) 194,536Proceeds from sale of equity interest in
joint venture, net . . . . . . . . . . . . . . . (1,846) — — 62,500 60,654Proceeds from SMR Transaction . . . . . — 73,129 — — 73,129Proceeds from public offerings, net . . . 178,565 — — — 178,565Share-based payment activity . . . . . . . . (1,385) — — — (1,385)Payment of distributions . . . . . . . . . . . (155,307) (13,984) (31,382) 45,211 (155,462)Intercompany advances, net . . . . . . . . . 119,466 (119,466) — — —
Net cash flows provided by (used in)financing activities . . . . . . . . . . . . 117,575 (29,803) 296,019 (50,708) 333,083
Net increase in cash . . . . . . . . . . . . . . . . — 74,448 19,983 — 94,431Cash and cash equivalents at beginning of
year . . . . . . . . . . . . . . . . . . . . . . . . . . — — 3,321 — 3,321
Cash and cash equivalents at end ofperiod . . . . . . . . . . . . . . . . . . . . . . . . $ — $ 74,448 $ 23,304 $ — $ 97,752
157

MARKWEST ENERGY PARTNERS, L.P.
NOTES TO CONSOLIDATED FINANCIAL STATEMENTS (Continued)
26. Supplemental Cash Flow Information
The following table provides information regarding supplemental cash flow information (inthousands):
Year ended December 31,
2011 2010 2009
Supplemental disclosures of cash flow information:Cash paid for interest, net of amounts capitalized . . . . . . . . . . . . . . $112,780 $101,459 $85,817Cash paid for income taxes, net of refunds . . . . . . . . . . . . . . . . . . . 10,115 8,683 4,609
Supplemental schedule of non-cash investing and financing activities:Accrued property, plant and equipment . . . . . . . . . . . . . . . . . . . . . $ 87,098 $ 65,908 $60,738Interest capitalized on construction in progress . . . . . . . . . . . . . . . . 1,121 2,766 12,228Issuance of common units for vesting of share-based payment
awards . . . . . . . . . . . . . . . . . . . . . . . . . . . . . . . . . . . . . . . . . . . . 5,412 7,238 9,402Issuance of Class B units for acquisition of non-controlling interest . 752,531 — —
27. Valuation and Qualifying Accounts
Activity in the Partnership’s allowance for doubtful accounts and deferred tax asset valuationallowance is as follows (in thousands):
Year ended December 31,
2011 2010 2009
Allowance for Doubtful AccountsBalance at beginning of period . . . . . . . . . . . . . . . . . . . . $ 162 $ 162 $ 175Charged to costs and expenses . . . . . . . . . . . . . . . . . . . . — 134 12Other charges(1) . . . . . . . . . . . . . . . . . . . . . . . . . . . . . . (2) (134) (25)
Balance at end of period . . . . . . . . . . . . . . . . . . . . . . . . . $ 160 $ 162 $ 162
Deferred Tax Asset Valuation AllowanceBalance at beginning of period . . . . . . . . . . . . . . . . . . . . $1,036 $1,688 $ 30Charged to costs and expenses . . . . . . . . . . . . . . . . . . . . (59) (652) 1,667Other charges . . . . . . . . . . . . . . . . . . . . . . . . . . . . . . . . — — (9)
Balance at end of period . . . . . . . . . . . . . . . . . . . . . . . . . $ 977 $1,036 $1,688
(1) Bad debts written-off (net of recoveries).
158

MARKWEST ENERGY PARTNERS, L.P.
NOTES TO CONSOLIDATED FINANCIAL STATEMENTS (Continued)
28. Quarterly Results of Operations (Unaudited)
The following summarizes the Partnership’s quarterly results of operations for 2011 and 2010 (inthousands, except per unit data):
Three months ended
March 31(1) June 30 September 30 December 31(2)
2011Total revenue . . . . . . . . . . . . . . . . . . . . . . . . . . . $263,221 $400,439 $507,826 $333,913(Loss) income from operations . . . . . . . . . . . . . . (15,294) 133,214 207,801 (7,557)Net (loss) income . . . . . . . . . . . . . . . . . . . . . . . . (74,671) 89,205 153,454 (61,743)Net (loss) income attributable to the Partnership . (84,029) 78,497 140,312 (74,085)Net (loss) income attributable to the Partnership’s
common unitholders per common unit(4):Basic . . . . . . . . . . . . . . . . . . . . . . . . . . . . . . . . $ (1.13) $ 1.03 $ 1.77 $ (0.87)Diluted . . . . . . . . . . . . . . . . . . . . . . . . . . . . . . $ (1.13) $ 1.03 $ 1.77 $ (0.87)
Three months ended
March 31 June 30 September 30 December 31(3)
2010Total revenue . . . . . . . . . . . . . . . . . . . . . . . . . . . . $308,379 $323,850 $255,411 $299,991Income from operations . . . . . . . . . . . . . . . . . . . . . 53,573 109,071 646 25,172Net income (loss) . . . . . . . . . . . . . . . . . . . . . . . . . 26,004 66,968 (18,676) (43,194)Net income (loss) attributable to the Partnership . . . 21,510 60,217 (27,151) (54,109)Net income (loss) attributable to the Partnership’s
common unitholders per common unit(4):Basic . . . . . . . . . . . . . . . . . . . . . . . . . . . . . . . . . $ 0.32 $ 0.84 $ (0.39) $ (0.76)Diluted . . . . . . . . . . . . . . . . . . . . . . . . . . . . . . . $ 0.32 $ 0.84 $ (0.39) $ (0.76)
(1) During the first quarter of 2011, the Partnership recorded a loss on redemption of debt ofapproximately $43.3 million related to the repurchase of the 2016 Senior Notes and a portion of2018 Senior Notes. See Note 16 for further details.
(2) During the fourth quarter of 2011, the Partnership recorded a loss on redemption of debt ofapproximately $35.5 million related to the repurchase of a portion of the 2018 Senior Notes. SeeNote 16 for further details.
(3) During the fourth quarter of 2010, the Partnership recorded a loss on redemption of debt ofapproximately $46.3 million related to the redemption of the 2014 Senior Notes. See Note 16 forfurther details.
(4) Basic and diluted net (loss) income per unit are computed independently for each of the quarterspresented; therefore, the sum of the quarterly earnings per unit may not equal the total computedfor the year.
159

MARKWEST ENERGY PARTNERS, L.P.
NOTES TO CONSOLIDATED FINANCIAL STATEMENTS (Continued)
29. Subsequent Events
Utica Shale Joint Venture
Effective January 1, 2012, the Partnership and EMG Utica entered into the Utica Joint Venture todevelop significant natural gas processing and NGL fractionation, transportation and marketinginfrastructure in the Utica Shale in eastern Ohio beginning in 2012. Under the terms of the Utica JointVenture, EMG will fund a majority of the initial capital expenditures required to develop the Uticamidstream infrastructure. The Partnership has a 60% ownership in the Utica Joint Venture. A wholly-owned subsidiary of the Partnership serves as the operator of MarkWest Utica EMG and provides fieldoperating and general and administrative services. A portion of the fee for providing these services isfixed.
160

ITEM 9. Changes in and Disagreements with Accountants on Accounting and Financial Disclosure
None.
ITEM 9A. Controls and Procedures
Evaluation of Disclosure Controls and Procedures
An evaluation was performed under the supervision and with the participation of the Partnership’smanagement, including the Chief Executive Officer and Chief Financial Officer, of the effectiveness ofthe design and operation of our disclosure controls and procedures, as defined in Rule 13a-15(e) of the1934 Act, as of December 31, 2011. Based on this evaluation, the Partnership’s management, includingour Chief Executive Officer and Chief Financial Officer, concluded that as of December 31, 2011, ourdisclosure controls and procedures were effective to provide reasonable assurance that informationrequired to be disclosed by us in the reports that we file or submit under the 1934 Act is recorded,processed, summarized, and reported within the time periods specified in the SEC’s rules and formsand to provide reasonable assurance that such information is accumulated and communicated to ourmanagement, including our Chief Executive Officer and Chief Financial Officer, as appropriate to allowtimely decisions regarding required disclosures.
Management’s Report on Internal Control Over Financial Reporting
Management of the Partnership is responsible for establishing and maintaining adequate internalcontrol over financial reporting, as defined in Rule 13a-15(f) of the 1934 Act. Management hasassessed the effectiveness of our internal control over financial reporting as of December 31, 2011based on criteria established in Internal Control—Integrated Framework issued by the Committee ofSponsoring Organizations of the Treadway Commission. As a result of this assessment, managementconcluded that, as of December 31, 2011, our internal control over financial reporting was effective inproviding reasonable assurance regarding the reliability of financial reporting and the preparation offinancial statements for external purposes in accordance with generally accepted accounting principles.
Limitations on Controls
Our disclosure controls and procedures and internal control over financial reporting are designedto provide reasonable assurance of achieving their objectives as specified above. Management does notexpect, however, that our disclosure controls and procedures or our internal control over financialreporting will prevent or detect all error and fraud. Any control system, no matter how well designedand operated, is based upon certain assumptions and can provide only reasonable, not absolute,assurance that its objectives will be met. Further, no evaluation of controls can provide absoluteassurance that misstatements due to error or fraud will not occur or that all control issues andinstances of fraud, if any, within the Partnership have been detected.
Changes in Internal Control Over Financial Reporting
There were no changes in our internal control over financial reporting during the quarter endedDecember 31, 2011 that materially affected, or are reasonably likely to materially affect, our internalcontrol over financial reporting.
Deloitte & Touche has independently assessed the effectiveness of our internal control overfinancial reporting and its report is included below.
161

REPORT OF INDEPENDENT REGISTERED PUBLIC ACCOUNTING FIRM
To the Board of Directors ofMarkWest Energy GP, L.L.C.Denver, Colorado
We have audited the internal control over financial reporting of MarkWest Energy Partners, L.P.,and subsidiaries (the ‘‘Partnership’’) as of December 31, 2011 based on criteria established in InternalControl—Integrated Framework issued by the Committee of Sponsoring Organizations of the TreadwayCommission. The Partnership’s management is responsible for maintaining effective internal controlover financial reporting, and for its assessment of the effectiveness of internal control over financialreporting, included in the accompanying Management’s Report on Internal Control Over FinancialReporting. Our responsibility is to express an opinion on the Partnership’s internal control overfinancial reporting based on our audit.
We conducted our audit in accordance with the standards of the Public Company AccountingOversight Board (United States). Those standards require that we plan and perform the audit to obtainreasonable assurance about whether effective internal control over financial reporting was maintainedin all material respects. Our audit included obtaining an understanding of internal control overfinancial reporting, assessing the risk that a material weakness exists, testing and evaluating the designand operating effectiveness of internal control based on the assessed risk, and performing such otherprocedures as we considered necessary in the circumstances. We believe that our audit provides areasonable basis for our opinion.
A company’s internal control over financial reporting is a process designed by, or under thesupervision of, the company’s principal executive and principal financial officers, or persons performingsimilar functions, and effected by the company’s board of directors, management, and other personnelto provide reasonable assurance regarding the reliability of financial reporting and the preparation offinancial statements for external purposes in accordance with generally accepted accounting principles.A company’s internal control over financial reporting includes those policies and procedures that(1) pertain to the maintenance of records that, in reasonable detail, accurately and fairly reflect thetransactions and dispositions of the assets of the company; (2) provide reasonable assurance thattransactions are recorded as necessary to permit preparation of financial statements in accordance withgenerally accepted accounting principles, and that receipts and expenditures of the company are beingmade only in accordance with authorizations of management and directors of the company; and(3) provide reasonable assurance regarding prevention or timely detection of unauthorized acquisition,use, or disposition of the company’s assets that could have a material effect on the financial statements.
Because of the inherent limitations of internal control over financial reporting, including thepossibility of collusion or improper management override of controls, material misstatements due toerror or fraud may not be prevented or detected on a timely basis. Also, projections of any evaluationof the effectiveness of the internal control over financial reporting to future periods are subject to therisk that the controls may become inadequate because of changes in conditions, or that the degree ofcompliance with the policies or procedures may deteriorate.
In our opinion, the Partnership maintained, in all material respects, effective internal control overfinancial reporting as of December 31, 2011, based on the criteria established in Internal Control—Integrated Framework issued by the Committee of Sponsoring Organizations of the TreadwayCommission.
We have also audited, in accordance with the standards of the Public Company AccountingOversight Board (United States), the consolidated financial statements as of and for the year endedDecember 31, 2011 of the Partnership and our report dated February 28, 2012 expressed an unqualifiedopinion on those financial statements.
/s/ DELOITTE & TOUCHE LLP
Denver, ColoradoFebruary 28, 2012
162

ITEM 9B. Other Information
None.
PART III
ITEM 10. Directors, Executive Officers and Corporate Governance
Information required to be set forth in Item 10. Directors, Executive Officers and CorporateGovernance, has been omitted and will be incorporated herein by reference, when filed, to our ProxyStatement for our 2011 Annual Meeting of Unitholders expected to be filed no later than April 29,2012.
ITEM 11. Executive Compensation
Information required to be set forth in Item 11. Executive Compensation, has been omitted andwill be incorporated herein by reference, when filed, to our Proxy Statement for our 2012 AnnualMeeting of Unitholders expected to be filed no later than April 29, 2012.
ITEM 12. Security Ownership of Certain Beneficial Owners and Management and Related UnitholderMatters
Information required to be set forth in Item 12. Security Ownership of Certain Beneficial Ownersand Management and Related Unitholder Matters, has been omitted and will be incorporated hereinby reference, when filed, to our Proxy Statement for our 2011 Annual Meeting of Unitholders expectedto be filed no later than April 29, 2012.
ITEM 13. Certain Relationships and Related Transactions, and Director Independence
Information required to be set forth in Item 13. Certain Relationships and Related Transactions,and Director Independence, has been omitted and will be incorporated herein by reference, when filed,to our Proxy Statement for our 2011 Annual Meeting of Unitholders expected to be filed no later thanApril 29, 2012.
ITEM 14. Principal Accountant Fees and Services
Information required to be set forth in Item 14. Principal Accountant Fees and Services, has beenomitted and will be incorporated herein by reference, when filed, to our Proxy Statement for our 2012Annual Meeting of Unitholders expected to be filed no later than April 29, 2012.
PART IV
ITEM 15. Exhibits and Financial Statement Schedules
(a) The following documents are filed as part of this report:
(1) Financial Statements
You should read the Index to Consolidated Financial Statements included in Item 8 of thisForm 10-K for a list of all financial statements filed as part of this report, which isincorporated herein by reference.
(2) Financial Statement Schedules
All schedules have been omitted because they are not required or because the requiredinformation is contained in the financial statements or notes thereto.
(3) Exhibits
163

ExhibitNumber Description
2.1(6) Agreement and Plan of Redemption and Merger dated September 5, 2007 by and amongMarkWest Hydrocarbon, Inc., MarkWest Energy Partners, L.P. and MWEP, L.L.C.
3.1(1) Certificate of Limited Partnership of MarkWest Energy Partners, L.P.
3.2(1) Certificate of Formation of MarkWest Energy Operating Company, L.L.C.
3.3(2) Amended and Restated Limited Liability Company Agreement of MarkWest EnergyOperating Company, L.L.C., dated as of May 24, 2002.
3.4(1) Certificate of Formation of MarkWest Energy GP, L.L.C.
3.5(2) Amended and Restated Limited Liability Company Agreement of MarkWest Energy GP,L.L.C., dated as of May 24, 2002.
3.6(10) Third Amended and Restated Agreement of Limited Partnership of MarkWest EnergyPartners, L.P., dated as of February 21, 2008.
3.7(20) Amendment No. 1 to Amended and Restated Limited Liability Company AgreementMarkWest Energy GP, L.L.C., dated as of December 31, 2004.
3.8(20) Amendment No. 2 to Amended and Restated Limited Liability Company AgreementMarkWest Energy GP, L.L.C., dated as of January 19, 2005.
3.9(20) Amendment No. 3 to Amended and Restated Limited Liability Company AgreementMarkWest Energy GP, L.L.C., dated as of February 21, 2008.
3.10(20) Amendment No. 4 to Amended and Restated Limited Liability Company AgreementMarkWest Energy GP, L.L.C., dated as of March 31, 2008.
3.11(27) Amendment No. 1 to the Third Amended and Restated Agreement of Limited Partnershipof MarkWest Energy Partners, L.P., dated December 29, 2011.
4.1(12) Indenture dated as of April 15, 2008 among MarkWest Energy Partners, L.P., MarkWestEnergy Finance Corporation, the several guarantors named therein, and Wells Fargo Bank,N.A., as trustee.
4.2(12) Form of 83⁄4% Series A and Series B Senior Notes due 2018 with attached notation ofGuarantees (incorporated by reference to Exhibits A and D of Exhibit 4.1 hereto).
4.3(12) Registration Rights Agreement dated as of April 15, 2008 among MarkWest EnergyPartners, L.P., MarkWest Energy Finance Corporation, and the several guarantors namedtherein, and J.P. Morgan Securities Inc., RBC Capital Markets Corporation, WachoviaCapital Markets, LLC, Banc of America Securities LLC, Credit Suisse Securities(USA) LLC, Deutsche Bank Securities Inc., Fortis Securities LLC and SunTrust RobinsonHumphrey, Inc.
4.4(13) Registration Rights Agreement dated as of May 1, 2008 among MarkWest EnergyPartners, L.P., MarkWest Energy Finance Corporation, and the several guarantors namedtherein, and J.P. Morgan Securities Inc., RBC Capital Markets Corporation, WachoviaCapital Markets, LLC, Banc of America Securities LLC, Credit Suisse Securities(USA) LLC, Deutsche Bank Securities Inc., Fortis Securities LLC and SunTrust RobinsonHumphrey, Inc.
4.5(16) First Supplemental Indenture, dated as of April 25, 2008, among MarkWest EnergyPartners, L.P., MarkWest Energy Finance Corporation, the Guarantors named therein, andWells Fargo Bank, National Association, as Trustee.
164
ExhibitNumber Description
4.6(16) Second Supplemental Indenture, dated as of August 4, 2008, among MarkWest EnergyPartners, L.P., MarkWest Energy Finance Corporation, the Guarantors named therein, andWells Fargo Bank, National Association, as Trustee.
4.7(16) Third Supplemental Indenture, dated as of September 15, 2008, among MarkWest EnergyPartners, L.P., MarkWest Energy Finance Corporation, the Guarantors named therein, andWells Fargo Bank, National Association, as Trustee.
4.8(17) Indenture Release of Subsidiary Guarantor dated as of May 1, 2009, among MarkWestEnergy Partners, L.P., and Wells Fargo Bank, N.A.
4.9(18) Indenture Release of Subsidiary Guarantor dated as of October 31, 2009, amongMarkWest Energy Partners, L.P. and Wells Fargo Bank, N.A.
4.10(28) Fourth Supplemental Indenture dated as of March 10, 2011, by and among MarkWestEnergy Partners, L.P., MarkWest Energy Finance Corporation, the Subsidiary Guarantorsnamed therein and Wells Fargo Bank, National Association, as trustee.
4.11(32) Fifth Supplemental Indenture dated as of October 21, 2011, by and among MarkWestEnergy Partners, L.P., MarkWest Energy Finance Corporation, the Subsidiary Guarantorsnamed therein and Wells Fargo Bank, National Association, as trustee.
4.12(34) Sixth Supplemental Indenture, dated as of November 10, 2011, by and among MarkWestEnergy Partners, L.P., MarkWest Energy Finance Corporation, the Subsidiary Guarantorsnamed therein and Wells Fargo Bank, National Association, as trustee.
4.13(22) Indenture, dated as of November 2, 2010, by and among MarkWest Energy Partners, L.P.,MarkWest Energy Finance Corporation, the Subsidiary Guarantors named therein andWells Fargo Bank, National Association, as trustee.
4.14(22) First Supplemental Indenture, dated as of November 2, 2010, by and among MarkWestEnergy Partners, L.P., MarkWest Energy Finance Corporation, the Subsidiary Guarantorsnamed therein and Wells Fargo Bank, National Association, as trustee.
4.15(22) Form of 63⁄4% Senior Notes due 2020 with attached notation of Guarantees (incorporatedby reference to Exhibits A and B of Exhibit 4.14 hereto).
4.16(26) Second Supplemental Indenture, dated as of February 24, 2011, by and among MarkWestEnergy Partners, L.P., MarkWest Energy Finance Corporation, the Subsidiary Guarantorsnamed therein and Wells Fargo Bank, National Association, as trustee.
4.17(26) Form of 6.5% Senior Notes due 2021 with attached notation of Guarantees (incorporatedby reference to Exhibits A and B of Exhibit 4.16 hereto).
4.18(28) Third Supplemental Indenture dated as of March 10, 2011, by and among MarkWestEnergy Partners, L.P., MarkWest Energy Finance Corporation, the Subsidiary Guarantorsnamed therein and Wells Fargo Bank, National Association, as trustee.
4.19(32) Fourth Supplemental Indenture dated as of October 21, 2011, by and among MarkWestEnergy Partners, L.P., MarkWest Energy Finance Corporation, the Subsidiary Guarantorsnamed therein and Wells Fargo Bank, National Association, as trustee.
4.20(33) Fifth Supplemental Indenture, dated as of November 3, 2011, by and among MarkWestEnergy Partners, L.P., MarkWest Energy Finance Corporation, the Subsidiary Guarantorsnamed therein and Wells Fargo Bank, National Association, as trustee.
165

ExhibitNumber Description
4.21(33) Form of 6.25% Senior Notes due 2022 with attached notation of Guarantees (incorporatedby reference to Exhibits A and B of Exhibit 4.20 hereto).
4.22* Sixth Supplemental Indenture, dated as of December 27, 2011, by and among MarkWestEnergy Partners, L.P., MarkWest Energy Finance Corporation, the Subsidiary Guarantorsnamed therein and Wells Fargo Bank, National Association, as trustee.
4.23* Registration Rights Agreement dated December 29, 2011 between MarkWest EnergyPartners, L.P. and M&R MWE Liberty, LLC.
10.1(24) Amended and Restated Revolving Credit Agreement dated as of July 1, 2010 amongMarkWest Energy Partners, L.P., Wells Fargo Bank, National Association, as successorAdministrative Agent, Issuing Bank and Swingline Linder, Royal Bank of Canada, as prioradministrative agent, RBC Capital Markets, as Syndication Agent, BNP Paribas, MorganStanley Bank and U.S. Bank National Association, as Documentation Agents, and thelenders party thereto.
10.2(25) Joinder Agreement dated as of July 29, 2010 among MarkWest Energy Partners, L.P.,Wells Fargo Bank, National Association, individually and as Administrative Agent, IssuingBank and Swingline Lender and Goldman Sachs Bank USA.
10.3(29) Joinder Agreement dated as of June 15, 2011 among MarkWest Energy Partners, L.P.,Wells Fargo Bank, National Association, individually and as Administrative Agent, IssuingBank and Swingline Lender and Citibank, N.A.
10.4(31) First Amendment to Amended and Restated Credit Agreement dated as of September 7,2011 among MarkWest Energy Partners, L.P., Wells Fargo Bank, National Association, asAdministrative Agent, and the other agents and lenders party thereto.
10.5(27) Second Amendment to Amended and Restated Credit Agreement dated as ofDecember 29, 2011, among MarkWest Energy Partners, L.P., Wells Fargo Bank, NationalAssociation, as Administrative Agent, and the other agents and lenders party thereto.
10.6(3) Services Agreement dated January 1, 2004 between MarkWest Energy GP, L.L.C. andMarkWest Hydrocarbon, Inc.
10.7(5)+ Construction, Operation and Gas Gathering Agreement dated as of September 21, 2006between MarkWest Western Oklahoma Gas Company, L.L.C. and Newfield ExplorationMid-Continent Inc.
10.8(7)+ Hydrogen Supply Agreement dated September 28, 2007, by and between MarkWestBlackhawk, L.P. and CITGO Refining and Chemicals Company L.P.
10.9(9)+ Gas Processing Agreement dated as of November 1, 2007, by and between MarkWestJavelina Company and CITGO Refining and Chemicals Company, L.P.
10.10(8)+ Amendment to Gas Processing Agreement dated as of December 11, 2007, by and betweenMarkWest Javelina Company and CITGO Refining and Chemicals Company, L.P.
10.11(15)+ Stiles/Britt Ranch Gas Gathering and Processing Agreement dated effective as of June 12,2008 and executed August 5, 2008 between Newfield Exploration Mid-Continent Inc. andMarkWest Oklahoma Gas Company, L.L.C.
10.12(16)+ Natural Gas Liquids Purchase Agreement dated August 25, 2006 between ONEOKHydrocarbon, L.P. and MarkWest Western Oklahoma Gas Company, L.L.C., now known asMarkWest Oklahoma Gas Company, L.L.C.
166

ExhibitNumber Description
10.13(16)+ Amendment to the Natural Gas Liquids Purchase Agreement effective as of November 1,2008 by and between MarkWest Oklahoma Gas Company, L.L.C. and ONEOKHydrocarbon, L.P.
10.14(16)+ Raw Product Purchase Agreement dated February 11, 2005 between MarkWest EnergyEast Texas Gas Company, L.P., now known as MarkWest Energy East Texas Gas Company,L.L.C., and Dynegy Liquids Marketing and Trade, now known as Targa Liquids Marketingand Trade.
10.15(23)+ Amendment to the Raw Product Purchase Agreement effective as of December 1, 2009 byand between Targa Liquids Marketing and Trade and MarkWest Energy East Texas GasCompany, L.L.C.
10.16(19)+ Contribution Agreement dated as of January 22, 2009 by and among MarkWest LibertyGas Gathering, L.L.C., M&R MWE Liberty, LLC, and MarkWest Liberty Midstream &Resources, L.L.C.
10.17(19)+ Amended and Restated Limited Liability Company Agreement of MarkWest LibertyMidstream & Resources, L.L.C. dated as of February 27, 2009.
10.18(21)+ Letter Agreement dated August 10, 2009 between MarkWest Liberty Gas Gathering,L.L.C. and M&R MWE Liberty, LLC.
10.19(23)+ Second Amended and Restated Limited Liability Company Agreement of MarkWestLiberty Midstream & Resources, L.L.C. dated as of November 1, 2009.
10.20(23) Amendment No. 1 to Second Amended and Restated Limited Liability CompanyAgreement of MarkWest Liberty Midstream & Resources, L.L.C. dated as ofNovember 20, 2009.
10.21(6) Exchange Agreement dated September 5, 2007 by and among MarkWest EnergyPartners, L.P., MarkWest Hydrocarbon, Inc., and MarkWest Energy, GP L.L.C.
10.22(14) Form of Second Amended and Restated Indemnification Agreement dated April 24, 2008by and among MarkWest Energy Partners, L.P., MarkWest Energy GP, L.L.C., and eachdirector and officer of MarkWest Energy GP, L.L.C., including the following namedexecutive officers: Frank Semple, President and Chief Executive Officer; Nancy Buese,Senior Vice President and Chief Financial Officer; Randy Nickerson, Senior Vice Presidentand Chief Commercial Officer; John Mollenkopf, Senior Vice President and ChiefOperations Officer; and C. Corwin Bromley, Senior Vice President, General Counsel andSecretary.
10.23(2) MarkWest Energy Partners, L.P. Long-Term Incentive Plan.
10.24(2) First Amendment to MarkWest Energy Partners, L.P. Long-Term Incentive Plan.
10.25(14) 1996 Stock Incentive Plan for MarkWest Hydrocarbon, Inc.
10.26(14) 2006 Stock Incentive Plan for MarkWest Hydrocarbon, Inc.
10.27(11) MarkWest Energy Partners, L.P. 2008 Long-Term Incentive Plan.
10.28(4)� Executive Employment Agreement effective September 5, 2007 between MarkWestHydrocarbon, Inc. and Frank Semple.
167

ExhibitNumber Description
10.29(4)� Form of Executive Employment Agreement effective September 5, 2007 betweenMarkWest Hydrocarbon, Inc. and Nancy K. Buese, C. Corwin Bromley, John C.Mollenkopf and Randy S. Nickerson.
10.30(30)+ Amendment No. 2 to Second Amended and Restated Limited Liability CompanyAgreement of MarkWest Liberty Midstream & Resources, L.L.C. dated as of April 28,2011.
10.31(28)+ Purchase and Sale Agreement dated as of January 3, 2011 by and between EQTGathering, LLC and MarkWest Energy Appalachia, L.L.C.
10.32(28)+ Letter Agreement dated February 1, 2011 between EQT Gathering, LLC and MarkWestEnergy Appalachia, L.L.C.
10.33*+ Amendment No. 3 to Second Amended and Restated Limited Liability CompanyAgreement of MarkWest Liberty Midstream & Resources, L.L.C. dated as ofDecember 19, 2011, among MarkWest Liberty Midstream & Resources, L.L.C., MarkWestLiberty Gas Gathering, L.L.C. and M&R MWE Liberty, LLC.
10.34*+ Contribution Agreement dated December 29, 2011 among M&R MWE Liberty, LLC,MarkWest Energy Partners, L.P. and MarkWest Liberty Gas Gathering L.L.C.
10.35*+ Limited Liability Company Agreement of MarkWest Utica EMG, L.L.C., datedDecember 29, 2011 and effective January 1, 2012, between MarkWest Utica OperatingCompany, L.L.C. and EMG Utica, LLC.
12.1* Computation of Ratio of Earnings to Fixed Charges
21.1* List of subsidiaries
23.1* Consent of Deloitte & Touche LLP
31.1* Chief Executive Officer Certification Pursuant to Section 13a-14 of the SecuritiesExchange Act
31.2* Chief Financial Officer Certification Pursuant to Section 13a-14 of the Securities ExchangeAct
32.1* Certification of Chief Executive Officer of the General Partner pursuant to 18 U.S.C.Section 1350, as adopted pursuant to Section 906 of the Sarbanes-Oxley Act of 2002.
32.2* Certification of Chief Financial Officer of the General Partner pursuant to 18 U.S.C.Section 1350, as adopted pursuant to Section 906 of the Sarbanes-Oxley Act of 2002.
101* The following financial information from the annual report on Form 10-K of MarkWestEnergy Partners, L.P. for the year ended December 31, 2010, formatted in XBRL(eXtensible Business Reporting Language): (i) Consolidated Balance Sheets,(ii) Consolidated Statements of Operations, (iii) Consolidated Statements of Changes inEquity and Comprehensive Income, (iv) Consolidated Statements of Cash Flows, and(v) Notes to Consolidated Financial Statements, tagged as blocks of text.
(1) Incorporated by reference to the Registration Statement (No. 33-81780) on Form S-1 filedJanuary 31, 2002.
(2) Incorporated by reference to the Current Report on Form 8-K filed June 7, 2002.
(3) Incorporated by reference to the Annual Report on Form 10-K filed March 15, 2004.
168

(4) Incorporated by reference to the Current Report on Form 8-K filed September 11, 2007.
(5) Incorporated by reference to the Quarterly Report on Form 10-Q filed November 7, 2006.
(6) Incorporated by reference to the Current Report on Form 8-K filed September 6, 2007.
(7) Incorporated by reference to the Quarterly Report on Form 10-Q filed November 8, 2007.
(8) Incorporated by reference to the Annual Report on Form 10-K filed February 29, 2008.
(9) Incorporated by reference to the Annual Report on Form 10-K/A filed May 8, 2008.
(10) Incorporated by reference to the Current Report on Form 8-K filed February 21, 2008.
(11) Incorporated by reference to the Form S-4/A Registration Statement filed December 21, 2007.
(12) Incorporated by reference to the Current Report on Form 8-K filed April 15, 2008.
(13) Incorporated by reference to the Current Report on Form 8-K filed May 1, 2008.
(14) Incorporated by reference to the Quarterly Report on Form 10-Q filed August 11, 2008.
(15) Incorporated by reference to the Quarterly Report on Form 10-Q filed November 10, 2008.
(16) Incorporated by reference to the Annual Report on Form 10-K filed March 2, 2009.
(17) Incorporated by reference to the Quarterly Report on Form 10-Q filed August 10, 2009.
(18) Incorporated by reference to the Registration Statement on Form S-3 filed January 13, 2010.
(19) Incorporated by reference to the Quarterly Report on Form 10-Q/A filed October 16, 2009.
(20) Incorporated by reference to the Form S-4 Registration Statement filed July 2, 2009.
(21) Incorporated by reference to the Quarterly Report on Form 10-Q filed November 9, 2009.
(22) Incorporated by reference to the Current Report on Form 8-K filed November 3, 2010.
(23) Incorporated by reference to the Annual Report on Form 10-K filed March 1, 2010.
(24) Incorporated by reference to the Current Report on Form 8-K filed July 7, 2010.
(25) Incorporated by reference to the Current Report on Form 8-K filed August 4, 2010.
(26) Incorporated by reference to the Current Report on Form 8-K filed February 24, 2011.
(27) Incorporated by reference to the Current Report on Form 8-K filed December 30, 2011.
(28) Incorporated by reference to the Quarterly Report on Form 10-Q filed May 9, 2011.
(29) Incorporated by reference to the Current Report on Form 8-K filed June 17, 2011.
(30) Incorporated by reference to the Quarterly Report on Form 10-Q filed August 8, 2011.
(31) Incorporated by reference to the Current Report on Form 8-K filed September 13, 2011.
(32) Incorporated by reference to the Quarterly Report on Form 10-Q filed November 7, 2011.
(33) Incorporated by reference to the Current Report on Form 8-K filed November 7, 2011.
(34) Incorporated by reference to the Current Report on Form 8-K filed November 15, 2011.
+ Application has been made to the Securities and Exchange Commission for confidential treatmentof certain provisions of these exhibits. Omitted material for which confidential treatment has beenrequested and has been filed separately with the Securities and Exchange Commission.
* Filed herewith.
169

� Identifies each management contract or compensatory plan or arrangement.
(b) The following exhibits are filed as part of this report: See Item 15(a)(2) above.
(c) The following financial statement schedules are filed as part of this report: None required.
170

SIGNATURES
Pursuant to the requirements of section 13 or 15(d) of the Securities Exchange Act of 1934, theRegistrant has duly caused this Report to be signed on its behalf by the undersigned, thereunto dulyauthorized.
MarkWest Energy Partners, L.P.(Registrant)
By: MarkWest Energy GP, L.L.C.,Its General Partner
Date: February 28, 2012 By: /s/ FRANK M. SEMPLE
Frank M. SempleChairman, President and Chief Executive Officer
(Principal Executive Officer)
Pursuant to the requirements of the Securities Exchange Act of 1934, this report has been signedbelow by the following persons on behalf of the Registrant and in the capacities with MarkWestEnergy GP, L.L.C., the General Partner of MarkWest Energy Partners, L.P., the Registrant, and on thedates indicated.
Date: February 28, 2012 By: /s/ FRANK M. SEMPLE
Frank M. SempleChairman, President and Chief Executive Officer
(Principal Executive Officer)
Date: February 28, 2012 By: /s/ NANCY K. BUESE
Nancy K. BueseSenior Vice President and Chief Financial Officer
(Principal Financial Officer)
Date: February 28, 2012 By: /s/ PAULA L. ROSSON
Paula L. RossonVice President and Chief Accounting Officer
(Principal Accounting Officer)
Date: February 28, 2012 By: /s/ DONALD D. WOLF
Donald D. WolfLead Director
Date: February 28, 2012 By: /s/ KEITH E. BAILEY
Keith E. BaileyDirector
171

Date: February 28, 2012 By: /s/ MICHAEL L. BEATTY
Michael L. BeattyDirector
Date: February 28, 2012 By: /s/ CHARLES K. DEMPSTER
Charles K. DempsterDirector
Date: February 28, 2012 By: /s/ ANNE E. FOX MOUNSEY
Anne E. Fox MounseyDirector
Date: February 28, 2012 By: /s/ DONALD C. HEPPERMANN
Donald C. HeppermannDirector
Date: February 28, 2012 By: /s/ WILLIAM A. KELLSTROM
William A. KellstromDirector
Date: February 28, 2012 By: /s/ WILLIAM P. NICOLETTI
William P. NicolettiDirector
Date: February 28, 2012 By: /s/ RANDALL J. LARSON
Randall J. LarsonDirector
172

Design by Curran & Connors, Inc. / www.curran-connors.com
Corporate InformatIon
Board of directors of MarkWest energy gP, LLc
Frank M. SempleChairman of the Board, President and Chief Executive OfficerMarkWest Energy GP, LLC
Keith E. BaileyChairman of the Compensation CommitteeMember of the Nominating and Corporate Governance Committee
Michael L. Beatty Chairman of the Nominating and Corporate Governance CommitteeMember of the Compensation Committee
Charles K. DempsterMember of the Compensation CommitteeMember of the Finance Committee
Donald C. HeppermannChairman of the Finance CommitteeMember of the Audit Committee
William A. KellstromMember of the Nominating and Corporate Governance Committee Member of the Finance Committee
Randall J. LarsonMember of the Audit CommitteeMember of the Compensation Committee
Anne E. Fox MounseyMember of the Audit CommitteeMember of the Nominating and Corporate Governance Committee
William P. NicolettiChairman of the Audit CommitteeMember of the Finance Committee
Donald D. Wolf Lead Director
executive officers of MarkWest energy gP, LLc
Frank M. SempleChairman of the Board, President and Chief Executive Officer
C. Corwin BromleySenior Vice President, General Counsel and Secretary
Nancy K. BueseSenior Vice President and Chief Financial Officer
John C. MollenkopfSenior Vice President and Chief Operating Officer
Randy S. NickersonSenior Vice President and Chief Commercial Officer
contact inforMationMarkWest Energy Partners, LP1515 Arapahoe StreetTower 1, Suite 1600Denver, Colorado 80202-2137Tel: 800.730.8388Fax: 303.290.8769Website: www.markwest.com
Investor RelationsTel: 866.858.0482 Email:[email protected]
transfer agent and registrarWells Fargo Shareowner ServicesTel: 800.468.9716Website: www.shareowneronline.com
Send unitholder inquiries to:Wells Fargo Shareowner Services161 North Concord ExchangeSouth St. Paul, Minnesota 55075
coMMon unit ListingNew York Stock ExchangeTicker Symbol: MWE
nyse and sec certificationsThe annual CEO certification required by Section 303A.12(a) of the New York Stock Exchange Listed Company Manual was submitted without qualification by Frank M. Semple on June 28, 2011.
MarkWest’s Chief Executive Officer and Chief Financial Officer have provided certifications to the U.S. Securities and Exchange Commission as required by Sections 302 and 906 of the Sarbanes-Oxley Act of 2002. These certifications are included as Exhibits 31.1, 31.2, 32.1, and 32.2 to the Partnership’s Form 10-K for the year ended December 31, 2011.
Our Core PrinciplesMarkWest believes that every employee is important to the success of the company and is committed to building a performance-oriented culture based on trust, account-ability, safety, and teamwork.
MarkWest strives to deliver best-in-class midstream services that consistently exceed the expectations of its producer customers.
MarkWest encourages innovative solutions to complex problems at all levels within the company.
MarkWest contributes to the development of environ- mentally clean energy while utilizing ecologically friendly practices and complying with or exceeding regulatory requirements.
MarkWest’s reputation rests on its ability to operate in accordance with the principles of honesty, integrity, and trustworthiness.
1515 Arapahoe Street, Tower 1, Suite 1600Denver, Colorado 80202-2137
www.markwest.com
MarkWest Energy Partners’ 2011 Annual Report saved the following resources by printing on paper con taining up to 100% recycled fiber.
100 trees preserved for
the future
32 million BTUs of energy
not consumed
46,062 gallons of wastewater
flow saved
2,797 pounds of solid waste not generated
9,564 pounds net of greenhouse gases prevented
Related Documents