Iranian German Cooperation Project March 2009 Energy Scenarios for Iran

Welcome message from author
This document is posted to help you gain knowledge. Please leave a comment to let me know what you think about it! Share it to your friends and learn new things together.
Transcript

Iranian
German Cooperation Project
March 2009
Energy Scenarios for Iran

1
This project was conducted as part of the initiative Climate Policy and
Sustainable Development: Opportunities for Iranian
German Co
Operation . Up to now, one internship has taken place in Wuppertal on 12
20
Jan. 2007.
Moreover the following workshops and seminars have held:
1. Workshop in Wuppertal on 20
21 Nov., 2006
2. Workshop in Wuppertal on 21
24 Nov., 2007
3. Workshop in Wuppertal on 14
17 May, 2008
4. Workshop in Berlin on 17
21 Nov., 2008
5. Seminar in Tehran on June 15, 2008
6. Seminar in Tehran on Dec., 11, 2008
Project Team:
Prof. Mohammad Hassan Panjeshahi [email protected]
Dr. Saeed Moshiri [email protected]
Dr. Farideh Atabi [email protected]
Dr. Esfandyar Jahangard [email protected]
Mr. Kioumars Heidari [email protected]
Dr. Stefan Lectenboehmer [email protected]
Mr. Dieter Seifried [email protected]
Dr. Nikolaus Supersberger [email protected]
Prof. Mohssen Massarrat [email protected]
2
Table of Contents:
Part I: Demand for Energy in the Business As Usual (BAU) Scenario
1. Introduction ............................................................................................ 12
1.1. Objectives ................................................................................................... 13
1.2. Methodology ............................................................................................... 13
1.3. Research Organization .............................................................................. 14
2. Economy and Energy in Iran; an Overview .......................................... 15
2.1. Macroeconomic Structure and Trends .................................................... 15
2.1.1. The Structure of the Economy ...................................................................... 16
2.1.2 Macroeconomic Trends .................................................................................. 18
2.2. An Overview of the Energy Sector ........................................................... 20
3. Energy Policies ...................................................................................... 26
3.1 Energy Subsidies ........................................................................................ 26
3.1.1 Energy Subsidies Objectives ......................................................................... 28
3.1.2 Energy Subsidies Problems ........................................................................... 29
3.1.3 Energy Price Reform ....................................................................................... 31
3.2 Oil Policy ...................................................................................................... 33
3.3. Natural Gas Development ........................................................................ 33
3.4. Electrification ............................................................................................ 34
3.5. Other Energy Policies ................................................................................ 35
3.6 Future Energy Policies ............................................................................... 35
4. Business as Usual (BAU) Scenario ...................................................... 36
4.1 Households .................................................................................................. 38
4.1.1. Oil Products and Natural Gas ........................................................................ 38
4.1.2. Electricity ......................................................................................................... 41
4.2. Industry ....................................................................................................... 49
4.3. Power Generating Plants .......................................................................... 54
4.4. Transport ..................................................................................................... 58

3
4.4.1. Passenger Transport ...................................................................................... 59
4.4.2 Freight Transport ............................................................................................ 61
4.5. Other Sectors ............................................................................................ 63
4.5.1. Public Sector ................................................................................................... 64
4.5.2. Commercial Sector ......................................................................................... 66
4.5.3. Agriculture ....................................................................................................... 69
5. Total Energy Demand ........................................................................... 72
5.1. Sectors ....................................................................................................... 72
5.2. Energy Type ................................................................................................ 76
5.3 Comparison with WEO ............................................................................... 77
5.4. Energy and Environment .......................................................................... 79
Part II: Scenario Analysis
6. Scenario I: High Efficiency ................................................................... 85
6.1. Households ................................................................................................ 86
6.2. Industry ....................................................................................................... 91
6.3. Transport ..................................................................................................... 96
6.4. Other Sectors ............................................................................................. 98
6.5. Total Energy Savings in High Efficiency Scenario ................................ 102
7. Scenario II: High Renewables ............................................................... 105
7.1. Wind power ................................................................................................. 105
7.2. Biomass ...................................................................................................... 106
7.3. Geothermal ................................................................................................. 106
7.4. Solar irradiation .......................................................................................... 108
7.5. Hydropower ................................................................................................ 109
7.6. Economic and Infrastructural Analysis ................................................... 111
7.6.1. Technical Data for MENA Region .................................................................. 111
7.6.2. Full Load Hours (FLH) .................................................................................... 111
7.6.3. Investment Costs ............................................................................................ 112
4
7.6.4. Time Scale and Dynamics ............................................................................. 114
7.7. Final Energy Demand in the High Renewables Scenario ...................... 115
7.7.1. Households ..................................................................................................... 116
7.7.2. Industry ............................................................................................................ 116
7.7.3. Transport ......................................................................................................... 116
7.7.4. Others ............................................................................................................. 116
8. Scenario III: Combined Scenario ......................................................... 118
9. Scenario IV: Constrained Scenario ...................................................... 119
10. A Comparison among Scenarios ....................................................... 121
10.1. Energy Intensity ....................................................................................... 126
11. Economic and Ecological Impacts of Scenarios ............................... 127
11.1. Economic Impacts ................................................................................... 127
11.2. Ecological Impacts ................................................................................. 135
References .................................................................................................. 146

5
List of Figures:
Part I: Demand for Energy in the Business As Usual (BAU) Scenario
Figure 2.1. GDP and its Components, Constant 1997 billion Rials ................... 18
Figure 2.2. Population (1000 persons) of Iran 2005 ............................................ 19
Figure 2.3. Energy Intensity in Iran, Constant 1997 prices ................................ 21
Figure 2.4. Energy Intensity, Iran and the world ................................................. 22
Figure 2.5. Primary Energy Supply And Final Consumption, mboe
(1974
2004) ............................................................................................................ 23
Figure 2.6. Petroleum Products Consumption by Sectors ................................ 23
Figure 2.7. Natural gas consumption by sectors (2004) ..................................... 25
Figure 2.8. Electricity Consumption by Sectors .................................................. 25
Figure 4.1. Household Demand for Oil Products, Natural Gas, and Solar
Energy -The BAU Scenario (2005-2030) ............................................................... 41
Figure 4.2. Residential demand for electricity- MkWh (2005-2030) ................... 48
Figure 4.3. Total energy demand by manufacturing industries, BAU
(2005-2030), mboe ................................................................................................... 54
Figure 4.4- Energy Demand by Road Transport, BAU Scenario (2005-2030),
Mboe ......................................................................................................................... 63
Figure 4.5. Demand for Energy In Public Sector, BAU Scenario (2005-2030) . 66
Figure 4.6. Demand for Energy in Commercial Sector (2005-2030) .................. 68
Figure 4.7. The Energy Demand In The Agriculture Sector, BAU Scenario
(2005-2030)- mboe ................................................................................................... 72
Figure 5.1- Total Primary Energy Demand by Sectors, BAU Scenario
(2005-2030) ............................................................................................................... 73
Figure 5.2- Demand for Electricity by Sectors in BAU Scenario (2005-2030) .. 74
Figure 5.3- The Shares of Demand for Energy by Sectors in BAU Scenario
(2005-2030) .............................................................................................................. 75
Figure 5.4
Total Primary Energy Demand by Energy Type, BAU Scenario
(2005-2030) ............................................................................................................... 77

6
Figure 5.5
Total Primary Energy Demand in WEO and Our Study, BAU Scenario
(2030) ........................................................................................................................ 78
Part II: Scenario Analysis
Figure 6.1 - Average Electricity Demand in BAU and Efficiency (EFF)
Scenarios (2005
2030)
kWh/Hh, year .............................................................. 88
Figure 6.2 - Household Energy Demand (Heat) in BAU and Efficiency
(EFF) Scenarios (2005-2030), mboe ..................................................................... 90
Figure 6.3 - The Final Energy Demand in Industry in the BAU and Efficiency
(EFF) Scenarios (2005-2030), mboe ..................................................................... 96
Figure 6.4 - Final Energy Demand in the Transport Sector under the BAU
and High-Efficiency (EFF) Scenarios (2005-2030), mboe ................................... 98
Figure 6.5 - Final Energy Demand in the Public Sector in BAU and High-Efficiency
EFF) Scenarios (2005-2030), mboe ....................................................................... 100
Figure 6.6
Final Energy Demand in the Commercial Sector in BAU and High
Efficiency (EFF) Scenarios (2005-2030), mboe .................................................... 101
Figure 6.7- Final Energy Demand in the Agriculture Sector in BAU and High
Efficiency EFF) Scenarios (2005-2030), mboe ..................................................... 102
Figure 6.8 - Total Final Energy Demand in BAU and Efficiency Scenarios
(2005-2030), mboe ................................................................................................... 103
Figure 6.9- Savings in Efficiency Scenario Compared with the BAU Scenario,
2030, (%) ................................................................................................................... 104
Figure 6.10 - The Energy Demand by Energy Types in BAU and High-Efficiency
Scenarios in 2030, mboe ...................................................................................... 104
Figure 7.1- Geothermal Resources in Iran, SUNA (1998) ................................... 107
Figure 7.2 - Investment Costs of Renewable Power Plants ............................... 113
Figure 7.3 - Electricity Costs by Renewable Energy Technologies .................. 114
Figure 7.4 - Total Primary Energy Demand in BAU and High Renewables
Scenarios, 205-2030, mboe .................................................................................... 117
Figure 8.1- Total Primary Energy Demand in Combined and BAU Scenarios
(2005-2030), mboe ................................................................................................... 118

7
Figure 9.1 - Total Primary Energy Demand in Constrained and BAU Scenarios
(2005-2030), mboe ................................................................................................... 121
Figure 10.1
Total Demand for Electricity by Sectors and Scenarios
(2005 & 2030), GWh ................................................................................................. 123
Figure 10.2
Electricity Generation by Sources in Alternative Scenarios,TWh 124
Figure 10.3 - A Summary of the Scenario Results (2005-2030), mboe ............. 125
Figure 10.4
Energy Intensity in Iran and World under Different Scenarios .. 126
Figure 11.1
The Potential Revenues Generated by Scenarios (2005-2030) .. 133
Figure 11.2 - CO2- Emissions in Alternative Scenarios (2005-2030) ................. 138
8
List of Tables:
Part I: Demand for Energy in the Business As Usual (BAU) Scenario
Table 2.1. Economic Indicators of Iran at a Glance, 2005 ................................. 19
Table 2.2. Energy production and use in Iran (2003) .......................................... 25
Table 3.1 - The Energy Subsidies by Sector and Energy Type, 2000(percent) 28
Table 4.1 GDP and Population Growth Assumptions in BAU Scenario ........... 37
Table 4.2 - The BAU Scenario Results for Household Demand for Oil Products,
Natural Gas and Solar Energy by Application (2005-2030) ................................ 40
Table 4.3- Household Electricity Demand, 2005 .................................................. 42
Table 4.4. The Penetration Rates of the Appliances Used by Iranian Households,
BAU Scenarios (2005-2030) ................................................................................... 43
Table 4.5. Average Electricity Consumption by Appliances .............................. 45
Table 4.6
Residential Demand for Electricity, BAU Scenario (2005-2030) ..... 47
Table 4.7- Total electricity consumption by appliances- BAU Scenario (2005-2030),
(MkWh) ...................................................................................................................... 49
Table 4.8
Manufacturing Industries Value Added and Energy Use (2005) ..... 51
Table 4.9
Energy Intensity in Manufacturing Industries- BAU Scenario
(2005-2030) ............................................................................................................... 52
Table 4.10
Manufacturing Industries Demand for Energy, BAU Scenario
(2001-2030), mboe ................................................................................................... 53
Table 4.11- Installed Capacities of Power Plants, 2005 ...................................... 55
Table 4.12. Total Electricity Generation in Iran, BAU Scenario (2005-2030) .... 56
Table 4.13. Electricity Generation by Renewable and Non Renewable Sources
(GWh)- BAU Scenario (2005-2030) ........................................................................ 57
Table 4.14
Energy Demand by Power Generating Plants, BAU Scenario
(2005-2030), GWh .................................................................................................... 58
Table 4.15. Passenger Transport Indicators
BAU Scenario (2005 - 2030) .... 61
Table 4.16 - Freight Transport Indicators
BAU Scenario (2005-2030) ........... 62
Table 4.17 - Final Energy Demand by Transport Sector- BAU Scenario

9
(2005-2030)
mboe ................................................................................................. 63
Table 4.18. Energy Consumption and Energy Intensity In The Public Sector . 64
Table 4.19- Public Sector Energy Demand, BAU Scenario (2005-2030), mboe65
Table 4.20. Energy Consumption and Energy Intensity in the Commercial Sector
(2004) ........................................................................................................................ 67
Table 4.21
Commercial Sector Energy Demand, BAU Scenario (2005-2030) 68
Table 4.22- Energy Consumption And Energy Intensity in Agriculture, 2004 69
Table 4.23. Energy Intensity in the Agriculture Sector (2004) .......................... 70
Table 4.24
Agriculture Demand for Energy (2005-2030)- mboe ...................... 71
Table 5.1
Total Primary Energy Demand in Iran by Sectors, BAU Scenario
(2005-2030) ............................................................................................................... 73
Table 5.2- Total Energy Demand by Type of Energy , BAU Scenario (2005-2030),
mboe ......................................................................................................................... 76
Table 5.3 - CO2 emissions From Primary Energy Consumption (2005-2030), Mt80
Part II: Scenario Analysis
Table 6.1
Energy Savings in Aluminium Manufacturing Industry .................. 92
Table 6.2
Energy Consumption in Selected Manufacturing Industries ......... 93
Table 6.3
Energy Savings in Selected Manufacturing Industries .................. 94
Table 6.4 - Energy Savings in Selected Buildings .............................................. 99
Table 7.1
Geothermal Potentials in Iran ........................................................... 108
Table 7.2 - Basic data on renewable energy potentials in Iran .......................... 110
Table 7.3- Summary of Economic Renewable Electricity Supply Potentials
in Iran, TWh/y ........................................................................................................... 110
Table 7.4 - Basic Parameters of Conventionally Fuelled And of Renewable
Energy Power Plants .............................................................................................. 111
Table 7.5 - Investment Costs of Renewable Energy Resources in US$/kW ..... 113
Table 10.1 - A Summary of the Scenario Results (2005-2030) ........................... 122
Table 11.1
Additional Revenues in Efficiency Scenario, 2005-2030 ............ 129
10
Table11.2
Additional Revenues in High Renewables Scenario, US 2007$,
2005-2030 ................................................................................................................ 130
Table11.3. Additional Revenues in Combined Scenario, US 2007$, 2005-2030 131
Table11.4. Additional Revenues in Constrained Scenario,US 2007$,2005-2030 132
Table 11.5 - CO2-Emissions in the BAU Scenario ............................................... 136
Table 11.6 - CO2-Emissions Reduction the Efficiency scenario ........................ 137
Table 11.7- CO2-Emissions Reduction in High Renewables Scenario ............. 137
Table 11.8 - CO2-Emissions Reduction in the Combined Scenario .................. 138
APPENDIX
Scenario Results Tables
Table A1: Scenario Overview BAU-Scenario, 2005
2030 ................................ 141
Table A2: Scenario Overview High Efficiency-Scenario, 2005
2030 .............. 142
Table A3: Scenario Overview Renewables-Scenario, 2005
2030 ................... 143
Table A4: Scenario Overview Combined Scenario, 2005
2030 ....................... 144
Table A5: Scenario Overview Constrained Scenario, 2005
2030 ................... 145

11
Part I
Demand for Energy:
Business As Usual Scenario

12
Part I: Demand for Energy in the Business As Usual
(BAU) Scenario
1. Introduction
Energy is becoming increasingly important in the world economy as demand is rapidly
rising and supply of hydrocarbon resources is more restricted. Iran is the largest country
in the Middle East and as an energy rich country, with 11 percent of the global oil
reserves, and 15.3 percent of the global natural gas reserves (second only to Russia). It
plays an important role in world energy supply and hence in the global economy.
However, Iran has had trouble in capitalizing on its vast resources. It has been
experiencing a rapid economic growth for the past two decades, leading to an increasing
trend in domestic demand for energy. Iran s generous subsidies program in the energy
sector has also contributed to growing energy consumption. Although higher energy
consumption may contribute to economic growth, it would restrict economic activities as
the oil exports shrink. The Iranian economy is heavily dependent on oil exports revenues
as oil exports account for half of the gross government revenues and about 80 percent
of the country s total exports earnings. On the supply side, Iran has not been able to
catch up with the increasing trend in demand leading to a shortage of energy in industry,
transport and residential sectors. Iran is now facing serious challenges in the economy
and the energy sector, imminent of which are price reforms by removing heavy subsidies
in the energy market and attracting foreign investments to boost its oil and natural gas
production and exports. Iran also needs to find a way on how to make optimal use of the

13
oil revenues in the economy and to invest in ample renewable energy sources. This
study intends to tackle some of these challenges and to explore alternative scenarios for
utilization of energy resources in Iran in the long run.
1.1. Objectives
The main objective of this study is to analyze alternative scenarios for the energy
consumption in Iran for the next 25 years. To this end, the study models the Iranian
energy sector and projects a Business As Usual (BAU) scenario taking into account the
past trends as well as the future policies and developments in the economy and the
energy sector. The study also identifies the potentials for sources of energy conservation
and renewable energy, and projects efficiency scenarios for the next 25 years. The
outcome of the study will help authorities set up policies to optimize the use of energy
and to protect environment without compromising the standard of living.
1.2. Methodology
The main method of the study is the bottom-up approach in which demand side
dynamics are modeled using a computational model and the detailed data from different
sectors of the economy. In some cases, where the time series data are available, the
regression method is also employed to estimate and forecast future values of the
variables. The model is first used to calculate a BAU scenario as a scenario that extends
the past trends of the economy and the energy sector into the future taking into account
the future policies. In the second part of the study, alternative scenarios for energy
demand with regard to obtaining higher efficiency and utilizing renewable sources are
designed and simulated for the next 25 years. The bottom-up method produces reliable

14
results in long term scenario analysis as it relies on the fundamental factors, which are
not subject to short-term fluctuations . The shortcoming of this approach is that its results
depend on many assumptions about the structure of the economy. However, making
sound assumptions and scenarios that are more realistic may help alleviate the problem.
1.3. Research Organization
The study has been conducted jointly by the Iran Energy Association (IEA) and the
Wuppertal Institute for Climate, Environment, and Energy (WI). To carry out the project,
two teams from each institute were organized in the following groups.
1. Steering Committee
2. Project Leader
3. Project Manager
4. Technical Manager
5. Study Team
6. Consultants
7. Research Assistants
8. Secretaries
The research team members met regularly in workshops to exchange the ideas and to
review the research method and outcomes. The study started in January 2006 and
ended in December 2008.

15
2. Economy and Energy in Iran; an Overview
In this section, the current conditions of the Iranian economy and its energy sector will be
briefly reviewed to set a ground for the BAU scenario analysis.
2.1. Macroeconomic Structure and Trends
2.1.1. The Structure of the Economy
Iran became Islamic Republic in 1979 after the ruling monarchy was overthrown by the
Islamic Revolution. The new constitution became effective on 2-3 December 1979, and
was revised in 1989 to expand powers of the presidency and eliminate the prime
ministership. The governing system consists of the Supreme Leader elected by the
Assembly of Experts, the Majlis (Shoura e Islami) or parliament, the judicial branch, and
the executive branch headed by the elected president.
In addition to the three major branches in the governing body, there are also
three oversight bodies as follows: Assembly of Experts, Expediency Council, and the
Council of Guardians. Assembly of Experts, a popularly elected body of 86 religious
scholars constitutionally charged with determining the succession of the Supreme
Leader (based on his qualifications in the field of jurisprudence and commitment to the
principles of the revolution, reviewing his performance, and deposing him if deemed
necessary). Expediency Council is a policy advisory and implementation board
consisting of permanent members, who represent all major government factions and
include the heads of the three branches of government, and the clerical members of the
Council of Guardians. The permanent members are appointed by the Supreme Leader
for five-year terms, and the temporary members, including Cabinet members and Majlis
committee chairmen, are selected when issues under their jurisdiction come before the
16
Expediency Council. The Expediency Council exerts supervisory authority over the
executive, judicial, and legislative branches and resolves legislative issues on which the
Majlis and the Council of Guardians disagree. Since 1989, it has also been used to
advise religious leader on matters of national policy. Council of Guardians of the
Constitution is a 12-member board made up of six clerics chosen by the Supreme
Leader and six jurists selected by the Majlis from a list of candidates recommended by
the judiciary, which in turn is controlled by the Supreme Leader, for six-year terms. This
Council determines whether proposed legislation is both constitutional and faithful to
Islamic law, vets candidates for suitability, and supervises national elections.
According to the article 44 of the constitution, the economy is divided in three
sectors: Public, Cooperative, and Private. The public sector is in charge of the public and
national institutions and enterprises such as the national oil and gas companies. The
cooperative corporations are supported by the public sector, but run privately.
There have been four Five-Year Development Plans (FYDP) since the beginning
of the Islamic Republic, the last of which started in 2004 calling for privatization and
economic reforms. There is also a 20-year vision calling for rapid socio-economic
development of the country.
2.1.2 Macroeconomic Trends
With an area of 1,648,000 km2 , Iran ranks 16th in size in the world. The main mountain
chain is the Zagros Mountains, a series of parallel ridges interspersed with plains that
bisect the country from northwest to southeast. The only navigable river is Karun, where
shallow-draft boats can commute from Khoramshahr to Ahvaz, a distance about 180 km.
The most important water bodies are the Persian Gulf, in the south, and the Caspian
Sea, in north. Iran has a very diverse climate. In the North West, winters are cold with
17
heavy snowfall and subfreezing temperatures. In the south, winters are mild and the
summers are very hot. In most part of Iran, the yearly precipitation averages 250 mm.
The major exceptions are the higher mountain valleys of the Zagros and the Caspian
Sea coastal plain, where precipitation averages at least 500 mm annually.
Iran s economy is a mixed economy in which oil and other large enterprises are
owned and run by the state, and agriculture, small-scale trading and service ventures
are mostly run by the private sector. In spite of diversification policies, the Iranian
economy is still heavily dependent on oil exports earnings. Currently, oil exports account
for 80 percent of total exports earnings; nearly 50 percent of the government revenue
and 23 percent of GDP. Continued favorable conditions in the world oil market have
improved the external financial conditions quite considerably. However, the challenge
still remains to make the best use of oil revenues, to promote growth and to further
diversify the economy. Despite relatively high oil exports revenues, Iran continues to
face budgetary pressure. Poverty reduction and heavy subsidy content of budget for
basic goods and energy leave the government with inadequate resources for
development purposes. Inefficient public sector, state monopolies, and economic
sanctions also add more budgetary constrains. Diversification of the economy and
energy-related activities require the creation of a more favorable investment environment
for both local and foreign investors.
GDP grew annually by 6.15 percent on average in 2001-2004, but slowed down
by about 1 percentage point since then. Although the recent economic growth rates are
relatively high, thanks to the high oil prices, they are lower than the government targets
under the third and the fourth five-year development plans. The estimated GDP for 2006
is US $599.2 billion(purchasing power parity), ranking 22nd in the world, but GDP per
18
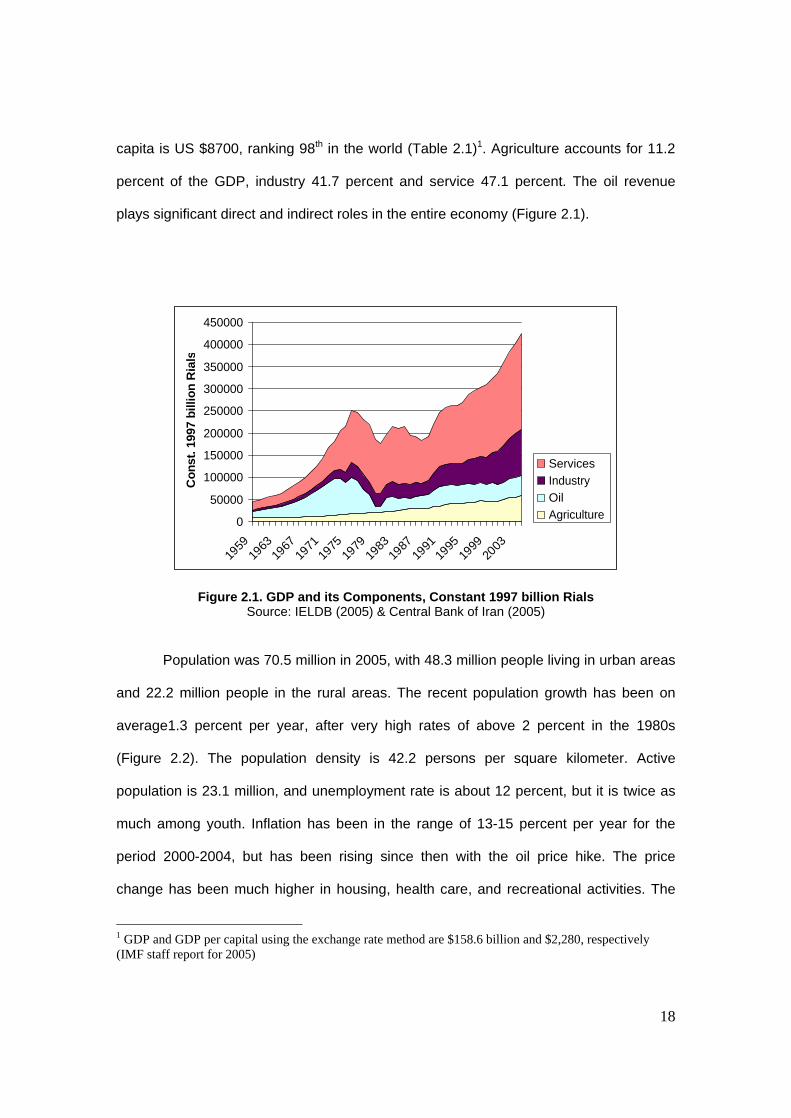
capita is US $8700, ranking 98th in the world (Table 2.1)1. Agriculture accounts for 11.2
percent of the GDP, industry 41.7 percent and service 47.1 percent. The oil revenue
plays significant direct and indirect roles in the entire economy (Figure 2.1).
0
50000
100000
150000
200000
250000
300000
350000
400000
450000
1959
1963
1967
1971
1975
1979
1983
1987
1991
1995
1999
2003
Con
st. 1
997
bi
llion
Ria
ls
ServicesIndustryOilAgriculture
Figure 2.1. GDP and its Components, Constant 1997 billion Rials Source: IELDB (2005) & Central Bank of Iran (2005)
Population was 70.5 million in 2005, with 48.3 million people living in urban areas
and 22.2 million people in the rural areas. The recent population growth has been on
average1.3 percent per year, after very high rates of above 2 percent in the 1980s
(Figure 2.2). The population density is 42.2 persons per square kilometer. Active
population is 23.1 million, and unemployment rate is about 12 percent, but it is twice as
much among youth. Inflation has been in the range of 13-15 percent per year for the
period 2000-2004, but has been rising since then with the oil price hike. The price
change has been much higher in housing, health care, and recreational activities. The
1 GDP and GDP per capital using the exchange rate method are $158.6 billion and $2,280, respectively (IMF staff report for 2005)

19
current account balance is about US $12 billion and the trade balance about US $15
billion. The total external debt amounts to about US $24 billion. Iran exports petroleum
(80 percent), chemical and petrochemical produces, fruits and nuts, and carpets to
Japan (17%), China (11.2%), Italy (6%), South Korea (6%), Turkey (6%), Netherlands
(4.6%), France (4.4%), South Africa (4.1%), and Taiwan (4.1%). The imports consist of
industrial raw materials and intermediate goods, capital goods, foodstuffs and other
consumer goods, technical services, and military supplies. Iran imports from Germany
(13.9%), UAE (8.4%), China (8.3%), Italy (7.1%), France (6.3%), South Korea (5.4%),
and Russia (4.9%).
20000
30000
40000
50000
60000
70000
80000
1974
- 7
5
1976
- 7
7
1978
- 7
9
1980
- 8
1
1982
- 8
3
1984
- 8
5
1986
- 8
7
1988
- 8
9
1990
- 9
1
1992
- 9
3
1994
- 9
5
1996
- 9
7
1998
- 9
9
2000
- 0
1
2002
- 0
3
2004
- 0
5
Figure 2.2. Population (1000 persons) of Iran 2005 Source: IELDB 2005
20
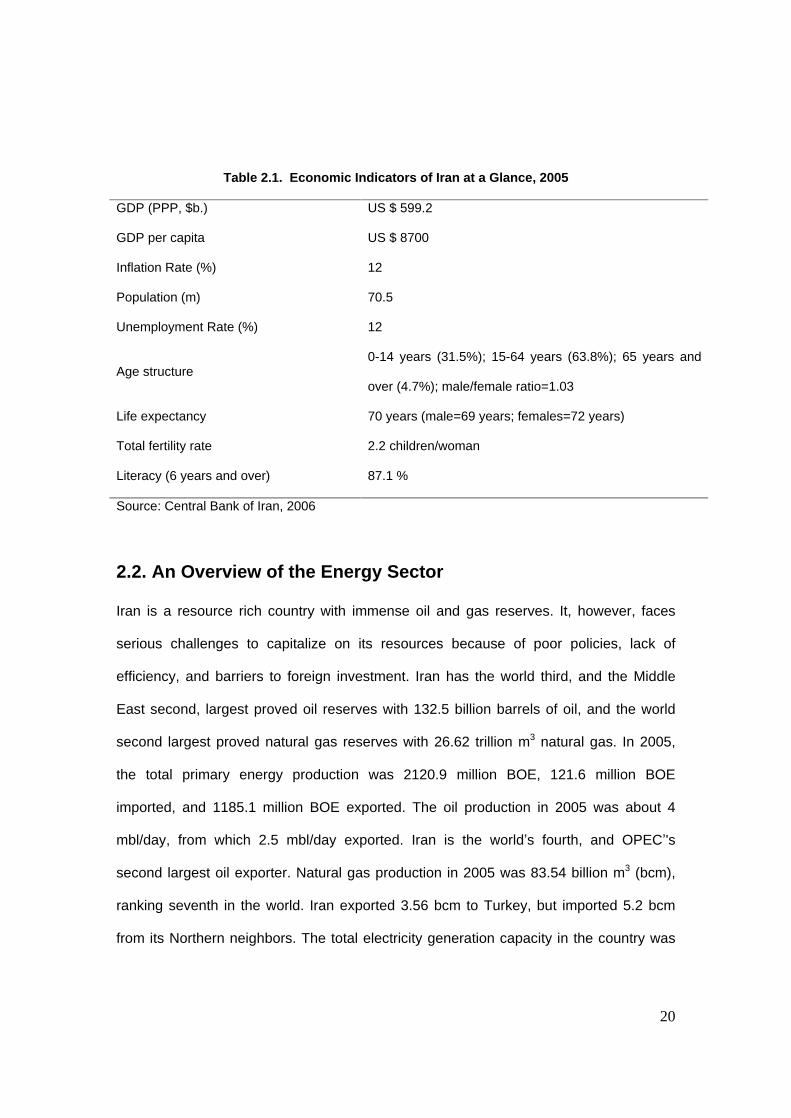
Table 2.1. Economic Indicators of Iran at a Glance, 2005
GDP (PPP, $b.) US $ 599.2
GDP per capita US $ 8700
Inflation Rate (%) 12
Population (m) 70.5
Unemployment Rate (%) 12
Age structure 0-14 years (31.5%); 15-64 years (63.8%); 65 years and
over (4.7%); male/female ratio=1.03
Life expectancy 70 years (male=69 years; females=72 years)
Total fertility rate 2.2 children/woman
Literacy (6 years and over) 87.1 %
Source: Central Bank of Iran, 2006
2.2. An Overview of the Energy Sector
Iran is a resource rich country with immense oil and gas reserves. It, however, faces
serious challenges to capitalize on its resources because of poor policies, lack of
efficiency, and barriers to foreign investment. Iran has the world third, and the Middle
East second, largest proved oil reserves with 132.5 billion barrels of oil, and the world
second largest proved natural gas reserves with 26.62 trillion m3 natural gas. In 2005,
the total primary energy production was 2120.9 million BOE, 121.6 million BOE
imported, and 1185.1 million BOE exported. The oil production in 2005 was about 4
mbl/day, from which 2.5 mbl/day exported. Iran is the world s fourth, and OPEC 's
second largest oil exporter. Natural gas production in 2005 was 83.54 billion m3 (bcm),
ranking seventh in the world. Iran exported 3.56 bcm to Turkey, but imported 5.2 bcm
from its Northern neighbors. The total electricity generation capacity in the country was

21
37.3 GW, out of which 40.8 percent generated by steam, 44.3 percent by combined
cycles, 13.4 percent by hydro, and 1.5 percent by renewable energy sources (wind,
solar, and others). The electricity production in 2005 was 186 billion kWh, ranking 21st in
the world.
0
1
2
3
4
1974
- 7
5
1976
- 7
7
1978
- 7
9
1980
- 8
1
1982
- 8
3
1984
- 8
5
1986
- 8
7
1988
- 8
9
1990
- 9
1
1992
- 9
3
1994
- 9
5
1996
- 9
7
1998
- 9
9
2000
- 0
1
2002
- 0
3
2004
- 0
5
Bar
rels
Per
Mill
ion
Ria
ls
Figure 2.3. Energy Intensity in Iran, Constant 1997 prices Source: Energy Balance, 2005
The total primary energy consumption in 2005 was 970 million boe. The
share of households of the total primary energy consumption was 27 percent,
industry 14 percent, transport 22 percent, others including agriculture, public, and
commercial 9 percent, and power generating plants 28 percent. The higher shares
of energy consumption by transport and households are somewhat consistent with the
energy subsidies received by these sectors from the government. Transport received 42
percent of the energy subsidies, household 30 percent, and industry 13.5 percent.

22
The energy consumption indicators and efficiency measures in the past decades
show an increasing trend of energy consumption as well as high level of inefficiency. The
energy use per capita has been increasing on average by 5 percent annually for the past
38 years. However, the energy intensity index has been increasing on average by 3.4
percent since 1967 indicating a decreasing trend in efficiency of energy use (Figure 2.3).
In Figure 2.4 the energy intensity in Iran is compared to that in the rest of the world. The
energy intensity in Iran is as high as in the whole Middle East region, but twice as high
as the world average. Figure (2.5) shows the primary energy supply and final
consumption, and Table (2.2) summarizes the major energy production and use figures
for Iran.
Figure 2.4. Energy Intensity, Iran and the world Source: IEA, International Energy Agency, Energy Balances for OECD and Non OECD
Countries, 2002, 03 and 2005 Edition.
2005. The primary energy supply and final consumption have been increasing smoothly
during the 70s and the early 80s, but the rates of increase have risen since then. Figures
2.6, 2.7 and 2.8 show the consumption of oil products, natural gas, and electricity by
different sectors. Transport is the major user of oil products followed by households and
Energy Intensity (tboe/$1000, PPP)
0.00
0.05
0.10
0.15
0.20
0.25
0.30
OECD US Asia Africa MiddleEast
Iran World
Energy Intensity (tboe / US $ 1000, PPP)

23
industry. Households and Industry are also two major users of the natural gas and
electricity. The energy factor, defined as the ratio of the final use growth to the GDP
growth, in Iran is also very high compared to the world; It has been on average 1.27 in
Iran compared to 0.41 in the world for the period 1990-2003.
Figure 2.5. Primary Energy Supply And Final Consumption, mboe (1974
2004) Source: Energy Balance, Ministry of Energy, 2005
Figure 2.6. Petroleum Products Consumption by Sectors Source: Energy Balance, Ministry of Energy, 2005
0
50
100
150
200
250
300
350
400
450
1974
- 7
5
1976
- 7
7
1978
- 7
9
1980
- 8
1
1982
- 8
3
1984
- 8
5
1986
- 8
7
1988
- 8
9
1990
- 9
1
1992
- 9
3
1994
- 9
5
1996
- 9
7
1998
- 9
9
2000
- 0
1
2002
- 0
3
2004
- 0
5
Mb
oe
Residential & Commercial Industry Transport Agriculture Non Energy Uses
mb
oem
bo
e
0
400
800
1200
1600
2000
1974
- 7
5
1976
- 7
7
1978
- 7
9
1980
- 8
1
1982
- 8
3
1984
- 8
5
1986
- 8
7
1988
- 8
9
1990
- 9
1
1992
- 9
3
1994
- 9
5
1996
- 9
7
1998
- 9
9
2000
- 0
1
2002
- 0
3
2004
- 0
5
Mb
oe
Final Consumption Primary Energy Supply
mb
oem
bo
e
24
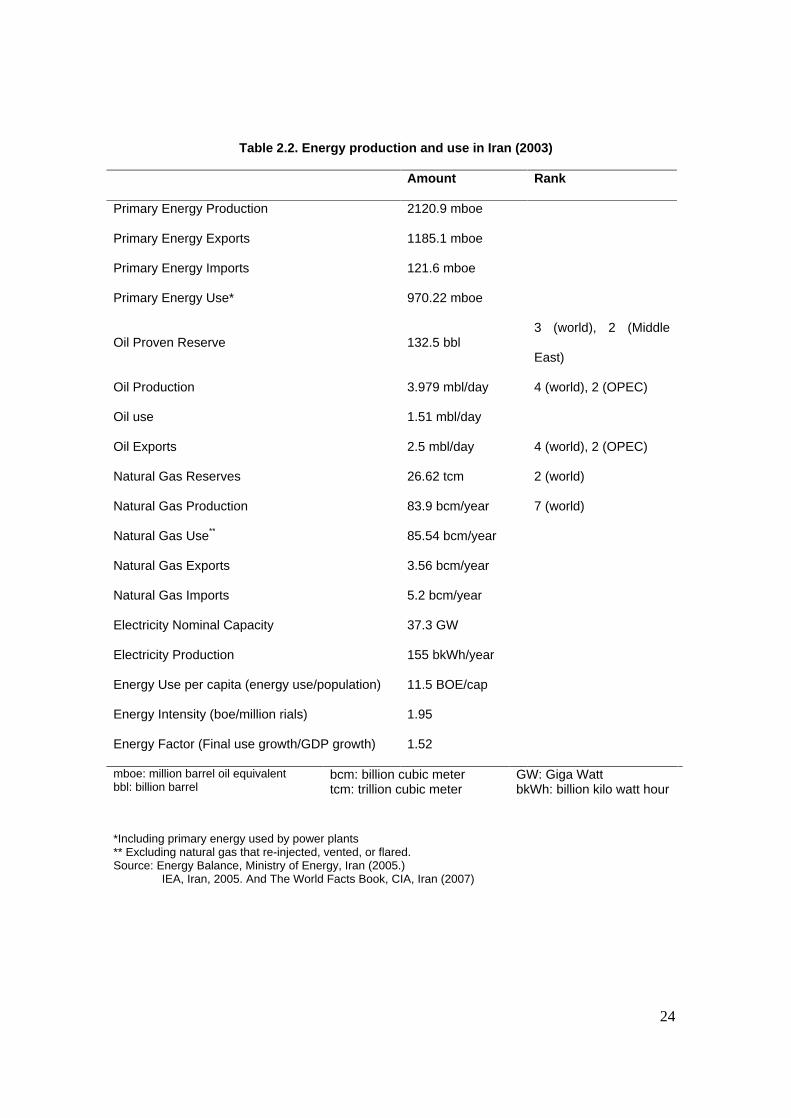
Table 2.2. Energy production and use in Iran (2003)
Amount Rank
Primary Energy Production 2120.9 mboe
Primary Energy Exports 1185.1 mboe
Primary Energy Imports 121.6 mboe
Primary Energy Use* 970.22 mboe
Oil Proven Reserve 132.5 bbl 3 (world), 2 (Middle
East)
Oil Production 3.979 mbl/day 4 (world), 2 (OPEC)
Oil use 1.51 mbl/day
Oil Exports 2.5 mbl/day 4 (world), 2 (OPEC)
Natural Gas Reserves 26.62 tcm 2 (world)
Natural Gas Production 83.9 bcm/year 7 (world)
Natural Gas Use**
85.54 bcm/year
Natural Gas Exports 3.56 bcm/year
Natural Gas Imports 5.2 bcm/year
Electricity Nominal Capacity 37.3 GW
Electricity Production 155 bkWh/year
Energy Use per capita (energy use/population) 11.5 BOE/cap
Energy Intensity (boe/million rials) 1.95
Energy Factor (Final use growth/GDP growth) 1.52
mboe: million barrel oil equivalent bbl: billion barrel
bcm: billion cubic meter tcm: trillion cubic meter
GW: Giga Watt bkWh: billion kilo watt hour
*Including primary energy used by power plants ** Excluding natural gas that re-injected, vented, or flared. Source: Energy Balance, Ministry of Energy, Iran (2005.)
IEA, Iran, 2005. And The World Facts Book, CIA, Iran (2007)

25
Figure 2.7. Natural gas consumption by sectors (2004)
Source: Energy Balance, Ministry of Energy, 2005
Figure 2.8. Electricity Consumption by Sectors
Source: Energy Balance, Ministry of Energy, 2005
0
50
100
150
200
250
300
35019
74 -
75
1976
- 77
1978
- 79
1980
- 81
1982
- 83
1984
- 85
1986
- 87
1988
- 89
1990
- 91
1992
- 93
1994
- 95
1996
- 97
1998
- 99
2000
- 01
2002
- 03
2004
- 05
Mboe
Residential & Commercial Industry Non Energy Uses Transport
mboe
0
10
20
30
40
50
60
70
80
1974
- 75
1976
- 77
1978
- 79
1980
- 81
1982
- 83
1984
- 85
1986
- 87
1988
- 89
1990
- 91
1992
- 93
1994
- 95
1996
- 97
1998
- 99
2000
- 01
2002
- 03
2004
- 05
Mb
oe
Residential & Commercial Industry Transport Agricultural Others
mb
oem
bo
e

26
3. Energy Policies
Iran s vast energy resources along with inappropriate policies have led to an increasing
consumption of energy without much being concerned about efficiency and the adverse
effects on environment. As figures 2.3 and 2.4 show, the energy intensity in Iran has
been increasing and is almost twice as much as world average. Although Iran has not
had any comprehensive plan for energy, it has embarked some short run and medium
run plans for energy production and consumption in different sectors. We can identify
four main policies that have influenced demand for energy for the past three decades.
The first and by far the most important energy policy in Iran has been the heavy
subsidization of energy use, especially in households and transport sectors. The second
policy is meeting the OPEC production quota. Third policy is development and utilization
of natural gas, and the fourth policy electrification of the rural areas. Here, we briefly
outline the objectives and the outcomes of these policies.
3.1 Energy Subsidies
There are many different estimates for energy subsidies in Iran, but it is generally agreed
that the Iran s energy subsidies are one of the highest in the world. It ranges between
0.5 to 12 percent of GDP depending on different sources. The huge discrepancies in the
estimations of subsidies arise from different calculation methods used to estimate supply
cost. The local officials use the strict version of subsidies that includes only the direct
payments by government or a difference between marginal or average cost and the price
paid by consumers. However, the agencies that report much higher estimates of
subsidies include opportunity costs of energy products sales in the domestic market.
These estimates compare domestic prices with the border prices and assess the

27
differences as opportunity costs of forgone revenues and therefore as subsidies. The
government estimation of subsidies is more relevant to the government budget
accounting; however, the broader estimation of subsidies is more appropriate for policy
making where the objectives are optimal use of resources and increasing social welfare.
In OECD countries, governments subsidize energy producers and levies taxes on
end-user consumers. The taxes, however, far exceed subsidies; It was $223 billion in
seven largest OECD countries in 2003- at least seven times more than the total amount
of energy subsidies for the OECD as a whole. In recent yeas, the shares of subsidies by
types of energy have changed in favour of renewable energy production. This policy is in
line with the objectives of energy security by lowering reliance on oil imports and
protecting environment by lowering consumption of fuel oil or coal and encouraging
environmentally friendlier energy sources. In non-OECD countries, except China, most
energy subsidies go to consumers by controlling end-user prices below the economic
cost of supply. Most non-OECD countries subsidize electricity, but Iran and Indonesia
heavily subsidize oil (IEA, 2006). Table (3.1) shows that transport receives about one
third of the total energy subsidies, and household and industry each receive one quarter
of the energy subsidies. The distribution of subsidies by energy type also shows that gas
oil receives highest share of energy subsidy followed by electricity and gasoline. Since
the subsidies are calculated based on the border prices, its distribution among energy
types changes as the prices for different types of energy vary. For instance, it is
expected that the share of gasoline and natural gas should be higher as their recent
prices have been increasing more rapidly.

28
Table 3.1 - The Energy Subsidies by Sector and Energy Type, 2000 (percent)
Household Industry
Agriculture
Transport Commercial Others Total
Gasoline - 0.1 0.0 17.6 0.0 0.1 17.8
Kerosene 7.5 0.0 0.2 - 0.1 0.2 8.2
Gas oil 1.3 3.8 4.2 15.0 0.6 1.4 26.3
Heavy Fuel Oil - 9.9 0.1 0.6 1.2 0.2 11.9
LPG 2.6 0.0 - 0.4 0.2 - 3.1
Electricity 10 8 3.3 - 1.1 3.4 25.7
Natural Gas 4 2.5 - - 0.5 - 7
Total 25.4 24.4 7.8 33.5 3.6 5.3 100
Source: Ministry of Energy, 2001
3.1.1 Energy Subsidies Objectives
There are two main objectives in providing huge energy subsidies in developing
countries like Iran. First, subsidies tend to make energy more affordable for poor
households who would otherwise be unable to pay the full economic cost. Second, they
tend to protect domestic producers against foreign competition by keeping the energy
cost low. Unfortunately, those subsidies and their sectoral allocation fail to achieve their
objectives. They mainly benefit higher income groups because they consume larger
amounts of subsidized energy. This is particularly true in oil products, because of a flat
price for all levels of consumption, and in transport sector, where the distribution of car
ownership is very uneven.

29
The second objective, which is known as industrialization or infant industry policy
in economic development, may work if there is a scheduled and careful plan to invest in
certain industries that would benefit economic growth in the long run. The protection
policy in Iran has continued for more than three decades, which shows that the protected
industries have never grown up to be competitive in the global market. The long run
policy of providing cheap energy to industry has led to an inefficient use of energy and a
condition in which there is no incentive to improve technology and to innovate. It is
evident that the policy of heavy subsidization of industry cannot continue further as Iran
is seeking membership in the World Trade Organization.
3.1.2 Energy Subsidies Problems
The continuous energy subsidies program in Iran has caused many economic
and social problems some of which are listed below.
i. Higher energy consumption and waste
ii. Weakening incentives for innovation and using more efficient
technologies
iii. Degrading environment by lowering quality of air in urban areas1
iv. Placing a heavy burden on government budget, contributing to budget
deficit by increasing direct payments as well as foregone income through
higher oil exports2
v. Cross-border smuggling of oil products to neighboring countries
1 The fuel oil subsidies may have positive effect on environment if it discourages the deforestation in the rural areas. The size of this subsidy, however, would be very small given the small rural population and their low consumption level. 2 OPEC quotas are for total production not exports. Therefore, Iran can always export more oil and earn foreign income without violating its quota, should its domestic consumption reduces.

30
vi. Exacerbating the unfair distribution of income by allocating more
subsidies to rich
Although government has raised the energy prices for the past 15 years, the real energy
prices have decreased because of higher inflation rates. Since the start of the third
FYDP, energy prices have risen on average by only 10 percent per year, but the
average inflation rate in this period has been well above 10 percent. The fourth FYDP
called for a more aggressive measure to reform the energy market, that is, to increase
the gasoline prices to the border prices. However, the new elected government and
parliament did not implement the plan and froze the fuel prices in 2006 and 2007.
The subsidy problem is more prominent in the case of gasoline consumption,
which receives one third of the total energy subsidies. Gasoline is sold below the market
price at around 10 cents per liter, which is about one fourth of the border price and about
one fifteenth of the European prices. The very low price of gasoline has encouraged high
level of gasoline consumption in large urban areas, especially in Tehran. The growth rate
of gasoline consumption has averaged 10 percent annually over the period 2001-2007. It
has also led to a high concentration of air pollutants along with other social and
economic problems. In response to a rapid growth in gasoline consumption, government
drew on the Oil Reserve Fund to import about 40 percent of domestic consumption in
2007. Iran is now the second biggest gasoline importer in the world after United States.
In June 2007, government instituted a gasoline rationing system to curb the rapidly
growing consumption. In the new system, each private passenger car would receive 30
liters gasoline per month at the fixed price of $1000 rials or about US 11 cents per liter.
The rationing scheme did not have any significant effect on domestic consumption, but it
apparently reduced the amount of gasoline smuggled to the neighboring countries.

31
3.1.3 Energy Price Reform
It is evident that the current subsidy program in the energy sector cannot continue mainly
because government has to cut oil exports in response to the growing domestic demand.
This will have a dramatic negative effect on government budget causing macroeconomic
instability and uncertainties. However, government is faced with many difficult issues
regarding the price reform policy. These issues include the question of what type of
energy subsidies should be removed, by how much and how. Moreover, the
macroeconomic impacts of price reform on inflation, unemployment, and balance of
payment are not very clear. Government also needs to have a plan on how to spend the
additional revenues that will be generated by removing subsidies. The plan should
identify the more vulnerable social groups who would suffer the most under the price
reform scheme, and lay out the details on how to compensate for their loss of income.
Removing energy subsidies will have strong effects on prices, exchange rates,
trade, and cost of living. Consumers will have to pay higher prices for energy goods
(electricity, gas, gasoline) and non-energy goods whose prices will increase to offset the
increase in their energy costs and the other inputs whose costs in turn will be affected by
energy price rises. While the impact of price rise on energy goods will be immediate, the
impact on non-energy goods will take time. Unfortunately, the inflationary effect of
energy price reform has been exaggerated leading to an unsubstantiated fear among
policy makers. A rise in energy prices will not have a continuous inflationary effect, since
it will increase the aggregate price level in the short-term, but inflation rate will return to
its past trend after the economy adjusts to its new equilibrium level. In fact, the
experiences of energy price reform in some developing countries suggest that inflation
rate may even be lower after the reform. For instance, while a rise in diesel and
kerosene prices in Indonesia and Turkey led to higher inflation rates by 0.6 and 16

32
percent, the inflation rates in Malaysia and Zimbabwe were lower by 80 percent and 40
percent, respectively, after two year of price change1. A study by World Bank estimates
that if energy prices in Iran rise to the border prices, inflation rate would rise by 40
percent in one year, and would remain the same afterward.2 The higher energy prices
will decrease the energy consumption by household, as they will use energy more
efficiently. The change in cost of living will vary in different income groups depending on
their expenditure patterns as well as price and income elasticities of demand and energy
elasticity of output. Government can return the additional revenues generated by
removing subsidies to households. Therefore, the total spending of households is
expected to rise.
Rising energy prices will also increase the relative costs of energy intensive
industries. This will likely lead to a change in trade pattern as Iran will import more goods
that use energy intensively, and will export more oil. Exporting more oil will increase
foreign reserves leading to an appreciation of the Rial that in turn will decrease exports
and increase imports. This will have an adverse effect on domestic industries and non-
traditional exports, similar to Dutch disease effect, which usually occurs in oil exporting
countries when they receive a huge windfall after a boom in the world oil prices.
Energy price reform in is inevitable in Iran, but it may have striking adverse
economic and social impacts, should it not be done properly. Therefore, it is imperative
to study all various effects using economic models that take into account all different
sectors of the economy and would analyze alternative scenarios. The outcome of such
detailed studies would help policy makers to foresee the potential benefits and
1 Einar Hope and Blabir Singh (1995), Energy Price Increases in Developing Countries: Case Studies of Colombia, Ghana, Indonesia, Malaysia, Turkey, and Zimbabwe, Policy Research Working Paper, 1442, World Bank. 2 Iran Medium Term Framework for Transition, Converting Oil Wealth to Development, A Country Economic Memorandum (2003), Report No. 25848-IRN, Social and Economic Development Group, Middle East and North Africa Region

33
challenges and thus design appropriate policies that would capitalize on advantages and
alleviate the adverse effects.
3.2 Oil Policy
Iran is a member of OPEC and is currently the second largest producer among OPEC
members after Saudi Arabia. Iran has maintained its production quota in OPEC, but has
cut its exports due to higher domestic consumption. Iran has recognized the importance
of foreign investment in the oil sector in order to expand new fields and increase the
recovery factor in the existing fields. Under the constitution, foreign companies are not
allowed to own Iranian natural resources, but Iran has offered a buy-back contract to
foreign investors. This new form of contract allows foreign companies to invest in oil and
gas fields and to share revenues with the Iranian counterparts. Through this new
mechanism, many international oil and gas companies, except US companies that are
banned from investing in Iran by the US sanction law, have participated in exploration
and development of the Iranian oil and gas fields.
Iran s main policy in the oil sector can be summarized as follows.
- Meeting the OPEC production quota
- Encouraging foreign investment
- Substituting natural gas for oil products in all sectors to free up oil for exports
3.3. Natural Gas Development
The third important of the government energy policy in Iran in the past three decades is
the development of natural gas fields. This policy gained momentum when Iran
discovered its share of the world largest gas reservoir in the Persian Gulf, i.e, the South
Pars field. Iran has been using the large share of its ever-increasing gas production to

34
substitute natural gas for domestic consumption of oil products in different sectors.
Producing natural gas is relatively cheap and its export to the world market is restricted
only to neighboring countries. Therefore, the policy of gas substitution has freed up oil
for exports generating more revenues for the government. In addition, since natural gas
is more environmentally friendly, its use for the domestic consumption would help reduce
pollution. Although the lower price for natural gas has made the substitution policy
between oil products and natural gas successful, the problem of inefficient use of
energy, especially in the residential sector, remains.
Iran has also increased its use of natural gas for injecting it into oil fields. This
policy has two positive effects. First, it would lead to a higher production of oil as the
recovery factor of oil fields will increase. Second, it will save the injected natural gas for
future extraction. Iran has also involved in natural gas international trade, by importing
from northern neighbors and exporting to Turkey through a pipeline. Iran is now a net
importer of natural gas, but it is expected to become a major net exporter in future. There
are different projects such as exporting natural gas to India through Pakistan, and to
Europe through Turkey and other Eastern European countries.
3.4. Electrification
The fourth energy policy is the electrification of rural areas by investing in new
transmission lines to reach remote areas and by keeping the electricity price very low;
more than 40 percent below the border prices. The policy that started in the 1980 s has
led many rural areas to be connected to the national electricity grid and changed the
energy consumption and living conditions in those areas. The policy continues by
encouraging rural residents to substitute electricity for oil products in cases like motor
pumps.

35
3.5. Other Energy Policies
Some other important policies in the energy sector can be listed as follows.
1. Ministry of Energy has established two organizations for studying and promoting
investment in renewable energy resources: Iran Energy Efficiency Organization
(SABA) in 1994 and Iran Renewable Energy Organization (SUNA) in 1995.
These two institutes have conducted some projects on wind, solar, and
geothermal energy resources in different parts of Iran, but their activities remain
insignificant compared to the level of energy consumption in the country.
2. Ministry of Oil established the Iran Fuel Conservation Organization (IFCO) in
2000 to study and invest in energy efficiency in different sectors. IFCO has
audited some manufacturing industries and made recommendations for energy
conservation in those units. Replacing very inefficient and pollutant old cars with
new cars in large cities and using CNG as a substitute for gasoline are some of
the projects undertaken by IFCO in recent years.
3. Iran has attempted to develop nuclear energy by completing the Bushehr nuclear
plant and making investment in other new plants. It is expected that these plants
will deliver at least 1000 MW electricity capacity by 2010.
3.6 Future Energy Policies
Some of the policies outlined above such as gasification are expected to continue, but
the energy pricing and the energy subsidy policies seem to have reached the endpoint
and are to change. The policy makers are now facing the huge energy demand which
puts an enormous pressure on the oil dependent government budget. Fortunately, there
is an understanding on the authorities side that the current pricing policy and the full

36
control of the energy sector is not sustainable, although the remedies are not so clear.
Government is also determined to produce part of the energy by nuclear plants, but its
share of the total energy used in the country is not expected to be very significant. There
are also discussions and some preliminary projects on the renewable sources which are
expected to continue and even gain momentum in the future.
4. Business as Usual (BAU) Scenario
In this section, we model the energy consumption in different sectors of the economy as
a business as usual (BAU) scenario for the period 2005-2030. The economic sectors
included in this study are households, industry, transport, and others consisting of
agriculture, commercial and public sectors. We also study the energy consumption and
production of the power generating plants. We model the energy consumption behaviour
in each sector by estimating and finding a pattern in consumption indicators such as
energy intensity. The BAU scenario describes a consumption path that can be
characterized as development of demand if no far-reaching changes in consumption
patterns are made. Therefore, it assumes that the economy and the energy sector will
follow the past trends. It also takes into account the new developments in the economy
based on patterns of the world economic growth as well as policies outlined in the Five-
Year-Development-Plan (FYDP) and the Vision approved by the authorities. Specifically,
it assumes that GDP and population as two major determinants of energy demand will
grow 5.5 percent and 1.3 percent until 2010, 3.4 percent and 1.4 percent until 2020, and
3 percent and 0.9 percent until 2030, respectively (see Table 4.1). The assumptions on
GDP and population growth are consistent with those of the past trends as well as the
national plans and the major international agencies
predictions about the Iranian
economy.

37
Table 4.1 GDP and Population Growth Assumptions in BAU Scenario
% per year 2005-2010 2011-2020 2021-230
GDP growth 5.5 3.4 3
Population growth 1.3 1.4 0.9
Our methodology in calculating the future energy demand in Iran in the BAU
scenario is summarized as follows. We first review the historical pattern of the energy
use and identify the major drivers of demand in each sector. We then apply the BAU
assumptions to project the future energy demand. We have used all the available
information about the current and the future policies and plans with respect to structure
of the economy and, in particular, the energy sector. We have applied both
computational or bottom-up approach as well as econometrics methods to estimate the
effects of the major factors affecting energy demand and to forecast its future values. In
some cases, such as transport and natural gas, the relationship between the energy
demand and its major drivers is estimated using econometric methods. In other cases,
such as electricity, where survey data were available, the computational approach has
been used.
4.1 Households
Households are one of the major energy users in Iran accounting for about 40 percent of
the total final energy consumption. Specifically, households use about 20 percent of the
total oil products, 63 percent of natural gas, and 33 percent of total electricity
consumption. The household energy consumption pattern has changed markedly since
1990 because of government s policy of substituting natural gas for oil products. The

38
households consumption of oil products has increased on average by about half a
percent annually, but the consumption of natural gas and electricity have increased by
19 percent and 6 percent per year for the past 15 years, respectively.
We study household demand for energy in two separate sections: Heat and
electricity. In the heat section, we model the demand for oil products and natural gas
using aggregate data. In the electricity section, we model the demand for electricity using
micro level data on appliances used by households.
4.1.1. Oil Products and Natural Gas
Natural gas is now a major energy carrier in the residential sector. In 2005, the Iranian
households used about 63 mboe oil products such as gas oil and LPG, and about 197
mboe natural gas. According to the National Iranian Gas Company (NIGC), 7.5 million
households had access to natural gas in 2004, which is projected to grow on average by
about 3 percent annually until 2025. This means that every year about 33000 new
households will join the natural gas grid. We estimate the relationship between the
demand for oil and gas and its drivers using a regression equation. Households demand
for oil and gas is assumed to grow with population and income. The estimation results of
the regression equation show that both GDP and population are significant factors in
explaining the changes in demand for oil and gas by household. The population effect
with a coefficient of 4, however, is much stronger than GDP effect with a coefficient of
0.0005. The future demand for oil and gas by households is projected by using the
regression equation results and the assumptions on the future values of GDP and
population. Using the estimated values for the future demand and the future shares of
each energy type based on the existing and the future government policies, we
breakdown the results into demand for kerosene, gas oil, LPG, and natural gas. One of

39
the key factors in estimating the future shares of energy types in household demand for
oil and natural gas is the government policy to increase the share of the natural gas in
the household energy basket from 79 percent to 95 percent. Based on this policy, the
shares of kerosene, gas oil, and LPG are assumed to decrease from 16, 2.6, and 2.7
percent in 2005 to 2, 2, and 1 percent in 2030, respectively.
The use of oil and natural gas by households is broken down to space heating,
cooking, and water heating. It is assumed that 100 percent of kerosene is used for
cooking, 80 percent of gas oil for space heating and 20 percent for water heating, and 50
percent of LPG for cooking and another 50 percent for water heating. The shares of
space heating, cooking, and water heating in natural gas consumption by household are
assumed to be 75, 10, and 15 percent, respectively. These shares of consumption types
are assumed to remain the same during the study period. It is also assumed that
households will start to use solar energy as much as 1 percent of their oil and gas
consumption by 2010. The share of solar energy is assumed to grow to 5 percent in
2030. Table (4.2) shows the BAU scenario for household consumption of oil products,
natural gas and solar energy in different types of their use. According to the results,
household demand for kerosene and LPG will decline on average by 5 percent and 0.7
percent per year, respectively, while the gas oil and natural gas demand will increase by
2.1 and 4.3 percent over the period 2005-2030, respectively. The demand for solar
energy will rise on average by 11.7 percent per year for the period 2010-2030. The total
demand for oil products and natural gas by household is projected to grow by 3.4
percent per year on average, increasing from 259 mboe in 2005 to 592 mboe in 2030.

40
Table 4.2 - The BAU Scenario Results for Household Demand for Oil Products, Natural Gas and Solar Energy by Application (2005-2030)
Share (%)
2005
mboe
2030
mboe Growth (%)
Kerosene 47 13 -4.97
Space heating 0 0 0
Cooking 100 47 13
Water heating 0 0 0
Gasoil 8 13 2.11
Space heating 80 6 10
Cooking 0 0 0
Water heating 20 2 3
LPG 8 7 -0.68
Space heating 0 0 0
Cooking 50 4 3
Water heating 50 4 3
Natural Gas 197 559 4.25
Space heating 75 148 420
Cooking 10 20 56
Water heating 15 30 84
Total
(Oil & Natural Gas) 259.5 591.9 3.35
Solar*
share 0 30 11.65
Heating 1-5 0 21
Cooking 1-5 0 4
Warm water 1-5 0 4
* The solar share will increase from 1 percent in 2010 to 5 percent in 2050.
41
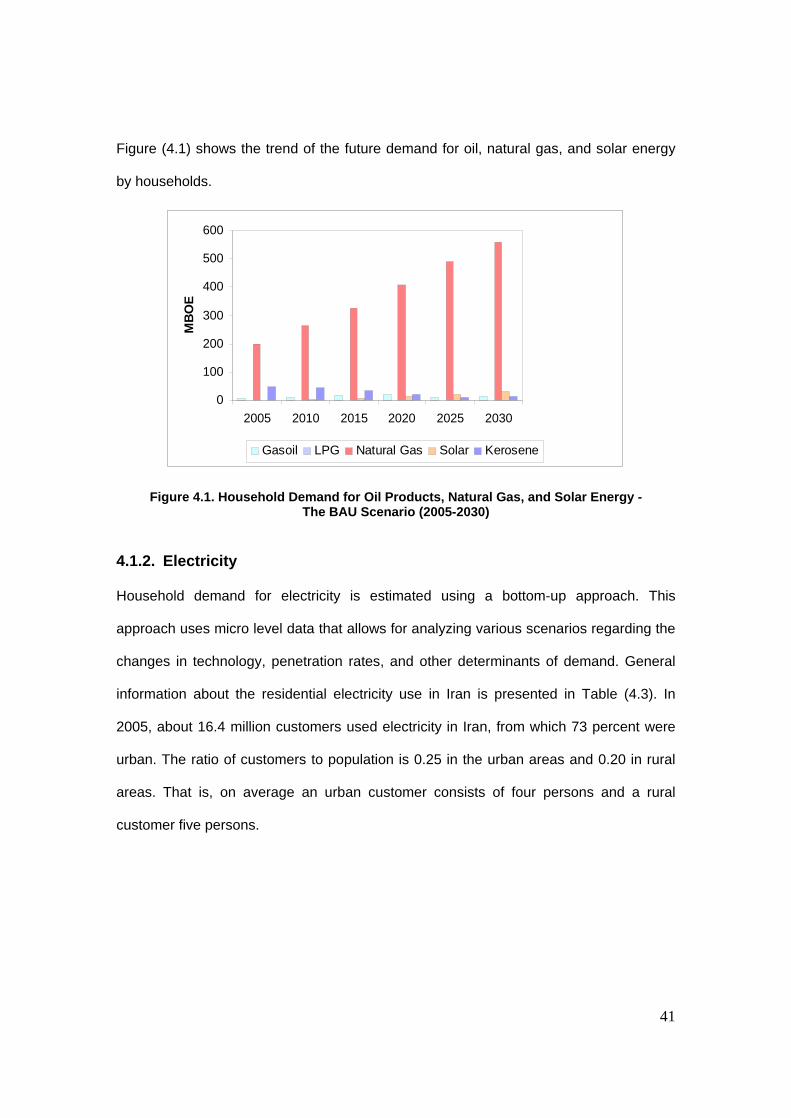
Figure (4.1) shows the trend of the future demand for oil, natural gas, and solar energy
by households.
0
100
200
300
400
500
600
2005 2010 2015 2020 2025 2030
MB
OE
Gasoil LPG Natural Gas Solar Kerosene
Figure 4.1. Household Demand for Oil Products, Natural Gas, and Solar Energy - The BAU Scenario (2005-2030)
4.1.2. Electricity
Household demand for electricity is estimated using a bottom-up approach. This
approach uses micro level data that allows for analyzing various scenarios regarding the
changes in technology, penetration rates, and other determinants of demand. General
information about the residential electricity use in Iran is presented in Table (4.3). In
2005, about 16.4 million customers used electricity in Iran, from which 73 percent were
urban. The ratio of customers to population is 0.25 in the urban areas and 0.20 in rural
areas. That is, on average an urban customer consists of four persons and a rural
customer five persons.

42
Table 4.3- Household Electricity Demand, 2005
Urban Rural Total
Number of customers (million) 11.99 4.41 16.40
Population (million) 48.24 22.23 70.47
Customer per person 0.25 0.20 0.23
Consumption (MkWh) 39,790 6,836 46,626
Source: Electricity Statistics, Ministry of Energy, 2005.
Although very detailed and extensive micro data on household consumption of energy
are not available in Iran, there are some survey data in Tehran along with other
published reports by TAVANIR, which can be used to analyze and estimate the
electricity demand for household at a disaggregated level1. We take the following steps
to model the electricity consumption by households using the survey data. First, a list of
all major appliances and their penetration rates are estimated for Iranian rural and urban
households. Second, the electricity use by those appliances and total electricity use per
household are estimated. Third, using the information on number of households with
access to electricity, the total amount of electricity use by households and appliances are
calculated. The details of the calculations and estimations are presented below.
The major appliances used by Iranian households are reported in Table (4.4).
There is no data on appliances for the rural areas, but using some general information
about living condition of the households in rural areas, the penetration rates of
appliances for rural households are estimated. For instance, the penetration rates for
appliances such as freezer, microwave, and washing machine are assumed zero and for
1. A study of household s electricity consumption pattern and their satisfaction in Tehran, Tehran Regional Electricity Company (TREC), different years
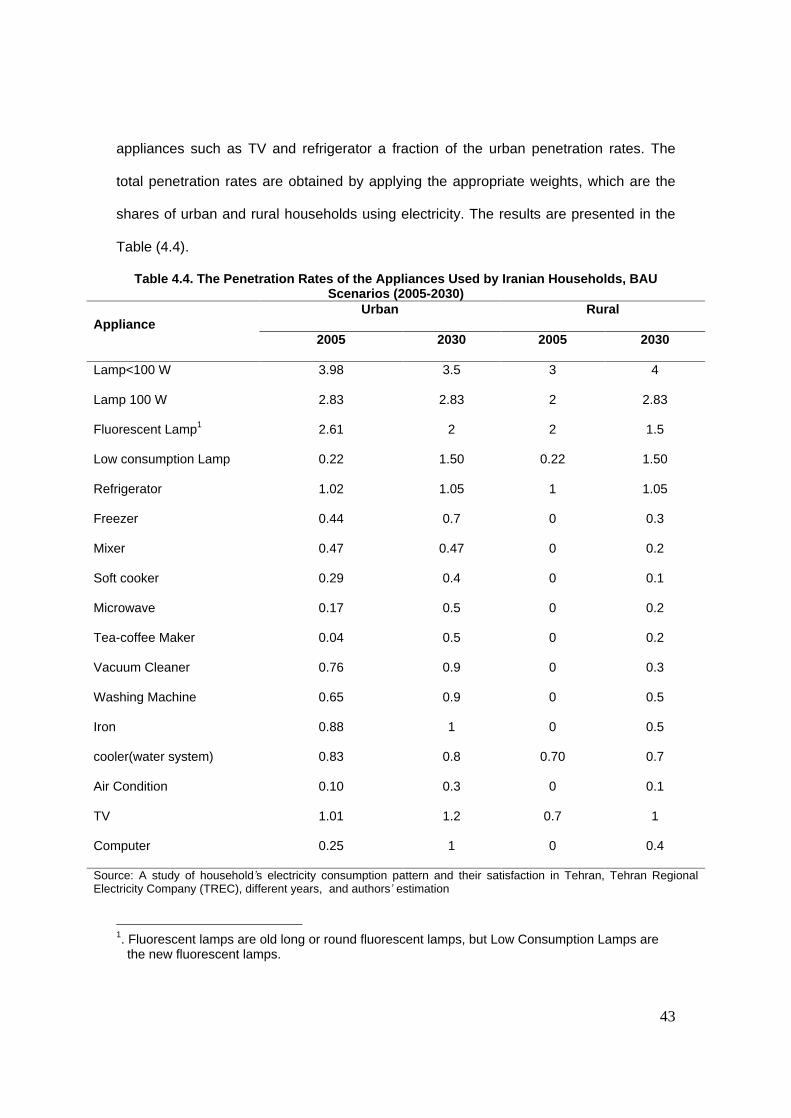
43
appliances such as TV and refrigerator a fraction of the urban penetration rates. The
total penetration rates are obtained by applying the appropriate weights, which are the
shares of urban and rural households using electricity. The results are presented in the
Table (4.4).
Table 4.4. The Penetration Rates of the Appliances Used by Iranian Households, BAU Scenarios (2005-2030)
Appliance Urban Rural
2005 2030 2005 2030
Lamp<100 W 3.98 3.5 3 4
Lamp 100 W 2.83 2.83 2 2.83
Fluorescent Lamp1
2.61 2 2 1.5
Low consumption Lamp 0.22 1.50 0.22 1.50
Refrigerator 1.02 1.05 1 1.05
Freezer 0.44 0.7 0 0.3
Mixer 0.47 0.47 0 0.2
Soft cooker 0.29 0.4 0 0.1
Microwave 0.17 0.5 0 0.2
Tea-coffee Maker 0.04 0.5 0 0.2
Vacuum Cleaner 0.76 0.9 0 0.3
Washing Machine 0.65 0.9 0 0.5
Iron 0.88 1 0 0.5
cooler(water system) 0.83 0.8 0.70 0.7
Air Condition 0.10 0.3 0 0.1
TV 1.01 1.2 0.7 1
Computer 0.25 1 0 0.4
Source: A study of household s electricity consumption pattern and their satisfaction in Tehran, Tehran Regional Electricity Company (TREC), different years, and authors estimation
1. Fluorescent lamps are old long or round fluorescent lamps, but Low Consumption Lamps are the new fluorescent lamps.

44
To estimate the cooler penetration rate, the information on electricity use in the very hot
and hot
regions is used. In the very hot and humid regions, like southern and some
northern areas, people use air condition in hot months. We first estimate the number of
coolers used by households using the household electricity consumption information for
those regions in hot and cold months1 and the average electricity consumption by type of
coolers used in Iran. In total, there are about 16 million households using electricity in
Iran, from which about 3.2 million households live in the hot areas (70 percent in very hot
areas and 30 percent in hot areas.) The water system and gas system cooler penetration
rates are calculated based on the weighted average of the cooler stock in Iran. Table
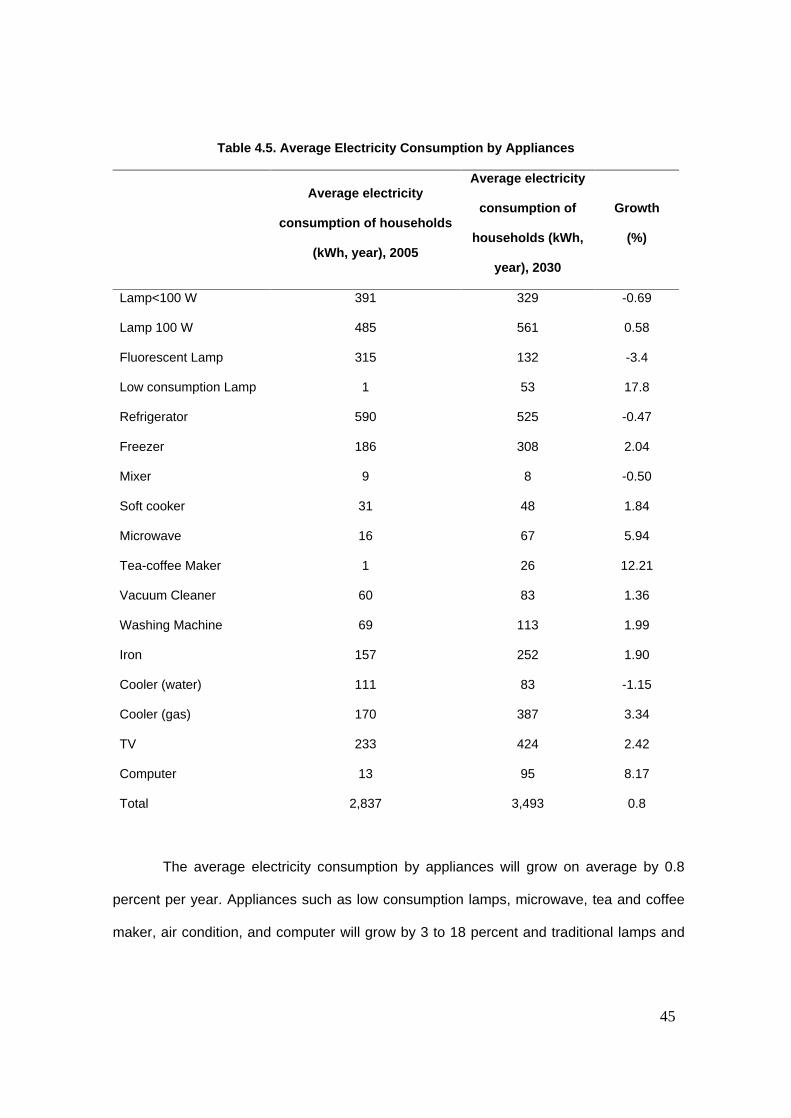
(4.5) shows the average electricity consumption by households and by appliances in
2005 and 2030.
1. The number of hot months is assumed three.
45
Table 4.5. Average Electricity Consumption by Appliances
Average electricity
consumption of households
(kWh, year), 2005
Average electricity
consumption of
households (kWh,
year), 2030
Growth
(%)
Lamp<100 W 391 329 -0.69
Lamp 100 W 485 561 0.58
Fluorescent Lamp 315 132 -3.4
Low consumption Lamp 1 53 17.8
Refrigerator 590 525 -0.47
Freezer 186 308 2.04
Mixer 9 8 -0.50
Soft cooker 31 48 1.84
Microwave 16 67 5.94
Tea-coffee Maker 1 26 12.21
Vacuum Cleaner 60 83 1.36
Washing Machine 69 113 1.99
Iron 157 252 1.90
Cooler (water) 111 83 -1.15
Cooler (gas) 170 387 3.34
TV 233 424 2.42
Computer 13 95 8.17
Total 2,837 3,493 0.8
The average electricity consumption by appliances will grow on average by 0.8
percent per year. Appliances such as low consumption lamps, microwave, tea and coffee
maker, air condition, and computer will grow by 3 to 18 percent and traditional lamps and

46
water cooler will grow negatively. The number of households using electricity is linked to
population and its future values are estimated using the household to population ratio. In
2005, the household population ratio was 0.25 for the rural areas and 0.20 for the urban
areas. The total electricity demand by households for the period 2005-2030 is obtained by
multiplying the number of households by the total electricity consumption per household. In
estimating the household future electricity consumption, it is assumed that the penetration
rates of the appliances will change as shown in Table (4.4).
Table (4.6) shows the results of the BAU scenario for the household electricity
demand for the period 2005-2030. The number of customers, consumption per household,
and total consumption of electricity by households will grow more rapidly in rural areas
than urban areas. The share of electricity consumption of urban households in total
households electricity consumption will reduce by 0.5 percentage point from 85 percent to
84.5 percent. The number of residential customers (households) will grow by 1.2 percent,
consumption per household by 1 percent, and the total electricity use by households by 2
percent on average for the period 2005-2030. Figure 4.2 shows the future trend of the
residential demand for electricity.

47
Table 4.6
Residential Demand for Electricity, BAU Scenario (2005-2030)
2005 2030 Growth (%)
Urban
Number of Customers (million) 12.14 16.3 1.19
Consumption per household per year
(MkWh) 3,319 3,742 0.48
Total Consumption (MkWh)
39,790 65,890 2.04
Rural
Number of Customers (million) 4.4 5.96 1.22
Consumption per household per year
(MkWh) 1,538 2,565 2.07
Total Consumption (MkWh)
6,836 12,119 2.32
Total
Number of Customers (million) 16.6 22.3 1.19
Total Consumption (MkWh) 46,626 78,008 2.08

48
0
10,000
20,000
30,000
40,000
50,000
60,000
70,000
80,000
90,000
2005 2010 2015 2020 2025 2030
MK
Wh
Urban Rural Total
Figure 4.2. Residential demand for electricity- MkWh (2005-2030)
Table (4.7) presents the total electricity consumption by appliances in 2005 and
2030. Lighting is the major component of electricity use by household and will remain so
in the future, but its share will reduce from 42 percent in 2005 to 31 percent in 2030 as
the more efficient light bulbs will be substituted for the currently used low efficient light
bulbs. Refrigerators use 21 percent of the total electricity consumption by households,
but its share will reduce to 15 percent in 2030, as low efficient refrigerators will be
phased out. The share of other appliances such as TV, air condition, iron, freezer, and
computer will increase slightly because of urbanization and changes in the households
life style.
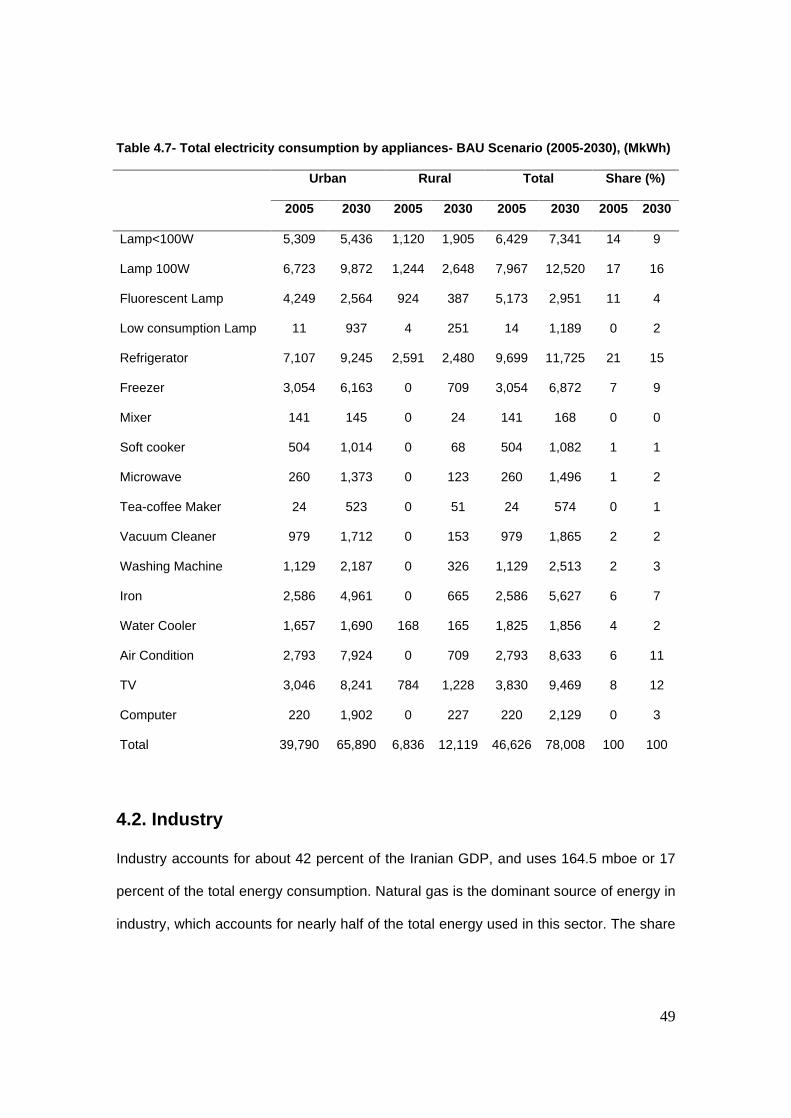
49
Table 4.7- Total electricity consumption by appliances- BAU Scenario (2005-2030), (MkWh)
Urban Rural Total Share (%)
2005 2030 2005 2030 2005 2030 2005
2030
Lamp<100W 5,309 5,436 1,120
1,905 6,429 7,341 14 9
Lamp 100W 6,723 9,872 1,244
2,648 7,967 12,520
17 16
Fluorescent Lamp 4,249 2,564 924 387 5,173 2,951 11 4
Low consumption Lamp 11 937 4 251 14 1,189 0 2
Refrigerator 7,107 9,245 2,591
2,480 9,699 11,725
21 15
Freezer 3,054 6,163 0 709 3,054 6,872 7 9
Mixer 141 145 0 24 141 168 0 0
Soft cooker 504 1,014 0 68 504 1,082 1 1
Microwave 260 1,373 0 123 260 1,496 1 2
Tea-coffee Maker 24 523 0 51 24 574 0 1
Vacuum Cleaner 979 1,712 0 153 979 1,865 2 2
Washing Machine 1,129 2,187 0 326 1,129 2,513 2 3
Iron 2,586 4,961 0 665 2,586 5,627 6 7
Water Cooler 1,657 1,690 168 165 1,825 1,856 4 2
Air Condition 2,793 7,924 0 709 2,793 8,633 6 11
TV 3,046 8,241 784 1,228 3,830 9,469 8 12
Computer 220 1,902 0 227 220 2,129 0 3
Total 39,790 65,890 6,836
12,119
46,626
78,008
100 100
4.2. Industry
Industry accounts for about 42 percent of the Iranian GDP, and uses 164.5 mboe or 17
percent of the total energy consumption. Natural gas is the dominant source of energy in
industry, which accounts for nearly half of the total energy used in this sector. The share

50
of natural gas in the total energy use by industry has been increasing because of
government s aggressive policy of substituting natural gas for oil products. This has
caused some difficulties to industries during cold winter months. The National Gas
Company cuts off supply of natural gas to manufacturing industries in order to respond
to household demand, which rises rapidly in winter. We model energy demand in
industry using the survey data on large (more than 10 workers) manufacturing industries
available through the Statistics Center of Iran. We use information at the two digit ISIC1
level in which the manufacturing industries are classified into nine main industry groups.
The list of industries is presented in Table (4.8). Machinery and Equipment
manufacturing industry is the largest industrial group in Iran accounting for about 36
percent of the total manufacturing industries value added. Chemical and Basic Metals
each produce 13 percent, and Refinery produces 9 percent of the total value added by
industrial groups. The shares of Food and Beverages, Non-Metallic Minerals, and
Textiles and Leather in the total valued added are 9, 8, and 6 percent, respectively.
Chemical industry shows the highest energy use (27 percent) among the
manufacturing industry groups, followed by Basic Metals (18 percent), Non-Metallic
Minerals (16 percent), Refinery (11 percent), and Food and Beverages (10 percent). 47
percent of energy used by manufacturing industries is natural gas, 26 percent fuel oil, 17
percent electricity, 7 percent gas oil, 1.7 percent liquefied petroleum gas (LPG), 0.6
percent gasoline, and 0.3 percent kerosene.2
1 International Standard of Industry Codes 2.There is a discrepancy between the data published by the Iranian Statistics Center (ISC) and the Ministry of Power in the Energy Balance (EB) on the energy use by the manufacturing industries. This is mainly due to the difference in the samples used by these two agencies. Here, we have taken the total energy use from EB and distributed its difference with ISC among the industries using their shares from ISC.

51
Table 4.8
Manufacturing Industries Value Added and Energy Use (2005)
Value Added
Constant 1997 b. Rials
Share
%
Energy Use
mboe
Share
%
Food and Beverages 7,083 9 17 10
Textile and Leather 4,426 6 5 3
Wood and Wood Products 279 0.4 1 0.5
Paper, Pulp and Printing 1,440 2 4 3
Chemical and Petrochemical 10,598 13 44 27
Refinery 7,184 9 19 11
Non-metallic Minerals 6,610 8 26 16
Basic metals 10,008 13 29 18
Machinery and Equipment 28,854 36 7 4
Other industrial 3,119 4 13 8
Total 79,579 100 164 100
Source: The Large Manufacturing Industries Survey, Statistical Center of Iran, and authors calculations.
To estimate the future energy demand by manufacturing industries in the BAU
scenario, the following procedure is used. First, the current rial value added for the nine
large manufacturing industry groups are converted into the constant rial value added
using the corresponding price deflators from the Central Bank Price Surveys. Second,
the future value added is of each manufacturing industries projected by taking into
account the past growth rates as well as the objectives outlined in the Ministry of
Industry plans, the fourth FYDP and the vision. According to the results, most
manufacturing industries would grow on average at the rate of 8 or 9 percent at the
beginning of the period and at the range of 4 to 6 percent per year at the end of the
study period. Third, the energy intensity for each manufacturing industry group is

52
obtained using the data on the energy consumption and the value added. The results
are shown in Table (4.9). The energy intensity in the manufacturing industry has been
decreasing on average by 7 percent for the past 15 years, but the rate of decrease has
slowed down since 2000. It is assumed that the overall energy intensity in the
manufacturing industry would continue to decline but at a much slower rate, that is, one
percentage point per year. Fourth, the future energy demand for manufacturing industry
groups is estimated given the energy intensity and the estimated value added for each
group in the next 25 years. In deriving the BAU scenario, the gasification policy of the
manufacturing industry, particularly in Food and Beverages, Wood and Wood Products,
Textile and Leather, and Paper, Pulp and Printing industries, is also taken into account.
The results are shown in Table (4.10) and figure (4.3).
Table 4.9
Energy Intensity in Manufacturing Industries- BAU Scenario (2005-2030)
BOE/billion rials (constant 1997)
2005 2030
Food and Beverages 2.33 1.82
Textile and Leather 1.02 0.80
Wood and Wood Products 2.87 1.73
Paper, Pulp and Printing 2.91 2.26
Chemical and Petrochemical 4.19 3.26
Refinery 2.62 2.04
Non-metallic Minerals 3.93 3.05
Basic metals 2.89 2.24
Machinery and Equipment 0.23 0.18
Other industrial 4.25 3.31
Total 2.06 1.58

53
The total energy demand by the manufacturing industries will grow on average by
3.4 percent per year reaching from 164 mboe in 2005 to 380 mboe in 2030.
Table 4.10
Manufacturing Industries Demand for Energy, BAU Scenario (2001-2030),
mboe
2005 2030 Growth (%)
Food and Beverages 17 44 4
Textile and Leather 5 8 2
Wood and Wood Products 1 1 1
Paper, Pulp and Printing 4 10 4
Chemical and Petrochemical 44 106 4
Refinery 19 45 4
Non-metallic Minerals 26 59 3
Basic metals 29 72 4
Machinery and Equipment 7 16 4
Other industrial 13 19 1
Total 164 380 3.4

54
0
50
100
150
200
250
300
350
400
2005 2010 2015 2020 2025 2030
Food Textile Wood Paper Chemical Refinery Non-metal mining Basic metals Machinery and Equip. Other industrial
Figure 4.3. Total energy demand by manufacturing industries, BAU (2005-2030), mboe
4.3. Power Generating Plants
The power generating plants are important part of the energy sector as they are both
energy users and energy producers. In 2005, the power generating plants used 270
mboe oil and natural gas accounting for 28 percent of the total energy used in the
country and generated 110 mboe electricity. The power generating plants use different
types of the energy depending on the type of technology they employ, and produce
electricity for different sectors of the economy. In 2004-2005, about 37.3 GW total
installed capacity was contributed by steam (38%), natural gas (30%), combined cycle
(17%), and hydro (15%) power plants. The electricity generation by renewable resources
is negligible, and by nuclear plant has not been materialized yet. Table (4.11) presents
the structure of the existing power generating plants in Iran.

55
Table 4.11- Installed Capacities of Power Plants, 2005
Type GW Share (%)
Steam 14.12 38
Gas 11.2 30
Combined Cycle 6.3 17
Hydro 5.6 15
Renewable 0.034 00
Total 37.3 100
To estimate the electricity production by power generating plants, three steps
have been taken. First, the future demand for electricity by each sector of the economy
is estimated using the future value added as well as the energy (electricity) intensity. It is
assumed that the energy intensity will decrease on average by 0.1 percent per year. The
total electricity demand is obtained by adding the transmission and distribution losses as
well as power plants own use, which are assumed to decline by 1 percent based on the
Ministry of Energy plan and the 2007 budget law. The total generation capacity by the
power generating plants is then estimated using the average load factor. The new
capacity needed is assumed to be met by a combination of combined cycle, nuclear, and
renewable power generating plants, as outlined in the energy policies by Tavanir.
In
2010, thermal plants will produce 94 percent and renewable and nuclear plants 6
percent of 220 GWh total electricity production.. It is assumed that combined cycle
plants will generate 80 percent and gas turbine plants 20 percent of new thermal
capacities. In addition, the nuclear plants will generate 6000 MWh by 2010, large hydro
18652 MWh, small hydro 2213 MWh, wind power 550 MWh, solar thermal 4 MWh, and
biomass 18 MWh. The pump storage in Siah Bisheh project will also generate 1971

56
MWh in 2010. Table (4.12) shows the total electricity capacity generation by power
generating plants for the period 2005-2030.
Table 4.12. Total Electricity Generation in Iran, BAU Scenario (2005-2030)
2005 2030
Total Electricity Consumption by All Sectors (million kWh) 144,296 284,250
Transmission and Distribution Losses (million kWh) 33,847 49,878
Power Plant Own Consumption (million kWh) 8,394 12,246
Total Electricity Generation (million kWh) 186,537 346,375
Average Load Factor (%) 57 57
Total Installed Capacity (GW) 37.35 69.27
Source: Ministry of Energy, Tavanir, and the study projection
Table 4.13 shows electricity generation by existing and future power generating
plants. It is assumed that the nuclear plants will generate the base load with 1000 MW
capacity in 2009 and the thermal plants along with renewable sources will generate the
rest. Based on the Ministry of Energy plan, the new thermal plants will be combined
cycle and the main renewable sources hydro and wind power plants. Hydro installed
capacity will be more than 7000 MW capacity until 2011 and 8500 MW in 2030. The wind
power capacity will increase from 37 MW in 2005 to 1187 MW in 2030. The small hydro
plants, solar thermal, geothermal, and biomass will generate 720 MW, 1 MW, 55 MW,
and 5 MW, respectively. A pump storage plant in Siah Bisheh will be installed in 2010
with the power of 1000 MW.

57
# why are the numbers in black or red? This has to be mentioned in the legend of the
table. Please note that some numbers are inconsistent.
Table 4.13. Electricity Generation by Renewable and Non Renewable Sources (GWh)- BAU Scenario (2005-2030)
2005 2030
Total Electricity generation (million kWh) 186,537 346,375
Thermal Power Plants 181,817 330,264
Nuclear Power 0 6,000
Renewable Sources 4,720 10,111
Hydro power 4,500 6,750
Wind power 220 2,730
Photovoltaic 0 7
Geothermal 0 303
Solar thermal power 0 4
Small hydropower 280
Biomass 0 18
Source: Tavanir and authors estimation
The fuel use by the power plants is estimated assuming that the future thermal
power plants will only use natural gas and that the average efficiency rate will rise from
39.7 percent to 46.1 percent in 2030 because of a better technology. The results are
presented in Table (4.14). The total fuel demand by the power generating plants will
grow on average by 1.81 percent per year for the period 2005-2030. Demand for gas oil,
heavy fuel, and natural gas for the existing plants will decrease on average by 0.22
percent per year, but demand for natural gas by the new power plants will increase by
about 15 percent per year. It is also assumed that solar heat power plants, which will
generate 4 GWh electricity, will need about 1.81 GWh natural gas by 2030.

58
Table 4.14
Energy Demand by Power Generating Plants, BAU Scenario (2005-2030), GWh
2005 2030 Growth (%)
Total Fuel 458,500 717,184 1.81
Gas Oil 47,312 44,827 -0.22
Natural Gas (existing plants) 326,435 309,289 -0.22
Natural Gas (new plants) - 282,729 -
Solar Heat Power Plants - 37.28
Heavy Fuel 84,753 80,302 -0.22
Average Efficiency Factor (%) 39.7 46.1
4.4. Transport
In 2005, the transport sector used 54.7 percent of the total oil product consumption, 0.16
percent of natural gas, and 0.07 percent of electricity. About 450 billion passenger
kilometers were travelled in 2005 by car (54%), bus (41%), train (2%), and airplane (2%).
About 208 billon tones kilometer freight has been transported by trucks (92%) and train
(8%). The main energy types used in the sector are gas oil, gasoline, kerosene, and jet
fuel. Natural gas (LPG and CNG), has been also added to the energy basket of the
sector, but its share is negligible. To estimate the future demand for energy in the sector,
we first model the demand for energy by finding the relationship between the
consumption and the major drivers in each sub sector of transport through regression
equations. We then estimate the future values of demand by applying the basic
assumptions about the future economic and population growth.
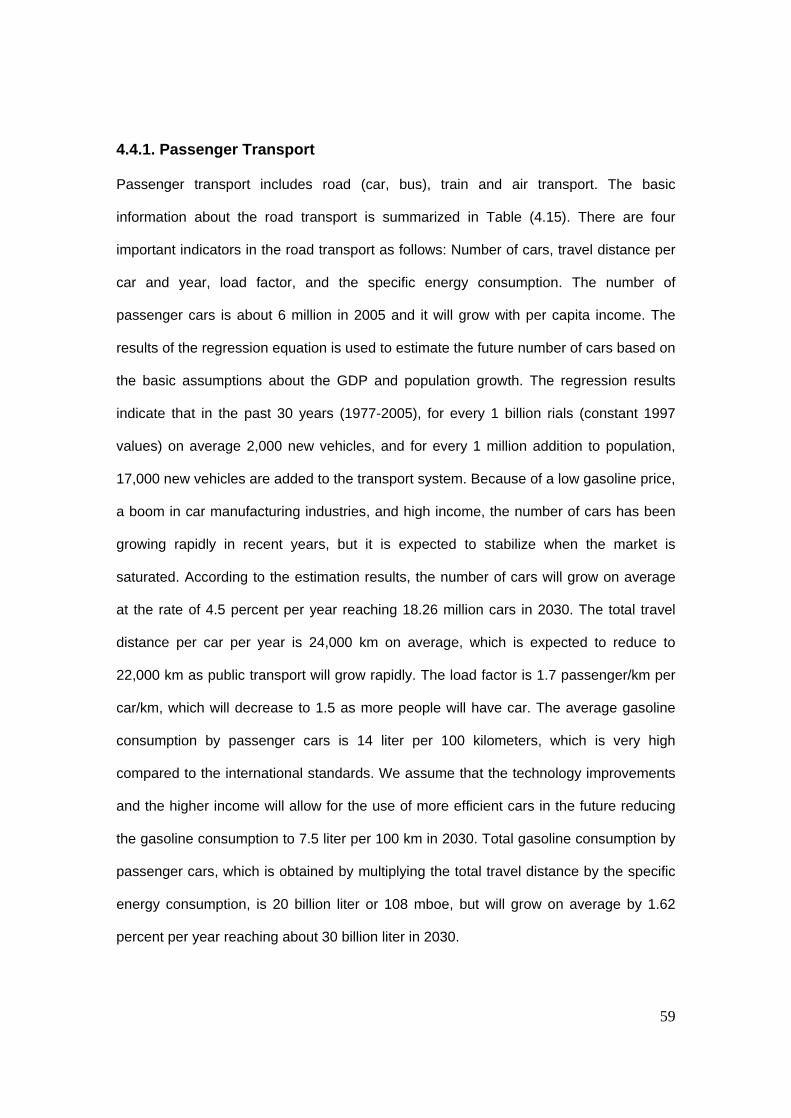
59
4.4.1. Passenger Transport
Passenger transport includes road (car, bus), train and air transport. The basic
information about the road transport is summarized in Table (4.15). There are four
important indicators in the road transport as follows: Number of cars, travel distance per
car and year, load factor, and the specific energy consumption. The number of
passenger cars is about 6 million in 2005 and it will grow with per capita income. The
results of the regression equation is used to estimate the future number of cars based on
the basic assumptions about the GDP and population growth. The regression results
indicate that in the past 30 years (1977-2005), for every 1 billion rials (constant 1997
values) on average 2,000 new vehicles, and for every 1 million addition to population,
17,000 new vehicles are added to the transport system. Because of a low gasoline price,
a boom in car manufacturing industries, and high income, the number of cars has been
growing rapidly in recent years, but it is expected to stabilize when the market is
saturated. According to the estimation results, the number of cars will grow on average
at the rate of 4.5 percent per year reaching 18.26 million cars in 2030. The total travel
distance per car per year is 24,000 km on average, which is expected to reduce to
22,000 km as public transport will grow rapidly. The load factor is 1.7 passenger/km per
car/km, which will decrease to 1.5 as more people will have car. The average gasoline
consumption by passenger cars is 14 liter per 100 kilometers, which is very high
compared to the international standards. We assume that the technology improvements
and the higher income will allow for the use of more efficient cars in the future reducing
the gasoline consumption to 7.5 liter per 100 km in 2030. Total gasoline consumption by
passenger cars, which is obtained by multiplying the total travel distance by the specific
energy consumption, is 20 billion liter or 108 mboe, but will grow on average by 1.62
percent per year reaching about 30 billion liter in 2030.

60
The numbers of buses for public transport is 233,000, and since 1991, on
average about 5000 minibuses and buses are added to the public transport system
every year. The average total travel distance by bus is 45,000 km per bus per year that
will decrease to 41,250 km in 2030. The total travel distance by bus will increase from
10.5 Mkm in 2005 to 17.2 Mkm in 2030. The average consumption of gas oil by bus,
which is 51 liter per 100 km, will decrease to 25 liter per 100 km in 2030 declining at the
rate of 2.81 percent per year. The total gas oil consumption by buses can be calculated
similar to gasoline consumption by car using indicators above. It is 5.3 billion liter in
2005, but will decrease on average by 0.87 percent per year reaching 4.3 billion liter in
2030. The reason for a decline in gas oil demand by bus is that the specific energy
consumption will decrease at a faster rate than the total travel distance will increase.
In 2005, 11.15 billion passenger km were traveled by train and about 11 billion
passenger km by airplane. Since there are no detailed data in these two transport
modes, we assume that train transport will grow on average by 5 percent until 2010, 4
percent until 2025, and 3 percent until 2030, and air transport will grow on average by 4
percent. The average gasoil consumption by train is 0.0085 liter per km and is assumed
to remain unchanged. The total gasoil consumption by train is 121 million liter which will
grow to 253 million liter in 2030. The total jet fuel consumption is 1.6 billion liter, which
will increase to 3.2 billion liter in 2030.
CNG as an environmentally friendly and a cheaper fuel is recently introduced to
the Iranian traffic system as a substitute for gasoline and gas oil. There is an ambitious
plan to build the required infrastructure for production and distribution of CNG,
particularly in large cities. We assume that CNG will account for 5 percent of total energy
use by passenger transport.
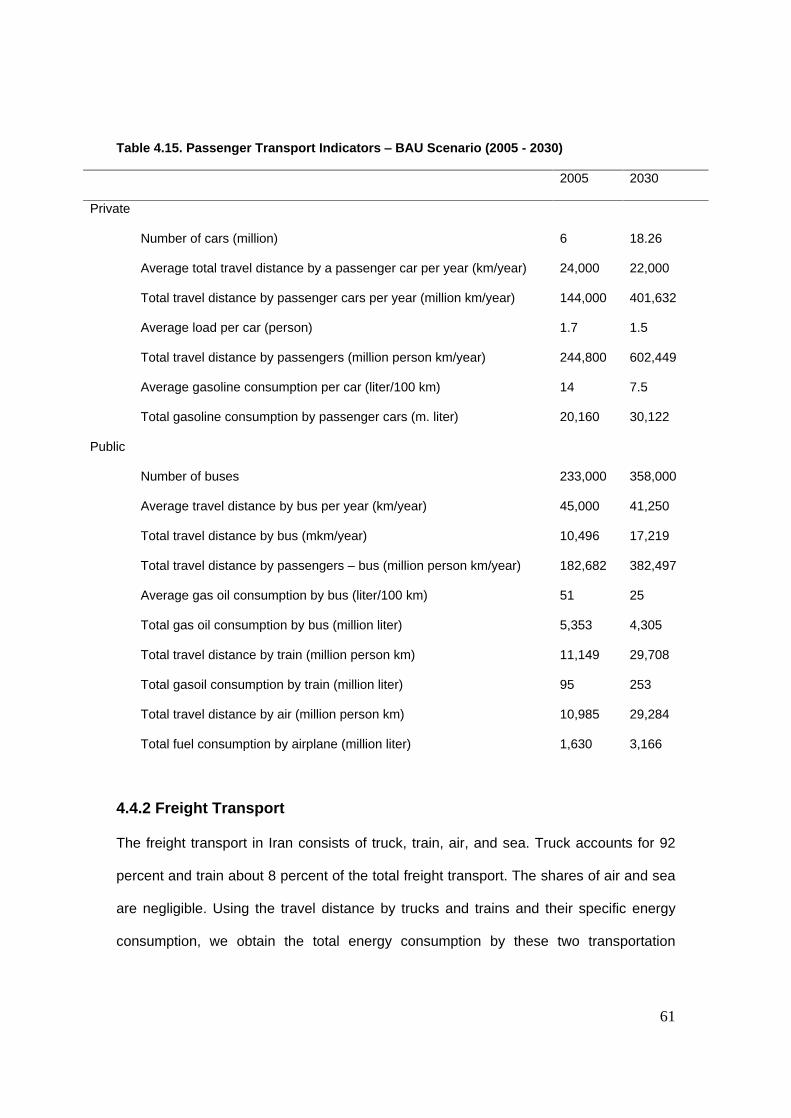
61
Table 4.15. Passenger Transport Indicators
BAU Scenario (2005 - 2030)
2005 2030
Private
Number of cars (million) 6 18.26
Average total travel distance by a passenger car per year (km/year) 24,000 22,000
Total travel distance by passenger cars per year (million km/year) 144,000 401,632
Average load per car (person) 1.7 1.5
Total travel distance by passengers (million person km/year) 244,800 602,449
Average gasoline consumption per car (liter/100 km) 14 7.5
Total gasoline consumption by passenger cars (m. liter) 20,160 30,122
Public
Number of buses 233,000 358,000
Average travel distance by bus per year (km/year) 45,000 41,250
Total travel distance by bus (mkm/year) 10,496 17,219
Total travel distance by passengers
bus (million person km/year) 182,682 382,497
Average gas oil consumption by bus (liter/100 km) 51 25
Total gas oil consumption by bus (million liter) 5,353 4,305
Total travel distance by train (million person km) 11,149 29,708
Total gasoil consumption by train (million liter) 95 253
Total travel distance by air (million person km) 10,985 29,284
Total fuel consumption by airplane (million liter) 1,630 3,166
4.4.2 Freight Transport
The freight transport in Iran consists of truck, train, air, and sea. Truck accounts for 92
percent and train about 8 percent of the total freight transport. The shares of air and sea
are negligible. Using the travel distance by trucks and trains and their specific energy
consumption, we obtain the total energy consumption by these two transportation

62
modes. The results are presented in Table (4.16). The freight transport by truck uses
about 9 billion liter and by train 239 million liter gasoil. They will increase to 21 billion liter
and 600 million liter in 2030; that is, a growth rate of 3.5 and 3.75 percent on average
per year, respectively. The total consumption of gasoil by freight transport is 108 BOE,
which will increase to 161 in 2030.
Table 4.16 - Freight Transport Indicators
BAU Scenario (2005-2030)
2005 2030
Freight transport by truck (million tones km)
208,263
553,389
Freight transport by train
19,112
47,980
Total fuel consumption by truck (million liter)
8,955
21,029
Total fuel consumption by train (million liter)
239
600
The ship transport consumes about 1.4 percent of the total Iranian gas oil
consumption. Since there is no direct and reliable data on the details of this sector, we
assume that this ratio will remain constant in the study period. Table (4.17) shows the
total consumption of different energy types used by transport sector in BOE unit.
Gasoline and CNG will be the major energy types used in the sector.
The total final energy demand in transport sector, which is 217 mboe in 2005, will grow
on average by 2 percent per year reaching 354 mboe in 2030.

63
Table 4.17 - Final Energy Demand by Transport Sector- BAU Scenario (2005-2030) - mboe
2005 2030 Growth (%)
Gasoline 108 161 1.62
Gasoil (buses and trucks) 88 156 0.99
CNG 6 8 2.31
Gasoil (train) 2 5 3.82
Jet fuel 10 20 2.69
Ship fuel 2.48 3.82 1.75
Total 217 354 1.98
Figure (4.4) shows the current and BAU scenario for the fuel consumption by
transport mode in the transport sector.
0
50
100
150
200
2005 2010 2015 2020 2025 2030
MB
PE
Gasoline Gasoil CNG Jet Fuel
Figure 4.4- Energy Demand by Road Transport, BAU Scenario (2005-2030), mboe

64
4.5. Other Sectors
In this section, we model the energy consumption by public, commercial, and agriculture
sectors. These three sectors account for 57 percent of the total value added of the
economy, but use less than 10 percent of the total energy consumption.
4.5.1. Public Sector
Public sector accounts for 15 percent of the GDP and uses about 2.5 percent of the total
energy consumption in the economy. More than half of the energy used in the sector is
electricity and one quarter is gas oil. Table (4.18) shows total consumption of different
types of energy and their energy intensities in the public sector. Since there is no
individual data for the consumption of natural gas by public sector, we estimate it by
assuming that natural gas has substituted fuel oil for the past 10 years. Therefore, the
consumption of natural gas for the period 1996-2004 will be equivalent to the reduction
in fuel oil consumption in public sector.
Table 4.18. Energy Consumption And Energy Intensity In The Public Sector (2004)
Energy Consumption (mboe) Energy Intensity
(BOE/Constant 1997 million rials)
Gasoline 0.81 0.013
Kerosene 1.74 0.029
Gas Oil 5.58 0.093
Fuel Oil 1.99 0.033
Electricity 12.74 0.213
Natural Gas 0.16 0.003
Source: Ministry of Energy, and the study s estimation

65
The future energy consumption of public sector is estimated by multiplying the
future value added of the sector by the future energy intensities. According to the FYDP
and the Vision, the share of the public sector will decrease in the future, as privatization
of public enterprises continues. Therefore, we reduce the share of the public sector in
the economy from 15 percent in 2005 to 10 percent in 2030, which leads to an average
of 2 percent annual growth of value added. The energy intensities for different energy
types have been decreasing for the period 1996-2004 and we assume that the trend will
continue in the future, but at slower rates. The only exception is the natural gas whose
intensity has been growing and will continue to grow but at a slower rate. The estimation
results for the energy demand by public sector are shown in Table (4.19). According to
the BAU scenario results, the total energy demand in public sector will grow on average
by 1.67 percent per year for the period 2005-2030. Electricity and natural gas will be two
major energy types used in public sector in 2030. Figure (4.5) shows the future trend of
the demand for energy in public sector.
Table 4.19- Public Sector Energy Demand, BAU Scenario (2005-2030), mboe
2005 2030 Growth (%)
Gasoline 0.85 0.66 -1
Kerosene 1.83 0.95 -2.6
Gas Oil 5.88 7.52 1
Fuel Oil 2.10 0.03 -15
Electricity 13.42 22.84 2
Natural Gas 0.16 4.68 14
Total 24 37 1.67

66
0
5
10
15
20
25
2005 2010 2015 2020 2025 2030
MB
OE
Gasoline Kerosene Gas Oil Fuel Oil Electricity Natural Gas
Figure 4.5. Demand for Energy In Public Sector, BAU Scenario (2005-2030)
4.5.2. Commercial Sector
Commercial sector accounts for about 30 percent of GDP and has been growing by
about 4 percent for the past 10 years. It uses about 2 percent of the total energy
consumption in the economy from which 24 percent is electricity, 47 percent fuel oil, 20
percent gas oil, and 5 percent natural gas. Table (4.20) shows consumption of different
energy types in the sector and the energy intensities. Since the individual data for
natural gas consumption is not available, we estimate it by assuming that natural gas is
substituted for fuel oil in the sector since 1996.

67
Table 4.20. Energy Consumption and Energy Intensity in the Commercial Sector (2004)
Energy Use
(mboe)
Energy Intensity
(BOE/constant 1997 million rials)
Gasoline 0.06 0.0036
Kerosene 0.44 0.0342
Gas Oil 4.19 0.0795
Fuel Oil 9.72 0.0405
Electricity a
4.96 0.0004
Natural Gas 32.12 0.2627
Total 51.47 0.42
a. Electricity and natural gas intensities are calculated for 2005.
The total demand for energy in the commercial sector is estimated using the
future value added of the sector and the energy intensities. The future value added of
the commercial sector is estimated assuming that the share of the sector in GDP will
increase from 31 percent in 2005 to 33 percent in 2030. This means that the sector will
grow on average by 4.9 percent per year in the next 25 years. The energy intensities in
the sector have been decreasing for kerosene, gasoline, and fuel oil, but increasing for
natural gas, electricity, and gasoil. We assume that the future energy intensities will
follow the past trend, but at slower rates. Table (4.21) shows the total energy demand by
the commercial sector for the periods 2005 and 2030. The energy demand will decline
for gasoline, kerosene, and fuel oil by an average of 3 percent, but will grow for
electricity and natural gas by an average of 5 and 2 percent per year, respectively. The
total demand for energy in the commercial sector will grow on average by 2 percent per
year for the period 2005-2030.
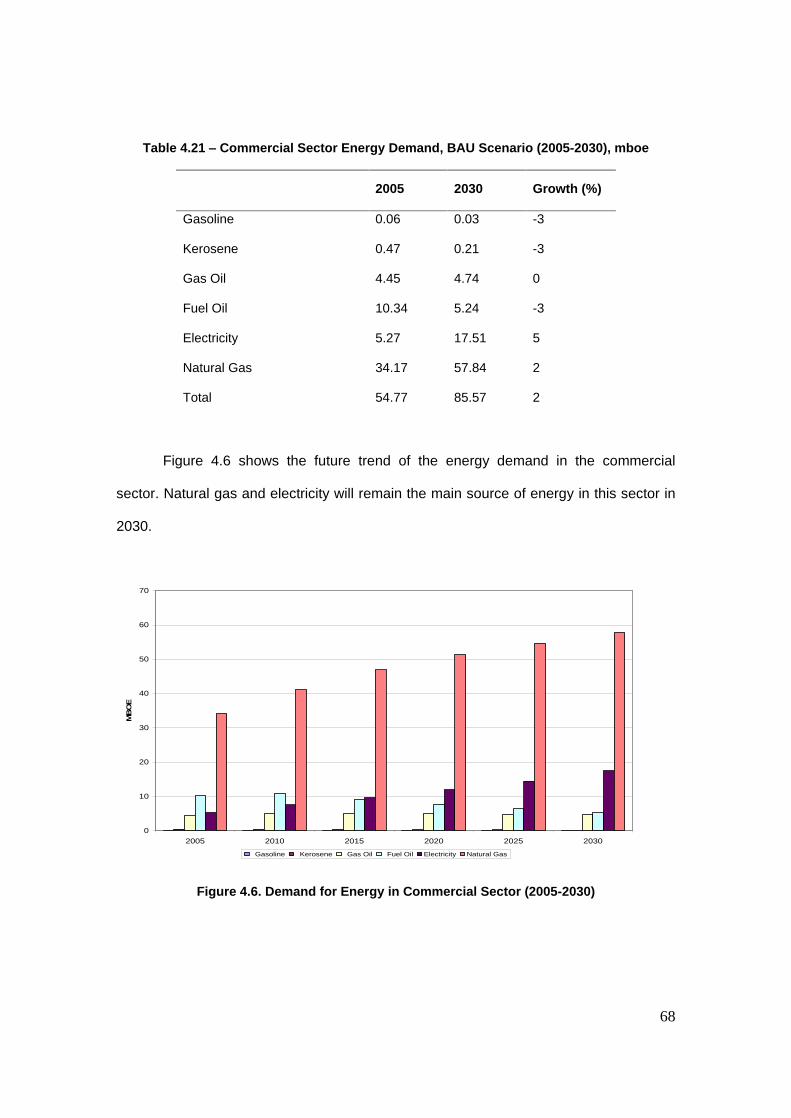
68
Table 4.21
Commercial Sector Energy Demand, BAU Scenario (2005-2030), mboe
2005 2030 Growth (%)
Gasoline 0.06 0.03 -3
Kerosene 0.47 0.21 -3
Gas Oil 4.45 4.74 0
Fuel Oil 10.34 5.24 -3
Electricity 5.27 17.51 5
Natural Gas 34.17 57.84 2
Total 54.77 85.57 2
Figure 4.6 shows the future trend of the energy demand in the commercial
sector. Natural gas and electricity will remain the main source of energy in this sector in
2030.
0
10
20
30
40
50
60
70
2005 2010 2015 2020 2025 2030
MB
OE
Gasoline Kerosene Gas Oil Fuel Oil Electricity Natural Gas
Figure 4.6. Demand for Energy in Commercial Sector (2005-2030)

69
4.5.3. Agriculture
Agriculture accounts for about 12 percent of GDP and uses 32.2 mboe or 3.6 percent of
the total final energy consumption. The main source of energy in agriculture is gas oil,
which accounts for 98 percent of fuel consumption in the sector. The use of electricity is
very low but has been increasing for the past decades. Table (4.22) shows the use of
different energy types and their energy intensities in the sector in 2004.
Table 4.22- Energy Consumption And Energy Intensity in Agriculture, 2004
Energy Consumption
(mboe
Energy Intensity
(BOE/constant 1997 million rials)
Gasoline 0.08 0.001
Kerosene 0.47 0.009
Gas oil 22.34 0.410
Fuel Oil 0.03 0.001
Electricity 9.76 0.179
Source: Energy Balance, Ministry of Energy, Iran, 2004, and authors calculations
Similar to other sectors, we use valued added and the energy intensities to
project the future consumption of energy in the agriculture sector. The future value
added of the sector is obtained assuming that the share of agriculture in GDP will be
decreasing gradually in the next 25 years. Specifically, the agriculture share of the GDP
will decrease from 13.9 percent in 2005 to 11 percent in 2030. Given the assumption for
GDP growth, this means that the agriculture sector will grow at the rate of 5.1 percent in

70
2005-2010, 3 percent in 2011-2020, and 2.6 percent in 2021-20301. The details of the
energy intensity for different types of energy in agriculture are shown in Table (4.23).
The energy intensities for all energy types but electricity have been decreasing for the
past 10 years, with kerosene and fuel oil having the highest decline rates. It is assumed
that the energy intensities will continue to decline but at lower rates. The future demand
for energy in agriculture is estimated using the future value added and the energy
intensities for the period 2005-2030. The results are shown in Table (4.24).
Table 4.23. Energy Intensity in the Agriculture Sector (2004)
Energy
Intensity*
(2004)
Change in Energy
Intensity
1996- 2004(%)
Change in Energy
Intensity
2005-2030 (%)
Energy
Intensity
(2030)
Gasoline 0.001
-2 -1.6 0.001
Kerosene 0.009 -19 -6.7 0.001
Gas oil 0.410
-4 -2.2 0.23
Fuel Oil 0.001 -22 -7.3 0.0001
Electricity 0.179 2 1 0.23
Total 0.59 -3.4 -1 0.47
* BOE/Const. 1997 million rials
1. The Vision has projected the future growth of the agriculture sector as 6.5 and 5.6 percent. These growth rates do not seem to be realistic given the past trend and restrictions such as the scarcity of the water resources.

71
Table 4.24
Agriculture Demand for Energy (2005-2030)- mboe
2005 2030 Growth (%)
Gasoline 0.09 0.12 0.91
Kerosene 0.50 0.17 -4.06
Gas Oil 24 25.9 0.31
Fuel Oil 0.03 0.01 -4.87
Electricity 10 26.6 3.66
Total 35 52.8 1.60
The energy demand in the agriculture sector will grow on average by 1.60
percent per year reaching from 35 million BOE in 2005 to 52.8 million BOE in 2030.
Demand for kerosene and fuel oil will decline, but demand for gas oil, gasoline, and
especially electricity will increase. The higher growth in electricity demand in the sector is
consistent with the current policy of making electricity accessible to all rural areas and
particularly of encouraging people to switch from the gasoline or gasoil water pumps to
electrical pumps. The future trend of energy use in the agriculture sector is shown in
Figure (4.7).

72
0.0
5.0
10.0
15.0
20.0
25.0
30.0
2005 2010 2015 2020 2025 2030
Gas Oil Kerosene Gasoline Fuel Oil Electricity
Figure 4.7. The Energy Demand In The Agriculture Sector, BAU Scenario (2005-2030)-
mboe
5. Total Energy Demand
5.1. Sectors
Total demand for primary energy will increase on average by 2.5 percent per year
reaching from 970 mboe in 2005 to 1821 mboe in 2030 in the BAU scenario. The
manufacturing industries will have the highest growth in demand for energy with an
average growth of 3.6 percent per year followed by the residential and transport sectors
with 3.4 and 2 percent annual growth, respectively. The demand for energy in the
commercial sector will grow on average by 1.3 percent annually, public sector by 1
percent, and agriculture sector by 0.3 percent. Table (5.1) and Figure (5.1) show the
BAU Scenario results for energy demand in different sectors for the period 2005-2030.

73
Table 5.1
Total Primary Energy Demand in Iran by Sectors, BAU Scenario (2005-2030),
2005
(mboe)
Share
(%)
2030
(mboe)
Share
(%)
Growth
(%/year)
Households 259 37.2 592 42.8 3.4
Manufacturing Industries 135.6 19.4 326 23.6 3.6
Transport 218 31.5 356 25.8 2
Public 11 1.6 14 1.0 1
Commercial 49.5 7.1 68 4.9 1.3
Agriculture 24.5 3.5 26.2 1.9 0.3
Total 698 100 1,382 100 2.8
Electricity 272 440 1.9
Total (including electricity) 970 1,822 2.6
0
200
400
600
800
1,000
1,200
1,400
1,600
2005 2010 2015 2020 2025 2030
MB
OE
Household_Oil & Gas Manufacturing Industries Commercial Public Agriculture Transport
Figure 5.1- Total Primary Energy Demand by Sectors, BAU Scenario (2005-2030)

74
The demand for electricity by all sectors will increase on average by 2.7 percent
annually reaching from 144 GWh in 2005 to 384 TWh in 2030. The commercial and
agriculture sectors demand for electricity will grow at higher rates than the average
growth rate for the economy, and therefore, theirs shares of electricity demand will
increase from 15 and 7 percent in 2005 to 16 and 10 percent in 2030, respectively. The
other sectors demand for electricity will grow at a rate lower than the average growth in
the economy, and as a result their shares will reduce slightly in 2030. Figure (5.2) shows
the demand for electricity by different sectors in the BAU scenario for the period 2005-
2030.
In 2030, 96 percent of electricity produced will be based on fossil fuel power
generating plants. The remaining 4 percent will be produced by the renewable and
nuclear plants. Natural gas will be the main source (79 percent) of fuel for the power
generating plants by 2030. The renewable sources in power generating plants will grow
on average by 3.6 percent per year reaching from 2.8 mboe in 2005 to 6.7 mboe in
2030,. It is also assumed that the nuclear energy will contribute to the power generation
by producing 11 mboe starting in 2010.
0
50,000
100,000
150,000
200,000
250,000
300,000
2005 2010 2015 2020 2025 2030
GW
h
Household Industy Commercial Public Agriculture
Figure 5.2- Demand for Electricity by Sectors in BAU Scenario (2005-2030)

75
The structure of the energy demand will change according to the policies and the
technological changes in the next 25 years. Specifically, the shares of households and
manufacturing industries of total energy consumption will increase from 37 and 19
percent to 43 and 24 percent, respectively. However, the shares of transport,
commercial, public, and agriculture sectors will decrease from 31, 7, 1.6, and 3.5 percent
in 2005 to 26, 5, 1, and 2 percent in 2030, respectively. The increasing shares of
household and manufacturing industries in total demand for energy are mainly due to the
increase in population and economic activities in those sectors and decreasing energy
demand shares of transport and other sectors are due to technological improvement and
government policies. Table (5.1) and Figure 5.3 show the changes in total energy
demand by all sectors and thei shares for the period 2005-2030.
0%
20%
40%
60%
80%
100%
120%
2005 2030
Household Manufacturing Industries Commercial
Public Agriculture Transport
Figure 5.3- The Shares of Demand for Energy by Sectors in BAU Scenario (2005-2030)

76
5.2. Energy Type
In the BAU scenario, natural gas demand will have the highest growth rate with 3.5
percent growth per year on average, reaching from 501 mboe in 2005 to 1,171 mboe in
2030. The demand for oil products (fuel oil, gas oil, and gasoline) will grow on average
between 1 to 2 percent. Demand for kerosene, however, will decrease on average by
4.6 percent per year in this period. Renewable energies will grow on average by 3.6
percent per year for the next 25 years. Table 5.2 and figure 5.4 show the total energy
demand by type of energy in 2005 and 2030.
Table 5.2- Total Energy Demand by Type of Energy , BAU Scenario (2005-2030), mboe
2005 Share(%)
2030 Share(%)
Growth
(%)/year
Gasoline 110 11 164 10 1.62
Kerosene 50 5 15 1 -4.6
Gas oil 175 18 271 15 1.8
Fuel Oil 104 8 140 7 1.2
Natural Gas 501 52 1,171 63 3.5
LPG 11 2 13 1 0.9
CNG 6 1 8 1 0.99
Jet Fuel 10 1 20 1
Total Energy Demand 970 100 1,779 100 2.8
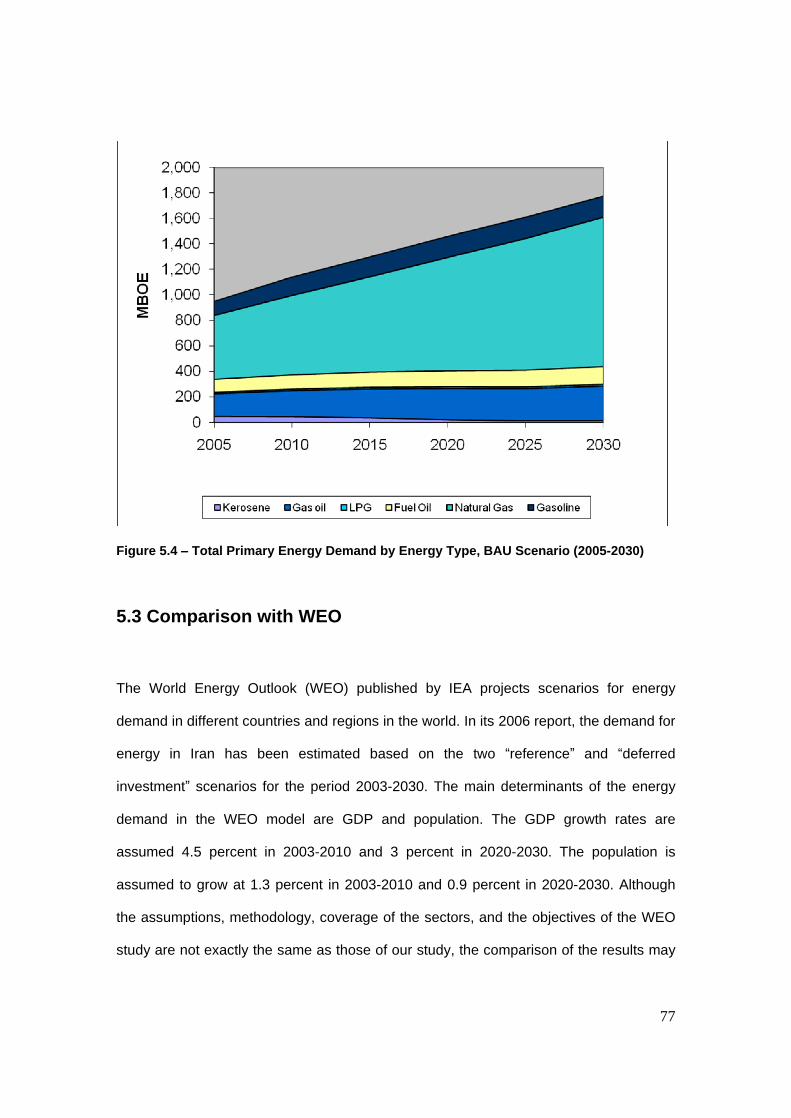
77
Figure 5.4
Total Primary Energy Demand by Energy Type, BAU Scenario (2005-2030)
5.3 Comparison with WEO
The World Energy Outlook (WEO) published by IEA projects scenarios for energy
demand in different countries and regions in the world. In its 2006 report, the demand for
energy in Iran has been estimated based on the two reference and deferred
investment scenarios for the period 2003-2030. The main determinants of the energy
demand in the WEO model are GDP and population. The GDP growth rates are
assumed 4.5 percent in 2003-2010 and 3 percent in 2020-2030. The population is
assumed to grow at 1.3 percent in 2003-2010 and 0.9 percent in 2020-2030. Although
the assumptions, methodology, coverage of the sectors, and the objectives of the WEO
study are not exactly the same as those of our study, the comparison of the results may

78
prove helpful. For instance, WEO seems to have used aggregate data, whereas our
study uses micro level data, particularly in household sector, to model the energy
demand. Furthermore, our GDP growth assumption is higher by 1 percentage point than
WEO assumption for the period ending 2010. There are also differences in classification
of the sectors, but we rearrange the results to make them comparable. Figure 5.5 shows
a comparison between the primary energy demand in our BAU scenario results and the
WEO s reference scenario results for the year 2030.
0
200
400
600
800
1000
1200
1400
WEO Our Study
mb
oe
Oil Gas Renewables & Nuclear
Figure 5.5
Total Primary Energy Demand in WEO and Our Study, BAU Scenario (2030)
Overall, the estimates for the total final energy consumption by the two studies are
rather close, but WEO s total calculations are lower than our calculations by 133 MOBE
in 2030. In our study, the total primary energy demand will grow on average by 2.8
percent, but in WEO study by 2.6 percent. The main source of difference is the lower
demand for natural gas and higher demand for oil by WEO. Demand for oil products and
natural gas in our study will increase on average by 1.4 and 3.6 percent per year, but in
79
WEO by 1.9 and 2.9 percent, respectively. The use of renewable and nuclear energy is
also projected higher in the WEO than our study. However, renewable energy will have
a higher growth rate in our High-Renewable scenario, which is presented in the Scenario
Analysis in part II. The other source of difference in the two studies is the projection of
total electricity generation, which will increase on average by 3.2 percent per year in
WEO , but 2.8 percent in our study.
5.4. Energy and Environment
Fossil fuels produce greenhouse gases such as NOx, SO2, CO2, CO, and SPM. In 2005,
the energy users in the economy produced in total 1 million tones (mt) of NOx, 0.8 mt of
SO2, 382 mt of CO2, 87 mt of CO, 2 mt of CH, and 0.3 mt of SPM. The transport sector is
by far the most pollutant sector in the economy, followed by household, industry, and
power generating plants. The amount of CO2 emissions by different sectors in 2005 are
as follows: Transport 105 mt (27.5 percent), residential, commercial, and public 112
(29.3 percent), power generating plants 95 mt (25.1 percent), industry 59 mt (15.4
percent), and agriculture 10 mt (2.6 percent). Although the substitution of natural gas for
oil products and the development of renewable resources in the power generating plants
will mitigate CO2 emissions problems, an increase in energy demand especially by
manufacturing industries and households will raise the aggregate pollution level
significantly. Table (5.3) shows a summary of the CO2-emissions from primary energy
use for the period 2005-2030. CO2 emissions from oil will grow on average by 1.4
percent and from gas by 3.5 percent per year for the next 25 years. The total CO2
emissions will grow on average by 2.5 percent per year reaching from 360 Mt in 2005 to
667 Mt in 2030.

80
Table 5.3 - CO2 emissions From Primary Energy Consumption (2005-2030), Mt
2005 2010 2020 2030
Growth
(%)/year
Oil 205 241 271 290 1.4
Gas 155 196 287 377 3.5
Total 360 437 558 667 2.5

81
Part II
Demand for Energy:
Scenario Analysis

82
Part II: Scenario Analysis
In this part, we develop alternative scenarios for the energy demand in Iran using the
results of the BAU scenario presented in part I as a reference. Specifically, we consider
four scenarios as follows:
1. High Efficiency scenario
2. High Renewables scenario
3. Combined Efficiency and Renewable scenario
4. Constrained scenario
In the High EfficiencyEfficiency scenario, we draw on the efficiency parameters in
energy use in each sector of the economy leaving the renewable resources at the BAU
levels. In the High Renewable scenario, we assume that the potentials of the renewable
resources will be highly utilized keeping the efficiency parameters constant as in the
BAU level. In the Combined Efficiency and Renewable scenario, we assume that the
country will utilize both the efficiency and the renewable potentials in the future. Finally,
in the Constrained scenario, we assume that some of the assumptions in the High
Efficiency and High Renewables scenarios may not be realized and therefore impose a
number of restrictions on both scenarios.
An underlying assumption in all four scenarios is that the policies regarding
energy prices will change in a way to reflect the real cost of energy to consumers. This
will encourage higher efficiency in energy use and will allow for investment in the
renewable resources in different sectors of the economy. One of the most important
reasons why the Iranian energy system is quiet inefficient, is the fact that oil, gas, and
electricity prices are extremely low compared to the international average and the world

83
market price of crude oil. The huge amount of subsidies for the energy sector, which
account for more than10 percent of GDP, has led to government budget imbalances as
well as increasing demand for gasoline, electricity, and natural gas in different sectors.
As long as the domestic energy prices are so low, there is less incentive to invest in
technologies that are more efficient and to change energy wasting behavior in different
sectors of the economy.
The energy market in Iran is controlled by the state. This means that the
government mostly undertakes investment, production and even distribution in the
energy sector. The government also sets the production quantities (domestic, exports,
and imports) and prices on different energy carriers and products. Therefore, there is no
competition in production and distribution and political factors, rather than economic and
market conditions, affect the energy prices. This may well be one additional reason why
energy efficiency is on a low level and why there is no incentive to invest in renewable
energy resources. Although the fourth FYDP (2004-2009) called for a price reform in the
energy market, the new parliament and government did not implement it. However, there
are indications that the past policies cannot not continue and price reform is inevitable. If
the domestic energy consumption continues to grow as projected in the BAU scenario,
Iran s ability to export oil will be diminished largely. This is obviously a warning to the
government whose budget is heavily dependent on the oil export revenues.
For the analysis of the four alternative scenarios, some principal assumptions have
been made as follows:
The price of oil will continuously approach the boarder prices for crude oil. The
electricity price will rise and reflect the true cost of electricity production and
distribution. A rise in relative energy prices will change people s behavior in

84
energy demand and their investment into efficient appliances, buildings, cars,
and power plants.
Any cost-related decision concerning energy efficiency at the individual level is
based, more or less, on a trade-off between the up-front investment cost and the
expected future energy expenses. As the energy price increases, energy efficient
solutions with typically higher up-front costs become more attractive. Making a
good investment decision, for domestic appliances or industrial devices, from
the energy efficiency viewpoint, certainly relies on a sound economic calculation.
Good or adequate (and not subsidized) price signals are necessary to make a
correct calculation.
To gain efficiency, government may change its past policy of full provision to
allow for private sector investment in the energy sector. Government would still
be able to regulate the market to protect consumers from monopolies exercising
market power. Efficient regulation will lead to energy prices that reflect the cost of
energy supply, i.e. the long-term marginal cost for electricity and the long-term
price of oil products in international markets for fossil fuels.
In addition to price and market reform, there are other measures, which would
help to remove the existing barriers to energy efficiency as follows.
o The availability of efficient appliances and production devices
o The availability of good information for consumers about such equipment
and devices
o Public awareness on energy efficiency, in particular awareness of the final
consumers about the individual and national benefits of energy efficiency
and climate protection

85
o Removal of other hampering factors such as legal and administrative
barriers
o The availability of technical, commercial and financial services
These policy measures are necessary in market economies to reinforce the role
of energy prices, and to create a framework that provides cost effective solutions for the
consumers. Any efficiency improvements in oil consuming sectors like the transport
sector will result in direct benefits to the balance of oil trading, because Iran would have
to import less gasoline from other countries. Instead of subsidising the consumed energy
through the national fund, the saved resources could be sold in the world market.
Improving energy efficiency through highly efficient electric appliances or efficient lights
will have two major benefits. First, the electricity demand growth will slow down, which
reduces the expansion of investment needs in the electricity sector. Second, the costs
for the saved kilowatt-hours are usually lower than the costs of electricity production.
6. Scenario I: High Efficiency
High Efficiency is the first scenario we propose for the future energy demand in Iran. In
this scenario, we will focus only on the efficiency parameters in the energy demand in
different sectors keeping all other things, including renewable potentials, constant. The
most important efficiency parameter is energy intensity, which changes with
advancement in technology and a change in the structure of the economy. Other things
being constant, more efficient technology will decrease the energy intensity. A change in
the structure of the economy in favour of less energy intensive production will also
reduce the energy intensity. Our primary concern in this scenario will be a change in
energy intensity due to a change in technology. For instance, in the household sector,

86
we assume that light bulbs and other appliances that are more efficient will substitute the
traditional inefficient devices. Likewise, in the transport sector, we assume that cars with
more efficient engines will drive away the cars with low efficient engines. In addition to
the technological effect, we assume that price reform will induce higher level of
consciences in the consumers, household and industry, so that they will be more vigilant
in their use of energy.
6.1. Households
We analyze the High Efficiency scenario in the residential sector in two sections:
Electricity and Heat.
A) Electricity
The most important use of the electricity in household is lighting (33 percent),
refrigerator and freezer (26 percent), and air conditioning (about 10 percent). TV
and computer s share of electricity use is 8 percent, but it will double by 2030 in
the BAU scenario.
Lighting
Compact fluorescent light bulbs (CFL) use 60 to 80 percent less energy compared to the
traditional light bulbs, producing the same level of lighting. It is assumed that compact
fluorescent bulbs will substitute 50 percent of the incandescent lamps that households
are using today by the year 2020. In the year 2030, households will substitute 80 percent
of the incandescent lamps. It is also assumed that through substituting old T12 lamps by
T8 and T5 with electronic starters, electricity consumption of fluorescent lamps will be 40
percent less while keeping the same brightness. Overall, the electricity use by lights in

87
the residential sector in 2030 will be about 40 percent less in the efficiency scenario
compared to the BAU scenario.
Refrigerators and Freezers
It is assumed that in the year 2020, the average consumption of an Iranian refrigerator
would be 20 percent higher than the consumption of an average refrigerator bought in
Central Europe today. For the year 2030, the average consumption could be 20 percent
higher than that of the most efficient refrigerators, which are sold in Europe today. The
same relation is assumed for freezers and combined appliances (refrigerator and freezer
in one appliance). The overall electricity consumption by refrigerators and freezers in the
residential sector in 2030 will be 67 percent less in the efficiency scenario compared to
the BAU scenario.
Iron
Using irons equipped with thermostat-regulation would lead to a 50 percent reduction in
electricity use for ironing. The electricity consumption of this appliance would still be five
times higher than the consumption for ironing in Germany.
Air Conditioner
It is assumed that there will not be a significant change in the water-cooler system, but
there will be an efficiency improvement in the new air conditioning system. Although the
need for cooling may decrease, the amount of equipment and comfort demands and as
a result cooling loads will increase. Overall, the electricity consumption for the cooling
systems in the residential sector will be reduced by 30 percent in 2030 under the High
Efficiency scenario compared to BAU.

88
TV and Computer
It is assumed that there will not be a significant change in the electricity consumption by
computers, but through change from CRT-monitor to LCD-monitor TV, the electricity
consumption of TV-devices will go down 25 percent until the year 2030.
Others
For the other appliances no changes in efficiency are assumed.
0
500
1,000
1,500
2,000
2,500
3,000
3,500
4,000
2005 2010 2015 2020 2025 2030
kWh/H
h,y
ear
BAU EFF
Figure 6.1 - Average Electricity Demand in BAU and Efficiency (EFF)
Scenarios (2005
2030)
kWh/Hh, year
To achieve the high-efficiency parameters in the household sector, the following
policies are required.
Minimum standards for appliances
Market oriented electricity prices
Consumer information about electricity consumption of appliances and about
efficient products

89
Efficiency labeling
Special marketing measures for highly efficient appliances
Building standards for efficient cooling system
Figure 6.1 shows the average electricity consumption by households in the efficiency
and BAU scenarios. According to our results, the average electricity consumption by
households in the efficiency scenario will be 42 percent lower than that in the BAU
scenario and thus more than 25% below the current level despite higher penetration
rates and higher comfort levels per household.
B) Heat
For the heating sector, the following assumptions have been made:
For existing buildings a renovation rate of 2 percent has been assumed. This means
that during a period of 50 years, all buildings will be renovated to a better standard.
The energy saving per building is assumed to be 50 percent on average, a value that
has already been shown to be feasible in several case studies for Iran. The technical
potential to make a building more efficient is about 90 percent. These are the results
of many projects and studies in Germany.
For new buildings in the year 2010 and later, we assume a standard that is about 80
percent better than the average consumption of today s buildings.
We also assume that by the year 2030, 10 percent of the houses will be demolished
and replaced by new and better buildings and that there will be a 10 percent increase
in the size of the living-area per person in Iran.

90
For the supply of warm water, we assume a higher efficiency through better boilers
and better insulation of storage and taps.
To achieve the efficiency scenario targets, the following policies are required.
Implementing standards for new buildings and for building-renovations
Financial help for home-owners to bear the investment
Education for builders and architects
Control system for monitoring the building standard
The total energy demand for heat by households in the efficiency scenario will be 52
percent less than that in the BAU scenario in 2030. Figure 6.2 shows the heat energy
consumption of households in the two BAU and efficiency scenarios.
0
100
200
300
400
500
600
700
2005 2010 2015 2020 2025 2030
MB
OE
BAU EFF
Figure 6.2 - Household Energy Demand (Heat) in BAU and Efficiency (EFF) Scenarios (2005-2030), mboe
91
6.2. Industry
The energy savings in the industry can be achieved by taking the following measures
(ECOFYS, 2007).
Efficient motor system to reduce electricity consumption of electric motor
systems, which accounts for 65 percent of the electricity consumption use
by industry
Improved monitoring and process control, which can lead to higher
efficient use of energy in industry. This includes monitoring and targeting,
computer integrated manufacturing and process (temperature, airflow,
moisture, oxygen, etc.) control. These measures can account for 2 to 18
percent of energy savings.
Process optimization and integration (pinch analysis). This is especially
important when there are multiple heating and cooling demands in a
production plant. Process integration saves energy by matching
components of the system in terms of size, function, and capability. The
potential saving by process optimization and integration is 10 to 25
percent.
Recycling, especially in the aluminium and steel production. Producing
aluminium by recycled scrap will use only 5 to 10 percent of the energy
used to produce aluminium, because it involves re-melting of the metal
instead of the electrochemical reduction process.
The industry in Iran has seen immense growth rates of almost 15 percent per
year over the last 15 years, which has led to significant increases in energy
consumption. In spite of decreases of energy intensity of about 7 percent per year

92
between 1990 and 2005, the energy intensity of many industrial installations is still
significantly above (about 36 percent) world average. This is mainly due to the low
energy prices, lack of capital for investment in new and/or more efficient machinery, and
poor public management of the majority of industrial plants.
Between 2000 and 2007, The Iran Energy Efficiency Organization (SAABA), a
subsidiary of the Tavanir, and the Iran Fuel Conservation Company (IFCO), a subsidiary
of National Iranian Oil Company, have conducted several studies and audited many
manufacturing industries to estimate the energy saving potentials. Table 6.1 shows the
auditing results for the four major aluminium plants by SAABA in 1999. The metallic
manufacturing industry consumes 25 percent of the energy used in the total
manufacturing industries and aluminium plants consume 17 percent of the total energy
consumed by the metallic industries. Improved monitoring and process control have
been identified as the most important sources of energy savings in the audited plants.
Table 6.1
Energy Savings in Aluminium Manufacturing Industry
Unit Product
Electricity
Consumption
(MWh/year)
Fuel
Consumption
(GJ/year)
Electricity
Saving
Potential
(MWh/year)
Fuel
Saving
Potential
(GJ/year)
Total
Energy
Saving
Potential(B
OE/year)
Electricity
saving
(%)
Fuel
saving
(%)
1 Aluminium
Profile 5117 82988 1463.2 37509.5
29 45
2 Aluminium
Profile 6408 71513 2290.7 27461 8531 36 38
3 Aluminium
Profile 3397 166174 1222.8 53175 10848 36 32
4 Cable 3654 47520 438.4 20433.7 4113 12 43
Source: Tavanir, SAABA, 1999

93
Tables 6.2 and 6.3 summarize the auditing results by IFCO. They show the
current energy consumption and the specific energy index for the selected industries as
well as the energy saving potentials in those industrial groups. Both demonstrate that
using best practice technology would lead to high energy savings of more than 40
percent on average and also to great savings of energy costs.
Table 6.2
Energy Consumption in Selected Manufacturing Industries
Current Energy Specific Energy Index (GJ/ton)
mboe
/Year
PJ Country
Average
Best
Practice
World
Average
Current
Condition
New
Plants
Glass 3.6 22.2 14.77 7.5 7.95 13.63 9.4
Sugar 8.4 51 36 12 19.7 27.6 13.8
Cooking Oil 1.8 11.4 10 5 6 7.5 6.4
Tire 0.83 5 31.1 17 19 22.7 17.44
Brick 1.7 104 4.8 1.73 2.2 3.9 2.5
Ceramic 3.7 22.7 0.13 0.06 0.07 0.12 0.09
Cement 18 112 3.5 2.6 2.72 3.45 3
Stucco 2.4 14.8 1.69 0.98 0.9 1.3 0.98
Lime 0.6 3.5 6.21 3.8 3.6 4.32 3.78
Iron and Steel 29.9 182.2 15 11 11 12.3 11.3
Source: Optimizing Energy Consumption in Industry Sector in the Next 20 Years, IFCO, 2007

94
Table 6.3
Energy Savings in Selected Manufacturing Industries
Saving Potential Saving Potential (%) Million
GJ
Million
m3
Value
(bn. Rials)
Best
Practice
Current
Condition
New
Plants
Glass 8 214.5 408 49 8 36
Sugar 31 836.2 1589 67 23 62
Cooking Oil 4 109.9 209 50 25 36
Tire 2.2 59 112 45 27 44
Brick 49.8 132.2 2512 64 19 48
Ceramic 6.9 185.3 352 54 8 31
Cement 16 424.8 807 26 1 14
Stucco 0.62 165.4 314 42 23 42
Lime 1.3 36.6 70 39 30 39
Iron and Steel 44.9 1,193 2267 27 18 25
Source: Optimizing Energy Consumption in Industry Sector in the Next 20 Years, IFCO, 2007
Based on the auditing results above, the following assumptions for the efficiency
scenario in industry are made.
It is assumed that real monetary growth and physical production will be
decoupled by a rate of 1 percent per year in the future (as in the BAU scenario),
as it is typical in more advanced economies. It is also assumed that existing
plants will increase their production levels through a higher capacity utilization
and expansions by about 1 percent per year. The residual production will come
from completely new producing sites. By 2030 thus the number of plants will
almost double and new installations will account for about 50 percent of physical
production.

95
For the technical standard of refurbished and new power plants it is assumed that
the current best available technology (BAT) as described in the tables 6.2 and
6.3 will be utilized. This standard will further improve in the future by about 1
percent per year. For sectors not covered by the analyses of SABA, an average
savings factor of 50 percent by using BAT versus currently installed technology
has been assumed based on detailed study results from Ecofys (2007).
It is furthermore assumed that existing plants will be almost completely (83
percent) reinvested by 2030. This would enable most existing plants to produce
with BAT by 2030.
The overall energy intensity of the Iranian industry declined by more than 50 percent
or by an average of 7 percent per year for the period 1990-2005. In the efficiency
scenario, a further decline by more than half, or an annual rate of 3.1 percent, will be
achieved by 2030. Although this decrease in energy intensity in industry is a continuation
of the past trend, its realization requires strong policies to promote efficiency. The 3.1
percent annual decline in energy intensity in industry under the efficiency scenario is in
the same range as the German national target of doubling energy productivity, which
would need about 3 percent energy intensity decrease by 2020. Figure 6.3 shows the
total energy consumption in the industry sector under the BAU and the High Efficiency
scenarios. The total energy consumption in industry in the efficiency scenario will be 41
percent less than that in BAU scenario in 2030.

96
0
50
100
150
200
250
300
350
400
2005 2010 2015 2020 2025 2030
mb
oe
BAU EFF
Figure 6.3 - The Final Energy Demand in Industry in the BAU and Efficiency (EFF)
Scenarios (2005-2030), mboe
6.3. Transport
Fuel efficiency in transport sector can be achieved in two ways:
Change in the number of cars and travel distance
Change in technology
The basic assumption in the transport sector is that the price of gasoline and gas
oil will eventually increase to the border prices1. In this case, the number of private
vehicles will be lower and the average yearly travel distance will be shorter compared to
the BAU scenario. Furthermore, the share of public transport will increase, manily
because of the higher cost of private cars. We assume that the number of private cars
will almost double from 244 800 in 2005 to 433 800 in 2030 (instead of 602 400 in BAU-
scenario). The average travel distance per private car will go down from 24 000 km/year
1This is still significantly less than in most OECD countries, which levy high taxes on transport fuels.

97
to 17 600 km/year (a twenty percent decrease compared to the BAU scenario). This is
still about 60 percent more than the average travel distance per car in developed
countries like Germany today.
Passenger cars can be more fuel efficient if they have better engines, reduced
weights, friction, and drag. The hybrid cars, which combine a conventional engine with
an electric engine, are now consuming about 4.3 liter ge/100 Km. It is suggested that
this rate can further decline to 1 liter ge/100 Km, when new light materials and new
propulsion technologies are used. The average specific energy consumption for Iranian
private cars in the BAU scenario will decrease from 14 litre/km to 10.litre/100km by
2030. For the efficiency-scenario, we assume that in 2020, the average consumption of
private cars in Iran will be the same as in Germany in the year 2006, which was 7.8
litres/100km. For the year 2030, we assume that private cars in Iran will consume
gasoline on average in the same amount of a fairly efficient middle-class car today, that
is 6 litres/100 km. The efficiency of busses and trains will rise by 20 percent, the
efficiency of aviation will rise by 45 percent through newer and bigger planes.
To achieve the targets above, the following policies are required.
Stepwise increase of gasoline price to border price
More investment in bus and train-system
Consumer awareness on the efficiency of cars and environment
Labelling for cars and trucks
Introduction of car fleet efficiency-standards for car importers
Education courses for efficient driving
An improvement in road conditions

98
Efficiency Improvement in domestic refineries
Figure 6.4 shows the total energy consumption in the transport sector under the
BAU and the High Efficiency scenarios in 2005-2030. The total energy used in the
transport sector in the efficiency scenario will be 35 percent lower than that in the BAU
scenario.
0
50
100
150
200
250
300
350
400
2005 2010 2015 2020 2025 2030
mb
oe
BAU EFF
Figure 6.4 - Final Energy Demand in the Transport Sector under the BAU and High-
Efficiency (EFF) Scenarios (2005-2030), mboe
6.4. Other Sectors
Other sectors include public buildings, the commercial sector and the agricultural sector.
As the results of surveys show (see table 6.4 below), public buildings and in particular
hospitals have extremely high energy intensities. Nevertheless, high saving potentials of
between 30 percent and 50 percent have been proven even with current low energy
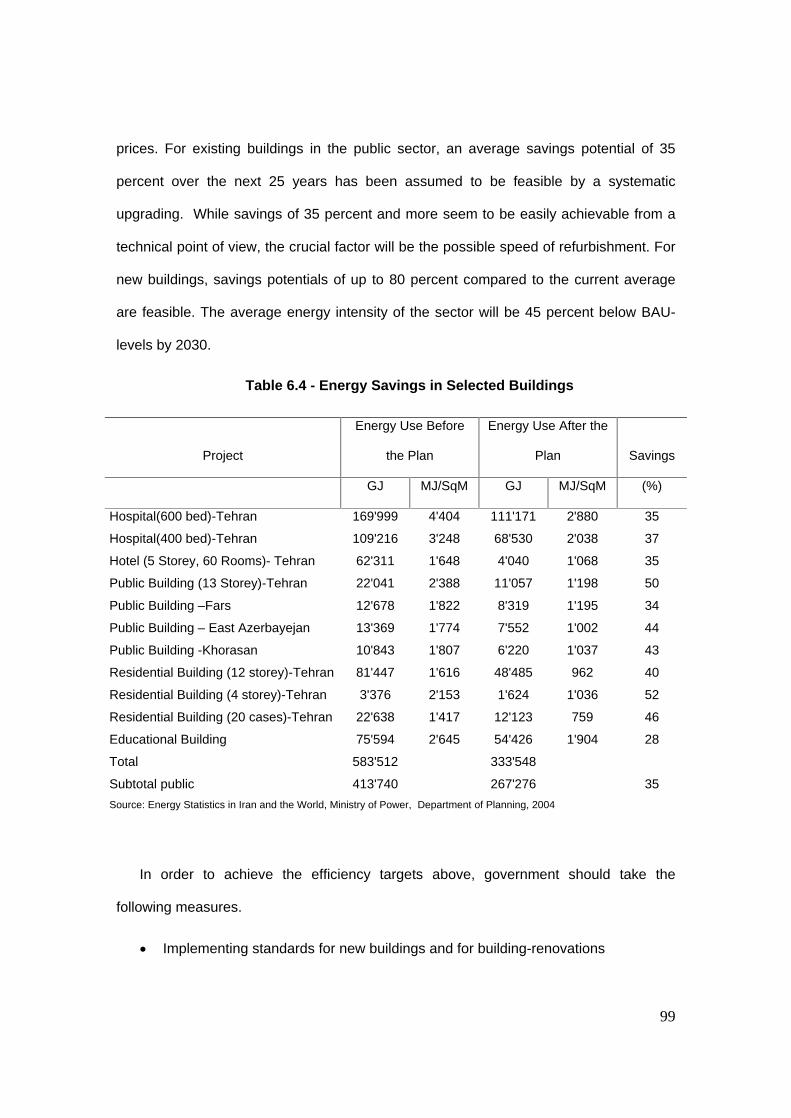
99
prices. For existing buildings in the public sector, an average savings potential of 35
percent over the next 25 years has been assumed to be feasible by a systematic
upgrading. While savings of 35 percent and more seem to be easily achievable from a
technical point of view, the crucial factor will be the possible speed of refurbishment. For
new buildings, savings potentials of up to 80 percent compared to the current average
are feasible. The average energy intensity of the sector will be 45 percent below BAU-
levels by 2030.
Table 6.4 - Energy Savings in Selected Buildings
Project
Energy Use Before
the Plan
Energy Use After the
Plan Savings
GJ MJ/SqM GJ MJ/SqM (%)
Hospital(600 bed)-Tehran 169'999 4'404 111'171 2'880 35
Hospital(400 bed)-Tehran 109'216 3'248 68'530 2'038 37
Hotel (5 Storey, 60 Rooms)- Tehran 62'311 1'648 4'040 1'068 35
Public Building (13 Storey)-Tehran 22'041 2'388 11'057 1'198 50
Public Building Fars 12'678 1'822 8'319 1'195 34
Public Building
East Azerbayejan 13'369 1'774 7'552 1'002 44
Public Building -Khorasan 10'843 1'807 6'220 1'037 43
Residential Building (12 storey)-Tehran
81'447 1'616 48'485 962 40
Residential Building (4 storey)-Tehran 3'376 2'153 1'624 1'036 52
Residential Building (20 cases)-Tehran 22'638 1'417 12'123 759 46
Educational Building 75'594 2'645 54'426 1'904 28
Total 583'512 333'548
Subtotal public 413'740 267'276 35
Source: Energy Statistics in Iran and the World, Ministry of Power, Department of Planning, 2004
In order to achieve the efficiency targets above, government should take the
following measures.
Implementing standards for new buildings and for building-renovations
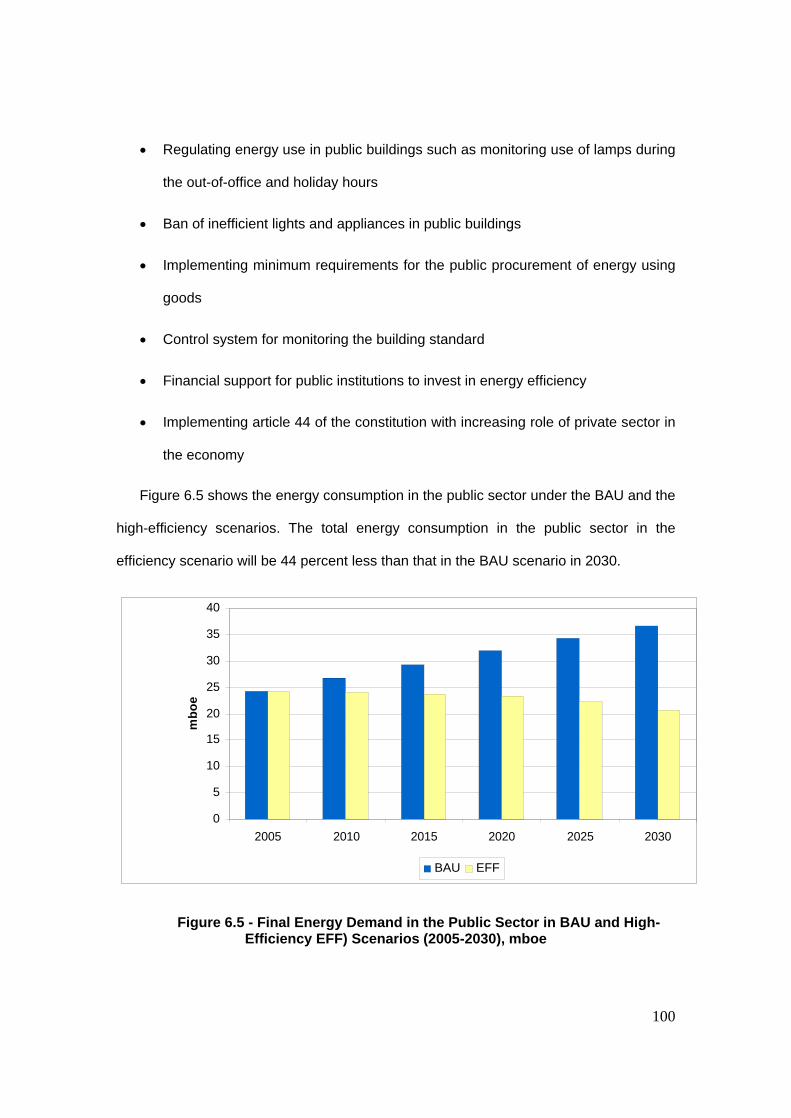
100
Regulating energy use in public buildings such as monitoring use of lamps during
the out-of-office and holiday hours
Ban of inefficient lights and appliances in public buildings
Implementing minimum requirements for the public procurement of energy using
goods
Control system for monitoring the building standard
Financial support for public institutions to invest in energy efficiency
Implementing article 44 of the constitution with increasing role of private sector in
the economy
Figure 6.5 shows the energy consumption in the public sector under the BAU and the
high-efficiency scenarios. The total energy consumption in the public sector in the
efficiency scenario will be 44 percent less than that in the BAU scenario in 2030.
0
5
10
15
20
25
30
35
40
2005 2010 2015 2020 2025 2030
mb
oe
BAU EFF
Figure 6.5 - Final Energy Demand in the Public Sector in BAU and High-Efficiency EFF) Scenarios (2005-2030), mboe

101
In commercial buildings, energy consumption and potential savings are similar to
those in public buildings. However, due to a more dynamic development in the
commercial sector, higher refurbishment rates and new building rates are assumed. This
leads to overall savings of about 55 percent versus BAU by 2030. The results are
presented in Figure 6.6. Also for this sector, several policies and measures are available
to improve energy efficiency such as minimum standards for building design and electric
appliances including air conditioning, information and financial support for energy
efficiency investment.
0
10
20
30
40
50
60
70
80
90
1 2 3 4 5 6
mb
oe
BAU EFF
Figure 6.6
Final Energy Demand in the Commercial Sector in BAU and High Efficiency (EFF) Scenarios (2005-2030), mboe
In the agricultural, sector the achievable savings are probably lower than those in
the public and commercial sectors. The core reason is the more diverse use of energy,
and often limited availability of capital and knowledge about technology due to remote
location and socioeconomic situation. Savings are assumed to be 40 percent versus
BAU for electricity and 30 percent for fuels. The results are shown in Figure 6.7. In the

102
agricultural sector, further to other measures applied in other sectors, it is particularly
important to start targeted information campaigns and to provide financial support in
order to be able to invest in energy efficient and thus more economical technology.
0
10
20
30
40
50
60
2005 2010 2015 2020 2025 2030
mb
oe
BAU EFF
Figure 6.7- Final Energy Demand in the Agriculture Sector in BAU and High Efficiency EFF) Scenarios (2005-2030), mboe
6.5. Total Energy Savings in High Efficiency Scenario
The total final demand for energy under the high-efficiency scenario will grow on
average by 0.4 percent per year reaching from 970 mboe in 2005 to 1,084 mboe in
2030. This means that the energy demand growth will slow down on average by 2.2
percent per year compared to the BAU scenario. Figure 6.8 shows the total final energy
demand under the high-efficiency and the BAU scenarios.

103
0
200
400
600
800
1,000
1,200
1,400
1,600
1,800
2,000
2005 2010 2015 2020 2025 2030
mb
oe
BAU EFF
Figure 6.8 - Total Final Energy Demand in BAU and Efficiency Scenarios
(2005-2030), mboe
In general, the High Efficiency scenario will lead to more than 40 percent energy
savings in the country by the year 2030. The lion share of the savings in the efficiency
scenario will be in the household sector with more than 50 percent lower consumption of
fuel compared with BAU. The savings in the industry, transport, public, and commercial
sectors will be between 30 to 40 percent. It should be noted that even though the saving
rates in the commercial and public sectors are higher than those in industry and
transport sectors, the amount of energy saved in the latter are much higher due to the
their higher level of energy consumption.
The total energy demand by energy types under the BAU and high-efficiency
scenarios in 2030 are shown in Figure 6.9. Demand for all energy careers will decline in
the high-efficiency scenario relative to the BAU scenario. The most significant decline
will be in the natural gas consumption, which will decrease by almost 50 percent.

104
Gasoline will also decrease considerably by about 42 percent. The consumption of
electricity will decrease by 35 percent, and gas oil, fuel oil and LPG by about one third.
0%
10%
20%
30%
40%
50%
60%
Household (Fuel) Industry Commercial Public Agriculture Transport Total
Figure 6.9- Savings in Efficiency Scenario Compared with the BAU Scenario, 2030, (%)
0
200
400
600
800
1000
1200
1400
Kerosene Gas oil LPG Fuel Oil NaturalGas
Gasoline Electricity
BAU EFF
Figure 6.10 - The Energy Demand by Energy Types in BAU and High-Efficiency Scenarios in 2030, mboe

105
7. Scenario II: High Renewables
In this section, we concentrate on the renewable energy potentials in Iran. We first
review all the potential resources and then present the estimation of the energy demand
under the High Renewables scenario for the period 2005-2030. Different national and
international studies were used as data base. We will mainly concentrate on electricity
generation, but will also discuss heat generation at the end of this section.
7.1. Wind power
There exist very different estimates of wind power potential in Iran. This starts from 6500
MW by World Bank, and rises to 12000-16000 MW potential by SUNA (CEERS et al.
2006). Assuming 2000 full load hours, the latter estimate leads to a potential generation
of 32 TWh/a of electricity. The forthcoming wind atlas will provide more detailed data. In
Khusistan, a German company made province-wide measurements, but the data were
not published. Some preliminary results of the study, however, were published in an
article in a German energy journal. According to this article there are some exceptionally
good wind power sites in N-E-Iran with high wind velocities (Hagenkort 2004, Kipke
2004). The German Aerospace Center generated a wind map with satellite imaging,
showing only a small wind power potential of 8 TWh/a. However, the author argues that
this is probably significantly underestimated. We assume that wind power will be able to
generate 22 TWh/a electricity by 2030, which is about 8 times higher than the electricity
generation by renewable sources in the BAU scenario.

106
7.2. Biomass
The DLR (2005) lists a biomass potential of 24 TWh/a electricity, but this figure includes
municipal waste . Since the data sources regarding biomass are not reliable, we ignore
biomass as an electricity option almost totally and use only a very low figure, i.e. 0.018
TWh/a in all scenarios by 2030.
7.3. Geothermal
Geothermal primary energy sources are relatively well investigated in Iran, but there is
still a lack of knowledge on economic and technical potentials. Talebi (2004) from SUNA
estimates the country-wide geothermal electricity potential in the range of 5000 MW to
6000 MWel. As geothermal energy can be used for base load on 24/7 basis, full load
hours (FLH) are high. Assuming 7500 FLH, about 37
45 TWh/a electricity could be
produced. However, since geothermal hot spots are far from inhabited areas, heat could
not be used. Therefore only the electrical option remains for geothermal energy
utilisation.
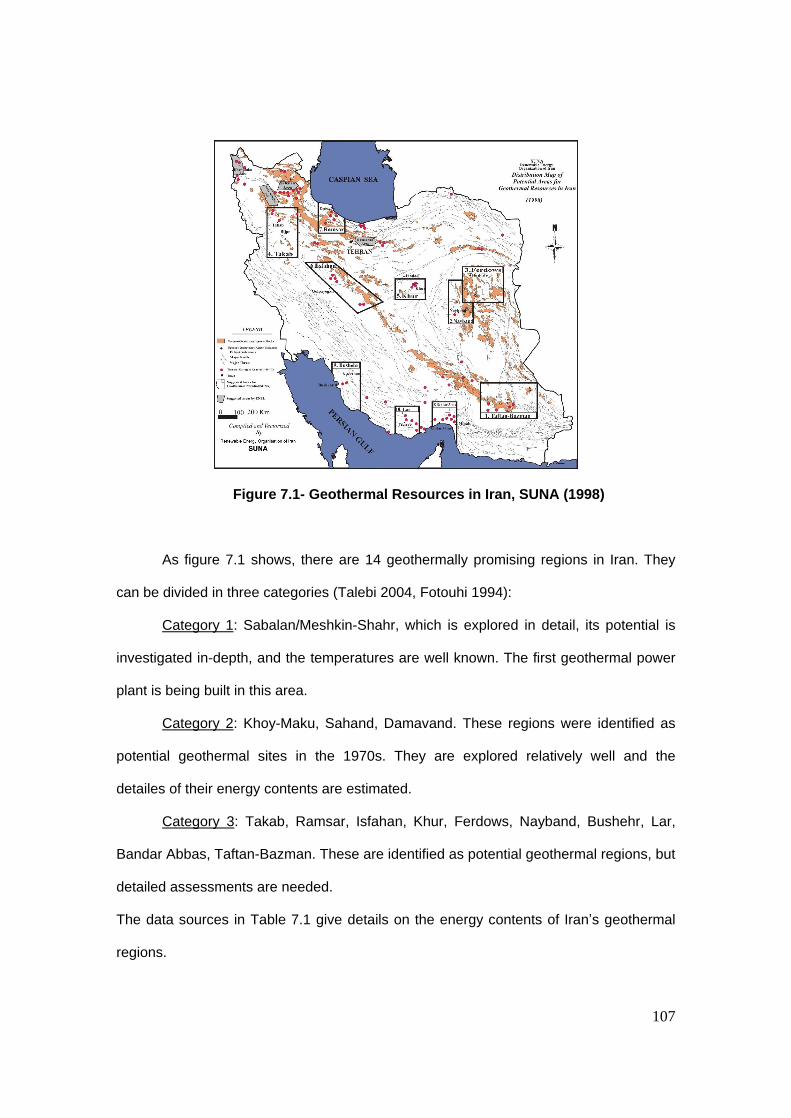
107
Figure 7.1- Geothermal Resources in Iran, SUNA (1998)
As figure 7.1 shows, there are 14 geothermally promising regions in Iran. They
can be divided in three categories (Talebi 2004, Fotouhi 1994):
Category 1: Sabalan/Meshkin-Shahr, which is explored in detail, its potential is
investigated in-depth, and the temperatures are well known. The first geothermal power
plant is being built in this area.
Category 2: Khoy-Maku, Sahand, Damavand. These regions were identified as
potential geothermal sites in the 1970s. They are explored relatively well and the
detailes of their energy contents are estimated.
Category 3: Takab, Ramsar, Isfahan, Khur, Ferdows, Nayband, Bushehr, Lar,
Bandar Abbas, Taftan-Bazman. These are identified as potential geothermal regions, but
detailed assessments are needed.
The data sources in Table 7.1 give details on the energy contents of Iran s geothermal
regions.
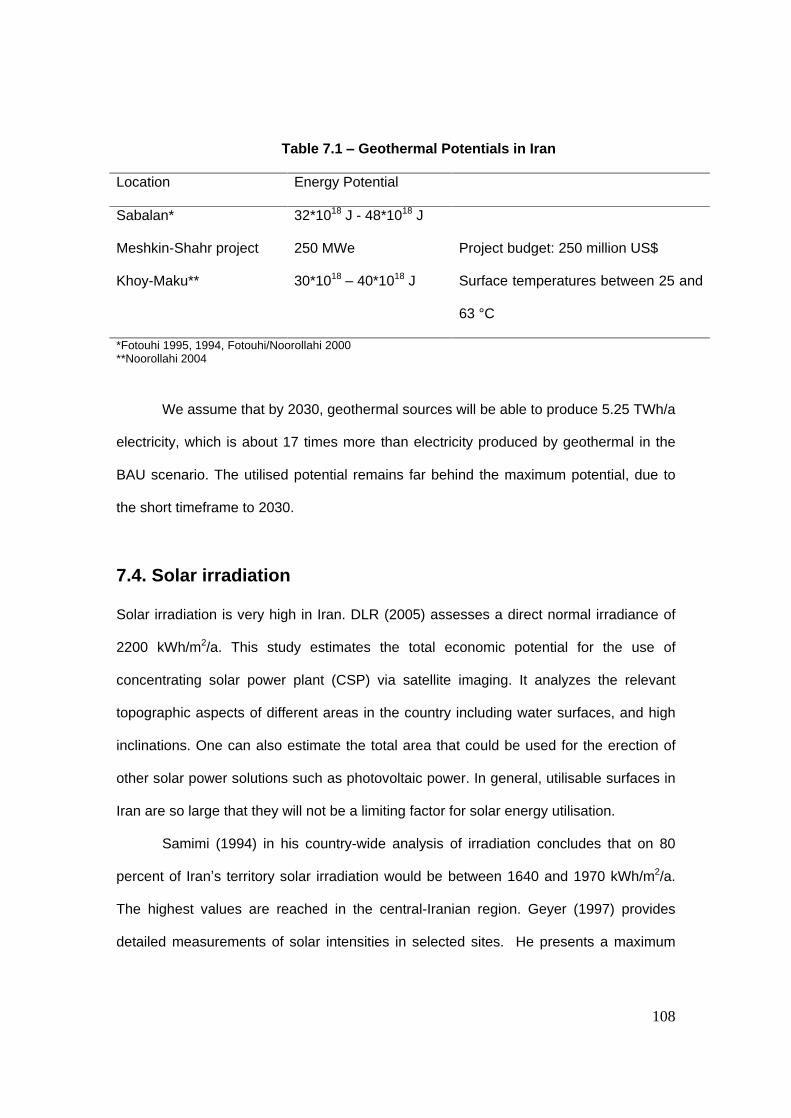
108
Table 7.1
Geothermal Potentials in Iran
Location Energy Potential
Sabalan* 32*1018
J - 48*1018
J
Meshkin-Shahr project 250 MWe Project budget: 250 million US$
Khoy-Maku** 30*1018
40*1018
J Surface temperatures between 25 and
63 °C
*Fotouhi 1995, 1994, Fotouhi/Noorollahi 2000 **Noorollahi 2004
We assume that by 2030, geothermal sources will be able to produce 5.25 TWh/a
electricity, which is about 17 times more than electricity produced by geothermal in the
BAU scenario. The utilised potential remains far behind the maximum potential, due to
the short timeframe to 2030.
7.4. Solar irradiation
Solar irradiation is very high in Iran. DLR (2005) assesses a direct normal irradiance of
2200 kWh/m2/a. This study estimates the total economic potential for the use of
concentrating solar power plant (CSP) via satellite imaging. It analyzes the relevant
topographic aspects of different areas in the country including water surfaces, and high
inclinations. One can also estimate the total area that could be used for the erection of
other solar power solutions such as photovoltaic power. In general, utilisable surfaces in
Iran are so large that they will not be a limiting factor for solar energy utilisation.
Samimi (1994) in his country-wide analysis of irradiation concludes that on 80
percent of Iran s territory solar irradiation would be between 1640 and 1970 kWh/m2/a.
The highest values are reached in the central-Iranian region. Geyer (1997) provides
detailed measurements of solar intensities in selected sites. He presents a maximum

109
direct normal insolation in Shiraz of about 2580 kWh/m2/a. Data for Yazd are of
particular interest, as tender documents for a solar thermal power plant in the area were
prepared. According to IPDC (2001) solar insolation in Yazd is in the range of 2500
kWh/m2/a. In our scenario analysis, based on the assumptions on the capacity
installation rate and the full load hours, we estimate that 94 TWh/a electricity will be
produced by CSP and 0.007 TWh/a by photovoltaic generation. The CSP generation is
assumed 0.004 TWh/a in the BAU scenario.
7.5. Hydropower
Hydropower produces less than 10 TWh/a electricity and therefore its contribution to
energy production is not significant in Iran. However, there are plans to increase
hydropower s share in the electricity mix. World Energy Council (WEC) and DLR
estimate Iran s hydropower potential as 48 TWh/a (DLR 2005, WEC 2001). In our study,
we estimate that large hydropower will contribute to electricity generation by producing
17.3 TWh/a.
Table 7.2 summarizes the renewable electricity performance indicators estimated by
DLR (2005). They define the representative average renewable electricity yield of a
typical facility in Iran. Table 7.3 shows the economical renewable electricity supply side
potentials, which are estimated by DLR (2005) for Iran.

110
Table 7.2 - Basic data on renewable energy potentials in Iran
Hydro Geo Bio CSP Wind PV
Full Load
Hours per
year (h/y)
Temperature
at 5000m
Depth
(Celcius)
Full Load
Hours Per
Year (h/y)
Direct
Normal
Irradiance
(kWh/m2/y)
Full Load
Hours Per
Year (h/y)
Global
Horizontal
Irradiance
(kWh/m2/y)
Full
Load
Hours
Per
Year
(h/y)
1351 295 3500 2200 1176 2010 4000
Rem
arks
Well
documented
resource
taken from
literature
From 5000m
temperature
map
considering
areas with
T>180 C as
economic
Agricultural
(bagasse)
and
municipal
waste and
renewable
solid
biomass
From DNI
and CSP
site mapping
taking sites
with
DNI>2000
kWh/m2/y as
economic
From wind
speed and
site
mapping
taking sites
with a
yeld>14
GWh/y and
from
literature
(EU)
Source: DLR (2005)
Table 7.3- Summary of Economic Renewable Electricity Supply Potentials in Iran,
TWh/y
Hydro Geo Bio CSP Wind PV
Electricity Supply 48 11.3 23.7 20000 8 16
Source: DLR (2005)

111
7.6. Economic and Infrastructural Analysis
7.6.1. Technical Data for MENA Region
The detailed data on renewable energy potentials in the MENA region are given
by DLR. In the TRANS-CSP report, basic data are also given for conventionally fuelled
power plant as a standard for comparison (see Table 7.4).
Table 7.4 - Basic Parameters of Conventionally Fuelled And of Renewable Energy
Power Plants
Plants Economic
Life Years
Efficiency
(%)
Fuel Price
Escalation
(%)
Operation &
Maintenance
(% of Inv./y)
Annual Full
Load Hours
(hours/year)
Steam Coal 40 40 1 3.5 5000
Steam Oil 30 40 1 2.5 5000
Combined
Cycle 30 48 1 2.5 5000
Wind Power 15 1.5 2000
Solar
Thermal 40 37 1 3 8000
Hydro 50 75 3 2600
Photovoltaics
20 10 1.5 1800
Geothermal 30 13.5 4 7500
Biomass 30 35 3.5 3700
Source: DLR (2005)
7.6.2. Full Load Hours (FLH)
Annual load hours of hydropower plant are relatively low in Iran. Historical data
are in the range of less than 3000 FLH. DLR assumes high investment costs for hybrid

112
CSP with combined feed of natural gas and solar radiation. The share of natural gas
decrease strongly through time, and expensive storage technologies would become
necessary. FLH of hybrid CSP are 8000/a, which is exceptionally high. As CSP fulfil
peak load production in later decades, FLH decrease over time. This is one option of
calculating basic characteristics of CSP, but there are also other assumptions possible.
For instance, the share of natural gas can decrease at slower rate and therefore the
need for expensive storage systems for solar radiation can be postponed. This leads to
lower investment costs compared to DLR.
7.6.3. Investment Costs
DLR has the investment costs of renewable energy technologies in different stages of
their development. According to these calculations, the investment costs will be reduced
dramatically mainly because of the learning curve as well as the economies of scale.
The only exception is the investment cost of CSP plants, which will increase because of
increasing solar shares (increased collector fields and storage) and increasing annual
solar operating hours. The electricity cost, however, will continue to decline in time.
Figure 7.2 shows the specific investment cost trend for the regions of North Africa and
Persian Gulf.
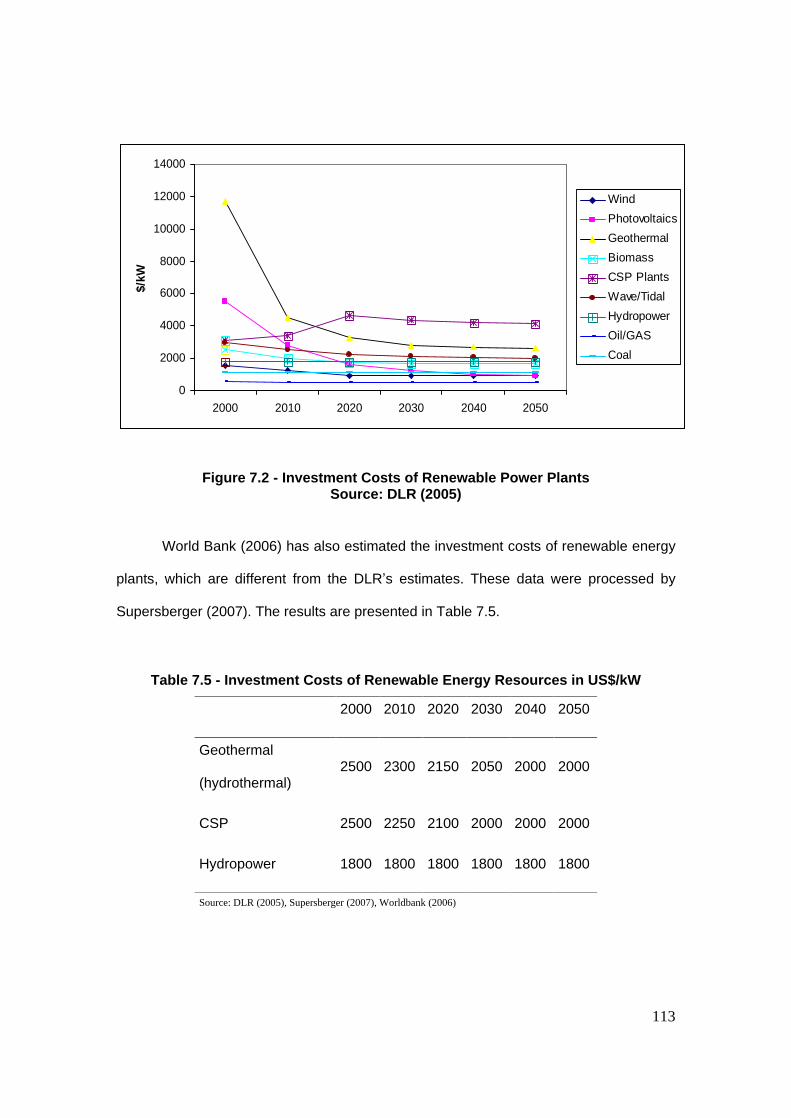
113
0
2000
4000
6000
8000
10000
12000
14000
2000 2010 2020 2030 2040 2050
$/kW
Wind
Photovoltaics
Geothermal
Biomass
CSP Plants
Wave/Tidal
Hydropower
Oil/GAS
Coal
Figure 7.2 - Investment Costs of Renewable Power Plants Source: DLR (2005)
World Bank (2006) has also estimated the investment costs of renewable energy
plants, which are different from the DLR s estimates. These data were processed by
Supersberger (2007). The results are presented in Table 7.5.
Table 7.5 - Investment Costs of Renewable Energy Resources in US$/kW
2000
2010
2020
2030
2040
2050
Geothermal
(hydrothermal) 2500
2300
2150
2050
2000
2000
CSP 2500
2250
2100
2000
2000
2000
Hydropower 1800
1800
1800
1800
1800
1800
Source: DLR (2005), Supersberger (2007), Worldbank (2006)

114
The costs of electricity generation by renewable energy technologies have been
estimated by DLR (2005). According to this estimation, in the year 2000, none of the
renewable technologies, except for hydropower, could compete with fossil fuels.
However, by the year 2030, they will cost either the same or slightly less than the fosill
fuels, and 20 years later, they will all become cheaper. Figure 7.3 shows the electricity
cost estimation by different renewable energy technologies.
0
5
10
15
20
25
30
35
2000 2010 2020 2030 2040 2050
cen
ts/k
Wh
Wind
Photovoltaics
Geothermal
Biomass
CSP Plants
Wave/Tidal
Hydropower
Oil/GAS
Coal
Figure 7.3 - Electricity Costs by Renewable Energy Technologies Source: DLR (2005)
7.6.4. Time Scale and Dynamics
As the different technology options show different market readiness and temporal
flexibility, the establishment of a certain chronology of renewables introduction is
necessary. Renewables contributions vary strongly depending on the specific scenarios.
In the Business as Usual scenario, only hydropower plays a somewhat important role

115
with about 7 TWh/a in 2030. Wind power is the second largest contributor with less than
3 TWh/a. This is different in the High Renewables scenario, in which the renewable
energy sources make a more or less vivid mix. In the High Renewable scenario,
hydropower will supply 17.6 TWh/a. Geothermal electricity generation is utilised by 2030
to about 20 percent of the total possible potential, contributing 5.25 TWh/a electricity to
the system. The first concentrating solar power (CSP) plants enter the system mainly as
retrofitted natural gas fuelled combined cycle power plants, which are initially built as
natural gas fuelled plants. The solar devices are retrofitted later when costs will come
down significantly. CSP will make the largest contribution to electricity production among
the renewable energy sources in the High Renewable scenario, amounting to 94 TWh/a
by 2030.
Concentrating solar power plants (CSP) are often planned as hybrid plants, using
natural gas during night-time and solar irradiation during day-time. In general, it is
possible to build natural gas power plants CSP ready : Starting with 100 percent natural
gas share, and adding solar devices later. The major additional requirement is space to
retrofit the solar panels. This arrangement of the hybrid CSP has a cost advantage of
using inexpensive natural gas plants in the beginning and the solar devices in some
years when costs will come down.
7.7. Final Energy Demand in the High Renewables Scenario
In the time frame to 2030, the final energy demand includes only small shares of
renewable energies. They vary between 0 percent and 16 percent. A summary of the
utilization of the renewable energy sources in each sector of the economy is provided
below.

116
7.7.1. Households
Over the coming decades, solar thermal water heating will become a standard in Iranian
homes as it already is in many households in the Mediterranean region. It is assumed
that by 2030 about two thirds of sanitary hot water will be generated by solar thermal
heat. In addition, solar devices will be used for cooking, mainly in rural areas, supplying
about 10% of the energy demand for this use. Overall, this leads to a share of about
10% of direct renewable energy use.
7.7.2. Industry
The share of renewable energy use in the sector is expected to increase to 6 percent.
This is relatively low mainly because of the limited potentials for residuals from
production, biomass, geothermal, and solar radiation. Biomass is in general very low and
geothermal is not practical because of large distance between supply and consumption
locations. There are, however, large potentials for solar heat generation for industrial
processes they will be realised to large extent in the longer time frame.
7.7.3. Transport
We assume no introduction of biofuels in the transport sector, as the supply chain would
be too expensive regarding the low biomass potentials.
7.7.4. Others
Agriculture: Renewable energies contribute 12.7 percent to the fuel use in this sector.
Biomass and solar irradiation are two important renewable energy sources as
agricultural residues and local oil seeds can be converted to liquid fuels and heat, and

117
solar heat generation is a viable option. The share of renewables is assumed to remain
relatively low due to two reasons: Short timeframe and restricted biomass potentials.
Commercial: The renewable energy share in the commercial sector is 16 percent,
contributed mainly by solar thermal devices. The share is relatively high due to the
simple applicability of solar thermal systems together with the availability of efficiency
potentials.
Public: Renewable energies make up to 10 percent of fuel use by 2030, mainly
contributed by solar thermal devices.
Figure 7.4 shows the total energy demand under the High Renewable scenario in
comparison with the BAU scenario. In 2030, the total demand for energy will increase
from 970 mboe in 2005 to 1,080 MBOE, which means an average growth rate of 2
percent per year. The energy saving rate in 2030 under the High Renewable scenario
will be 3 percent compared to BAU. The savings will almost exclusively be achieved by
the higher efficiency of the renewable power generation technology.
0
200
400
600
800
1,000
1,200
1,400
1,600
1,800
2,000
2005 2010 2015 2020 2025 2030
mb
oe
BAU Renewalbe
Figure 7.4 - Total Primary Energy Demand in BAU and High Renewables Scenarios, 205-2030, mboe

118
8. Scenario III: Combined Scenario
In the Combined scenario, we combine high-efficiency and High Renewables scenarios.
Therefore, the energy saving under this scenario is expected to be higher than that in
each individual scenario. Since we have already discussed about the details of each
scenarios and their implications in each sector of the economy, we only present the final
result of this scenario. Figure 8.1 shows the total energy demand under the Combined
scenario compared with the BAU scenario. The total energy demand under the
Combined scenario will grow on average by 0.2 percent per year for the period 2005-
2030. This is much lower than the2.6 percent growth in energy demand in the BAU
scenario. The total energy demand in 2030 under this scenario will be 1030 mboe, which
implies a saving rate of 43 percent compared to the BAU scenario.
0
200
400
600
800
1,000
1,200
1,400
1,600
1,800
2,000
2005 2010 2015 2020 2025 2030
mb
oe
BAU Combined
Figure 8.1- Total Primary Energy Demand in Combined and BAU Scenarios (2005-2030), mboe

119
9. Scenario IV: Constrained Scenario
In the high-efficiency and the High Renewables scenarios, we assume that the efficiency
potentials and the renewable resources will be utilized by 2030. Although the
assumptions in those scenarios are supported by the case studies conducted by SABA,
IFCO, and other international organizations such as IEA, they may not necessarily be
realized. The main reasons for the failure of the assumptions are the uncertainties in
policymaking, economic conditions, and technological changes. To acknowledge those
restrictions, we thus construct a Constrained scenario. The Constrained scenario will
take into account those uncertainties in the context of high-efficiency and High
Renewables scenarios, and will therefore be a rather conservative scenario with regard
to both energy saving and utilization of renewable resources. In the following, we list the
assumptions for the Constrained scenario. We only include those assumptions that are
different from the high-efficiency and High Renewables scenarios.
1. In High Renewables scenario, we assume electricity generation of 22 TWh by
wind power by 2030. Given the uncertainties in investments by private sector and
in the policy changes, the more conservative assumption will be 15 TWh by
2030.
2. In High Renewables scenario, we assume electricity generation of 5.25 TWh by
geothermal power plants by 2030. This corresponds to 700 MW capacities given
90 percent plant factor. The more conservative assumption is the electricity
production of 3 TWh by 2030. The lower electricity generation by geothermal
power plants takes into account uncertainties regarding the plant factor and the
hours of operation.

120
3. In high-efficiency scenario, we assume number of cars will increase from about 6
million cars in 2005 to 16.26 million cars in 2030. This projection is lower than the
BAU projection by 2 million cars. The lower growth rate of number of cars
projection in the high-efficiency scenario is based on the assumptions that people
will use public transport as a main transport means and that gasoline price will
rise up to a level that will not provide an incentive to own a car. In the
Constrained scenario, we assume that the number of cars in 2030 will remain the
same as the BAU scenario, that is, 18,26 million cars.
4. The fuel consumption by passenger cars is assumed to decline to as low as 6
litre per 100 km by 2030 in the high-efficiency scenario. This assumption is
mainly based on the higher efficiency of new engines. However, there are other
factors such as city infrastructure, road condition, driving habit, quality of fuel,
and traffic condition, which affect the fuel consumption by passenger cars. Since
there are some uncertainties regarding the other factors affecting the fuel
consumption, the more conservative assumption for the average fuel
consumption would be 7 litter per 100 km.
5. In the residential heat section of the high-efficiency scenario, we assume 50
percent saving per building and 90 percent saving as technical potential. These
figures are based on the IFCO and the Ministry of Energy s auditing reports on
sample buildings, but their realization would depend on building policies,
government successful supervision in the construction sector, and a change in
household behaviour. In the Constrained scenario, we assume 30 percent saving
per building, because of uncertainties in the policies and their successful
implementation.

121
Figure 9.1 shows the total energy demand under the Constrained scenario and the BAU
scenario. The total demand for energy in the Constrained scenario will be 1070 mboe in
2030, which implies a saving rate of 41 percent compared to the BAU scenario.
0
200
400
600
800
1,000
1,200
1,400
1,600
1,800
2,000
2005 2010 2015 2020 2025 2030
mb
oe
BAU Constrained
Figure 9.1 - Total Primary Energy Demand in Constrained and BAU Scenarios
(2005-2030), mboe
10. A Comparison among Scenarios
Table 10.1 shows a comparison of demand for energy among four scenarios. As it is
evident from the table, the high-efficiency scenario will lead to about 40 percent saving in
total energy consumption in the year 2030. This saving potential is very significant in the
international scale. The energy saving under the High Renewables scenario will be
about 3 percent in 2030. The saving rate in the High Renewables scenario only reflects
the efficiency gains in electricity production by the use of renewable energies. The

122
Combined scenario, which is a combination of the high-efficiency and High Renewables
scenarios, will lead to the highest energy saving in 2030. In total, the energy saving rate
under this scenario will be 43 percent compared to the BAU. Finally, the Constrained
scenario results show that total energy saving in 2030 will be 41 percent compared to
the BAU scenario.
Table 10.1 - A Summary of the Scenario Results (2005-2030)
Scenario
Primary Energy Demand (mboe) Growth per
year (%)
Savings vs.
BAU by
2030 (%)
2005 2030
BAU 970 1,822 2.6 -
High- Efficiency 970 1,084 0.4 40
High Renewables 970 1,760 2.4 3
Combined 970 1,030 0.2 43
Constrained 970 1,070 0.4 41
Total demand for electricity will almost double in BAU, High Renewables, and
Constrained scenarios in 2030. The electricity demand in the efficiency and Combined
scenario, however, will increase only by about 13 percent. The most significant reduction
in electricity consumption is in the manufacturing industry under efficiency and
Combined scenarios compared with the BAU scenario. Figure 10.1 shows the demand
for electricity in different sectors and different scenarios.
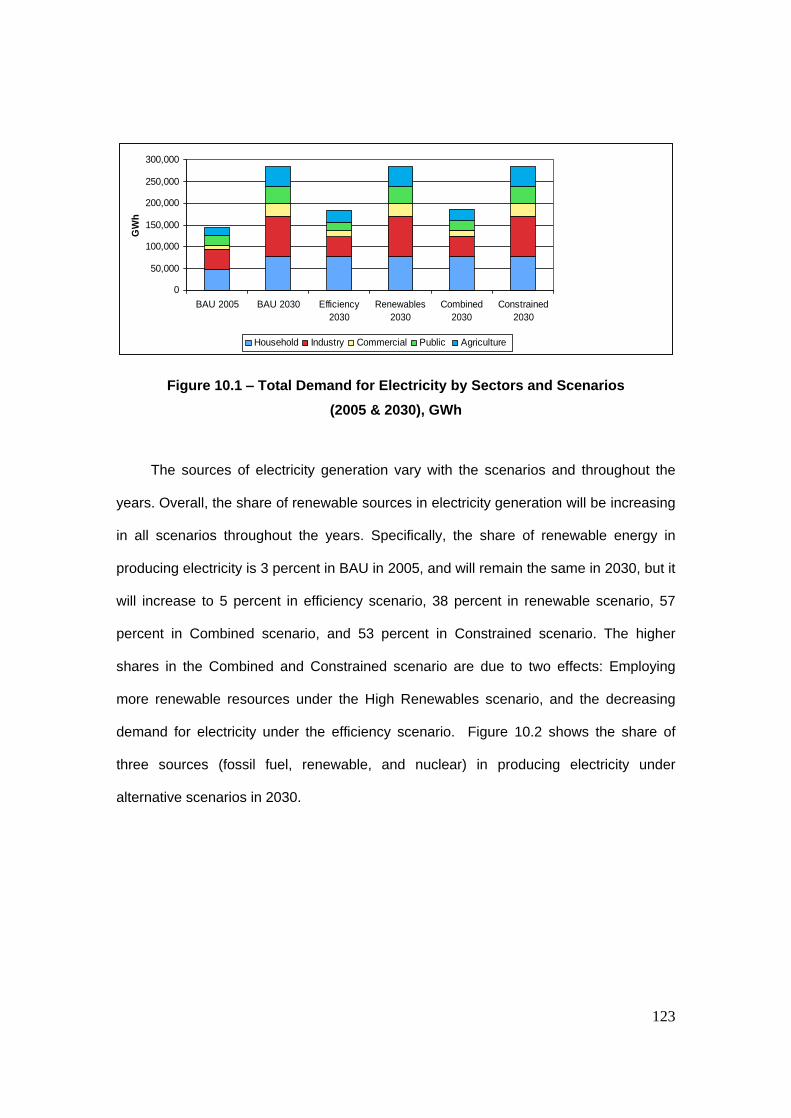
123
0
50,000
100,000
150,000
200,000
250,000
300,000
BAU 2005 BAU 2030 Efficiency2030
Renewables2030
Combined2030
Constrained2030
GW
h
Household Industry Commercial Public Agriculture
Figure 10.1
Total Demand for Electricity by Sectors and Scenarios
(2005 & 2030), GWh
The sources of electricity generation vary with the scenarios and throughout the
years. Overall, the share of renewable sources in electricity generation will be increasing
in all scenarios throughout the years. Specifically, the share of renewable energy in
producing electricity is 3 percent in BAU in 2005, and will remain the same in 2030, but it
will increase to 5 percent in efficiency scenario, 38 percent in renewable scenario, 57
percent in Combined scenario, and 53 percent in Constrained scenario. The higher
shares in the Combined and Constrained scenario are due to two effects: Employing
more renewable resources under the High Renewables scenario, and the decreasing
demand for electricity under the efficiency scenario. Figure 10.2 shows the share of
three sources (fossil fuel, renewable, and nuclear) in producing electricity under
alternative scenarios in 2030.

124
0
50
100
150
200
250
300
350
400
BAU 2005 BAU 2030 Efficiency2030
Renewables2030
Combined2030
Constrained2030
TW
h
nuclear renewable thermal fossil
Figure 10.2
Electricity Generation by Sources in Alternative Scenarios, TWh
Figure 10.3 shows the final energy demand in alternative scenarios in different
sectors of the economy. As it is evident, the highest potential in energy saving will be in
household sector under the efficiency scenario. The industry and transport sectors also
show a significant energy saving under the efficiency scenario. Although the energy
savings in the public and commercial sectors are also relatively high, but in absolute
term they are not comparable with those in household, industry, and transport sectors.
Household (Heat) Household (Electricity)
0
100
200
300
400
500
600
700
2005 2010 2015 2020 2025 2030
MB
OE
BAU EFF COMBCONS RENEW
0
500
1000
1500
2000
2500
3000
3500
4000
2005 2010 2015 2020 2025 2030
KW
H/H
H/Y
EA
R
BAU EFF COMCONS RENEW

125
Industry Transport
0
50
100
150
200
250
300
350
400
2005 2010 2015 2020 2025 2030
MB
OE
BAU EFF COMBCONS RENEW
0
50
100
150
200
250
300
350
400
2005 2010 2015 2020 2025 2030
BO
E
BAU EFF COMCONS RENEW
Agriculture Commercial
0
10
20
30
40
50
60
2005 2010 2015 2020 2025 2030
MB
OE
BAU EFF COMCONS RENEW
0
10
20
30
40
50
60
70
80
90
2005 2010 2015 2020 2025 2030
MB
OE
BAU EFF COMCONS RENEW
Public Total
0
5
10
15
20
25
30
35
40
2005 2010 2015 2020 2025 2030
MB
OE
BAU EFF COMCONS RENEW
0
200
400
600
800
1,000
1,200
1,400
1,600
1,800
2,000
2005 2010 2015 2020 2025 2030
BAU EFF Renewable Combined Constrained
Figure 10.3 - A Summary of the Scenario Results (2005-2030), mboe

126
10.1. Energy Intensity
The energy intensity in Iran is one of the highest in the world. We compare the energy
intensity in different scenarios in Iran with that in the world, and in an industrialized
country with a low energy intensity such as Germany. In 2003, the energy intensity in
Iran was more than 60 percent higher than the world average and more than twice in
Germany. Although the energy intensity will be reduced by about 30 percent in the BAU
scenario in 2030, it will still be higher than today s world average. In the efficiency
scenario, however, the energy intensity in 2030 will be declined by about 60 percent
making it lower than the world average and Germany today, but still higher than the
2020 energy intensity target in Germany. Figure 10.4 shows the energy intensity in Iran
in comparison with the world and Germany in different scenarios.
0
2
4
6
8
10
12
14
16
1991
2003
Wor
ld
Ger
man
y
BAU
Ren
ew.
Effi
cien
cy
Com
bine
d
BAU
Tar
get
2003 Scenarios for 2030 2020
Iran Comp. Iran Germany
MJ/
$00
pp
p
Figure 10.4
Energy Intensity in Iran and World under Different Scenarios Source: EEA, IEA (2007), and the authors calculation

127
11. Economic and Ecological Impacts of Scenarios
The different impacts of the examined scenarios are of great importance for policy
makers facing the socio economical challenges. For instance, in the BAU-scenario, the
export capacity of crude oil and natural gas will continually decrease, because of an
increasing domestic consumption. With the current trend, it is probable that Iran might
not be able to export any oil in the mid-2030s. Later, this might also happen with natural
gas. In the other scenarios, the Iranian export capacities of oil and gas would decrease
more slowly keeping up the country s export capacity at least until the middle of the
century.
The BAU scenario will also have a negative impact on climate change. The CO2
emissions will increase proportionally to the oil and gas consumption and thus will almost
double by 2030. This also applies to other pollutants; such as nitrogen oxides, sulphur
dioxide, dust and heavy metals; with considerable economic follow-up costs and risks for
the public, especially in areas of high population density. In all the other scenarios, CO2
emissions and contamination with other pollutants would decrease considerably. For the
Combined scenario this means that energy related CO2 emissions in Iran can be
stabilised slightly above 400 Mt of CO2 and slightly above current values, that is, a
reduction of 45% by 2030 in comparison to the BAU scenario.
11.1. Economic Impacts
Although the detailed economic evaluation of the scenario analysis is not in the
scope of our study, it is important to assess generally the economic costs and benefits of
the scenarios. In this section, we examine the overall economic impacts of the scenarios

128
focusing on export revenues and change in technology. Since our assessment of the
scenarios will directly depend on the world oil prices, we will have to make an
assumption about its long-term trend. The oil prices are one of the most volatile prices in
the world making its short-term prediction very difficult, or even impossible, but the
overall trend of the prices can be projected taking into account the fundamental forces in
the energy market. Among the fundamental factors, we can point to the increasing
demand for crude oil especially by emerging economies, limited supply, technological
changes and substitution of alternative energy sources. The first two factors would push
oil prices up, but the last two factors would have a downward pressure on oil prices.
Furthermore, changes in the political and market structure towards growing autonomy of
oil producing countries and increasing competition among the consumers might have an
increasing impact on oil prices. Since the development of new technologies and
substitution of new energy sources will take time, the upward pressure factors seem to
have a dominant effect on oil prices in the next two or three decades. Therefore, we
predict that the oil prices will grow due to increasing demand and supply limits until 2020
and then will start to stabilize due to competition by alternative sources. The projection of
future oil prices by the International Energy Agency (IEA) in World Energy Outlook
(2008) is consistent with our analysis and therefore provides a good basis for our
calculations.
Tables 11.1
11.4 show saved amounts of oil and gas for the efficiency, High
Renewables, Combined, and Constrained scenarios in comparison to BAU in 2005-
2030. In the efficiency scenario, the total revenue as a result of energy savings will rise
continually to about US $68 billion in 2030. In the High Renewables scenario, the
revenue will increase to more than US $19 billion, in the Combined scenario to more
than US $82 billion, and in the Constrained scenario to more than US $77 billion in 2030.
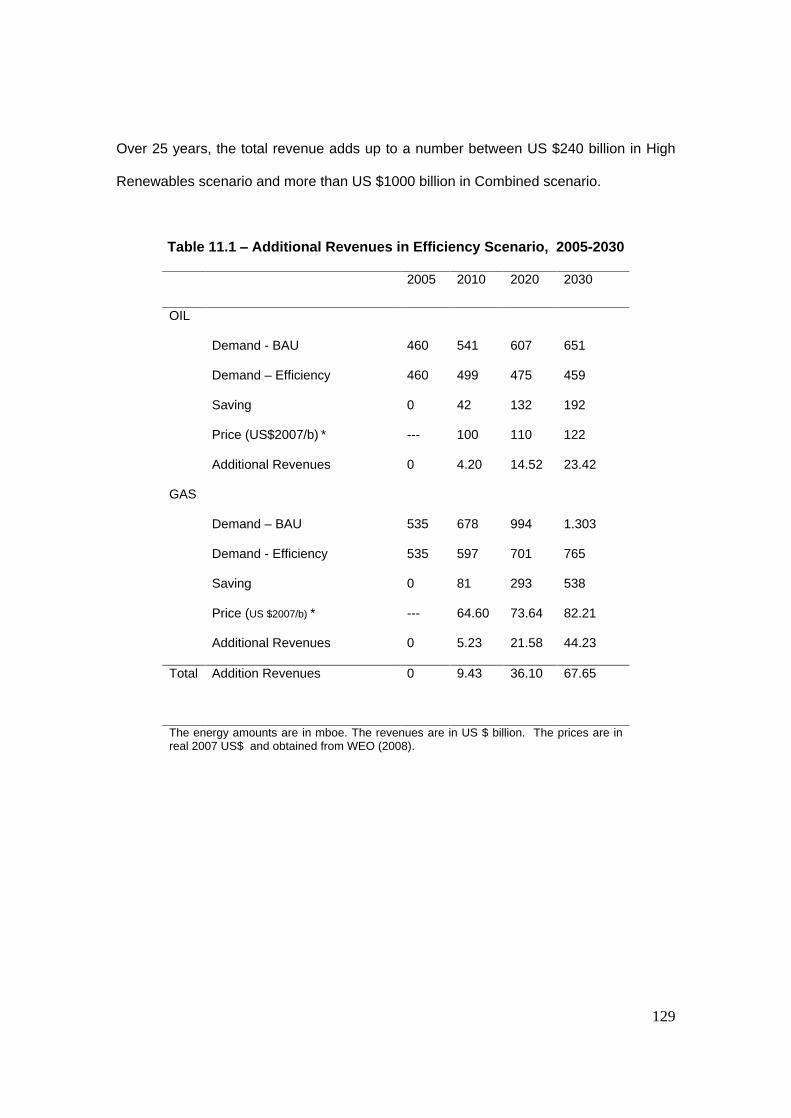
129
Over 25 years, the total revenue adds up to a number between US $240 billion in High
Renewables scenario and more than US $1000 billion in Combined scenario.
Table 11.1
Additional Revenues in Efficiency Scenario, 2005-2030
2005 2010 2020 2030
OIL
Demand - BAU 460 541 607 651
Demand
Efficiency 460 499 475 459
Saving 0 42 132 192
Price (US$2007/b) * --- 100 110 122
Additional Revenues 0 4.20 14.52 23.42
GAS
Demand
BAU 535 678 994 1.303
Demand - Efficiency 535 597 701 765
Saving 0 81 293 538
Price (US $2007/b) * --- 64.60 73.64 82.21
Additional Revenues 0 5.23 21.58 44.23
Total
Addition Revenues 0 9.43 36.10 67.65
The energy amounts are in mboe. The revenues are in US $ billion. The prices are in real 2007 US$ and obtained from WEO (2008).

130
Table11.2
Additional Revenues in High Renewables Scenario, US 2007$, 2005-
2030
2005 2010 2020 2030
OIL
Demand - BAU 460 541 607 651
Demand
Renewables 460 538 587 603
Saving 0 3 20 48
Price (US$/b) * --- 100 110 122
Additional Revenues 0 0.03 2.20 5.86
GAS
Demand
BAU 535 678 994 1,303
Demand -Renewables 535 670 922 1,140
Saving 0 8 72 163
Price (US $/boe) * --- 64.60 73.64 82.21
Additional Revenues 0 0.52 5.30 13.40
Total
Addition Revenues 0 0.2 7.50 19.6
The energy amounts are in mboe. The revenues are in US $ billion. The prices are in real 2007 US$ and obtained from WEO (2008).
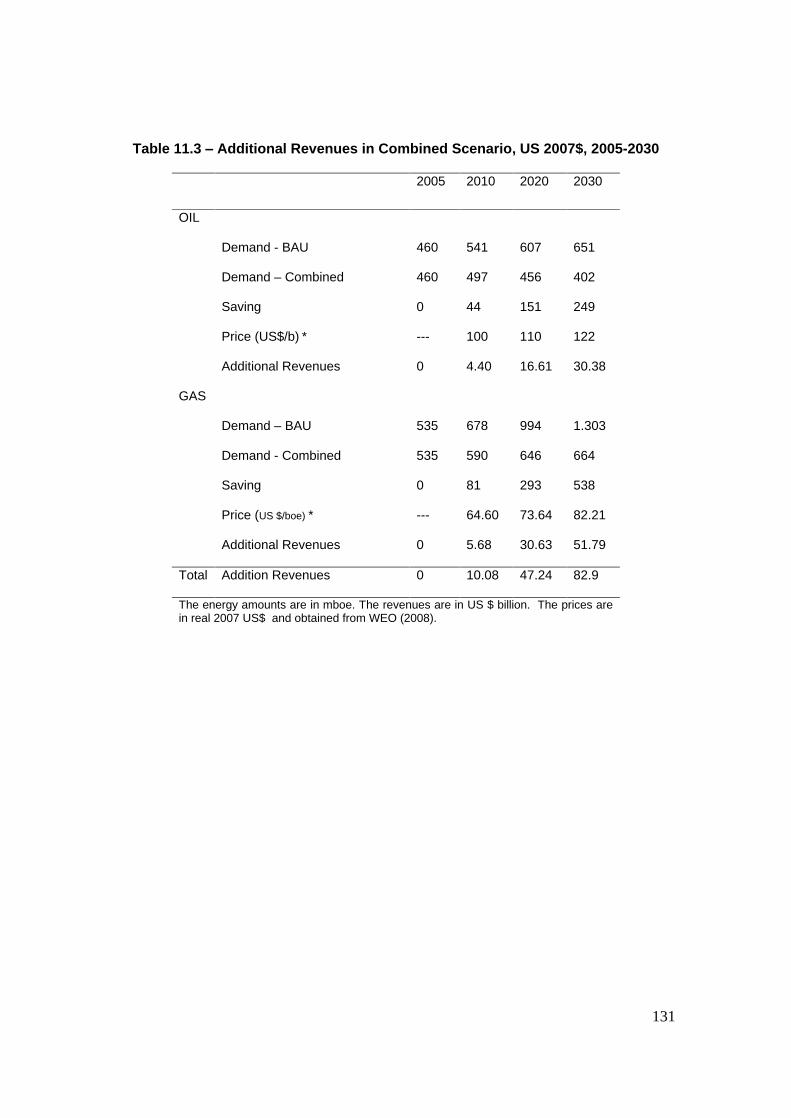
131
Table 11.3
Additional Revenues in Combined Scenario, US 2007$, 2005-2030
2005 2010 2020 2030
OIL
Demand - BAU 460 541 607 651
Demand
Combined 460 497 456 402
Saving 0 44 151 249
Price (US$/b) * --- 100 110 122
Additional Revenues 0 4.40 16.61 30.38
GAS
Demand
BAU 535 678 994 1.303
Demand - Combined 535 590 646 664
Saving 0 81 293 538
Price (US $/boe) * --- 64.60 73.64 82.21
Additional Revenues 0 5.68 30.63 51.79
Total
Addition Revenues 0 10.08 47.24 82.9
The energy amounts are in mboe. The revenues are in US $ billion. The prices are in real 2007 US$ and obtained from WEO (2008).

132
Table 11.4
Additional Revenues in Constrained Scenario, US 2007$,
2005-2030 2005 2010 2020 2030
OIL
Demand - BAU 460 541 607 651
Demand
Constrained 460 507 486 434
Saving 0 34 121 217
Price (US$/b) * --- 100 110 122
Additional Revenues 0 3.38 13.33 26.62
GAS
Demand
BAU 535 678 994 1.303
Demand - Constrained 535 591 658 684
Saving 0 87 336 619
Price (US $/boe) * --- 64.60 73.64 82.21
Additional Revenues 0 5.61 24.72 50.90
Total
Addition Revenues 0 8.99 38.05 77.42
The energy amounts are in mboe. The revenues are in US $ billion. The prices are in real 2007 US$ and obtained from WEO (2008).
Figure 11.1 shows the trend of total revenues that Iran could generate with all
four scenarios in comparison to BAU. The greatest revenues can be generated by
realizing the Combined scenario where both efficiency and renewable potentials are
considered. Compared to countries without own energy resources, Iran as a country
with fossil energy resources is in a privileged position when it comes to changing its
energy supply system. The saved resources of oil and natural gas can be transferred to
more revenues through export.

133
0
10
20
30
40
50
60
70
80
90
2005 2010 2020 2030
US
$ b
illi
on
Efficiency Renewables Combined Constrained
Figure 11.1
The Potential Revenues Generated by Scenarios (2005-2030)
Our economic impact evaluation of the scenarios shows that the potential
revenues generated by different scenarios in Iran are remarkably high. To realize these
additional revenues, there is a need for investment in new capital and training. Although
the estimation of detailed investment costs requires further research, we present the
results of some other studies, which can be used as references.
A thermal solar study for Tehran (CEERS, 2005) shows that taking over of that
technology for the production of warm water would be beneficial to Iran s economy. This
use of the thermal solar would be economical even if the State had to subsidize the full
investment costs. The following simple calculation validates the claim. We can assume
that the Iranian government is able to borrow loans at the international capital markets
with an interest rate of 3 percent. This loan will be used to finance the solar installations
projects that result in a reduction of fuel use for heating in households. If we further
assume an oil price of US $38 per barrel, which is a rather conservative assumption as
the average oil price was about US $50 per barrel in March 2005, and an annual

134
increase in oil prices of 2 percent, every solar thermal installation in a two-floor flat would
yield a revenue of about US $168 per year. Assuming a lifetime of 25 years, every solar
thermal plant would yield economic net benefits (additional oil revenues minus capital
and maintenance costs) of US $4,200. Assuming that solar heating systems would be
installed in about one quarter of all households in Tehran, the total net revenue would
sum up to US $1,800 million for the Iranian economy.
Supersberger (2007) has estimated the revenues and investment costs of
increasing efficiency and renewable energy sources in Iran for the period 2005-2050.
Given the assumption of oil price of US $47 barrel in 2005 and the investment costs
equal to $47.2 billion, the net benefit of implementing the High Efficiency and High
Renewables scenarios will be $403 billion.
The international Studies for Germany, Europe and others confirm this
economically profitable development. For instance, in a comprehensive study by the
enquète commission of the German Federal Parliament about sustainable energy supply
in Germany in 2002, one point of interest is the assessment of different energy scenarios
and their costs until 2050. The results of the study show that the additional costs of
alternative scenarios, without taking into account external costs, are only slightly higher
in comparison to the baseline scenario at extremely low oil price levels. When taking into
account external costs, all High Efficiency and High Renewables scenarios perform
better than the baseline scenario economically.
Another recent study by the German Ministry for the Environment
(Bundesministerium für Umwelt, 2008) shows that renewable energy technologies for
power supply in Europe are already partly profitable and will be completely profitable in
the medium term. Furthermore, the electricity generation in hydropower plants today is
already cheaper than conventional electricity generation. Given a dynamic view and

135
further growth of world market prices for fossil fuel, geothermal energy and wind energy
will reach their break-even point shortly after 2020. Only photovoltaics will need more
than three decades to become profitable for electricity generation. The same study also
shows that in Europe heat generation with biomass will be profitable in 2010, while heat
generation using geothermal energy and solar collectors will become profitable between
2020 and 2025.
Most studies that are carried out mainly for developed countries indicate that a
modernisation of energy system is an economical and viable option and therefore it does
not have to depend on government subsidies. The McKinsey (2008) study evaluates the
efficiency strategy with reference to CO2 reduction as economically very positive.
Increasing energy productivity is the most cost-effective way globally to reduce GHG
emissions, representing roughly 80 percent of the positive return opportunities identified
in McKinsey s work on the global carbon-abatement cost curve.
11.2. Ecological Impacts
Climate change is a global challenge. The concentration of CO2-emissions is the main
cause for global warming. Based on the findings from IPCC (2007), to prevent a climate
catastrophe, CO2-emissions have to be reduced by at least 50% of the 1990 level
worldwide by 2050. The developed industrial countries are the main generators of
climate change and should therefore make the most contribution to reducing CO2-
emissions. Nevertheless, as expressed in the Bali Roadmap the less-developed
industrial countries and developing countries like Iran should make their own contribution
as well. The demand scenarios presented in this study can be used to assess the
development of CO2-emissions in different scenarios. Since the total demand for primary
energy in the High Efficiency, High Renewables and Combined scenarios are less than

136
that in the BAU scenario, the CO2-emissions are expected to be lower in those
scenarios in comparison to the BAU scenario. In the following section, we assess the
CO2-emissions for all scenarios.
Crude oil contains 466 kg CO2 per barrel and natural gas contains about 289 kg
CO2 per barrel of oil equivalent. For reasons of simplicity, CO2-emissions resulting from
conduction losses of gas and burning off during oil production are not taken into account.
In addition, climate-relevant CO2-emissions from methane need to be examined
separately. We use the results of energy savings under different scenarios, which were
presented in Tables 11.1 -11.4, to calculate the CO2-emission levels for alternative
scenarios in comparison to BAU. Table 11.5 shows the development of CO2-emissions
for Business as Usual and Tables 11. 6 -11.8 show and the reduction of CO2-emissions
in the alternative scenarios.
Table 11.5 - CO2-Emissions in the BAU Scenario
2005 2010 2020 2030
Oil
Demand - BAU 460 541 607 651
CO2- emission 205.2 241.3 270.7 290.3
Gas
Demand
BAU 535 678 994 1,303
CO2- emission 154.6 195.9 287.3 376.6
Total 359.8 437.2 558 667.1
One barrel Oil contains 446 kg CO2 , and one barrel oil equivalent gas contains 289 kg CO2

137
Table 11.6 - CO2-Emissions Reduction the Efficiency scenario
2010 2020 2030
Oil
Saving 42 132 92
CO2- emission Saving 19.6 61.5 89.5
Gas
Saving 81 293 538
CO2- emission Reduction 23.4 84.7 155.5
Total
CO2-emiision Reduction 43.0 146.2 244.0
The BAU scenario is a basis for comparison. Savings are in MOBE and the CO2-emissions are in MT.
Table 11.7- CO2-Emissions Reduction in High Renewables Scenario
2010 2020 2030
Oil
Saving 3 20 48
CO2- emission Saving 11.4 9.3 22.4
Gas
Saving 8 72 163
CO2- emission Reduction 2.3 20.8 47.1
Total
CO2-emiision Reduction 3.7 30.1 69.5
The BAU scenario is a basis for comparison. Savings are in MOBE and the CO2-emissions are in MT.

138
Table 11.8 - CO2-Emissions Reduction in the Combined Scenario
2010 2020 2030
Oil
Saving 4.4 151 249
CO2- emission Saving 20.5 117 116
Gas
Saving 88 348 630
CO2- emission Reduction 25.4 100.6 183
Total
CO2-emiision Reduction 45.9 217.6 298
The BAU scenario is a basis for comparison. Savings are in MOBE and the CO2-emissions are in MT.
0
100
200
300
400
500
600
700
800
2005 2010 2020 2030
m.
ton
nes
BAU Efficiency Renewable Combined
Figure 11.2 - CO2- Emissions in Alternative Scenarios (2005-2030)
139
As the figure 11.2 shows, the CO2-emissions are sinking to a considerable
degree in all alternative scenarios in comparison to BAU. The strongest decrease may
be observed in the Combined scenario in which the CO2-emission will be reduced by
10% in 2010, 39% in 2020 and 45% in 2030. The alternative scenarios will not only
generate additional revenues for Iran s economy of up to $1000 billion in 25 years, but
also enable Iran to take the right path in reducing CO2-emissions according to IPCC
guidelines and thereby acquiring an internationally leading position.
CO2 is not the only pollutant that is generated by fossil fuel. Other pollutants
such as SO2, NOx, dust, CO, and heavy metals like lead are also generated during the
combustion of oil and gas. The main producers of SO2 are industry and power plants.
NOx is generated in the transport sector. These substances constitute a massive risk to
humans and the environment. They induce numerous illnesses and soil and water
pollution, which cause immense follow-up costs for the economy. For instance,
bronchitis, skin diseases, and allergies are often caused by a concentration of the
pollutants above that get into the human organism directly through the air or indirectly
through the food chain. If these external costs imposed on health and environment are
taken into account, the net benefits of the scenarios will be even higher than what are
already shown in this study.
The estimation of the external costs is not in the scope of our study and requires
a separate research, but to show the significance of those costs, we make a reference to
a major study by the European Union. The European Commission predicts that as a
result of air pollution with SO2, NOx, dust, and CO2, there will be the early death of many
people with 2,800,000 life years of people aged over 30, 142,268 cases of chronic
bronchitis, and 240,333,947 working days lost in the economy in 2020. However, if the
fossil final energy consumption is reduced by 30%, those losses would decrease by

140
about 12 percent. The study estimates that the reduction of the illnesses would lower
health care costs in the European Union by 19.9 billion (Low) to 76.9 billion (High).
The consequences of combusting fossil energy for health and economy in Iran
will have to be assessed in a separate study. The above quoted study by the European
Union nevertheless shows that human health problems and the resulting health care
costs for the economy may be avoided largely by changing the current energy system.

141
APPENDIX
Scenario Results Tables
Table A1: Scenario Overview BAU-Scenario, 2005 - 2030
2005
2010
2020
2030
30/05 2005
2010
2020
2030
in mboe %/a shares Total Final Energy Consumption 783
969
1'262
1'549
2.8%
100%
100%
100%
100%
oil
382
453
511
550
1.5%
49%
47%
41%
36%
gas
316
415
617
830
3.9%
40%
43%
49%
54%
electricity
85
101
133
167
2.7%
11%
10%
11%
11%
coal
0
0
0
0
0%
0%
0%
0%
renewables
0
0
1
1
0%
0%
0%
0%
Industry 164
204
288
380
3.4%
100.0%
100.0%
100.0%
100.0%
oil
58
72
97
124
3.1%
35.6%
35.2%
33.9%
32.7%
gas
77
98
146
200
3.9%
47.2%
48.3%
50.7%
52.7%
electricity
28
33
44
54
2.6%
17.3%
16.3%
15.2%
14.3%
coal
0.0%
0.0%
0.0%
0.0%
renewables
0
0
1
1
0.0%
0.2%
0.2%
0.2%
Transport 218
273
325
356
2.0%
100.0%
100.0%
100.0%
100.0%
oil
211
265
316
348
2.0%
97.0%
97.1%
97.3%
97.7%
others (CNG)
6
8
9
8
1.0%
3.0%
2.9%
2.7%
2.3%
Other sectors 401
492
650
813
2.9%
100.0%
100.0%
100.0%
100.0%
oil
113
115
98
78
-1.5%
28.1%
23.5%
15.1%
9.6%
gas
232
308
462
622
4.0%
57.8%
62.7%
71.2%
76.5%
electricity
57
68
90
113
2.8%
14.1%
13.9%
13.8%
13.9%
coal
renewables
0
0
0
0
Non-energy use 21
21
27
34
0.0%
Electricity generation in TWh/a 187
220
282
346
2.5%
100.0%
100.0%
100.0%
100.0%
fossil
182
209
267
330
2.4%
97.5%
94.7%
94.7%
95.3%
nuclear
0
6
6
6
0.0%
2.7%
2.1%
1.7%
renewables
5
6
9
10
3.1%
2.5%
2.6%
3.2%
2.9%
Total Primary Energy Demand 998
1'236
1'626
1'979
2.8%
100.0%
100.0%
100.0%
100.0%
Oil 460
541
607
651
1.4%
46.1%
43.8%
37.4%
32.9%
Gas 535
680
994
1'303
3.6%
53.6%
55.0%
61.2%
65.8%
Nuclear 0
11
11
11
0.0%
0.9%
0.7%
0.5%
Hydro & other REN elec. 3
4
6
7
3.6%
0.3%
0.3%
0.4%
0.3%
other renewables 0
0
1
1
0.0%
0.0%
0.0%
0.0%
Coal 0
0
7
7
0.0%
0.0%
0.4%
0.3%
Source: own calculations

142
Table A2: Scenario Overview High Efficiency-Scenario, 2005
2030
2005
2010
2020
2030
30/05 2005
2010
2020
2030
in mboe %/a shares Total Final Energy Consumption 783
856
878
894
0.5%
100%
100%
100%
100%
oil
382
411
379
354
-0.3%
49%
48%
43%
40%
gas
316
351
394
431
1.3%
40%
41%
45%
48%
electricity
85
94
104
108
1.0%
11%
11%
12%
12%
coal
0
0
0
0
0%
0%
0%
0%
renewables
0
0
0
0
0%
0%
0%
0%
Industry 164
180
211
236
1.5%
100.0%
100.0%
100.0%
100.0%
oil
58
62
66
68
0.6%
35.6%
34.4%
31.3%
28.6%
gas
77
88
115
142
2.5%
47.2%
48.9%
54.6%
60.1%
net electricity*)
28
30
29
26
-0.3%
17.3%
16.5%
13.9%
11.1%
coal
0.0%
0.0%
0.0%
0.0%
renewables
0
0
0
0
0.0%
0.2%
0.2%
0.2%
Transport 218
246
242
232
0.3%
100.0%
100.0%
100.0%
100.0%
oil
211
239
236
227
0.3%
97.0%
97.1%
97.5%
97.9%
others (CNG)
6
7
6
5
-1.0%
3.0%
2.9%
2.5%
2.1%
Other sectors 401
431
425
426
0.2%
100.0%
100.0%
100.0%
100.0%
oil
112
110
77
59
-2.5%
28.0%
25.6%
18.2%
13.9%
gas
232
256
272
285
0.8%
57.8%
59.5%
64.1%
66.9%
electricity
57
64
75
82
1.5%
14.1%
15.0%
17.7%
19.3%
coal
renewables
0
0
0
0
Non-energy use 21
21
27
34
0.0%
Electricity generation in TWh/a 187
205
221
224
0.7%
100.0%
100.0%
100.0%
100.0%
fossil
182
191
206
208
0.5%
97.5%
93.3%
93.2%
92.8%
nuclear
0
6
6
6
0.0%
2.9%
2.7%
2.7%
renewables
5
8
9
10
3.1%
2.5%
3.7%
4.1%
4.5%
Total Primary Energy Demand 997
1,112
1,200
1,242
0.9%
100.0%
100.0%
100.0%
100.0%
Oil 460
499
475
455
0.0%
46.1%
44.9%
39.6%
36.6%
Gas 535
597
701
763
1.4%
53.6%
53.6%
58.4%
61.4%
Nuclear 0
11
11
11
0.0%
1.0%
0.9%
0.9%
Hydro & other REN elec.
3
6
6
7
3.6%
0.3%
0.5%
0.5%
0.5%
other renewables 0
0
0
0
0.0%
0.0%
0.0%
0.0%
Coal 0
0
7
7
0.0%
0.0%
0.6%
0.6%
Source: own calculations
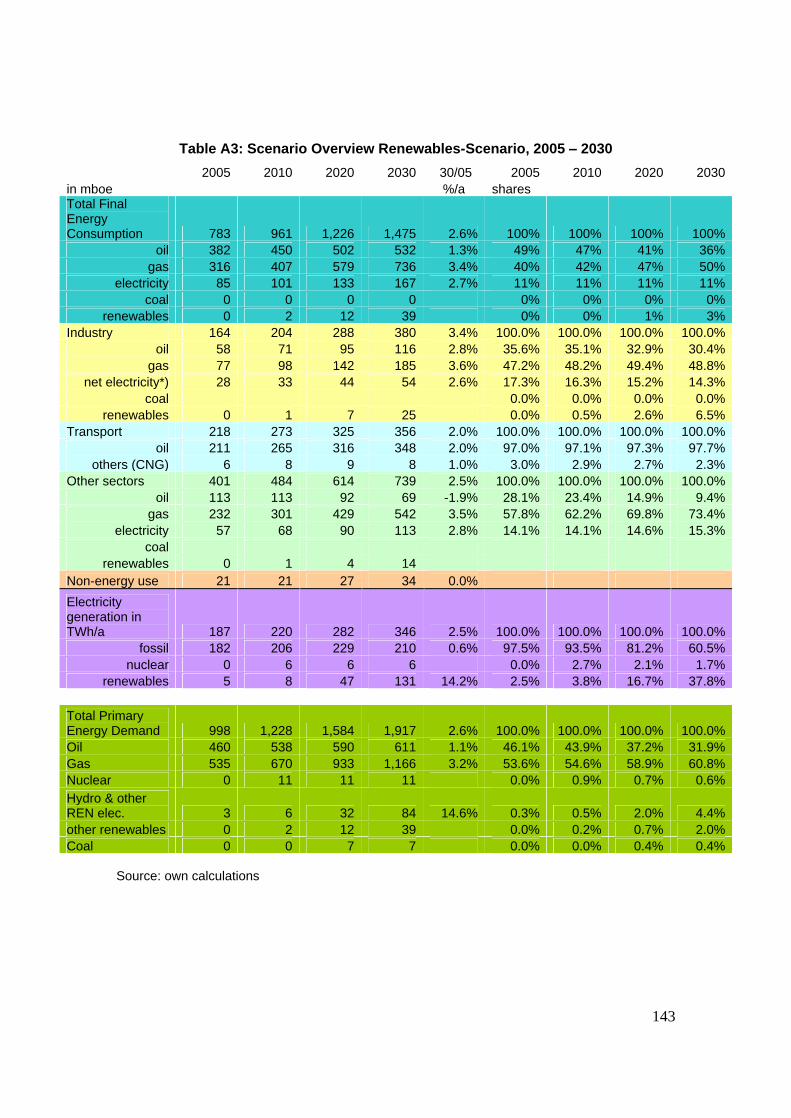
143
Table A3: Scenario Overview Renewables-Scenario, 2005
2030
2005
2010
2020
2030
30/05 2005
2010
2020
2030
in mboe %/a shares Total Final Energy Consumption 783
961
1,226
1,475
2.6%
100%
100%
100%
100%
oil
382
450
502
532
1.3%
49%
47%
41%
36%
gas
316
407
579
736
3.4%
40%
42%
47%
50%
electricity
85
101
133
167
2.7%
11%
11%
11%
11%
coal
0
0
0
0
0%
0%
0%
0%
renewables
0
2
12
39
0%
0%
1%
3%
Industry 164
204
288
380
3.4%
100.0%
100.0%
100.0%
100.0%
oil
58
71
95
116
2.8%
35.6%
35.1%
32.9%
30.4%
gas
77
98
142
185
3.6%
47.2%
48.2%
49.4%
48.8%
net electricity*)
28
33
44
54
2.6%
17.3%
16.3%
15.2%
14.3%
coal
0.0%
0.0%
0.0%
0.0%
renewables
0
1
7
25
0.0%
0.5%
2.6%
6.5%
Transport 218
273
325
356
2.0%
100.0%
100.0%
100.0%
100.0%
oil
211
265
316
348
2.0%
97.0%
97.1%
97.3%
97.7%
others (CNG)
6
8
9
8
1.0%
3.0%
2.9%
2.7%
2.3%
Other sectors 401
484
614
739
2.5%
100.0%
100.0%
100.0%
100.0%
oil
113
113
92
69
-1.9%
28.1%
23.4%
14.9%
9.4%
gas
232
301
429
542
3.5%
57.8%
62.2%
69.8%
73.4%
electricity
57
68
90
113
2.8%
14.1%
14.1%
14.6%
15.3%
coal
renewables
0
1
4
14
Non-energy use 21
21
27
34
0.0%
Electricity generation in TWh/a 187
220
282
346
2.5%
100.0%
100.0%
100.0%
100.0%
fossil
182
206
229
210
0.6%
97.5%
93.5%
81.2%
60.5%
nuclear
0
6
6
6
0.0%
2.7%
2.1%
1.7%
renewables
5
8
47
131
14.2%
2.5%
3.8%
16.7%
37.8%
Total Primary Energy Demand 998
1,228
1,584
1,917
2.6%
100.0%
100.0%
100.0%
100.0%
Oil 460
538
590
611
1.1%
46.1%
43.9%
37.2%
31.9%
Gas 535
670
933
1,166
3.2%
53.6%
54.6%
58.9%
60.8%
Nuclear 0
11
11
11
0.0%
0.9%
0.7%
0.6%
Hydro & other REN elec. 3
6
32
84
14.6%
0.3%
0.5%
2.0%
4.4%
other renewables 0
2
12
39
0.0%
0.2%
0.7%
2.0%
Coal 0
0
7
7
0.0%
0.0%
0.4%
0.4%
Source: own calculations

144
Table A4: Scenario Overview Combined Scenario, 2005
2030
2005
2010
2020
2030
30/05 2005
2010
2020
2030
in mboe %/a shares Total Final Energy Consumption 783
849
848
841
0.3%
100%
100%
100%
100%
oil
382
408
372
346
-0.4%
49%
48%
44%
41%
gas
316
344
363
365
0.6%
40%
41%
43%
43%
electricity
85
94
105
110
1.0%
11%
11%
12%
13%
coal
0
0
0
0
0%
0%
0%
0%
renewables
0
2
8
21
0%
0%
1%
2%
Industry 164
180
211
234
1.4%
100.0%
100.0%
100.0%
100.0%
oil
58
62
64
63
0.3%
35.6%
34.3%
30.5%
26.9%
gas
77
88
112
131
2.1%
47.2%
48.8%
53.2%
55.8%
net electricity*)
28
30
30
28
-0.1%
17.3%
16.5%
14.1%
11.8%
coal
0.0%
0.0%
0.0%
0.0%
renewables
0
1
5
13
0.0%
0.5%
2.3%
5.4%
Transport 218
246
241
232
0.3%
100.0%
100.0%
100.0%
100.0%
oil
211
239
235
227
0.3%
97.0%
97.1%
97.5%
97.9%
others (CNG)
6
7
6
5
-1.0%
3.0%
2.9%
2.5%
2.1%
Other sectors 401
423
395
374
-0.3%
100.0%
100.0%
100.0%
100.0%
oil
112
108
72
55
-2.8%
28.0%
25.6%
18.2%
14.8%
gas
232
249
245
229
0.0%
57.8%
58.9%
62.0%
61.2%
electricity
57
64
75
82
1.5%
14.1%
15.2%
19.0%
21.9%
coal
renewables
0
1
3
8
Non-energy use 21
21
27
34
0.0%
Electricity generation in TWh/a 187
205
222
227
0.8%
100.0%
100.0%
100.0%
100.0%
fossil
182
190
169
92
-2.7%
97.5%
93.0%
76.1%
40.3%
nuclear
0
6
6
6
0.0%
2.9%
2.7%
2.6%
renewables
5
8
47
130
14.2%
2.5%
4.1%
21.2%
57.1%
Total Primary Energy Demand 997
1,106
1,160
1,187
0.7%
100.0%
100.0%
100.0%
100.0%
Oil 460
497
456
402
-0.5%
46.1%
45.0%
39.3%
33.9%
Gas 535
590
646
664
0.9%
53.6%
53.4%
55.7%
55.9%
Nuclear 0
11
11
11
0.0%
1.0%
0.9%
0.9%
Hydro & other REN elec. 3
6
32
83
14.6%
0.3%
0.5%
2.8%
7.0%
other renewables 0
2
8
21
0.0%
0.2%
0.7%
1.7%
Coal 0
0
7
7
0.0%
0.0%
0.6%
0.6%
Source: own calculations
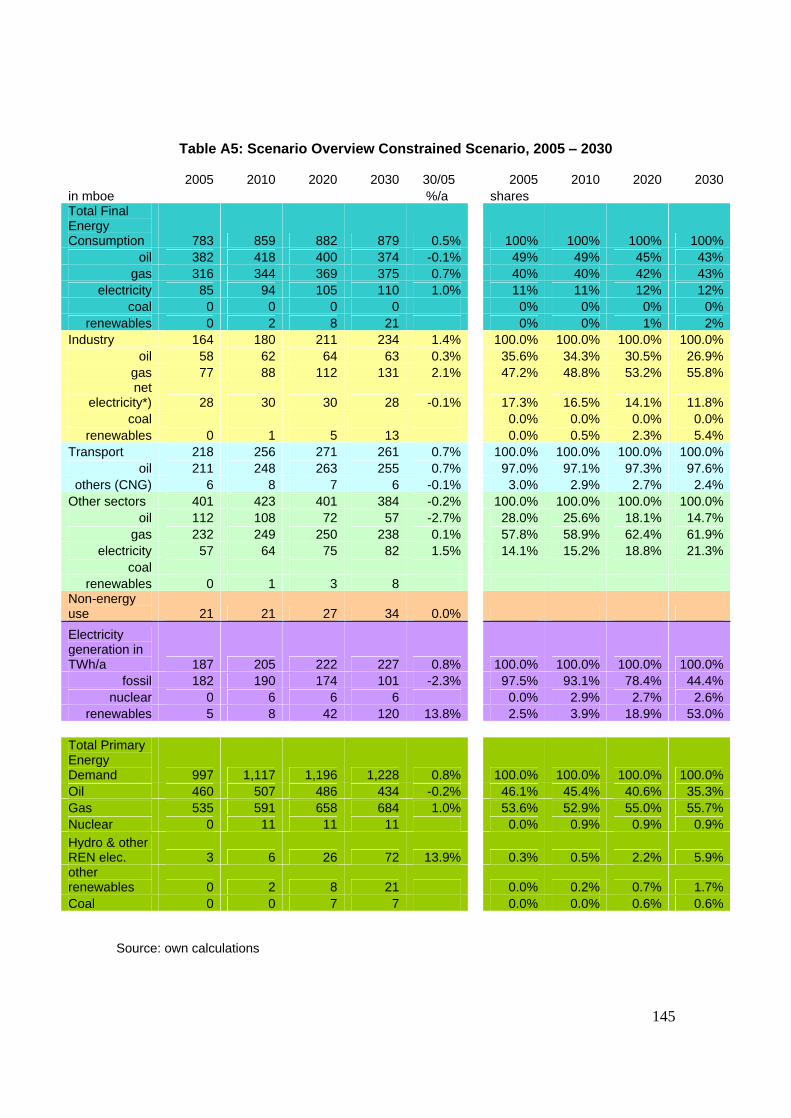
145
Table A5: Scenario Overview Constrained Scenario, 2005
2030
Source: own calculations
2005
2010
2020
2030
30/05 2005
2010
2020
2030
in mboe %/a shares Total Final Energy Consumption 783
859
882
879
0.5%
100%
100%
100%
100%
oil
382
418
400
374
-0.1%
49%
49%
45%
43%
gas
316
344
369
375
0.7%
40%
40%
42%
43%
electricity
85
94
105
110
1.0%
11%
11%
12%
12%
coal
0
0
0
0
0%
0%
0%
0%
renewables
0
2
8
21
0%
0%
1%
2%
Industry 164
180
211
234
1.4%
100.0%
100.0%
100.0%
100.0%
oil
58
62
64
63
0.3%
35.6%
34.3%
30.5%
26.9%
gas
77
88
112
131
2.1%
47.2%
48.8%
53.2%
55.8%
net electricity*)
28
30
30
28
-0.1%
17.3%
16.5%
14.1%
11.8%
coal
0.0%
0.0%
0.0%
0.0%
renewables
0
1
5
13
0.0%
0.5%
2.3%
5.4%
Transport 218
256
271
261
0.7%
100.0%
100.0%
100.0%
100.0%
oil
211
248
263
255
0.7%
97.0%
97.1%
97.3%
97.6%
others (CNG)
6
8
7
6
-0.1%
3.0%
2.9%
2.7%
2.4%
Other sectors 401
423
401
384
-0.2%
100.0%
100.0%
100.0%
100.0%
oil
112
108
72
57
-2.7%
28.0%
25.6%
18.1%
14.7%
gas
232
249
250
238
0.1%
57.8%
58.9%
62.4%
61.9%
electricity
57
64
75
82
1.5%
14.1%
15.2%
18.8%
21.3%
coal
renewables
0
1
3
8
Non-energy use 21
21
27
34
0.0%
Electricity generation in TWh/a 187
205
222
227
0.8%
100.0%
100.0%
100.0%
100.0%
fossil
182
190
174
101
-2.3%
97.5%
93.1%
78.4%
44.4%
nuclear
0
6
6
6
0.0%
2.9%
2.7%
2.6%
renewables
5
8
42
120
13.8%
2.5%
3.9%
18.9%
53.0%
Total Primary Energy Demand 997
1,117
1,196
1,228
0.8%
100.0%
100.0%
100.0%
100.0%
Oil 460
507
486
434
-0.2%
46.1%
45.4%
40.6%
35.3%
Gas 535
591
658
684
1.0%
53.6%
52.9%
55.0%
55.7%
Nuclear 0
11
11
11
0.0%
0.9%
0.9%
0.9%
Hydro & other REN elec. 3
6
26
72
13.9%
0.3%
0.5%
2.2%
5.9%
other renewables 0
2
8
21
0.0%
0.2%
0.7%
1.7%
Coal 0
0
7
7
0.0%
0.0%
0.6%
0.6%

146
References
Bundesministerium für Umwelt, Naturschutz und Reaktorsicherheit: Leitstudie 2008.
Berlin, Oktober 2008, S. 123
CEERS, HBS, WI (2005), Case Study: Solar Thermal Energy in Iran (2005). Executive
Summary. CEERS; Wuppertal Institute for Climate Environment and Energy;
Quadrat; University of Osnabrueck. Wuppertal/Tehran, p 15.
CEERS, HBS, WI (2006). Evaluation of Long-Term Energy Policies in Iran.
Projektbericht. Center for Environment and Energy Research and Studies, Heinrich
B?ll Stiftung, Wuppertal Institut für Klima, Umwelt, Energie
Central Bank of Iran, Economic Indicators, various issues.
CIA (2007),The World Fact Book, Iran ,.
City of Tehran, Tehran Transportation and Traffic Studies, , various years.
DLR (2005): Concentrating Solar Power for the Mediterranean Region. Deutsches
Zentrum für Luft- und Raumfahrt e.V. (DLR), Stuttgart
Deutscher Bundestag: Nachhaltige Energieversorgung unter den Bedingungen der
Globalisierung und Liberalisierung. Zur Sache 6/2002, Berlin, P. 724 f
Ecofys (2006): GLOBAL LOW ENERGY DEMAND SCENARIOS 2003-2050, Wina
Economist Intelligence Unit (2006), Iran: Energy and Electricity Profile
Economist Intelligence Unit (2006), Iran: Energy and Electricity Forecast
Economist Intelligence Unit (2006), Iran: Energy and Electricity Profile (2006),
Economist Intelligence Unit
Economist Intelligence Unit (2006), Iran: Energy and Electricity Forecast (2006),
Economist Intelligence Unit
147
Fettini, Habib (2003), Iran: Medium Term Framework for Transition, Converting Oil
Wealth to Development, A Country Economic Memorandum, Word Bank, Social
and Economic Development Group, Middle East and North Africa Region,
Report No. 25848-IRN, April 30, 2003.
Fotouhi, Manuchehr (1994). Iran s Geothermal Potential. International Geothermal
Association, IGA News, Nr. 17, S. 5
Fotouhi, Manuchehr (1995). Geothermal Development in Sabalan, Iran. Proceedings
World Geothermal Congress, Florenz, Mai 1995, S. 191
196
Fotouhi, Manuchehr, Younes Noorollahi (2000). Updated Geothermal Activities in Iran.
Proceedings World Geothermal Congress 2000, Kyushu-Tohoku, 28.5.
10.6.2000.
S. 183
185
Graus Wina, and Mirjam Harmelink (2006), Global Low Energy Demand Scenarios
2003-2050, Ecofys BV, Project No. ECS05100, Deutsches Zentrium Fur Luft-
und Raumfahrt (DLR), August
Hagenkort, Bert (2004). (Wind-)Verh?ltnisse im Iran. Erneuerbare Energien, Nr.7/2004,
Juli
IFCO, Optimizing Energy Consumption in Industry Sector in the Next 20 Years, IFCO,
2007
International Energy Agency (IEA), Energy Balance for OECD and Non-OECD
countries, , 2002-2003 edition
International Energy Agency (IEA), Carrots and Sticks: Taxing and Subsidizing Energy,
Note on Energy Subsidies and Taxes, Economic Analysis Division, 17 January
2006

148
Iranian Economic Research Center, Iranian Economic Literature and Data Bank
(IELDB), , University of Allameh Tababaie, 2007
IRI Rail Road (1381), Rail Road Statistics
International Energy Agency (IEA)(2006), Carrots and Sticks: Taxing and Subsidizing
Energy, Note on Energy Subsidies and Taxes, Economic Analysis Division, 17
January 2006
International Energy Agency (2004), Oil Crisis and Climate Challenges, 30 Years of
Energy Use in IEA Countries, International Energy Agency, OECD/IEA, 2004
IPDC (2001). The integrated solar combined cycle (ISCCS) power plant project in Yazd,
Iran. Project description and Status of October 2001. Iranian Power Development
Company. www.ystpp.com
IPCC, Climate Change 2001: Mitigation . A Report of Working Group III of the
Intergovernmental Panel on Climate Change. Accra.
Kipke, Rüdiger (2004). Pers?nliche Kommunikation (Telefonat), 25.10.2004
Management and Plan Organization, Economic Reports, various years
Ministry of Energy, Energy Balance, various years
Management and Plan Organization, Transportation Reports, various years
Management and Plan Organization, Energy Reports, various years
Ministry of Road and Transport (2005), Comprehensive Transportation Studies of Iran,
Ministry of Road and Transport, Tehran
Ministry of Transportation, Road Transportation Annual Report, Ministry of
Transportation, different various years.
McKinsey Global Institute: Fuelling sustainable development: The energy productivity
solution, Oktober 2008, p. 10.

149
Nouraliee, Younes (2004). Pers?nliche Kommunikation mit Javad Nouraliee, Niroo
Research Institute NRI, 4.10.2004, Teheran
Samimi J. ( 1994) Estimation of height-dependent solar irradiation and application to the
solar climate of Iran. Solar Energy 52, 401
409
Statistical Center of Iran (2004),The Large Manufacturing Industries Survey,.
Supersberger, Nikolaus (2007), Szenarien eines diversifizierten Energieangebots in
OPEC-Staaten am Beispiel Irans. Dissertation. University of Osnabrueck.
TAVANIR, Energy Savings in Audited Industries, Tehran Regional Electricity Company
(TREC), various reports, 1999-2005.
TAVANIR, Reports by The Consumption Management Office , Production,
Transmission, and Distribution Company, TAVANIR, variousdifferent years
Tehran Police, Traffic Police Reports, different various years.
The Cost-Benefits to Health of a Strong EU Climate Change Policy. A Mutual Study of
CAN Europe (www.climnet.org), Health & Environment Alliance (www.env-
health.org) and WWF (www.panda.org/eu) (Erscheinungsjahr + Ort)
WEC (2001). Survey of energy resources 2001. World Energy Council, Laxenburg.
www.worldenergy.org
World Bank (1999), Economic Aspects of Increasing Energy Prices to Border Price
Levels in Islamic Republic of Iran, Middle East and North Africa Region
World Bank (2006). Clean Energy and Development: Towards an Investment
Framework. Worldbank, Washington, D. C.
World Energy Outlook (2004, 2008), Internatioal Energy Agency, OECD.

This document was created with Win2PDF available at http://www.daneprairie.com.The unregistered version of Win2PDF is for evaluation or non-commercial use only.
Related Documents