Energy in Transport 2007 REPORT

Welcome message from author
This document is posted to help you gain knowledge. Please leave a comment to let me know what you think about it! Share it to your friends and learn new things together.
Transcript

Energy in Transport2007 REPORT


Energy in Transport 2007 Report
Report prepared by Martin Howley, Fergal O’ Leary and Dr. Brian Ó Gallachóir December 2007

Sustainable Energy Ireland (SEI)
Sustainable Energy Ireland was established as Ireland’s national energy agency under the Sustainable Energy Act 2002. SEI’s mission is to promote and assist the development of sustainable energy. This encompasses environmentally and economically sustainable production, supply and use of energy, in support of Government policy, across all sectors of the economy including public bodies, the business sector, local communities and individual consumers. Its remit relates mainly to improving energy efficiency, advancing the development and competitive deployment of renewable sources of energy and combined heat and power, and reducing the environmental impact of energy production and use, particularly in respect of greenhouse gas emissions. SEI is charged with implementing significant aspects of government policy on sustainable energy and the climate change abatement, including:
• Assisting deployment of superior energy technologies in each sector as required; • Raising awareness and providing information, advice and publicity on best practice; • Stimulating research, development and demonstration; • Stimulating preparation of necessary standards and codes; • Publishing statistics and projections on sustainable energy and achievement of targets.
It is funded by the Government through the National Development Plan with programmes part financed by the European Union. Energy Policy Statistical Support Unit (EPSSU) SEI has a lead role in developing and maintaining comprehensive national and sectoral statistics for energy production, transformation and end use. This data is a vital input to meeting international reporting obligations, for advising policy makers and informing investment decisions. Based in Cork, EPSSU is SEI’s specialist statistics team. Its core functions are to:
• Collect, process and publish energy statistics to support policy analysis and development in line with national needs and international obligations;
• Conduct statistical and economic analyses of energy services sectors and sustainable energy options; • Contribute to the development and promulgation of appropriate sustainability indicators.
© Sustainable Energy Ireland Reproduction of the contents is permissible provided the source is acknowledged.
1
Highlights
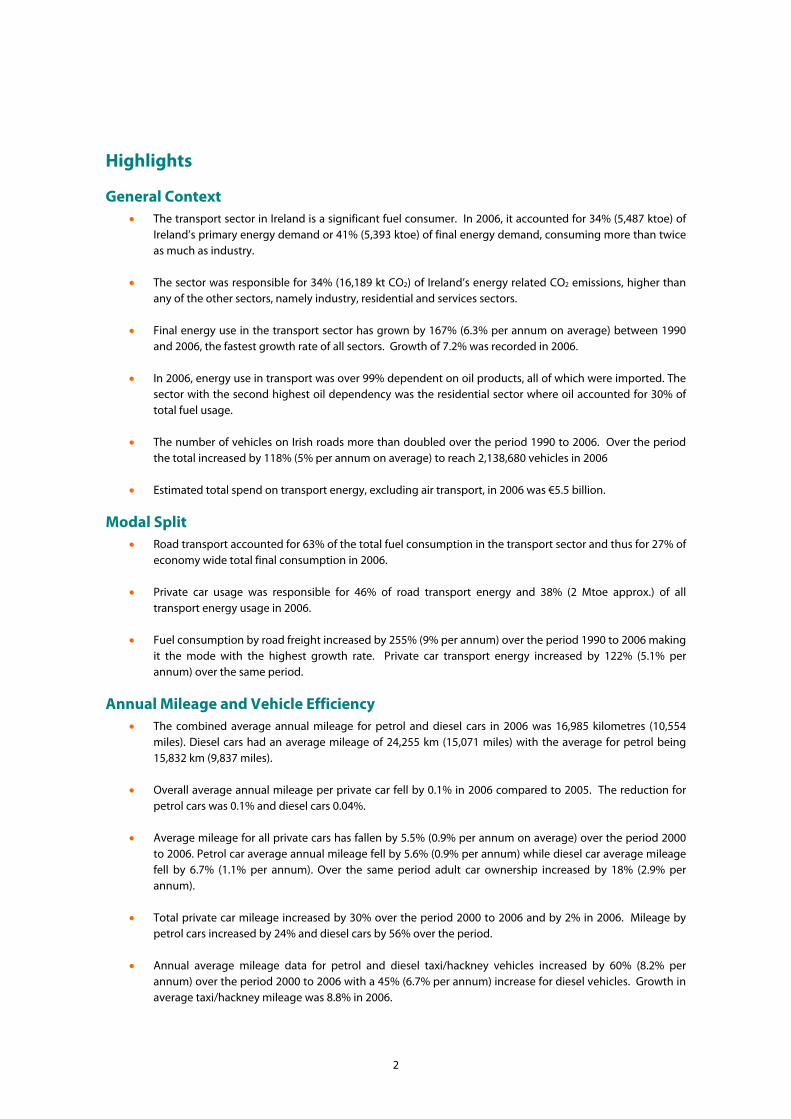
General Context • The transport sector in Ireland is a significant fuel consumer. In 2006, it accounted for 34% (5,487 ktoe) of
Ireland’s primary energy demand or 41% (5,393 ktoe) of final energy demand, consuming more than twice as much as industry.
• The sector was responsible for 34% (16,189 kt CO2) of Ireland’s energy related CO2 emissions, higher than
any of the other sectors, namely industry, residential and services sectors.
• Final energy use in the transport sector has grown by 167% (6.3% per annum on average) between 1990 and 2006, the fastest growth rate of all sectors. Growth of 7.2% was recorded in 2006.
• In 2006, energy use in transport was over 99% dependent on oil products, all of which were imported. The
sector with the second highest oil dependency was the residential sector where oil accounted for 30% of total fuel usage.
• The number of vehicles on Irish roads more than doubled over the period 1990 to 2006. Over the period
the total increased by 118% (5% per annum on average) to reach 2,138,680 vehicles in 2006
• Estimated total spend on transport energy, excluding air transport, in 2006 was €5.5 billion.
Modal Split • Road transport accounted for 63% of the total fuel consumption in the transport sector and thus for 27% of
economy wide total final consumption in 2006.
• Private car usage was responsible for 46% of road transport energy and 38% (2 Mtoe approx.) of all transport energy usage in 2006.
• Fuel consumption by road freight increased by 255% (9% per annum) over the period 1990 to 2006 making
it the mode with the highest growth rate. Private car transport energy increased by 122% (5.1% per annum) over the same period.
Annual Mileage and Vehicle Efficiency • The combined average annual mileage for petrol and diesel cars in 2006 was 16,985 kilometres (10,554
miles). Diesel cars had an average mileage of 24,255 km (15,071 miles) with the average for petrol being 15,832 km (9,837 miles).
• Overall average annual mileage per private car fell by 0.1% in 2006 compared to 2005. The reduction for
petrol cars was 0.1% and diesel cars 0.04%.
• Average mileage for all private cars has fallen by 5.5% (0.9% per annum on average) over the period 2000 to 2006. Petrol car average annual mileage fell by 5.6% (0.9% per annum) while diesel car average mileage fell by 6.7% (1.1% per annum). Over the same period adult car ownership increased by 18% (2.9% per annum).
• Total private car mileage increased by 30% over the period 2000 to 2006 and by 2% in 2006. Mileage by
petrol cars increased by 24% and diesel cars by 56% over the period.
• Annual average mileage data for petrol and diesel taxi/hackney vehicles increased by 60% (8.2% per annum) over the period 2000 to 2006 with a 45% (6.7% per annum) increase for diesel vehicles. Growth in average taxi/hackney mileage was 8.8% in 2006.
2

• The specific energy consumption for all new cars on the road in Ireland in 2006 was 2.3 MJ/km. In 2006, the weighted average energy efficiency for new petrol and diesel cars were equal with new petrol cars having an average energy use of 2.27 MJ/km and new diesel cars 2.26 MJ/km.
• Specific energy use of new petrol cars fell by 4% in 2006 compared with 2005 while specific energy use of
new diesel cars fell by 2%.
• The specific fuel consumption for new petrol cars on the road in Ireland in 2006 was 6.7 litres/100km (42 miles per gallon, mpg). This represents a decrease of 2.4% (increase in fuel efficiency) on the average consumption in 2000 and indicates that, overall, the weighted average of newly purchased petrol cars is becoming more fuel efficient.
• The comparable 2006 fuel efficiency figure for new diesel cars was 6.2 litres/100km (46 mpg), which was
0.2% lower than in 2000.
Ownership and Purchasing Patterns • In Ireland private car ownership per 1,000 population increased by 3.2% in 2006 which resulted in an
increase in car density to 420 cars per 1,000 population. This is compared to an EU-25 average of 476 and a UK average of 469 (both in 2005).
• In Ireland the number of private cars per permanently occupied dwelling was 1.2 in 2006, representing a
54% increase on 1990. In 1998 the number of private cars exceeded the number of permanently occupied dwellings for the first time.
• Private car ownership per 1,000 adults increased by 2.9% in 2006 to 528 cars per 1,000 adults, compared to
an EU-25 average of 558 and a UK average of 555 (both in 2003).
• Since 2005 there has been more than one car for every two adults in Ireland.
• The numbers of cars with an engine size of 1.2 litres or less are showing steady or declining numbers whereas the numbers of cars with engine size of larger then 1.2 litres are all showing increasing trends. The 1.2 to 1.5 litre engine size has the largest share of private cars, 39% of the total in 2006. This was over twice the share of the second most popular class, the 0.9 to1.2 litre band which accounted for 17% of the total.
• The dominant share of private cars has shifted from the 900cc – 1.2 litre engine size category in 1990 to 1.2
– 1.5 litre size category in 2006.
• Private cars with engines greater than 1.7 litres have increased their share from 13% in 1990 to 29% in 2006
• Over the period 1990 to 2006 the average engine size of the private car fleet has increased by 14% (0.8% per annum). The average engine size increased by 1.2% in 2006.
• In 2006, 50% of diesel car engines were over 1.9 litre capacity.
• Diesel car share of the private car fleet has increased from 13% in 2000 to 16% in 2006. Over the same
period the share of diesel in the taxis fleet has decreased from 53% to 47%.
• Almost a quarter (24%) of all private cars registered for the first time in 2006 was second-hand imports.
• Of second-hand imports in 2006, 30% were in the greater than 1.9 litre engine size category. This compares with just 16% for new cars.
• Of second-hand imports in 2006, 56% were in the greater than 1.7 litre engine size category. This
compares with 29% for new cars.
3
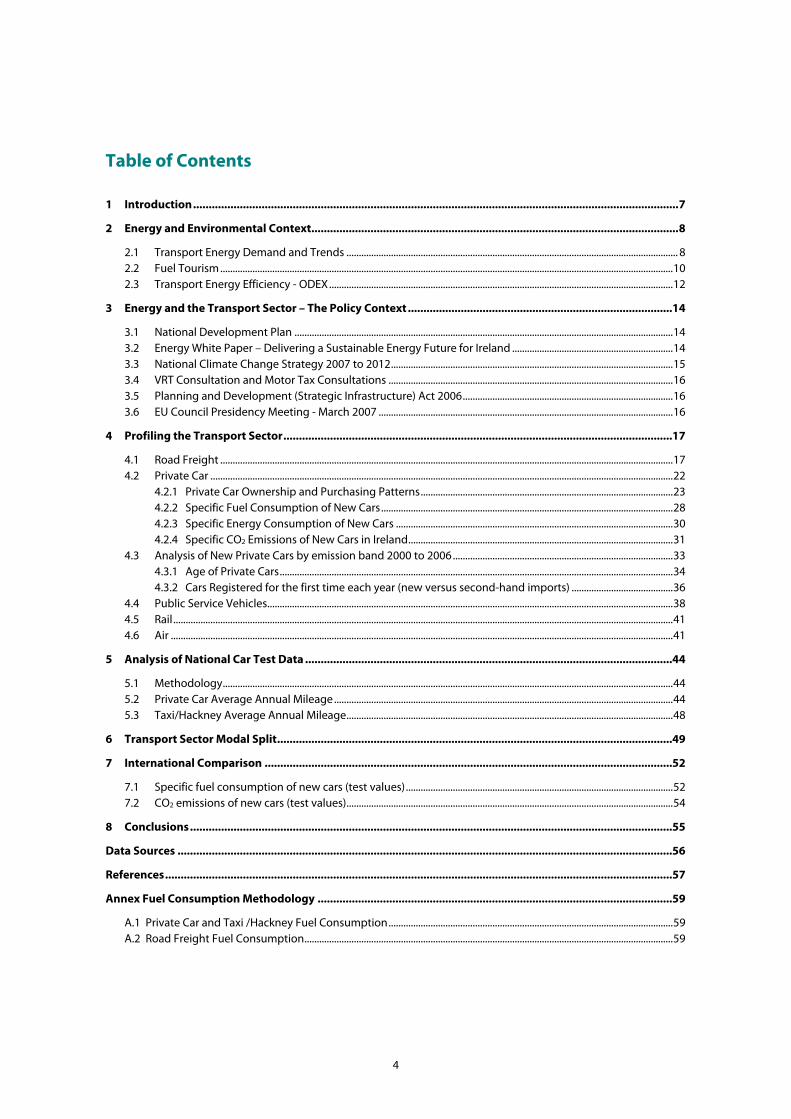
Table of Contents
1 Introduction............................................................................................................................................................7 2 Energy and Environmental Context......................................................................................................................8
2.1 Transport Energy Demand and Trends ...................................................................................................................................... 8 2.2 Fuel Tourism.......................................................................................................................................................................................10 2.3 Transport Energy Efficiency - ODEX...........................................................................................................................................12
3 Energy and the Transport Sector – The Policy Context.....................................................................................14 3.1 National Development Plan .........................................................................................................................................................14 3.2 Energy White Paper – Delivering a Sustainable Energy Future for Ireland .................................................................14 3.3 National Climate Change Strategy 2007 to 2012..................................................................................................................15 3.4 VRT Consultation and Motor Tax Consultations ...................................................................................................................16 3.5 Planning and Development (Strategic Infrastructure) Act 2006.....................................................................................16 3.6 EU Council Presidency Meeting - March 2007 .......................................................................................................................16
4 Profiling the Transport Sector.............................................................................................................................17 4.1 Road Freight .......................................................................................................................................................................................17 4.2 Private Car ...........................................................................................................................................................................................22
4.2.1 Private Car Ownership and Purchasing Patterns......................................................................................................23 4.2.2 Specific Fuel Consumption of New Cars......................................................................................................................28 4.2.3 Specific Energy Consumption of New Cars ................................................................................................................30 4.2.4 Specific CO2 Emissions of New Cars in Ireland...........................................................................................................31
4.3 Analysis of New Private Cars by emission band 2000 to 2006.........................................................................................33 4.3.1 Age of Private Cars...............................................................................................................................................................34 4.3.2 Cars Registered for the first time each year (new versus second-hand imports) .........................................36
4.4 Public Service Vehicles....................................................................................................................................................................38 4.5 Rail..........................................................................................................................................................................................................41 4.6 Air ...........................................................................................................................................................................................................41
5 Analysis of National Car Test Data ......................................................................................................................44 5.1 Methodology......................................................................................................................................................................................44 5.2 Private Car Average Annual Mileage.........................................................................................................................................44 5.3 Taxi/Hackney Average Annual Mileage....................................................................................................................................48
6 Transport Sector Modal Split...............................................................................................................................49 7 International Comparison ...................................................................................................................................52
7.1 Specific fuel consumption of new cars (test values)............................................................................................................52 7.2 CO2 emissions of new cars (test values)....................................................................................................................................54
8 Conclusions...........................................................................................................................................................55 Data Sources ...............................................................................................................................................................56 References...................................................................................................................................................................57 Annex Fuel Consumption Methodology ..................................................................................................................59
A.1 Private Car and Taxi /Hackney Fuel Consumption...................................................................................................................59 A.2 Road Freight Fuel Consumption.....................................................................................................................................................59
4

Table of Figures
Figure 1 GDP and Transport Energy 1990 to 2006 – Index...............................................................................................................9 Figure 2 Transport Sector Total Final Consumption of Oil 1990 to 2006................................................................................... 10 Figure 3 Difference in Petrol Prices for the ROI and the UK 1990 to 2006 .................................................................................. 11 Figure 4 Difference in Diesel Prices for the ROI and the UK 1990 to 2006 .................................................................................. 12 Figure 5 Transport ODEX 1995 to 2005 ............................................................................................................................................. 13 Figure 6 Road Vehicle Fleet 1990 to 2006 ......................................................................................................................................... 17 Figure 7 Road Freight Fuel Consumption and GDP 1990 to 2006 –Index ................................................................................. 18 Figure 8 Goods Vehicles Fleet by Unladen Weight 1990 to 2006................................................................................................. 19 Figure 9 Age of Goods Vehicles 2006 ................................................................................................................................................. 19 Figure 10 Average Age of Goods Vehicles 1990 to 2006 .................................................................................................................. 20 Figure 11 Road Freight Activity 1991 to 2006 – Index ...................................................................................................................... 21 Figure 12 Road Freight Energy Intensity 1990 to 2005..................................................................................................................... 22 Figure 13 Private Car Fuel Consumption and Personal Consumption 1990 to 2005 ................................................................ 23 Figure 14 Private Car Ownership 1990 to 2006.................................................................................................................................. 24 Figure 15 Change in Car Engine Size 1990 to 2006 ........................................................................................................................... 25 Figure 16 Change in Car Engine Size 1990 to 2006 – Index............................................................................................................. 26 Figure 17 Estimated Average Private Car Engine Size 1990 to 2006 ............................................................................................. 27 Figure 18 Specific Fuel Consumption of New Cars 2000 to 2006 ................................................................................................... 29 Figure 19 Specific Energy Consumption of New Cars 2000 to 2006 ............................................................................................. 31 Figure 20 Specific CO2 Emissions of New Cars 2000 to 2006........................................................................................................... 32 Figure 21 Percentage of New Vehicles in each emission band 2000 to 2006.............................................................................. 33 Figure 22 Age of Private Cars 2006 ....................................................................................................................................................... 35 Figure 23 Average Age of Private Cars 1990 to 2006 ........................................................................................................................ 35 Figure 24 New & Used Imports 1990 to 2006...................................................................................................................................... 36 Figure 25 Used Imports 1990 to 2006 - Numbers............................................................................................................................... 37 Figure 26 Used Imports 1990 to 2006 – Index (1990 = 100) ............................................................................................................ 37 Figure 27 Fuel Consumption of Buses 1995 to 2006 ......................................................................................................................... 38 Figure 28 Stock of Buses by Fuel Type 1990 to 2006 ......................................................................................................................... 39 Figure 29 Fuel Consumption of Taxis /Hackneys 1990 to 2005...................................................................................................... 40 Figure 30 Stock of Taxi /Hackney Vehicles by Fuel Type 1990 to 2006......................................................................................... 40 Figure 31 Rail Passenger and Tonne Kilometres 1990 to 2005 - Index ......................................................................................... 41 Figure 32 Air Passenger Travel 1990 to 2005...................................................................................................................................... 42 Figure 33 Air Passenger Travel 1990 and 2006 .................................................................................................................................. 43 Figure 34 Aircraft Movements 1990 to 2005....................................................................................................................................... 43 Figure 35 Private Car Average Annual Mileage 2000 to 2006 ........................................................................................................ 45 Figure 36 Petrol Car Average Annual Mileage by Engine Size Band 2006 ................................................................................... 46 Figure 37 Diesel Car Average Annual Mileage by Engine Size Band 2006 ................................................................................... 46 Figure 38 Taxi /Hackney Average Annual Mileage 2000 to 2006 .................................................................................................. 48 Figure 39 Energy Flow Transport Sector 2006.................................................................................................................................... 49 Figure 40 Transport Final Energy Demand by Mode 1990 to 2006 ............................................................................................... 50 Figure 41 Transport CO2 Emissions by Mode 1990 to 2006 ............................................................................................................ 51 Figure 42 Comparison of Specific Consumption of New Cars - Overall........................................................................................ 52 Figure 43 Comparison of Specific Consumption of New Petrol Cars ............................................................................................ 53 Figure 44 Comparison of Specific Consumption of New Diesel Cars ............................................................................................ 53 Figure 45 Comparison of Test CO2 Emission of New Cars................................................................................................................ 54
5

Table of Tables Table 1 GDP, Transport Primary Energy Requirement and CO2 Growth Rates ..........................................................................8 Table 2 Growth Rates and Shares of Final Energy Consumption in Transport ..........................................................................9 Table 3 Growth Rates and Shares of TFC by Sector ....................................................................................................................... 10 Table 4 Petrol Prices for ROI and the UK 1990 to 2006.................................................................................................................. 11 Table 5 Table 2.5: Diesel Prices for ROI and the UK 1990 to 2006............................................................................................... 12 Table 6 NCCS 2007 - 2012 Emissions Reductions in Transport (Existing Measures) .............................................................. 16 Table 7 NCCS 2007 - 2012 Emissions Reductions in Transport (Additional Measures) ......................................................... 16 Table 8 Growth Rates and Shares of Road Vehicle Fleet 1990 to 2006 ..................................................................................... 17 Table 9 Growth Rates and Shares of Goods Vehicle Fleet 1990 to 2006................................................................................... 18 Table 10 Growth Rates of Private Car Ownership 1990 to 2006................................................................................................... 23 Table 11 Change in Car Engine Size – Growth Rates & Shares Overall (numbers on the road)............................................. 25 Table 12 Change in Petrol Car Engine Size – Growth Rates & Shares (numbers on the road) ............................................... 27 Table 13 Change in Diesel Car Engine Size – Growth Rates & Shares (numbers on the road) ............................................... 28 Table 14 Specific Fuel Consumption (Petrol and Diesel by Engine Size Band) 2000, 2005 & 2006 ....................................... 30 Table 15 Specific Energy Consumption by Fuel Type 2000, 2005 & 2006 .................................................................................. 30 Table 16 Specific CO2 Emissions (Petrol and Diesel by Engine Size Band) 2000, 2005 & 2006 ............................................... 32 Table 17 New Vehicle Shares by emission band............................................................................................................................... 33 Table 18 New Vehicle Numbers above and below the current average emissions .................................................................. 34 Table 19 Growth Rates & Shares of Used Imports 1990 to 2006 ................................................................................................... 38 Table 20 Estimates of Petrol Expenditure and Consumption by Engine Size Band.................................................................. 47 Table 21 Estimates of Petrol Expenditure and Consumption by Emissions Category ............................................................. 47 Table 22 Estimates of Diesel Expenditure and Consumption by Engine Size Band.................................................................. 47 Table 23 Estimates of Diesel Expenditure and Consumption by Emissions Category ............................................................. 48 Table 24 Growth Rates and Shares of Transport Final Energy Demand by Mode 1990 to 2006........................................... 50 Table 25 Growth Rates and Shares of Transport CO2 Emissions by Mode 1990 to 2006......................................................... 51
6
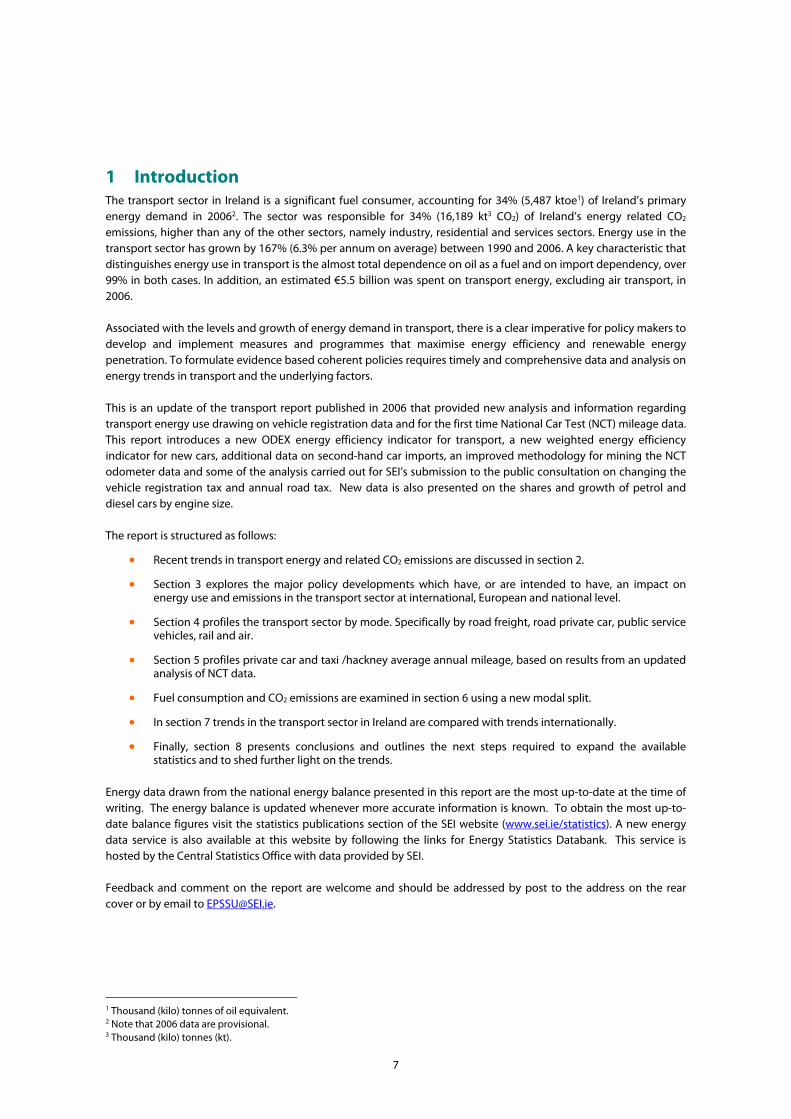
1 Introduction The transport sector in Ireland is a significant fuel consumer, accounting for 34% (5,487 ktoe1) of Ireland’s primary energy demand in 20062. The sector was responsible for 34% (16,189 kt3 CO2) of Ireland’s energy related CO2 emissions, higher than any of the other sectors, namely industry, residential and services sectors. Energy use in the transport sector has grown by 167% (6.3% per annum on average) between 1990 and 2006. A key characteristic that distinguishes energy use in transport is the almost total dependence on oil as a fuel and on import dependency, over 99% in both cases. In addition, an estimated €5.5 billion was spent on transport energy, excluding air transport, in 2006. Associated with the levels and growth of energy demand in transport, there is a clear imperative for policy makers to develop and implement measures and programmes that maximise energy efficiency and renewable energy penetration. To formulate evidence based coherent policies requires timely and comprehensive data and analysis on energy trends in transport and the underlying factors. This is an update of the transport report published in 2006 that provided new analysis and information regarding transport energy use drawing on vehicle registration data and for the first time National Car Test (NCT) mileage data. This report introduces a new ODEX energy efficiency indicator for transport, a new weighted energy efficiency indicator for new cars, additional data on second-hand car imports, an improved methodology for mining the NCT odometer data and some of the analysis carried out for SEI’s submission to the public consultation on changing the vehicle registration tax and annual road tax. New data is also presented on the shares and growth of petrol and diesel cars by engine size. The report is structured as follows:
• Recent trends in transport energy and related CO2 emissions are discussed in section 2.
• Section 3 explores the major policy developments which have, or are intended to have, an impact on energy use and emissions in the transport sector at international, European and national level.
• Section 4 profiles the transport sector by mode. Specifically by road freight, road private car, public service vehicles, rail and air.
• Section 5 profiles private car and taxi /hackney average annual mileage, based on results from an updated analysis of NCT data.
• Fuel consumption and CO2 emissions are examined in section 6 using a new modal split.
• In section 7 trends in the transport sector in Ireland are compared with trends internationally.
• Finally, section 8 presents conclusions and outlines the next steps required to expand the available statistics and to shed further light on the trends.
Energy data drawn from the national energy balance presented in this report are the most up-to-date at the time of writing. The energy balance is updated whenever more accurate information is known. To obtain the most up-to-date balance figures visit the statistics publications section of the SEI website (www.sei.ie/statistics). A new energy data service is also available at this website by following the links for Energy Statistics Databank. This service is
osted by the Central Statistics Office with data provided by SEI. h Feedback and comment on the report are welcome and should be addressed by post to the address on the rear cover or by email to [email protected].
1 Thousand (kilo) tonnes of oil equivalent. 2 Note that 2006 data are provisional. 3 Thousand (kilo) tonnes (kt).
7
2 Energy and Environmental Context This section provides an overview of energy trends in Ireland, covering the period 1990 to 2006, with an emphasis on the transport sector. A more detailed discussion of energy trends in Ireland generally is available in the latest edition of Energy in Ireland4. For the purposes of this report the transport sector in Ireland is split into the following modes:
• Road Freight, • Road Private Car, comprising cars taxed as private for the purposes of motor tax, • Public Service Vehicles, this category includes road going public, private, touring and coach vehicles as well
as taxi and hackney vehicles, • Rail, including both passenger and freight, • Air, • Unspecified. This category is the difference between estimates of fuel consumption and data from the
national energy balance and will therefore include any errors that arise from estimates of road freight etc. Also included in unspecified is fuel consumption by motorcycles, service vehicles (ambulances etc.), construction vehicles (excavators and loadalls etc) and by domestic water activities.
A further category, fuel tourism, is also analysed and is defined as fuel that is bought within the State by motorists and hauliers but consumed outside the State.
2.1 Transport Energy Demand and Trends The International Energy Agency (IEA) in a recent publication5 identified that energy use in the transport sector depends primarily on the following factors:
• Transport activity (the level of demand for personal mobility and for the transport of goods), • Modal mix (the chosen mix of transport modes like cars, buses planes, ships, aircraft, etc.), • Fuel mix (the types and the mix of fuel used in each transport mode) and • Energy intensity (including the fuel efficiency of the different modes).
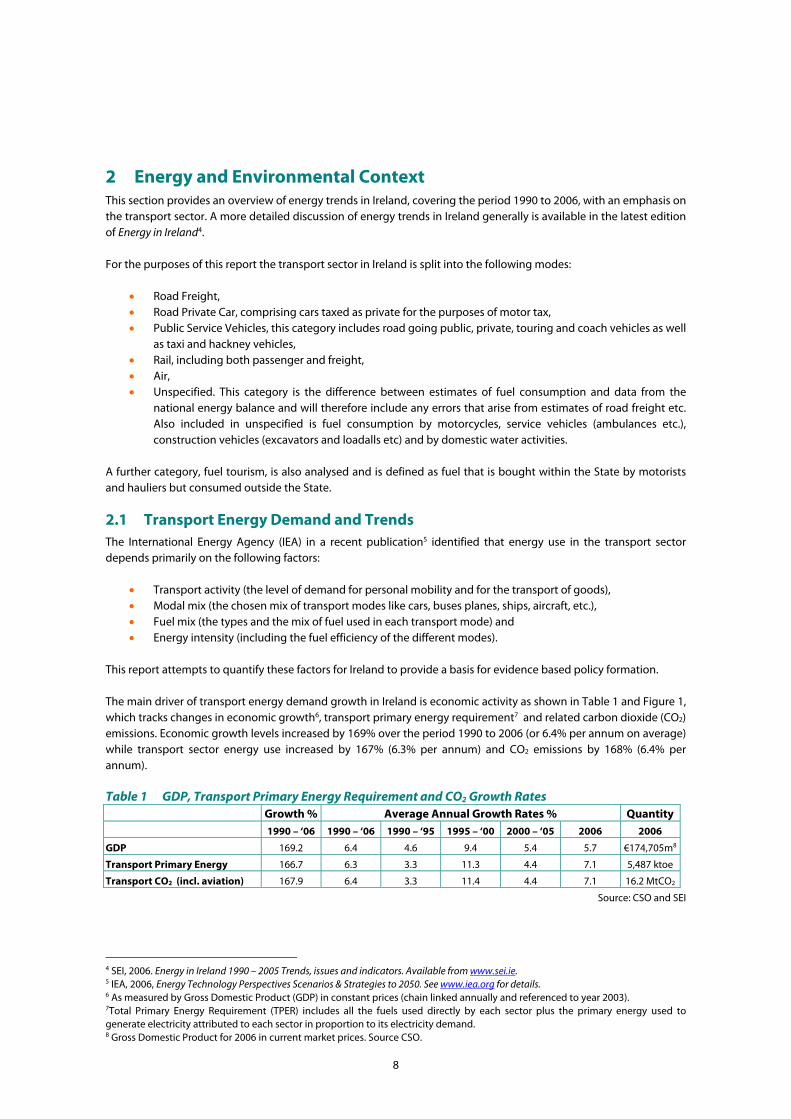
This report attempts to quantify these factors for Ireland to provide a basis for evidence based policy formation. The main driver of transport energy demand growth in Ireland is economic activity as shown in Table 1 and Figure 1, which tracks changes in economic growth6, transport primary energy requirement7 and related carbon dioxide (CO2) emissions. Economic growth levels increased by 169% over the period 1990 to 2006 (or 6.4% per annum on average) while transport sector energy use increased by 167% (6.3% per annum) and CO2 emissions by 168% (6.4% per annum). Table 1 GDP, Transport Primary Energy Requirement and CO2 Growth Rates
Growth % Average Annual Growth Rates % Quantity 1990 – ‘06 1990 – ‘06 1990 – ‘95 1995 – ‘00 2000 – ‘05 2006 2006
GDP 169.2 6.4 4.6 9.4 5.4 5.7 €174,705m8
Transport Primary Energy 166.7 6.3 3.3 11.3 4.4 7.1 5,487 ktoe
Transport CO2 (incl. aviation) 167.9 6.4 3.3 11.4 4.4 7.1 16.2 MtCO2
Source: CSO and SEI
4 SEI, 2006. Energy in Ireland 1990 – 2005 Trends, issues and indicators. Available from www.sei.ie. 5 IEA, 2006, Energy Technology Perspectives Scenarios & Strategies to 2050. See www.iea.org for details. 6 As measured by Gross Domestic Product (GDP) in constant prices (chain linked annually and referenced to year 2003). 7Total Primary Energy Requirement (TPER) includes all the fuels used directly by each sector plus the primary energy used to generate electricity attributed to each sector in proportion to its electricity demand. 8 Gross Domestic Product for 2006 in current market prices. Source CSO.
8
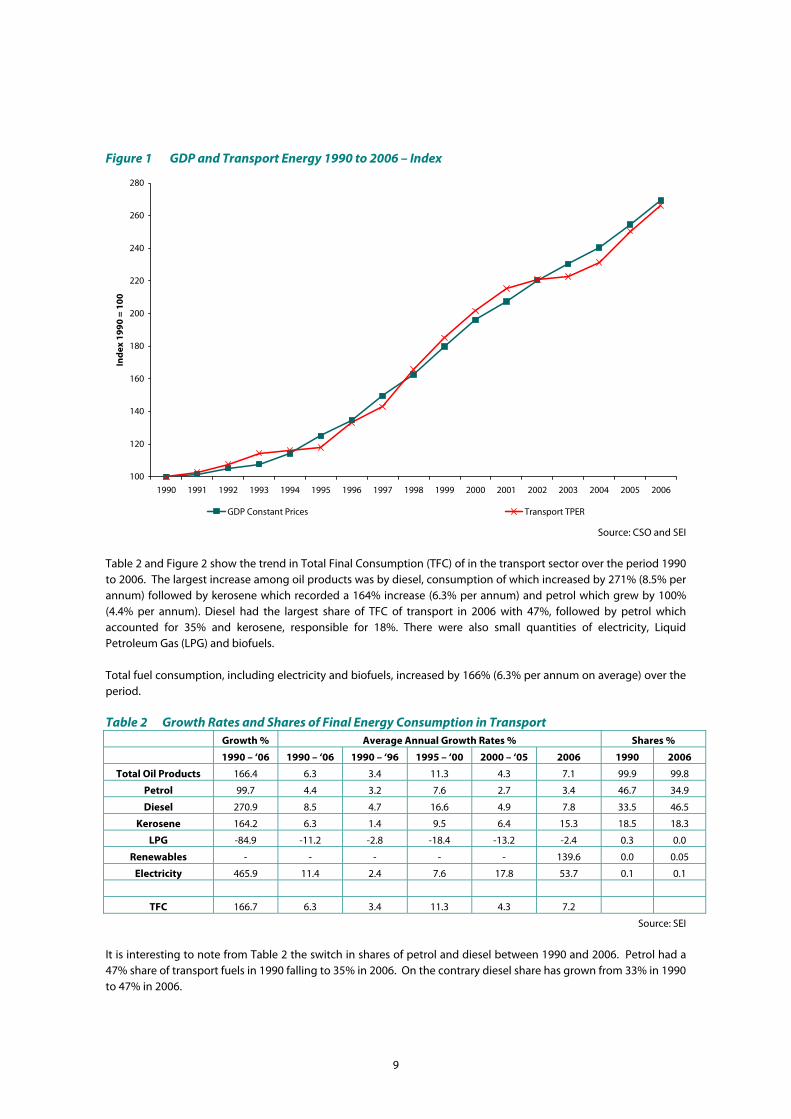
Figure 1 GDP and Transport Energy 1990 to 2006 – Index
100
120
140
160
180
200
220
240
260
280
1990 1991 1992 1993 1994 1995 1996 1997 1998 1999 2000 2001 2002 2003 2004 2005 2006
Ind
ex 1
990
= 1
00
GDP Constant Prices Transport TPER
Source: CSO and SEI
Table 2 and Figure 2 show the trend in Total Final Consumption (TFC) of in the transport sector over the period 1990 to 2006. The largest increase among oil products was by diesel, consumption of which increased by 271% (8.5% per annum) followed by kerosene which recorded a 164% increase (6.3% per annum) and petrol which grew by 100% (4.4% per annum). Diesel had the largest share of TFC of transport in 2006 with 47%, followed by petrol which accounted for 35% and kerosene, responsible for 18%. There were also small quantities of electricity, Liquid Petroleum Gas (LPG) and biofuels. Total fuel consumption, including electricity and biofuels, increased by 166% (6.3% per annum on average) over the period. Table 2 Growth Rates and Shares of Final Energy Consumption in Transport
Growth % Average Annual Growth Rates % Shares %
1990 – ‘06 1990 – ‘06 1990 – ‘96 1995 – ‘00 2000 – ‘05 2006 1990 2006
Total Oil Products 166.4 6.3 3.4 11.3 4.3 7.1 99.9 99.8
Petrol 99.7 4.4 3.2 7.6 2.7 3.4 46.7 34.9
Diesel 270.9 8.5 4.7 16.6 4.9 7.8 33.5 46.5
Kerosene 164.2 6.3 1.4 9.5 6.4 15.3 18.5 18.3
LPG -84.9 -11.2 -2.8 -18.4 -13.2 -2.4 0.3 0.0
Renewables - - - - - 139.6 0.0 0.05
Electricity 465.9 11.4 2.4 7.6 17.8 53.7 0.1 0.1
TFC 166.7 6.3 3.4 11.3 4.3 7.2
Source: SEI
It is interesting to note from Table 2 the switch in shares of petrol and diesel between 1990 and 2006. Petrol had a 47% share of transport fuels in 1990 falling to 35% in 2006. On the contrary diesel share has grown from 33% in 1990 to 47% in 2006.
9

Figure 2 Transport Sector Total Final Consumption of Oil 1990 to 2006
0
1
2
3
4
5
1990 1991 1992 1993 1994 1995 1996 1997 1998 1999 2000 2001 2002 2003 2004 2005 2006
Mto
e
Petrol LPG Diesel Electricity Kerosene Renewables
Source: SEI
As stated, over the period 1990 to 2006 TFC in the transport sector grew by 167%. To put this in context, the increases and shares of all sectors are shown in Table 3. It can be seen that transport was the fastest growing sector by far. Table 3 Growth Rates and Shares of TFC by Sector
Growth % Average Annual Growth Rates% Shares %
1990 – ‘06 1990 – ‘06 1990 – ‘96 1995 – ‘00 2000 – ‘05 2006 1990 2006
Industry 55.9 2.8 2.8 5.2 0.8 1.7 23.7 20.6
Transport 166.7 6.3 3.4 11.3 4.3 7.2 27.8 41.5
Residential 32.3 1.8 -0.4 2.6 3.2 1.2 31.1 23.0
Commercial /Public 60.9 3.0 1.6 4.6 4.5 -5.0 13.9 12.4
Agriculture 27.6 1.5 6.2 -1.4 1.2 -4.3 3.5 2.5
Total 79.1 3.7 2.0 6.2 3.2 2.7
Source: SEI
2.2 Fuel Tourism As well as the factors identified by the IEA, fuel tourism is an added factor affecting transport energy use in Ireland. Fuel tourism is defined as fuel that is bought within the State by private motorists and hauliers but consumed outside the State. Fuel price differences between States act as an incentive for fuel tourism for both freight hauliers and for private motorists. Assessments of transport energy demand within Ireland should normally seek to exclude fuel tourism in order to correctly link trends with underlying factors. This is complicated by the fact that reporting guidelines relating to emission reduction targets require that emissions be reported on the basis of domestic sales rather than domestic consumption. In this report fuel consumption and emissions refer to the amount sold as opposed to used in the Republic of Ireland (ROI).
10

The Department of the Environment, Heritage and Local Government estimates that, in 2004, 10% of petrol and 25% of diesel sold in Ireland was consumed outside the State9. The key determinant of fuel tourism is the relative price of fuel between countries. Table 4 presents “at the pump” Irish and UK unleaded petrol prices for the period 1990 to 2006. The differential between the two is also shown in Table 4 and Figure 3. The trend was negative in 1997 for the first time during the period when the price of petrol became more expensive in the UK than in ROI. Referring to Figure 2, the highest year on year increase (10.2% compared to the average annual growth rate of 4.5%) in consumption of petrol occurred in 1998 which is partially accounted for by fuel tourism. The differential increased further by 4 cents in 2007 to 27 cents. Table 4 Petrol Prices for ROI and the UK 1990 to 2006 Unleaded Petrol (€) 1990 1995 2000 2001 2002 2003 2004 2005 2006 2007
Ireland 0.76 0.70 0.87 0.91 0.85 0.86 0.93 1.00 1.12 1.10
UK 0.56 0.67 1.29 1.25 1.14 1.10 1.15 1.21 1.35 1.37
Difference 0.20 0.03 -0.42 -0.33 -0.29 -0.24 -0.22 -0.21 -0.23 -0.27
Source: Eurostat
Figure 3 Difference in Petrol Prices for the ROI and the UK 1990 to 2006
-50
-40
-30
-20
-10
0
10
20
30
1990 1991 1992 1993 1994 1995 1996 1997 1998 1999 2000 2001 2002 2003 2004 2005 2006
Cen
ts
Source: Eurostat
Table 5 shows diesel prices for same period with the differential also being shown in Figure 4. In this case diesel prices were generally more expensive in the UK from 1997 onwards. Again, the highest year on year increase (19.4% compared to the average annual growth rate of 8.7%) in consumption of diesel occurred in 1996. The differential for diesel increased by 4 cents in 2007 to 34 cents.
9DEHLG, 2006. Ireland’s Pathway to Kyoto Compliance Review of the National Climate Change Strategy. Available from http://www.environ.ie.
11
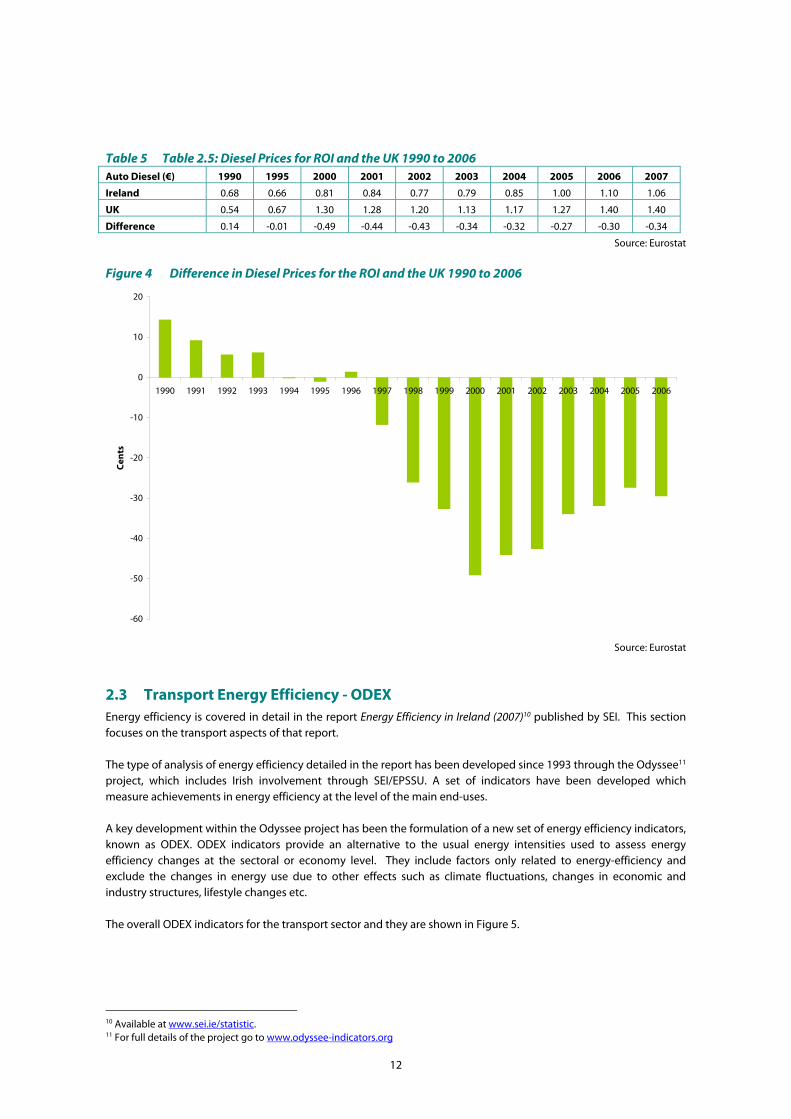
Table 5 Table 2.5: Diesel Prices for ROI and the UK 1990 to 2006 Auto Diesel (€) 1990 1995 2000 2001 2002 2003 2004 2005 2006 2007
Ireland 0.68 0.66 0.81 0.84 0.77 0.79 0.85 1.00 1.10 1.06
UK 0.54 0.67 1.30 1.28 1.20 1.13 1.17 1.27 1.40 1.40
Difference 0.14 -0.01 -0.49 -0.44 -0.43 -0.34 -0.32 -0.27 -0.30 -0.34
Source: Eurostat
Figure 4 Difference in Diesel Prices for the ROI and the UK 1990 to 2006
-60
-50
-40
-30
-20
-10
0
10
20
1990 1991 1992 1993 1994 1995 1996 1997 1998 1999 2000 2001 2002 2003 2004 2005 2006
Cen
ts
Source: Eurostat
2.3 Transport Energy Efficiency - ODEX Energy efficiency is covered in detail in the report Energy Efficiency in Ireland (2007)10 published by SEI. This section focuses on the transport aspects of that report. The type of analysis of energy efficiency detailed in the report has been developed since 1993 through the Odyssee11 project, which includes Irish involvement through SEI/EPSSU. A set of indicators have been developed which measure achievements in energy efficiency at the level of the main end-uses. A key development within the Odyssee project has been the formulation of a new set of energy efficiency indicators, known as ODEX. ODEX indicators provide an alternative to the usual energy intensities used to assess energy efficiency changes at the sectoral or economy level. They include factors only related to energy-efficiency and exclude the changes in energy use due to other effects such as climate fluctuations, changes in economic and industry structures, lifestyle changes etc. The overall ODEX indicators for the transport sector and they are shown in Figure 5.
10 Available at www.sei.ie/statistic. 11 For full details of the project go to www.odyssee-indicators.org
12
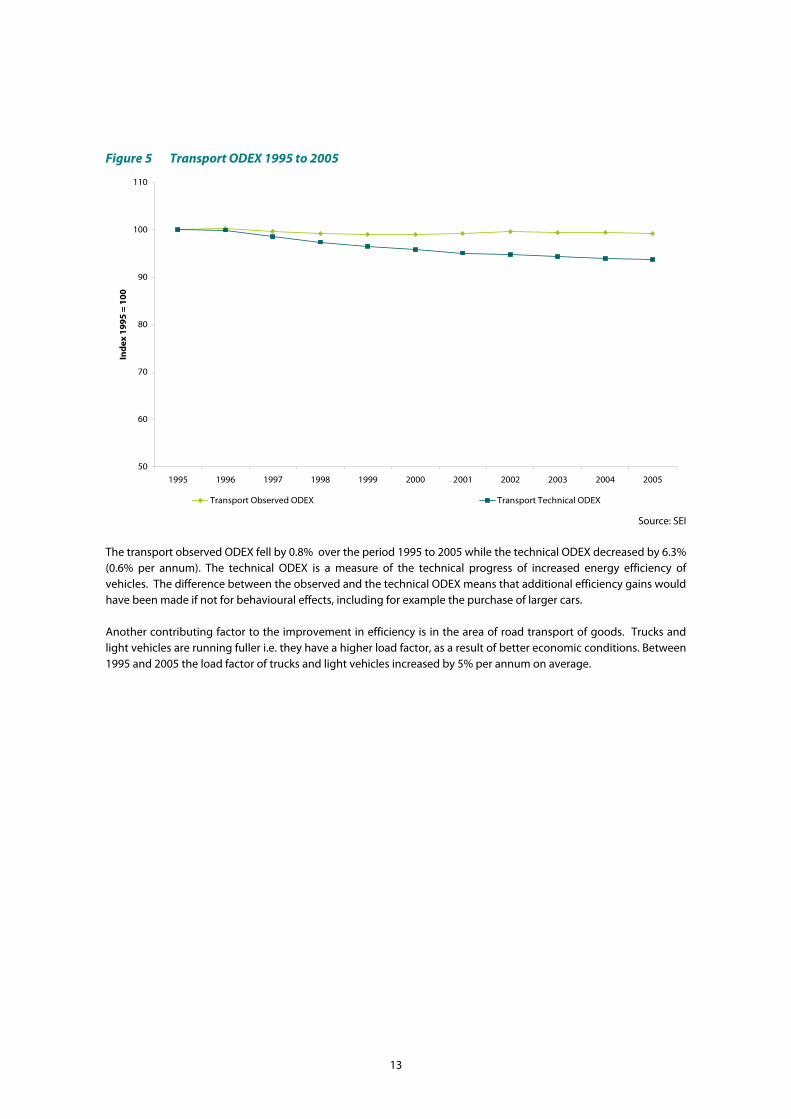
Figure 5 Transport ODEX 1995 to 2005
50
60
70
80
90
100
110
1995 1996 1997 1998 1999 2000 2001 2002 2003 2004 2005
Ind
ex 1
995
= 1
00
Transport Observed ODEX Transport Technical ODEX
Source: SEI
The transport observed ODEX fell by 0.8% over the period 1995 to 2005 while the technical ODEX decreased by 6.3% (0.6% per annum). The technical ODEX is a measure of the technical progress of increased energy efficiency of vehicles. The difference between the observed and the technical ODEX means that additional efficiency gains would have been made if not for behavioural effects, including for example the purchase of larger cars. Another contributing factor to the improvement in efficiency is in the area of road transport of goods. Trucks and light vehicles are running fuller i.e. they have a higher load factor, as a result of better economic conditions. Between 1995 and 2005 the load factor of trucks and light vehicles increased by 5% per annum on average.
13
3 Energy and the Transport Sector – The Policy Context The increased scientific evidence of the contribution of energy use to climate change and air quality coupled with the growth in energy demand and related emissions have prompted governments and policy makers to respond by introducing policies and measures designed to manage energy more effectively and to move towards less polluting sources of energy. This section briefly identifies the major policy developments which have occurred since the publication of Energy in Transport 2006 Report.
3.1 National Development Plan The reference document for policy implementation in Ireland is the National Development Plan12 (NDP). The NDP, published in January 2007, details Government spending for the period 2007 to 2013. Investment in transport infrastructure over the Plan period will total nearly €33 billion of which:
• €13.3 billion will be invested in upgrading and building new national roads;
• €4.3 billion will be invested in non-national roads, funded by the Exchequer and the Local Government Fund;
• €12.9 billion will be invested in public transport, particularly in the Greater Dublin Area, this investment is a
quadrupling of that allocated in the previous Plan;
• €90 million will be invested in the Rural Transport Initiative;
• €1.8 billion will be invested in improving air transport facilities at the country’s three national airports; and €96 million for investment in the six regional airports and City of Derry Airport; and
• €480 million will be invested in upgrading strategic ports facilities and regional harbours.
This investment had already been largely announced as the Transport 21 programme. In addition the sustainable energy sub-programme and the energy research sub-programme both include the transport sector.
3.2 Energy White Paper – Delivering a Sustainable Energy Future for Ireland On the 12th March 2007, An Taoiseach Bertie Ahern TD and Noel Dempsey TD, Minister13 for Communications, Marine and Natural Resources launched the Government's Energy White Paper14. The White Paper sets out the energy policy directions and targets for Ireland to 2020. The White Paper set a target to achieve 20% savings in energy across the electricity, transport and heating sectors by 2020, in line with EU target and also set an indicative target of 30% for 2020 to surpass the EU ambition. The White paper lists a number of programmes and measures, which will assist in achieving these targets including the following:
• CIE have been instructed by the Minister for Transport to move its existing fleet to a 5% biodiesel blend with the view to achieving a higher blend of 30% in all new buses in as short a time frame as possible and have also been requested to assess the feasibility of using hybrid electric buses as part of future fleet replacement.
12 See www.ndp.ie for the full text of the NDP. 13 Eamon Ryan TD was appointed Minister for Communications, Energy & Natural Resources on the 14th June 2007. 14 The full text of the White Paper is available at http://www.dcmnr.gov.ie/Energy/Energy+Planning+Division/Energy+White+Paper.htm.
14
• A Sustainable Transport Action Plan will be published in late 2007 with the overall aim of achieving a sustainable transport system by 2020. This Action Plan will set out how Government will deliver this objective in terms of firm policies, actions and targets.
The following issues will be addressed in the Action Plan:
• Better integration of transport infrastructure and land use planning;
• Fiscal measures to reduce transport demand, including road pricing or congestion charges once sufficient infrastructure has been provided and public transport alternatives are in place;
• Support measures that aim to achieve greater energy efficiency from the transport sector and influence
behavioural change, including car sharing schemes and workplace travel plans;
• Public awareness campaigns on issues such as eco-driving, which aims to achieve up to a 20% improvement in fuel efficiency among private transport users;
• Support for EU-level agreements with motor manufacturers’ associations to reduce CO2 emissions of new
passenger cars to an average level of 130 g/km by 2012;
• A mandatory comparative labelling system for new cars based on CO2 emission levels and continued support for the mandatory provision of consumer information on fuel economy and CO2 emissions in order to influence behavioural change and
• Changes to both vehicle registration tax (VRT) and motor tax, which should provide further incentives for
choosing fuel-efficient cars with lower CO2 emissions. The extension beyond December 2007 of the preferential VRT treatment currently available to series production hybrid electric, flexi fuel and electric vehicles will be considered.
With regard to biofuels the Government will provide support for
• a national biofuels obligation on fuel suppliers of 5% by 2009, which will provide market certainty and encourage projects of scale;
• 10% of Ireland’s transport energy requirements to come from renewable sources by 2020;
• the use of 100% pure plant oil (PPO) in captive fleets maintained by local authorities and public bodies, and
Support for measures to include the aviation and maritime sectors in the EU Emissions Trading Scheme (ETS), as part of a multilateral commitment by Member States.
Finally the Government will ensure that the public sector leads the way as exemplar through the deployment of bio-energy heating, the use of renewable electricity and CHP in public buildings as well as the use of biofuels in the public transport fleets.
3.3 National Climate Change Strategy 2007 to 2012 The National Climate Change Strategy (NCCS) 2007 - 2012, published on the 2nd April 200715 follows on from the first national strategy, published in 2000. The Strategy details the measures by which Ireland will meet its Kyoto 2008 - 2012 commitment. It also outlines how the measures will position Ireland for the post 2012 period. The Strategy identifies the areas in which further measures are being researched and developed to enable Ireland to meet the 2020 commitments. The existing measures associated with the transport sector are presented in Table 6 :
15 Available from http://www.environ.ie/en/PublicationsDocuments/FileDownLoad,1861,en.pdf.
15
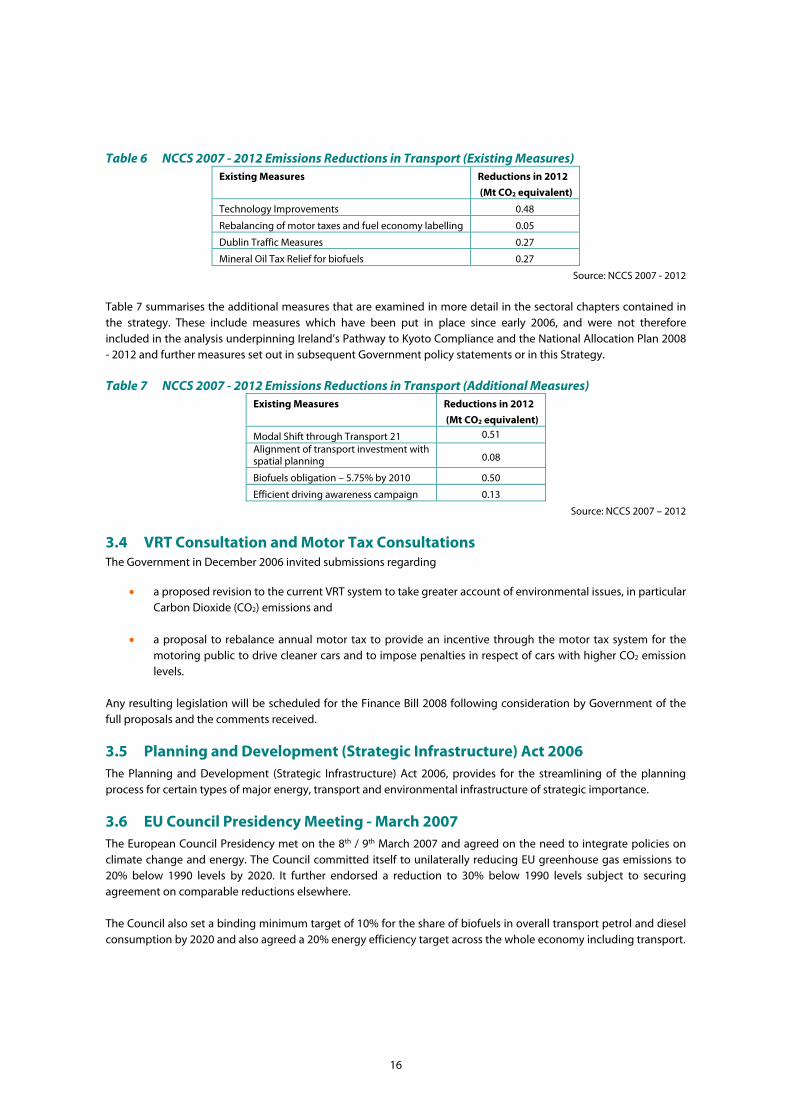
Table 6 NCCS 2007 - 2012 Emissions Reductions in Transport (Existing Measures) Existing Measures Reductions in 2012
(Mt CO2 equivalent)
Technology Improvements 0.48
Rebalancing of motor taxes and fuel economy labelling 0.05
Dublin Traffic Measures 0.27
Mineral Oil Tax Relief for biofuels 0.27
Source: NCCS 2007 - 2012
Table 7 summarises the additional measures that are examined in more detail in the sectoral chapters contained in the strategy. These include measures which have been put in place since early 2006, and were not therefore included in the analysis underpinning Ireland’s Pathway to Kyoto Compliance and the National Allocation Plan 2008 - 2012 and further measures set out in subsequent Government policy statements or in this Strategy. Table 7 NCCS 2007 - 2012 Emissions Reductions in Transport (Additional Measures)
Existing Measures Reductions in 2012
(Mt CO2 equivalent)
Modal Shift through Transport 21 0.51 Alignment of transport investment with spatial planning 0.08
Biofuels obligation – 5.75% by 2010 0.50
Efficient driving awareness campaign 0.13
Source: NCCS 2007 – 2012
3.4 VRT Consultation and Motor Tax Consultations The Government in December 2006 invited submissions regarding
• a proposed revision to the current VRT system to take greater account of environmental issues, in particular Carbon Dioxide (CO2) emissions and
• a proposal to rebalance annual motor tax to provide an incentive through the motor tax system for the
motoring public to drive cleaner cars and to impose penalties in respect of cars with higher CO2 emission levels.
Any resulting legislation will be scheduled for the Finance Bill 2008 following consideration by Government of the full proposals and the comments received.
3.5 Planning and Development (Strategic Infrastructure) Act 2006 The Planning and Development (Strategic Infrastructure) Act 2006, provides for the streamlining of the planning process for certain types of major energy, transport and environmental infrastructure of strategic importance.
3.6 EU Council Presidency Meeting - March 2007 The European Council Presidency met on the 8th / 9th March 2007 and agreed on the need to integrate policies on climate change and energy. The Council committed itself to unilaterally reducing EU greenhouse gas emissions to 20% below 1990 levels by 2020. It further endorsed a reduction to 30% below 1990 levels subject to securing agreement on comparable reductions elsewhere. The Council also set a binding minimum target of 10% for the share of biofuels in overall transport petrol and diesel consumption by 2020 and also agreed a 20% energy efficiency target across the whole economy including transport.
16

4 Profiling the Transport Sector Figure 6 profiles the number of road vehicles by vehicle type in Ireland between 1990 and 2006. Over the period the total increased by 118% (5% per annum on average) to reach 2,138,680 vehicles in 2006. The majority of vehicles were private cars, accounting for 77% in 2006 with 14% of the total being goods vehicles. The contribution that road transport makes to the sector as a whole in Ireland in analysed in section 6. Figure 6 Road Vehicle Fleet 1990 to 2006
0.0
0.5
1.0
1.5
2.0
2.5
1990 1991 1992 1993 1994 1995 1996 1997 1998 1999 2000 2001 2002 2003 2004 2005 2006
Nu
mb
er o
f Veh
icle
s (m
illio
ns)
Private Cars Motor Cycles Goods Vehicles Public Service Vehicles Others
Source: Department of Environment, Heritage and Local Government (DEHLG)
Table 8 Growth Rates and Shares of Road Vehicle Fleet 1990 to 2006
Growth % Average Annual Growth Rates% Shares %
1990 – ‘06 1990 – ‘06 1990 – ‘96 1995 – ‘00 2000 – ‘05 2006 1990 2006
Private Cars 123.4 5.2 4.5 5.9 4.7 7.0 75.5 77.5
Motorcycle 53.6 2.7 0.6 5.5 2.3 1.8 2.2 1.5
Goods Vehicles 122.7 5.1 -0.2 7.7 6.9 11.2 13.6 13.9
Public Service Vehicles 246.6 8.1 8.2 9.0 7.5 6.0 0.9 1.4
Others 60.1 3.0 2.4 2.6 3.5 5.2 7.9 5.8
Total 117.8 5.0 3.7 5.9 4.9 7.4
Source: DEHLG
4.1 Road Freight Using the methodology first used in the 2006 Energy in Transport report, which is detailed in Annex 1, it is possible to estimate the amount of energy used by road freight in Ireland. Figure 7 presents the results of the analysis and compares fuel usage with GDP16 over the period 1990 to 2006. It can be seen that fuel consumption by road freight increased by 255% (8% per annum) over the period while GDP grew by 169% (6.4% per annum). Fuel consumption in freight transport decreased by 2.6% in 2006. The relationship between GDP and road freight fuel consumption is examined further below.
16 Gross Domestic Product (GDP) in constant prices and chain linked to 2003. Note that 2005 data are provisional.
17
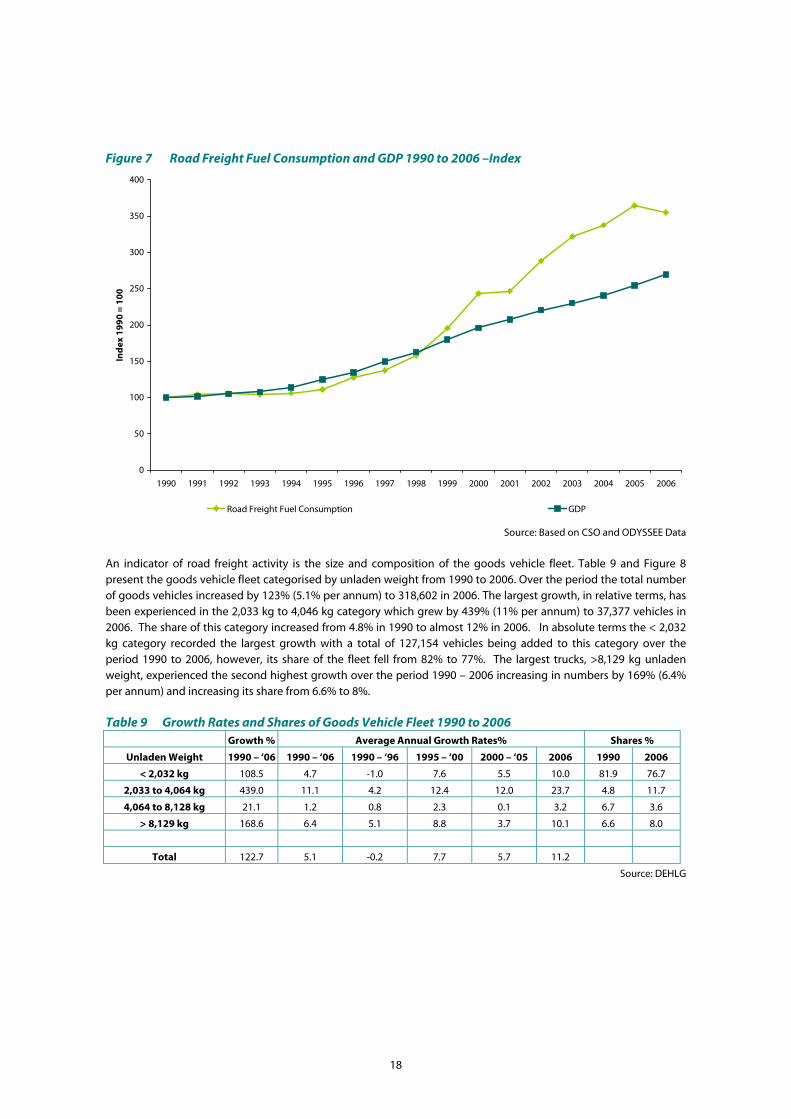
Figure 7 Road Freight Fuel Consumption and GDP 1990 to 2006 –Index
0
50
100
150
200
250
300
350
400
1990 1991 1992 1993 1994 1995 1996 1997 1998 1999 2000 2001 2002 2003 2004 2005 2006
Ind
ex 1
990
= 1
00
Road Freight Fuel Consumption GDP
Source: Based on CSO and ODYSSEE Data
An indicator of road freight activity is the size and composition of the goods vehicle fleet. Table 9 and Figure 8 present the goods vehicle fleet categorised by unladen weight from 1990 to 2006. Over the period the total number of goods vehicles increased by 123% (5.1% per annum) to 318,602 in 2006. The largest growth, in relative terms, has been experienced in the 2,033 kg to 4,046 kg category which grew by 439% (11% per annum) to 37,377 vehicles in 2006. The share of this category increased from 4.8% in 1990 to almost 12% in 2006. In absolute terms the < 2,032 kg category recorded the largest growth with a total of 127,154 vehicles being added to this category over the period 1990 to 2006, however, its share of the fleet fell from 82% to 77%. The largest trucks, >8,129 kg unladen weight, experienced the second highest growth over the period 1990 – 2006 increasing in numbers by 169% (6.4% per annum) and increasing its share from 6.6% to 8%. Table 9 Growth Rates and Shares of Goods Vehicle Fleet 1990 to 2006
Growth % Average Annual Growth Rates% Shares %
Unladen Weight 1990 – ‘06 1990 – ‘06 1990 – ‘96 1995 – ‘00 2000 – ‘05 2006 1990 2006
< 2,032 kg 108.5 4.7 -1.0 7.6 5.5 10.0 81.9 76.7
2,033 to 4,064 kg 439.0 11.1 4.2 12.4 12.0 23.7 4.8 11.7
4,064 to 8,128 kg 21.1 1.2 0.8 2.3 0.1 3.2 6.7 3.6
> 8,129 kg 168.6 6.4 5.1 8.8 3.7 10.1 6.6 8.0
Total 122.7 5.1 -0.2 7.7 5.7 11.2
Source: DEHLG
18
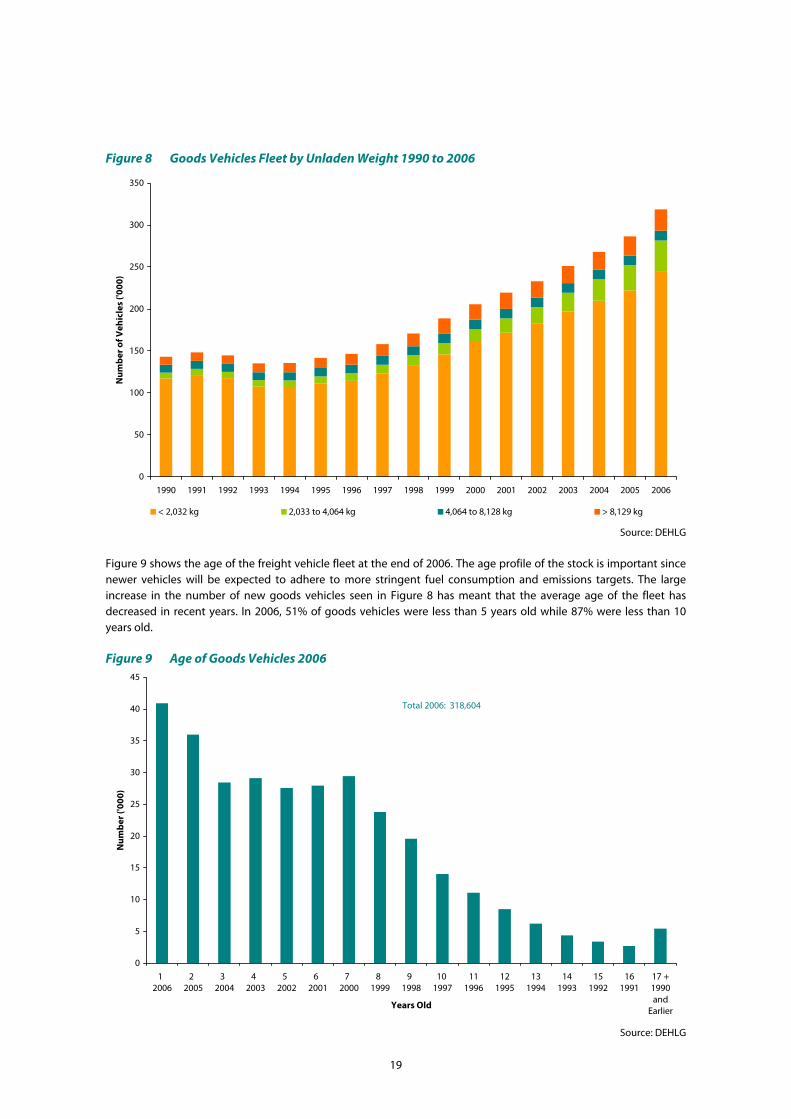
Figure 8 Goods Vehicles Fleet by Unladen Weight 1990 to 2006
0
50
100
150
200
250
300
350
1990 1991 1992 1993 1994 1995 1996 1997 1998 1999 2000 2001 2002 2003 2004 2005 2006
Nu
mb
er o
f Veh
icle
s ('0
00)
< 2,032 kg 2,033 to 4,064 kg 4,064 to 8,128 kg > 8,129 kg
Source: DEHLG
Figure 9 shows the age of the freight vehicle fleet at the end of 2006. The age profile of the stock is important since newer vehicles will be expected to adhere to more stringent fuel consumption and emissions targets. The large increase in the number of new goods vehicles seen in Figure 8 has meant that the average age of the fleet has decreased in recent years. In 2006, 51% of goods vehicles were less than 5 years old while 87% were less than 10 years old. Figure 9 Age of Goods Vehicles 2006
0
5
10
15
20
25
30
35
40
45
1 2006
2 2005
3 2004
4 2003
5 2002
6 2001
7 2000
8 1999
9 1998
10 1997
111996
121995
131994
141993
151992
161991
17 +1990and
EarlierYears Old
Nu
mb
er ('
000)
Total 2006: 318,604
Source: DEHLG
19

It is possible to calculate an approximate average age of the goods vehicles fleet. Each year the DEHLG publishes the stock of private cars and goods vehicles by the year that they were first licensed. For each year the average age is calculated by assigning a value of 1,2,3 etc to each preceding year and then multiplying the number of vehicles that were first licensed by the “value” to get the total number of years of the stock. This is then divided by the total number of vehicles in that year. For each year there is also a 19XX and earlier category, in this case all goods vehicles are assigned the same value. While not ideal it should not alter the results significantly as the number in this category is quite small, accounting for 1.7% of goods vehicles in 2005. Using this methodology at the end of 2006 the average age of a goods vehicle in Ireland was 5.92 years, a slight reduction from 5.97 recorded in 2005. Figure 10 graphs the trend in the average age of goods vehicles over the period 1990 to 2006. The average age peaked in 1995 at 6.35 years and was at its lowest point recently during the period in 2000/’01 when the average age was 5.68 years. Figure 10 Average Age of Goods Vehicles 1990 to 2006
5.655.925.87
5.765.685.685.876.13
6.286.336.356.215.91
5.905.66
5.975.99
0.0
1.0
2.0
3.0
4.0
5.0
6.0
7.0
1990 1991 1992 1993 1994 1995 1996 1997 1998 1999 2000 2001 2002 2003 2004 2005 2006
Ave
rag
e A
ge
(Yea
rs)
Source: DEHLG
Three metrics which measure activity in the road freight sector are tonne kilometres, vehicle kilometres and tonnes carried. Tonne kilometres are defined by the Central Statistics Office (CSO)17 as the weight of goods carried multiplied by the distance they were carried. Figure 11 presents data from the CSO’s Road Freight Survey for the period 1991 to 2006 as an index and it can be seen that tonne kilometres, vehicle kilometres and tonnes carried have increased significantly since the data set began in 1991. Tonne kilometres increased by 253% (9.4% per annum on average) over the period 1991 to 2005, vehicle kilometres increased by 216% (8.6% per annum) and total tonnes carried increased by 279% (10% per annum). In 2006 tonnes carried continued to increase (3% increase on 2005) while both tonne kilometres and vehicle kilometres decreased by 2.6% and 1.7% respectively. Also included in Figure 11 are data for GDP18 which increased by 169% (6.4% per annum) over the period.
17 CSO, Various Years. Road Freight Surveys. Available from CSO, Skehard Road, Cork or www.cso.ie. 18 Constant prices chain linked to 2003.
20
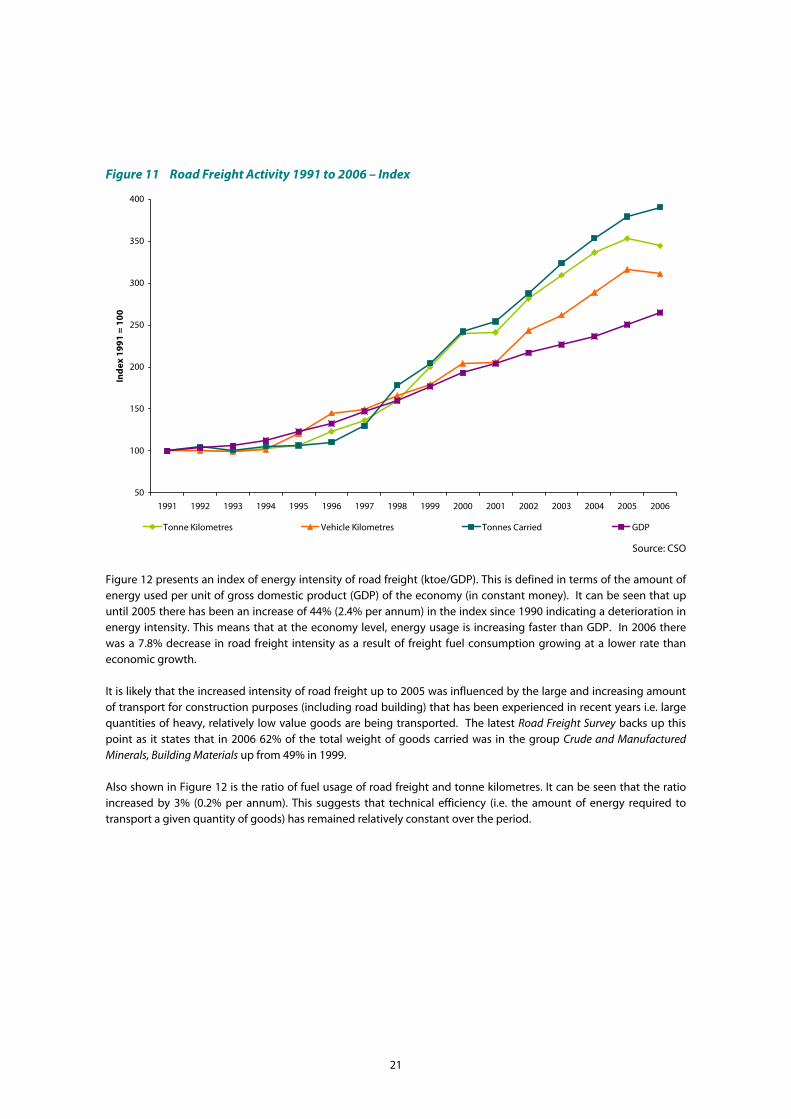
Figure 11 Road Freight Activity 1991 to 2006 – Index
50
100
150
200
250
300
350
400
1991 1992 1993 1994 1995 1996 1997 1998 1999 2000 2001 2002 2003 2004 2005 2006
Ind
ex 1
991
= 1
00
Tonne Kilometres Vehicle Kilometres Tonnes Carried GDP
Source: CSO
Figure 12 presents an index of energy intensity of road freight (ktoe/GDP). This is defined in terms of the amount of energy used per unit of gross domestic product (GDP) of the economy (in constant money). It can be seen that up until 2005 there has been an increase of 44% (2.4% per annum) in the index since 1990 indicating a deterioration in energy intensity. This means that at the economy level, energy usage is increasing faster than GDP. In 2006 there was a 7.8% decrease in road freight intensity as a result of freight fuel consumption growing at a lower rate than economic growth. It is likely that the increased intensity of road freight up to 2005 was influenced by the large and increasing amount of transport for construction purposes (including road building) that has been experienced in recent years i.e. large quantities of heavy, relatively low value goods are being transported. The latest Road Freight Survey backs up this point as it states that in 2006 62% of the total weight of goods carried was in the group Crude and Manufactured Minerals, Building Materials up from 49% in 1999. Also shown in Figure 12 is the ratio of fuel usage of road freight and tonne kilometres. It can be seen that the ratio increased by 3% (0.2% per annum). This suggests that technical efficiency (i.e. the amount of energy required to transport a given quantity of goods) has remained relatively constant over the period.
21

Figure 12 Road Freight Energy Intensity 1990 to 2005
0
20
40
60
80
100
120
140
160
1990 1991 1992 1993 1994 1995 1996 1997 1998 1999 2000 2001 2002 2003 2004 2005 2006
Ind
ex 1
990
= 1
00
Energy Intensity Road Freight ktoe/GDP Energy Intensity Road Freight ktoe/tkm Index
Source: Based on CSO Data
4.2 Private Car Economic growth has significantly increased the average individual’s prosperity and disposable income levels in Ireland. This in turn has contributed to a significant increase in private car sales and energy use. Figure 13 compares fuel consumption of private cars, personal consumption of goods and services19 and the stock of cars for the period 1990 to 2006. The methodology behind the fuel estimates is explained in Annex 1. A very close relationship between the three variables is observed. Over the period fuel consumption increased 122% (5.1% per annum on average), personal consumption of goods and services increased by 130% (5.3% per annum) and the stock of private cars grew by 123% (5.2% per annum).
19 Constant prices chain linked to 2004.
22

Figure 13 Private Car Fuel Consumption and Personal Consumption 1990 to 2005
0
50
100
150
200
250
1990 1991 1992 1993 1994 1995 1996 1997 1998 1999 2000 2001 2002 2003 2004 2005 2006
Ind
ex 1
990
= 1
00
Private Car Fuel Consumption Personal Consumption (Constant Prices) Stock of Private Cars
Source: CSO and SEI
4.2.1 Private Car Ownership and Purchasing Patterns
Table 10 and Figure 14 examine car density during the period 1990 to 2006 and two indicators are shown. The first relates to private car ownership per 1,000 population which increased by 4.4% in 2006 and resulted in an increase in car density to 420 cars per 1,000 population, compared to an EU-25 average of 476 and a UK average of 469 (both in 2005). The average for the USA in 2002 was 765 cars per 1,000 of population, believed to be the highest in the world20. The second indictor is private car ownership per 1,000 adults21 which increased by 4.1% in 2006 and resulted in an increase in car density to 528 cars per 1000 adults. Between 1990 and 2006 there was an increase of 69% (3.3% per annum). This is compared to an EU-15 average of 594 and a UK average of 555 (again, both in 2003). The average for the EU-25 was 558. There is now more than one car for every two adults in Ireland. Table 10 Growth Rates of Private Car Ownership 1990 to 2006 Growth % Average annual growth rates %
Car Ownership 1990 – ‘06 1990 – ‘06 1990 – ‘96 1995 – ‘00 2000 – ‘05 2006
Cars/1000 (population) 84.9 3.9 3.9 4.8 2.9 4.4
Cars/1000 (adults) 69.1 3.3 3.1 4.1 2.6 4.1
Source: Eurostat and DG Tren
The number of driving licenses per 1,000 adults, an indicator of potential growth in the number of cars per 1,000 adults and population, has also increased over the period, from 447 in 1990 to 725 in 2006. This is an increase of 62% over the period.
20United National Economic Commission for Europe, 2006. The Statistical Yearbook of the Economic Commission for Europe 2000. Available from www.unece.org. 21 In this case an adult is defined in Ireland as a person over 15, the closest category match in Census data to the legal car driving age of 17. Different definitions may exist in other EU countries but this should not overly alter the results of the comparison.
23

The figures show that private car ownership was just 12% below the European average in 2005, which suggests that there remains some potential for further growth in Ireland. Figure 14 Private Car Ownership 1990 to 2006
227237 242 249
262275
292310
323339
348360
370379
391402
420
312324 327 335
349364
382403
417436
445459
469479
495507
528
0
100
200
300
400
500
600
1990 1991 1992 1993 1994 1995 1996 1997 1998 1999 2000 2001 2002 2003 2004 2005 2006
Car
s P
er 1
,000
Cars per 1,000 (Population) Cars per 1,000 (Adult)
Private Cars Per 1,000 of Population: EU 25 Average (2005) = 476Germany (2005) = 559France (2005) = 500Belgium (2005) = 468Denmark (2005) = 362Netherlands (2005) = 434UK (2005) = 469Source: Eurostat & DG TREN
Private Cars Per 1,000 of Adults: EU 25 Average (2003) = 558EU 15 Average (2003) = 594UK (2003) = 555Source: Based on Eurostat Data
Source: Eurostat and DG Tren
Another metric that is used to examine car density is the number of cars per household. In Ireland the number of private cars per permanently occupied dwelling22 was 1.2 in 2006, representing a 54% increase on 1990. In 1998 the number of private cars exceeded the number of permanently occupied dwellings for the first time. In addition to the increases in private car ownership, there has been a purchasing trend towards larger cars (in terms of engine size), which generally has the effect of offsetting the energy efficiency gains achieved by the manufacturers. Figure 15 and Table 11 show how purchasing patterns with respect to engine size have changed over time.
22 A proxy for the number of households which is not available.
24
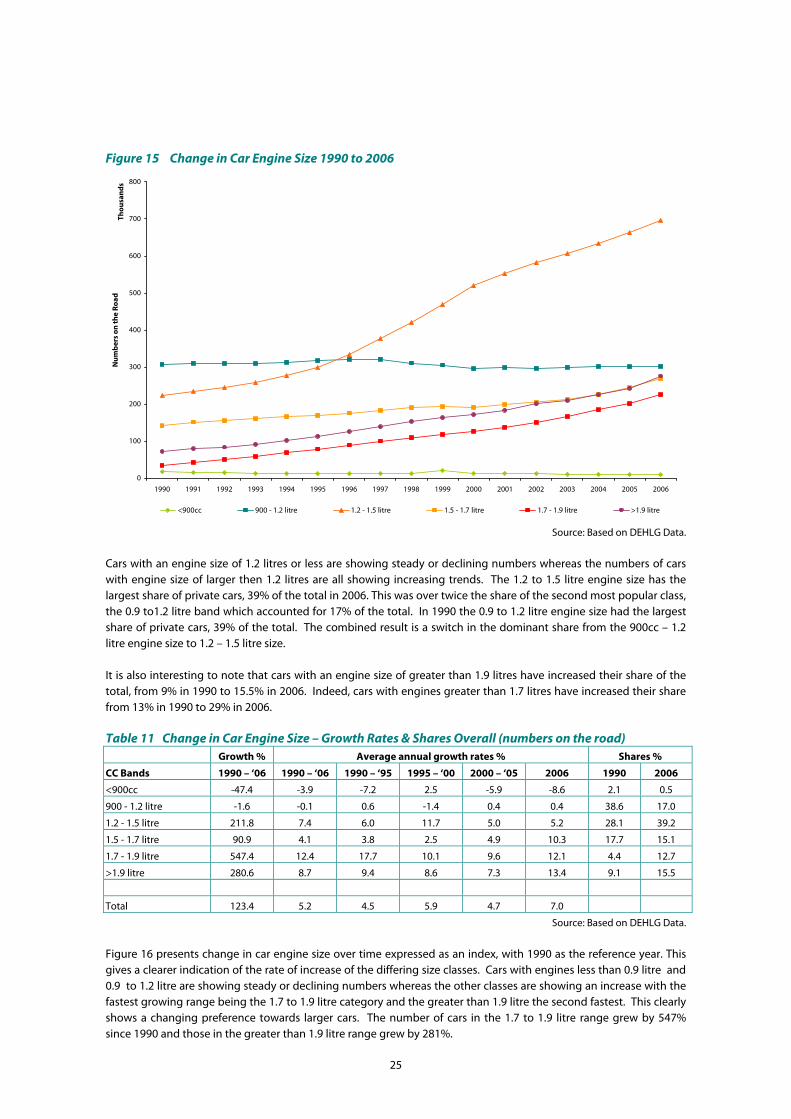
Figure 15 Change in Car Engine Size 1990 to 2006
0
100
200
300
400
500
600
700
800
1990 1991 1992 1993 1994 1995 1996 1997 1998 1999 2000 2001 2002 2003 2004 2005 2006
Tho
usa
nd
sN
um
ber
s o
n th
e R
oad
<900cc 900 - 1.2 litre 1.2 - 1.5 litre 1.5 - 1.7 litre 1.7 - 1.9 litre >1.9 litre
Source: Based on DEHLG Data.
Cars with an engine size of 1.2 litres or less are showing steady or declining numbers whereas the numbers of cars with engine size of larger then 1.2 litres are all showing increasing trends. The 1.2 to 1.5 litre engine size has the largest share of private cars, 39% of the total in 2006. This was over twice the share of the second most popular class, the 0.9 to1.2 litre band which accounted for 17% of the total. In 1990 the 0.9 to 1.2 litre engine size had the largest share of private cars, 39% of the total. The combined result is a switch in the dominant share from the 900cc – 1.2 litre engine size to 1.2 – 1.5 litre size. It is also interesting to note that cars with an engine size of greater than 1.9 litres have increased their share of the total, from 9% in 1990 to 15.5% in 2006. Indeed, cars with engines greater than 1.7 litres have increased their share from 13% in 1990 to 29% in 2006. Table 11 Change in Car Engine Size – Growth Rates & Shares Overall (numbers on the road) Growth % Average annual growth rates % Shares %
CC Bands 1990 – ‘06 1990 – ‘06 1990 – ‘95 1995 – ‘00 2000 – ‘05 2006 1990 2006
<900cc -47.4 -3.9 -7.2 2.5 -5.9 -8.6 2.1 0.5
900 - 1.2 litre -1.6 -0.1 0.6 -1.4 0.4 0.4 38.6 17.0
1.2 - 1.5 litre 211.8 7.4 6.0 11.7 5.0 5.2 28.1 39.2
1.5 - 1.7 litre 90.9 4.1 3.8 2.5 4.9 10.3 17.7 15.1
1.7 - 1.9 litre 547.4 12.4 17.7 10.1 9.6 12.1 4.4 12.7
>1.9 litre 280.6 8.7 9.4 8.6 7.3 13.4 9.1 15.5
Total 123.4 5.2 4.5 5.9 4.7 7.0
Source: Based on DEHLG Data.
Figure 16 presents change in car engine size over time expressed as an index, with 1990 as the reference year. This gives a clearer indication of the rate of increase of the differing size classes. Cars with engines less than 0.9 litre and 0.9 to 1.2 litre are showing steady or declining numbers whereas the other classes are showing an increase with the fastest growing range being the 1.7 to 1.9 litre category and the greater than 1.9 litre the second fastest. This clearly shows a changing preference towards larger cars. The number of cars in the 1.7 to 1.9 litre range grew by 547% since 1990 and those in the greater than 1.9 litre range grew by 281%.
25
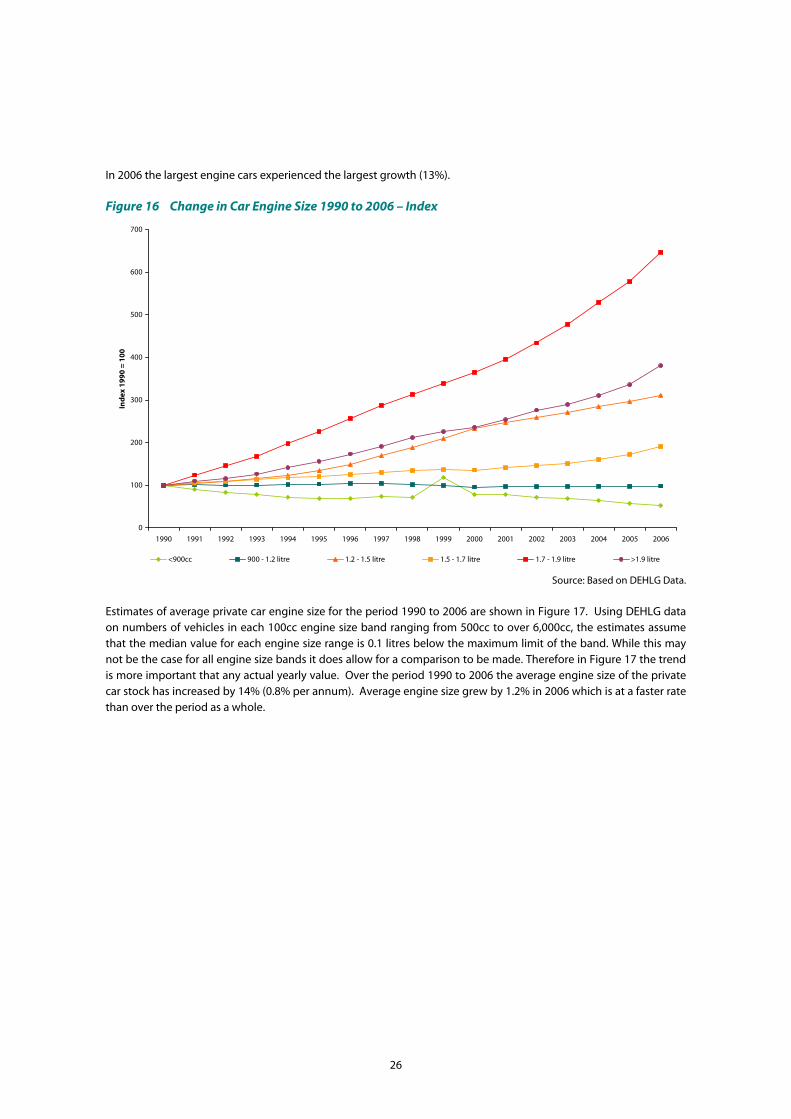
In 2006 the largest engine cars experienced the largest growth (13%). Figure 16 Change in Car Engine Size 1990 to 2006 – Index
0
100
200
300
400
500
600
700
1990 1991 1992 1993 1994 1995 1996 1997 1998 1999 2000 2001 2002 2003 2004 2005 2006
Ind
ex 1
990
= 1
00
<900cc 900 - 1.2 litre 1.2 - 1.5 litre 1.5 - 1.7 litre 1.7 - 1.9 litre >1.9 litre
Source: Based on DEHLG Data.
Estimates of average private car engine size for the period 1990 to 2006 are shown in Figure 17. Using DEHLG data on numbers of vehicles in each 100cc engine size band ranging from 500cc to over 6,000cc, the estimates assume that the median value for each engine size range is 0.1 litres below the maximum limit of the band. While this may not be the case for all engine size bands it does allow for a comparison to be made. Therefore in Figure 17 the trend is more important that any actual yearly value. Over the period 1990 to 2006 the average engine size of the private car stock has increased by 14% (0.8% per annum). Average engine size grew by 1.2% in 2006 which is at a faster rate than over the period as a whole.
26
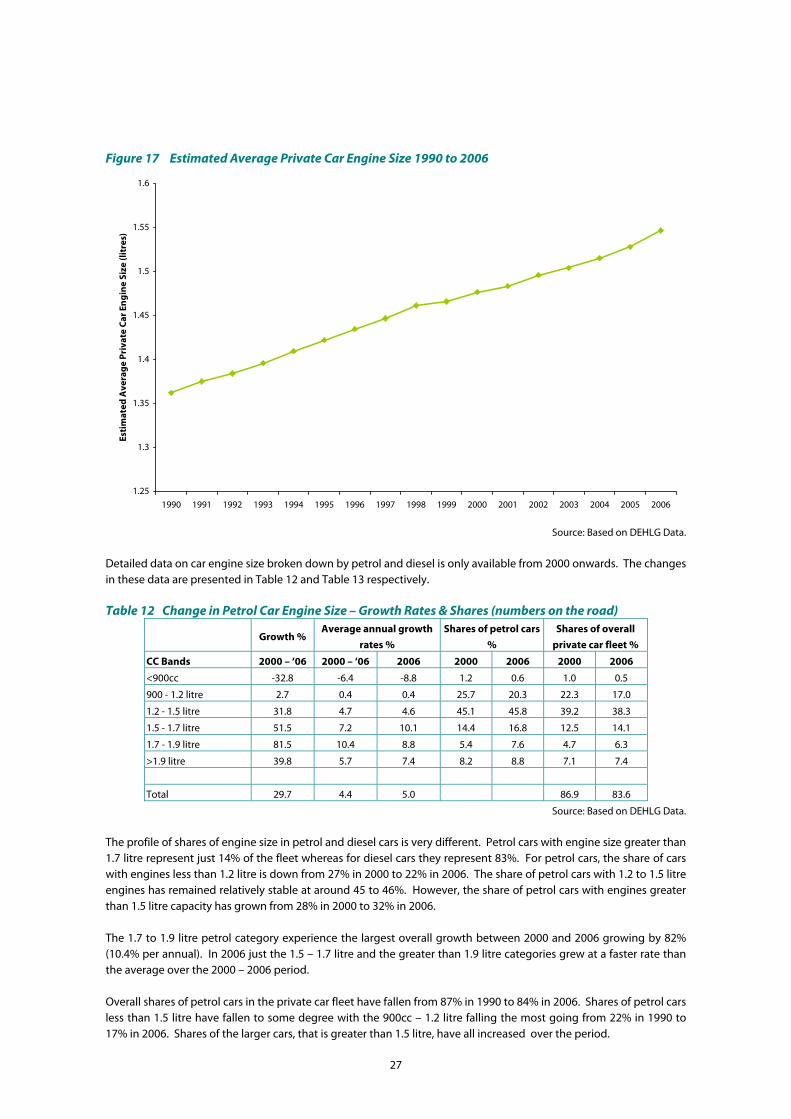
Figure 17 Estimated Average Private Car Engine Size 1990 to 2006
1.25
1.3
1.35
1.4
1.45
1.5
1.55
1.6
1990 1991 1992 1993 1994 1995 1996 1997 1998 1999 2000 2001 2002 2003 2004 2005 2006
Esti
mat
ed A
vera
ge
Pri
vate
Car
En
gin
e Si
ze (l
itre
s)
Source: Based on DEHLG Data.
Detailed data on car engine size broken down by petrol and diesel is only available from 2000 onwards. The changes in these data are presented in Table 12 and Table 13 respectively. Table 12 Change in Petrol Car Engine Size – Growth Rates & Shares (numbers on the road)
Growth % Average annual growth
rates %
Shares of petrol cars
%
Shares of overall
private car fleet %
CC Bands 2000 – ‘06 2000 – ‘06 2006 2000 2006 2000 2006
<900cc -32.8 -6.4 -8.8 1.2 0.6 1.0 0.5
900 - 1.2 litre 2.7 0.4 0.4 25.7 20.3 22.3 17.0
1.2 - 1.5 litre 31.8 4.7 4.6 45.1 45.8 39.2 38.3
1.5 - 1.7 litre 51.5 7.2 10.1 14.4 16.8 12.5 14.1
1.7 - 1.9 litre 81.5 10.4 8.8 5.4 7.6 4.7 6.3
>1.9 litre 39.8 5.7 7.4 8.2 8.8 7.1 7.4
Total 29.7 4.4 5.0 86.9 83.6
Source: Based on DEHLG Data.
The profile of shares of engine size in petrol and diesel cars is very different. Petrol cars with engine size greater than 1.7 litre represent just 14% of the fleet whereas for diesel cars they represent 83%. For petrol cars, the share of cars with engines less than 1.2 litre is down from 27% in 2000 to 22% in 2006. The share of petrol cars with 1.2 to 1.5 litre engines has remained relatively stable at around 45 to 46%. However, the share of petrol cars with engines greater than 1.5 litre capacity has grown from 28% in 2000 to 32% in 2006. The 1.7 to 1.9 litre petrol category experience the largest overall growth between 2000 and 2006 growing by 82% (10.4% per annual). In 2006 just the 1.5 – 1.7 litre and the greater than 1.9 litre categories grew at a faster rate than the average over the 2000 – 2006 period. Overall shares of petrol cars in the private car fleet have fallen from 87% in 1990 to 84% in 2006. Shares of petrol cars less than 1.5 litre have fallen to some degree with the 900cc – 1.2 litre falling the most going from 22% in 1990 to 17% in 2006. Shares of the larger cars, that is greater than 1.5 litre, have all increased over the period.
27
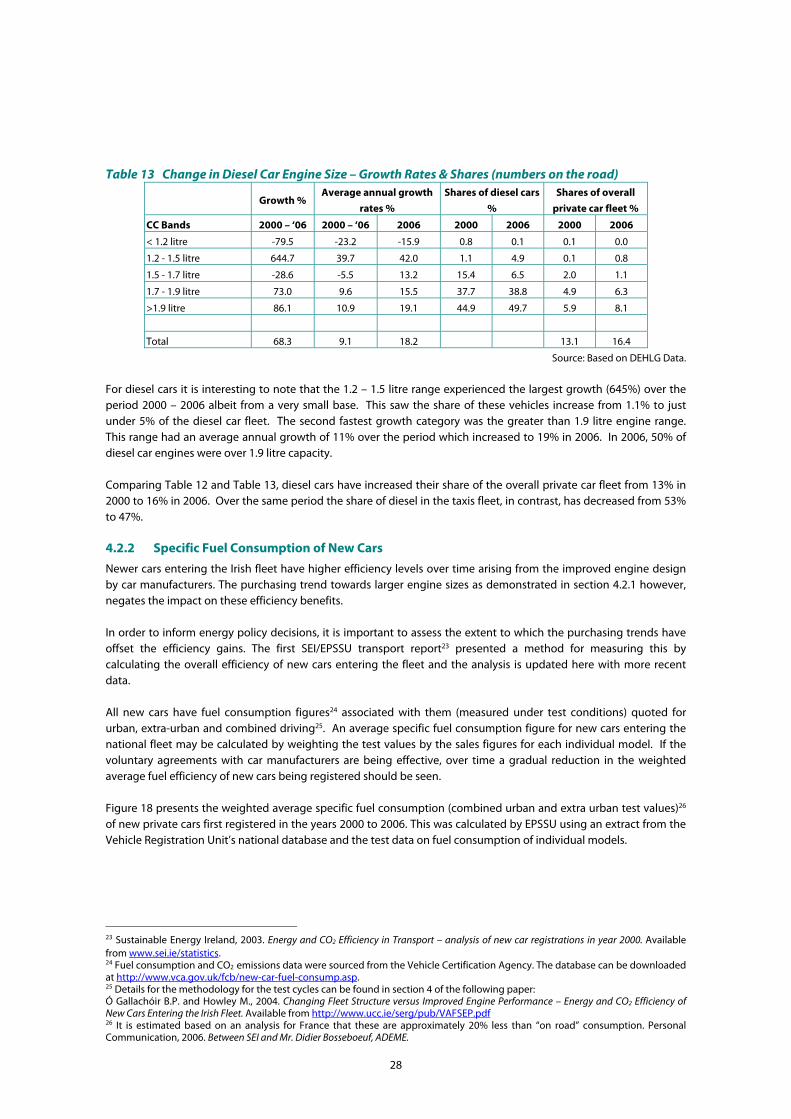
Table 13 Change in Diesel Car Engine Size – Growth Rates & Shares (numbers on the road)
Growth % Average annual growth
rates %
Shares of diesel cars
%
Shares of overall
private car fleet %
CC Bands 2000 – ‘06 2000 – ‘06 2006 2000 2006 2000 2006
< 1.2 litre -79.5 -23.2 -15.9 0.8 0.1 0.1 0.0
1.2 - 1.5 litre 644.7 39.7 42.0 1.1 4.9 0.1 0.8
1.5 - 1.7 litre -28.6 -5.5 13.2 15.4 6.5 2.0 1.1
1.7 - 1.9 litre 73.0 9.6 15.5 37.7 38.8 4.9 6.3
>1.9 litre 86.1 10.9 19.1 44.9 49.7 5.9 8.1
Total 68.3 9.1 18.2 13.1 16.4
Source: Based on DEHLG Data.
For diesel cars it is interesting to note that the 1.2 – 1.5 litre range experienced the largest growth (645%) over the period 2000 – 2006 albeit from a very small base. This saw the share of these vehicles increase from 1.1% to just under 5% of the diesel car fleet. The second fastest growth category was the greater than 1.9 litre engine range. This range had an average annual growth of 11% over the period which increased to 19% in 2006. In 2006, 50% of diesel car engines were over 1.9 litre capacity. Comparing Table 12 and Table 13, diesel cars have increased their share of the overall private car fleet from 13% in 2000 to 16% in 2006. Over the same period the share of diesel in the taxis fleet, in contrast, has decreased from 53% to 47%.
4.2.2 Specific Fuel Consumption of New Cars
Newer cars entering the Irish fleet have higher efficiency levels over time arising from the improved engine design by car manufacturers. The purchasing trend towards larger engine sizes as demonstrated in section 4.2.1 however, negates the impact on these efficiency benefits. In order to inform energy policy decisions, it is important to assess the extent to which the purchasing trends have offset the efficiency gains. The first SEI/EPSSU transport report23 presented a method for measuring this by calculating the overall efficiency of new cars entering the fleet and the analysis is updated here with more recent data. All new cars have fuel consumption figures24 associated with them (measured under test conditions) quoted for urban, extra-urban and combined driving25. An average specific fuel consumption figure for new cars entering the national fleet may be calculated by weighting the test values by the sales figures for each individual model. If the voluntary agreements with car manufacturers are being effective, over time a gradual reduction in the weighted average fuel efficiency of new cars being registered should be seen. Figure 18 presents the weighted average specific fuel consumption (combined urban and extra urban test values)26 of new private cars first registered in the years 2000 to 2006. This was calculated by EPSSU using an extract from the Vehicle Registration Unit’s national database and the test data on fuel consumption of individual models.
23 Sustainable Energy Ireland, 2003. Energy and CO2 Efficiency in Transport – analysis of new car registrations in year 2000. Available from www.sei.ie/statistics. 24 Fuel consumption and CO2 emissions data were sourced from the Vehicle Certification Agency. The database can be downloaded at http://www.vca.gov.uk/fcb/new-car-fuel-consump.asp. 25 Details for the methodology for the test cycles can be found in section 4 of the following paper: Ó Gallachóir B.P. and Howley M., 2004. Changing Fleet Structure versus Improved Engine Performance – Energy and CO2 Efficiency of New Cars Entering the Irish Fleet. Available from http://www.ucc.ie/serg/pub/VAFSEP.pdf 26 It is estimated based on an analysis for France that these are approximately 20% less than “on road” consumption. Personal Communication, 2006. Between SEI and Mr. Didier Bosseboeuf, ADEME.
28

Figure 18 Specific Fuel Consumption of New Cars 2000 to 2006
6.74
6.18
7.027.016.997.016.996.91
6.19 6.28 6.12 6.226.36
6.30
4
5
6
7
8
2000 2001 2002 2003 2004 2005 2006
litre
s/10
0km
Petrol Diesel
Source: Based on DEHLG Data
The specific fuel consumption for new petrol cars on the road in Ireland in 2005 was 7.02 litres/100km (40 miles per gallon, mpg). This represented an increase of 1.6% (decrease in fuel efficiency) on the average consumption in 2000. In 2006 there was a step change improvement in the weighted average fuel efficiency of petrol cars with the specific fuel consumption improving by 4% to 6.74 litres/100km on 2005 figures. For diesel cars the average fuel efficiency improved slightly over the period 2000 - 2006 by 0.2% to 6.18 litres/100km. There was an improvement in 2006 over 2005 figures of 2%. Generally, until 2005 the decrease in fuel efficiency suggests that the purchasing trend towards large cars over the period did outweigh the efficiency benefits of engine improvements. This applied to both petrol and diesel cars with the exception of diesel cars in 2002 where an improvement was noted and also in 2005 when a slight improvement was recorded. The efficiency improvement in 2006 for both new petrol and diesel cars is due to one or a combination of the following;
• The purchasing trend within engine size bands was towards more fuel efficient cars • The efficiency improvements in individual cars outweighed the purchasing trend towards larger cars
Table 14 presents the change in specific fuel efficiency of different engine size bands between 2000, 2005 and 2006 for both petrol and diesel cars. It can be seen that there has been a decrease for all petrol engine size bands between 2000 and 2006. For all diesel engine size bands there has been an increase in fuel consumption per 100km until 2005. In 2006 there was a reduction in the specific fuel consumption in all diesel bands with the exception of the smallest band, 1.2 – 1.5 litre engine size, which shows an increase.
29
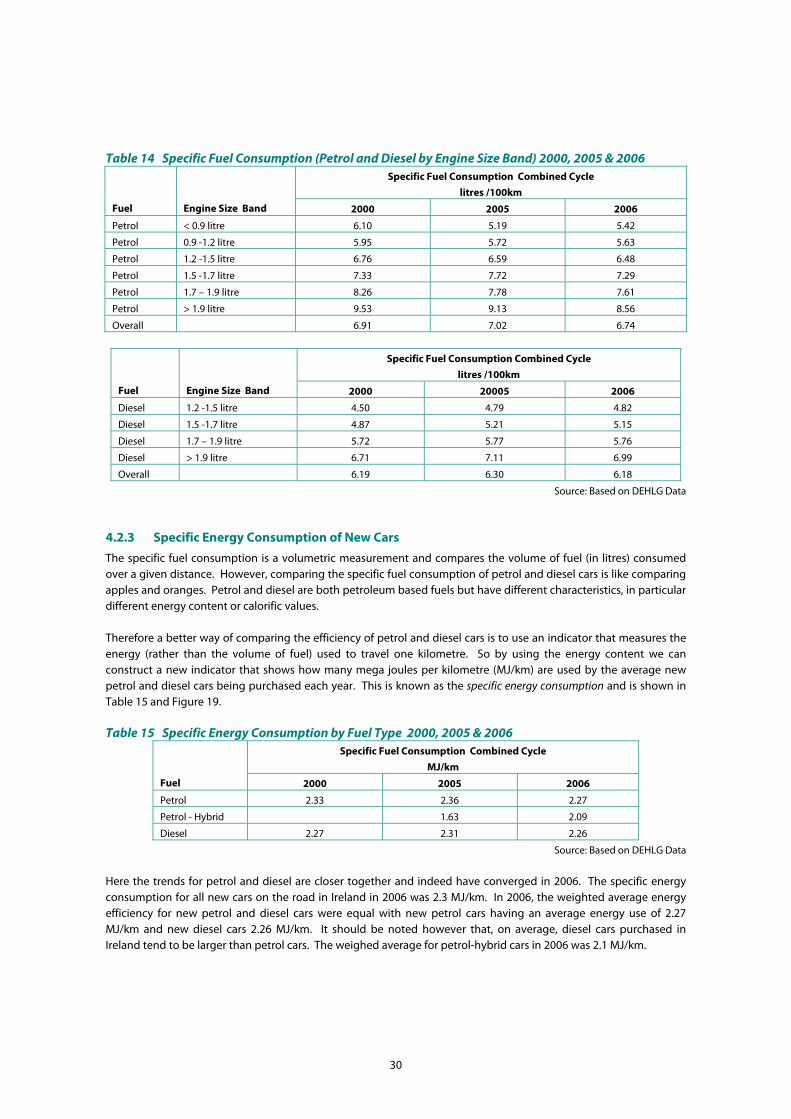
Table 14 Specific Fuel Consumption (Petrol and Diesel by Engine Size Band) 2000, 2005 & 2006 Specific Fuel Consumption Combined Cycle
litres /100km
Fuel Engine Size Band 2000 2005 2006
Petrol < 0.9 litre 6.10 5.19 5.42
Petrol 0.9 -1.2 litre 5.95 5.72 5.63
Petrol 1.2 -1.5 litre 6.76 6.59 6.48
Petrol 1.5 -1.7 litre 7.33 7.72 7.29
Petrol 1.7 – 1.9 litre 8.26 7.78 7.61
Petrol > 1.9 litre 9.53 9.13 8.56
Overall 6.91 7.02 6.74
Specific Fuel Consumption Combined Cycle
litres /100km
Fuel Engine Size Band 2000 20005 2006
Diesel 1.2 -1.5 litre 4.50 4.79 4.82
Diesel 1.5 -1.7 litre 4.87 5.21 5.15
Diesel 1.7 – 1.9 litre 5.72 5.77 5.76
Diesel > 1.9 litre 6.71 7.11 6.99
Overall 6.19 6.30 6.18
Source: Based on DEHLG Data
4.2.3 Specific Energy Consumption of New Cars
The specific fuel consumption is a volumetric measurement and compares the volume of fuel (in litres) consumed over a given distance. However, comparing the specific fuel consumption of petrol and diesel cars is like comparing apples and oranges. Petrol and diesel are both petroleum based fuels but have different characteristics, in particular different energy content or calorific values. Therefore a better way of comparing the efficiency of petrol and diesel cars is to use an indicator that measures the energy (rather than the volume of fuel) used to travel one kilometre. So by using the energy content we can construct a new indicator that shows how many mega joules per kilometre (MJ/km) are used by the average new petrol and diesel cars being purchased each year. This is known as the specific energy consumption and is shown in Table 15 and Figure 19. Table 15 Specific Energy Consumption by Fuel Type 2000, 2005 & 2006
Specific Fuel Consumption Combined Cycle
MJ/km
Fuel 2000 2005 2006
Petrol 2.33 2.36 2.27
Petrol - Hybrid 1.63 2.09
Diesel 2.27 2.31 2.26
Source: Based on DEHLG Data
Here the trends for petrol and diesel are closer together and indeed have converged in 2006. The specific energy consumption for all new cars on the road in Ireland in 2006 was 2.3 MJ/km. In 2006, the weighted average energy efficiency for new petrol and diesel cars were equal with new petrol cars having an average energy use of 2.27 MJ/km and new diesel cars 2.26 MJ/km. It should be noted however that, on average, diesel cars purchased in Ireland tend to be larger than petrol cars. The weighed average for petrol-hybrid cars in 2006 was 2.1 MJ/km.
30
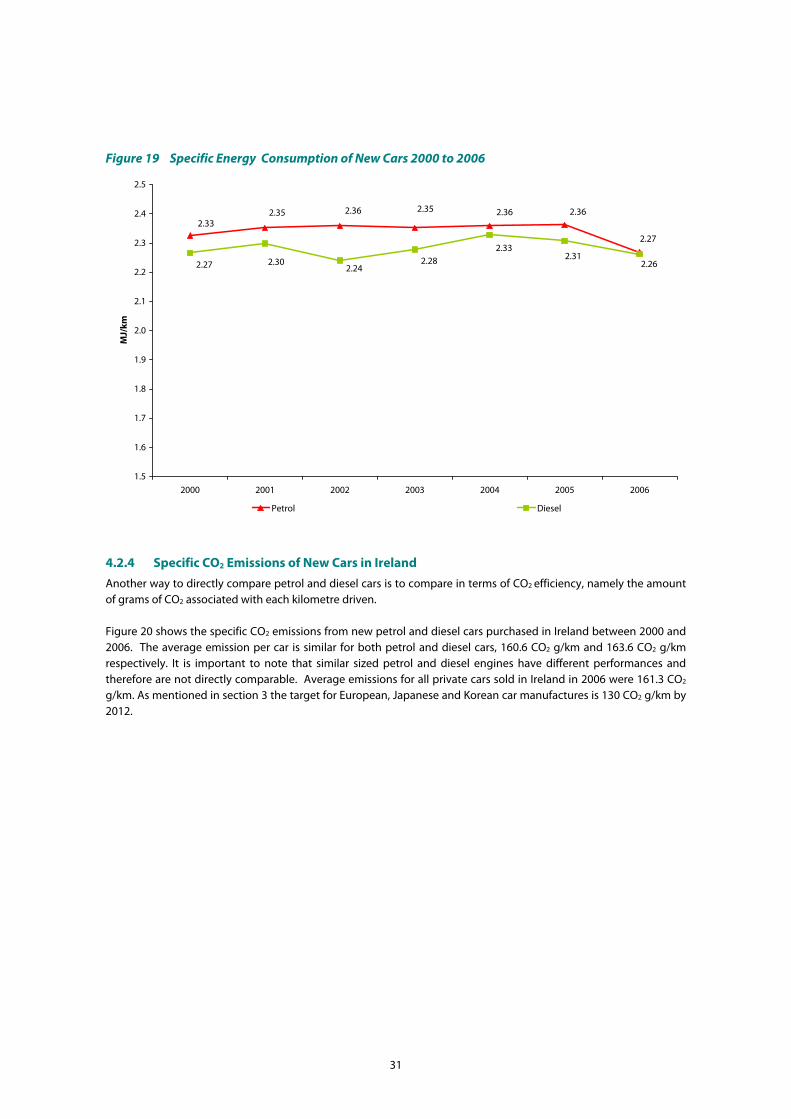
Figure 19 Specific Energy Consumption of New Cars 2000 to 2006
2.27
2.332.35 2.36 2.35 2.36 2.36
2.262.31
2.332.28
2.242.302.27
1.5
1.6
1.7
1.8
1.9
2.0
2.1
2.2
2.3
2.4
2.5
2000 2001 2002 2003 2004 2005 2006
MJ/
km
Petrol Diesel
4.2.4 Specific CO2 Emissions of New Cars in Ireland
Another way to directly compare petrol and diesel cars is to compare in terms of CO2 efficiency, namely the amount of grams of CO2 associated with each kilometre driven. Figure 20 shows the specific CO2 emissions from new petrol and diesel cars purchased in Ireland between 2000 and 2006. The average emission per car is similar for both petrol and diesel cars, 160.6 CO2 g/km and 163.6 CO2 g/km respectively. It is important to note that similar sized petrol and diesel engines have different performances and therefore are not directly comparable. Average emissions for all private cars sold in Ireland in 2006 were 161.3 CO2 g/km. As mentioned in section 3 the target for European, Japanese and Korean car manufactures is 130 CO2 g/km by 2012.
31

Figure 20 Specific CO2 Emissions of New Cars 2000 to 2006
167.9165.6
160.6
168.1
163.6
166.1167.7
167.3167.6
163.5165.8 167.5165.3
169.6
100
110
120
130
140
150
160
170
180
2000 2001 2002 2003 2004 2005 2006
CO
2 g/k
m
Petrol Diesel
Source: Based on DEHLG Data
Over the period 2000 to 2005 the trend decreased by 3.3% for average petrol emissions while diesel emissions decreased by 1.2% having increased for the years 2004/’05. The trend from 2004 onwards shows some sign that average emissions of new cars entering the fleet are becoming slightly more CO2 efficient. It is also possible to look at the specific CO2 emissions by engine size band. Table 16 presents data for 2000, 2005 and 2006 and it can be seen that emissions per km from all diesel bands increased while all petrol bands recorded a decrease. Table 16 Specific CO2 Emissions (Petrol and Diesel by Engine Size Band) 2000, 2005 & 2006
Average of CO2 g/km
Fuel Engine Size Band 2000 2005 2006
Petrol < 0.9 litre 157 126 131
Petrol 0.9 -1.2 litre 143 137 133
Petrol 1.2 -1.5 litre 163 158 155
Petrol 1.5 -1.7 litre 176 174 173
Petrol 1.7 - 1.9 litre 198 186 181
Petrol > 1.9 litre 228 218 205
Overall 166.1 165.6 160.6
Average of CO2 g/km
Fuel Engine Size Band 2000 2005 2006
Diesel 1.2 -1.5 litre 120 127 129
Diesel 1.5 -1.7 litre 131 137 136
Diesel 1.7 - 1.9 litre 153 155 154
Diesel > 1.9 litre 180 190 184
Overall 165.8 168.1 163.6
Source: Based on DEHLG Data
32

Between 2000 and 2005 the average emissions of each diesel engine size band increased whereas in 2006 there was a reduction in each band with the exception of the smallest category (1.2 – 1.5 litre band). It is also interesting to compare CO2 emissions from similar engine size petrol and diesel cars. In 2005 for example, emissions from petrol cars in the 1.2 to 1.5 litre band were 20% above those for similar sized diesel cars. For the 1.5-1.7 litre band the difference was 27%, 18% for the 1.7 to 1.9 litre band and 11% for the over 1.9 litre band.
4.3 Analysis of New Private Cars by emission band 2000 to 2006 Data held by SEI on vehicle registrations was analysed to obtain information about the numbers of new vehicles coming onto Irish roads in different CO2 emission bands. Bands of CO2 emissions were selected starting with less than 130 g CO2 and going up in increments of 20 g up to greater than 210 g CO2. Results are presented below. Figure 21 Percentage of New Vehicles in each emission band 2000 to 2006
0%
20%
40%
60%
80%
100%
2000 2001 2002 2003 2004 2005 2006
New
Veh
icle
s (%
)
<=130 gCO2/km 131-150 gCO2/km 151-170 gCO2/km 171-190 gCO2/km 191-210 gCO2/km >=210 gCO2/km
Table 17 New Vehicle Shares by emission band
Shares % 2000 2001 2002 2003 2004 2005 2006 <=130 gCO2/km 0.6 0.5 1.0 1.9 3.6 7.2 9.6 131-150 gCO2/km 25.7 27.4 26.1 28.0 22.7 17.9 21.8 151-170 gCO2/km 41.1 38.0 38.9 34.2 35.1 38.1 39.7 171-190 gCO2/km 17.8 19.5 20.4 21.5 24.4 25.1 19.3 191-210 gCO2/km 6.5 6.3 5.9 5.9 7.4 5.4 5.0 >=210 gCO2/km 8.1 8.3 7.7 8.6 6.8 6.3 4.5
Table 17 shows in figures the changing shares of new vehicles in each emission band shown in Figure 21. There has been considerable growth in the less than 130 gCO2/km band albeit from a very low starting point of 0.6% in 2000 to 9.6% of sales in 2006. The 131 – 150 gCO2/km and 151 – 170 gCO2/km bands, which are both below the average emissions of 161 gCO2/km, have shown declining shares since 2000 going from 67% in aggregate in 2000 to 62% in 2006. The two bands above the average, 171 – 190 and 191 – 210 gCO2/km both experienced growth, going from 24% in aggregate in 2000 to 31% in 2005 but falling back to 24% again in 2006. Interestingly the share of the highest
33
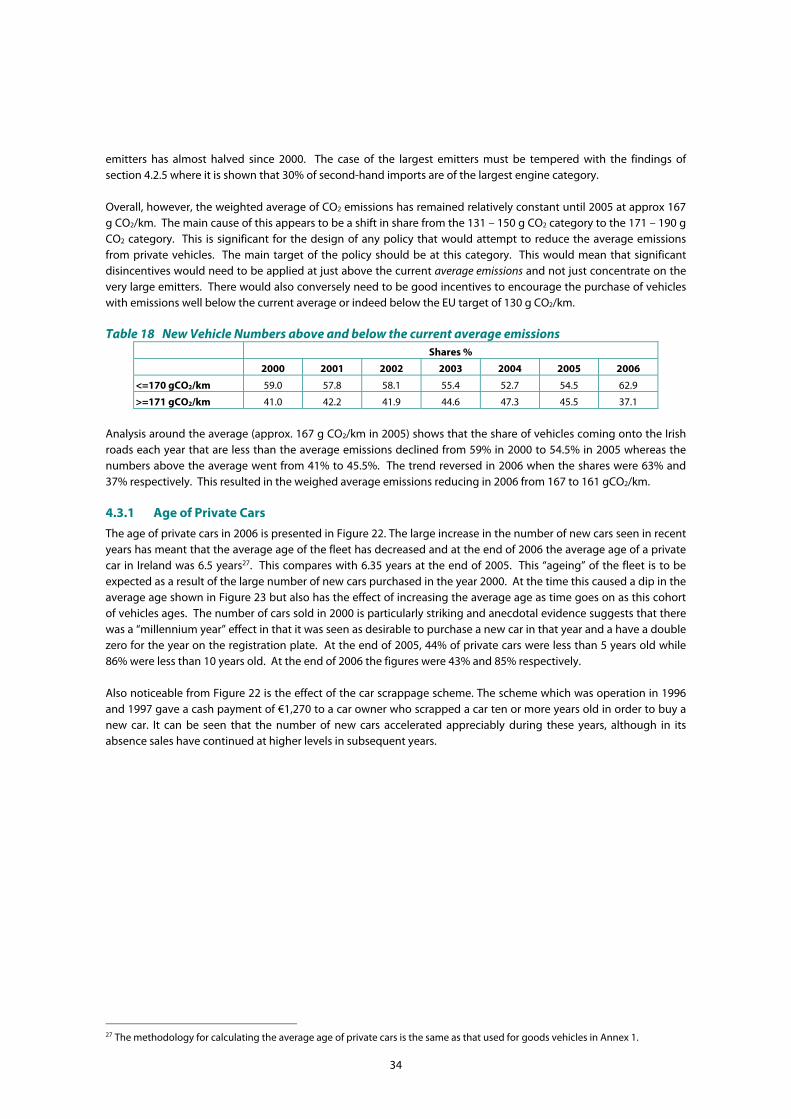
emitters has almost halved since 2000. The case of the largest emitters must be tempered with the findings of section 4.2.5 where it is shown that 30% of second-hand imports are of the largest engine category. Overall, however, the weighted average of CO2 emissions has remained relatively constant until 2005 at approx 167 g CO2/km. The main cause of this appears to be a shift in share from the 131 – 150 g CO2 category to the 171 – 190 g CO2 category. This is significant for the design of any policy that would attempt to reduce the average emissions from private vehicles. The main target of the policy should be at this category. This would mean that significant disincentives would need to be applied at just above the current average emissions and not just concentrate on the very large emitters. There would also conversely need to be good incentives to encourage the purchase of vehicles with emissions well below the current average or indeed below the EU target of 130 g CO2/km. Table 18 New Vehicle Numbers above and below the current average emissions
Shares %
2000 2001 2002 2003 2004 2005 2006
<=170 gCO2/km 59.0 57.8 58.1 55.4 52.7 54.5 62.9
>=171 gCO2/km 41.0 42.2 41.9 44.6 47.3 45.5 37.1
Analysis around the average (approx. 167 g CO2/km in 2005) shows that the share of vehicles coming onto the Irish roads each year that are less than the average emissions declined from 59% in 2000 to 54.5% in 2005 whereas the numbers above the average went from 41% to 45.5%. The trend reversed in 2006 when the shares were 63% and 37% respectively. This resulted in the weighed average emissions reducing in 2006 from 167 to 161 gCO2/km.
4.3.1 Age of Private Cars
The age of private cars in 2006 is presented in Figure 22. The large increase in the number of new cars seen in recent years has meant that the average age of the fleet has decreased and at the end of 2006 the average age of a private car in Ireland was 6.5 years27. This compares with 6.35 years at the end of 2005. This “ageing” of the fleet is to be expected as a result of the large number of new cars purchased in the year 2000. At the time this caused a dip in the average age shown in Figure 23 but also has the effect of increasing the average age as time goes on as this cohort of vehicles ages. The number of cars sold in 2000 is particularly striking and anecdotal evidence suggests that there was a “millennium year” effect in that it was seen as desirable to purchase a new car in that year and a have a double zero for the year on the registration plate. At the end of 2005, 44% of private cars were less than 5 years old while 86% were less than 10 years old. At the end of 2006 the figures were 43% and 85% respectively. Also noticeable from Figure 22 is the effect of the car scrappage scheme. The scheme which was operation in 1996 and 1997 gave a cash payment of €1,270 to a car owner who scrapped a car ten or more years old in order to buy a new car. It can be seen that the number of new cars accelerated appreciably during these years, although in its absence sales have continued at higher levels in subsequent years.
27 The methodology for calculating the average age of private cars is the same as that used for goods vehicles in Annex 1.
34
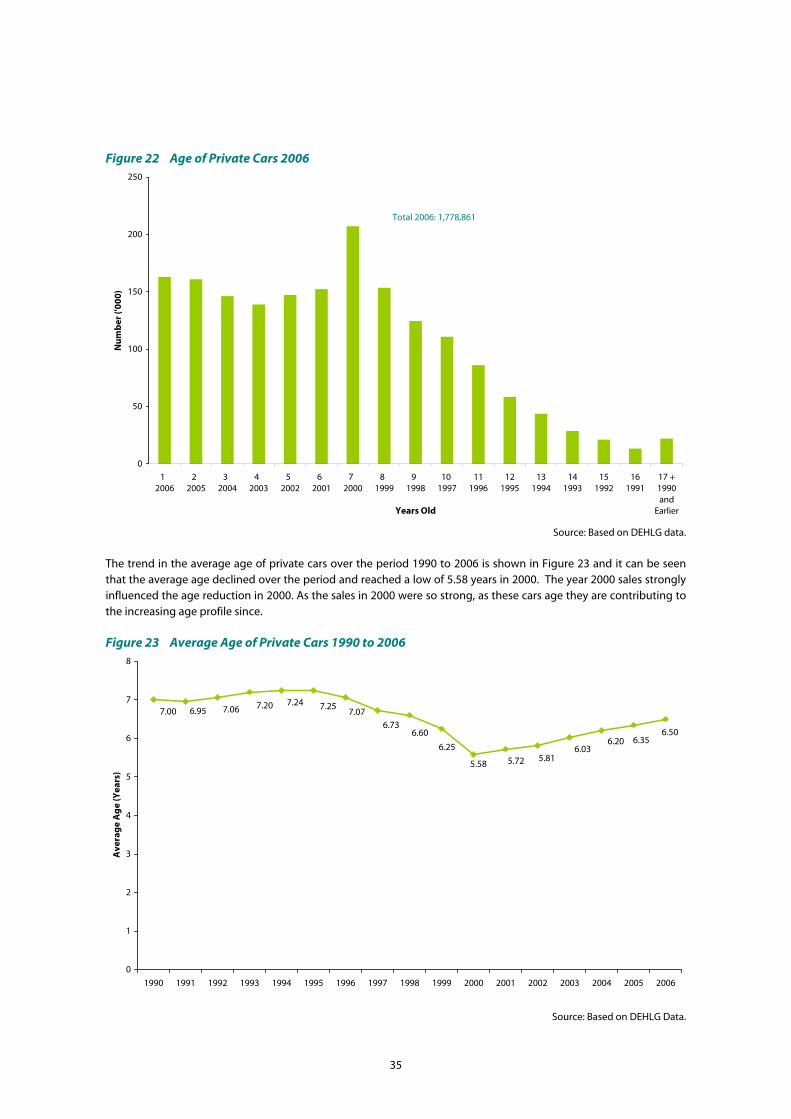
Figure 22 Age of Private Cars 2006
0
50
100
150
200
250
1 2006
2 2005
3 2004
4 2003
5 2002
6 2001
7 2000
8 1999
9 1998
10 1997
111996
121995
131994
141993
151992
161991
17 +1990and
EarlierYears Old
Nu
mb
er ('
000)
Total 2006: 1,778,861
Source: Based on DEHLG data.
The trend in the average age of private cars over the period 1990 to 2006 is shown in Figure 23 and it can be seen that the average age declined over the period and reached a low of 5.58 years in 2000. The year 2000 sales strongly influenced the age reduction in 2000. As the sales in 2000 were so strong, as these cars age they are contributing to the increasing age profile since. Figure 23 Average Age of Private Cars 1990 to 2006
6.506.356.20
6.035.815.72
6.606.73
7.077.257.247.207.066.957.00
6.25
5.58
0
1
2
3
4
5
6
7
8
1990 1991 1992 1993 1994 1995 1996 1997 1998 1999 2000 2001 2002 2003 2004 2005 2006
Ave
rag
e A
ge
(Yea
rs)
Source: Based on DEHLG Data.
35
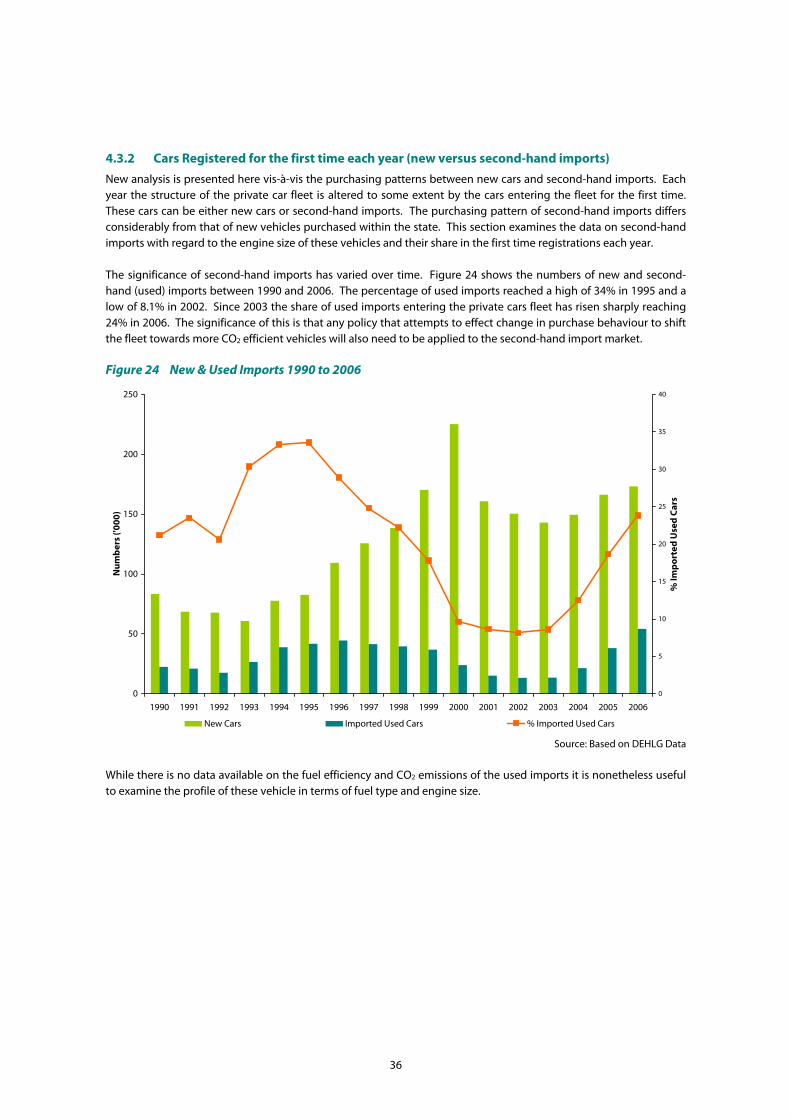
4.3.2 Cars Registered for the first time each year (new versus second-hand imports)
New analysis is presented here vis-à-vis the purchasing patterns between new cars and second-hand imports. Each year the structure of the private car fleet is altered to some extent by the cars entering the fleet for the first time. These cars can be either new cars or second-hand imports. The purchasing pattern of second-hand imports differs considerably from that of new vehicles purchased within the state. This section examines the data on second-hand imports with regard to the engine size of these vehicles and their share in the first time registrations each year. The significance of second-hand imports has varied over time. Figure 24 shows the numbers of new and second-hand (used) imports between 1990 and 2006. The percentage of used imports reached a high of 34% in 1995 and a low of 8.1% in 2002. Since 2003 the share of used imports entering the private cars fleet has risen sharply reaching 24% in 2006. The significance of this is that any policy that attempts to effect change in purchase behaviour to shift the fleet towards more CO2 efficient vehicles will also need to be applied to the second-hand import market. Figure 24 New & Used Imports 1990 to 2006
0
50
100
150
200
250
1990 1991 1992 1993 1994 1995 1996 1997 1998 1999 2000 2001 2002 2003 2004 2005 2006
Nu
mb
ers
('000
)
0
5
10
15
20
25
30
35
40
% Im
po
rted
Use
d C
ars
New Cars Imported Used Cars % Imported Used Cars
Source: Based on DEHLG Data
While there is no data available on the fuel efficiency and CO2 emissions of the used imports it is nonetheless useful to examine the profile of these vehicle in terms of fuel type and engine size.
36

Figure 25 Used Imports 1990 to 2006 - Numbers
0
2,000
4,000
6,000
8,000
10,000
12,000
14,000
16,000
18,000
1990 1991 1992 1993 1994 1995 1996 1997 1998 1999 2000 2001 2002 2003 2004 2005 2006
Nu
mb
er o
f veh
icle
s
< 0.9 litre 0.9 - 1.2 litre 1.2 - 1.5 litre 1.5 - 1.7 litre 1.7 - 1.9 litre > 1.9 litre
Source: Based on DEHLG Data
Figure 25 shows the numbers of used imports by engine size. Throughout the 1990’s the dominant sizes were the 0.9 – 1.2 litre and the 1.2 – 1.5 litre. However, since 2001 the greater than 1.9 litre category recorded the largest number of vehicles purchased followed by the next largest categories. This would suggest that consumers are trying to mitigate to some extent the high cost of large vehicles by importing used examples of these. Figure 26 Used Imports 1990 to 2006 – Index (1990 = 100)
0
100
200
300
400
500
600
700
800
900
1,000
1990 1991 1992 1993 1994 1995 1996 1997 1998 1999 2000 2001 2002 2003 2004 2005 2006
Ind
ex 1
990
= 1
00
< 0.9 litre 0.9 - 1.2 litre 1.2 - 1.5 litre 1.5 - 1.7 litre 1.7 - 1.9 litre > 1.9 litre
Source: Based on DEHLG Data
37

Figure 26 shows the same data as an index. This shows the extent of the growth of the import of large engine used cars more clearly. Table 19 Growth Rates & Shares of Used Imports 1990 to 2006 Growth % Average annual growth rates % Shares %
CC Bands 1990 – ‘06 1990 – ‘06 1990 – ‘96 1995 – ‘00 2000 – ‘06 2006 1990 2006
<900cc -43.1 -3.5 2.4 -23.3 11.4 10.7 1.1 0.2
900 - 1.2 litre -21.8 -1.5 15.1 -18.2 0.9 26.3 29.7 8.4
1.2 - 1.5 litre 50.0 2.6 7.9 -7.4 7.1 43.8 38.0 20.6
1.5 - 1.7 litre 185.9 6.8 20.6 -15.3 17.1 36.1 14.0 14.5
1.7 - 1.9 litre 798.0 14.7 22.1 -11.1 34.6 48.1 8.0 26.0
>1.9 litre 810.8 14.8 28.6 -3.2 20.3 42.0 9.2 30.3
Total 176.9 6.6 15.6 -11.0 15.7 41.4
Source: Based on DEHLG Data.
Table 19 shows that the growth in the largest engine size vehicles was 811% over the period 1990 – 2006 with the second larges category growing also by approx. 800%. The share of imported used cars of these two categories has grown from 17% in 1990 to 56% in 2006. Overall growth of imported used cars was 41% in 2006.
4.4 Public Service Vehicles
This section profiles the public service vehicles mode which includes the activities of bus (private and public) and taxi/hackney vehicles. It is possible using a new dataset of excise rebates which was provided by the Revenue Commissioners to create bottom up estimates of fuel consumption for buses. Fuel excise rebates (diesel only) are claimed by bus operators therefore data is available on energy usage. The results are shown in Figure 27. It can be seen that total consumption increased by 58% over the period 1995 to 2006. Figure 27 Fuel Consumption of Buses 1995 to 2006
0
10
20
30
40
50
60
70
80
1995 1996 1997 1998 1999 2000 2001 2002 2003 2004 2005 2006
kto
e
Source: Based on Revenue Commissioners Data
38
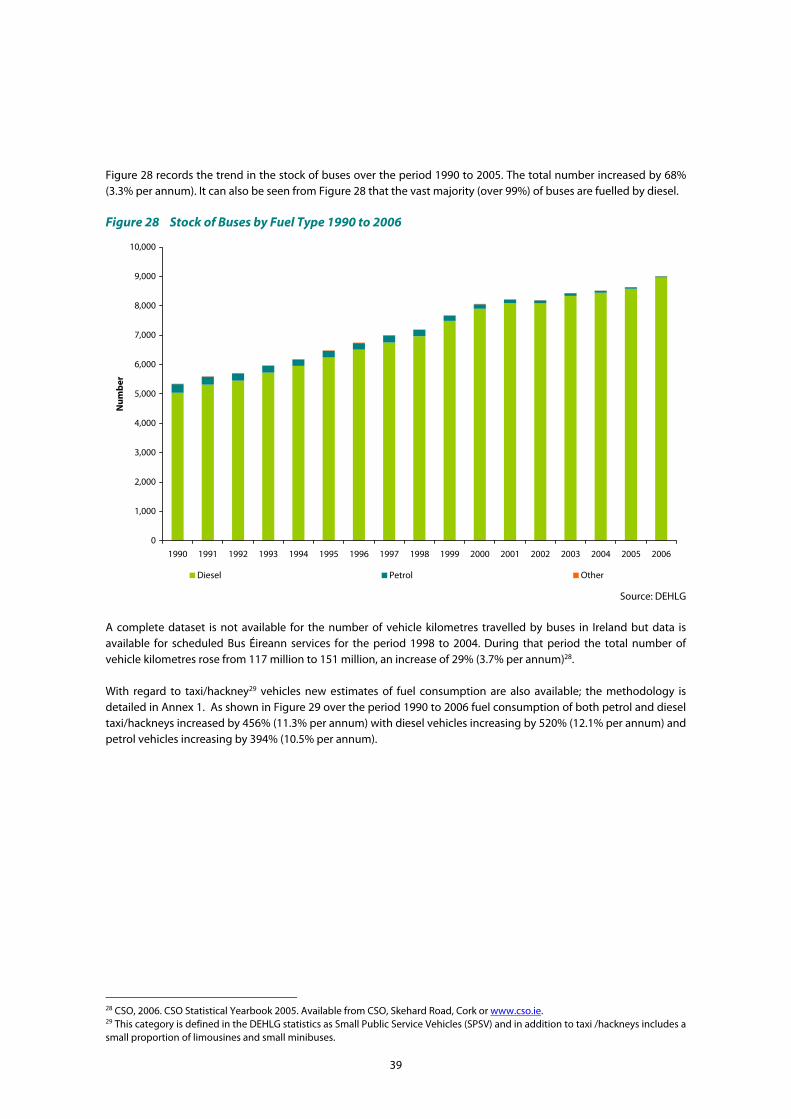
Figure 28 records the trend in the stock of buses over the period 1990 to 2005. The total number increased by 68% (3.3% per annum). It can also be seen from Figure 28 that the vast majority (over 99%) of buses are fuelled by diesel. Figure 28 Stock of Buses by Fuel Type 1990 to 2006
0
1,000
2,000
3,000
4,000
5,000
6,000
7,000
8,000
9,000
10,000
1990 1991 1992 1993 1994 1995 1996 1997 1998 1999 2000 2001 2002 2003 2004 2005 2006
Nu
mb
er
Diesel Petrol Other
Source: DEHLG
A complete dataset is not available for the number of vehicle kilometres travelled by buses in Ireland but data is available for scheduled Bus Éireann services for the period 1998 to 2004. During that period the total number of vehicle kilometres rose from 117 million to 151 million, an increase of 29% (3.7% per annum)28. With regard to taxi/hackney29 vehicles new estimates of fuel consumption are also available; the methodology is detailed in Annex 1. As shown in Figure 29 over the period 1990 to 2006 fuel consumption of both petrol and diesel taxi/hackneys increased by 456% (11.3% per annum) with diesel vehicles increasing by 520% (12.1% per annum) and petrol vehicles increasing by 394% (10.5% per annum).
28 CSO, 2006. CSO Statistical Yearbook 2005. Available from CSO, Skehard Road, Cork or www.cso.ie. 29 This category is defined in the DEHLG statistics as Small Public Service Vehicles (SPSV) and in addition to taxi /hackneys includes a small proportion of limousines and small minibuses.
39
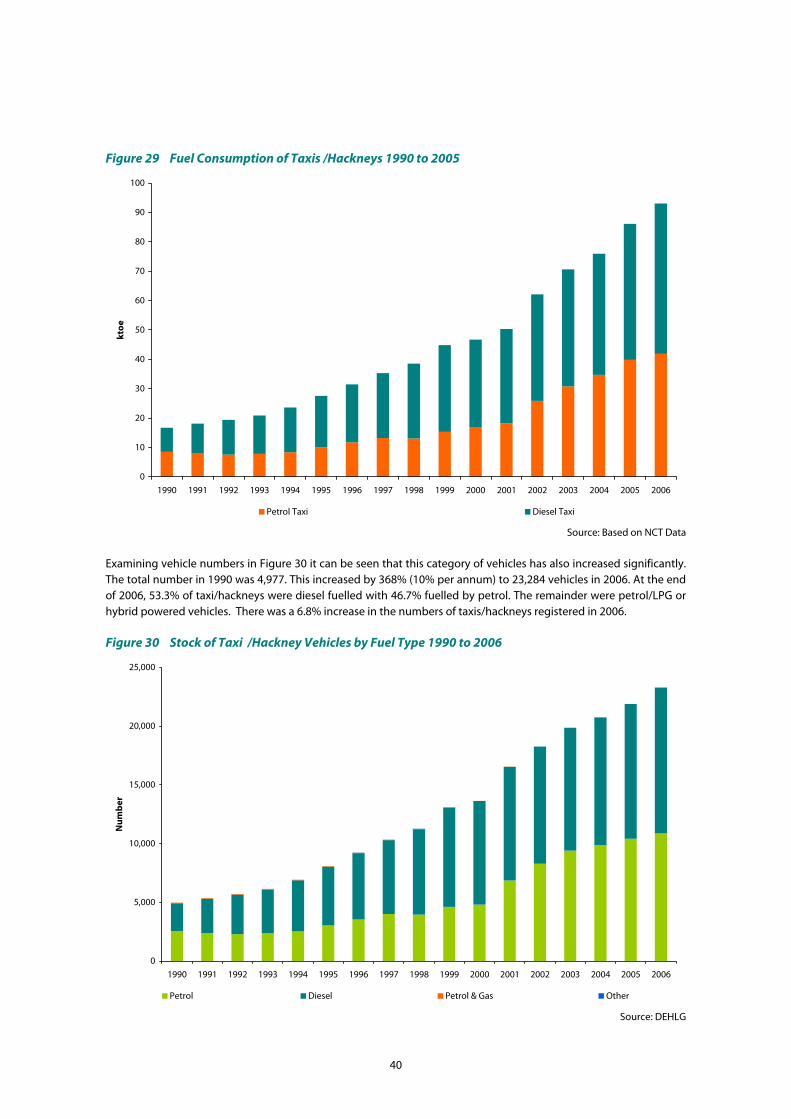
Figure 29 Fuel Consumption of Taxis /Hackneys 1990 to 2005
0
10
20
30
40
50
60
70
80
90
100
1990 1991 1992 1993 1994 1995 1996 1997 1998 1999 2000 2001 2002 2003 2004 2005 2006
kto
e
Petrol Taxi Diesel Taxi
Source: Based on NCT Data
Examining vehicle numbers in Figure 30 it can be seen that this category of vehicles has also increased significantly. The total number in 1990 was 4,977. This increased by 368% (10% per annum) to 23,284 vehicles in 2006. At the end of 2006, 53.3% of taxi/hackneys were diesel fuelled with 46.7% fuelled by petrol. The remainder were petrol/LPG or hybrid powered vehicles. There was a 6.8% increase in the numbers of taxis/hackneys registered in 2006. Figure 30 Stock of Taxi /Hackney Vehicles by Fuel Type 1990 to 2006
0
5,000
10,000
15,000
20,000
25,000
1990 1991 1992 1993 1994 1995 1996 1997 1998 1999 2000 2001 2002 2003 2004 2005 2006
Nu
mb
er
Petrol Diesel Petrol & Gas Other
Source: DEHLG
40

4.5 Rail Fuel consumption of rail transport in Ireland comprises diesel and electricity for DART and Luas services. Diesel usage data for rail transport is sourced from Iarnród Éireann. Overall, fuel consumption by rail increased by 13.6% (0.9% per annum) over the period 1990 to 2005. Figure 31 shows the trend in passenger traffic in trains as measured by passenger kilometres (pkm) and rail freight traffic, measured by tonne kilometres (tkm), as an index. Data are only available for Iarnród Éireann services (Luas pkm numbers were not available at the time of going to print) for the period 1990 to 2005. Over the period 1990 to 2005 the number of pkm increased from 1,223 million to 1,781 million, an increase of 46% (2.5% per annum). Rail freight traffic declined by 49% (4.3% per annum) over the period from 589 million tkm in 1990 to 303 million tkm in 2005. While the demand for rail freight has declined over the period, combined rail and road freight has increased significantly indicating a modal shift. In 1991, the first year comparable data are available, total freight traffic was 5,738 million tkm. Rail accounted for 10% of the total. In 2005 total freight traffic was 18,455 million tkm with rail only accounting for 1.6%. The European Commission has published30 average figures for CO2 emissions per tkm for both road and rail freight traffic. For rail average emissions are in the range of 39 to 48 CO2 g/tkm while emissions for road transport are from 207 to 280 CO2 g/tkm. Figure 31 Rail Passenger and Tonne Kilometres 1990 to 2005 - Index
0
20
40
60
80
100
120
140
160
1990 1991 1992 1993 1994 1995 1996 1997 1998 1999 2000 2001 2002 2003 2004 2005
Ind
ex 1
990
=10
0
Passengers traffic in trains (pkm) Freight traffic in trains (tkm)
Source: CSO
4.6 Air Energy data for this sub sector is currently not available. In the absence of data, kerosene sales figures are used as a proxy. As a result it is also not possible to robustly quantify the proportion of air transport that is consumed domestically and internationally, a requirement for Kyoto reporting. The Environmental Protection Agency, who has
30 European Union, 2000. Energy use for freight transport.
41
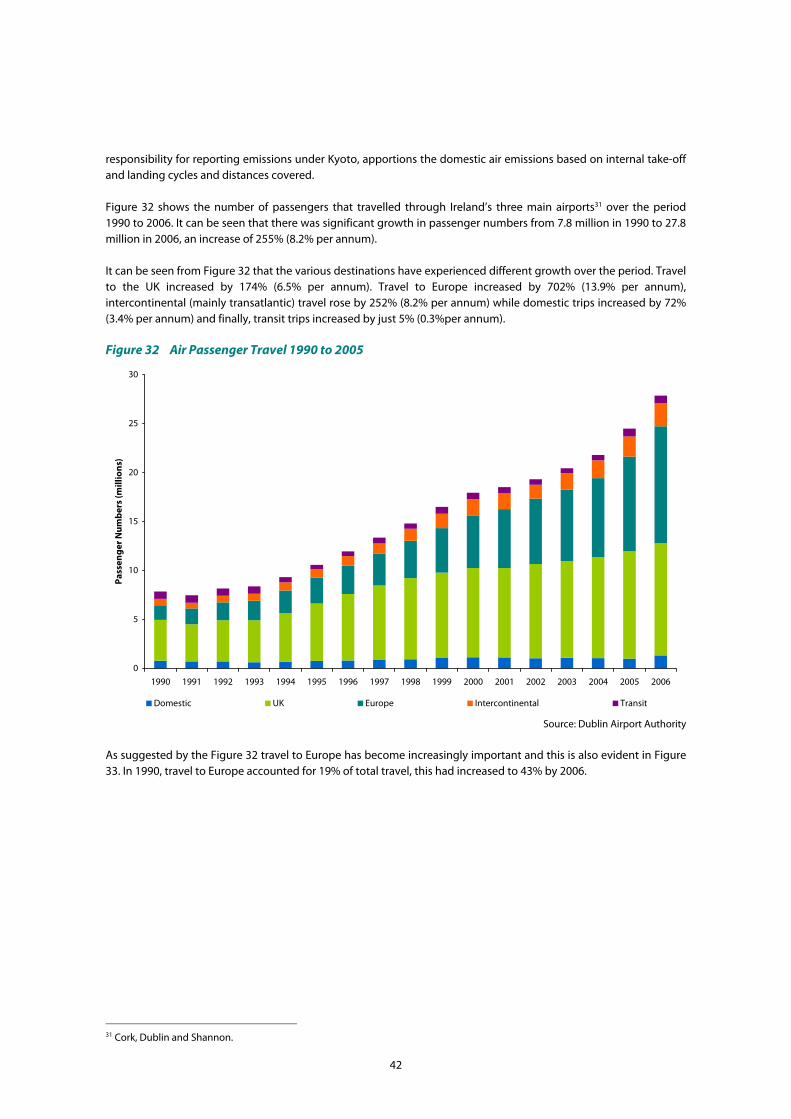
responsibility for reporting emissions under Kyoto, apportions the domestic air emissions based on internal take-off and landing cycles and distances covered. Figure 32 shows the number of passengers that travelled through Ireland’s three main airports31 over the period 1990 to 2006. It can be seen that there was significant growth in passenger numbers from 7.8 million in 1990 to 27.8 million in 2006, an increase of 255% (8.2% per annum). It can be seen from Figure 32 that the various destinations have experienced different growth over the period. Travel to the UK increased by 174% (6.5% per annum). Travel to Europe increased by 702% (13.9% per annum), intercontinental (mainly transatlantic) travel rose by 252% (8.2% per annum) while domestic trips increased by 72% (3.4% per annum) and finally, transit trips increased by just 5% (0.3%per annum). Figure 32 Air Passenger Travel 1990 to 2005
0
5
10
15
20
25
30
1990 1991 1992 1993 1994 1995 1996 1997 1998 1999 2000 2001 2002 2003 2004 2005 2006
Pas
sen
ger
Nu
mb
ers
(mill
ion
s)
Domestic UK Europe Intercontinental Transit
Source: Dublin Airport Authority
As suggested by the Figure 32 travel to Europe has become increasingly important and this is also evident in Figure 33. In 1990, travel to Europe accounted for 19% of total travel, this had increased to 43% by 2006.
31 Cork, Dublin and Shannon.
42
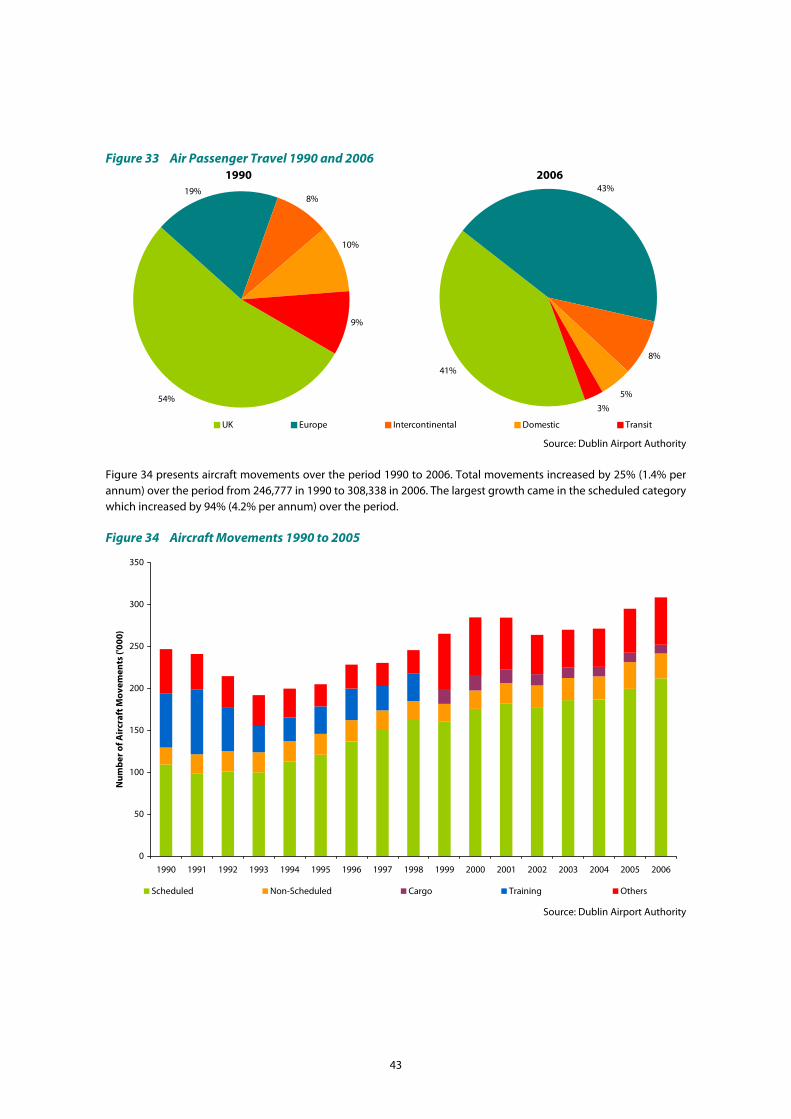
Figure 33 Air Passenger Travel 1990 and 2006 1990 2006
41%
43%
8%
5%
3%
UK Europe Intercontinental Domestic Transit
54%
19%
9%
10%
8%
Source: Dublin Airport Authority
Figure 34 presents aircraft movements over the period 1990 to 2006. Total movements increased by 25% (1.4% per annum) over the period from 246,777 in 1990 to 308,338 in 2006. The largest growth came in the scheduled category which increased by 94% (4.2% per annum) over the period. Figure 34 Aircraft Movements 1990 to 2005
0
50
100
150
200
250
300
350
1990 1991 1992 1993 1994 1995 1996 1997 1998 1999 2000 2001 2002 2003 2004 2005 2006
Nu
mb
er o
f Air
craf
t Mo
vem
ents
('00
0)
Scheduled Non-Scheduled Cargo Training Others
Source: Dublin Airport Authority
43
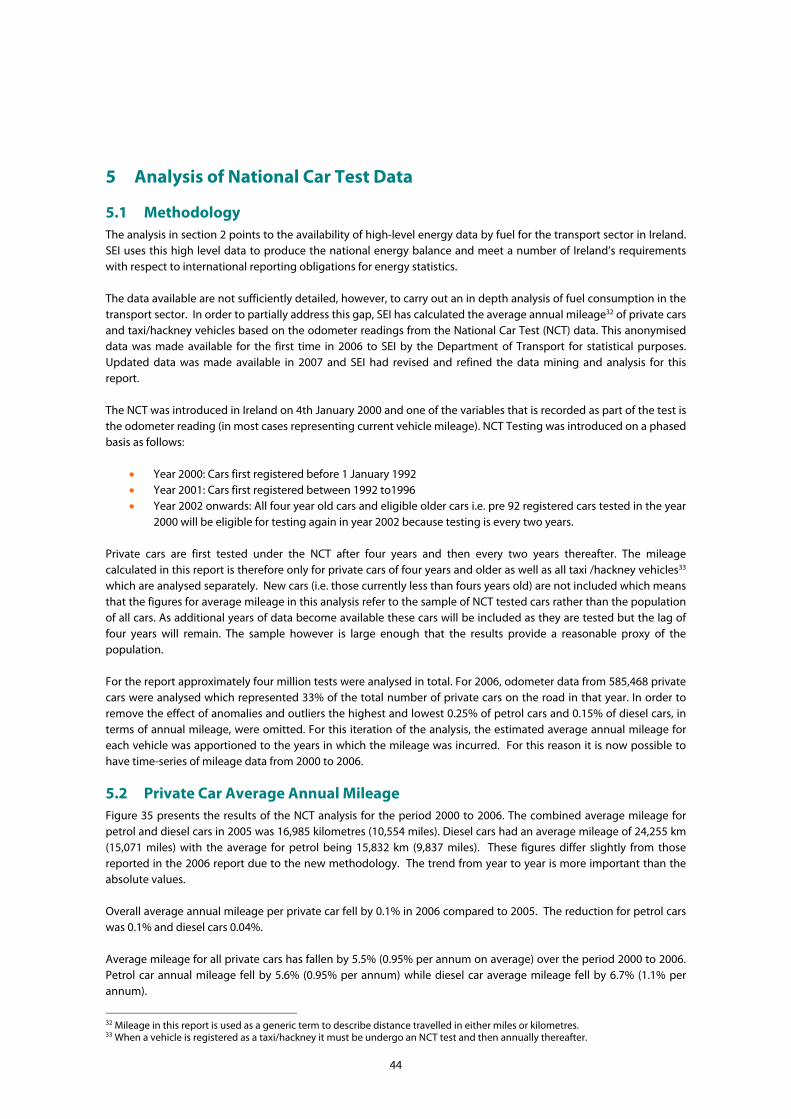
5 Analysis of National Car Test Data
5.1 Methodology The analysis in section 2 points to the availability of high-level energy data by fuel for the transport sector in Ireland. SEI uses this high level data to produce the national energy balance and meet a number of Ireland’s requirements with respect to international reporting obligations for energy statistics. The data available are not sufficiently detailed, however, to carry out an in depth analysis of fuel consumption in the transport sector. In order to partially address this gap, SEI has calculated the average annual mileage32 of private cars and taxi/hackney vehicles based on the odometer readings from the National Car Test (NCT) data. This anonymised data was made available for the first time in 2006 to SEI by the Department of Transport for statistical purposes. Updated data was made available in 2007 and SEI had revised and refined the data mining and analysis for this report. The NCT was introduced in Ireland on 4th January 2000 and one of the variables that is recorded as part of the test is the odometer reading (in most cases representing current vehicle mileage). NCT Testing was introduced on a phased basis as follows:
• Year 2000: Cars first registered before 1 January 1992 • Year 2001: Cars first registered between 1992 to1996 • Year 2002 onwards: All four year old cars and eligible older cars i.e. pre 92 registered cars tested in the year
2000 will be eligible for testing again in year 2002 because testing is every two years. Private cars are first tested under the NCT after four years and then every two years thereafter. The mileage calculated in this report is therefore only for private cars of four years and older as well as all taxi /hackney vehicles33 which are analysed separately. New cars (i.e. those currently less than fours years old) are not included which means that the figures for average mileage in this analysis refer to the sample of NCT tested cars rather than the population of all cars. As additional years of data become available these cars will be included as they are tested but the lag of four years will remain. The sample however is large enough that the results provide a reasonable proxy of the population. For the report approximately four million tests were analysed in total. For 2006, odometer data from 585,468 private cars were analysed which represented 33% of the total number of private cars on the road in that year. In order to remove the effect of anomalies and outliers the highest and lowest 0.25% of petrol cars and 0.15% of diesel cars, in terms of annual mileage, were omitted. For this iteration of the analysis, the estimated average annual mileage for each vehicle was apportioned to the years in which the mileage was incurred. For this reason it is now possible to have time-series of mileage data from 2000 to 2006.
5.2 Private Car Average Annual Mileage Figure 35 presents the results of the NCT analysis for the period 2000 to 2006. The combined average mileage for petrol and diesel cars in 2005 was 16,985 kilometres (10,554 miles). Diesel cars had an average mileage of 24,255 km (15,071 miles) with the average for petrol being 15,832 km (9,837 miles). These figures differ slightly from those reported in the 2006 report due to the new methodology. The trend from year to year is more important than the absolute values. Overall average annual mileage per private car fell by 0.1% in 2006 compared to 2005. The reduction for petrol cars was 0.1% and diesel cars 0.04%. Average mileage for all private cars has fallen by 5.5% (0.95% per annum on average) over the period 2000 to 2006. Petrol car annual mileage fell by 5.6% (0.95% per annum) while diesel car average mileage fell by 6.7% (1.1% per annum).
32 Mileage in this report is used as a generic term to describe distance travelled in either miles or kilometres. 33 When a vehicle is registered as a taxi/hackney it must be undergo an NCT test and then annually thereafter.
44
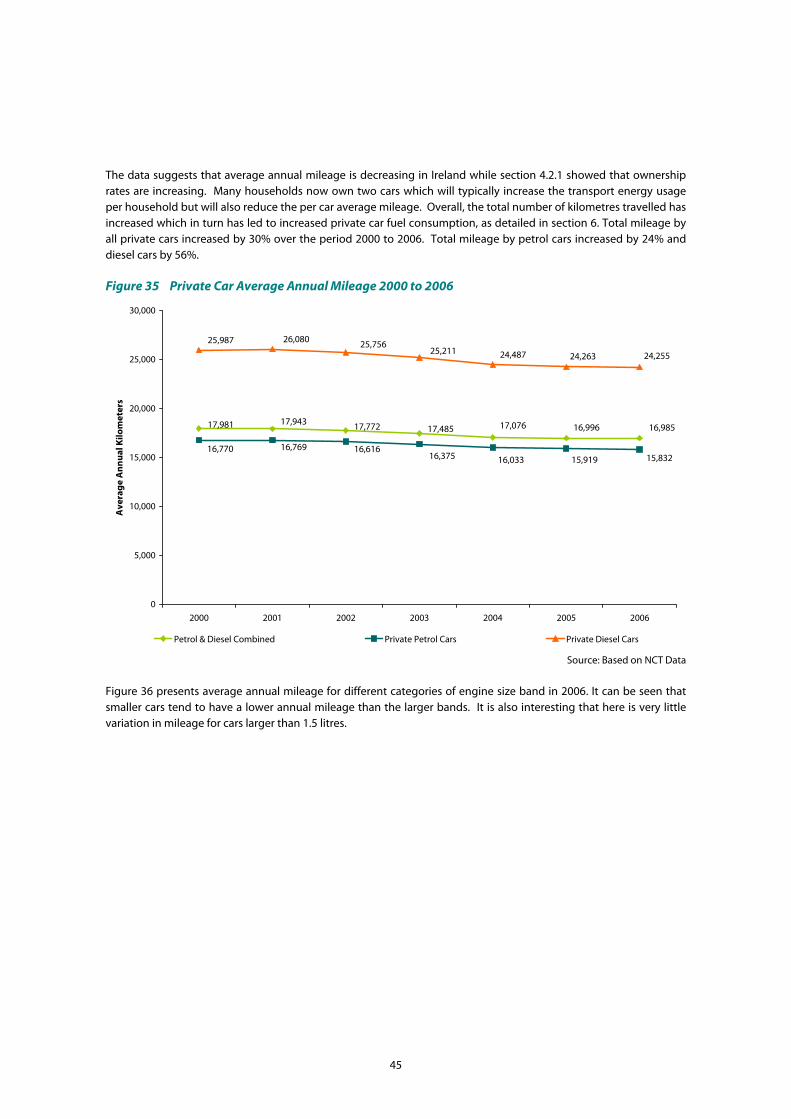
The data suggests that average annual mileage is decreasing in Ireland while section 4.2.1 showed that ownership rates are increasing. Many households now own two cars which will typically increase the transport energy usage per household but will also reduce the per car average mileage. Overall, the total number of kilometres travelled has increased which in turn has led to increased private car fuel consumption, as detailed in section 6. Total mileage by all private cars increased by 30% over the period 2000 to 2006. Total mileage by petrol cars increased by 24% and diesel cars by 56%. Figure 35 Private Car Average Annual Mileage 2000 to 2006
16,98516,99617,07617,48517,77217,94317,981
16,033 15,919 15,83216,37516,61616,76916,770
24,25524,26324,48725,21125,75626,08025,987
0
5,000
10,000
15,000
20,000
25,000
30,000
2000 2001 2002 2003 2004 2005 2006
Ave
rag
e A
nn
ual
Kilo
met
ers
Petrol & Diesel Combined Private Petrol Cars Private Diesel Cars
Source: Based on NCT Data
Figure 36 presents average annual mileage for different categories of engine size band in 2006. It can be seen that smaller cars tend to have a lower annual mileage than the larger bands. It is also interesting that here is very little variation in mileage for cars larger than 1.5 litres.
45
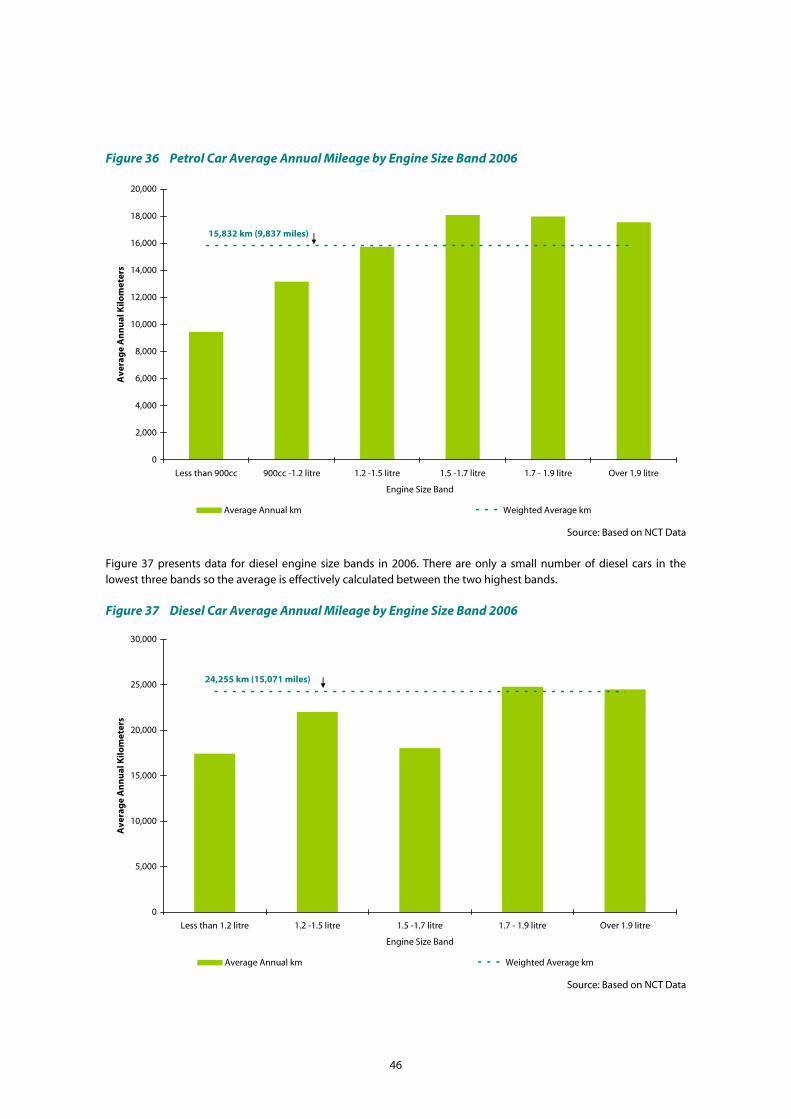
Figure 36 Petrol Car Average Annual Mileage by Engine Size Band 2006
0
2,000
4,000
6,000
8,000
10,000
12,000
14,000
16,000
18,000
20,000
Less than 900cc 900cc -1.2 litre 1.2 -1.5 litre 1.5 -1.7 litre 1.7 - 1.9 litre Over 1.9 litre
Engine Size Band
Ave
rag
e A
nn
ual
Kilo
met
ers
Average Annual km Weighted Average km
15,832 km (9,837 miles)
Source: Based on NCT Data
Figure 37 presents data for diesel engine size bands in 2006. There are only a small number of diesel cars in the lowest three bands so the average is effectively calculated between the two highest bands. Figure 37 Diesel Car Average Annual Mileage by Engine Size Band 2006
0
5,000
10,000
15,000
20,000
25,000
30,000
Less than 1.2 litre 1.2 -1.5 litre 1.5 -1.7 litre 1.7 - 1.9 litre Over 1.9 litre
Engine Size Band
Ave
rag
e A
nn
ual
Kilo
met
ers
Average Annual km Weighted Average km
24,255 km (15,071 miles)
Source: Based on NCT Data
46
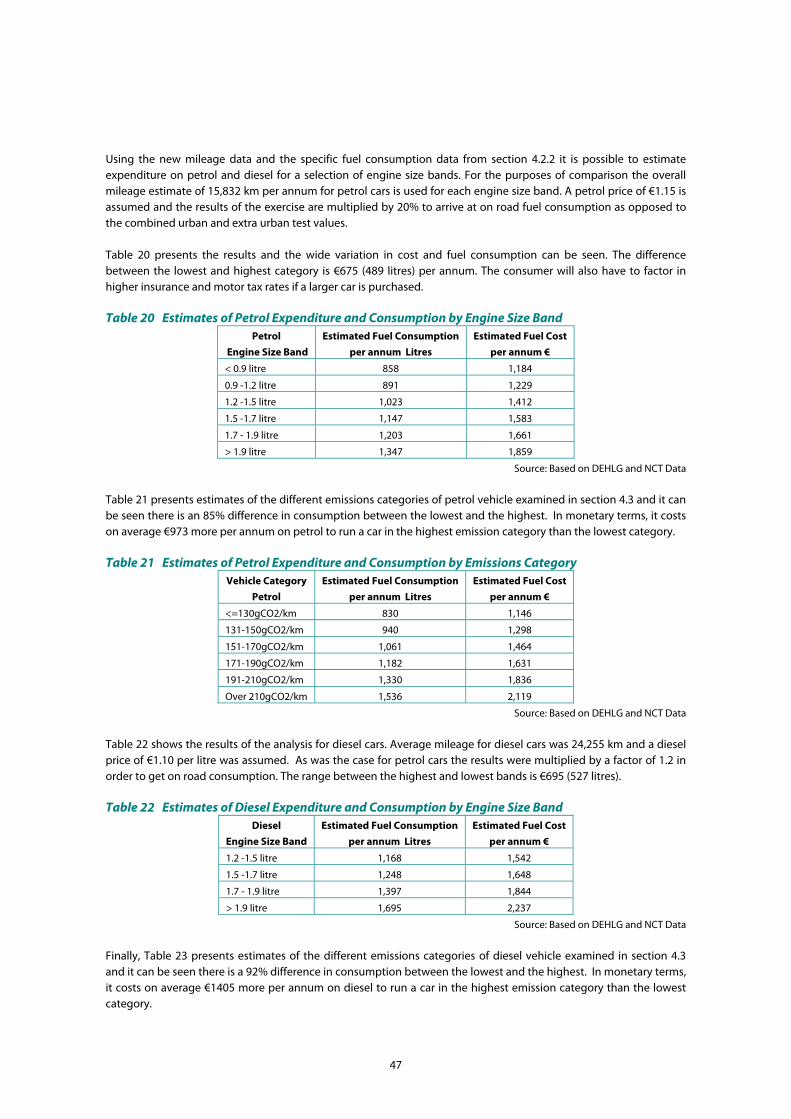
Using the new mileage data and the specific fuel consumption data from section 4.2.2 it is possible to estimate expenditure on petrol and diesel for a selection of engine size bands. For the purposes of comparison the overall mileage estimate of 15,832 km per annum for petrol cars is used for each engine size band. A petrol price of €1.15 is assumed and the results of the exercise are multiplied by 20% to arrive at on road fuel consumption as opposed to the combined urban and extra urban test values. Table 20 presents the results and the wide variation in cost and fuel consumption can be seen. The difference between the lowest and highest category is €675 (489 litres) per annum. The consumer will also have to factor in higher insurance and motor tax rates if a larger car is purchased. Table 20 Estimates of Petrol Expenditure and Consumption by Engine Size Band
Petrol
Engine Size Band
Estimated Fuel Consumption
per annum Litres
Estimated Fuel Cost
per annum €
< 0.9 litre 858 1,184
0.9 -1.2 litre 891 1,229
1.2 -1.5 litre 1,023 1,412
1.5 -1.7 litre 1,147 1,583
1.7 - 1.9 litre 1,203 1,661
> 1.9 litre 1,347 1,859
Source: Based on DEHLG and NCT Data
Table 21 presents estimates of the different emissions categories of petrol vehicle examined in section 4.3 and it can be seen there is an 85% difference in consumption between the lowest and the highest. In monetary terms, it costs on average €973 more per annum on petrol to run a car in the highest emission category than the lowest category. Table 21 Estimates of Petrol Expenditure and Consumption by Emissions Category
Vehicle Category
Petrol
Estimated Fuel Consumption
per annum Litres
Estimated Fuel Cost
per annum €
<=130gCO2/km 830 1,146
131-150gCO2/km 940 1,298
151-170gCO2/km 1,061 1,464
171-190gCO2/km 1,182 1,631
191-210gCO2/km 1,330 1,836
Over 210gCO2/km 1,536 2,119
Source: Based on DEHLG and NCT Data
Table 22 shows the results of the analysis for diesel cars. Average mileage for diesel cars was 24,255 km and a diesel price of €1.10 per litre was assumed. As was the case for petrol cars the results were multiplied by a factor of 1.2 in order to get on road consumption. The range between the highest and lowest bands is €695 (527 litres). Table 22 Estimates of Diesel Expenditure and Consumption by Engine Size Band
Diesel
Engine Size Band
Estimated Fuel Consumption
per annum Litres
Estimated Fuel Cost
per annum €
1.2 -1.5 litre 1,168 1,542
1.5 -1.7 litre 1,248 1,648
1.7 - 1.9 litre 1,397 1,844
> 1.9 litre 1,695 2,237
Source: Based on DEHLG and NCT Data
Finally, Table 23 presents estimates of the different emissions categories of diesel vehicle examined in section 4.3 and it can be seen there is a 92% difference in consumption between the lowest and the highest. In monetary terms, it costs on average €1405 more per annum on diesel to run a car in the highest emission category than the lowest category.
47
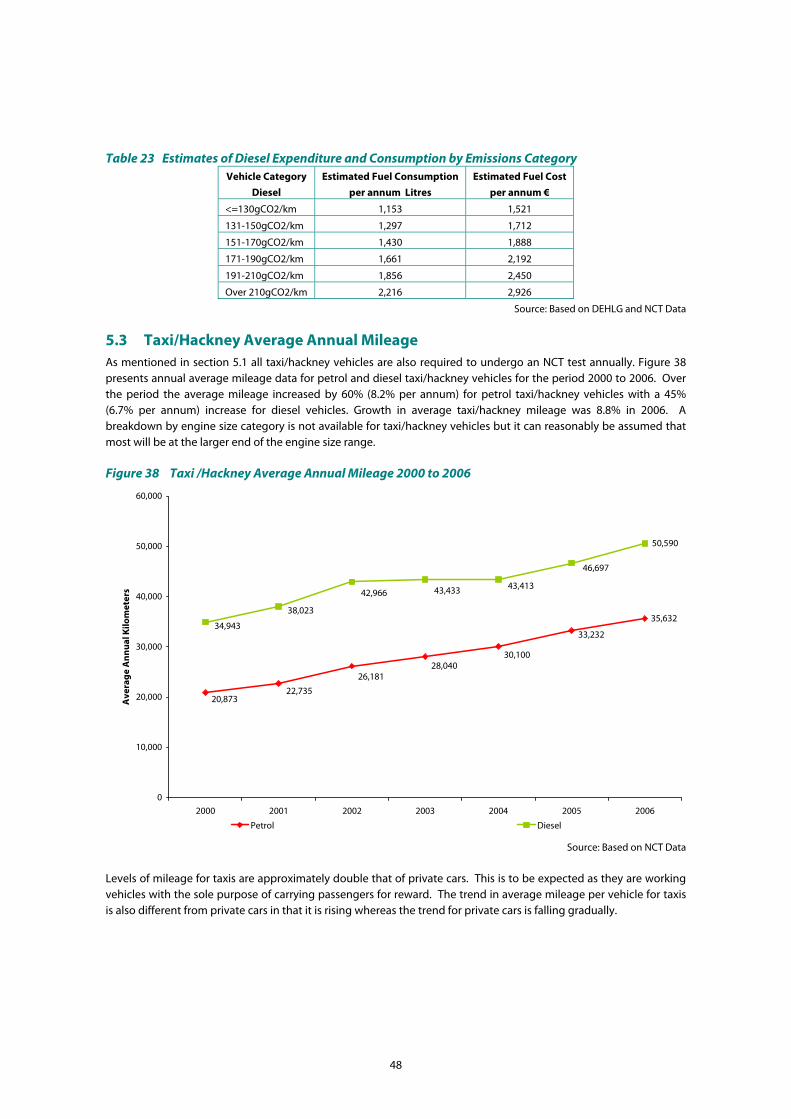
Table 23 Estimates of Diesel Expenditure and Consumption by Emissions Category Vehicle Category
Diesel
Estimated Fuel Consumption
per annum Litres
Estimated Fuel Cost
per annum €
<=130gCO2/km 1,153 1,521
131-150gCO2/km 1,297 1,712
151-170gCO2/km 1,430 1,888
171-190gCO2/km 1,661 2,192
191-210gCO2/km 1,856 2,450
Over 210gCO2/km 2,216 2,926
Source: Based on DEHLG and NCT Data
5.3 Taxi/Hackney Average Annual Mileage As mentioned in section 5.1 all taxi/hackney vehicles are also required to undergo an NCT test annually. Figure 38 presents annual average mileage data for petrol and diesel taxi/hackney vehicles for the period 2000 to 2006. Over the period the average mileage increased by 60% (8.2% per annum) for petrol taxi/hackney vehicles with a 45% (6.7% per annum) increase for diesel vehicles. Growth in average taxi/hackney mileage was 8.8% in 2006. A breakdown by engine size category is not available for taxi/hackney vehicles but it can reasonably be assumed that most will be at the larger end of the engine size range. Figure 38 Taxi /Hackney Average Annual Mileage 2000 to 2006
35,632
50,590
30,100
33,232
28,04026,181
22,73520,873
46,697
43,413
38,023
42,966 43,433
34,943
0
10,000
20,000
30,000
40,000
50,000
60,000
2000 2001 2002 2003 2004 2005 2006
Ave
rag
e A
nn
ual
Kilo
met
ers
Petrol Diesel
Source: Based on NCT Data
Levels of mileage for taxis are approximately double that of private cars. This is to be expected as they are working vehicles with the sole purpose of carrying passengers for reward. The trend in average mileage per vehicle for taxis is also different from private cars in that it is rising whereas the trend for private cars is falling gradually.
48
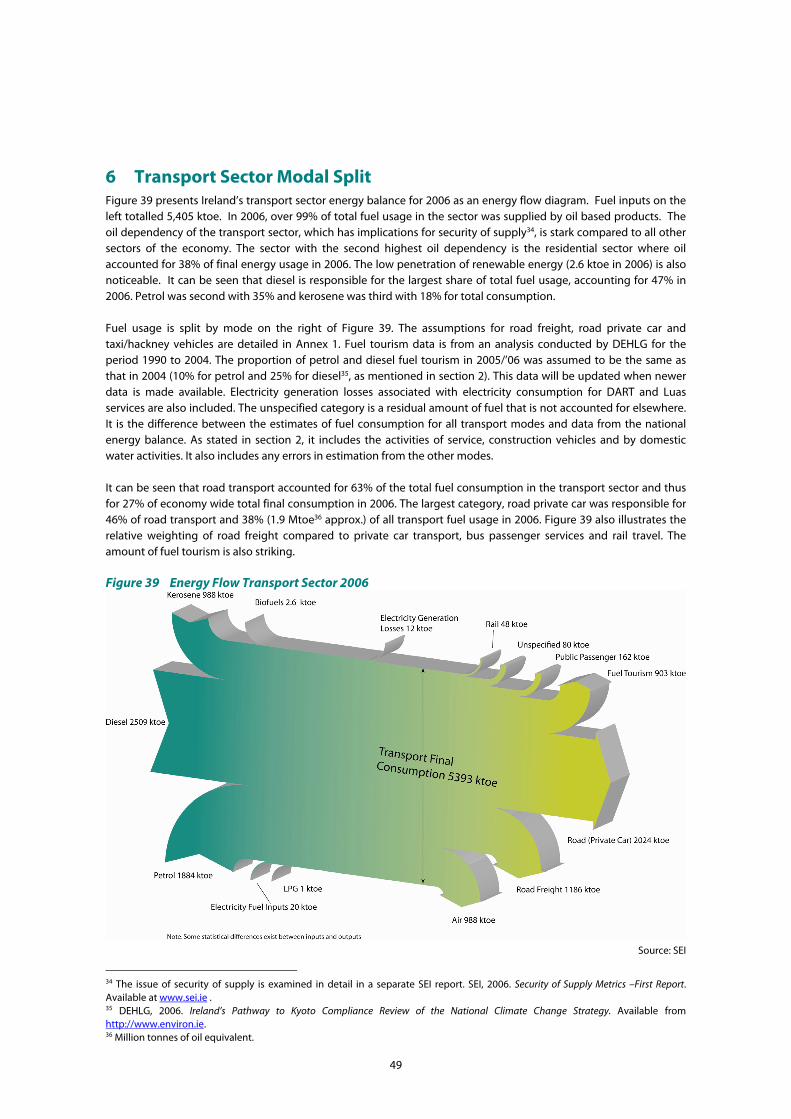
6 Transport Sector Modal Split Figure 39 presents Ireland’s transport sector energy balance for 2006 as an energy flow diagram. Fuel inputs on the left totalled 5,405 ktoe. In 2006, over 99% of total fuel usage in the sector was supplied by oil based products. The oil dependency of the transport sector, which has implications for security of supply34, is stark compared to all other sectors of the economy. The sector with the second highest oil dependency is the residential sector where oil accounted for 38% of final energy usage in 2006. The low penetration of renewable energy (2.6 ktoe in 2006) is also noticeable. It can be seen that diesel is responsible for the largest share of total fuel usage, accounting for 47% in 2006. Petrol was second with 35% and kerosene was third with 18% for total consumption.
Fuel usage is split by mode on the right of Figure 39. The assumptions for road freight, road private car and taxi/hackney vehicles are detailed in Annex 1. Fuel tourism data is from an analysis conducted by DEHLG for the period 1990 to 2004. The proportion of petrol and diesel fuel tourism in 2005/’06 was assumed to be the same as that in 2004 (10% for petrol and 25% for diesel35, as mentioned in section 2). This data will be updated when newer data is made available. Electricity generation losses associated with electricity consumption for DART and Luas services are also included. The unspecified category is a residual amount of fuel that is not accounted for elsewhere. It is the difference between the estimates of fuel consumption for all transport modes and data from the national energy balance. As stated in section 2, it includes the activities of service, construction vehicles and by domestic water activities. It also includes any errors in estimation from the other modes.
It can be seen that road transport accounted for 63% of the total fuel consumption in the transport sector and thus for 27% of economy wide total final consumption in 2006. The largest category, road private car was responsible for 46% of road transport and 38% (1.9 Mtoe36 approx.) of all transport fuel usage in 2006. Figure 39 also illustrates the relative weighting of road freight compared to private car transport, bus passenger services and rail travel. The amount of fuel tourism is also striking.
Figure 39 Energy Flow Transport Sector 2006
Source: SEI
34 The issue of security of supply is examined in detail in a separate SEI report. SEI, 2006. Security of Supply Metrics –First Report. Available at www.sei.ie . 35 DEHLG, 2006. Ireland’s Pathway to Kyoto Compliance Review of the National Climate Change Strategy. Available from http://www.environ.ie. 36 Million tonnes of oil equivalent.
49
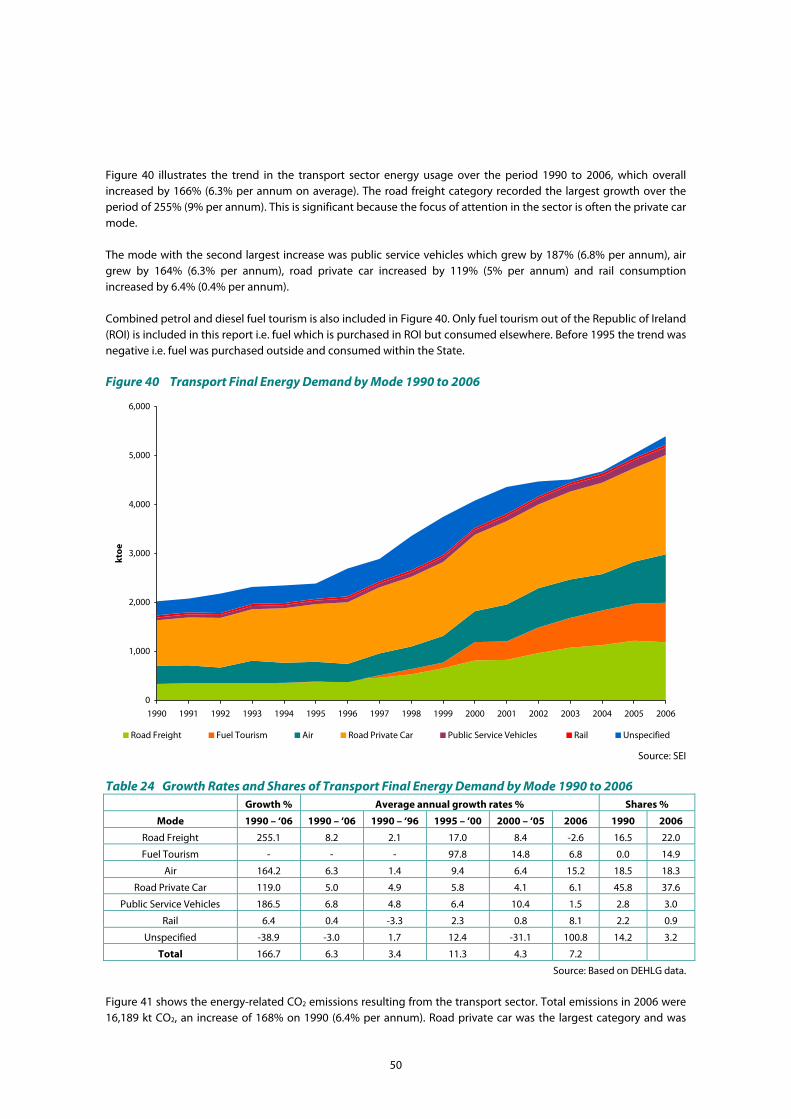
Figure 40 illustrates the trend in the transport sector energy usage over the period 1990 to 2006, which overall increased by 166% (6.3% per annum on average). The road freight category recorded the largest growth over the period of 255% (9% per annum). This is significant because the focus of attention in the sector is often the private car mode. The mode with the second largest increase was public service vehicles which grew by 187% (6.8% per annum), air grew by 164% (6.3% per annum), road private car increased by 119% (5% per annum) and rail consumption increased by 6.4% (0.4% per annum). Combined petrol and diesel fuel tourism is also included in Figure 40. Only fuel tourism out of the Republic of Ireland (ROI) is included in this report i.e. fuel which is purchased in ROI but consumed elsewhere. Before 1995 the trend was negative i.e. fuel was purchased outside and consumed within the State. Figure 40 Transport Final Energy Demand by Mode 1990 to 2006
0
1,000
2,000
3,000
4,000
5,000
6,000
1990 1991 1992 1993 1994 1995 1996 1997 1998 1999 2000 2001 2002 2003 2004 2005 2006
kto
e
Road Freight Fuel Tourism Air Road Private Car Public Service Vehicles Rail Unspecified
Source: SEI
Table 24 Growth Rates and Shares of Transport Final Energy Demand by Mode 1990 to 2006
Growth % Average annual growth rates % Shares %
Mode 1990 – ‘06 1990 – ‘06 1990 – ‘96 1995 – ‘00 2000 – ‘05 2006 1990 2006
Road Freight 255.1 8.2 2.1 17.0 8.4 -2.6 16.5 22.0
Fuel Tourism - - - 97.8 14.8 6.8 0.0 14.9
Air 164.2 6.3 1.4 9.4 6.4 15.2 18.5 18.3
Road Private Car 119.0 5.0 4.9 5.8 4.1 6.1 45.8 37.6
Public Service Vehicles 186.5 6.8 4.8 6.4 10.4 1.5 2.8 3.0
Rail 6.4 0.4 -3.3 2.3 0.8 8.1 2.2 0.9
Unspecified -38.9 -3.0 1.7 12.4 -31.1 100.8 14.2 3.2
Total 166.7 6.3 3.4 11.3 4.3 7.2
Source: Based on DEHLG data.
Figure 41 shows the energy-related CO2 emissions resulting from the transport sector. Total emissions in 2006 were 16,189 kt CO2, an increase of 168% on 1990 (6.4% per annum). Road private car was the largest category and was
50
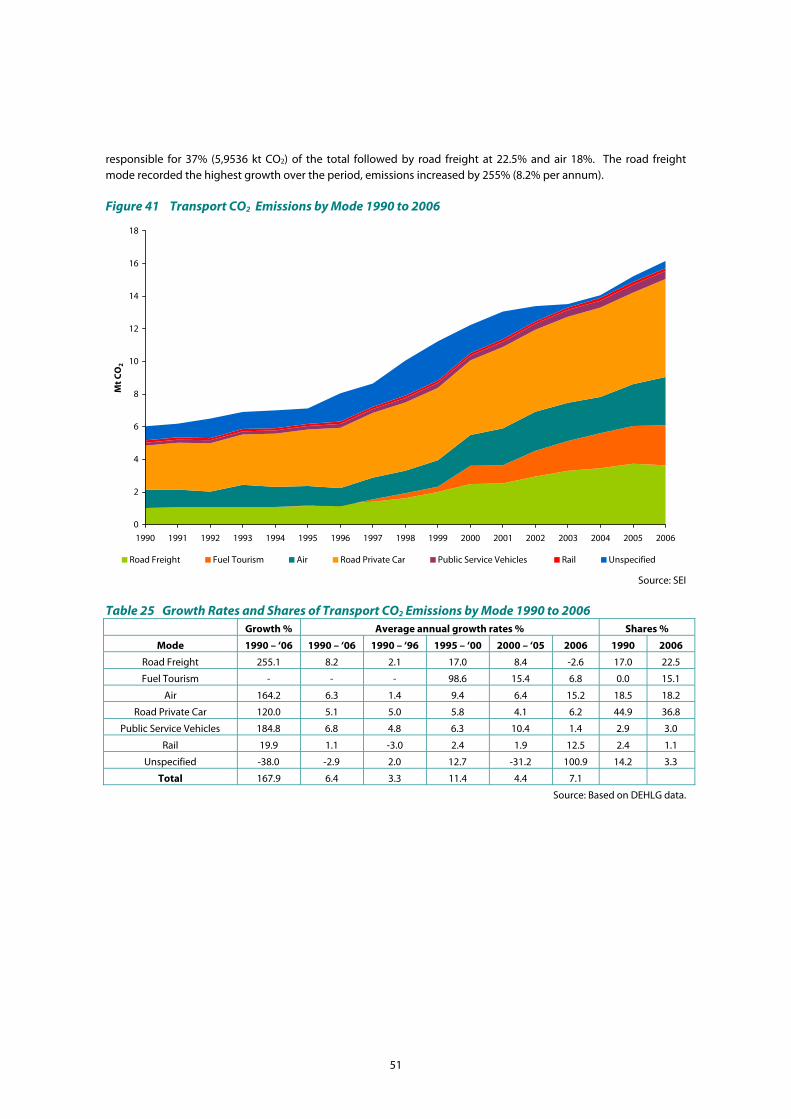
responsible for 37% (5,9536 kt CO2) of the total followed by road freight at 22.5% and air 18%. The road freight mode recorded the highest growth over the period, emissions increased by 255% (8.2% per annum). Figure 41 Transport CO2 Emissions by Mode 1990 to 2006
0
2
4
6
8
10
12
14
16
18
1990 1991 1992 1993 1994 1995 1996 1997 1998 1999 2000 2001 2002 2003 2004 2005 2006
Mt C
O2
Road Freight Fuel Tourism Air Road Private Car Public Service Vehicles Rail Unspecified
Source: SEI
Table 25 Growth Rates and Shares of Transport CO2 Emissions by Mode 1990 to 2006
Growth % Average annual growth rates % Shares %
Mode 1990 – ‘06 1990 – ‘06 1990 – ‘96 1995 – ‘00 2000 – ‘05 2006 1990 2006
Road Freight 255.1 8.2 2.1 17.0 8.4 -2.6 17.0 22.5
Fuel Tourism - - - 98.6 15.4 6.8 0.0 15.1
Air 164.2 6.3 1.4 9.4 6.4 15.2 18.5 18.2
Road Private Car 120.0 5.1 5.0 5.8 4.1 6.2 44.9 36.8
Public Service Vehicles 184.8 6.8 4.8 6.3 10.4 1.4 2.9 3.0
Rail 19.9 1.1 -3.0 2.4 1.9 12.5 2.4 1.1
Unspecified -38.0 -2.9 2.0 12.7 -31.2 100.9 14.2 3.3
Total 167.9 6.4 3.3 11.4 4.4 7.1
Source: Based on DEHLG data.
51

7 International Comparison The EU has a voluntary agreement with car manufacturers to reduce the average emission of new cars to below 140 g CO2/km by 2008/’09. In this context it is useful to compare how Ireland is doing compared with its neighbours in Europe with regard to fuel efficiency of new cars entering the fleet each year and the average CO2 emissions per kilometre from these cars.
7.1 Specific fuel consumption of new cars (test values) Figure 42 presents the progress in overall specific fuel consumption of new cars in the EU-15, Ireland and the highest and lowest of the available data. Note data is not available for all years but is sufficient to demonstrate the progress and Ireland’s position relative to the other countries. The dataset used here is from the ODYSSEE project. Figure 42 Comparison of Specific Consumption of New Cars - Overall
4.0
5.0
6.0
7.0
8.0
9.0
10.0
1990 1991 1992 1993 1994 1995 1996 1997 1998 1999 2000 2001 2002 2003 2004 2005 2006
Test
Sp
ecif
ic F
uel
Co
nsu
mp
tio
n (l
itre
/100
km)
EU15 Ireland Sweden Norway
Source: Odyssee & SEI
As the figures shown in Figure 42 are overall figures they mask the different proportions of petrol and diesel vehicles in each country. However, it does show that Ireland is close to the EU average although until 2006 progress had been very flat. Figure 43 shows the situation for petrol cars. Here Ireland has been consistently below the EU average but from 2000 to 2005 very little progress is seen in reducing fuel consumption. Sweden is has the highest consumption on average and Italy the lowest.
52
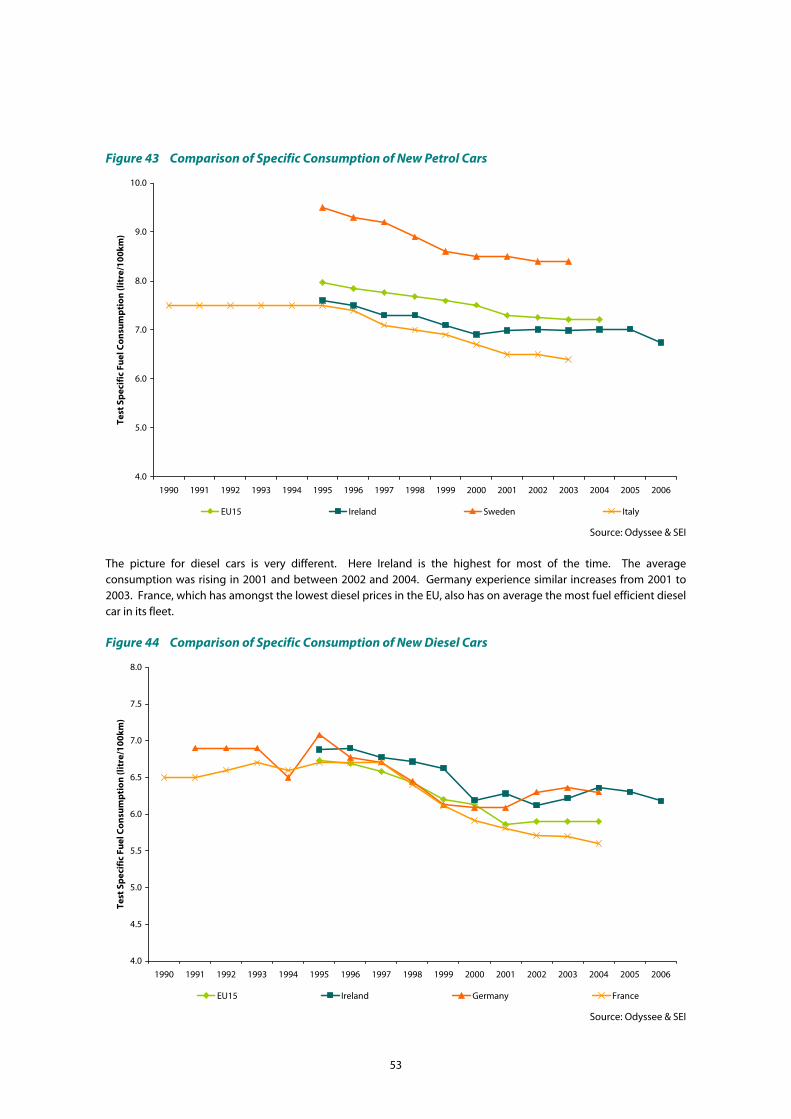
Figure 43 Comparison of Specific Consumption of New Petrol Cars
4.0
5.0
6.0
7.0
8.0
9.0
10.0
1990 1991 1992 1993 1994 1995 1996 1997 1998 1999 2000 2001 2002 2003 2004 2005 2006
Test
Sp
ecif
ic F
uel
Co
nsu
mp
tio
n (l
itre
/100
km)
EU15 Ireland Sweden Italy
Source: Odyssee & SEI
The picture for diesel cars is very different. Here Ireland is the highest for most of the time. The average consumption was rising in 2001 and between 2002 and 2004. Germany experience similar increases from 2001 to 2003. France, which has amongst the lowest diesel prices in the EU, also has on average the most fuel efficient diesel car in its fleet. Figure 44 Comparison of Specific Consumption of New Diesel Cars
4.0
4.5
5.0
5.5
6.0
6.5
7.0
7.5
8.0
1990 1991 1992 1993 1994 1995 1996 1997 1998 1999 2000 2001 2002 2003 2004 2005 2006
Test
Sp
ecif
ic F
uel
Co
nsu
mp
tio
n (l
itre
/100
km)
EU15 Ireland Germany France
Source: Odyssee & SEI
53

7.2 CO2 emissions of new cars (test values) Comparing the average CO2 test values of new cars removes the problems of trying to compare the different characteristics of petrol and diesel cars and their weighting in the car fleet. Also it is against this measure that the voluntary agreement with car manufacturers will be measured. The EU figure in 2004 was approx 163 g CO2/km37. Ireland’s figure in 2006 was 161 g CO2/km. Figure 45 Comparison of Test CO2 Emission of New Cars38
100
110
120
130
140
150
160
170
180
190
200
1995 1996 1997 1998 1999 2000 2001 2002 2003 2004 2005 2006
Test
CO
2 em
issi
on
(CO
2 g
/km
)
EU15 Ireland
Source: EU Commission & SEI
37 Implementing the Community Strategy to Reduce CO2 Emissions from Cars: Sixth Annual Communication on the effectiveness of the strategy, Communication from the Commission to the Council and the European Parliament, COM(2006) 463 Final, Brussels, 2006. 38 The EU data refers to passenger cars (which includes taxis etc) while the Irish data refers specifically to cars registered as private for the purposes of road tax.
54

8 Conclusions The transport sector in Ireland is a significant fuel consumer, accounting for 34% (5,487 ktoe) of Ireland’s primary energy demand in 200639 or 41% of final energy demand, consuming more than twice as much as industry. The sector was responsible for 34% (16,189 kt CO2) of Ireland’s energy related CO2 emissions, higher than any of the other sectors. Energy use in the transport sector has grown by 167% (6.3% per annum on average) between 1990 and 2006. It is the fastest growing sector in terms of energy demand and CO2 emissions. In 2006, energy use in transport was over 99% dependent on oil products, all of which are imported. This has clear implications for Ireland’s security of energy supply. The sector is therefore key to Ireland’s Greenhouse Gas (GHG) emissions targets and there is a clear incentive for policy makers to implement programmes that will mitigate demand for transport energy. Timely and comprehensive data on energy trends is needed in order to inform policy development and this report aims to provide such data. This is an update of the transport report published in 2006 that provided new analysis and information regarding transport energy use drawing on vehicle registration data and for the first time National Car Test (NCT) mileage data. This report introduces a new ODEX energy efficiency indicator for transport, a new weighted energy efficiency indicator for new cars, additional data on second-hand car imports, an improved methodology for mining the NCT odometer data and some of the analysis carried out for SEI’s submission to the public consultation on changing the vehicle registration tax and annual road tax. New data is also presented on the shares and growth of petrol and diesel cars by engine size. The report also identifies key data gaps that need to be filled in order to have a comprehensive understanding of energy and CO2 trends in the transport sector. For example, further research is required to assess the amount of fuel consumption in air transport. Estimates of road freight fuel consumption and fuel tourism also need to be improved upon. SEI gratefully acknowledges the co-operation of the following organisations for providing the data that made this analysis
possible.
Department of Transport National Car Test Service
Department of the Environment, heritage and Local Government Dublin Airport Authority
Iarnród Éireann
39 Note that 2006 data are provisional.
55

Data Sources Central Statistics Office, Skehard Road, Cork. www.cso.ie Department of the Environment, Heritage and Local Government, Custom House, Dublin 1. www.environ.ie Department of Trade and Industry. 1 Victoria Street, London SW1H 0ET www.dti.gov.uk The Directorate-General for Energy and Transport, Brussels. http://ec.europa.eu/dgs/energy_transport/index_en.html Dublin Airport Authority. Dublin Airport. www.daa.ie. EU funded SAVE II Odyssee Project http://www.odyssee-indicators.org/ Eurostat, Luxembourg. http://epp.eurostat.cec.eu.int/portal/page?_pageid=1090,30070682,1090_33076576&_dad=portal&_schema=PORTAL Iarnród Éireann, Inchicore Dublin 8. www.irishrail.ie. National Car Test Service, Lakedrive 3026, Citywest Business Campus, Nass Road, Dublin 24. www.ncts.ie. Road Safety Authority, Moy Business Park, Primrose Hill, Ballina, Co. Mayo Revenue Commissioners, Dublin Castle, Dublin 2. http://www.revenue.ie. Vehicle Certification Agency, 1 The Eastgate Office Centre, Eastgate Road Bristol. BS5 6XX. http://www.vca.gov.uk/fcb/new-car-fuel-consump.asp
56
References Bosseboeuf, D. Personal Communication, 2006. Between SEI and Mr. Didier Bosseboeuf, ADEME. Central Statistics Office, 2007. CSO Statistical Yearbook 2006. Available from CSO, Skehard Road, Cork or www.cso.ie. Central Statistics Office, Various Years. Road Freight Surveys. Available from CSO, Skehard Road, Cork or www.cso.ie. Department of the Environment, Heritage and Local Government, 2006. Ireland’s Pathway to Kyoto Compliance Review of the National Climate Change Strategy. Available from http://www.environ.ie. Department of Trade and Industry, 2006. International Vehicle Statistics. Available from www.dti.gov.uk. Euractive, 2006. Biofules in Transport. Available from http://www.euractiv.com/en/energy/biofuels-transport/article-152282 European Union, 1999. Commission Recommendation on the reduction of CO2 emissions from passenger cars. Available from http://ec.europa.eu/environment/co2/99125/en.pdf European Union, 2000. Commission Recommendation on the reduction of CO2 emissions from passenger cars. Available from http://ec.europa.eu/environment/co2/00304/en.pdf European Union, 2000 Commission Recommendation on the reduction of CO2 emissions from passenger cars. Available from http://ec.europa.eu/environment/co2/00303/en.pdf European Union, 2003. Directive 2003/30/EC of the European Parliament and of the council on the promotion of the use of biofuels or other renewable fuels for transport. Available from http://europa.eu.int/eur-lex/pri/en/oj/dat/2003/l_123/l_12320030517en00420046.pdf European Union, 2003. Directive 2003/96/EC on restructuring the Community framework for the taxation of energy products and electricity. Available from http://ec.europa.eu/energy/res/legislation/doc/biofuels/taxation_energy_products_and_electricity.pdf European Union, 2006. An EU Strategy for Biofules. Available from http://ec.europa.eu/agriculture/biomass/biofuel/index_en.htm European Union, 2006. Biomass Action Plan. Available from http://ec.europa.eu/energy/res/biomass_action_plan/index_en.htm Government of Ireland, 2007, Delivering a Sustainable Energy Future for Ireland – Government White Paper, http://www.dcmnr.gov.ie/NR/rdonlyres/54C78A1E-4E96-4E28-A77A-3226220DF2FC/27356/EnergyWhitePaper12March2007.pdf International Energy Agency, 2006. Energy Technology Perspectives Scenarios & Strategies to 2050. See www.iea.org for details. Ó Gallachóir B.P. and Howley M., 2004. Changing Fleet Structure versus Improved Engine Performance – Energy and CO2 Efficiency of New Cars Entering the Irish Fleet. Available from http://www.ucc.ie/ucc/depts/civil/staff/brian/VAFSEP.pdf Sustainable Energy Ireland, 2003. Energy and CO2 efficiency in transport – analysis of new car registrations in year 2000. Available from www.sei.ie. Sustainable Energy Ireland, 2004. Liquid biofuels strategy study for Ireland. Available from www.sei.ie
57
Sustainable Energy Ireland, 2005. Energy in Ireland 1990 – 2004 Trends, issues and indicators. Available from www.sei.ie. Sustainable Energy Ireland, 2006. Security of Supply Metrics –First Report. Available from www.sei.ie . Sustainable Energy Ireland, 2006. Policy incentive options for liquid biofuels. Available from www.sei.ie Transport and Environment, 2006. T&E Bulletin. The data is available from: http://www.transportenvironment.org/docs/Bulletin/2006/2006-05_bulletin148_web.pdf. United National Economic Commission for Europe, 2006. The Statistical Yearbook of the Economic Commission for Europe 2000. Available from www.unece.org. Vehicle Registration Unit, Various Years, Irish Bulletin of Vehicle and Driver Statistics. Available from http://www.environ.ie/DOEI/DOEIPub.nsf/wvNavView/RegularPublications?OpenDocument&Lang=en#I5
58

Annex Fuel Consumption Methodology This report in section 4 referred to new estimates of fuel consumption for private cars, taxi /hackney vehicles and for goods vehicles. This section details the methodology for each of these estimates.
A.1 Private Car and Taxi /Hackney Fuel Consumption This section uses the mileage data, as explained in section 5.2 and 5.3 and the specific fuel consumption data from section 4.2.3 to estimate the total amount of fuel that is consumed by:
• Petrol and diesel private cars and, • Petrol and diesel taxi /hackney vehicles.
For private cars the methodology was as follows: fuel specific consumption data (combined cycle) for each engine size band was multiplied by the corresponding per car mileage estimate from the analysis of NCT data and then by the number of cars to get the total number of litres of petrol and diesel consumed. This was then multiplied by a factor of 1.2 to get on road consumption as opposed to data from the test cycle. Data was converted to ktoe. As data is only available for the period 2000 to 2006, estimates were extrapolated back to 1990 by assuming that the average per car fuel consumption for this period remained constant over the period 1990 to 2000. While this may not be the case it is currently considered to be the best available method of estimating fuel consumption back to 1990. The estimate of per car fuel consumption was multiplied by the total number of cars per year. For taxis /hackneys, fuel specific consumption data for each engine size band was not available so instead an average of the four largest private car petrol and diesel engine size bands was used. It is believed that this is a reasonable assumption as taxi /hackneys will most likely have larger engine sizes. Another difference from the private car methodology was that the urban test cycle was used for taxi /hackneys. The fuel specific consumption average was multiplied by the corresponding per taxi /hackney mileage estimate from the analysis of NCT data and then by the number of cars to get the total number of litres of petrol and diesel consumed. Estimates were extrapolated back to 1990 by assuming that the average per taxi /hackney fuel consumption for the period 2000 to 2006 remained constant over the period 1990 to 2000. The estimate of per car fuel consumption was multiplied by the total number of taxi /hackneys per year.
A.2 Road Freight Fuel Consumption For the period 1990 to 2004, EU-15 averages for the amount of fuel used by road freight per tonne kilometer, in kilograms of oil equivalent (kgoe/tkm), are available from the Odyssee40 project. Multiplying these values by the total number of road freight tkm from various iterations of CSO’s Road Freight Survey41 gives yearly estimates for the total amount of energy consumed by the mode. The EU-15 average is available for the period 1991 to 2004 and further estimates have been made for 1990 and 2005 to complete the modal split for the period as a whole. Specifically, for 1990 the total number of tkm is taken to be the same as 1991. This is then multiplied by the EU-15 fuel consumption. For 2005 EU-15 fuel use per tonne kilometre data are not available so 2004 data is used as a proxy until 2005 data is available. These estimates will be developed further and improved upon in subsequent reports.
40 Odyssee is a cross European project which develops and maintains a database of energy efficiency indicators. More information can be found at http://www.odyssee-indicators.org/. 41 Full details are available from www.cso.ie.
59

Sustainable Energy Ireland is funded by the Irish Governmentunder the National Development Plan 2007-2013 withprogrammes part financed by the European Union
Sustainable Energy IrelandEnergy Policy Statistical Support UnitBuilding 2200Cork Airport Business ParkCo. Cork Ireland
T. +353 21 4547050F. +353 21 4547059
Sustainable Energy IrelandGlasnevinDublin 9Ireland
T. +353 1 8369080F. +353 1 8372848
Related Documents