i FINE6150: Forecasting Assignment Analysis of the Encana Corporation Spin-off of Cenovus Energy Prepared for: Prof. Karen Chiykowski

Encana Cenovus Financial Analysis
Dec 15, 2015
This is Encana Cenovus Financial Analysis and a comparison of both the companies
Advanced Corporate Finance
Advanced Corporate Finance
Welcome message from author
This document is posted to help you gain knowledge. Please leave a comment to let me know what you think about it! Share it to your friends and learn new things together.
Transcript
i
FINE6150: Forecasting Assignment
Analysis of the Encana Corporation Spin-off of Cenovus Energy
Prepared for: Prof. Karen Chiykowski
2
Table of Contents
Executive Summary...................................................................................................................................... iIndustry Overview.......................................................................................................................................1EnCana Corporation: Company Overview...................................................................................................2EnCana Corp: Capital Structure, Dividend Policy, Share Structure..............................................................2EV/EBITDA Comparison...............................................................................................................................2Cenovus Spin-off Time Line.........................................................................................................................3Rationale for Spinoff....................................................................................................................................3Reorganization............................................................................................................................................5
Assets to EnCana (GasCo)........................................................................................................................5Assets to Cenovus (IOCo).........................................................................................................................5
Balance Sheet......................................................................................................................................6Deal Structure..............................................................................................................................................6
Share value..............................................................................................................................................7Announcement – May 2008....................................................................................................................7Proceeding with Spin off – September 10, 2009......................................................................................7Shareholder value estimates – September 10, 2009...............................................................................7
Multiples..............................................................................................................................................7Discounted Cash Flow..........................................................................................................................8
Actual Trading post split up – Dec 3, 2009...............................................................................................8Post Spin-off Performance...........................................................................................................................8Share price performance after Spin-off.......................................................................................................9Conclusion – did it create value.................................................................................................................10Appendices................................................................................................................................................11
Appendix A: Porter 5 Forces and Industry Risk Assessment..................................................................11Appendix B: Encana Corporation Capital Structure Summary...............................................................12Appendix C: EnCana and Cenovus Dividend Policy Review....................................................................12Appendix D: Share Ownership at Announcement.................................................................................13Appendix E: EnCana Valuation Analysis.................................................................................................15Appendix F: Benefits of the Spin-off......................................................................................................16Appendix G: Location of assets to EnCana (GasCo)...............................................................................17Appendix H: EnCana (Pre-Spin-off) Value chain.....................................................................................18Appendix I: Location of assets to Cenovus (IOCo)..................................................................................19Appendix I: Location of assets to Cenovus (IOCo)..................................................................................19Appendix J: Breakup of Encana balance sheet into Encana and Cenovus..............................................20Appendix K: Breakdown of shareholder value in May 2008..................................................................21Appendix L: Proceeding with Spin-off in September 10, 2009...............................................................22Appendix M: Shareholder value estimates – September 10, 2009........................................................23
Multiples Approach...........................................................................................................................23DCF Approach....................................................................................................................................27
Appendix X: Actual Trading post split up - Dec 3, 2009.........................................................................30Appendix X: Encana business unit performance....................................................................................31Appendix X: Cenovus business unit performance..................................................................................31Appendix X: Consolidated Financial Performance Post Split.................................................................32
3
Appendix X: Combined post-split firm trading values does not demonstrate much change in shareholder value..................................................................................................................................33Appendix X: The TSX has outperformed the combined firms since the split in 2009.............................34Appendix X: Monthly total returns of the independent firms are less volatile THIS IS MARGINAL, remove/restate.....................................................................................................................................35
References.................................................................................................................................................36

i
Executive Summary
EXEC SUMMARY HERE
1
Industry Overview
The Oil & Gas Industry in North America in 2008 was riding an all-time high, driven by soaring
commodity prices. (1) In addition, all indications are that the industry will continue to grow based on
international demand for oil and domestic demand for natural gas. (1) These high commodity prices are
driving producers to consider previously commercially unviable reserves, such as shale gas. In the
natural gas market, it is expected (in 2009) that the growing demand will outplace the massive reserves
that shale gas represents.
Given the intense capital investment nature of the industry, the sector is dominated by large
international firms. In North America, a small group of large scale producers lead the market including:
EnCana, Exxon Mobile and Imperial Oil. (1) In addition to the large leaders, the market is populated by
second tier players. Despite the varying size of the firms in the industry, there is one truth in the
industry that profitability is tied back to reserves quality and production rates. (1)
The industry structure is described via a Porter 5 forces in Appendix A. However, the highlights
of this analysis show that there is a high degree of rivalry within the industry (due to the fact that firms
must constantly seek out new reserves) and a low threat of new entrants (due to the intense capital
investments required).
Lastly, a high-level industry risk assessment is presented in Appendix A. Although the industry is
rife with potential risks, the single biggest external determinant of risk is commodity pricing. (1) Swings
in commodity prices can have massive impacts on the profitability of the firms within the industry. This
is an especially concerning issue, as the firms have little to no ability to offset this risk, given the massive
capital outlays required to get reserves to the production phase. Firms are typically required to run
production when a site reaches maturity, independent of commodity pricing, with output only being
controlled. (1)
EnCana Corporation: Company Overview
Company details – Sean
2
EnCana Corp: Capital Structure, Dividend Policy, Share Structure
Prior to the spin-off Encana Corp. had a debt-to-equity ratio of 0.46 (2)and a targeted net debt-
to-capitalization ratio of between 30 and 40 percent and a net debt to adjusted EBITDA of 1.0 to 2.0
times at the time of the announcement of the spin-off. (3)
In 2008, prior to the Cenovus spin-off Encana paid a dividend of $1.60/share. (4) This was in-
line with the dividend payout for 2007 (4), however EnCana has stated consistently that it would flex
dividends to maintain the desired capital structure (5). Reviewing the Dividend ratio (Appendix B), it
appears that despite the statements in the annual reports to the contrary, EnCana was trying to
maintain a consistent dividend/share.
At the time the spin-off was announced, EnCana only had a single share class and hence all
shares were voting shares. (6) No information is available regarding who owned shares at the time of
the transaction, but as the issue was never raised in the press, it is assumed that it was widely held, as it
was in 2012 and 2010 (Appendix D). In addition, in reviewing the notes of the 2008 and 2007 annual
report, no risks associated with a majority shareholder or controlling interest was highlighted. (2) (4)
EV/EBITDA Comparison
NEEDS WORK
At the time of the announcement of the deal the Encana shares were underpriced with a
EV/EBITDA valuation of 16.38 as compared to 18.86 for its peers. And the multiple further plummeted to
5.35 as compared to its peers multiple of 1.277 as of Dec-2008. We calculated the EV/EBITDA multiple
for 2009 till 2011 and found that significant value was realized for both the new entities. The Encana,
had a EV/EBITDA multiple of 91.69 in 2011 (but this was primarily due to an impairment of $1 billion in
the year 2011, but even if we consider the impairment into consideration the multiple stands at 21.91)
and Cenovus had the EV/EBITDA multiple of 18.99. The EV/EBITDA multiple for the peers was 8.55 for
the year 2011.
3
Cenovus Spin-off Time Line
The timeline for the spin-off transaction is noted above. Of note, EnCana was able to raise
enough funds through private offerings and new debt securities, that it did not require bridge financing
to complete the transaction.
Date 11-May-08 (3) 30-Sep-08 (7) 15-Oct-08 (8) 4-May-09 (9) 16-Jul-09 (10) 11-Sep-09 (11)
Event
EnCana announces plan to spin-off oil company
EnCana announces the name of new gas company - Cenovus Energy Inc.
EnCana revises schedule for creation of Cenovus Energy due to financial markets uncertainty
EnCana completes US$500 million debt offering; this allows them to pay off debt whose convents does not allow for the spin-off
EnCana agrees to sell non-core Alberta properties for $632 million (C$707 million) to Bonavista Energy Trust with the goal of improving the value of their portfolio (divestiture target of $500M to $1B)
EnCana announces intent to use a plan of arrangement to complete spin-off of Cenovus Energy
Date 18-Sep-09 (12) 1-Oct-09 (13) 29-Oct-09 (14) 13-Nov-09 (15) 25-Nov-09 (16) 30-Nov-09 (17)
Event
EnCana subsidiary Cenovus Energy completes a US$3.5 billion private debt offering. Proceeds of the private offering will eliminate the need for the US$3 billion bridge credit facility.
EnCana holds first Analyst call focused on Cenovus
EnCana mails Arrangement Circular - “when issued” trading in EnCana and Cenovus shares to start November 2, 2009
Financial and operating information filed for Cenovus Energy and post-split EnCana
Shareholders overwhelmingly endorse plan of arrangement proposal
EnCana closes transaction to split into two distinct and independent companies
Rationale for Spinoff
EnCana spun-off Cenovus with the goal of creating value of shareholders. By creating two
independent companies, each with its own management and strategies best suited for its operations,
the ability to increase the shareholder value was maximized (3). The general thesis behind this value
creation relates to the underlying assets of the firm, specifically the properties. When the spin-off was
proposed, EnCana owned two distinct set of assets: 1) unconventional gas reserves, such as shale
reserves, which are much harder to develop into production capable sites 2) Conventional gas and oil
4
(both on shore and offshore) reserves and oil refineries (18). The basic logic behind the spin-off was that
in order to maximize the return on these assets, there needed to be different operating practices,
different capital management practices and focus from management. This rationale is supported by the
fact Natural gas is a North American continental market business, with limited shipments overseas. (19)
There is considerable price volatility in the business as unconventional sources of North American gas
may be realized in the near future, driving down prices. (20) In contrast, the Canadian oil sands are a
relatively stable resource with well defined reserves. Price is also a major point of uncertainty, but unlike
with gas there is no source of oil that may enter the market at a lower price point – price is primarily a
factor of demand. (21) The oil sands also have a better established international distribution network. It
was felt that the only way to achieve this result was through a spin-off (more akin to a split) of the
company.
The spin-off would result in EnCana focusing on unconventional Natural gas reserve
development, while a new firm (eventually named Cenovus) would focus on oil (offshore as well as oil
sands) and traditional gas reserves. These two firms would be lead by EnCana’s existing CEO and CFO
respectively. (3)
Lastly, the spin-off would offer Encana stakeholders several advantages. First, shareholders
could elect to own the business and the risks that suited them, instead of accepting both the business
model risks at once. The division also removed transfer pricing issues, as the oil sands are a major user
of natural gas in the production process.
Based on the general rationale that the EnCana assets had a lot of value and that the firm was
somewhat undervalued, when compared to industry peers, the most logical course of action was a spin-
off or to stay the course. Selling off any assets, when management believed the firm was undervalued,
would not result in a fair valuation from management’s perspective.
Lastly, a series of additional supporting arguments for a spin-off are presented in Appendix F.
5
Reorganization
The parent EnCana was divided along the operational lines to have minimal impact to the
employees, suppliers, stakeholders and day-to-day operations. Under the proposed transaction,
EnCana’s Integrated Oil Division and Canadian Plains Division will become IOCo. GasCo will contain the
Canadian Foothills Division, the USA Division, the Offshore & International Division and the midstream
assets. (3)
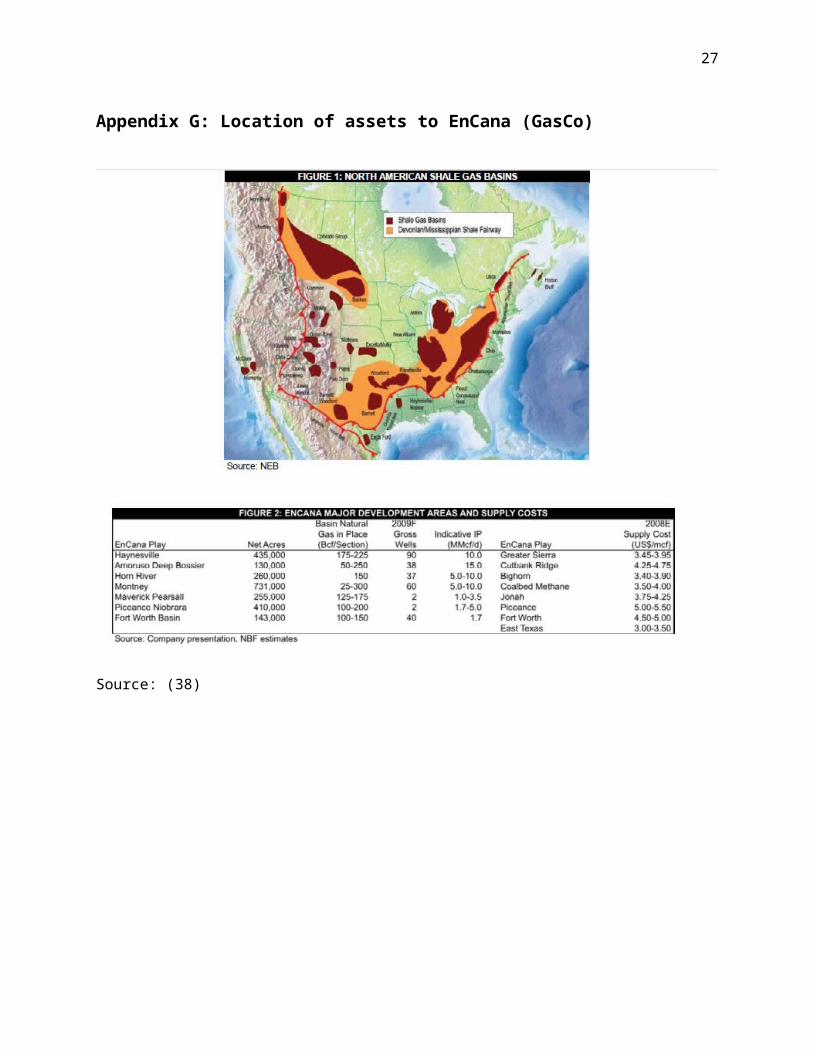
Assets to EnCana (GasCo)
GasCo will represent about two-thirds of parent EnCana’s current production and proved
reserves (11). Parent EnCana’s major operating divisions, Canadian Foothills and USA, were retained to
form a pure-play natural gas company, aimed at growing existing high-potential resource plays in
Canada and the United States (3). GasCo has a portfolio of current and emerging resource plays in key
basins in Alberta, British Columbia, Wyoming, Colorado, Texas, Louisiana and offshore Nova Scotia
(Appendix X). GasCo will hold the company’s portfolio of prolific gas resource plays: CBM (coalbed
methane) and Bighorn in Alberta, Cutbank Ridge and Greater Sierra in British Columbia, Jonah in
Wyoming, Piceance in Colorado and Fort Worth and East Texas in Texas (3). GasCo also achieved some
promising exploration results in a number of North American shale plays, such as Horn River in British
Columbia and the Haynesville shale in Louisiana, plus the Mannville CBM play in central Alberta, and
these plays have the potential to add significant depth to the company’s strong portfolio of natural gas
assets (3).
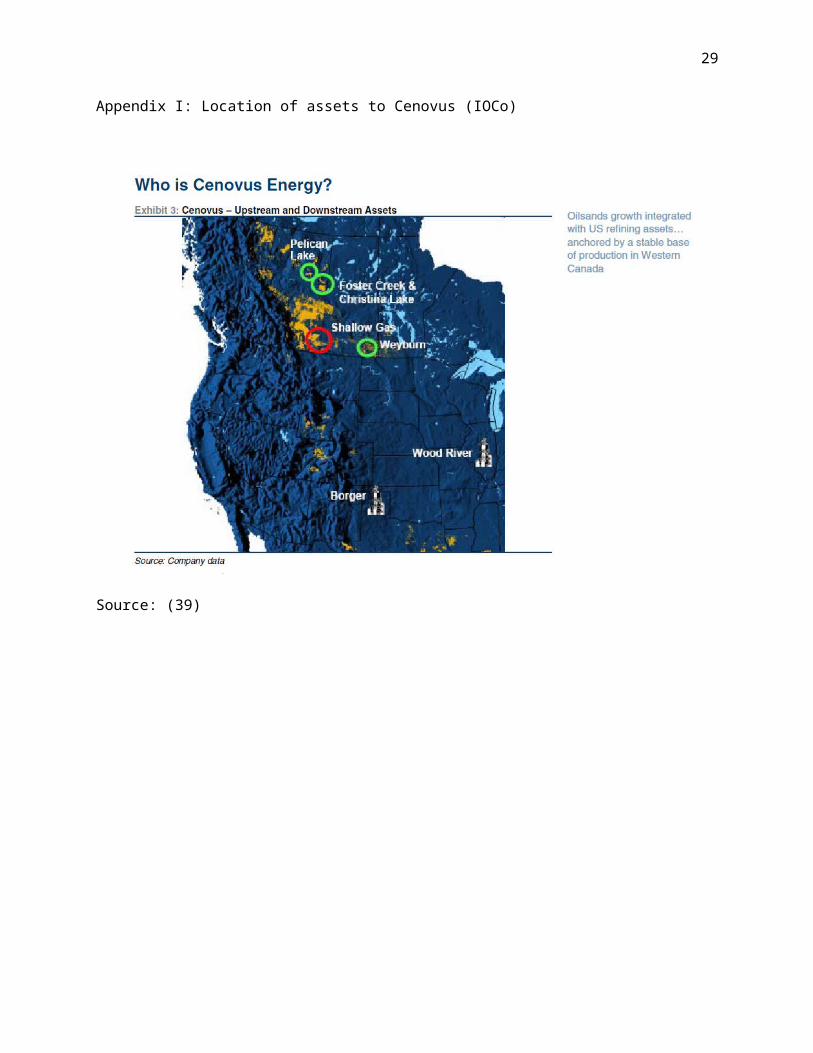
Assets to Cenovus (IOCo)
Cenovus’s assets contain parent EnCana’s Integrated Oil and Canadian Plains divisions and represent about
one third of EnCana’s current production and proved reserves (11). Assets were transferred to Cenovus with a
focus on the development of parent EnCana’s Canadian oil sands assets and refinery interests in the United
States, supported by a natural gas and oil production base in Alberta and Saskatchewan. Cenovus will also
capture the benefits of the full value chain (Appendix X) through EnCana’s integration of two producing
upstream Alberta oil sands assets – Foster Creek and Christina Lake, and two top-performing refineries at
6
Wood River in Illinois and Borger in Texas (Appendix X) (11). Cenovus’s assets will also include successful
enhanced oil developments at Pelican Lake in northern Alberta (3).
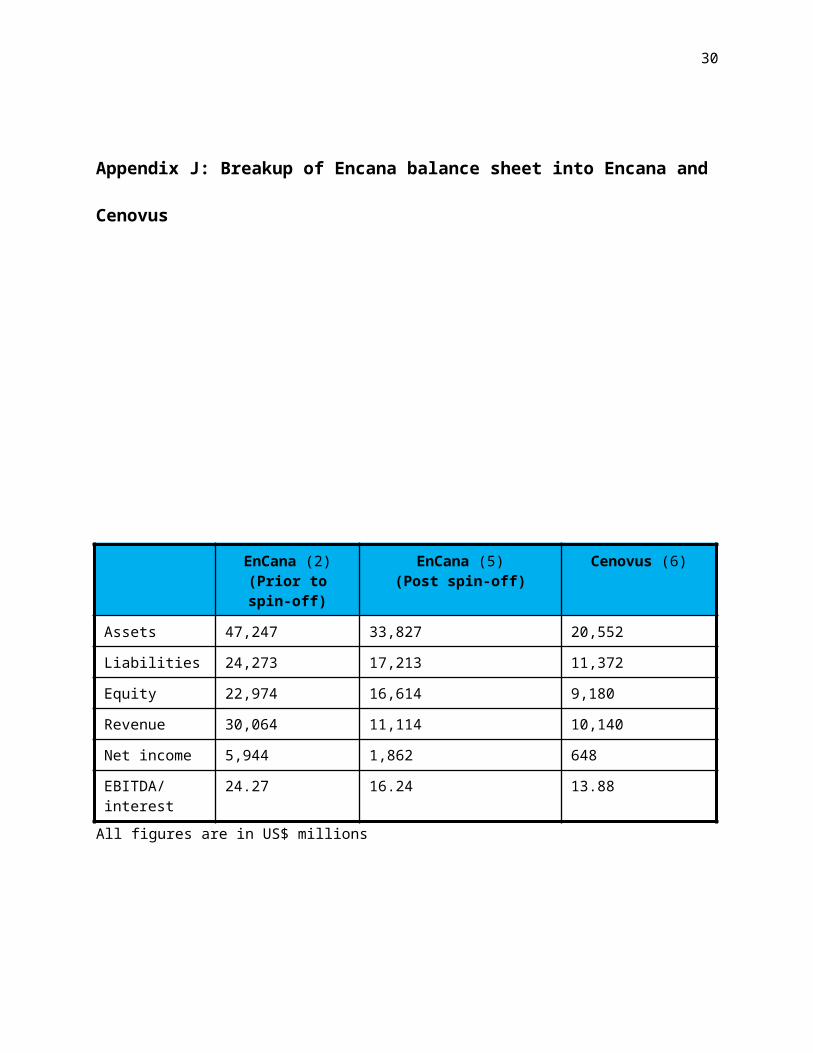
Balance Sheet
Depicting the above asset transfer in dollar values indicate that the parent company prior to transfer
had total assets worth $47.25B (2). Post split up EnCana retained $33.8B (5) worth of assets and $20.6B
(6) was transferred to Cenovus (Appendix X). The slight increase in the values of the assets for EnCana
was due to the cash ($3.5B) (11) received from the sale of its oil sands asset to Cenovus while a portion
of the goodwill was transferred from EnCana to Cenovus. The increase in asset base for Cenovus was
due to the step up in upstream and downstream refineries cost ($2.3B) (6).
Deal Structure
Under the Split Transaction, EnCana shareholders received one new EnCana Common Share and one
EnCana Special Share in exchange for each EnCana Common Share previously held (5). The book value of
EnCana's outstanding Common Shares immediately prior to the Split Transaction was attributed to the
new EnCana Common Shares and the EnCana Special Shares in direct proportion to the weighted
average trading price of the shares on a "when issued" basis. The value attributed to the new EnCana
Common Shares and the EnCana Special Shares was $2,360 million and $2,222 million, respectively (5).
The EnCana Special Shares were subsequently exchanged by EnCana shareholders for Common Shares
of Cenovus, thereby effecting the Split Transaction (5). Also, a committed and fully underwritten $3
billion non-revolving, 364-day, bridge financing was obtained from RBC Capital Markets to partially fund
the approximately $3.5 billion amount to be paid by Cenovus to EnCana to acquire the Cenovus assets
under the transaction (18). The Split Transaction reduced EnCana’s total Shareholders’ Equity due to a
reduction in Share capital of $2,222 million, a reduction in Retained earnings of $4,902 million and a
reduction in Accumulated other comprehensive income of $2,096 million. However, EnCana received
amounts due from Cenovus and invested the net proceeds of approximately $3.75 billion in short-term
marketable securities (5).
7
Share value
Announcement – May 2008
At the time of announcement in May, 2008, the closing share price of EnCana was $85.93. Owing to the
uncertainty and volatility of the global financial markets, EnCana decided to delay the spin off until clear
signs of stabilization returned to financial markets (8).
Proceeding with Spin off – September 10, 2009
Prior to the split up in September 2009, each shareholder who owned a share of parent EnCana would
have received $55.03 per share based on the closing share price of EnCana on Sept 10, 2009 ( Appendix
X). The drop in price was primarily due to the depressed state of the financial markets.
Shareholder value estimates – September 10, 2009
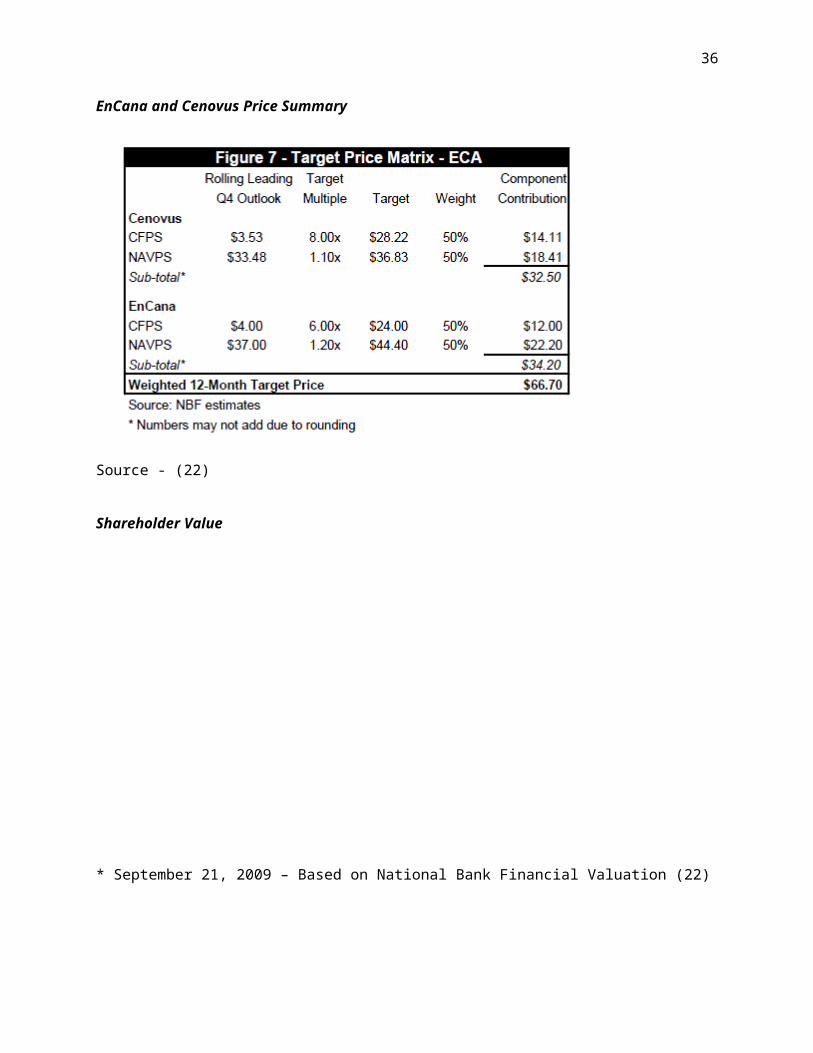
Multiples
National Bank Financial (22) estimated the share value of Cenovus and EnCana based on the Cash flow
method and the NAV method. An Equal weight of 50% was used and per share value was determined
based on comparable multiples. EnCana was valued at 6.0x Cash Flows and a P/NAV multiple of 1.2x was
used. Based on the two multiples, the par share price of EnCana was estimated to be $34.20. To further
account for valuation uncertainty, an additional discount of 0.7xNAV was factored and hence EnCana’s
share price was determined to be $27.54/share (Appendix X). Cenovus was valued using a P/CF multiple
of 8x and a P/NAV multiple of 1.10x. After accounting for valuation uncertainty (additional discount of
0.9xNAV), per share value of Cenovus was determined to be $30/share (Appendix X).
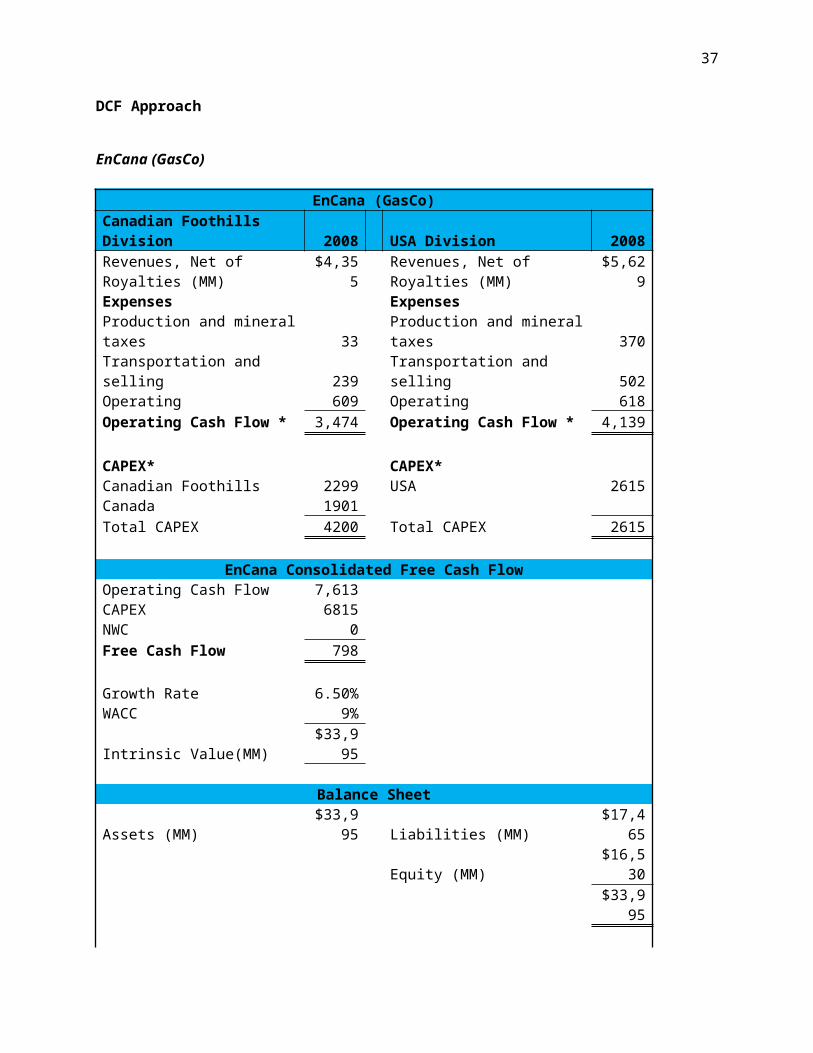
Discounted Cash Flow
A DCF analysis was performed based on the cash flows generated by operations transferred to Cenovus
and the operations retained by EnCana. The consolidated Free Cash flow based on operating cash flows
and necessary CAPEX for the Canadian Foothills division and USA division, both parts of EnCana (GasCo)
was $798MM (Appendix X). At an adjusted estimated growth rate of 6.50% (11) and WACC of 9% (23),
8
the intrinsic value was determined to be $33,395MM. After accounting for liabilities ($17,465MM), the
per share price of EnCana was determined to be $22 (Appendix X).
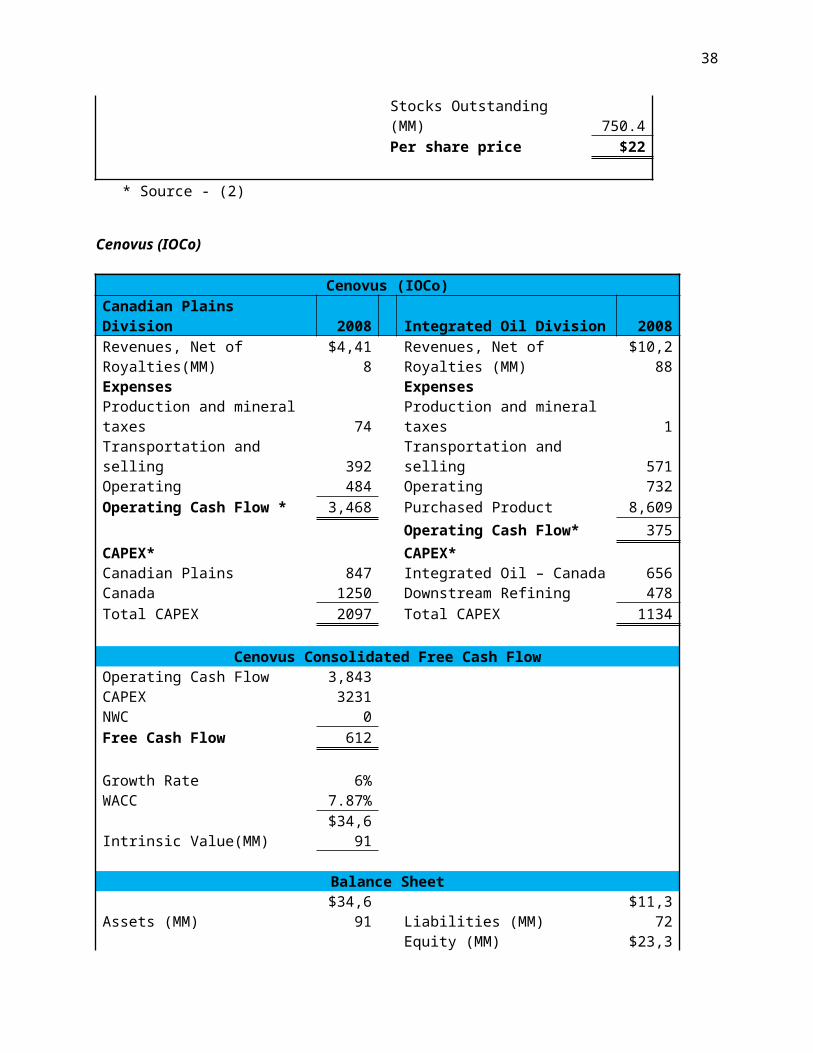
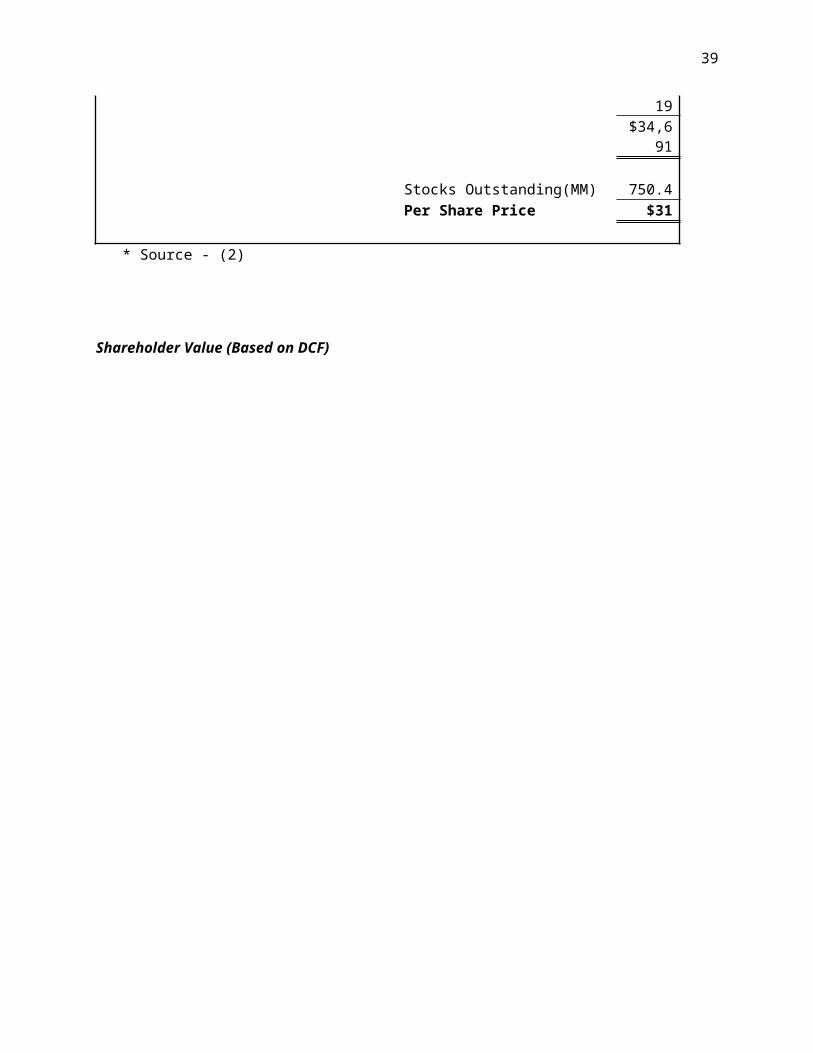
The consolidated Free Cash flow based on operating cash flows and necessary CAPEX for the Canadian
Plains division and Integrated Oil division, both parts of Cenovus (IOCo) was $612MM (Appendix X). At
an adjusted estimated growth rate of 6% (11) and WACC of 7.87% (24), the intrinsic value was
determined to be $34,691MM. After accounting for liabilities ($11,372MM), the per share price of
EnCana was determined to be $31 (Appendix X).
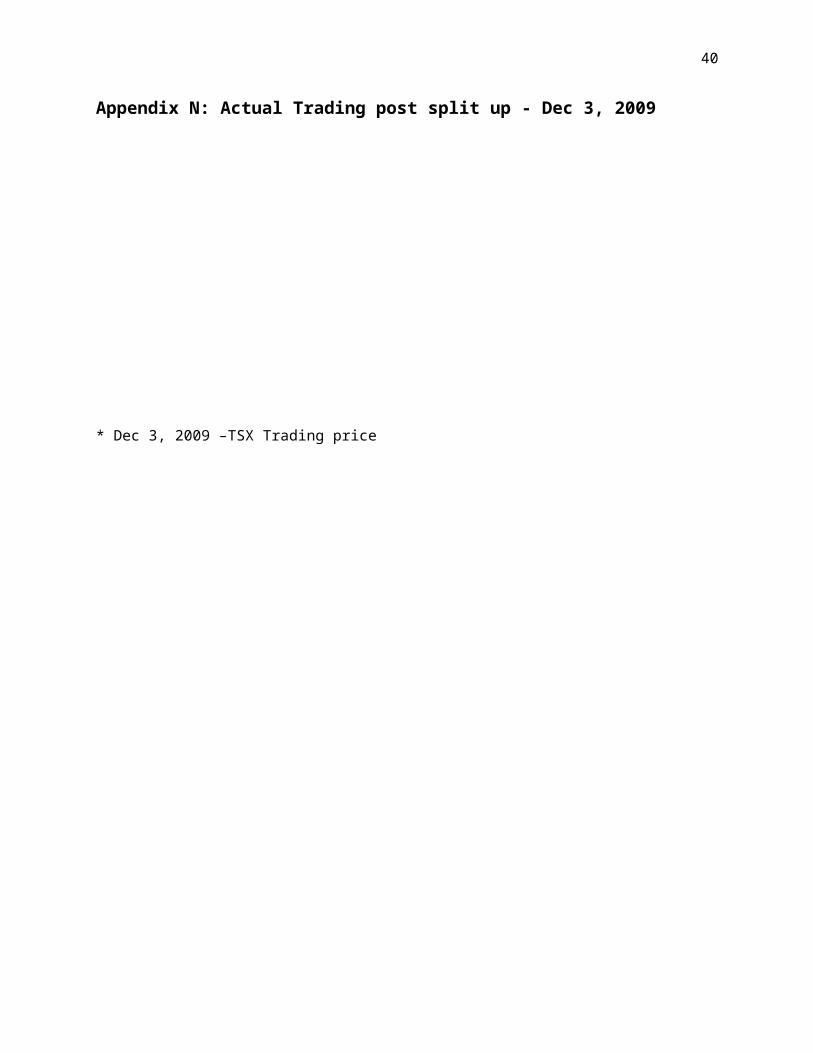
Actual Trading post split up – Dec 3, 2009
The stock price of the spun off companies did not appreciate much and the share price of EnCana was
$29.40/share and the share price of Cenovus was $26.75/share (Appendix X). The aggregated value to
share holder was $56.15 which was a meager 1.02% increase from $55.03 (as of September 10, 2009),
indicating that the market was expecting the split up for quite some time and factored in the price
already.
Post Spin-off Performance
On December 1, 2009 EnCana split into two companies. Post split, the two new companies appear to be
on different business trajectories. After a significant decline from 2008-2009, Encana revenues have not
made a major recovery, stalling at $8,467 in 2011, a 37% decline since 2008. Net income has also
dropped, with a corresponding decrease in profit margin. (Appendix X)
In contrast, Cenovus has experienced a faster revenue rebound, with 2011 revenue nearly back up to
levels that were experienced in 2008 for the operating units that would be spun off into Cenovus in
2009. Net income has also shown positive growth, although profit margin is lower than before.
(Appendix X)
Operational improvements from divesting unrelated businesses, such as Encana and Canovus, are often
cited as reasons for a divestiture. Based on a consolidated view of the two resulting companies, there is
9
little evidence of operational improvements from the split outweighing overall economic effects that
have occurred over time.
Revenue, driven by gains in the Cenovus component of the consolidated performance of the two firms,
is approaching the high water revenue mark set by the old Encana in 2008, indicating increased
performance as well as a potentially improving economic climate. However, expenses associated with
recovering resources and selling them have risen faster. Profit margin for the consolidated reports of
Encana and Canovus are still well below those reported before the 2009 split.
Balance sheet performance appears stable, with the two separate firms not making significant changes
to operating components of the business now that they have parted ways. Long term debt to equity or
long term asset ratios are both stable, indicating that capital structure, on the aggregate, has not
significantly changed. (Appendix X)
A loan payable of $3,750 payable to Encana was placed on Cenovus’ balance sheet upon separation. This
was paid in the same year, 2009. (6) There appears to be no ongoing relationship between the two
companies. Not 100% why this was done
Share price performance after Spin-off
The Encana – Cenovus split was handled by exchanging each share of Old Encana for one share each of
New Encana and Cenovus. This had the effect of significantly decreasing the share price of Encana, from
about $60 per share, which kept its ticker symbol, to about $30 per share. Cenovus began trading at
about $28 dollars per share, valuing the combined entities at approximately $58, similar to the
combined company’s previous level.
Based on the evolution of the companies’ share price since the split, the split of the two firms does not
appear to have increased shareholder value. On March 1st, 2013, the combined value of an Encana and
Cenovus share was $51.06, a decline of nearly $10 since just before the split.
10
Since the split, Encana has trended downwards, falling to a share price of $18.32 on March 1 st, 2013 and
significantly underperforming the TSX Index. Cenovus, on the other hand, has improved in value, rising
to $32.74 on March 1st, 2013.
On a consolidated basis, a shareholder of Encana just before the split would have slightly
underperformed the TSX as of March 1st, 2013. Indexed to 100 as of December 2nd, 2009, the TSX would
stand at 108.4 on March 1st while the pre-split Encana shareholder would hold an indexed value of 90.5.
This represents a loss over the period of 14.9% percent. Inclusive of dividends, representing a total
return perspective, the loss falls to 6.0%.
Is there a relative valuation story?
Conclusion – did it create value
text
11
Appendices
Appendix A: Porter 5 Forces and Industry Risk Assessment
PORTER
Industry Risk Assessment (1) (25)Risk Description
Commodity price fluctuations
Commodity pricing fluctuations can have a massive impact on a business’ ability to meet profit targets; Lowering commodity pricing can also make an owned reserve commercial unviable due to high development or production costs
F/X ExposureCommodity pricing typically done in USD, resulting in F/X fluctuations representing a potential risk for Canadian and Mexican operations or US firms shipping overseas
Asset Depletion Future financial performance is dependant on firms' ability to replace reserves that are constantly depleting
Reservoir CharacteristicsGeological and reservoir characteristics vary by site and can result in wide of production volumes – past success doesn’t impact future success
Reliance on 3rd Party OperatorsSeveral firms reliant on 3rd party operators (refineries, pipeline transportation, shipping lanes), which can create delays to market impacting cash flows
Environmental Regulation
Consistent trend in the industry for more and more regulation to be introduced; this increases production costs and can potentially make owned reserves not commercially viable (ex, risk of anti-fraking regulations)
Capital Requirements
The industry is very capital intensive and a lack of access to capital can have dramatic impacts on an operator, specifically limiting their ability to bring reservoirs to production phase
12
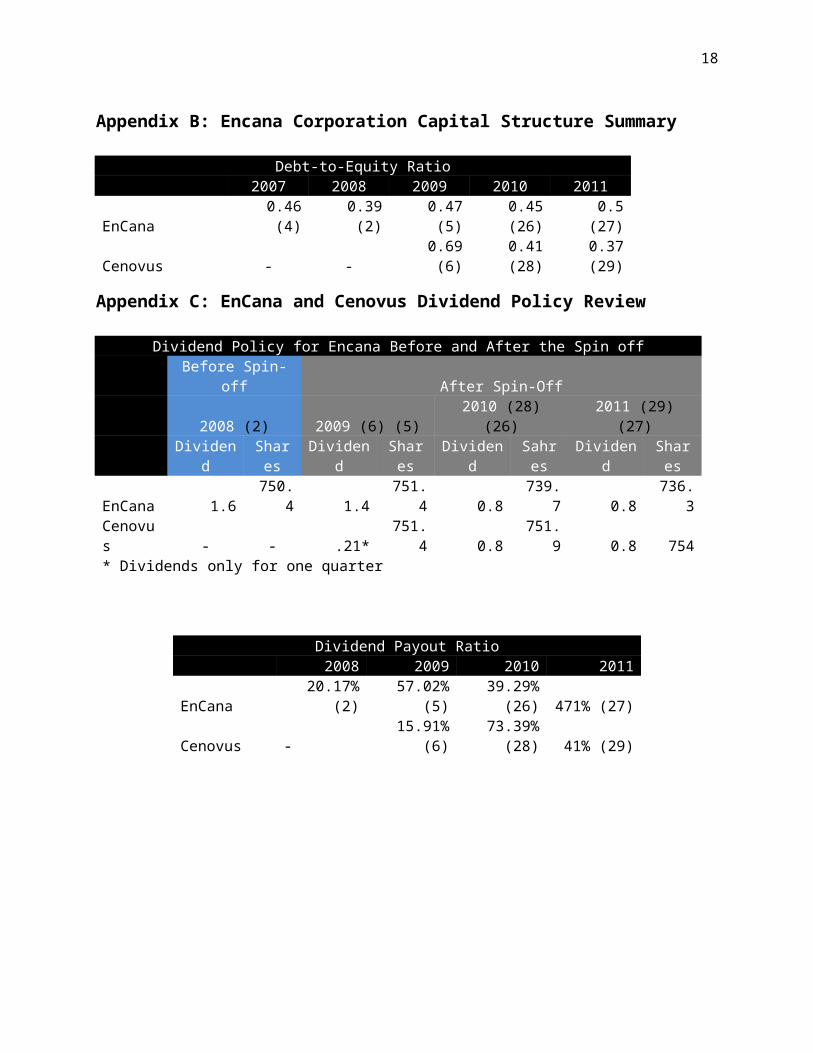
Appendix B: Encana Corporation Capital Structure Summary
Debt-to-Equity Ratio 2007 2008 2009 2010 2011EnCana 0.46 (4) 0.39 (2) 0.47 (5) 0.45 (26) 0.5 (27)Cenovus - - 0.69 (6) 0.41 (28) 0.37 (29)
Appendix C: EnCana and Cenovus Dividend Policy Review
Dividend Policy for Encana Before and After the Spin off Before Spin-off After Spin-Off 2008 (2) 2009 (6) (5) 2010 (28) (26) 2011 (29) (27) Dividend Shares Dividend Shares Dividend Sahres Dividend Shares
EnCana 1.6 750.4 1.4 751.4 0.8 739.7 0.8 736.3Cenovus - - .21* 751.4 0.8 751.9 0.8 754* Dividends only for one quarter
Dividend Payout Ratio 2008 2009 2010 2011EnCana 20.17% (2) 57.02% (5) 39.29% (26) 471% (27)Cenovus - 15.91% (6) 73.39% (28) 41% (29)
13
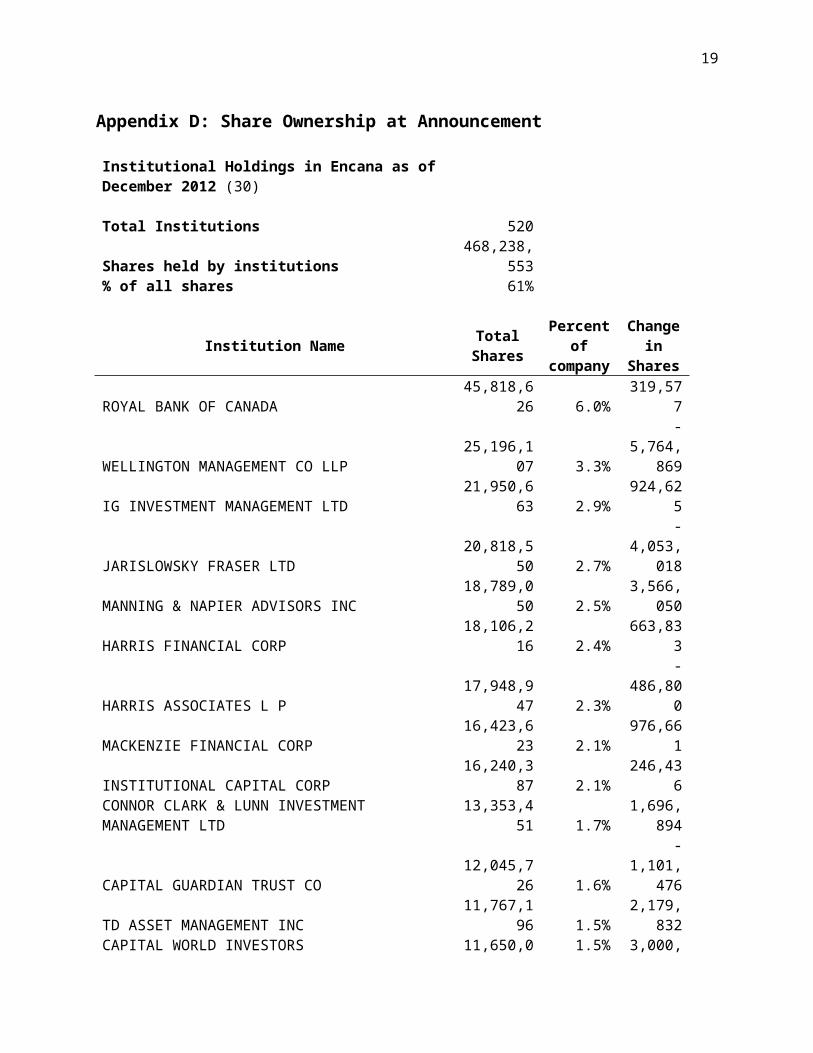
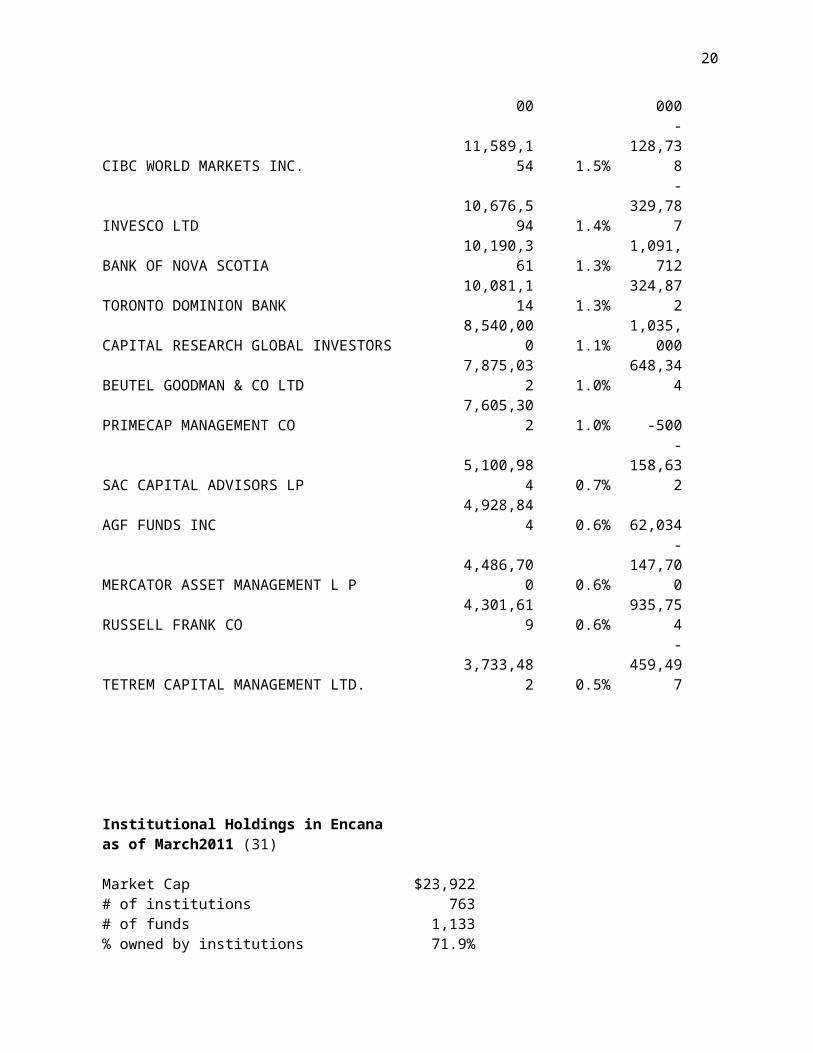
Appendix D: Share Ownership at Announcement
Institutional Holdings in Encana as of December 2012 (30)
Total Institutions 520
Shares held by institutions468,238,55
3% of all shares 61%
Institution NameTotal
Shares
Percent of
company
Change in Shares
ROYAL BANK OF CANADA 45,818,626 6.0% 319,577
WELLINGTON MANAGEMENT CO LLP 25,196,107 3.3%
-5,764,86
9IG INVESTMENT MANAGEMENT LTD 21,950,663 2.9% 924,625
JARISLOWSKY FRASER LTD 20,818,550 2.7%
-4,053,01
8
MANNING & NAPIER ADVISORS INC 18,789,050 2.5%3,566,05
0HARRIS FINANCIAL CORP 18,106,216 2.4% 663,833HARRIS ASSOCIATES L P 17,948,947 2.3% -486,800MACKENZIE FINANCIAL CORP 16,423,623 2.1% 976,661INSTITUTIONAL CAPITAL CORP 16,240,387 2.1% 246,436CONNOR CLARK & LUNN INVESTMENT MANAGEMENT LTD 13,353,451 1.7%
1,696,894
CAPITAL GUARDIAN TRUST CO 12,045,726 1.6%
-1,101,47
6
TD ASSET MANAGEMENT INC 11,767,196 1.5%2,179,83
2
CAPITAL WORLD INVESTORS 11,650,000 1.5%3,000,00
0CIBC WORLD MARKETS INC. 11,589,154 1.5% -128,738INVESCO LTD 10,676,594 1.4% -329,787
BANK OF NOVA SCOTIA 10,190,361 1.3%1,091,71
2TORONTO DOMINION BANK 10,081,114 1.3% 324,872
CAPITAL RESEARCH GLOBAL INVESTORS 8,540,000 1.1%1,035,00
0BEUTEL GOODMAN & CO LTD 7,875,032 1.0% 648,344PRIMECAP MANAGEMENT CO 7,605,302 1.0% -500
14
SAC CAPITAL ADVISORS LP 5,100,984 0.7% -158,632AGF FUNDS INC 4,928,844 0.6% 62,034MERCATOR ASSET MANAGEMENT L P 4,486,700 0.6% -147,700RUSSELL FRANK CO 4,301,619 0.6% 935,754TETREM CAPITAL MANAGEMENT LTD. 3,733,482 0.5% -459,497
Institutional Holdings in Encana as of March2011 (31)
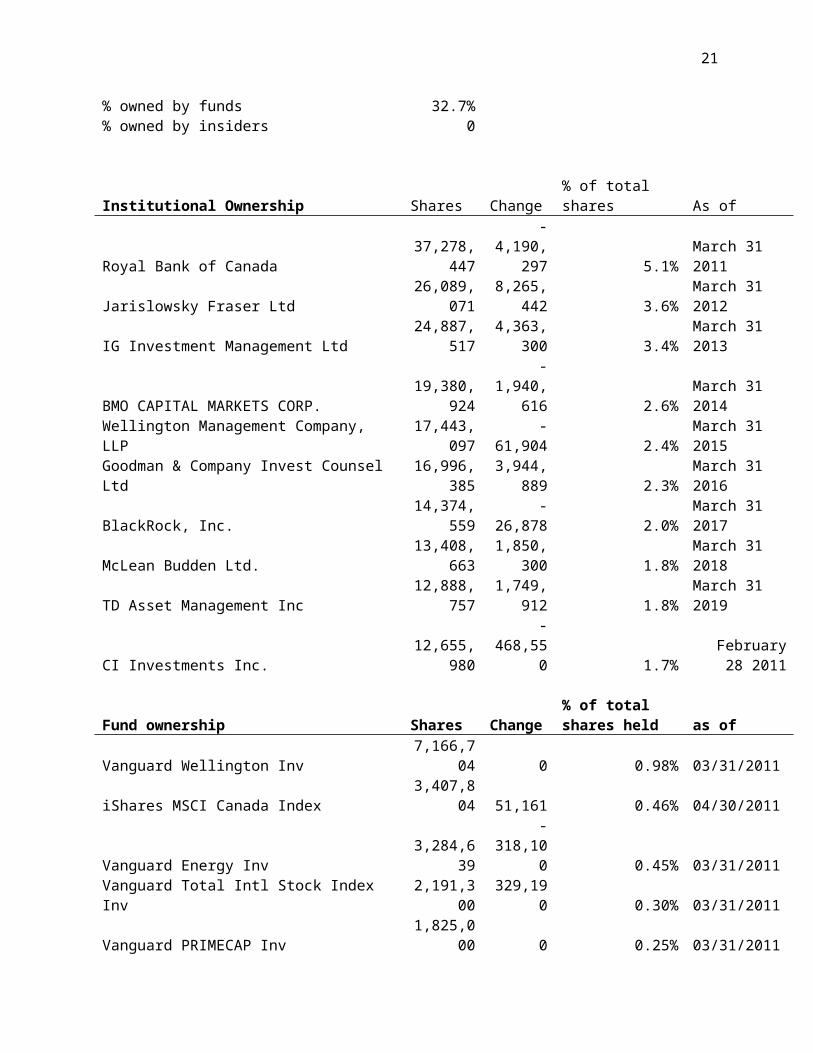
Market Cap $23,922# of institutions 763# of funds 1,133% owned by institutions 71.9%% owned by funds 32.7%% owned by insiders 0
Institutional Ownership Shares Change % of total shares As of
Royal Bank of Canada37,278,44
7
-4,190,29
7 5.1% March 31 2011
Jarislowsky Fraser Ltd26,089,07
18,265,44
2 3.6% March 31 2012
IG Investment Management Ltd24,887,51
74,363,30
0 3.4% March 31 2013
BMO CAPITAL MARKETS CORP.19,380,92
4
-1,940,61
6 2.6% March 31 2014
Wellington Management Company, LLP17,443,09
7 -61,904 2.4% March 31 2015
Goodman & Company Invest Counsel Ltd16,996,38
53,944,88
9 2.3% March 31 2016
BlackRock, Inc.14,374,55
9 -26,878 2.0% March 31 2017
McLean Budden Ltd.13,408,66
31,850,30
0 1.8% March 31 2018
TD Asset Management Inc12,888,75
71,749,91
2 1.8% March 31 2019
CI Investments Inc.12,655,98
0 -468,550 1.7%February 28
2011
15
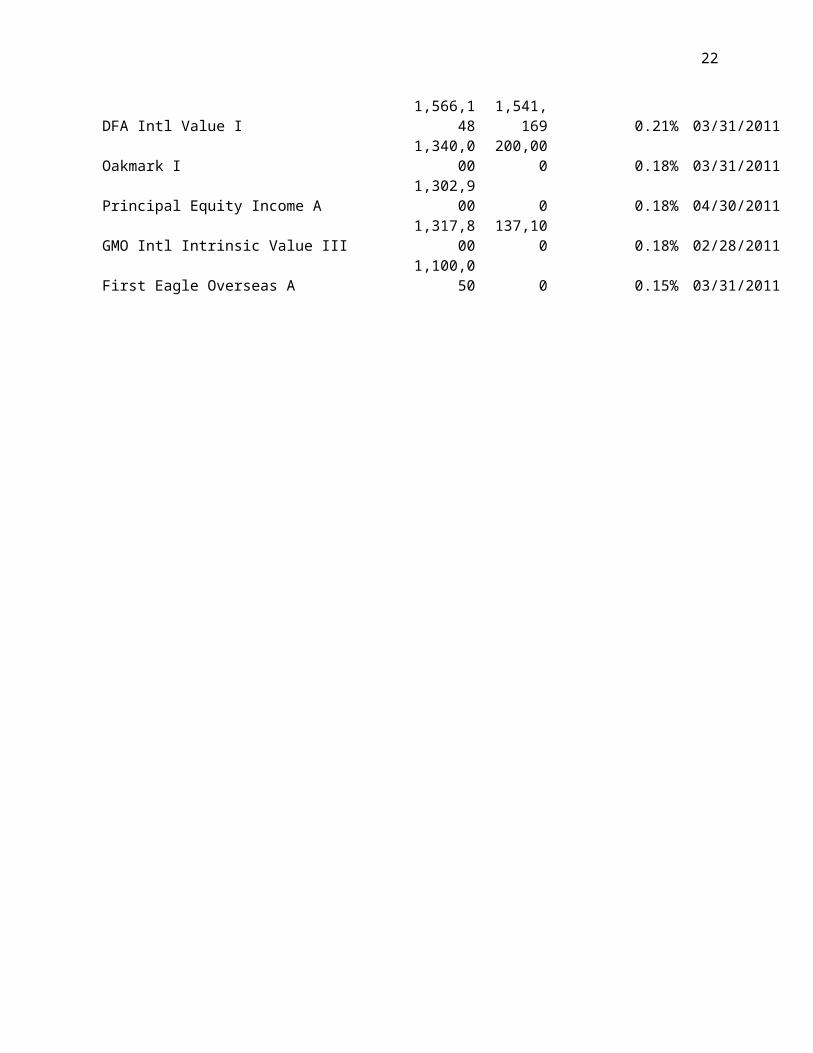
Fund ownership Shares Change% of total shares held as of
Vanguard Wellington Inv 7,166,704 0 0.98% 03/31/2011iShares MSCI Canada Index 3,407,804 51,161 0.46% 04/30/2011Vanguard Energy Inv 3,284,639 -318,100 0.45% 03/31/2011Vanguard Total Intl Stock Index Inv 2,191,300 329,190 0.30% 03/31/2011Vanguard PRIMECAP Inv 1,825,000 0 0.25% 03/31/2011
DFA Intl Value I 1,566,1481,541,16
9 0.21% 03/31/2011Oakmark I 1,340,000 200,000 0.18% 03/31/2011Principal Equity Income A 1,302,900 0 0.18% 04/30/2011GMO Intl Intrinsic Value III 1,317,800 137,100 0.18% 02/28/2011First Eagle Overseas A 1,100,050 0 0.15% 03/31/2011
16
Appendix E: EnCana Valuation Analysis
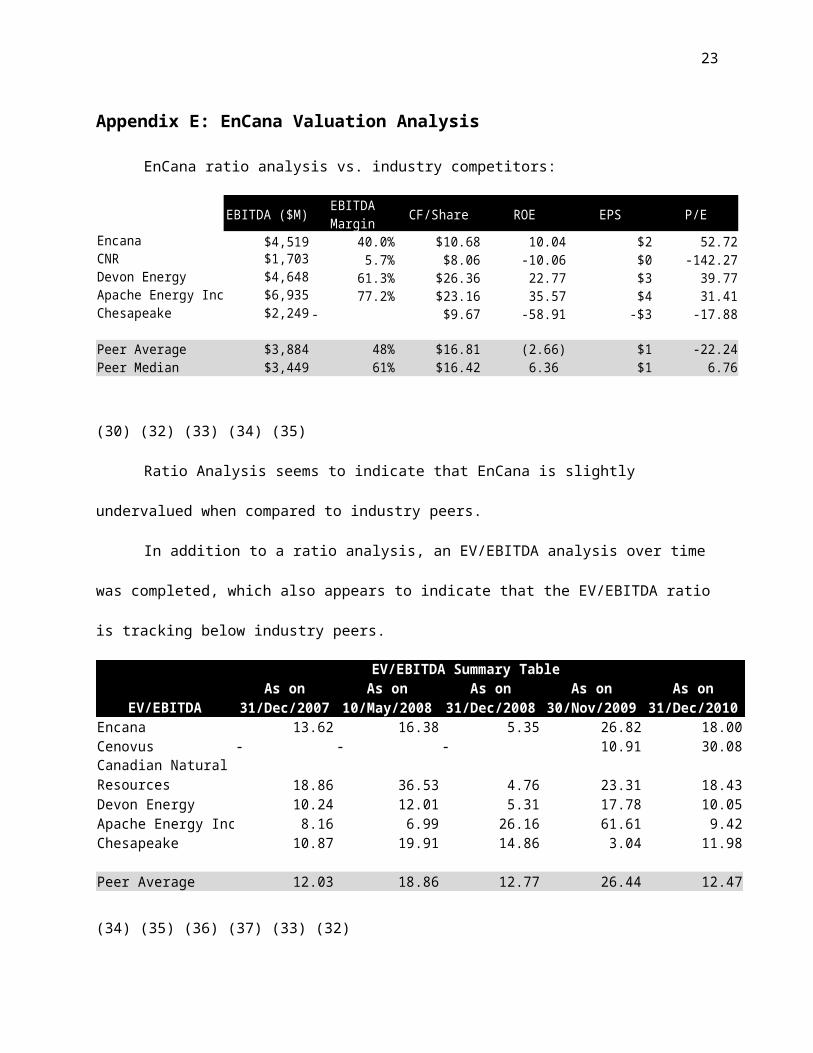
EnCana ratio analysis vs. industry competitors:
EBITDA ($M) CF/Share ROE EPS P/E EV/EBITDA
Encana $4,519 40.0% $10.68 10.04 $2 52.72 16.38CNR $1,703 5.7% $8.06 -10.06 $0 -142.27 36.53Devon Energy $4,648 61.3% $26.36 22.77 $3 39.77 12.01Apache Energy Inc $6,935 77.2% $23.16 35.57 $4 31.41 6.99Chesapeake $2,249 - $9.67 -58.91 -$3 -17.88 19.91
Peer Average $3,884 48% $16.81 (2.66) $1 -22.24 18.86Peer Median $3,449 61% $16.42 6.35 $1 6.76 15.96
As on 10/May/2008
EBITDA Margin
(30) (32) (33) (34) (35)
Ratio Analysis seems to indicate that EnCana is slightly undervalued when compared to industry
peers.
In addition to a ratio analysis, an EV/EBITDA analysis over time was completed, which also
appears to indicate that the EV/EBITDA ratio is tracking below industry peers.
EV/EBITDA Summary Table
EV/EBITDAEncana 13.62 16.38 5.35 26.82 18.00 91.69Cenovus - - - 10.91 30.08 18.99
18.86 36.53 4.76 23.31 18.43 13.88Devon Energy 10.24 12.01 5.31 17.78 10.05 5.60Apache Energy Inc 8.16 6.99 26.16 61.61 9.42 5.20Chesapeake 10.87 19.91 14.86 3.04 11.98 9.50
Peer Average 12.03 18.86 12.77 26.44 12.47 8.55Peer Median 10.55 15.96 10.09 20.54 11.01 7.55
As on 31/Dec/2007
As on 10/May/2008
As on 31/Dec/2008
As on 30/Nov/2009
As on 31/Dec/2010
As on 31/Dec/2011
Canadian Natural Resources
(34) (35) (36) (37) (33) (32)
17
Appendix F: Benefits of the Spin-off
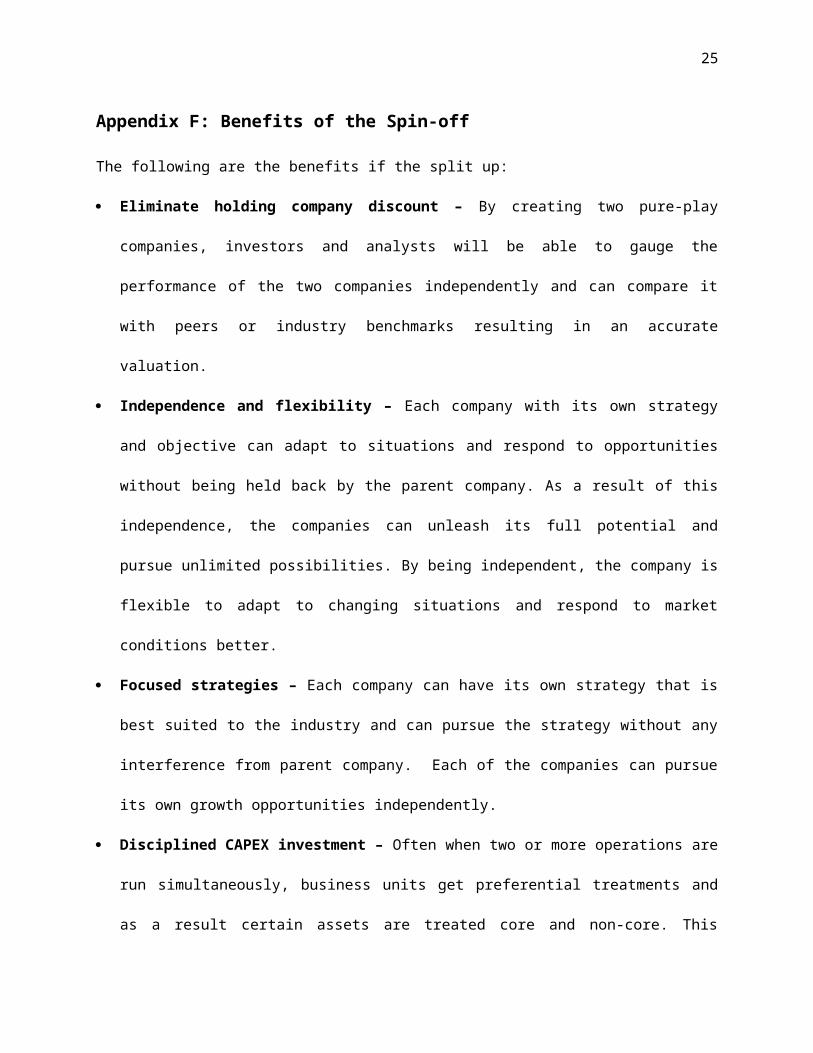
The following are the benefits if the split up:
Eliminate holding company discount – By creating two pure-play companies, investors and analysts
will be able to gauge the performance of the two companies independently and can compare it with
peers or industry benchmarks resulting in an accurate valuation.
Independence and flexibility – Each company with its own strategy and objective can adapt to
situations and respond to opportunities without being held back by the parent company. As a result
of this independence, the companies can unleash its full potential and pursue unlimited possibilities.
By being independent, the company is flexible to adapt to changing situations and respond to
market conditions better.
Focused strategies – Each company can have its own strategy that is best suited to the industry and
can pursue the strategy without any interference from parent company. Each of the companies can
pursue its own growth opportunities independently.
Disciplined CAPEX investment – Often when two or more operations are run simultaneously,
business units get preferential treatments and as a result certain assets are treated core and non-
core. This results in under investment of non-core assets. By splitting the 2 companies this partiality
in investment is eliminated and each of the two companies can invest effectively in CAPEX and
operational improvements.
Management Expertise – By splitting the two companies, each company can attract and retain
talent that is best suited for its operations. Also, by having the expertise in running the business, the
ability to create future success is maximized.
Shareholders value creation – By having ownership in both the companies, Shareholders get a
chance to share the profits of the two companies and at the same time diversify any market risks.
18
Appendix G: Location of assets to EnCana (GasCo)
Source: (38)
19
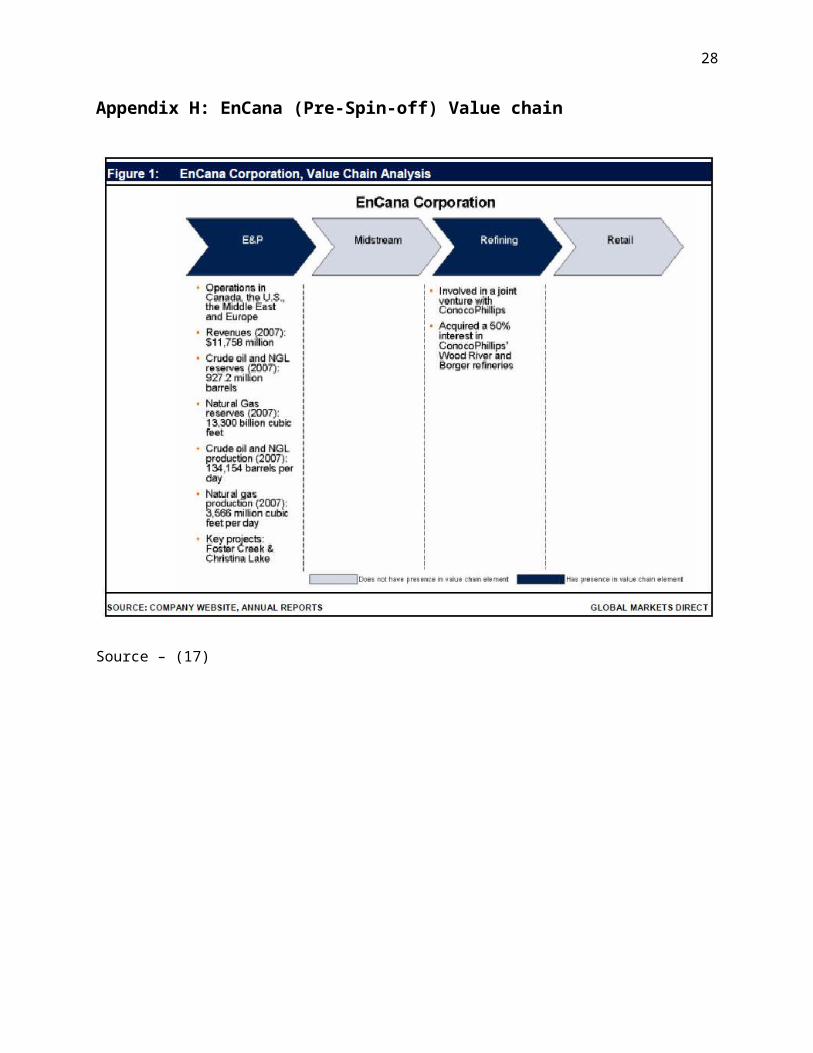
Appendix H: EnCana (Pre-Spin-off) Value chain
Source – (17)
20
Appendix I: Location of assets to Cenovus (IOCo)
Source: (39)
21
Appendix J: Breakup of Encana balance sheet into Encana and Cenovus
EnCana (2)(Prior to spin-off)
EnCana (5)(Post spin-off)
Cenovus (6)
Assets 47,247 33,827 20,552
Liabilities 24,273 17,213 11,372
Equity 22,974 16,614 9,180
Revenue 30,064 11,114 10,140
Net income 5,944 1,862 648
EBITDA/interest 24.27 16.24 13.88
All figures are in US$ millions
Shareholders
EnCana
Shareholders
IOCo(later to become
Cenovus)EnCana(GasCo)
Cenovus(IOCo)
$47.25B
$33.8B
$20.6B
22
Appendix K: Breakdown of shareholder value in May 2008
Shareholder Value
EncanaShare holder
Encana($85.93/share*)
GasCo(Pure play natural gas company
– later to retain EnCana)
IOCo(Integrated Oil Company – later
to become Cenovus)
23
Appendix L: Proceeding with Spin-off in September 10, 2009
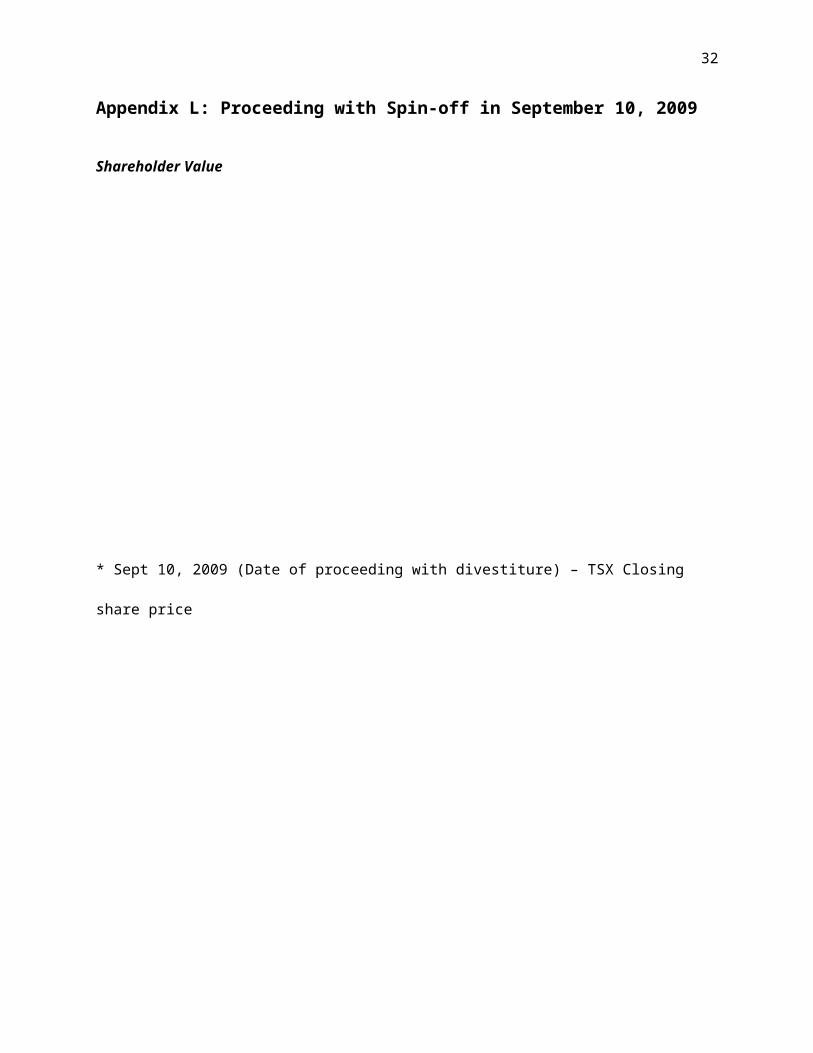
Shareholder Value
* Sept 10, 2009 (Date of proceeding with divestiture) – TSX Closing share price
EncanaShare holder
Encana($55.03/share*)
GasCo(Pure play natural gas company
– later to retain EnCana)
IOCo(Integrated Oil Company – later
to become Cenovus)

24
Appendix M: Shareholder value estimates – September 10, 2009
Multiples Approach
Source - (22)
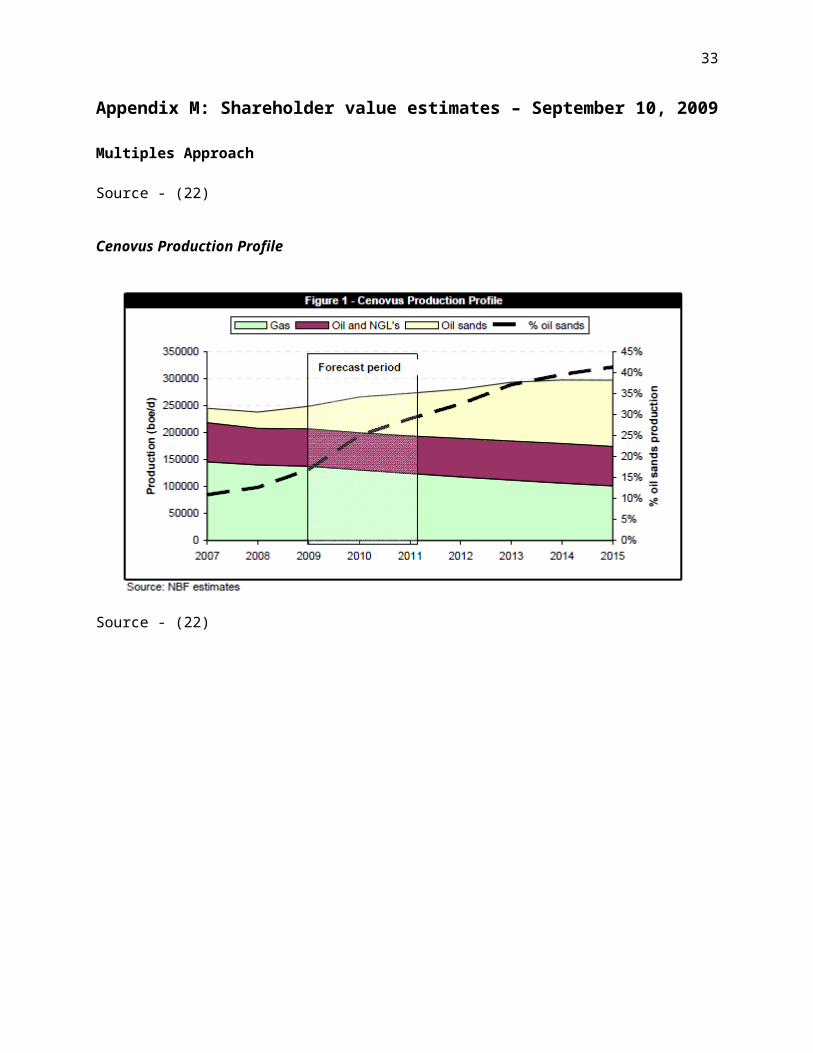
Cenovus Production Profile
Source - (22)
25
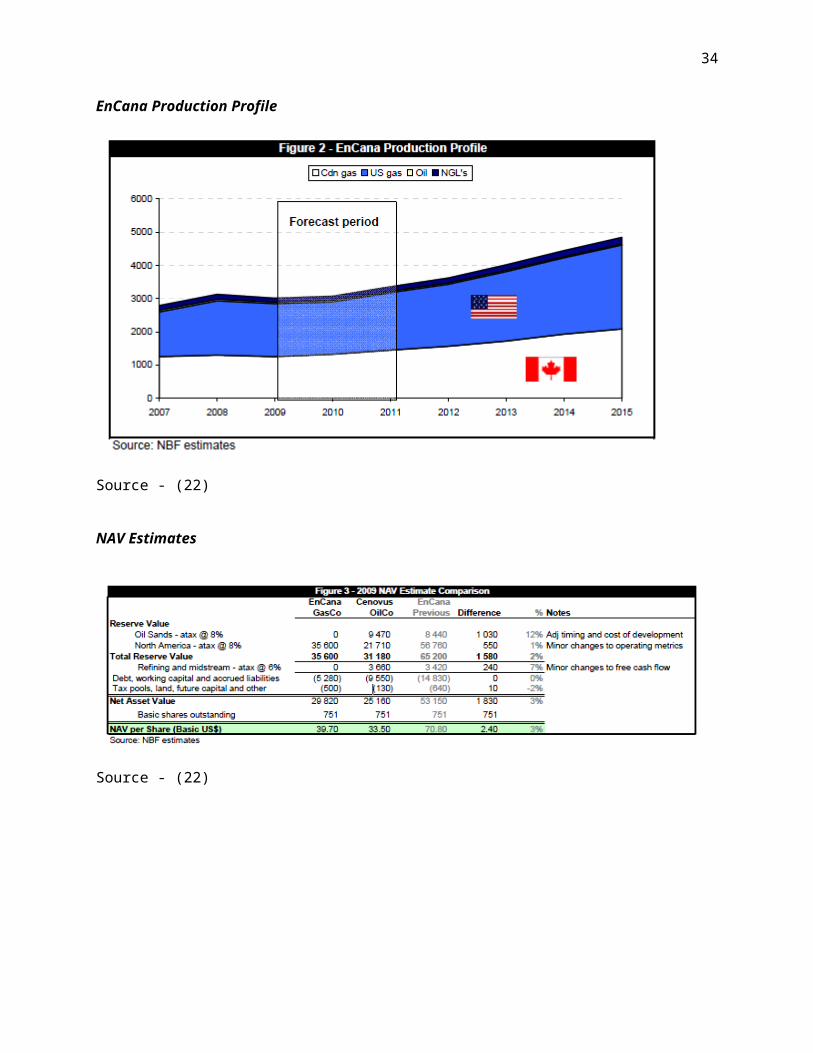
EnCana Production Profile
Source - (22)
NAV Estimates
Source - (22)
26
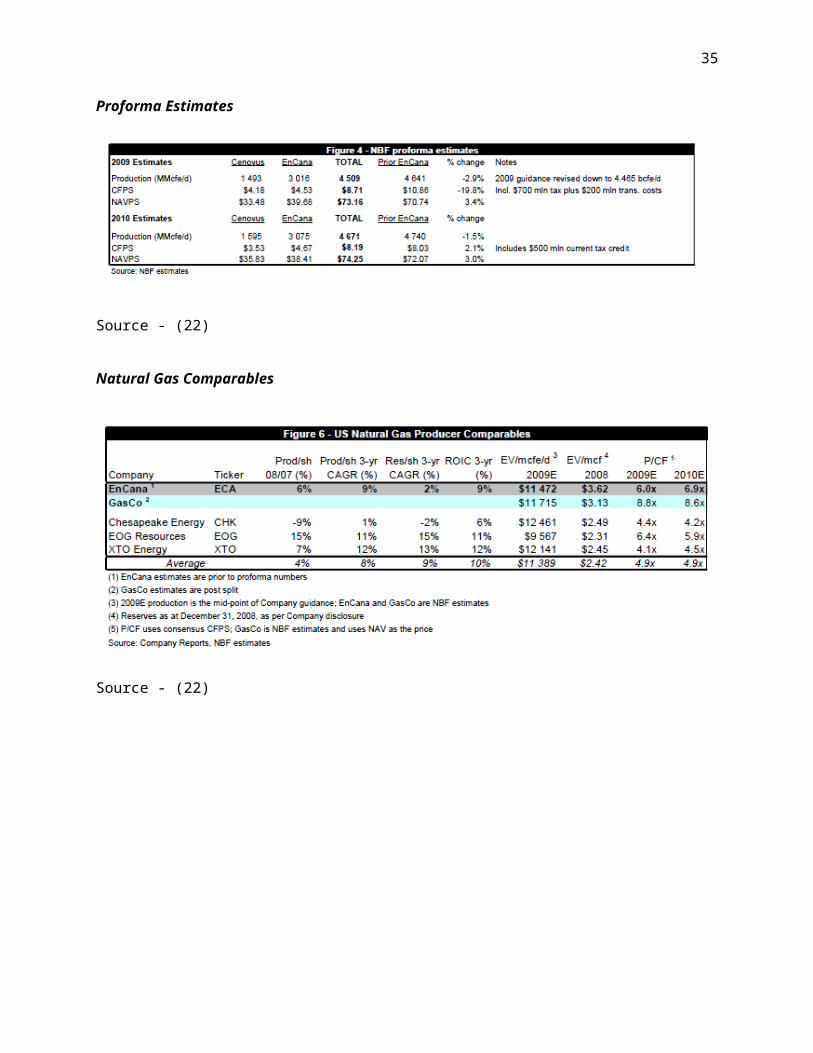
Proforma Estimates
Source - (22)
Natural Gas Comparables
Source - (22)
27
EnCana and Cenovus Price Summary
Source - (22)
Shareholder Value
* September 21, 2009 – Based on National Bank Financial Valuation (22)
Share holder($57/Share)
Encana($27/share*)
Cenovus($30/share*)
28
DCF Approach
EnCana (GasCo)
EnCana (GasCo)Canadian Foothills Division 2008 USA Division 2008Revenues, Net of Royalties (MM) $4,355
Revenues, Net of Royalties (MM) $5,629
Expenses Expenses Production and mineral taxes 33 Production and mineral taxes 370Transportation and selling 239 Transportation and selling 502Operating 609 Operating 618Operating Cash Flow * 3,474 Operating Cash Flow * 4,139 CAPEX* CAPEX* Canadian Foothills 2299 USA 2615Canada 1901 Total CAPEX 4200 Total CAPEX 2615
EnCana Consolidated Free Cash FlowOperating Cash Flow 7,613 CAPEX 6815 NWC 0 Free Cash Flow 798 Growth Rate 6.50% WACC 9%
Intrinsic Value(MM)$33,99
5
Balance Sheet
Assets (MM)$33,99
5 Liabilities (MM)$17,46
5
Equity (MM)$16,53
0
$33,99
5 Stocks Outstanding (MM) 750.4 Per share price $22
* Source - (2)
29
Cenovus (IOCo)
Cenovus (IOCo)Canadian Plains Division 2008 Integrated Oil Division 2008Revenues, Net of Royalties(MM) $4,418 Revenues, Net of Royalties (MM) $10,288Expenses Expenses Production and mineral taxes 74 Production and mineral taxes 1Transportation and selling 392 Transportation and selling 571Operating 484 Operating 732Operating Cash Flow * 3,468 Purchased Product 8,609 Operating Cash Flow* 375CAPEX* CAPEX* Canadian Plains 847 Integrated Oil – Canada 656Canada 1250 Downstream Refining 478Total CAPEX 2097 Total CAPEX 1134
Cenovus Consolidated Free Cash FlowOperating Cash Flow 3,843 CAPEX 3231 NWC 0 Free Cash Flow 612 Growth Rate 6% WACC 7.87%
Intrinsic Value(MM)$34,69
1
Balance Sheet
Assets (MM)$34,69
1 Liabilities (MM) $11,372 Equity (MM) $23,319 $34,691 Stocks Outstanding(MM) 750.4 Per Share Price $31
* Source - (2)
30
Shareholder Value (Based on DCF)
Share holder($53/Share)
Encana($22/share)
Cenovus($31/share)

31
Appendix N: Actual Trading post split up - Dec 3, 2009
* Dec 3, 2009 –TSX Trading price
Share holder($56.15/Share)
Encana($29.4/share*)
Cenovus($26.75/share*)
32
Appendix O: Encana business unit performance
EnCana Performance 2008PF 2009PF 2010 2011
Revenue $ 13,505 $ 6,732 $ 8,870 $ 8,467
Net income $ 3,405 $ 749 $ 1,499 $ 128
Profit margin 25% 11% 17% 2%
SOURCE?
Appendix P: Cenovus business unit performance
Cenovus Performance 2008PF 2009PF 2010 2011
Revenue $ 16,559 $ 10,140 $ 12,973 $ 15,696
Net income $ 2,368 $ 648 $ 993 $ 1,478
Profit margin 14% 6% 8% 9%
SOURCE?
33
Appendix Q: Consolidated Financial Performance Post Split
Source?
Consolidated Performance 2007 2008 2010 2011
Revenue $ 21,700 $ 30,064 $ 21,843 $ 24,163
Expenses $ 16,879 $ 21,487 $ 18,620 $ 21,954
Earnings before taxes $ 4,821 $ 8,577 $ 3,223 $ 2,209
Net Income $ 3,959 $ 5,944 $ 2,492 $ 1,606
Long Term Assets $ 42,530 $ 41,645 $ 50,486 $ 47,274
Long Term Liabilities $ 19,940 $ 20,379 $ 23,505 $ 24,174
Equity $ 20,704 $ 22,974 $ 27,349 $ 25,730
Profit Margin 22% 29% 15% 9%
LT Liabilities / Equity 0.96 0.89 0.86 0.94
LT Liabilities / LT Assets 0.47 0.49 0.47 0.51
ROA 11% 13% n/a 3%
ROE 23% 29% n/a 6%
34
Appendix R: Combined post-split firm trading values does not demonstrate
much change in shareholder value
7/24/1998 4/19/2001 1/14/2004 10/10/2006 7/6/2009 4/1/2012 12/27/2014$0
$20
$40
$60
$80
$100
$120
Encana Closing PriceCenovus Closing PriceCombined Closing Price
Share price,C$
Source: Yahoo Finance (2012)
Adjusted for Splits
SOURCE
35
Appendix S: The TSX has outperformed the combined firms since the split in
2009.
7/6/2009 8/10/2010 9/14/2011 10/18/2012 11/22/20130
20
40
60
80
100
120
140
160
Encana Index
Cenovus Index
TSX Index
Consolidated Firm Index
Index,Dec 2 2009 = 100
Source: Yahoo Finance (2012)
SOURCE
36
References
1. MarketLine. MarketLine Industry Profile: Oil & Gas North America. [Online] june 2012. [Cited: 03 26,
2013.] http://advantage.marketline.com.ezproxy.library.yorku.ca/Product?pid=MLIP0559-0024.
2. EnCana . EnCana 2008 Annual Report. [Online] 2009. [Cited: 03 20, 2013.]
http://www.encana.com/pdf/investors/financial/annual-reports/2009/annual-report-2009.pdf.
3. Encana. EnCana plans to split along distinct business lines to create two Calgary-headquartered
energy companies. Encana. [Online] May 11, 2008. [Cited: March 16, 2013.]
http://www.encana.com/news-stories/news-releases/details.html?release=609419.
4. EnCana. EnCana 2007 Annual Report. [Online] 2008. [Cited: 03 22, 2013.]
http://www.encana.com/pdf/investors/financial/annual-reports/2007/2007-annual-report.pdf.
5. —. EnCana 2009 Annual Report. [Online] 2010. [Cited: 03 18, 2013.]
http://www.encana.com/pdf/investors/financial/annual-reports/2009/annual-report-2009.pdf.
6. Cenovus 2009 Annual Report. Cenovus 2009 Annual Report. [Online] 2010. [Cited: 03 18, 2013.]
http://www.cenovus.com/invest/docs/2010/2009-annual.pdf.
7. Encana. Cenovus Energy Inc. to be North America’s newest integrated oil company. Encana. [Online]
September 30, 2008. [Cited: March 16, 2013.]
http://www.encana.com/news-stories/news-releases/details.html?release=609377.
8. —. EnCana revises schedule for creation of Cenovus Energy due to financial markets uncertainty.
Encana. [Online] October 15, 2008. [Cited: March 16, 2013.]
http://www.encana.com/news-stories/news-releases/details.html?release=609363.
9. —. EnCana completes US$500 million debt offering. Encana. [Online] May 04, 2009. [Cited: March 16,
2013.] http://www.encana.com/news-stories/news-releases/details.html?release=609296.
37
10. —. EnCana agrees to sell non-core Alberta properties for $632 million (C$707 million) to Bonavista
Energy Trust. Encana. [Online] July 16, 2009. [Cited: March 16, 2013.] http://www.encana.com/news-
stories/news-releases/details.html?release=609318.
11. —. EnCana proceeds with plan to split into two distinct and independent energy companies. Encana.
[Online] September 10, 2009. [Cited: March 16, 2013.] http://www.encana.com/news-stories/news-
releases/details.html?release=609273.
12. —. EnCana subsidiary Cenovus Energy completes a US$3.5 billion private debt offering. Encana.
[Online] Spetember 18, 2009. [Cited: March 16, 2013.] http://www.encana.com/news-stories/news-
releases/details.html?release=609266.
13. —. EnCana to hold conference call and webcast on Integrated Oil Division. Encana. [Online] October
01, 2009. [Cited: March 16, 2013.] http://www.encana.com/news-stories/news-releases/details.html?
release=609255.
14. —. EnCana mails Arrangement Circular - “when issued” trading in EnCana and Cenovus shares to
start November 2, 2009. Encana. [Online] October 29, 2009. [Cited: March 16, 2013.]
http://www.encana.com/news-stories/news-releases/details.html?release=609247.
15. —. Financial and operating information filed for Cenovus Energy and post-split EnCana. Encana.
[Online] November 13, 2009. [Cited: March 16, 2013.] http://www.encana.com/news-stories/news-
releases/details.html?release=609230.
16. —. Shareholders overwhelmingly endorse split of EnCana into two distinct and independent
companies - Cenovus Energy and EnCana. Encana. [Online] November 25, 2009. [Cited: March 16, 2013.]
http://www.encana.com/news-stories/news-releases/details.html?release=609227.
17. Global Markets Direct. EnCana Corporation Financial Profile. s.l. : Global Markets Direct, 2008.
18. Encana . EnCana closes transaction to split into two distinct and independent companies – Cenovus
Energy and EnCana. Encana. [Online] November 30, 2009. [Cited: March 16, 2013.]
38
http://www.encana.com/news-stories/news-releases/details.html?release=609226.
19. The Economist. America’s Cheap Gas: Bonanza or Bane? [Online] March 2, 2013. [Cited: 03 20,
2013.] http://www.economist.com/news/finance-and-economics/21572815-natural-gas-prices-are-
sure-riseeventually-bonanza-or-bane.
20. KPMG Global Energy Institute. KPMG (2011). Shale Gas, a Global Perspective. [Online] KPMG, 2011.
[Cited: 03 26, 2013.] www.gses.com/images/documents/shale-gas-global-perspective.pdf.
21. Bennet Jones. Bennet Jones (2012). The Canadian Oil Sands: A Backgrounder. [Online] 2012. [Cited:
03 19, 2013.] http://www.bennettjones.com/uploadedFiles/Publications/Guides/The%20Canadian
%20Oil%20Sands%202012-Web.pdf.
22. National Bank Financial . EnCana Corp. - Taking another look as we split the forecast. Toronto : The
NBF Daily Bulletin, 2009.
23. Wiki Wealth. EnCana WACC. Wiki Wealth Collaborative Research. [Online] 2012. [Cited: March 23,
2013.] http://www.wikiwealth.com/wacc-analysis:eca.
24. Henry Fund Research. Cenovus Energy. Tippie School of Management. [Online] September 18, 2012.
[Cited: March 23, 2013.] http://tippie.uiowa.edu/henry/reports12/cve_f12.pdf.
25. TriStone Capital Inc. TriStone Capital Inc. Research Report: EnCana 2009. [Online] May 29, 2009.
[Cited: 03 26, 2013.] Bloomberg Terminal.
26. EnCana. EnCana 2010 Annual Report. [Online] 2011. [Cited: 03 20, 2013.]
http://www.encana.com/pdf/investors/financial/annual-reports/2010/annual-report-2010.pdf.
27. —. EnCana 2011 Annual Report. [Online] 2012. [Cited: 03 22, 2013.]
http://www.encana.com/pdf/investors/financial/annual-reports/2011/annual-report-2011.pdf.
28. Cenovus. Cenovus 2010 Annual Report. [Online] 2011. [Cited: 03 18, 2013.]
http://www.cenovus.com/invest/docs/2010-annual-report/cenovus-AR-2010.pdf.
39
29. —. Cenovus 2011 Annual Report. [Online] 2012. [Cited: 03 17, 2013.]
http://www.cenovus.com/invest/docs/2011-annual-report/cenovus-AR-2011.pdf.
30. Mergent. Mergent Online EnCana Company Profile (2013). [Online] [Cited: 03 26, 2013.]
http://www.mergentonline.com.
31. Morningstar. Morningstar, Encana Corp via The Internet Archive Wayback Machine (2013). [Online]
2011. [Cited: 03 26, 2013.]
http://web.archive.org/web/20110611012255/http://investors.morningstar.com/ownership/
shareholders-overview.html?t=ECA®ion=USA&culture=en-US.
32. Mergent Online. Chesapeake Energy Corp. Mergent Online . [Online] March 20, 2013. [Cited: March
20, 2013.] http://www.mergentonline.com/companyfinancials.php?
pagetype=asreported&compnumber=75886&period=Annuals&dataarea=PL&range=5¤cy=AsRep
&scale=AsRep&Submit=Refresh.
33. —. Devon Energy Corp. Mergent Online. [Online] March 20, 2013. [Cited: March 20, 2013.]
http://www.mergentonline.com/companyfinancials.php?
pagetype=asreported&compnumber=98163&period=Annuals&dataarea=PL&range=5¤cy=AsRep
&scale=AsRep&Submit=Refresh.
34. Mergen Online. Apache Corp. Mergent Online. [Online] March 20, 2013. [Cited: March 20, 2013.]
http://www.mergentonline.com/companyfinancials.php?
pagetype=asreported&compnumber=525&period=Annuals&dataarea=PL&range=5¤cy=AsRep&sc
ale=AsRep&Submit=Refresh.
35. Mergent Online. CNR. Mergent Online. [Online] March 20, 2013. [Cited: March 20, 2013.]
http://www.mergentonline.com/companyfinancials.php?
pagetype=asreported&compnumber=6434&period=Annuals&dataarea=PL&range=5¤cy=AsRep&
scale=AsRep&Submit=Refresh.
40
36. —. Cenovus Energy Inc. Mergent Online. [Online] March 20, 2013. [Cited: March 20, 2013.]
http://www.mergentonline.com/companyfinancials.php?
pagetype=asreported&compnumber=128343&period=Annuals&dataarea=PL&range=5¤cy=AsRe
p&scale=AsRep&Submit=Refresh.
37. —. Encana Corp. Mergent Online . [Online] March 18, 2013. [Cited: March 18, 2013.]
http://www.mergentonline.com/companyfinancials.php?
pagetype=ratios&compnumber=6434&period=AnnualsIFRS&dataarea=BS&range=7¤cy=AsRep&s
cale=AsRep.
38. National Bank Financial. EnCana Corporation - Initiating Coverage. Toronto : The NBF Daily Bulletin,
2009.
39. Credit Suisse. Cenovus Energy Inc. s.l. : Credit Suisse Equity Research, 2009.
40. Market Watch. Historical Quotes. Market Watch. [Online] March 20, 2013. [Cited: March 20, 2013.]
http://www.marketwatch.com/investing/stock/CVE/historical.
41. Investopedia. Integrated Oil & Gas Company . Investopedia . [Online] [Cited: March 16, 2013.]
http://www.investopedia.com/terms/i/integrated-oil-gas-company.asp#axzz2NjV9lBZP.
42. Morgan Stanley Research. EnCana Corporation- Split Announced; Committed to Shareholder Value.
North America : Morgan Sanley Research, 2009.
Related Documents