1 Integrated oil Building on our success John Brannan Executive Vice-President and President, Integrated Oil Division Investor Day | Calgary - June 17 | New York - June 21 Borger TEXAS Wood River ILLINOIS Foster Creek • Up to 12 months acceleration of phase F • ~235,000 bbls/d (gross) of planned development Christina Lake • Up to 12 months acceleration of phase E • ~258,000 bbls/d (gross) of planned development Overview of our industry leading performance Update Wood River CORE project Integrated oil overview Cenovus land at Dec. 31, 2009. Christina Lake Region Foster Creek Region P&NG leases Oilsands leases Christina Lake proper Foster Creek proper ALBERTA Note: Timelines are subject to regulatory approvals.

Welcome message from author
This document is posted to help you gain knowledge. Please leave a comment to let me know what you think about it! Share it to your friends and learn new things together.
Transcript

1
Integrated oilBuilding on our success
John BrannanExecutive Vice-President and President, Integrated Oil Division
Investor Day | Calgary - June 17 | New York - June 21
BorgerTEXAS
Wood RiverILLINOIS
Foster Creek
• Up to 12 months acceleration of phase F
• ~235,000 bbls/d (gross) of planned development
Christina Lake
• Up to 12 months acceleration of phase E
• ~258,000 bbls/d (gross) of planned development
Overview of our industry leading performance
Update Wood River CORE project
Integrated oil overview
Cenovus land at Dec. 31, 2009.
Christina Lake
Region
Foster Creek Region
P&NG leasesOilsands leases
Christina Lake properFoster Creek proper
ALBERTA
Note: Timelines are subject to regulatory approvals.

2
Growth strategyDriven by bitumen resource
• Projects capable of supporting 20% CAGR through 2019
• 56 Bbbls best estimate for discovered BIIP
• 5.4 Bbbls best estimate for contingent resource
Supported by downstream heavy oil processing
• 275,000 bbls/d post-CORE total heavy oil processing capacity
Fost
er C
reek
&
Chris
tina
Lake
Addi
tiona
l
Opp
ortu
nitie
s
Co
mm
erc
iality
Base growth plan
Growth
Long term plays
Currentproduction
0
30
60
90
120
1998 1999 2000 2001 2002 2003 2004 2005 2006 2007 2008 2009 Q12010
Foster Creek Christina Lake
Mbbls/d
5 yr CAGR (2
005–09) ~25%
Production is shown before royalties and on a gross basis.
Cenovus SAGD operating experience

3
Foster Creek - leading the way
Volumes are shown on a 100% basis.
Foster Creek current phasesPilot project began in 1996
Became the industry’s first commercial SAGD project in 2001
120,000 bbls/d of productive capacity (phases A - E)
• Largest producing SAGD operation in Alberta
• Currently producing more than 100,000 bbls/d from 160 wells
Pioneered use of wedge wells
Achieved royalty payout in Feb 2010
Top tier performance
• 2.3 – 2.5 SOR
• Leading capital efficiencies
• $12.50 - 13.50/bbl operating cost (2010F)
0
10,000
20,000
A 20Mbbls/d
B 10Mbbls/d
C 30Mbbls/d
D&E 60Mbbls/d
Capital efficiencyC$/bbl/d

4
Foster Creek future developmentTotal planned capacity of ~235,000 bbls/d
Phases F, G & H
• Staged plant expansion west of phases A - E
• Each expansion adds 30,000 bbls/d of productive capacity
• Regulatory approval anticipated second half 2010
• Up to 12 months acceleration of phase F
• Requires $76 million (gross) in 2010F
Phase I now planned
Timelines are subject to regulatory approvals. Volumes are shown on a 100% basis.
Christina Lake - top tier reservoir

5
Christina Lake current phases
0
10,000
20,000
30,000
A&B 18Mbbls/d
CD&E 120Mbbls/d
Pilot project began in 2000
First production in 2002
18,000 bbls/d of productive capacity (phases A&B)
• Currently producing approximately 15,000 bbls/dfrom 17 wells
Top tier performance
• 2.1 – 2.2 SOR
• Leading capital efficiencies
• $16.00 - 17.00/bbl operating costs (2010F)
Capital efficiencyC$/bbl/d
Volumes are shown on a 100% basis.
Total planned capacity of ~258,000 bbls/d
Phases C – G
• Each expansion adds 40,000 bbls/d of productive capacity
• Regulatory approval in place for phases C & D
• Phase C construction ahead of schedule and on budget
• Phase D under construction
• Regulatory approval anticipatedfor phases E – G in 2011
• Up to 12 months acceleration of phase E
Phase H now planned
Christina Lake future development
Timelines are subject to regulatory approvals. Volumes are shown on a 100% basis.

6
*Timelines are subject to regulatory approvals.
Project schedules
~258,000~2019F~2013FH
~235,000~2019F~2014FI
218,0002017FQ4 2009G
178,0002016FQ4 2009F
138,0002014FQ4 2009E
98,000Q2 2013FQ3 2007D
58,000Q3 2011FQ3 2007C
18,000Q4 2002Q3 1998A-B
Christina Lake
210,0002017FQ2 2009H
180,0002016FQ2 2009G
150,0002014FQ2 2009F
120,000Q1 2002Q1 1999A-E
Foster Creek
Expected cumulative production capacity (bbls/d)
First production target
Regulatory applicationsProject phase
On stream Under construction Submitted for regulatory approval* Planned no approvals*
0
50
100
150
200
250
300
350
2010F 2011F 2012F 2013F 2014F 2015F 2016F 2017F 2018F 2019F
Emerging Opportunities
Christina Lake (developing)
Foster Creek (developing)
Christina Lake (existing)
Foster Creek (existing)
Annualized production
Annualized production
Mbbls/d
SAGD development plans driving growth
Volumes are shown before royalties and net to CVE (50% basis).
Production capacity (year end rate)

7
Timeline - illustrative SAGD phase
(1) Receipt of regulatory approval is variable. Assumes construction starts when approval is received.(2) Construction time is variable depending on several factors. Commissioning, steam and production would be timed
accordingly.
Prepare application
Regulatory approval(1)
Engineering
Procurement
Construction(2)
Commissioning
Steam
Production
Initial capital
Year 6Year 5Year 4Year 3Year 2Year 1
Capital profile - illustrative SAGD phase
Capital efficiency based on initial capital
~ 30 - 36 month construction timeline - starts after regulatory approval
Sustaining capital varies from year to year and may be affected by technological innovations
0%
10%
20%
30%
40%
50%
1 2 3 4 5 6 7 8
Well capital
Maintenance capital
Plant capital
% peak production
Sustaining capital
Engineering and procurement
Construction
Initial capital
Percent of peak production100%
0%
Percent of total initial capital
Years

8
Top quality reservoirs
Manufacturing approach & project execution
Operational excellence
Technological innovations
Top quality people
Why we’re successful – how we do it
0
2
4
6
8
Peer Peer Peer Peer Peer Peer Peer Peer Peer Peer Peer CVEFC
Peer CVECL
Lower capital cost
Lower operating cost
Smaller surface footprint
Lower energy usage
Lower emissions
Less water usage
Low SOR means
Top quality reservoirs
Peers include: CNQ, COP, CLL, DVN, HSE, IMO, JACOS, MEG, NXY, RDS, SU.Source: ERCB public domain data, April, 2009 – March, 2010.
Steam-to-oil ratio (bbl/bbl)

9
Increasing efficiency is reducing execution timeline
Manufacturing process• Staged development
• Dedicated in-house construction management teams
• Multiple small contractors
• Standard designs
• Assembly line drilling & completions
Module yard• Enhanced safety
• Minimize rework and cost over-runs
• Cost savings and schedule certainty
• Accessible labor
Manufacturing approach to development
Nisku module yard

10
Pipe module
Christina Lake site construction

11
0
20
40
60
80
100
120
1-Jun-09 1-Sep-09 1-Dec-09 1-Mar-10 1-Jun-10
Operational excellence - Foster CreekMbbls/d Record production
113 Mbbls/d March 1, 2010
Volumes are shown on a 100% basis.
0
5
10
15
20
1-Jun-09 1-Sep-09 1-Dec-09 1-Mar-10 1-Jun-10
Operational excellence - Christina LakeMbbls/d Record production
18 Mbbls/d May 20, 2010
Tu
rnaro
un
d
Volumes are shown on a 100% basis.

12
Electric Submersible Pumps (ESP)ESPs reduce SOR through use of lower operating pressures
~20% improvement in run life• Cumulative Meantime to Failure
(MTTF) increased from 10.5 to 12.7 months
Down time for a pump change• 75% reduction
• 24 hour service rig operations
Effect of reducing pump change time 15 days:
More than 1,000,000 bbls/yr*
ESP run life cumulative MTTF in months
9
10
11
12
13
Dec-08 Mar-09 Jun-09 Sep-09 Dec-09
0
10
20
30
2003 2004 2005 2006 2007 2008 2009
Days down on pump change
*Based on plant production of 100 Mbbls/d and 1 pump change per well per year.
Standard SAGD well pair
Wedge wellproducer
Steam chambers coalesce
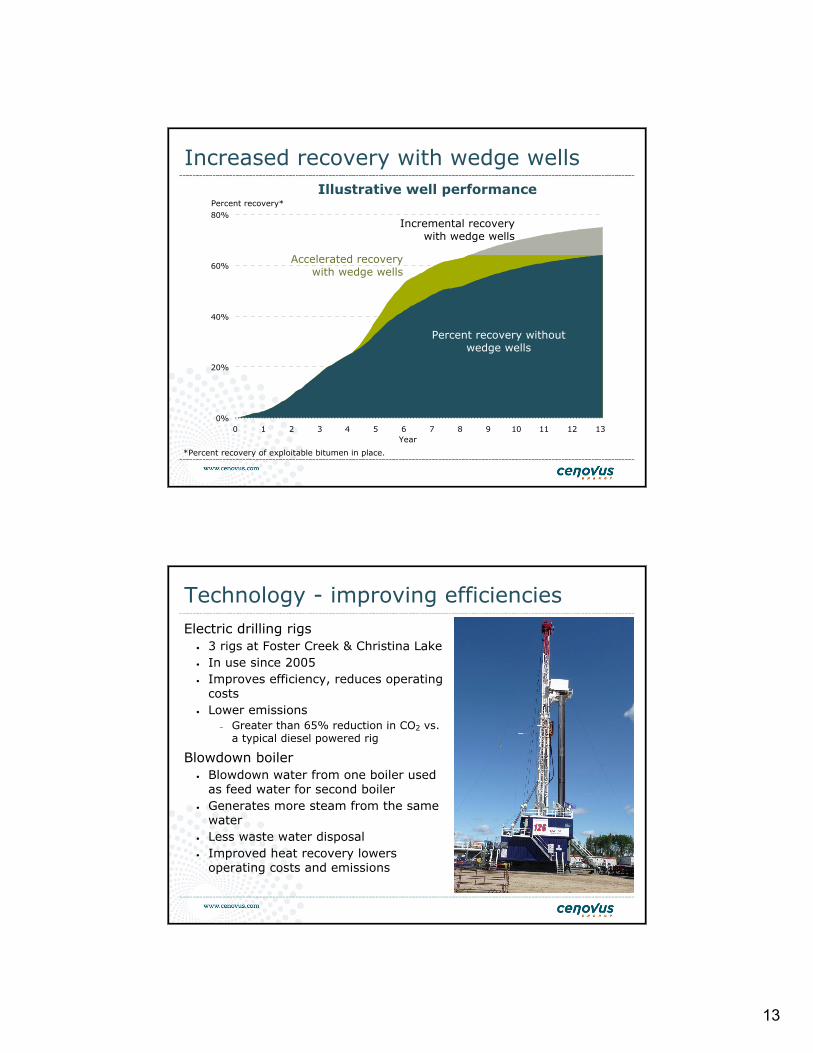
Technology – improving recovery
Wedge wells
• < 0.1 average SOR
• 600 – 800 bbls/d average production rate at Foster Creek
• Acceleration of production
• 10% potential increase in recovered oil
• Foster Creek – 36 wells drilled
• Christina Lake – evaluating pilot
13
0%
20%
40%
60%
80%
0 1 2 3 4 5 6 7 8 9 10 11 12 13
Increased recovery with wedge wells
Percent recovery*
Illustrative well performance
*Percent recovery of exploitable bitumen in place.
Incremental recovery with wedge wells
Accelerated recovery with wedge wells
Percent recovery without wedge wells
Year
Technology - improving efficienciesElectric drilling rigs
• 3 rigs at Foster Creek & Christina Lake• In use since 2005• Improves efficiency, reduces operating
costs• Lower emissions
– Greater than 65% reduction in CO2 vs. a typical diesel powered rig
Blowdown boiler• Blowdown water from one boiler used
as feed water for second boiler• Generates more steam from the same
water• Less waste water disposal• Improved heat recovery lowers
operating costs and emissions
14
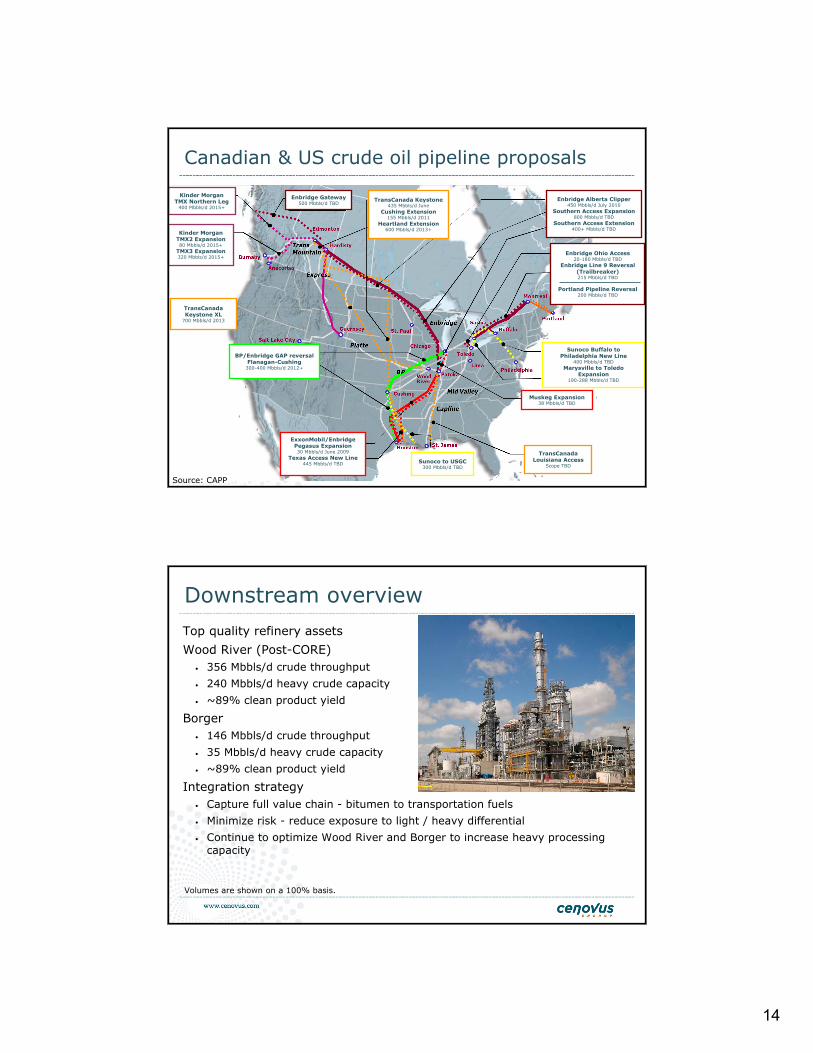
Canadian & US crude oil pipeline proposals
TransCanada Keystone XL
700 Mbbls/d 2013
BP/Enbridge GAP reversal Flanagan-Cushing
300-400 Mbbls/d 2012+
Enbridge Gateway500 Mbbls/d TBD
Muskeg Expansion38 Mbbls/d TBD
Sunoco to USGC300 Mbbls/d TBD
Sunoco Buffalo to Philadelphia New Line
400 Mbbls/d TBDMarysville to Toledo
Expansion190-288 Mbbls/d TBD
Kinder Morgan TMX Northern Leg
400 Mbbls/d 2015+
Kinder Morgan TMX2 Expansion80 Mbbls/d 2015+
TMX3 Expansion320 Mbbls/d 2015+
ExxonMobil/Enbridge Pegasus Expansion30 Mbbls/d June 2009
Texas Access New Line445 Mbbls/d TBD
TransCanada Louisiana Access
Scope TBD
TransCanada Keystone435 Mbbls/d June
Cushing Extension155 Mbbls/d 2011
Heartland Extension600 Mbbls/d 2013+
Enbridge Alberta Clipper450 Mbbls/d July 2010
Southern Access Expansion800 Mbbls/d TBD
Southern Access Extension400+ Mbbls/d TBD
Enbridge Ohio Access20-180 Mbbls/d TBD
Enbridge Line 9 Reversal (Trailbreaker)215 Mbbls/d TBD
Portland Pipeline Reversal200 Mbbls/d TBD
Source: CAPP
Top quality refinery assets
Wood River (Post-CORE)• 356 Mbbls/d crude throughput
• 240 Mbbls/d heavy crude capacity
• ~89% clean product yield
Borger• 146 Mbbls/d crude throughput
• 35 Mbbls/d heavy crude capacity
• ~89% clean product yield
Integration strategy• Capture full value chain - bitumen to transportation fuels
• Minimize risk - reduce exposure to light / heavy differential
• Continue to optimize Wood River and Borger to increase heavy processing capacity
Downstream overview
Volumes are shown on a 100% basis.

15
Bitumen value chain – net margin
0%
100%
1995
1996
1997
1998
1999
2000
2001
2002
2003
2004
2005
2006
2007
2008
2009
Downstream net margin
Upstream net margin
History of margin sharing
Total net margin available for one bbl of bitumen refined into transportation fuels. Downstream margin based on Purvin & Gertz PADD II heavy refining margin. Upstream margin based on Purvin & Gertzbitumen field price and average SAGD opex assuming a 2.5 SOR. Source: Purvin & Gertz, CVE.
Share of bitumen value chain margin
Bitumen integration strategy
0
50
100
150
200
250
300
350
2008 2009 2010F 2011F 2012F 2013F 2014F 2015F 2016F 2017F 2018F 2019F
Downstream bitumen equivalent processing capacity
Annualized bitumen production
Mbbls/d Post 2012 – long bitumen
Volumes are shown before royalties and net to CVE (50% basis).

16
Wood River CORE project
Increases overall capacity• 50 Mbbls/d of increased crude
throughput
• 130 Mbbls/d of increased heavy crude capacity
- lowers crude input costs
• ~10% increase in clean product yield
~$4.00/bbl margin improvement
Completion mid-2011 (Coker)• 9 of 21 scope areas already
complete
Final cost forecast to be within 10% of budget
Volumes are shown on a 100% basis.
Offloading modules

17
CORE project - new units area
High quality refinery assets
US refining infrastructure
Bak
er O
’Brien
com
ple
xity
index
CORE ProjectWood River post-CORE
Borger
Wood River pre-CORE
0
5
10
15
20
25
30
35

18
Building valueTop quality assets
• Foster Creek and Christina Lake are recognized as best in industry
Significant growth opportunity
• Potential for greater than 245,000 bbls/d (net) of production capacity at Foster Creek and Christina Lake
Experienced SAGD operator
• A proven track record
• Low cost capital and operating structures
• Technology leader
Full value chain integration
• Natural gas - heavy oil production - refining
• CORE on-stream mid-2011
Supplemental information

19
Foster Creek summary
40 – 50Supply cost US$/bbl(3)
2.3 – 2.52.5SOR
15 – 202.7Average royalty (%)
36,000
Acreage (year end, net acres)
Proper/Core area
12.50 – 13.50 11.87Operating costs ($/bbl)
550 – 700585Operating cash flow(2) ($ MM)
250 – 300262Capital ($ MM)
3121Net wells drilled(1)
46,000 – 50,00037,725Production (bbls/d)
2010F2009
(1) Includes well pairs and wedge wells, excludes strat wells.(2) Operating cash flow is a non-GAAP measure. Numbers shown include hedges.(3) Average WTI or NYMEX price required for an after-tax cost of capital return of 9%.
0
10
20
30
40
50
60
2008 2009 2010F 2011F 2012F 2013F 2014F
Mbbls/d – Net before royalties
Foster Creek overview
Producing formation: McMurray
Multiple stacked channels
~450 m reservoir depth
Up to 40 m+ net pay (average 25 m)
High permeability (5 - 10 Darcies)
High oil saturation (~80%)
9 – 11° API bitumen
No significant gas caps or formation water
Cenovus land at Dec. 31, 2009.
ALBERTA
P&NG leases
Oilsands leases
Foster Creek proper

20
Christina Lake summary
(1) Includes well pairs plus wedge wells, excludes strat wells.(2) Operating cash flow is a non-GAAP measure. Numbers shown include hedges.(3) Average WTI or NYMEX price required for an after-tax cost of capital return of 9%.
45 – 55Supply cost US$/bbl(3)
2.1 – 2.22.1SOR
4 – 62.3Average royalty (%)
12,000
Acreage (year end, net acres)
Proper/Core area
16.00 – 17.0016.31Operating costs ($/bbl)
100 – 15078Operating cash flow(2) ($ MM)
300 – 350224Capital ($ MM)
250Net wells drilled(1)
7,200 – 7,7006,698Production (bbls/d)
2010F2009
0
10
20
30
40
50
2008 2009 2010F 2011F 2012F 2013F 2014F
Christina Lake overview
Producing formation: McMurray
Multiple stacked channels
Reservoir depth ~375 m
Up to 47 m+ net pay (average 25 – 30 m)
High permeability (5 - 10 Darcies)
High oil saturation (~80%)
7.5 – 9.5° API bitumen
Gas cap and bottom water present
Cenovus land at Dec. 31, 2009.
ALBERTA
P&NG leases
Oilsands leases
Christina Lake proper
Mbbls/d – Net before royalties

21
Western Canadian Sedimentary Basin pipelines
Proposed projects illustrate number of pipelines competing for next expansion
Existing and
approved projects
Proposed projects
Existing and Planned Pipeline Project Capacity (Unrisked)
318 318 318 318 318 318 318 318 318 318 318
300 300 300 300 300 300 300 300 300 300 300
1,935 1,870 1,870 1,870 1,870 1,870 1,870 1,870 1,870 1,870 1,870
210 450 450 450 450 450 450 450 450 450 450218
435 435 435 435 590 590 590 590 590 590
350700
700 700 700 700 700 700
200400 400 400 400 400
100 200 200 200 200175
525 525 525200
400 400 400
150350
-
500
1,000
1,500
2,000
2,500
3,000
3,500
4,000
4,500
5,000
5,500
6,000
6,500
2010 2011 2012 2013 2014 2015 2016 2017 2018 2019 2020
Mbbl/d
Alberta Clipper Expansion
TMX Northern Leg(Kitimat)
Enbridge NorthernGateway
Keystone XL (Expansion)
TMX-2 & 3 (Vancouver)
Keystone XL (Base)
Keystone Legacy &Expansion
Enbridge Alberta Clipper(Base)
Enbridge (Base)
TMPL (Land)
Express Pipeline
CAPP supply forecast
(June 2009)
2,980
6,100
WRB refinery statistics
35
240
110
Heavy crude
processing Mbbls/d
25
83
18
Coking capacity, Mbbls/d
15.720146Borger
15.0130356Wood River
post-CORE
10.050306Wood River
pre-CORE
Baker O’Brien
complexity
Bitumen processing equivalent,
Mbbls/d
Crude throughput,
Mbbls/d
Figures represent 100% of the Wood River and Borger refinery operations.
22
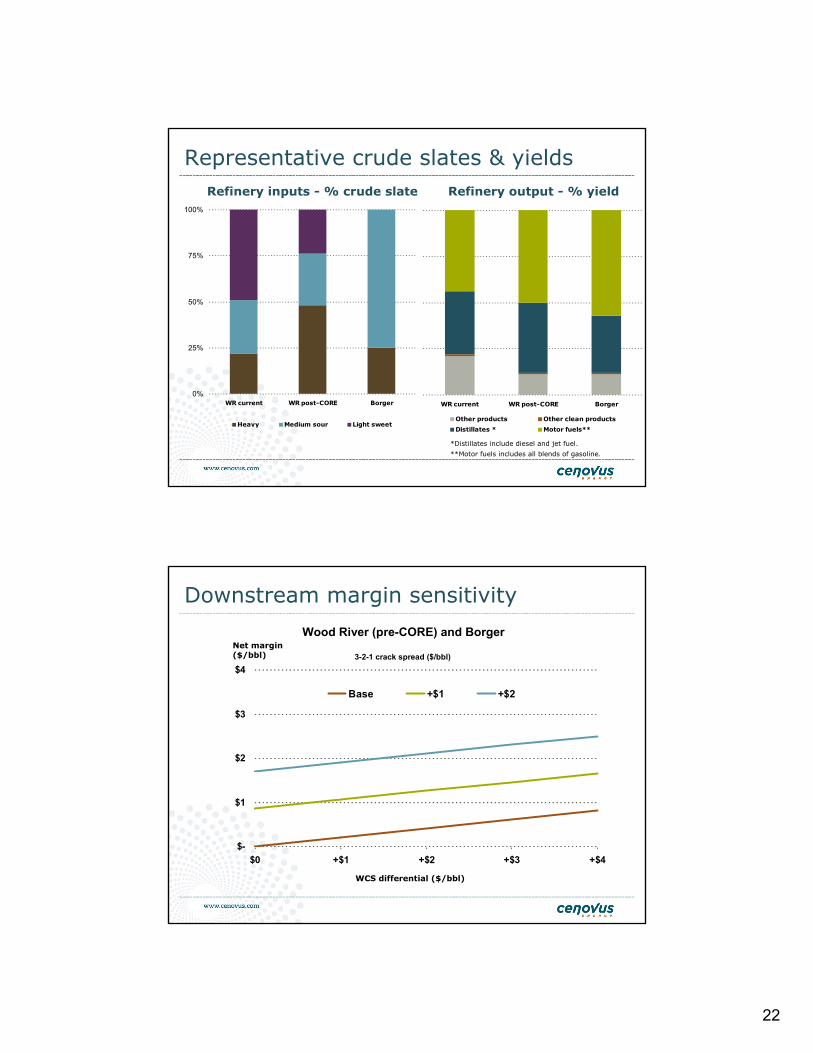
0%
25%
50%
75%
100%
WR current WR post-CORE Borger
Heavy Medium sour Light sweet
WR current WR post-CORE Borger
Other products Other clean products
Distillates * Motor fuels**
Refinery inputs - % crude slate Refinery output - % yield
Representative crude slates & yields
*Distillates include diesel and jet fuel.
**Motor fuels includes all blends of gasoline.
$-
$1
$2
$3
$4
$0 +$1 +$2 +$3 +$4
Base +$1 +$2
Wood River (pre-CORE) and Borger
3-2-1 crack spread ($/bbl)
Downstream margin sensitivity
WCS differential ($/bbl)
Net margin ($/bbl)

23
$-
$1
$2
$3
$4
$0 +$1 +$2 +$3 +$4
Base +$1 +$2
Downstream margin sensitivity
Wood River (post-CORE) and Borger
3-2-1 crack spread ($/bbl)
WCS differential ($/bbl)
Net margin ($/bbl)
The resources estimates were prepared effective December 31, 2009 by McDaniel & Associates Consultants Ltd., an independent qualified reserves evaluator (IQRE), and other than as disclosed herein are based on definitions contained in the Canadian Oil and Gas Evaluation Handbook (COGEH). For further discussion regarding our economic contingent resources and our total bitumen initially-in-place and all subcategories thereof, see our April 22, 2010 news release and our June 16, 2010 news release, respectively, available at www.cenovus.com. Actual resources may be greater than or less than the estimates provided. Total Bitumen Initially-In-Place (BIIP) (equivalent to “total resources”) is that quantity of bitumen that is estimated to exist originally in naturally occurring accumulations. It includes that quantity of bitumen that is estimated, as of a given date, to be contained in known accumulations, prior to production, plus those estimated quantities in accumulations yet to be discovered. BIIP estimates include unrecoverable volumes and are not an estimate of the volume of the substances that will ultimately be recovered. Discovered Bitumen Initially-In-Place (equivalent to “discovered resources”) is that quantity of bitumen that is estimated, as of a given date, to be contained in known accumulations prior to production.The recoverable portion of discovered bitumen initially-in-place includes production, reserves, and contingent resources; the remainder is categorized as unrecoverable. There is no certainty that it will be commercially viable to produce any portion of the estimate. Undiscovered Bitumen Initially-In-Place (equivalent to “undiscovered resources”) is that quantity of bitumen that is estimated, on a given date, to be contained in accumulations yet to be discovered. The recoverable portion of undiscovered bitumen initially-in-place is referred to as “prospective resources,” the remainder as “unrecoverable”. There is no certainty that any portion of the estimate will be discovered. If discovered, there is no certainty that it will be commercially viable to produce any portion of the resources. Exploitable Bitumen Initially-In-Place is the estimated volume of bitumen, before any production has been removed, which is contained in a subsurface stratigraphic interval that meets or exceeds certain reservoir characteristics considered necessary for the commercial application of known recovery technologies. Examples of such reservoir characteristics include continuous net pay, porosity, and mass bitumen content. This definition was derived from and is consistent with current draft proposed COGEH terminology. Contingent resources – those quantities of bitumen estimated, as of a given date, to be potentially recoverable from known accumulations using established technology or technology under development, but which are not currently considered to be commercially recoverable due to one or more contingencies. Contingencies may include such factors as economic, legal, environmental, political and regulatory matters or a lack of markets. It is also appropriate to classify as contingent resources the estimated discovered recoverable quantities associated with a project in the early evaluation stage. For Cenovus, the contingencies which must be overcome to enable the classification of bitumen contingent resources as reserves include regulatory application submission with no major issues raised, access to markets and intent to proceed by the operator and partners as evidenced by major capital expenditures planned within five years. The estimate of contingent resources has not been adjusted for risk based on the chance of development. There is no certainty that it will be commercially viable to produce any portion of the resources. Economic contingent resources – those contingent resources that are currently economically recoverable based on specific forecasts of commodity prices and costs. The IQRE used the same commodity price assumptions that were used for the 2009 reserves evaluation, which were determined in accordance with U.S. Securities and Exchange Commission requirements. Prospective resources are those quantities of bitumen estimated, as of a given date, to be potentially recoverable from undiscovered accumulations by application of future development projects. Prospective resources have both an associated chance of discovery and a chance of development. Prospective Resources are further subdivided in accordance with the level of certainty associated with recoverable estimates assuming their discovery and development and may be subclassified based on project maturity. Unrecoverable is that portion of discovered or undiscovered BIIP quantities which is estimated, as of a given date, not to be recoverable by future development projects. A portion of these quantities may become recoverable in the future as commercial circumstances change or technological developments occur; the remaining portion may never be recovered due to the physical/chemical constraints represented by subsurface interaction of fluids and reservoir rocks. Best estimate is considered to be the best estimate of the quantity of resources that will actually be recovered. It is equally likely that the actual remaining quantities recovered will be greater or less than the best estimate. Those resources that fall within the best estimate have a 50% confidence level that the actual quantities recovered will equal or exceed the estimate. Proved reserves are those quantities of bitumen, which, by analysis of geoscience and engineering data, can be estimated with reasonable certainty to be economically producible from a given date forward, from known reservoirs and under existing economic conditions, operating methods and government regulations. Probable reserves are those additional reserves of bitumen that are less certain to be recovered than proved reserves, but which, together with proved reserves, are as likely as not to be recovered. Our disclosure of annual reserves data is made in accordance with U.S. disclosure requirements pursuant to an exemption received from the Canadian Securities Administrators. Accordingly, the proved plus probable reserves data may differ from corresponding information prepared in accordance with NI 51-101. See “Note Regarding Reserves Data and Other Oil and Gas Information” in Cenovus’s 2009 Annual Information Form (AIF). Certain natural gas volumes have been converted to barrels of oil equivalent (BOE) on the basis of one barrel (bbl) to six thousand cubic feet (Mcf). BOE may be misleading, particularly if used in isolation. A conversion ratio of one bbl to six Mcf is based on an energy equivalency conversion method primarily applicable at the burner tip and does not represent value equivalency at the well head.
Oil & gas information

24
This presentation contains certain forward-looking statements and information about our current expectations, estimates and projections about the future, based on certain assumptions made by the Company in light of its experience and perception of historical trends. Although we believe that the expectations represented by such forward-looking statements are reasonable, there can be no assurance that such expectations will prove to be correct.
Forward-looking statements are typically identified by words such as “anticipate”, “believe”, “expect”, “plan”, “intend”, “forecast” or “F”, “target”, “project”, “objective”, “could”, “focus”, “goal”, “proposed”, “scheduled”, “outlook”, “potential”, “may” or similar expressions suggesting future outcomes or statements regarding an outlook, including statements about our strategy, our projected future value or net asset value, schedules, land positions, production, including, without limitation, the stability or growth thereof, reserves and resources estimates, material properties, uses and development of our technology, risk mitigation efforts, commodity prices, shareholder value, cash flow, funding alternatives, costs and expected impact of future commitments in respect of our ongoing operations generally and with respect to certain properties and interests held by Cenovus. Readers are cautioned not to place undue reliance on forward-looking statements and information as our actual results may differ materially from those expressed or implied.
Forward-looking statements involve a number of assumptions, risks and uncertainties, some of which are specific to Cenovus and others that apply to the industry generally. The risk factors and uncertainties that could cause actual results to differ materially, and the factors or assumptions on which the forward-looking information is based, include, among other things: volatility of and assumptions regarding oil and gas prices; assumptions inherent in our current guidance; our projected capital investment levels, the flexibility of capital spending plans and the associated source of funding; the effect of our risk management program, including the impact of derivative financial instruments and our access to various sources of capital; accuracy of cost estimates; fluctuations in commodity, currency and interest rates; fluctuations in product supply and demand; market competition, including from alternative energy sources; risks inherent in our marketing operations, including credit risks; success of hedging strategies; maintaining a desirable debt to cash flow ratio; accuracy of our reserves, resources and future production estimates; estimates of quantities of oil, bitumen, natural gas and liquids from properties and other sources not currently classified as proved; our ability to replace and expand oil and gas reserves; the ability of us and ConocoPhillips to maintain our relationship and to successfully manage and operate the North American integrated heavy oil business and to obtain necessary regulatory approvals; the successful and timely implementation of capital projects; reliability of our assets; refining and marketing margins; potential disruption or unexpected technical difficulties in developing new products and manufacturing processes; potential failure of new products to achieve acceptance in the market; unexpected cost increases or technical difficulties in constructing or modifying manufacturing or refining facilities; unexpected difficulties in manufacturing, transporting or refining synthetic crude oil; risks associated with technology and its application to our business; our ability to generate sufficient cash flow from operations to meet our current and future obligations; our ability to access external sources of debt and equity capital; the timing and the costs of well and pipeline construction; our ability to secure adequate product transportation; changes in royalty, tax, environmental, greenhouse gas, carbon and other laws or regulations, or the interpretations of such laws or regulations, as adopted or proposed, the impact thereof and the costs associated with compliance; the expected impact and timing of various accounting pronouncements, rule changes and standards on us, our financial results and our consolidated financial statements; changes in the general economic, market and business conditions; the political and economic conditions in the countries in which we operate; the occurrence of unexpected events such as war, terrorist threats, hostilities, civil insurrection and instability affecting countries in which we operate; risks associated with existing and potential future lawsuits and regulatory actions made against us; our financing plans and initiatives; the historical financial information pertaining to our assets as operated by Encana prior to November 30, 2009 may not be representative of our results as an independent entity; our limited operating history as a separate entity and other risks and uncertainties described from time to time in the filings we make with securities regulatory authorities. The forward-looking statements and information contained in this presentation, including the assumptions, risks and uncertainties underlying such statements, are made as of the date of this presentation.
Many of these risk factors are discussed in further detail in our 2010 First Quarter Report to Shareholders, our 2009 AIF/Form 40-F and our MD&A for the year ended December 31, 2009, each as filed at www.sedar.com and www.sec.gov, and available at www.cenovus.com. The Cenovus 2010 Corporate Guidance, including the assumptions on which it is based, is available at www.cenovus.com.
Non-GAAP measures (Operating Earnings, Operating Cash Flow, Cash flow, Free Cash Flow, Capitalization and Adjusted EBITDA) have been described and presented in order to provide shareholders and potential investors with additional information regarding Cenovus’s liquidity and its ability to generate funds to finance its operations. Please see our 2010 First Quarter Report to Shareholders for a full discussion of the use of each measure.
Forward-looking information
Related Documents