4 Employment Dynamics Key findings: • The working age population is expected to continue to grow. • The labour force has grown rapidly since 2000, but employment growth has not been able to keep up, and so the number of broadly unemployed individuals has increased. • There has been a substantial reduction in primary sector employment between 2000 and 2004. • Within total employment, the number of employed matriculants increased rapidly, pointing to increasing average educational attainment amongst the Province’s employed population. • However, broad unemployment has increased substantially. • There are important spatial differences within the Western Cape. • The challenge of making a significant impact on unemployment levels over short periods of time are shown to be immense, requiring rates of economic growth and levels of employment intensity significantly higher than currently experienced.

Welcome message from author
This document is posted to help you gain knowledge. Please leave a comment to let me know what you think about it! Share it to your friends and learn new things together.
Transcript
4Employment Dynamics
Key findings:
• The working age population is expected to continue to grow.
• The labour force has grown rapidly since 2000, but employment growth has not been able to keep up, and so the number of broadly unemployed individuals has increased.
• There has been a substantial reduction in primary sector employment between 2000 and 2004.
• Within total employment, the number of employed matriculants increased rapidly, pointing to increasing average educational attainment amongst the Province’s employed population.
• However, broad unemployment has increased substantially.
• There are important spatial differences within the Western Cape.
• The challenge of making a significant impact on unemployment levels over short periods of time are shown to be immense, requiring rates of economic growth and levels of employment intensity significantly higher than currently experienced.

Western Cape Provincial Economic Review & Outlook 2006154

155Chapter 4 – Employment Dynamics
1. Introduction
Shared growth and integrated development in the Western Cape depend critically on improved labour market performance and enhanced economic empowerment and participation, particularly among poorer communities.
There is much evidence pointing to the persistence of high unemployment levels, despite recent economic growth successes. This has contributed to entrenched and deepening poverty, and has stretched the development gap – the antithesis of shared growth and integrated development.
Job creation and improved labour market performance are fundamental to building a shared, inclusive and vibrant economy that responds to the dilemma of systemic poverty and inequality.
However, creating jobs and ensuring that all groups within society are able to access these jobs are no simple tasks.
This chapter presents a closer analysis of the Western Cape labour market, providing both an historical review and a forward projection or outlook. This sets a credible analytical platform to debate the appropriate interventions for improved Provincial labour market performance, enhanced job creation and reduced unemployment.
Section two of the chapter investigates demographic trends in the Province – changes in the historical population size and structure, as well as future expected changes to 2015 – using the ASSA1-based demographic model commissioned by the Western Cape Department of Social Services and Poverty Alleviation.
Such demographic trend analysis is important for future labour market projections, as the size and structure of the labour force are closely linked to that of the working age population (15-65 year-olds)2.
Section three moves on to analyse developments in the labour market between 2000 and 2004. Important questions revolve around whether the Western Cape has experienced positive job creation over the period, and whether unemployment has continued its rising trend.
The section presents a clear picture of the structure of the labour force, employment and unemployment. The analysis pays particular attention to youth (15-34 year-olds), in line with the trends identified in PER&O 2005, as well as national and Provincial government policy emphasis.
1 Actuarial Society of South Africa 2 All labour market analyses in this chapter use age groups from 15-65 years – the years that are defined as working age. However, the demographic projections use age groups that start on a multiple of 5 and end on a 4 or a 9, for example, 0-4; 5-9; 10-14; 60-64; and therefore 15-64.
Western Cape Provincial Economic Review & Outlook 2006
Geography is becoming increasingly important within the policy context, and the spatial analysis of employment and unemployment in PER&O 2005 is updated and extended in this chapter.
Section four begins to look at labour market winners and losers within a spatial context. As different regions have diverse economic structures, it is reasonable to expect varying experiences of recent economic developments, both at the aggregate and sectoral levels.
The final section of the chapter takes the Western Cape labour market analysis an important step further, presenting simple scenarios of labour market performance up to 2015.
Like all scenario projections, these are subject to various constraints, not least of which is the inability to control for all possible events that may affect the labour market. However, it is hoped that this exercise will help to stimulate the debate around future Provincial labour market performance.
As part of this, the scenarios investigate the feasibility of halving broad unemployment in the Western Cape by 2015.
Readers should note that since this chapter examines the Western Cape labour market from a number of different angles – demographically, spatially and structurally – trends witnessed in a particular area are likely to be congruent to those observed in the complementary analyses, and thus do not represent a duplication of information.
156
157Chapter 4 – Employment Dynamics
2. Demographic trends to 2015
2.1 Population size and structure
Labour market performance relates largely to the quantity and quality of labour supply and the quantity and quality of labour demand.
A key determinant of labour supply is the population size and structure. Trends in the Province’s demographic profile are essential in understanding labour market performance in the Western Cape.
The demographic analysis in this chapter draws on the demographic model commissioned by the Western Cape Department of Social Services. Taking both HIV/Aids and migration into account, the model adapts the ASSA 2003 model to the Western Cape, projecting the Province’s population from 2001 to 2025. The analysis below only considers the projections to 2015.
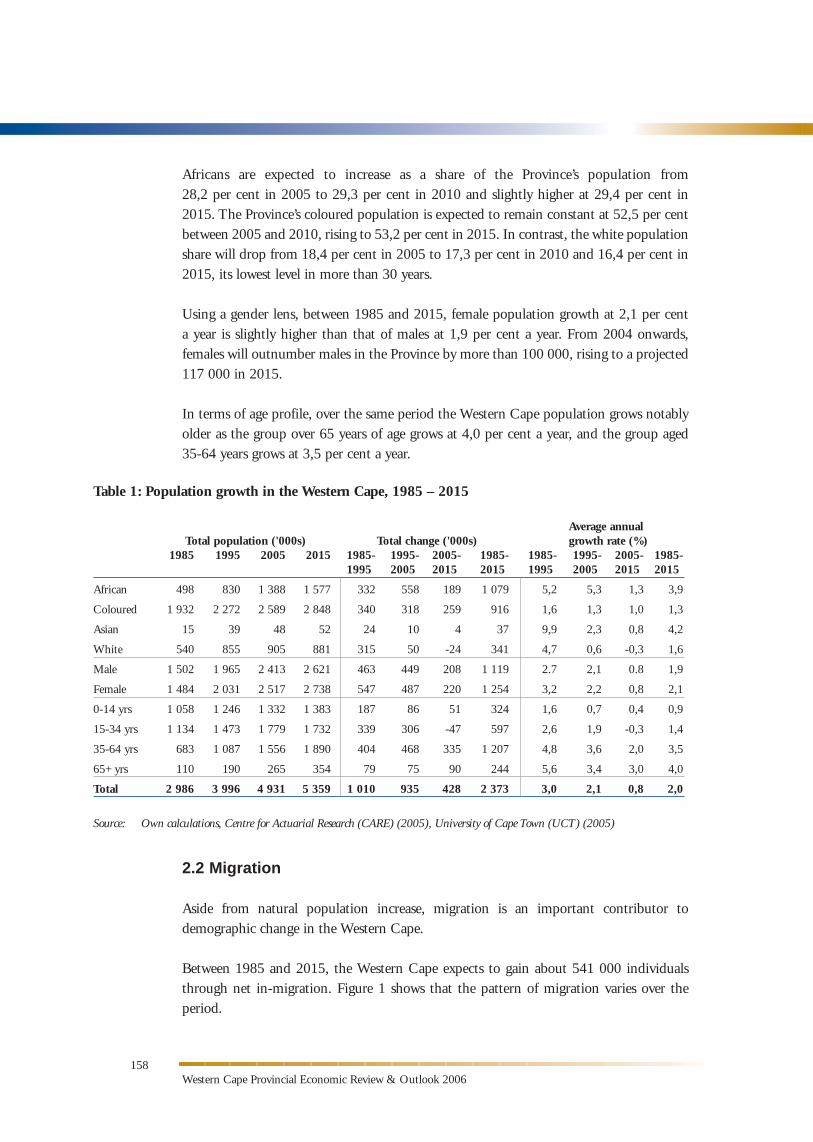
As seen in table 1, the model estimates that about 4,9-million people lived in the Western Cape in 2005. This tally represents an increase of 935 000 over the 1995 headcount and over 1,9-million more than in 1985.
The Province has therefore seen relatively rapid population growth over the past two decades, with an average growth rate of 3,0 per cent a year between 1985 and 1995 and 2,1 per cent a year between 1995 and 2005.
Projections suggest a marked slowing down of Provincial population expansion over the next 10 years. It is estimated that by 2015, just under 5,4-million people will live in the Western Cape. The expected headcount represents an increase of 428 000 individuals over the decade, equivalent to an average annual growth rate of 0,8 per cent.
Africans constitute the most rapidly growing segment of the provincial population, and are expected to grow at an average annual rate of 3,9 per cent between 1985 and 2015. However, this rapid rate of growth is concentrated in the first two decades of the period, averaging more than five per cent a year between 1985 and 2005. Over the next 10 years, the average annual growth in the african population falls to an average of 1,3 per cent a year.
Population growth amongst coloureds and whites is notably slower at an average of 1,3 per cent and 1,6 per cent a year, respectively, and trends downwards over the three decades. While the coloured population growth rate falls from 1,6 per cent a year from 1985 to 1995 to an estimated 1,0 per cent a year from 2005 to 2015, that of whites actually turns negative over the latter period. In fact, the white population is expected to have peaked in 2005 at 905 000.
2.2 Migration
Aside from natural population increase, migration is an important contributor to demographic change in the Western Cape.
Between 1985 and 2015, the Western Cape expects to gain about 541 000 individuals through net in-migration. Figure 1 shows that the pattern of migration varies over the period.
Western Cape Provincial Economic Review & Outlook 2006
Africans are expected to increase as a share of the Province’s population from 28,2 per cent in 2005 to 29,3 per cent in 2010 and slightly higher at 29,4 per cent in 2015. The Province’s coloured population is expected to remain constant at 52,5 per cent between 2005 and 2010, rising to 53,2 per cent in 2015. In contrast, the white population share will drop from 18,4 per cent in 2005 to 17,3 per cent in 2010 and 16,4 per cent in 2015, its lowest level in more than 30 years.
Using a gender lens, between 1985 and 2015, female population growth at 2,1 per cent a year is slightly higher than that of males at 1,9 per cent a year. From 2004 onwards, females will outnumber males in the Province by more than 100 000, rising to a projected 117 000 in 2015.
In terms of age profile, over the same period the Western Cape population grows notably older as the group over 65 years of age grows at 4,0 per cent a year, and the group aged 35-64 years grows at 3,5 per cent a year.
158
Table 1: Population growth in the Western Cape, 1985 – 2015
Average annual Total population ('000s) Total change ('000s) growth rate (%) 1985 1995 2005 2015 1985- 1995- 2005- 1985- 1985- 1995- 2005- 1985- 1995- 2005- 2015- 2015- 1995- 2005- 2015- 2015-
African 498 830 1 388 1 577 332 558 189 1 079 5,2 5,3 1,3 3,9
Coloured 1 932 2 272 2 589 2 848 340 318 259 916 1,6 1,3 1,0 1,3
Asian 15 39 48 52 24 10 4 37 9,9 2,3 0,8 4,2
White 540 855 905 881 315 50 -24 341 4,7 0,6 -0,3 1,6
Male 1 502 1 965 2 413 2 621 463 449 208 1 119 2.7 2,1 0.8 1,9
Female 1 484 2 031 2 517 2 738 547 487 220 1 254 3,2 2,2 0,8 2,1
0-14 yrs 1 058 1 246 1 332 1 383 187 86 51 324 1,6 0,7 0,4 0,9
15-34 yrs 1 134 1 473 1 779 1 732 339 306 -47 597 2,6 1,9 -0,3 1,4
35-64 yrs 683 1 087 1 556 1 890 404 468 335 1 207 4,8 3,6 2,0 3,5
65+ yrs 110 190 265 354 79 75 90 244 5,6 3,4 3,0 4,0
Total 2 986 3 996 4 931 5 359 1 010 935 428 2 373 3,0 2,1 0,8 2,0
Source: Own calculations, Centre for Actuarial Research (CARE) (2005), University of Cape Town (UCT) (2005)
159Chapter 4 – Employment Dynamics
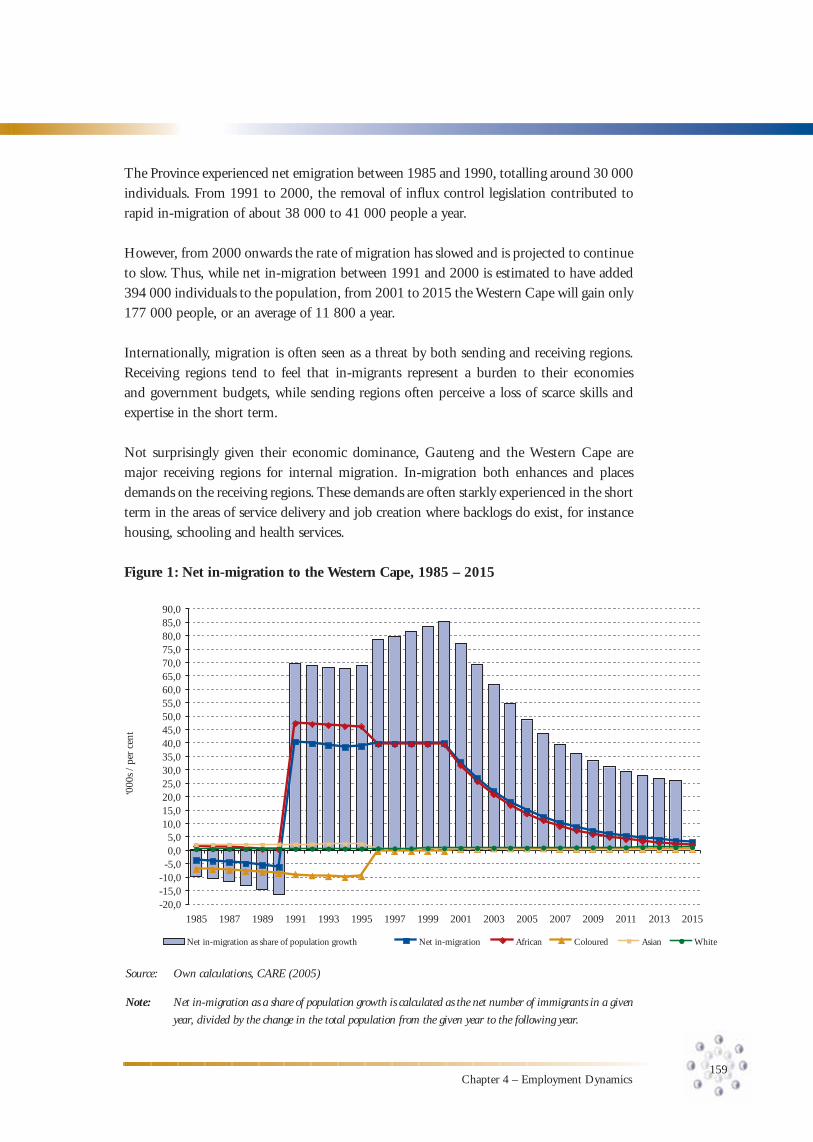
The Province experienced net emigration between 1985 and 1990, totalling around 30 000 individuals. From 1991 to 2000, the removal of influx control legislation contributed to rapid in-migration of about 38 000 to 41 000 people a year.
However, from 2000 onwards the rate of migration has slowed and is projected to continue to slow. Thus, while net in-migration between 1991 and 2000 is estimated to have added 394 000 individuals to the population, from 2001 to 2015 the Western Cape will gain only 177 000 people, or an average of 11 800 a year.
Internationally, migration is often seen as a threat by both sending and receiving regions. Receiving regions tend to feel that in-migrants represent a burden to their economies and government budgets, while sending regions often perceive a loss of scarce skills and expertise in the short term.
Not surprisingly given their economic dominance, Gauteng and the Western Cape are major receiving regions for internal migration. In-migration both enhances and places demands on the receiving regions. These demands are often starkly experienced in the short term in the areas of service delivery and job creation where backlogs do exist, for instance housing, schooling and health services.
Figure 1: Net in-migration to the Western Cape, 1985 – 2015
-20,0-15,0-10,0-5,00,05,0
10,015,020,025,030,035,040,045,050,055,060,065,070,075,080,085,090,0
1985 1987 1989 1991 1993 1995 1997 1999 2001 2003 2005 2007 2009 2011 2013 2015
Net in-migration as share of population growth Net in-migration African Coloured Asian White
‘000
s /
per
cent
Source: Own calculations, CARE (2005)
Note: Net in-migration as a share of population growth is calculated as the net number of immigrants in a given
year, divided by the change in the total population from the given year to the following year.
Source: Own calculations, CARE (2005)
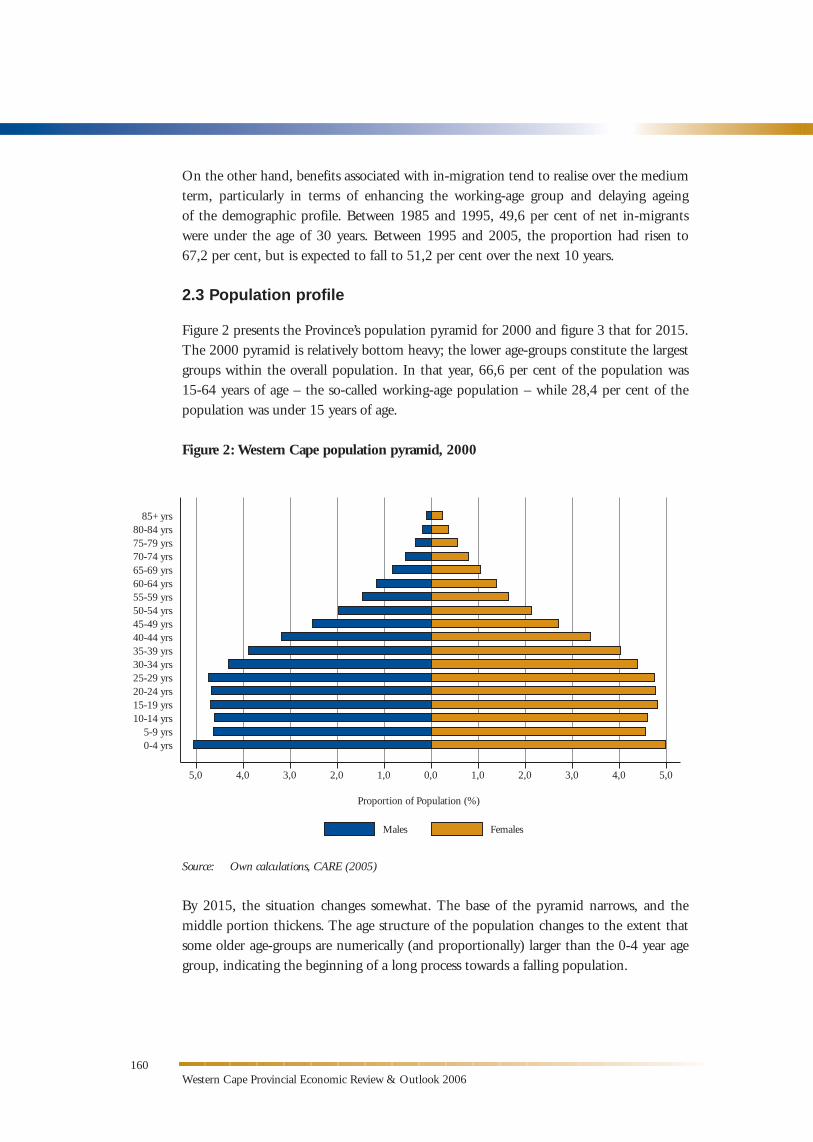
By 2015, the situation changes somewhat. The base of the pyramid narrows, and the middle portion thickens. The age structure of the population changes to the extent that some older age-groups are numerically (and proportionally) larger than the 0-4 year age group, indicating the beginning of a long process towards a falling population.
Western Cape Provincial Economic Review & Outlook 2006
On the other hand, benefits associated with in-migration tend to realise over the medium term, particularly in terms of enhancing the working-age group and delaying ageing of the demographic profile. Between 1985 and 1995, 49,6 per cent of net in-migrants were under the age of 30 years. Between 1995 and 2005, the proportion had risen to 67,2 per cent, but is expected to fall to 51,2 per cent over the next 10 years.
2.3 Population profile
Figure 2 presents the Province’s population pyramid for 2000 and figure 3 that for 2015. The 2000 pyramid is relatively bottom heavy; the lower age-groups constitute the largest groups within the overall population. In that year, 66,6 per cent of the population was 15-64 years of age – the so-called working-age population – while 28,4 per cent of the population was under 15 years of age.
Figure 2: Western Cape population pyramid, 2000
160
5,0 4,0 3,0 2,0 1,0 0,0 1,0 2,0 3,0 4,0 5,0
Proportion of Population (%)
0-4 yrs5-9 yrs
10-14 yrs15-19 yrs20-24 yrs25-29 yrs30-34 yrs35-39 yrs40-44 yrs45-49 yrs50-54 yrs55-59 yrs60-64 yrs65-69 yrs70-74 yrs75-79 yrs80-84 yrs
85+ yrs
Males Females
161Chapter 4 – Employment Dynamics
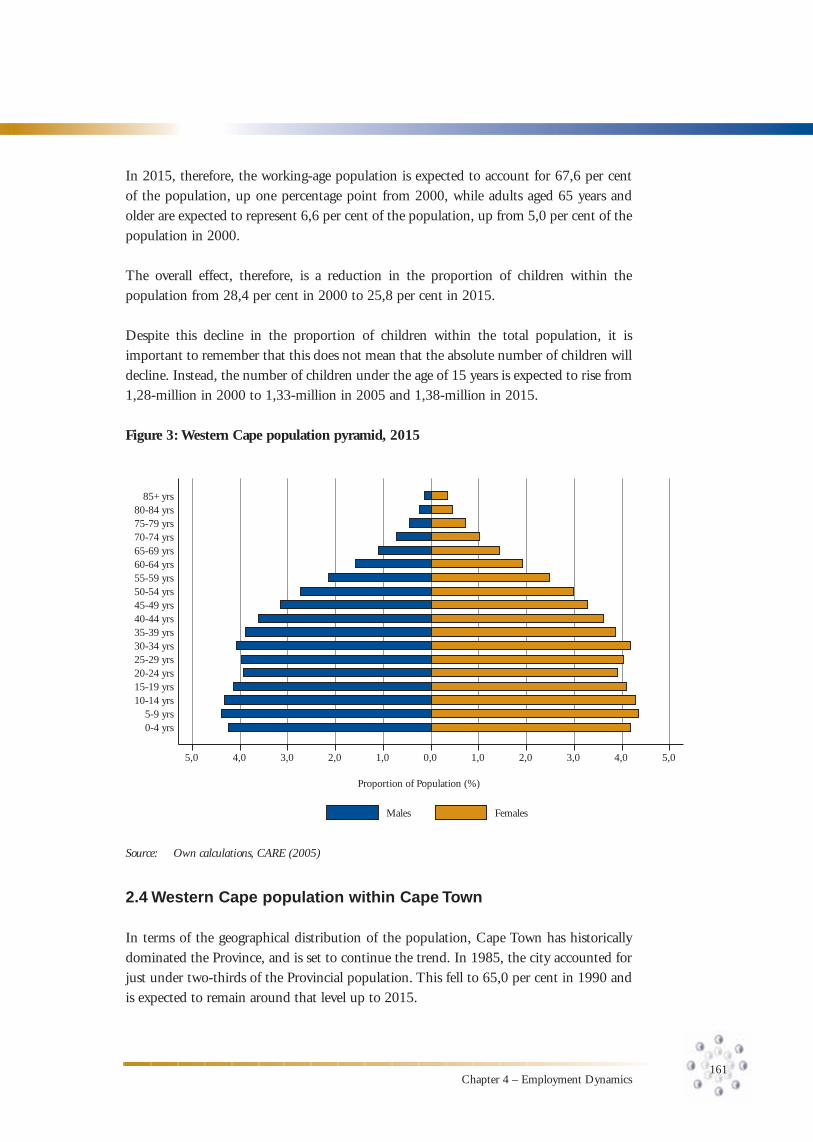
In 2015, therefore, the working-age population is expected to account for 67,6 per cent of the population, up one percentage point from 2000, while adults aged 65 years and older are expected to represent 6,6 per cent of the population, up from 5,0 per cent of the population in 2000.
The overall effect, therefore, is a reduction in the proportion of children within the population from 28,4 per cent in 2000 to 25,8 per cent in 2015.
Despite this decline in the proportion of children within the total population, it is important to remember that this does not mean that the absolute number of children will decline. Instead, the number of children under the age of 15 years is expected to rise from 1,28-million in 2000 to 1,33-million in 2005 and 1,38-million in 2015.
Figure 3: Western Cape population pyramid, 2015
5,0 4,0 3,0 2,0 1,0 0,0 1,0 2,0 3,0 4,0 5,0
Proportion of Population (%)
0-4 yrs5-9 yrs
10-14 yrs15-19 yrs20-24 yrs25-29 yrs30-34 yrs35-39 yrs40-44 yrs45-49 yrs50-54 yrs55-59 yrs60-64 yrs65-69 yrs70-74 yrs75-79 yrs80-84 yrs
85+ yrs
Males Females
Source: Own calculations, CARE (2005)
2.4 Western Cape population within Cape Town
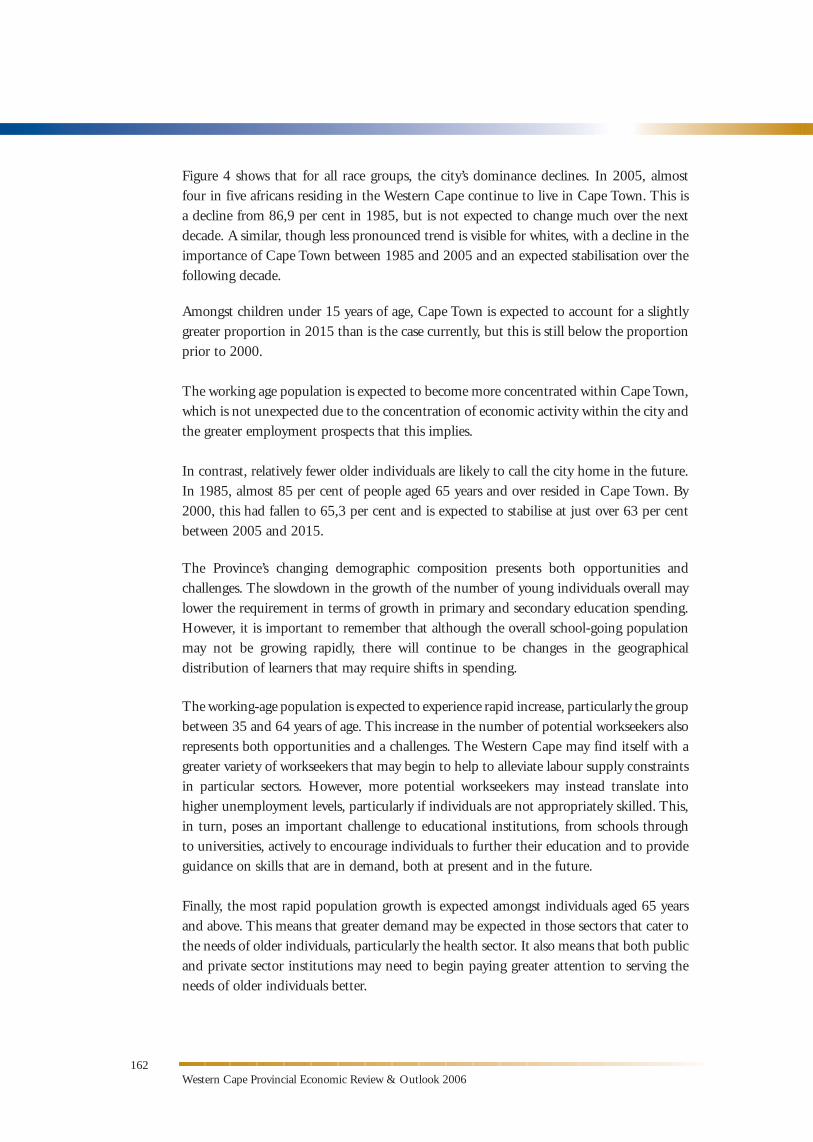
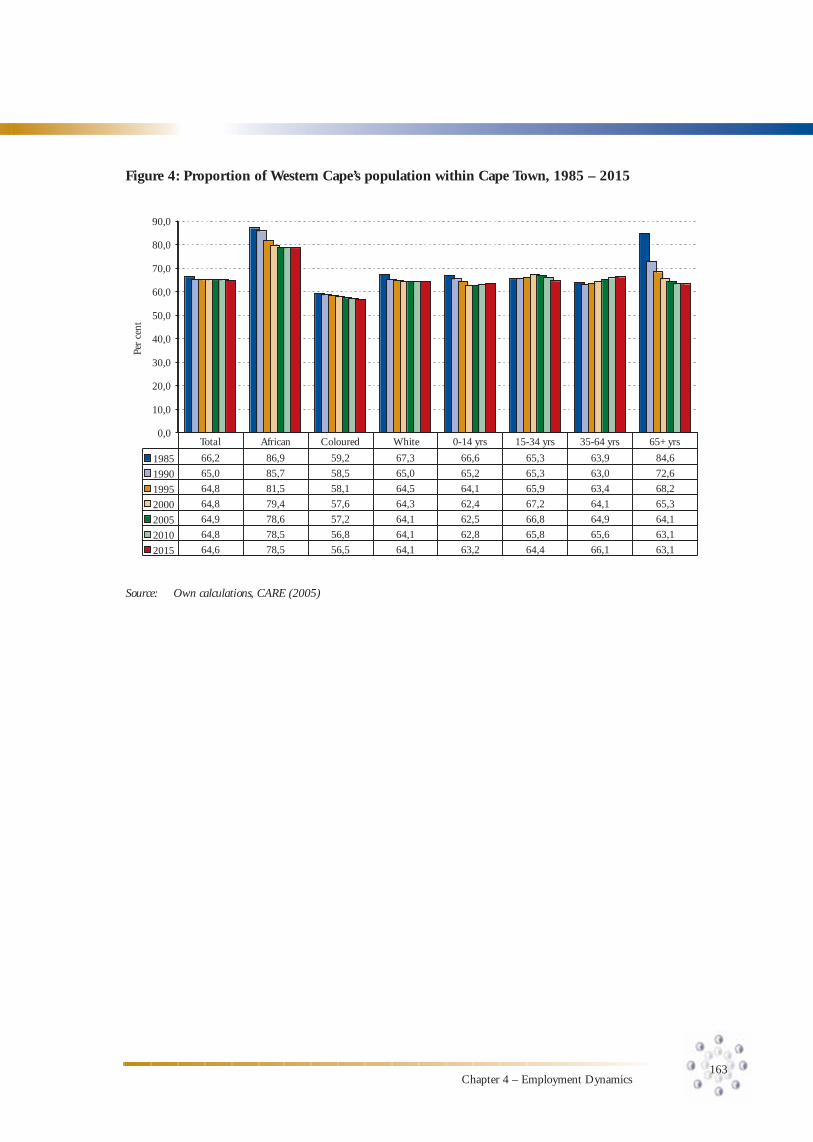
In terms of the geographical distribution of the population, Cape Town has historically dominated the Province, and is set to continue the trend. In 1985, the city accounted for just under two-thirds of the Provincial population. This fell to 65,0 per cent in 1990 and is expected to remain around that level up to 2015.
Western Cape Provincial Economic Review & Outlook 2006
Figure 4 shows that for all race groups, the city’s dominance declines. In 2005, almost four in five africans residing in the Western Cape continue to live in Cape Town. This is a decline from 86,9 per cent in 1985, but is not expected to change much over the next decade. A similar, though less pronounced trend is visible for whites, with a decline in the importance of Cape Town between 1985 and 2005 and an expected stabilisation over the following decade.
Amongst children under 15 years of age, Cape Town is expected to account for a slightly greater proportion in 2015 than is the case currently, but this is still below the proportion prior to 2000.
The working age population is expected to become more concentrated within Cape Town, which is not unexpected due to the concentration of economic activity within the city and the greater employment prospects that this implies.
In contrast, relatively fewer older individuals are likely to call the city home in the future. In 1985, almost 85 per cent of people aged 65 years and over resided in Cape Town. By 2000, this had fallen to 65,3 per cent and is expected to stabilise at just over 63 per cent between 2005 and 2015.
The Province’s changing demographic composition presents both opportunities and challenges. The slowdown in the growth of the number of young individuals overall may lower the requirement in terms of growth in primary and secondary education spending. However, it is important to remember that although the overall school-going population may not be growing rapidly, there will continue to be changes in the geographical distribution of learners that may require shifts in spending.
The working-age population is expected to experience rapid increase, particularly the group between 35 and 64 years of age. This increase in the number of potential workseekers also represents both opportunities and a challenges. The Western Cape may find itself with a greater variety of workseekers that may begin to help to alleviate labour supply constraints in particular sectors. However, more potential workseekers may instead translate into higher unemployment levels, particularly if individuals are not appropriately skilled. This, in turn, poses an important challenge to educational institutions, from schools through to universities, actively to encourage individuals to further their education and to provide guidance on skills that are in demand, both at present and in the future.
Finally, the most rapid population growth is expected amongst individuals aged 65 years and above. This means that greater demand may be expected in those sectors that cater to the needs of older individuals, particularly the health sector. It also means that both public and private sector institutions may need to begin paying greater attention to serving the needs of older individuals better.
162
163Chapter 4 – Employment Dynamics
Figure 4: Proportion of Western Cape’s population within Cape Town, 1985 – 2015
Source: Own calculations, CARE (2005)
2015
1985 66,2 86,9 59,2 67,3 66,6 65,3 63,9 84,6
1990 65,0 85,7 58,5 65,0 65,2 65,3 63,0 72,6
1995 64,8 81,5 58,1 64,1 65,9 63,4 68,2
2000 64,8 79,4 57,6 64,3 62,4 67,2 64,1 65,3
2005 64,9 78,6 57,2 64,1 62,5 66,8 64,9 64,1
64,8 78,5 56,8 64,1 62,8 65,8 65,6 63,1
64,6 78,5 56,5 64,1 63,2 64,4 66,1 63,1
African Coloured 0-14 yrs 15-34 yrs 35-64 yrs 65+ yrs0,0
10,0
20,0
30,0
40,0
50,0
60,0
70,0
80,0
90,0
64,5
Total
2010
Per
cent
White
Western Cape Provincial Economic Review & Outlook 2006
3. Employment and unemployment in the Western Cape, 2000 – 2004
3.1 Recent employment and unemployment trends
The most comprehensive source of labour market data in SA is the biannual LFS, conducted by Stats SA. This is a nationally representative survey of approximately 100 000 individuals from which a variety of labour market and other data can be gleaned. The analysis below draws on the September 2000 and the September 2004 LFSs3,4.
The working age population (individuals 15-65 years of age) constitutes the group from which the labour force can potentially be drawn. Individuals in this group can choose to be part of the labour force or not. As a result, the size of the working age population will impact on the size of the labour force.
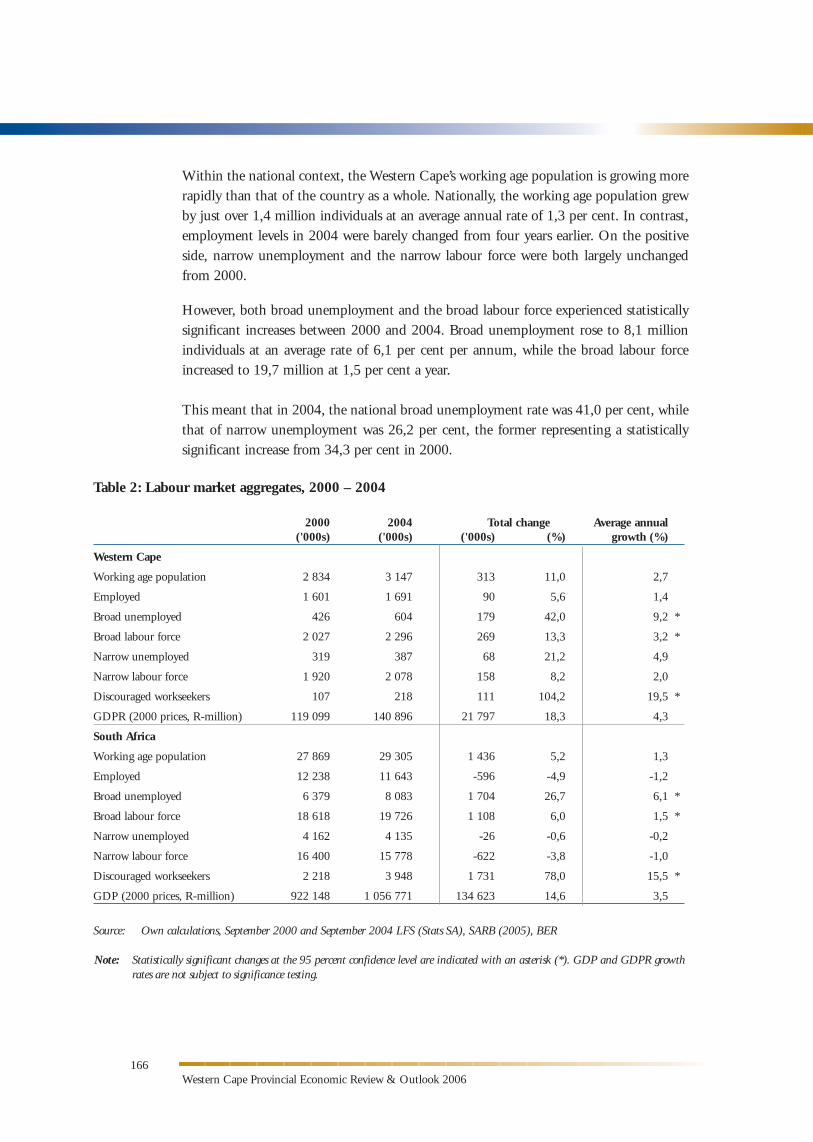
Table 2 shows that between 2000 and 2004, the working age population in the Western Cape appears to have grown relatively rapidly, at 2,7 per cent a year. This amounts to an increase of around 313 000 individuals.
Over the same period, the broad labour force has expanded by 269 000 individuals at an average rate of 3,2 per cent a year. It is not possible to discern whether employment has increased over the period, since the change is not significant at the 95 per cent level of confidence.
Use of confidence intervals in statistical analysis
Confidence intervals are calculated because the datasets used are from sample surveys and the possibility therefore exists that the estimates generated will not be truly representative of the entire population. The confidence intervals indicate the likely range within which the estimate should fall, if one was to resample the same population and calculate these estimates with the new data*. This range is therefore a valuable marker and should be given as much attention as the point estimate.
The confidence intervals become particularly useful when making comparisons across data points. If the intervals overlap, one cannot say with any precision that there has been a change. If they do not overlap, one can say with a certain degree of confidence that a statistically significant change has occurred. Although the confidence intervals are useful in that they provide us with the likely range, they are affected by data quality concerns, and are only as ‘precise’ as the data upon which they are based.
* The confidence interval is generally calculated according to a specified probability of the interval containing the true population value. The most common level is at 95 per cent, which means that, statistically, the true value has a 0,95 probability of falling within this range.
Source: PER&O 2005
164
3 The LFS of September 2000 used in this chapter has population weights derived from the 2001 Census calculated by Stats SA. This dataset was originally released with weights based on the 1996 Census. The September 2004 LFS is weighted according to the 2001 Census. 4 Note that the detailed datasets of the September 2005 LFS were not available at the time of analysis.
165Chapter 4 – Employment Dynamics
Both broad and narrow unemployment appear to have increased over the period, as has the narrow labour force, although it is only the change in the number of broadly unemployed individuals that is statistically significant. Broad unemployment grew by 179 000 individuals over the four-year period, equivalent to an average annual growth rate of 9,2 per cent.
The Western Cape has also seen a statistically significant increase in the number of so-called discouraged workseekers – individuals who are unemployed but have given up actively looking for work. They are captured in the broad definition of unemployment, but not the narrow definition.
The number of discouraged workseekers increased by an average of 19,5 per cent a year, off a relatively low base of 107 000 individuals in 2000 to 218 000 in 2004. Despite this rapid rate of growth, the Western Cape remains home to relatively few discouraged workseekers. In the Western Cape, discouraged workseekers constituted 9,5 per cent of the broad labour force, compared to 20,0 per cent for the country as a whole.
Definitions of unemployment
Translating the layperson’s concept of being unemployed (‘not having a job’) into a technical and measurable form is a relatively difficult task. Following that used by the International Labour Organisation (ILO), SA’s official (narrow) definition of unemployment definition classifies individuals as being unemployed if they “(a) did not work during the seven days prior to the interview, (b) want to work and are available to start work within a week of the interview, and (c) have taken active steps to look for work or to start some form of self-employment in the four weeks prior to the interview” (Stats SA Statistical Release P0210 2002: xv).
This places the ‘burden of proof’ on the shoulders of non-employed individuals: they need to demonstrate that they have made some attempt at finding or creating a job for themselves.
The expanded (broad) definition of unemployment, on the other hand, does not include criterion (c).
Although the narrow definition is the official definition in SA, the evidence suggests that the broad definition is better able to accurately identify the unemployed in countries like SA, where unemployment rates are very high and many individuals give up looking for work, becoming what is termed ‘discouraged workers’ (see Kingdon and Knight 2001: 84-87, for a complete discussion).
Thus, although details of narrow unemployment are provided, most of the analysis in this chapter uses the expanded definition of unemployment. That is, simply stated, if you have not worked in the last week but want to work and would, if offered a job, be able to start working within a week, you are classified as unemployed according to the expanded definition.
Source: PER&O 2005
Western Cape Provincial Economic Review & Outlook 2006
Within the national context, the Western Cape’s working age population is growing more rapidly than that of the country as a whole. Nationally, the working age population grew by just over 1,4 million individuals at an average annual rate of 1,3 per cent. In contrast, employment levels in 2004 were barely changed from four years earlier. On the positive side, narrow unemployment and the narrow labour force were both largely unchanged from 2000.
However, both broad unemployment and the broad labour force experienced statistically significant increases between 2000 and 2004. Broad unemployment rose to 8,1 million individuals at an average rate of 6,1 per cent per annum, while the broad labour force increased to 19,7 million at 1,5 per cent a year.
This meant that in 2004, the national broad unemployment rate was 41,0 per cent, while that of narrow unemployment was 26,2 per cent, the former representing a statistically significant increase from 34,3 per cent in 2000.
166
Table 2: Labour market aggregates, 2000 – 2004
2000 2004 Total change Average annual ('000s) ('000s) ('000s) (%) growth (%)
Western Cape
Working age population 2 834 3 147 313 11,0 2,7
Employed 1 601 1 691 90 5,6 1,4
Broad unemployed 426 604 179 42,0 9,2 *
Broad labour force 2 027 2 296 269 13,3 3,2 *
Narrow unemployed 319 387 68 21,2 4,9
Narrow labour force 1 920 2 078 158 8,2 2,0
Discouraged workseekers 107 218 111 104,2 19,5 *
GDPR (2000 prices, R-million) 119 099 140 896 21 797 18,3 4,3
South Africa
Working age population 27 869 29 305 1 436 5,2 1,3
Employed 12 238 11 643 -596 -4,9 -1,2
Broad unemployed 6 379 8 083 1 704 26,7 6,1 *
Broad labour force 18 618 19 726 1 108 6,0 1,5 *
Narrow unemployed 4 162 4 135 -26 -0,6 -0,2
Narrow labour force 16 400 15 778 -622 -3,8 -1,0
Discouraged workseekers 2 218 3 948 1 731 78,0 15,5 *
GDP (2000 prices, R-million) 922 148 1 056 771 134 623 14,6 3,5
Source: Own calculations, September 2000 and September 2004 LFS (Stats SA), SARB (2005), BER
Note: Statistically significant changes at the 95 percent confidence level are indicated with an asterisk (*). GDP and GDPR growth rates are not subject to significance testing.
167Chapter 4 – Employment Dynamics
Natural population growth, coupled with in-migration, means that the working age population in the Western Cape has grown relatively rapidly compared to the national situation. This places the Province under above-average pressure to create employment opportunities to absorb new labour market entrants.
Despite positive economic growth between 2000 and 2004, both nationally and in the Western Cape, national employment appears to have stagnated, as has employment at the Provincial level. Overall, therefore, employment has not been able to grow sufficiently and the number of unemployed individuals in the Western Cape has grown relatively rapidly, with broad unemployment growing approximately 1,5 times faster in the Province than nationally.
Calculating target employment growth rates (TGRs) and employment absorption rates (EARs) are useful measures to assess and explain labour market performance and trends in the context of an expanding labour force.
Target employment growth rate and employment absorption rate
The TGR measures how fast employment should have expanded over the period to provide work for all net entrants to the labour market.
The TGR is defined as where EAPk refers to the economically active
population of group k, defined by any given covariate, and Lk is the number of employed group k individuals.
The TGR is independent of the rate or level of unemployment in the base year, because it captures the growth rate required to provide employment to only new entrants. If actual employment growth reached the target rate, the overall rate of unemployment would decline. This is because, considering new labour market entrants as a group on their own, if employment grew at the target growth rate, thereby absorbing all new entrants into employment, their unemployment rate would be zero. The fact that, in reality, not all new jobs go to new entrants does not impact on this reduction in the overall unemployment rate.
The EAR answers the question ‘by how much did employment growth miss the target growth rate?’ by comparing actual employment growth and the target rate.
Using the same symbols as above, the EAR is expressed as a percentage and is defined as follows:
The higher the EAR, the better the actual relative to the desired employment performance. If all net labour force entrants are absorbed into employment, the EAR will be 100. Where only some net labour force entrants find jobs, the EAR is less than 100, while a reduction in the absolute level of unemployment is associated with an EAR above 100.
Western Cape Provincial Economic Review & Outlook 2006
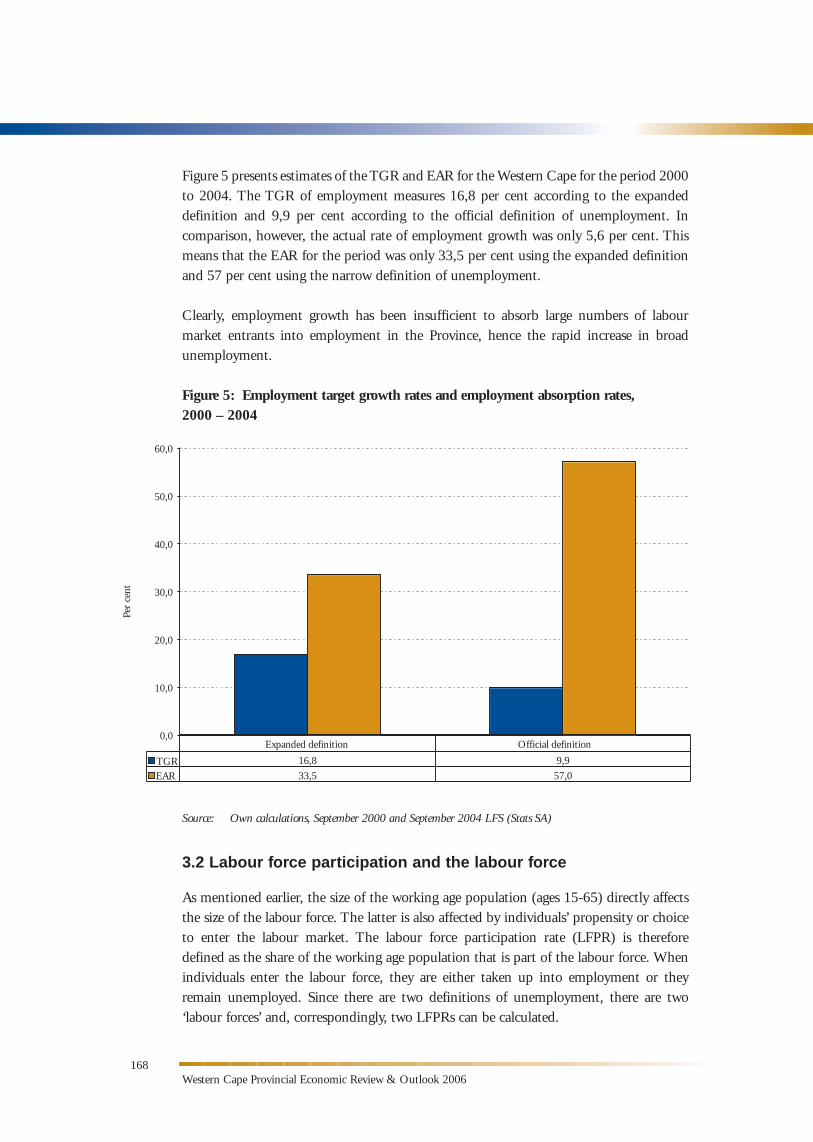
Figure 5 presents estimates of the TGR and EAR for the Western Cape for the period 2000 to 2004. The TGR of employment measures 16,8 per cent according to the expanded definition and 9,9 per cent according to the official definition of unemployment. In comparison, however, the actual rate of employment growth was only 5,6 per cent. This means that the EAR for the period was only 33,5 per cent using the expanded definition and 57 per cent using the narrow definition of unemployment.
Clearly, employment growth has been insufficient to absorb large numbers of labour market entrants into employment in the Province, hence the rapid increase in broad unemployment.
Figure 5: Employment target growth rates and employment absorption rates, 2000 – 2004
Source: Own calculations, September 2000 and September 2004 LFS (Stats SA)
3.2 Labour force participation and the labour force
As mentioned earlier, the size of the working age population (ages 15-65) directly affects the size of the labour force. The latter is also affected by individuals’ propensity or choice to enter the labour market. The labour force participation rate (LFPR) is therefore defined as the share of the working age population that is part of the labour force. When individuals enter the labour force, they are either taken up into employment or they remain unemployed. Since there are two definitions of unemployment, there are two ‘labour forces’ and, correspondingly, two LFPRs can be calculated.
168
16,8 9,9
33,5 57,0
0,0
10,0
20,0
30,0
40,0
50,0
60,0
Expanded definition Official definition
EAR
Per
cent
TGR
169Chapter 4 – Employment Dynamics
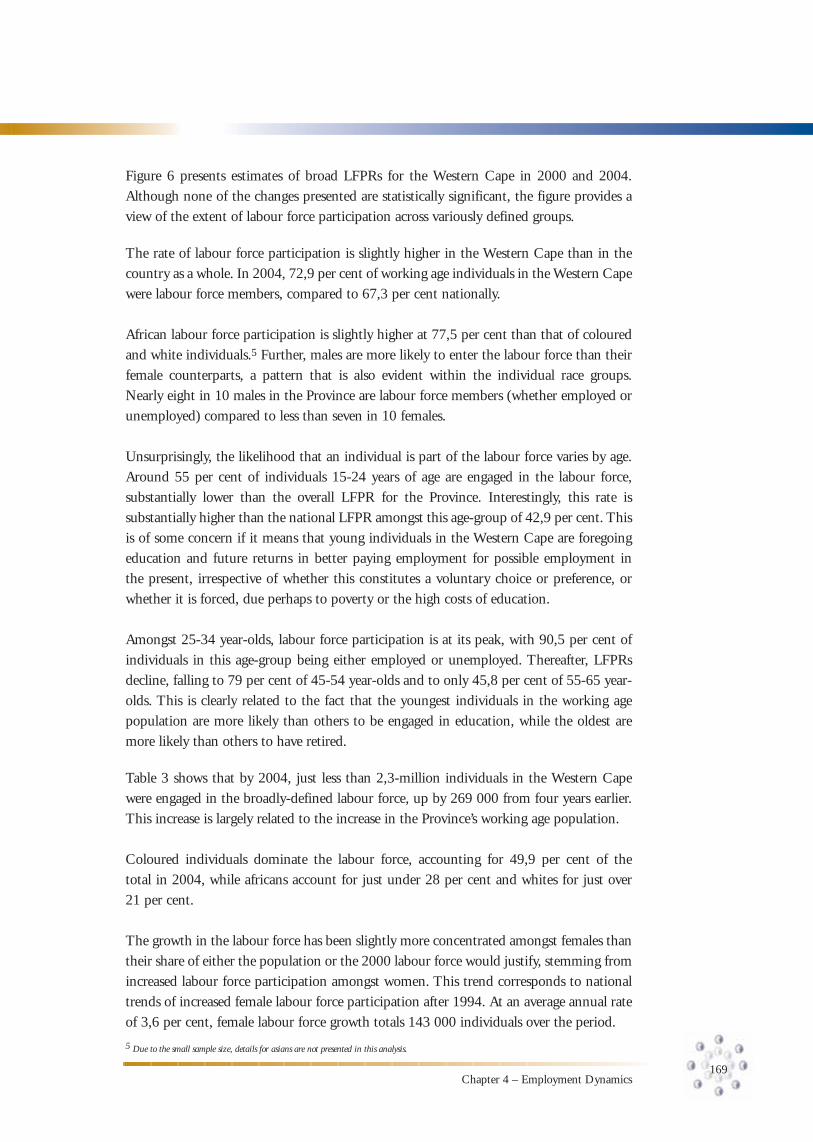
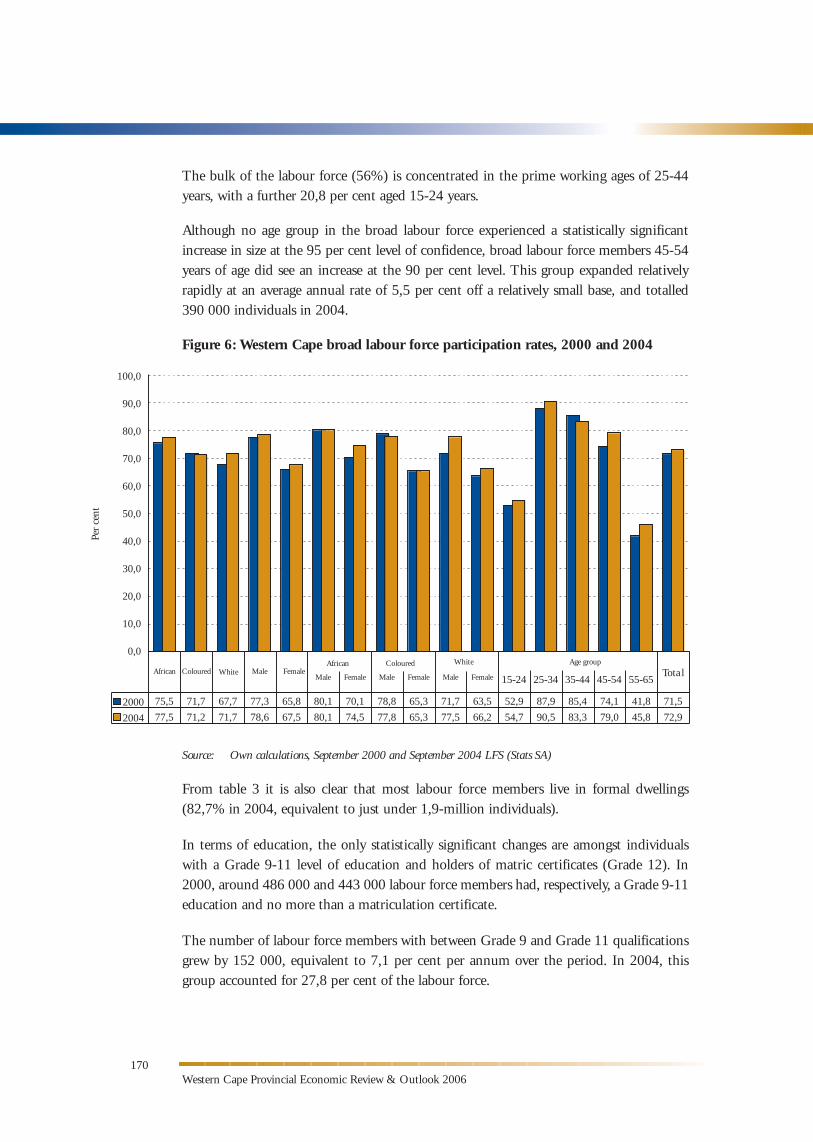
Figure 6 presents estimates of broad LFPRs for the Western Cape in 2000 and 2004. Although none of the changes presented are statistically significant, the figure provides a view of the extent of labour force participation across variously defined groups.
The rate of labour force participation is slightly higher in the Western Cape than in the country as a whole. In 2004, 72,9 per cent of working age individuals in the Western Cape were labour force members, compared to 67,3 per cent nationally.
African labour force participation is slightly higher at 77,5 per cent than that of coloured and white individuals.5 Further, males are more likely to enter the labour force than their female counterparts, a pattern that is also evident within the individual race groups. Nearly eight in 10 males in the Province are labour force members (whether employed or unemployed) compared to less than seven in 10 females.
Unsurprisingly, the likelihood that an individual is part of the labour force varies by age. Around 55 per cent of individuals 15-24 years of age are engaged in the labour force, substantially lower than the overall LFPR for the Province. Interestingly, this rate is substantially higher than the national LFPR amongst this age-group of 42,9 per cent. This is of some concern if it means that young individuals in the Western Cape are foregoing education and future returns in better paying employment for possible employment in the present, irrespective of whether this constitutes a voluntary choice or preference, or whether it is forced, due perhaps to poverty or the high costs of education.
Amongst 25-34 year-olds, labour force participation is at its peak, with 90,5 per cent of individuals in this age-group being either employed or unemployed. Thereafter, LFPRs decline, falling to 79 per cent of 45-54 year-olds and to only 45,8 per cent of 55-65 year-olds. This is clearly related to the fact that the youngest individuals in the working age population are more likely than others to be engaged in education, while the oldest are more likely than others to have retired.
Table 3 shows that by 2004, just less than 2,3-million individuals in the Western Cape were engaged in the broadly-defined labour force, up by 269 000 from four years earlier. This increase is largely related to the increase in the Province’s working age population.
Coloured individuals dominate the labour force, accounting for 49,9 per cent of the total in 2004, while africans account for just under 28 per cent and whites for just over 21 per cent.
The growth in the labour force has been slightly more concentrated amongst females than their share of either the population or the 2000 labour force would justify, stemming from increased labour force participation amongst women. This trend corresponds to national trends of increased female labour force participation after 1994. At an average annual rate of 3,6 per cent, female labour force growth totals 143 000 individuals over the period.
5 Due to the small sample size, details for asians are not presented in this analysis.
Western Cape Provincial Economic Review & Outlook 2006
The bulk of the labour force (56%) is concentrated in the prime working ages of 25-44 years, with a further 20,8 per cent aged 15-24 years.
Although no age group in the broad labour force experienced a statistically significant increase in size at the 95 per cent level of confidence, broad labour force members 45-54 years of age did see an increase at the 90 per cent level. This group expanded relatively rapidly at an average annual rate of 5,5 per cent off a relatively small base, and totalled 390 000 individuals in 2004.
Figure 6: Western Cape broad labour force participation rates, 2000 and 2004
Source: Own calculations, September 2000 and September 2004 LFS (Stats SA)
From table 3 it is also clear that most labour force members live in formal dwellings (82,7% in 2004, equivalent to just under 1,9-million individuals).
In terms of education, the only statistically significant changes are amongst individuals with a Grade 9-11 level of education and holders of matric certificates (Grade 12). In 2000, around 486 000 and 443 000 labour force members had, respectively, a Grade 9-11 education and no more than a matriculation certificate.
The number of labour force members with between Grade 9 and Grade 11 qualifications grew by 152 000, equivalent to 7,1 per cent per annum over the period. In 2004, this group accounted for 27,8 per cent of the labour force.
170
African
2000 75,5 71,7 67,7 77,3 65,8 80,1 70,1 78,8 65,3 71,7 63,5 52,9 87,9 85,4 74,1 41,8 71,5
2004 77,5 71,2 71,7 78,6 67,5 80,1 74,5 77,8 65,3 77,5 66,2 54,7 90,5 83,3 79,0 45,8 72,9
Coloured Tota l
Per
cent
MaleWhiteAfrican
Male Female
Coloured
Male Female
White
Male Female 15-24 25-34 35-44 45-54 55-65Female
Age group
100,0
90,0
80,0
70,0
60,0
50,0
40,0
30,0
20,0
10,0
0,0
171Chapter 4 – Employment Dynamics
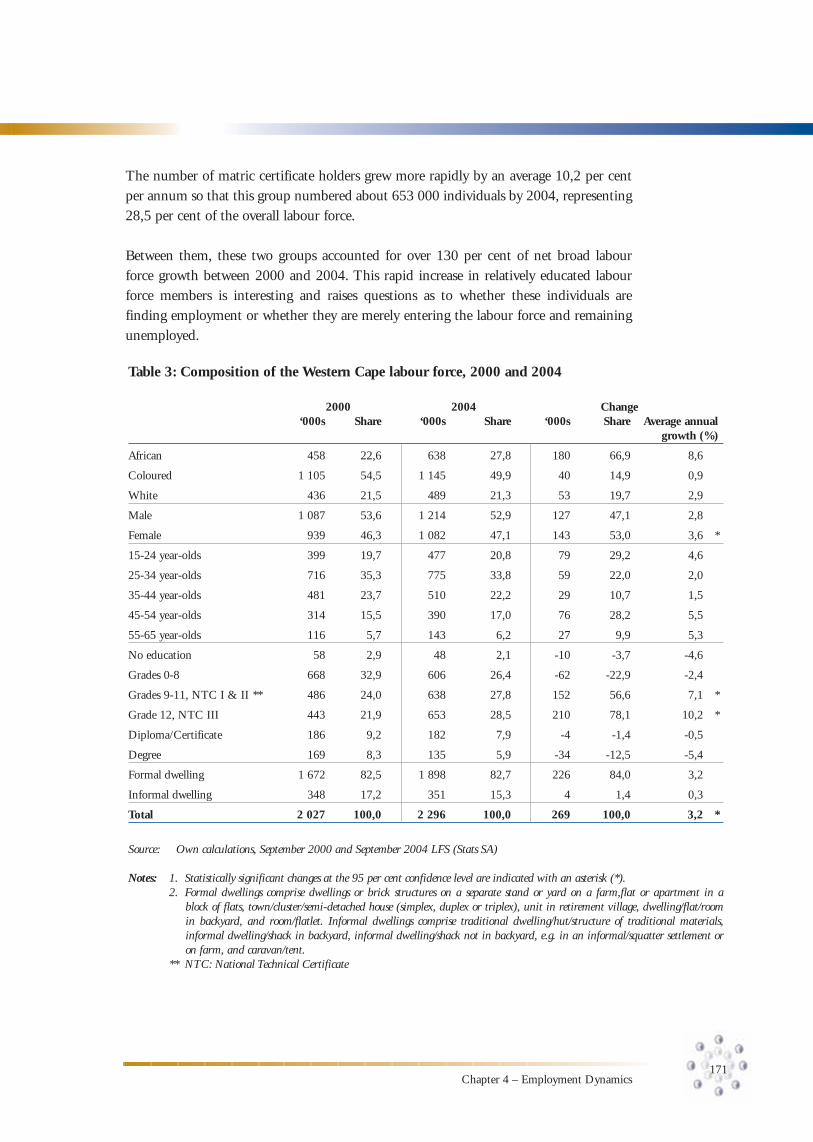
The number of matric certificate holders grew more rapidly by an average 10,2 per cent per annum so that this group numbered about 653 000 individuals by 2004, representing 28,5 per cent of the overall labour force.
Between them, these two groups accounted for over 130 per cent of net broad labour force growth between 2000 and 2004. This rapid increase in relatively educated labour force members is interesting and raises questions as to whether these individuals are finding employment or whether they are merely entering the labour force and remaining unemployed.
Table 3: Composition of the Western Cape labour force, 2000 and 2004
2000 2004 Change ‘000s Share ‘000s Share ‘000s Share Average annual growth (%)
African 458 22,6 638 27,8 180 66,9 8,6
Coloured 1 105 54,5 1 145 49,9 40 14,9 0,9
White 436 21,5 489 21,3 53 19,7 2,9
Male 1 087 53,6 1 214 52,9 127 47,1 2,8
Female 939 46,3 1 082 47,1 143 53,0 3,6 *
15-24 year-olds 399 19,7 477 20,8 79 29,2 4,6
25-34 year-olds 716 35,3 775 33,8 59 22,0 2,0
35-44 year-olds 481 23,7 510 22,2 29 10,7 1,5
45-54 year-olds 314 15,5 390 17,0 76 28,2 5,5
55-65 year-olds 116 5,7 143 6,2 27 9,9 5,3
No education 58 2,9 48 2,1 -10 -3,7 -4,6
Grades 0-8 668 32,9 606 26,4 -62 -22,9 -2,4
Grades 9-11, NTC I & II ** 486 24,0 638 27,8 152 56,6 7,1 *
Grade 12, NTC III 443 21,9 653 28,5 210 78,1 10,2 *
Diploma/Certificate 186 9,2 182 7,9 -4 -1,4 -0,5
Degree 169 8,3 135 5,9 -34 -12,5 -5,4
Formal dwelling 1 672 82,5 1 898 82,7 226 84,0 3,2
Informal dwelling 348 17,2 351 15,3 4 1,4 0,3
Total 2 027 100,0 2 296 100,0 269 100,0 3,2 *
Source: Own calculations, September 2000 and September 2004 LFS (Stats SA)
Notes: 1. Statistically significant changes at the 95 per cent confidence level are indicated with an asterisk (*). 2. Formal dwellings comprise dwellings or brick structures on a separate stand or yard on a farm,flat or apartment in a
block of flats, town/cluster/semi-detached house (simplex, duplex or triplex), unit in retirement village, dwelling/flat/room in backyard, and room/flatlet. Informal dwellings comprise traditional dwelling/hut/structure of traditional materials, informal dwelling/shack in backyard, informal dwelling/shack not in backyard, e.g. in an informal/squatter settlement or on farm, and caravan/tent.
** NTC: National Technical Certificate
Western Cape Provincial Economic Review & Outlook 2006
Further, the Western Cape is relatively fortunate compared to the rest of the country in this regard. The number of labour force members with matric certificates increased at a rate of 7,9 per cent nationally and only accounted for 26,2 per cent of the national labour force, while the number of labour force members with a Grade 9-11 education increased by 4,8 per cent a year.
The rapid increase in the numbers of Grade 9-11 graduates and matric certificate holders entering the labour force means that the Western Cape is slightly better off than other provinces in terms of the supply of relatively skilled labour. This also presents opportunities and challenges for the education sector in enabling and encouraging these individuals to acquire higher level skills, which would improve their future employment prospects.
3.3 Employment
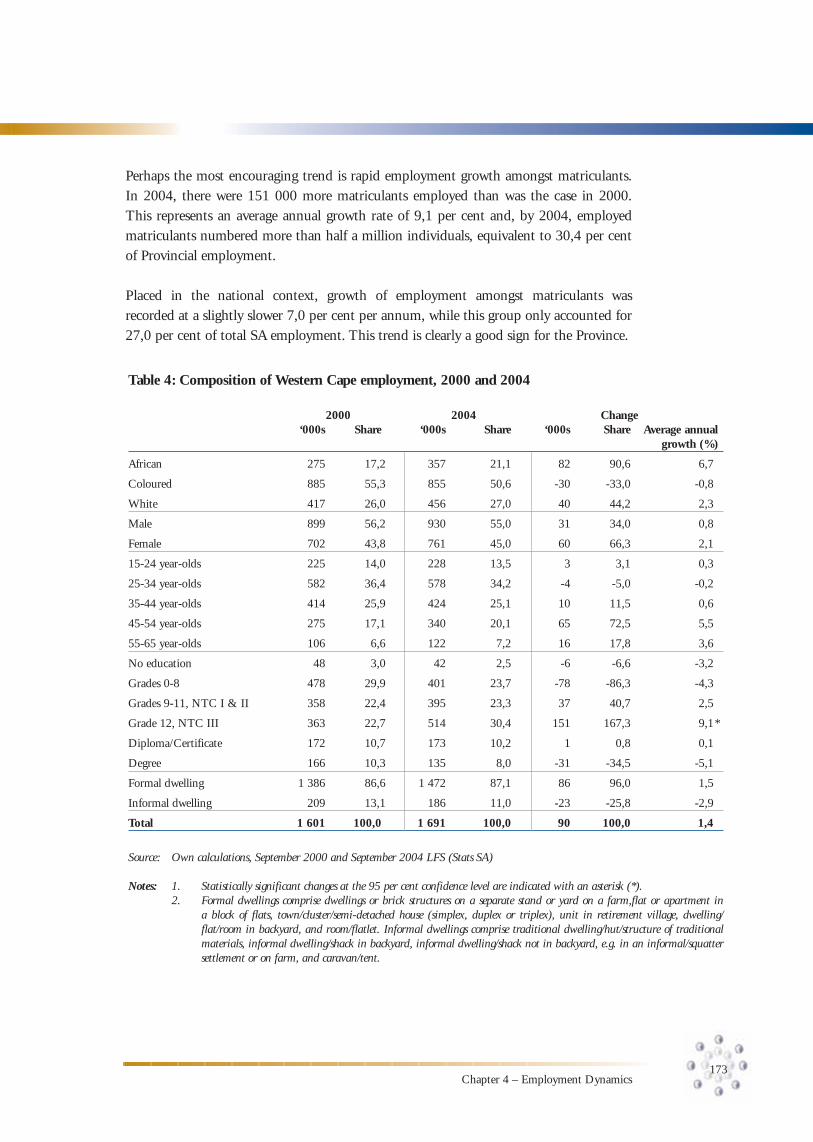
Table 4 illustrates that in 2004, about 1,7-million people were employed in the Western Cape. While it is tempting to claim that Provincial employment increased over the period (from 1,6 million in 2000), the difference between the two estimates is not statistically significant at the 95 per cent level. This is related in part to the small sample size within the LFS.
Approximately one half (50,6%) of employed Western Cape residents in 2004 are coloured, while 27,0 per cent are white and 21,1 per cent african.
While the coloured share of employment is largely in line with that of the broad labour force, the shares of africans and whites are not. Africans account for a smaller share of employment (21,1%) than of the labour force (27,8%), while the converse is true for whites. The result of this misalignment of relative labour force and employment shares is that whites have the lowest unemployment rate, followed by coloureds and africans.
The rapid growth in the labour force between the ages of 45 and 54 years appears to have been accompanied by employment, rather than unemployment, growth, although the increase in employment is not statistically significant.
Unfortunately, there is also no statistically significant change in employment amongst younger individuals, a sector of the labour market that was identified in the PER&O 2005 as being more problematic in the Province relative to the national situation and therefore deserving specific attention.
The vast majority of the employed reside in formal dwellings (87,1%), although this is only slightly higher than the share of the labour force that resides in formal dwellings. Informal dwelling residents account for 11 per cent of employment, compared to 15,3 per cent of the labour force. This means that informal dwelling residents have a higher rate of unemployment than those living in formal dwellings.
172
173Chapter 4 – Employment Dynamics
Perhaps the most encouraging trend is rapid employment growth amongst matriculants. In 2004, there were 151 000 more matriculants employed than was the case in 2000. This represents an average annual growth rate of 9,1 per cent and, by 2004, employed matriculants numbered more than half a million individuals, equivalent to 30,4 per cent of Provincial employment.
Placed in the national context, growth of employment amongst matriculants was recorded at a slightly slower 7,0 per cent per annum, while this group only accounted for 27,0 per cent of total SA employment. This trend is clearly a good sign for the Province.
Table 4: Composition of Western Cape employment, 2000 and 2004
2000 2004 Change ‘000s Share ‘000s Share ‘000s Share Average annual growth (%)
African 275 17,2 357 21,1 82 90,6 6,7
Coloured 885 55,3 855 50,6 -30 -33,0 -0,8
White 417 26,0 456 27,0 40 44,2 2,3
Male 899 56,2 930 55,0 31 34,0 0,8
Female 702 43,8 761 45,0 60 66,3 2,1
15-24 year-olds 225 14,0 228 13,5 3 3,1 0,3
25-34 year-olds 582 36,4 578 34,2 -4 -5,0 -0,2
35-44 year-olds 414 25,9 424 25,1 10 11,5 0,6
45-54 year-olds 275 17,1 340 20,1 65 72,5 5,5
55-65 year-olds 106 6,6 122 7,2 16 17,8 3,6
No education 48 3,0 42 2,5 -6 -6,6 -3,2
Grades 0-8 478 29,9 401 23,7 -78 -86,3 -4,3
Grades 9-11, NTC I & II 358 22,4 395 23,3 37 40,7 2,5
Grade 12, NTC III 363 22,7 514 30,4 151 167,3 9,1 *
Diploma/Certificate 172 10,7 173 10,2 1 0,8 0,1
Degree 166 10,3 135 8,0 -31 -34,5 -5,1
Formal dwelling 1 386 86,6 1 472 87,1 86 96,0 1,5
Informal dwelling 209 13,1 186 11,0 -23 -25,8 -2,9
Total 1 601 100,0 1 691 100,0 90 100,0 1,4
Source: Own calculations, September 2000 and September 2004 LFS (Stats SA)
Notes: 1. Statistically significant changes at the 95 per cent confidence level are indicated with an asterisk (*). 2. Formal dwellings comprise dwellings or brick structures on a separate stand or yard on a farm,flat or apartment in
a block of flats, town/cluster/semi-detached house (simplex, duplex or triplex), unit in retirement village, dwelling/flat/room in backyard, and room/flatlet. Informal dwellings comprise traditional dwelling/hut/structure of traditional materials, informal dwelling/shack in backyard, informal dwelling/shack not in backyard, e.g. in an informal/squatter settlement or on farm, and caravan/tent.
Western Cape Provincial Economic Review & Outlook 2006
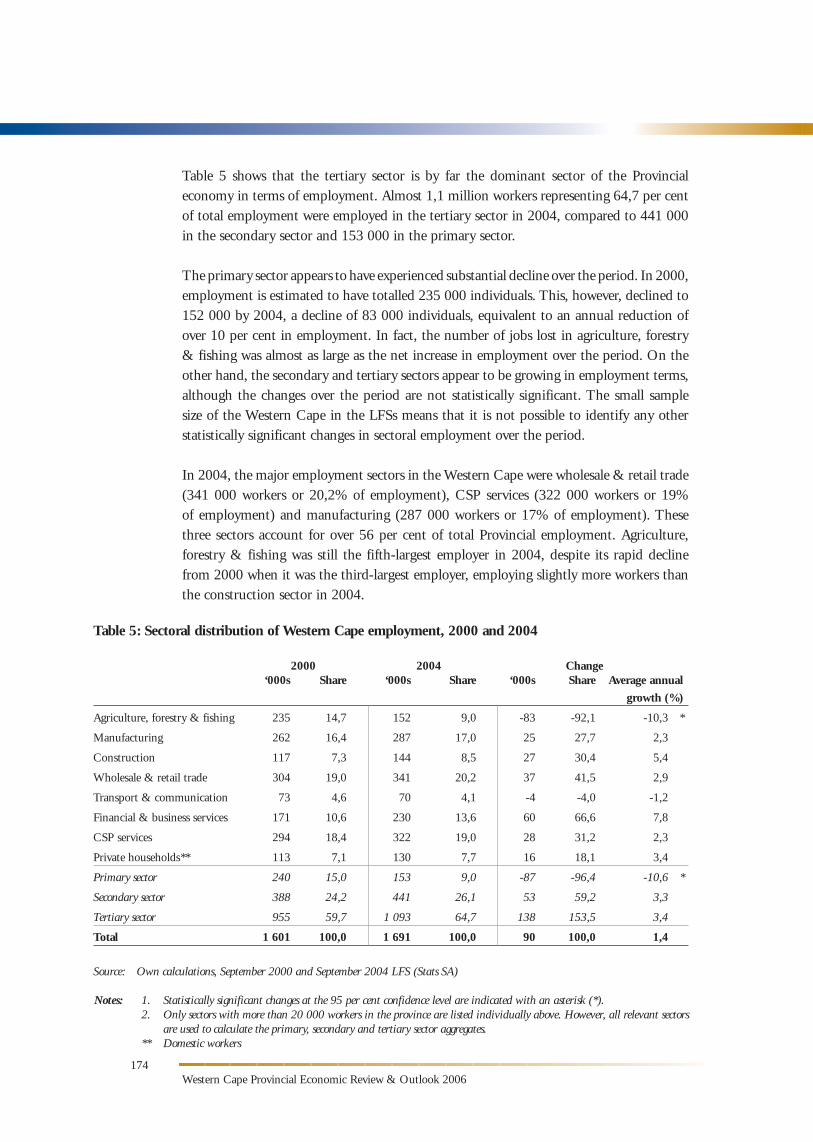
Table 5 shows that the tertiary sector is by far the dominant sector of the Provincial economy in terms of employment. Almost 1,1 million workers representing 64,7 per cent of total employment were employed in the tertiary sector in 2004, compared to 441 000 in the secondary sector and 153 000 in the primary sector.
The primary sector appears to have experienced substantial decline over the period. In 2000, employment is estimated to have totalled 235 000 individuals. This, however, declined to 152 000 by 2004, a decline of 83 000 individuals, equivalent to an annual reduction of over 10 per cent in employment. In fact, the number of jobs lost in agriculture, forestry & fishing was almost as large as the net increase in employment over the period. On the other hand, the secondary and tertiary sectors appear to be growing in employment terms, although the changes over the period are not statistically significant. The small sample size of the Western Cape in the LFSs means that it is not possible to identify any other statistically significant changes in sectoral employment over the period.
In 2004, the major employment sectors in the Western Cape were wholesale & retail trade (341 000 workers or 20,2% of employment), CSP services (322 000 workers or 19% of employment) and manufacturing (287 000 workers or 17% of employment). These three sectors account for over 56 per cent of total Provincial employment. Agriculture, forestry & fishing was still the fifth-largest employer in 2004, despite its rapid decline from 2000 when it was the third-largest employer, employing slightly more workers than the construction sector in 2004.
Table 5: Sectoral distribution of Western Cape employment, 2000 and 2004
2000 2004 Change ‘000s Share ‘000s Share ‘000s Share Average annual
growth (%)
Agriculture, forestry & fishing 235 14,7 152 9,0 -83 -92,1 -10,3 *
Manufacturing 262 16,4 287 17,0 25 27,7 2,3
Construction 117 7,3 144 8,5 27 30,4 5,4
Wholesale & retail trade 304 19,0 341 20,2 37 41,5 2,9
Transport & communication 73 4,6 70 4,1 -4 -4,0 -1,2
Financial & business services 171 10,6 230 13,6 60 66,6 7,8
CSP services 294 18,4 322 19,0 28 31,2 2,3
Private households** 113 7,1 130 7,7 16 18,1 3,4
Primary sector 240 15,0 153 9,0 -87 -96,4 -10,6 *
Secondary sector 388 24,2 441 26,1 53 59,2 3,3
Tertiary sector 955 59,7 1 093 64,7 138 153,5 3,4
Total 1 601 100,0 1 691 100,0 90 100,0 1,4
Source: Own calculations, September 2000 and September 2004 LFS (Stats SA)
Notes: 1. Statistically significant changes at the 95 per cent confidence level are indicated with an asterisk (*). 2. Only sectors with more than 20 000 workers in the province are listed individually above. However, all relevant sectors
are used to calculate the primary, secondary and tertiary sector aggregates. ** Domestic workers
174
175Chapter 4 – Employment Dynamics
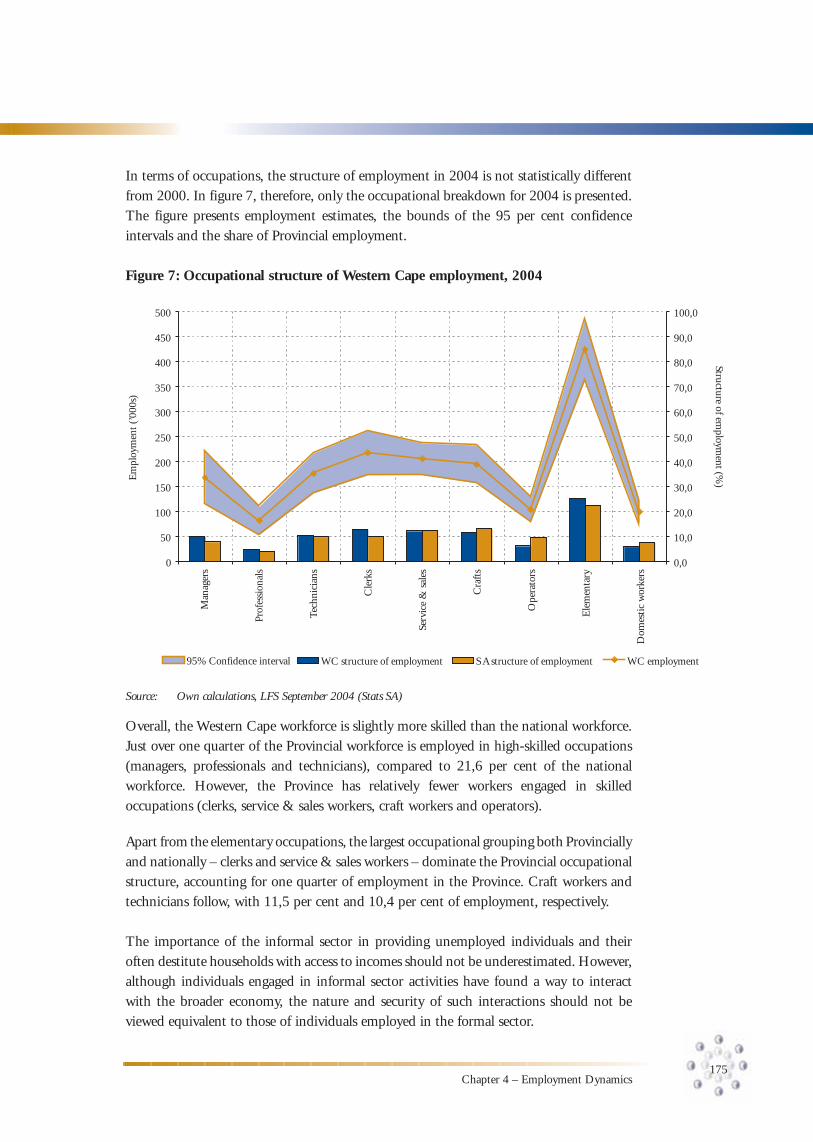
In terms of occupations, the structure of employment in 2004 is not statistically different from 2000. In figure 7, therefore, only the occupational breakdown for 2004 is presented. The figure presents employment estimates, the bounds of the 95 per cent confidence intervals and the share of Provincial employment.
Figure 7: Occupational structure of Western Cape employment, 2004
Man
ager
s
Prof
essi
onal
s
Tech
nici
ans
Cle
rks
Serv
ice
& s
ales
Cra
fts
Ope
rato
rs
Ele
men
tary
Dom
esti
c w
orke
rs
0,0
10,0
20,0
30,0
40,0
50,0
60,0
70,0
80,0
90,0
100,0
0
50
100
150
200
250
300
350
400
450
500
95% Confidence interval WC structure of employment S A structure of employment WC employment
Em
ploy
men
t (’0
00s)
Structure of employm
ent (%)
Source: Own calculations, LFS September 2004 (Stats SA)
Overall, the Western Cape workforce is slightly more skilled than the national workforce. Just over one quarter of the Provincial workforce is employed in high-skilled occupations (managers, professionals and technicians), compared to 21,6 per cent of the national workforce. However, the Province has relatively fewer workers engaged in skilled occupations (clerks, service & sales workers, craft workers and operators).
Apart from the elementary occupations, the largest occupational grouping both Provincially and nationally – clerks and service & sales workers – dominate the Provincial occupational structure, accounting for one quarter of employment in the Province. Craft workers and technicians follow, with 11,5 per cent and 10,4 per cent of employment, respectively.
The importance of the informal sector in providing unemployed individuals and their often destitute households with access to incomes should not be underestimated. However, although individuals engaged in informal sector activities have found a way to interact with the broader economy, the nature and security of such interactions should not be viewed equivalent to those of individuals employed in the formal sector.
Western Cape Provincial Economic Review & Outlook 2006
Informal sector employment is not equivalent to formal sector employment, being less secure, less safe and less remunerative, and therefore employment growth in these sectors should not be seen as perfectly substitutable. There is an argument to be made in terms of promoting informal sector growth, as the sector would then be able to absorb individuals into employment who may not have found employment in the formal sector. These individuals would then at least have some form of income and this would therefore help to reduce abject poverty.
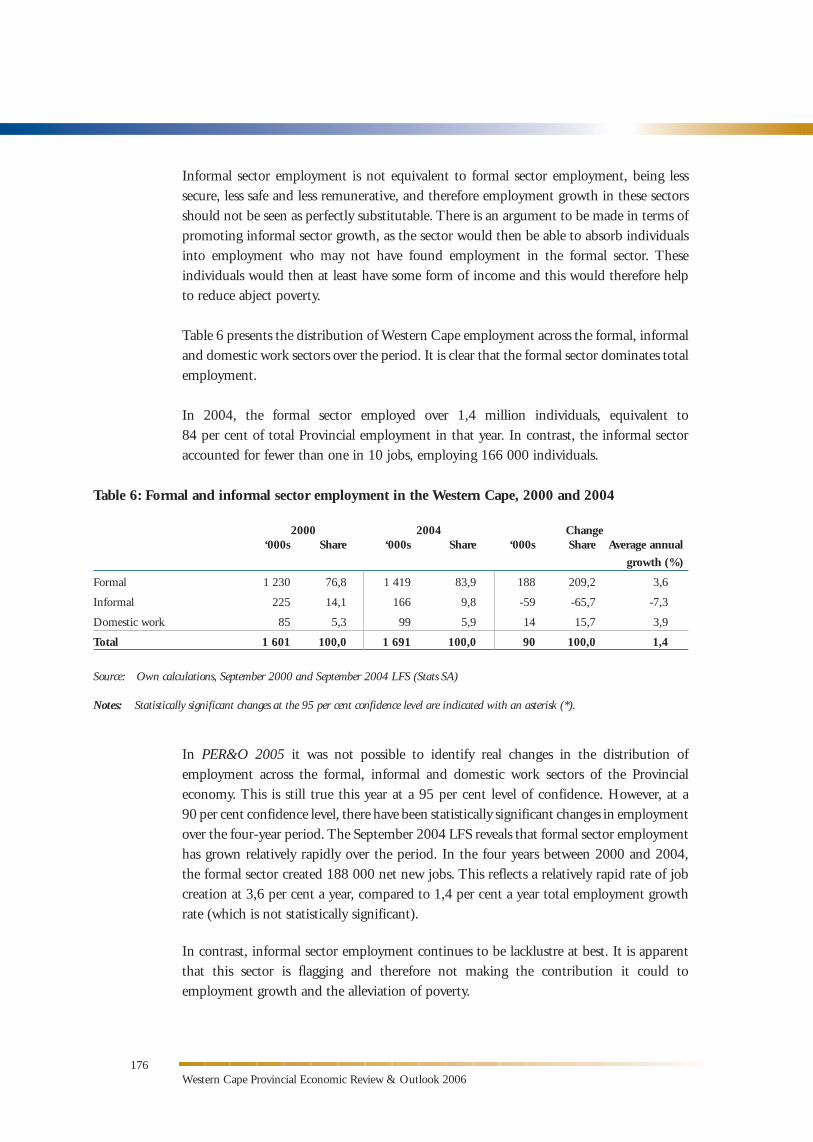
Table 6 presents the distribution of Western Cape employment across the formal, informal and domestic work sectors over the period. It is clear that the formal sector dominates total employment.
In 2004, the formal sector employed over 1,4 million individuals, equivalent to 84 per cent of total Provincial employment in that year. In contrast, the informal sector accounted for fewer than one in 10 jobs, employing 166 000 individuals.
In PER&O 2005 it was not possible to identify real changes in the distribution of employment across the formal, informal and domestic work sectors of the Provincial economy. This is still true this year at a 95 per cent level of confidence. However, at a 90 per cent confidence level, there have been statistically significant changes in employment over the four-year period. The September 2004 LFS reveals that formal sector employment has grown relatively rapidly over the period. In the four years between 2000 and 2004, the formal sector created 188 000 net new jobs. This reflects a relatively rapid rate of job creation at 3,6 per cent a year, compared to 1,4 per cent a year total employment growth rate (which is not statistically significant).
In contrast, informal sector employment continues to be lacklustre at best. It is apparent that this sector is flagging and therefore not making the contribution it could to employment growth and the alleviation of poverty.
176
Table 6: Formal and informal sector employment in the Western Cape, 2000 and 2004
2000 2004 Change ‘000s Share ‘000s Share ‘000s Share Average annual
growth (%)
Formal 1 230 76,8 1 419 83,9 188 209,2 3,6
Informal 225 14,1 166 9,8 -59 -65,7 -7,3
Domestic work 85 5,3 99 5,9 14 15,7 3,9
Total 1 601 100,0 1 691 100,0 90 100,0 1,4
Source: Own calculations, September 2000 and September 2004 LFS (Stats SA)
Notes: Statistically significant changes at the 95 per cent confidence level are indicated with an asterisk (*).
177Chapter 4 – Employment Dynamics
Obviously, formal sector employment growth is the first prize, but since this sector is still not growing sufficiently to reduce unemployment, the informal sector should not be neglected. The poor performance of the informal sector points to the need for policy interventions that will stimulate informal sector economic activity in a way that it does not impact negatively on formal sector performance.
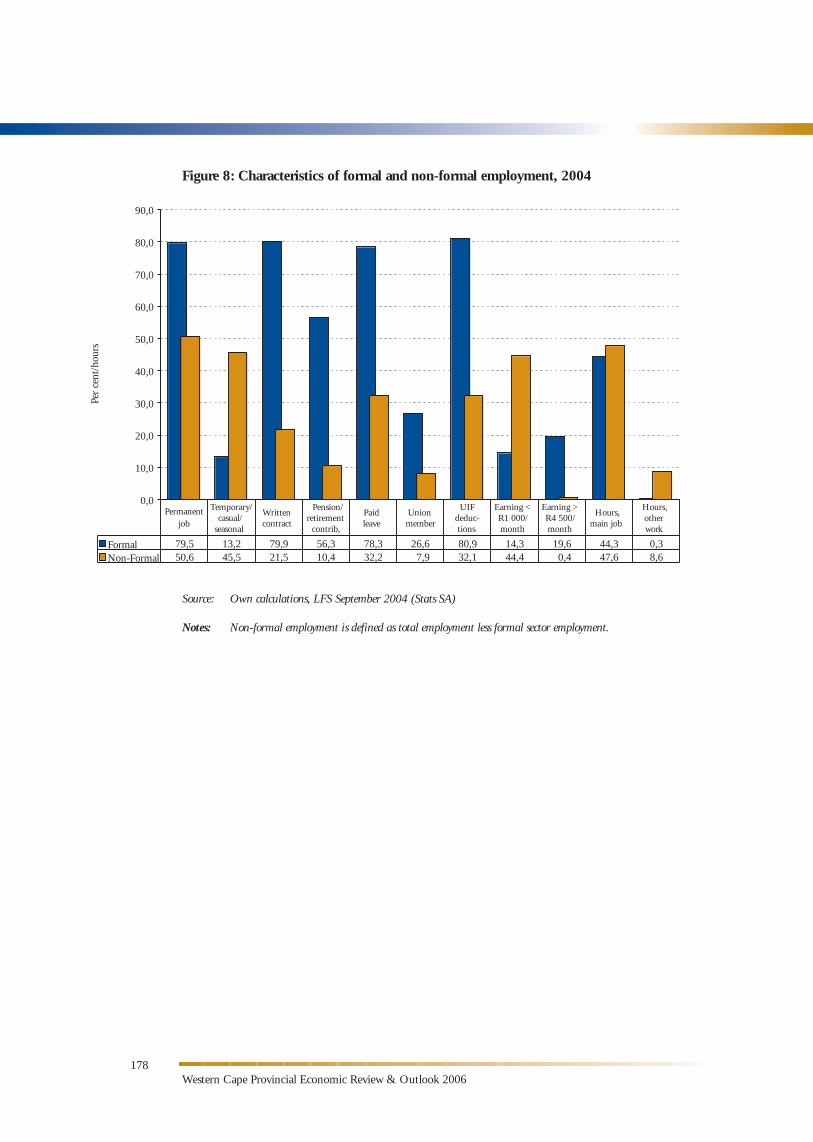
Figure 8 illustrates the differences between the ‘quality’ of formal and non-formal employment in the Western Cape. Formal sector workers are better off than their non-formal sector counterparts in terms of the permanence of their employment. Four-fifths of the formal sector employed has permanent jobs, compared to only half of non-formal sector workers. Conversely, only 13,2 per cent of those employed in the formal sector have temporary, casual or seasonal employment, compared to 45,5 per cent of the non-formal sector employed.
The incidence of written contracts is far higher amongst those employed in the formal sector (79,9%), as is that of paid leave (78,3%) and Unemployment Insurance Fund (UIF) deductions (80,9%), compared to the informal sector where incidence rates reach 21,5 per cent, 32,2 per cent and 32,1 per cent, respectively.
More than half of the formal sector employed benefit from employer contributions to pension or retirement funds, while this is true of only one in 10 in the non-formal sector. The rate of union membership in the formal sector is also higher than that in the non-formal sector. Non-formal sector employment is less remunerative than formal sector employment.
In 2004, only 14 per cent of formal sector workers earned no more than R1 000 per month, while this was the case for more than 44 per cent of non-formal sector workers. Conversely, almost one-fifth of the formal sector employed earned more than R4 500 per month, compared to almost none (0,4%) in the non-formal sector.
Finally, formal sector workers reported tend to work fewer hours on average compared to non-formal sector workers. Formal sector workers reported usually working 44,3 hours per week, compared to the 47,6 hours per week reported by non-formal sector workers.
The evidence therefore suggests that formal sector employment is far superior to other forms of employment in terms of the level of benefits, protection, bargaining power and remuneration. Formal sector employment is more secure and, in the event of formal sector workers losing their jobs, there is greater scope for recourse to Unemployment Insurance. This means that a formal sector worker is in a better position than his or her counterpart in the non-formal sector when they are employed and, in the event of job losses, the former is likely to be better provided for by the state social security net than the latter.
Western Cape Provincial Economic Review & Outlook 2006
Figure 8: Characteristics of formal and non-formal employment, 2004
Source: Own calculations, LFS September 2004 (Stats SA)
Notes: Non-formal employment is defined as total employment less formal sector employment.
178
orw k
44,3Non-Formal
0,0
10,0
20,0
30,0
40,0
50,0
60,0
70,0
80,0
90,0
Temporary/casual/
seasonal
Writtencontract
Pension/retirement
contrib,
Unionmember
UIFdeduc-tions
Earning <R1 000/month
Earning >R4 500/month
Hours,main job
Hours,other
44,4Formal
50,679,5 13,2
21,545,556,3
32,278,3 26,6
7,9 32,180,9 14,3 19,6
47,6 8,60,3
0,410,4
Per
cent
/hou
rs
Permanentjob
Paidleave
79,9
179Chapter 4 – Employment Dynamics
3.4 Unemployment
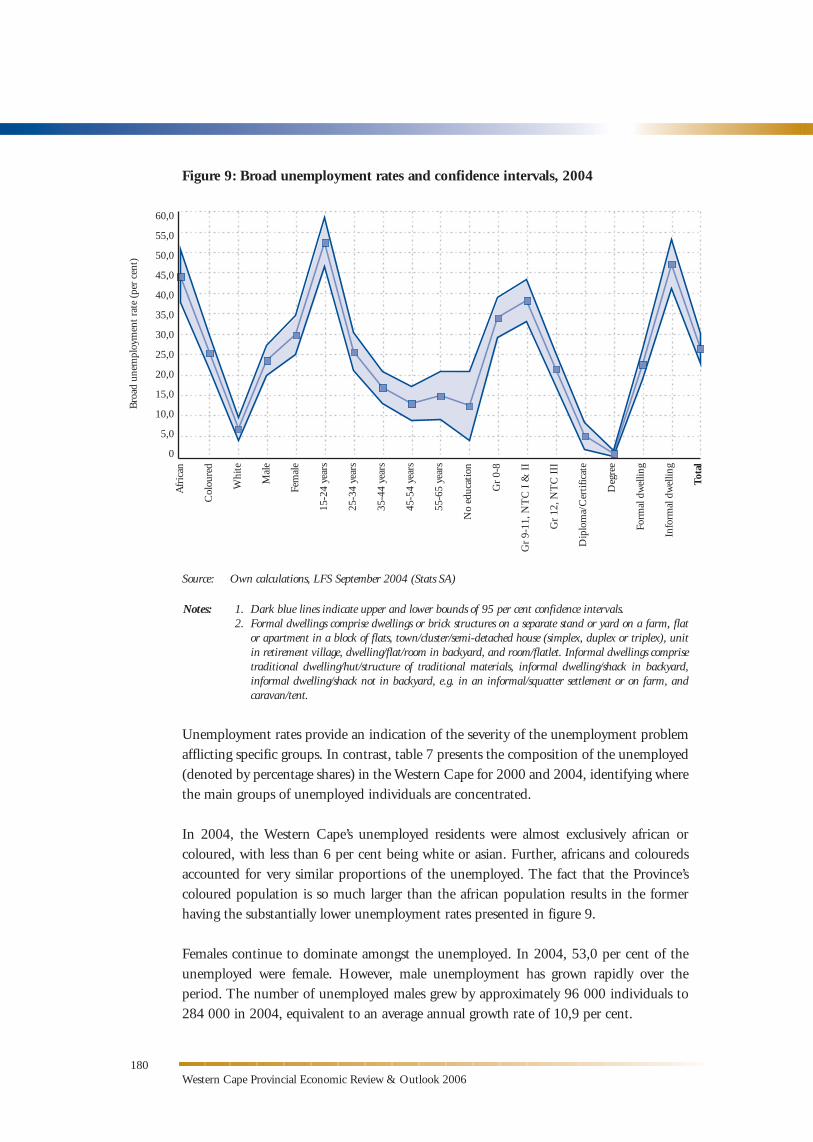
As noted, in 2004 broad unemployment in SA stood at 41 per cent, far in excess of the Western Cape’s rate of 26,3 per cent. However, like employment, unemployment is not evenly distributed across the various groups that constitute the labour force and so the Provincial rate obscures variances, which are presented in figure 9.
The segmentation of the labour market is clear from the widely differing estimates of the broad unemployment rate for africans, coloureds and whites. In 2004, the broad unemployment rate amongst whites, at 6,6 per cent, is substantially lower than the 25,3 per cent rate for coloureds and the 44,0 per cent rate for africans. Similar to the national pattern, female unemployment at 29,6 per cent exceeds that of male unemployment (23,4%).
The pattern of higher unemployment amongst younger age groups identified in the PER&O 2005 is again observable in the 2004 data. The rate of unemployment amongst 15-24 year-olds is in excess of 52 per cent, which means that one in two labour force members in this age group were unable to find work in 2004. Amongst 25-34 year-olds, the unemployment rate is substantially lower at 25,5 per cent, dropping to around 13 per cent amongst 45-54 year-olds.
Generally, lower levels of education are associated with higher rates of unemployment. Unemployment amongst those with incomplete primary, complete primary and incomplete secondary education ranges between 32 per cent and 37 per cent, while holders of matriculation certificates experience a rate of 21,3 per cent. Less than three per cent of the Western Cape’s tertiary educated labour force is unable to find work.
Interestingly, individuals with no education at all are less often unemployed than those with less than complete secondary education at 12,3 per cent. This is due to the fact that the sample is very small (in 2004, fewer than 50 000 labour force members had no education) and the fact that individuals without any education are generally older than average and tend to be employed in agriculture.
Residents of informal housing have a substantially higher rate of unemployment than their counterparts in formal housing. Around 47 per cent of individuals residing in informal housing are unemployed, compared to only 22,4 per cent of those in formal housing.
Western Cape Provincial Economic Review & Outlook 2006
Figure 9: Broad unemployment rates and confidence intervals, 2004
Source: Own calculations, LFS September 2004 (Stats SA)
Notes: 1. Dark blue lines indicate upper and lower bounds of 95 per cent confidence intervals. 2. Formal dwellings comprise dwellings or brick structures on a separate stand or yard on a farm, flat
or apartment in a block of flats, town/cluster/semi-detached house (simplex, duplex or triplex), unit in retirement village, dwelling/flat/room in backyard, and room/flatlet. Informal dwellings comprise traditional dwelling/hut/structure of traditional materials, informal dwelling/shack in backyard, informal dwelling/shack not in backyard, e.g. in an informal/squatter settlement or on farm, and caravan/tent.
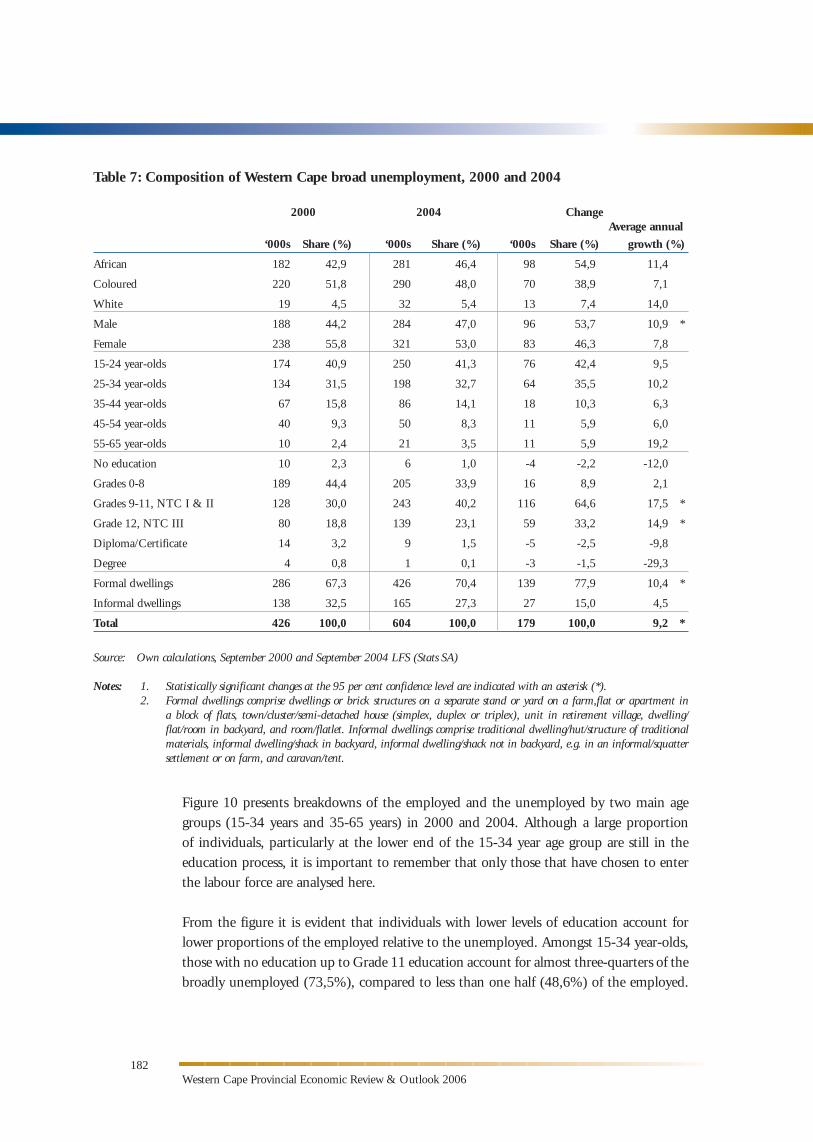
Unemployment rates provide an indication of the severity of the unemployment problem afflicting specific groups. In contrast, table 7 presents the composition of the unemployed (denoted by percentage shares) in the Western Cape for 2000 and 2004, identifying where the main groups of unemployed individuals are concentrated.
In 2004, the Western Cape’s unemployed residents were almost exclusively african or coloured, with less than 6 per cent being white or asian. Further, africans and coloureds accounted for very similar proportions of the unemployed. The fact that the Province’s coloured population is so much larger than the african population results in the former having the substantially lower unemployment rates presented in figure 9.
Females continue to dominate amongst the unemployed. In 2004, 53,0 per cent of the unemployed were female. However, male unemployment has grown rapidly over the period. The number of unemployed males grew by approximately 96 000 individuals to 284 000 in 2004, equivalent to an average annual growth rate of 10,9 per cent.
180
Bro
ad u
nem
ploy
men
t rat
e (p
er c
ent)
Afr
ican
Col
oure
d
Whi
te
Mal
e
Fem
ale
15-2
4 ye
ars
25-3
4 ye
ars
35-4
4 ye
ars
45-5
4 ye
ars
55-6
5 ye
ars
No
educ
atio
n
Gr
0-8
Gr
9-11
, NT
C I
& I
I
Gr
12, N
TC
III
Dip
lom
a/C
erti
ficat
e
Deg
ree
Form
al d
wel
ling
Info
rmal
dw
ellin
g
Tota
l
60,0
55,0
50,0
45,0
40,0
35,0
30,0
25,0
20,0
15,0
10,0
5,0
0
181Chapter 4 – Employment Dynamics
The unemployed are predominantly younger than 34 years of age. In 2004, 41,3 per cent of the unemployed were 15-24 years old, while a further 32,7 per cent were 25-34 years old. In contrast, less than 12 per cent of the unemployed were over the age of 45 years, which was substantially lower than this group’s share of the labour force of more than 23 per cent.
Although the data seems to suggest that the bulk of unemployment growth over the period has occurred amongst the two youngest age groups, none of these changes are statistically significant.
Seven in 10 unemployed individuals in 2004 resided in formal dwellings, while almost three in 10 were informal dwelling residents. However, the increase in the number of unemployed individuals residing in formal dwellings rose by a statistically significant 139 000, equivalent to an average annual growth rate of 10,4 per cent. This increase is likely to be, at least partly, related to the extension of formal housing to those that previously lacked it.
More than half of the unemployed have incomplete secondary education, while the remainder are almost evenly split between those with some level of primary education and those with complete secondary education.
The number of unemployed individuals with between Grade 9 and Grade 11 education grew by 116 000 over the period, at an average annual rate of 17,5 per cent. The number of unemployed matriculants grew at a similarly high rate (14,9%), adding an extra 59 000 individuals to the pool of the unemployed.
As noted earlier, employment amongst labour force members that are matriculants grew by 151 000 at an average annual rate of 9,1 per cent, while this category of the labour force itself grew by 210 000 over the period. This means that around seven out of 10 matriculants that entered the labour force were absorbed into employment, indicating that although their employment performance appears favourable, it is still not sufficient to reduce or even halt the increase in their unemployment rate.
Western Cape Provincial Economic Review & Outlook 2006
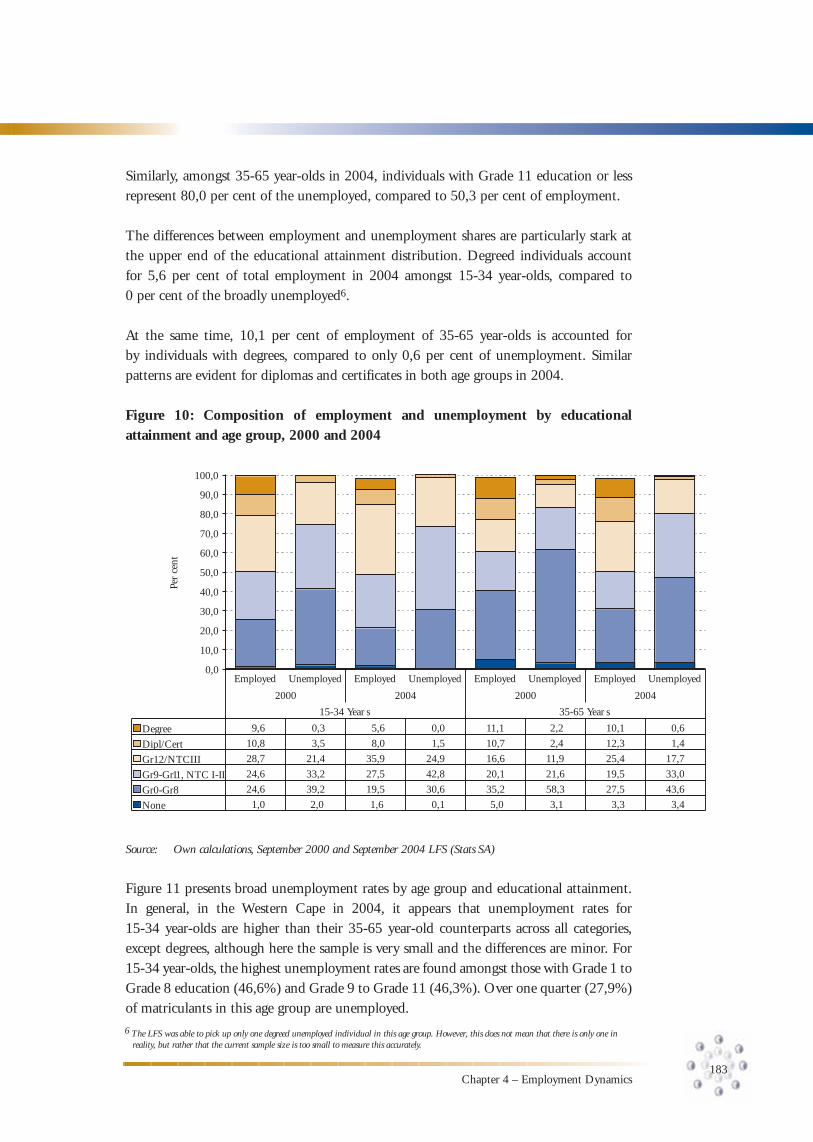
Figure 10 presents breakdowns of the employed and the unemployed by two main age groups (15-34 years and 35-65 years) in 2000 and 2004. Although a large proportion of individuals, particularly at the lower end of the 15-34 year age group are still in the education process, it is important to remember that only those that have chosen to enter the labour force are analysed here.
From the figure it is evident that individuals with lower levels of education account for lower proportions of the employed relative to the unemployed. Amongst 15-34 year-olds, those with no education up to Grade 11 education account for almost three-quarters of the broadly unemployed (73,5%), compared to less than one half (48,6%) of the employed.
182
Table 7: Composition of Western Cape broad unemployment, 2000 and 2004
2000 2004 Change Average annual
‘000s Share (%) ‘000s Share (%) ‘000s Share (%) growth (%)
African 182 42,9 281 46,4 98 54,9 11,4
Coloured 220 51,8 290 48,0 70 38,9 7,1
White 19 4,5 32 5,4 13 7,4 14,0
Male 188 44,2 284 47,0 96 53,7 10,9 *
Female 238 55,8 321 53,0 83 46,3 7,8
15-24 year-olds 174 40,9 250 41,3 76 42,4 9,5
25-34 year-olds 134 31,5 198 32,7 64 35,5 10,2
35-44 year-olds 67 15,8 86 14,1 18 10,3 6,3
45-54 year-olds 40 9,3 50 8,3 11 5,9 6,0
55-65 year-olds 10 2,4 21 3,5 11 5,9 19,2
No education 10 2,3 6 1,0 -4 -2,2 -12,0
Grades 0-8 189 44,4 205 33,9 16 8,9 2,1
Grades 9-11, NTC I & II 128 30,0 243 40,2 116 64,6 17,5 *
Grade 12, NTC III 80 18,8 139 23,1 59 33,2 14,9 *
Diploma/Certificate 14 3,2 9 1,5 -5 -2,5 -9,8
Degree 4 0,8 1 0,1 -3 -1,5 -29,3
Formal dwellings 286 67,3 426 70,4 139 77,9 10,4 *
Informal dwellings 138 32,5 165 27,3 27 15,0 4,5
Total 426 100,0 604 100,0 179 100,0 9,2 *
Source: Own calculations, September 2000 and September 2004 LFS (Stats SA)
Notes: 1. Statistically significant changes at the 95 per cent confidence level are indicated with an asterisk (*). 2. Formal dwellings comprise dwellings or brick structures on a separate stand or yard on a farm,flat or apartment in
a block of flats, town/cluster/semi-detached house (simplex, duplex or triplex), unit in retirement village, dwelling/flat/room in backyard, and room/flatlet. Informal dwellings comprise traditional dwelling/hut/structure of traditional materials, informal dwelling/shack in backyard, informal dwelling/shack not in backyard, e.g. in an informal/squatter settlement or on farm, and caravan/tent.
183Chapter 4 – Employment Dynamics
Similarly, amongst 35-65 year-olds in 2004, individuals with Grade 11 education or less represent 80,0 per cent of the unemployed, compared to 50,3 per cent of employment.
The differences between employment and unemployment shares are particularly stark at the upper end of the educational attainment distribution. Degreed individuals account for 5,6 per cent of total employment in 2004 amongst 15-34 year-olds, compared to 0 per cent of the broadly unemployed6.
At the same time, 10,1 per cent of employment of 35-65 year-olds is accounted for by individuals with degrees, compared to only 0,6 per cent of unemployment. Similar patterns are evident for diplomas and certificates in both age groups in 2004.
Figure 10: Composition of employment and unemployment by educational attainment and age group, 2000 and 2004
0,0
10,0
20,0
30,0
40,0
50,0
60,0
70,0
80,0
90,0
100,0
0,3 11,1 10,1
10,8 10,7 12,3
28,7 21,4 35,9 24,9 16,6 11,9 25,4 17,7
33,2 27,5 42,8 20,1 21,6 19,5 33,0
39,2 19,5 30,6 35,2 58,3 27,5 43,6
Employed Unemployed Employed Unemployed Employed Unemployed Employed Unemployed
2000 2004 2000 2004
15-34 Year s 35-65 Year s
Degree
Dipl/Cert
Gr12/NTCIII
Gr9-Gr11, NTC I-II
Gr0-Gr8
None
Per
cent
1,0
24,6
24,6
9,6
3,5
2,0
5,6
8,0
1,6
0,0
1,5
0,1 5,0
2,2
2,4
3,1 3,3
0,6
1,4
3,4
Source: Own calculations, September 2000 and September 2004 LFS (Stats SA)
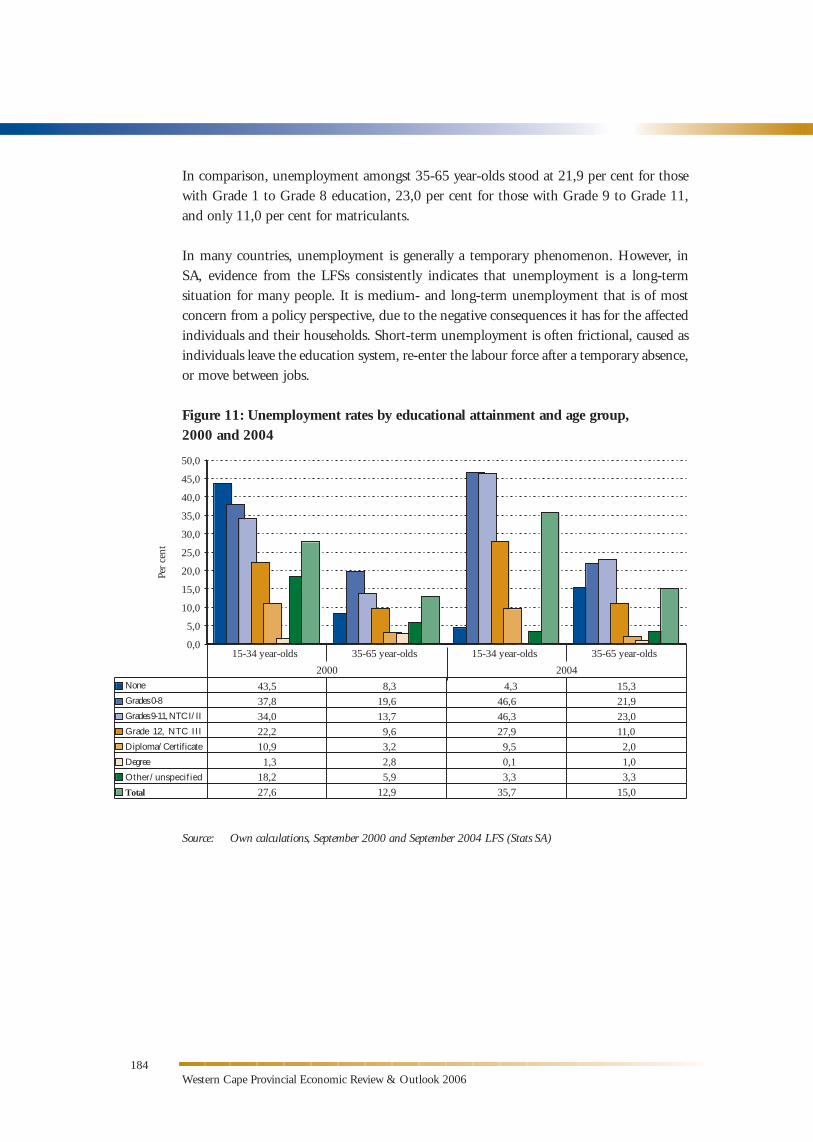
Figure 11 presents broad unemployment rates by age group and educational attainment. In general, in the Western Cape in 2004, it appears that unemployment rates for 15-34 year-olds are higher than their 35-65 year-old counterparts across all categories, except degrees, although here the sample is very small and the differences are minor. For 15-34 year-olds, the highest unemployment rates are found amongst those with Grade 1 to Grade 8 education (46,6%) and Grade 9 to Grade 11 (46,3%). Over one quarter (27,9%) of matriculants in this age group are unemployed.
6 The LFS was able to pick up only one degreed unemployed individual in this age group. However, this does not mean that there is only one in reality, but rather that the current sample size is too small to measure this accurately.
Western Cape Provincial Economic Review & Outlook 2006
In comparison, unemployment amongst 35-65 year-olds stood at 21,9 per cent for those with Grade 1 to Grade 8 education, 23,0 per cent for those with Grade 9 to Grade 11, and only 11,0 per cent for matriculants.
In many countries, unemployment is generally a temporary phenomenon. However, in SA, evidence from the LFSs consistently indicates that unemployment is a long-term situation for many people. It is medium- and long-term unemployment that is of most concern from a policy perspective, due to the negative consequences it has for the affected individuals and their households. Short-term unemployment is often frictional, caused as individuals leave the education system, re-enter the labour force after a temporary absence, or move between jobs.
Figure 11: Unemployment rates by educational attainment and age group, 2000 and 2004
Source: Own calculations, September 2000 and September 2004 LFS (Stats SA)
184
0,0
5,0
10,0
15,0
20,0
25,0
30,0
35,0
40,0
45,0
50,0
43,5 8,3 4,3 15,3
37,8 19,6 46,6 21,9
34,0 13,7 46,3 23,0
22,2 9,6 27,9 11,0
10,9 3,2 9,5 2,0
2,8 0,1 1,0
18,2 5,9 3,3 3,3
27,6 12,9 35,7 15,0
35-65 year-olds 15-34 year-olds 35-65 year-olds
2000 2004
Per
cent
None
Grades 0-8
Grades 9-11, NTC I/II
Grade 12, NTC III
Diploma/Certificate
Degree
Other/unspecified
Total
15-34 year-olds
1,3
185Chapter 4 – Employment Dynamics
Education and work experiences of young people in the Cape
The Cape Area Panel Study (CAPS) is a joint project between the Centre for Social Science Research (CSSR) at the University of Cape Town and the Institute for Social Research at the University of Michigan (in the US). CAPS is a project designed to study the transitions that young people in the Cape Metropole make as they move through school, begin to work and start their own families. The study follows the lives of about 4 800 young adults who were aged 14-22 years in 2002.
The study was designed as a household survey, and the households are representative of all regions, racial groups and economic levels in Cape Town. CAPS also takes the form of a panel survey, that is, a survey in which the same group, or panel of participants, is re-interviewed over a period of time. The major advantage of this study and its design compared to other sources, such as the official census data, is that it focuses on the youth and makes it possible to study the complicated transitions that young people make and how their choices influence their lives thereafter. Problems affecting young people can therefore be addressed more effectively.
The first wave of the study was carried out between August 2002 and January 2003. About 4 752 young adults were interviewed. A sub-sample of 1 360 young adults (wave 2A) was re-interviewed between August and December 2003. The remainder of the sample (wave 2B) was re-interviewed between May and December 2004. Wave 3 of the survey was carried out between April and October 2005, and all young adults were interviewed. Waves 4A, 4B and 5 will occur between 2006 and 2008. By the end-date the young adults will be aged between 20 and 28 years.
The information in CAPS will help policy-makers to understand questions such as:
• What factors determine whether young people finish school, pass matric and go on to further study?
• How do young people find work after leaving school?
• How important are connections with family and friends?
• How optimistic are young people about their futures and their future job prospects?
• How are young people affected by the HIV/Aids pandemic?
• How are young people affected when their household experiences income loss, unemployment, or the death of a household member?
• How do childhood experiences of young people affect their adult lives?
Some findings (2002 and 2004):
• Results from the 2004 wave indicate that 32 per cent of CAPS participants who had jobs found such jobs through family or other household members, and 34 per cent through friends.
• At the age of 18, young adults begin to live away from parents.
• CAPS participants had high rates of school enrolment while they were growing up, with over 99 per cent enrolled at age 10 and 12, and almost 90 per cent at age 14.
• The results show that by the of age 14, only 48 per cent of those in school had reached Grade 9 and 27 per cent were in Grade 7 or below.
• The CAPS data shows that girls tend to go through school faster than boys. By age 16, 39 per cent of girls have finished at least grade 10 compared to only 31 per cent of boys.
Source: www.cssr.uct.ac.za/ssu_surveycaps.html
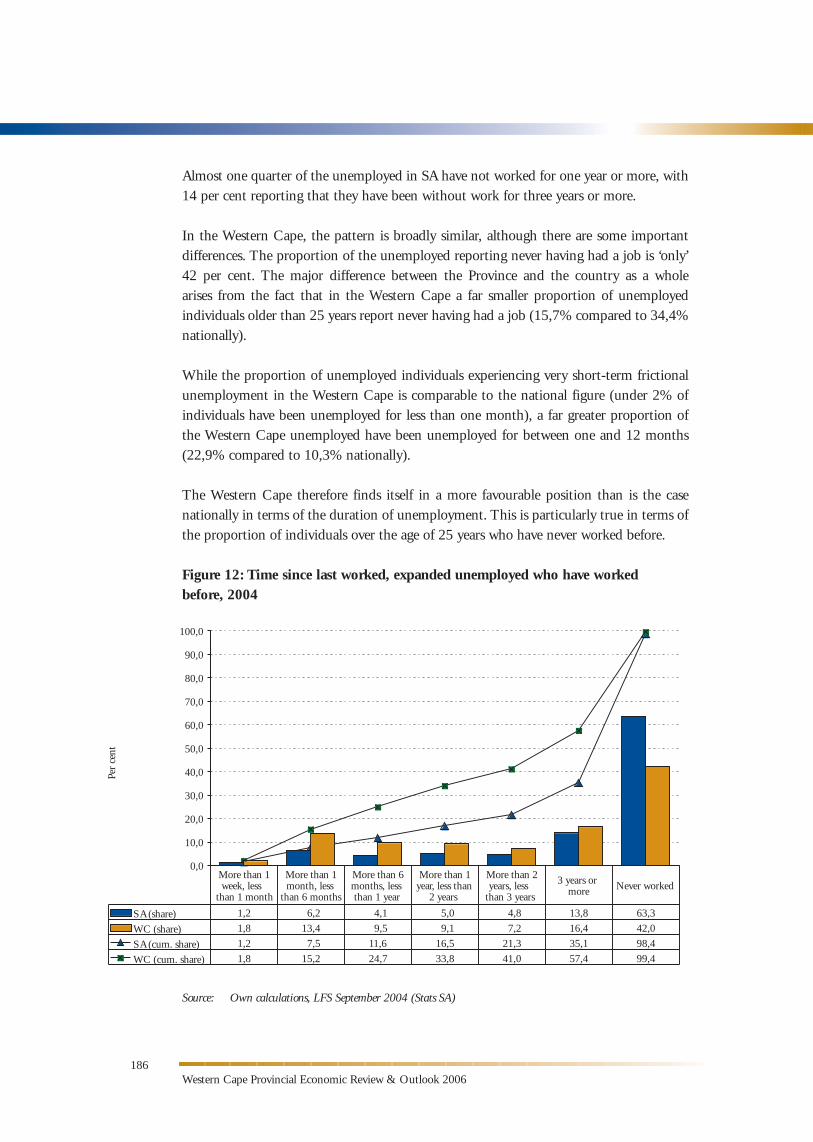
Figure 12 illustrates that in SA, about 63,3 per cent of the broadly unemployed have never worked before. Even the fact that more than one-third of the broadly unemployed were between 15-24 years of age cannot explain this very high proportion of workers who report they have never worked before.
Western Cape Provincial Economic Review & Outlook 2006
Almost one quarter of the unemployed in SA have not worked for one year or more, with 14 per cent reporting that they have been without work for three years or more.
In the Western Cape, the pattern is broadly similar, although there are some important differences. The proportion of the unemployed reporting never having had a job is ‘only’ 42 per cent. The major difference between the Province and the country as a whole arises from the fact that in the Western Cape a far smaller proportion of unemployed individuals older than 25 years report never having had a job (15,7% compared to 34,4% nationally).
While the proportion of unemployed individuals experiencing very short-term frictional unemployment in the Western Cape is comparable to the national figure (under 2% of individuals have been unemployed for less than one month), a far greater proportion of the Western Cape unemployed have been unemployed for between one and 12 months (22,9% compared to 10,3% nationally).
The Western Cape therefore finds itself in a more favourable position than is the case nationally in terms of the duration of unemployment. This is particularly true in terms of the proportion of individuals over the age of 25 years who have never worked before.
Figure 12: Time since last worked, expanded unemployed who have worked before, 2004
Source: Own calculations, LFS September 2004 (Stats SA)
186
0,0
10,0
20,0
30,0
40,0
50,0
60,0
70,0
80,0
90,0
100,0
1,2 6,2 4,1 5,0 4,8 13,8 63,3
1,8 13,4 9,5 9,1 7,2 16,4 42,0
1,2 7,5 11,6 16,5 21,3 35,1 98,4
1,8 15,2 24,7 33,8 41,0 57,4 99,4
More than 1week, less
than 1 month
More than 1month, less
than 6 months
More than 6months, lessthan 1 year
More than 2years, less
than 3 years
3 years ormore Never worked
Per
cent
SA (share)
WC (share)
SA (cum. share)
WC (cum. share)
More than 1year, less than
2 years
187Chapter 4 – Employment Dynamics
4. Employment, unemployment and geography
Every economy has uneven distribution of economic activity that depends on regional or local natural resources, climatic conditions, geographic location, biodiversity, and human knowledge and skill. Although these distributions may change over time – as is currently occurring on an international scale with the rapid growth of many developing economies – concentrations of economic activity will persist.
The uneven distribution of a country’s economic activity combines with the geographic distribution of its population, specifically its labour force, leading to varying degrees of mismatch between labour demand and supply, and hence unemployment or labour shortages.
Geography, therefore, is an important facet to consider in economic policy-making, particularly where economic inequality differs geographically.
Employment data used in geographical analysis
The Censuses of 1996 and 2001 are used as the source dataset, despite their labour market deficiencies. While both censuses ask labour market information of respondents, space limitations mean that the detailed and in-depth questions required to identify an individual’s labour market status accurately, as asked in the LFSs, for example, cannot all be included. As a result, the Census tends to underestimate employment and over-estimate unemployment when compared to dedicated sample surveys, such as the LFSs conducted by Stats SA.
However, the Censuses are very well equipped to enable comparisons on a detailed geographical level, which the LFSs are unable to do. Since Census estimates of labour market variables are not totally accurate, too much emphasis should not be placed on the actual derived figures. Instead, these estimates should be used to place regions in the appropriate context relative to each other and the province as a whole.
4.1 Employment and geography7
The dominant employment sectors in the Western Cape as a whole are CSP services (17,4%), wholesale & retail trade (16,3%), manufacturing (13,9%), agriculture, forestry & fishing (13,8%) and financial & business services (10%).
Figure 13 shows that while there are similarities in terms of employment structure across the Western Cape’s municipal districts, there are also some important differences.
Amongst 15-34 year-olds in 2001, agriculture, forestry & fishing is the largest employer in four districts: the West Coast, Overberg, Cape Winelands and Central Karoo.
7 As noted briefly in the text box above, data from the LFSs are able to create a sectoral employment picture at the provincial level - as described in section 3.3 of this chapter - but not at the more disaggregated municipal level, as section 4.1 attempts to do. In this section, data from the 1996 and 2001 Census are used. Since the Census is not primarily an employment survey, analyses from the two datasets should therefore not be compared ‘side by side’, as they do not correlate directly.
Western Cape Provincial Economic Review & Outlook 2006188
The exact nature of employment in this sector will, however, vary by district. For example, in the West Coast, employment in agriculture, forestry & fishing is more likely to be employment in the fishing industry. In the Cape Winelands, employment in this sector is more likely to be in agriculture, while in Eden, a greater proportion may actually be in forestry.
Overall, though, the wholesale & retail trade sector employs more individuals in the 15-34 age group than any other. Approximately 18,8 per cent of this age group is employed in wholesale & retail trade, followed by CSP services (14,9%), agriculture, forestry & fishing (14,8%) and manufacturing (13,6%).
The West Coast and Cape Winelands are similar in that agriculture, forestry & fishing, wholesale & retail trade, manufacturing and CSP services are the top four employers of young people.
The Overberg and Eden districts differ slightly in that manufacturing is not in the top four sectors in terms of employment, while construction accounts for the fourth-highest level of employment amongst 15-34 year-olds (7,7% and 10,5%, respectively).
In the Central Karoo, it is private households that replaces manufacturing in the top four sectors, while in Cape Town, the top four sectors are wholesale & retail trade (21,1%), CSP services (16,7%), manufacturing (16%) and financial & business services (15%).
Within this age group therefore, at 53,5 per cent, employment is concentrated in the tertiary sector, with a further fifth (20,7%) occurring in the secondary sector. The tertiary sector is the dominant sector in terms of employment in Cape Town (62,6%), Eden (51%) and the Central Karoo (49,6%), while the primary sector dominates employment amongst 15-34 year-olds in the West Coast (44,3%), Cape Winelands (41,5%) and Overberg (37,9%).
Employment amongst older individuals aged 35-65 years is, interestingly, less concentrated in agriculture, forestry & fishing than is the case amongst 15-34 year-olds, with this sector accounting for 12,9 per cent and 14,8 per cent of employment, respectively.
Overall, employment amongst 35-65 year-olds is more concentrated in the tertiary sector, which accounts for 56 per cent of employment, and the secondary sector, which accounts for 21,8 per cent. This is particularly the case outside of Cape Town. In Cape Town, the broad structure of employment (primary, secondary and tertiary) is almost identical for both age groups.
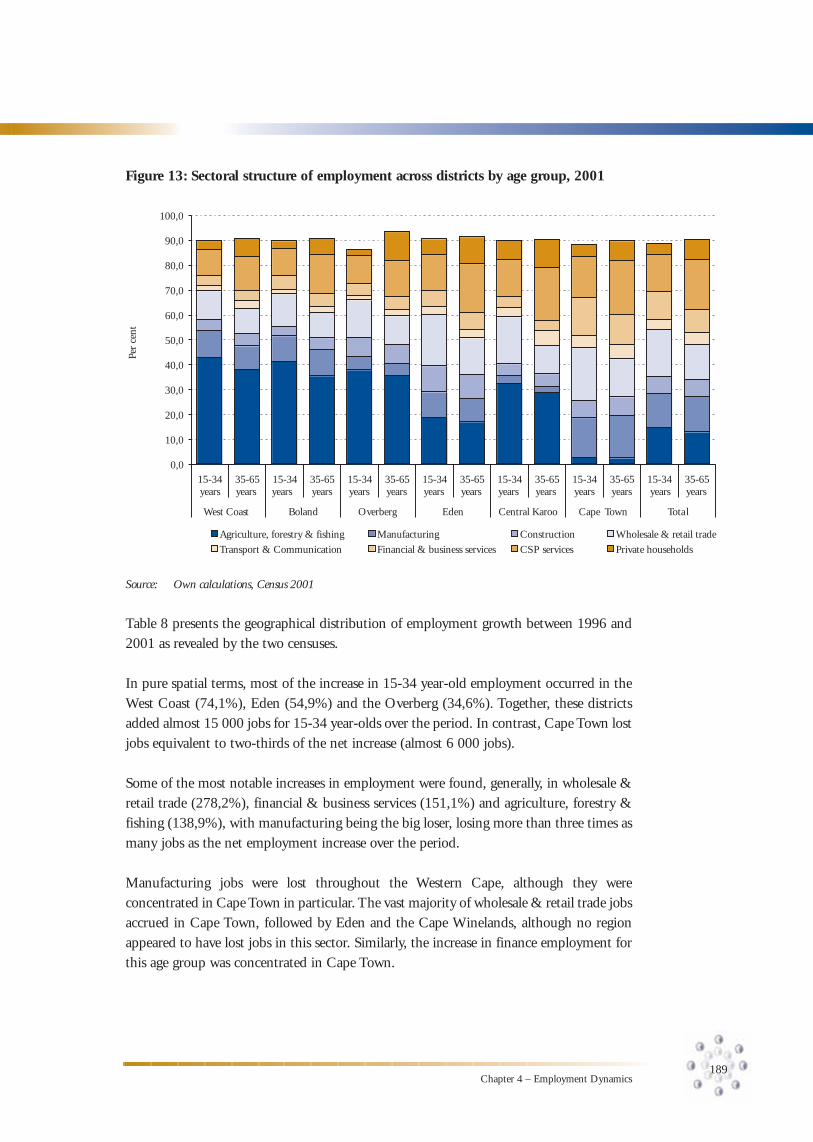
189Chapter 4 – Employment Dynamics
Figure 13: Sectoral structure of employment across districts by age group, 2001
Source: Own calculations, Census 2001
Table 8 presents the geographical distribution of employment growth between 1996 and 2001 as revealed by the two censuses.
In pure spatial terms, most of the increase in 15-34 year-old employment occurred in the West Coast (74,1%), Eden (54,9%) and the Overberg (34,6%). Together, these districts added almost 15 000 jobs for 15-34 year-olds over the period. In contrast, Cape Town lost jobs equivalent to two-thirds of the net increase (almost 6 000 jobs).
Some of the most notable increases in employment were found, generally, in wholesale & retail trade (278,2%), financial & business services (151,1%) and agriculture, forestry & fishing (138,9%), with manufacturing being the big loser, losing more than three times as many jobs as the net employment increase over the period.
Manufacturing jobs were lost throughout the Western Cape, although they were concentrated in Cape Town in particular. The vast majority of wholesale & retail trade jobs accrued in Cape Town, followed by Eden and the Cape Winelands, although no region appeared to have lost jobs in this sector. Similarly, the increase in finance employment for this age group was concentrated in Cape Town.
Wholesale & retail trade
Financial & business services Private households
Manufacturing
0,0
10,0
20,0
30,0
40,0
50,0
60,0
70,0
80,0
90,0
100,0
15-34years
35-65 15-34 35-65 15-34 35-65 15-34 35-65 15-34 35-65 15-34 35-65 15-34 35-65
West Coast Boland Overberg Eden Central Karoo Cape Town Total
years years years years years years years years years years years years years
Agriculture, forestry & fishing Construction
Transport & Communication CSP services
Per
cent
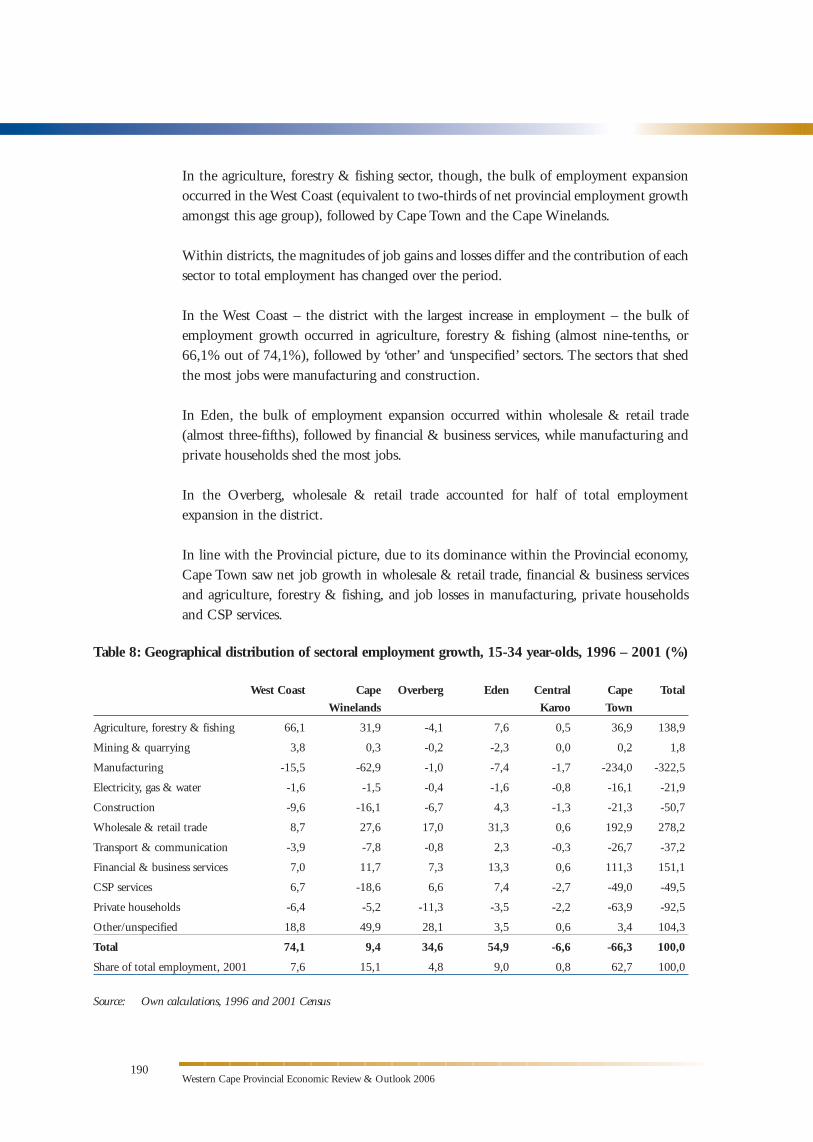
Western Cape Provincial Economic Review & Outlook 2006190
Table 8: Geographical distribution of sectoral employment growth, 15-34 year-olds, 1996 – 2001 (%)
West Coast Cape Overberg Eden Central Cape Total
Winelands Karoo Town
Agriculture, forestry & fishing 66,1 31,9 -4,1 7,6 0,5 36,9 138,9
Mining & quarrying 3,8 0,3 -0,2 -2,3 0,0 0,2 1,8
Manufacturing -15,5 -62,9 -1,0 -7,4 -1,7 -234,0 -322,5
Electricity, gas & water -1,6 -1,5 -0,4 -1,6 -0,8 -16,1 -21,9
Construction -9,6 -16,1 -6,7 4,3 -1,3 -21,3 -50,7
Wholesale & retail trade 8,7 27,6 17,0 31,3 0,6 192,9 278,2
Transport & communication -3,9 -7,8 -0,8 2,3 -0,3 -26,7 -37,2
Financial & business services 7,0 11,7 7,3 13,3 0,6 111,3 151,1
CSP services 6,7 -18,6 6,6 7,4 -2,7 -49,0 -49,5
Private households -6,4 -5,2 -11,3 -3,5 -2,2 -63,9 -92,5
Other/unspecified 18,8 49,9 28,1 3,5 0,6 3,4 104,3
Total 74,1 9,4 34,6 54,9 -6,6 -66,3 100,0
Share of total employment, 2001 7,6 15,1 4,8 9,0 0,8 62,7 100,0
Source: Own calculations, 1996 and 2001 Census
In the agriculture, forestry & fishing sector, though, the bulk of employment expansion occurred in the West Coast (equivalent to two-thirds of net provincial employment growth amongst this age group), followed by Cape Town and the Cape Winelands.
Within districts, the magnitudes of job gains and losses differ and the contribution of each sector to total employment has changed over the period.
In the West Coast – the district with the largest increase in employment – the bulk of employment growth occurred in agriculture, forestry & fishing (almost nine-tenths, or 66,1% out of 74,1%), followed by ‘other’ and ‘unspecified’ sectors. The sectors that shed the most jobs were manufacturing and construction.
In Eden, the bulk of employment expansion occurred within wholesale & retail trade (almost three-fifths), followed by financial & business services, while manufacturing and private households shed the most jobs.
In the Overberg, wholesale & retail trade accounted for half of total employment expansion in the district.
In line with the Provincial picture, due to its dominance within the Provincial economy, Cape Town saw net job growth in wholesale & retail trade, financial & business services and agriculture, forestry & fishing, and job losses in manufacturing, private households and CSP services.
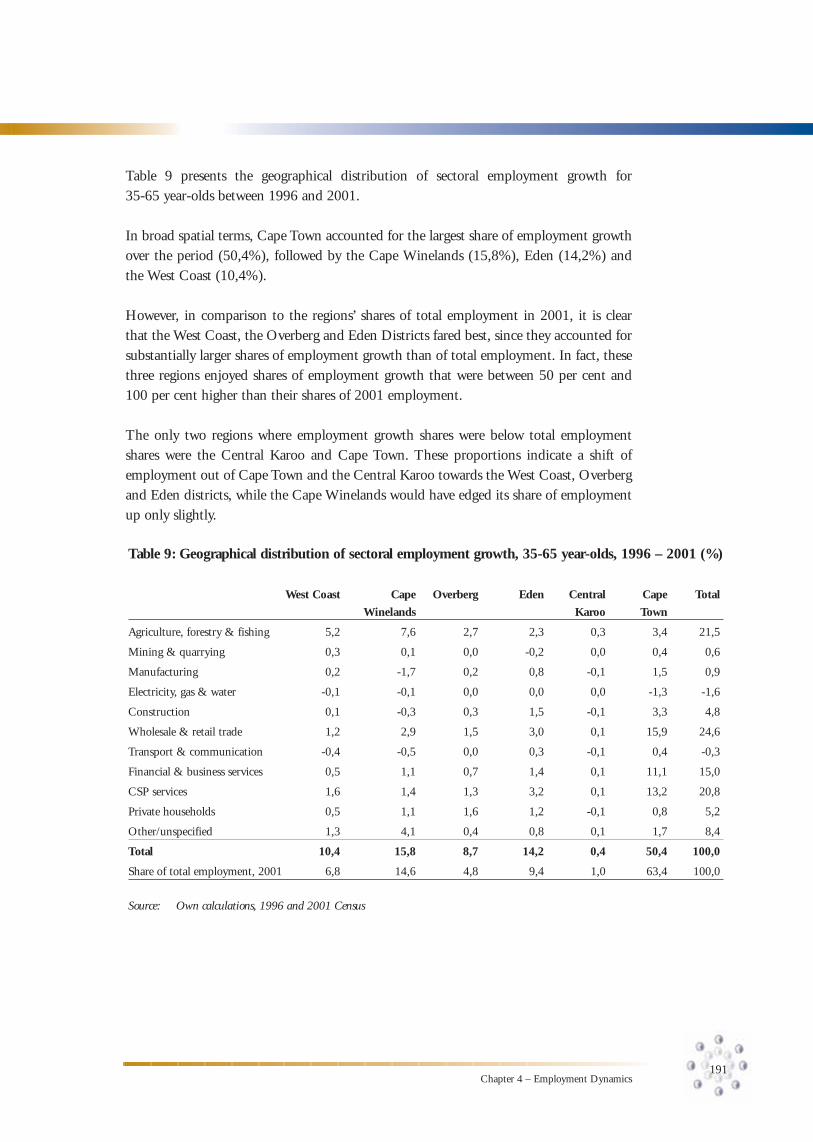
191Chapter 4 – Employment Dynamics
Table 9 presents the geographical distribution of sectoral employment growth for 35-65 year-olds between 1996 and 2001.
In broad spatial terms, Cape Town accounted for the largest share of employment growth over the period (50,4%), followed by the Cape Winelands (15,8%), Eden (14,2%) and the West Coast (10,4%).
However, in comparison to the regions’ shares of total employment in 2001, it is clear that the West Coast, the Overberg and Eden Districts fared best, since they accounted for substantially larger shares of employment growth than of total employment. In fact, these three regions enjoyed shares of employment growth that were between 50 per cent and 100 per cent higher than their shares of 2001 employment.
The only two regions where employment growth shares were below total employment shares were the Central Karoo and Cape Town. These proportions indicate a shift of employment out of Cape Town and the Central Karoo towards the West Coast, Overberg and Eden districts, while the Cape Winelands would have edged its share of employment up only slightly.
Table 9: Geographical distribution of sectoral employment growth, 35-65 year-olds, 1996 – 2001 (%)
West Coast Cape Overberg Eden Central Cape Total
Winelands Karoo Town
Agriculture, forestry & fishing 5,2 7,6 2,7 2,3 0,3 3,4 21,5
Mining & quarrying 0,3 0,1 0,0 -0,2 0,0 0,4 0,6
Manufacturing 0,2 -1,7 0,2 0,8 -0,1 1,5 0,9
Electricity, gas & water -0,1 -0,1 0,0 0,0 0,0 -1,3 -1,6
Construction 0,1 -0,3 0,3 1,5 -0,1 3,3 4,8
Wholesale & retail trade 1,2 2,9 1,5 3,0 0,1 15,9 24,6
Transport & communication -0,4 -0,5 0,0 0,3 -0,1 0,4 -0,3
Financial & business services 0,5 1,1 0,7 1,4 0,1 11,1 15,0
CSP services 1,6 1,4 1,3 3,2 0,1 13,2 20,8
Private households 0,5 1,1 1,6 1,2 -0,1 0,8 5,2
Other/unspecified 1,3 4,1 0,4 0,8 0,1 1,7 8,4
Total 10,4 15,8 8,7 14,2 0,4 50,4 100,0
Share of total employment, 2001 6,8 14,6 4,8 9,4 1,0 63,4 100,0
Source: Own calculations, 1996 and 2001 Census
Western Cape Provincial Economic Review & Outlook 2006192
Overall, the largest changes in sectoral employment were in wholesale & retail trade (24,6% of the total increase), agriculture, forestry & fishing (21,5%), CSP services (20,8%), and financial & business services (15%).
Within wholesale & retail trade, the bulk of employment expansion occurred within Cape Town, accounting for 15,9 per cent of total Provincial employment growth over the period. Employment within this sector expanded in all districts, with growth in Eden representing 3 per cent of Provincial employment growth amongst this age-group and that in the Cape Winelands representing 2,9 per cent.
In terms of agriculture, forestry & fishing, employment growth has been experienced in all districts but has been concentrated particularly in the West Coast and the Cape Winelands. Employment growth in these districts in this sector accounted for 5,2 per cent and 7,6 per cent respectively of overall employment expansion, with Cape Town accounting for a further 3,4 per cent.
CSP services contributed over one fifth of employment expansion over the period and was highly concentrated within Cape Town. In fact, the Cape Town CSP services sector alone accounted for 13,2 per cent of Provincial employment expansion amongst 35-65 year-olds. Eden’s CSP Services sector accounted for a further 3,2 per cent of Provincial employment growth. A similar pattern is observable in finance employment growth.
4.2 Unemployment and geography
Unemployment rates are likely to vary on a spatial basis, depending on the regional socioeconomic characteristics of a specific region. These factors are complex and interrelated. For example, the level of economic activity within a region may, on the one hand, be linked to lower rates of unemployment because there are relatively more employment opportunities, while, on the other hand, it may be argued that such areas are more likely to attract workseekers, thereby increasing the supply of labour and resulting in higher rates of unemployment.
Figure 14 presents broad unemployment rates for the Western Cape’s five districts and the city for 1996 and 2001.
Cape Town, the Central Karoo and Eden have high unemployment rates while the West Coast, Cape Winelands and Overberg have relatively low unemployment rates, both overall and for the 15-34 year-old and 35-65 year-old age groups separately.
In 2001, the Central Karoo was characterised by a 36 per cent unemployment rate, followed by Cape Town at 29,2 per cent and Eden at 26,5 per cent. In contrast, unemployment in the West Coast stood at 13,8 per cent, at 18,4 per cent in the Cape Winelands and at 18,6 per cent in the Overberg.
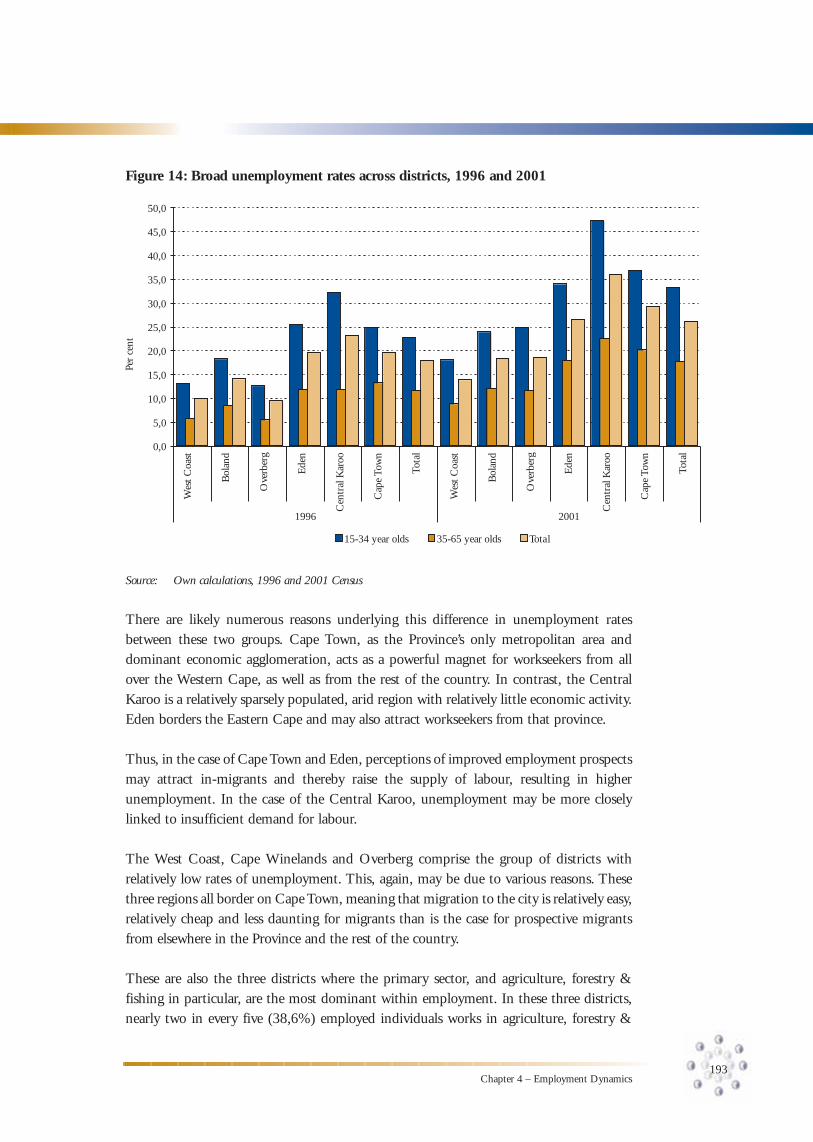
193Chapter 4 – Employment Dynamics
Figure 14: Broad unemployment rates across districts, 1996 and 2001
Source: Own calculations, 1996 and 2001 Census
There are likely numerous reasons underlying this difference in unemployment rates between these two groups. Cape Town, as the Province’s only metropolitan area and dominant economic agglomeration, acts as a powerful magnet for workseekers from all over the Western Cape, as well as from the rest of the country. In contrast, the Central Karoo is a relatively sparsely populated, arid region with relatively little economic activity. Eden borders the Eastern Cape and may also attract workseekers from that province.
Thus, in the case of Cape Town and Eden, perceptions of improved employment prospects may attract in-migrants and thereby raise the supply of labour, resulting in higher unemployment. In the case of the Central Karoo, unemployment may be more closely linked to insufficient demand for labour.
The West Coast, Cape Winelands and Overberg comprise the group of districts with relatively low rates of unemployment. This, again, may be due to various reasons. These three regions all border on Cape Town, meaning that migration to the city is relatively easy, relatively cheap and less daunting for migrants than is the case for prospective migrants from elsewhere in the Province and the rest of the country.
These are also the three districts where the primary sector, and agriculture, forestry & fishing in particular, are the most dominant within employment. In these three districts, nearly two in every five (38,6%) employed individuals works in agriculture, forestry &
Wes
t Coa
st
Bol
and
Ove
rber
g
Ede
n
Cen
tral
Kar
oo
Cap
e To
wn
Tota
l
Wes
t Coa
st
Bol
and
Ove
rber
g
Ede
n
Cen
tral
Kar
oo
Cap
e To
wn
Tota
l
Per
cent
1996 2001
0,0
5,0
10,0
15,0
20,0
25,0
30,0
35,0
40,0
45,0
50,0
15-34 year olds 35-65 year olds Total
Western Cape Provincial Economic Review & Outlook 2006194
fishing. This relatively dominant position of the primary sector means that these districts
may have greater scope for absorbing relatively less educated and less skilled individuals
than those districts dominated by tertiary sector employment. Further, the relative
proximity of these regions to the city means that firms in these districts are in a relatively
good position to cater to this large market, thereby also raising employment.
Figure 15 presents the spatial composition of unemployment change between 1996 and
2001, while also providing the 2001 shares of the Provincial labour force for comparison.
The shares of the five district municipalities are presented, while that of Cape Town is
subdivided into shares for africans, coloureds and ‘other’ race groups.
Of the increase in unemployment recorded over the period, the bulk derived from
15-34 year-olds. This group represents 65,9 per cent of the net increase in unemployment,
compared to 34,1 per cent for 35-65 year-olds.
Of the five districts, Eden and the Cape Winelands accounted for the largest proportion
of the increase in unemployment amongst 15-34 year-olds – 5,6 per cent and
4,5 per cent, respectively. However, compared to their shares of the labour force, the
Central Karoo and Overberg contributed the most to increased unemployment, the
regions’ shares of unemployment change being 1,7 and 1,3 times their shares of the labour
force respectively.
The increase in unemployment amongst 15-34 year-olds in Cape Town represented almost
one-half (49,6%) of the increase in unemployment over the period. This was mainly due
to the fact that in Cape Town, africans between the ages of 15 and 34 years represented
36,2 per cent of overall unemployment growth, followed by coloureds, who accounted for
14,5 per cent.
A similar pattern is observable for individuals between the ages of 35 and 65 years.
Africans in Cape Town in this age group accounted for 14,7 per cent of the Western Cape’s
unemployment growth, while their coloured counterparts accounted for 10,1 per cent.
Eden and the Cape Winelands were, again, the two districts that accounted for the largest
proportions of total unemployment growth. However, amongst this age group, it was only
Cape Town africans who accounted for a larger proportion of unemployment growth than
they did of the 2001 labour force, the ratio between these two shares being 1,7.
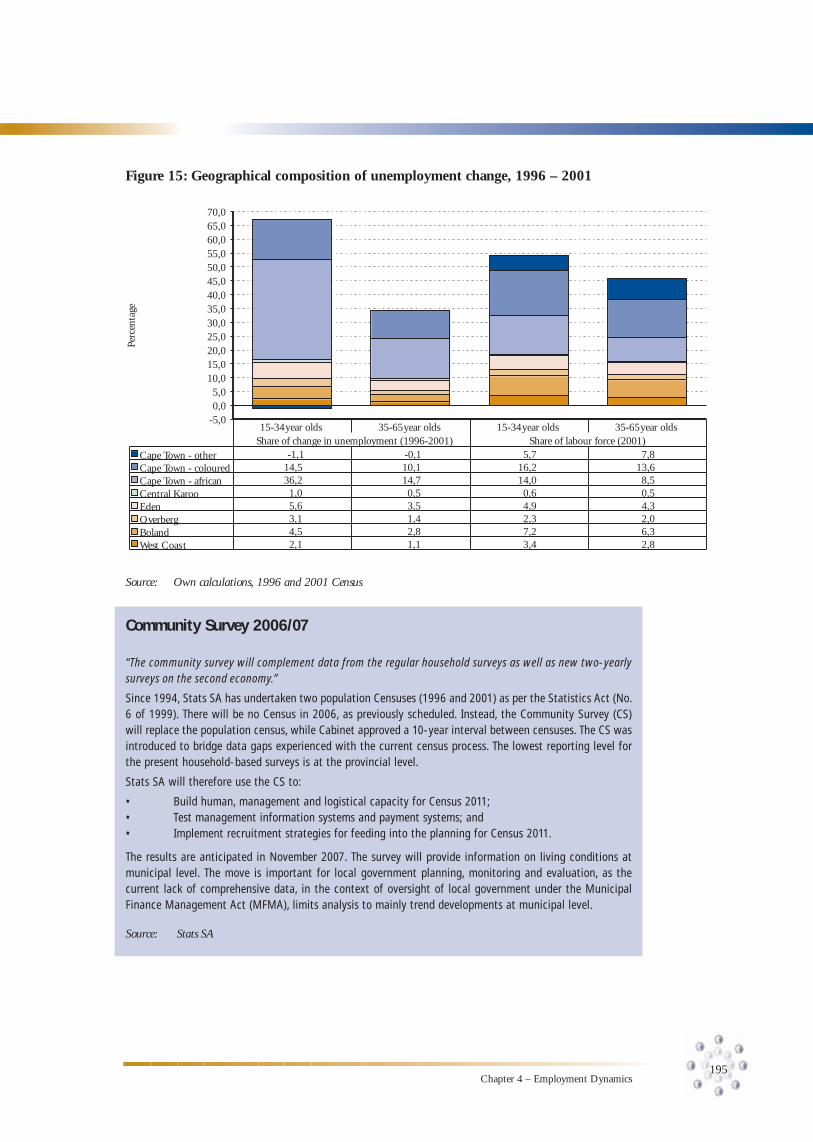
195Chapter 4 – Employment Dynamics
Figure 15: Geographical composition of unemployment change, 1996 – 2001
-5,00,05,0
10,015,020,025,030,035,040,045,050,055,060,065,070,0
-1,1 -0,1 5,7 7,814,5 10,1 16,2 13,636,2 14,7 14,0 8,51,0 0,5 0,6 0,55,6 3,5 4,9 4,33,1 1,4 2,3 2,04,5 2,8 7,2 6,32,1 1,1 3,4 2,8
Share of change in unemployment (1996-2001)Cape Town - other
Cape Town - african
15-34year olds 35-65year olds 15-34year olds 35-65year olds
Cape Town - coloured
EdenOverbergBolandWest Coas t
Central Karoo
Perc
enta
ge
Share of labour force (2001)
Source: Own calculations, 1996 and 2001 Census
Community Survey 2006/07
“The community survey will complement data from the regular household surveys as well as new two-yearly surveys on the second economy.”
Since 1994, Stats SA has undertaken two population Censuses (1996 and 2001) as per the Statistics Act (No. 6 of 1999). There will be no Census in 2006, as previously scheduled. Instead, the Community Survey (CS) will replace the population census, while Cabinet approved a 10-year interval between censuses. The CS was introduced to bridge data gaps experienced with the current census process. The lowest reporting level for the present household-based surveys is at the provincial level.
Stats SA will therefore use the CS to:
• Build human, management and logistical capacity for Census 2011;• Test management information systems and payment systems; and• Implement recruitment strategies for feeding into the planning for Census 2011.
The results are anticipated in November 2007. The survey will provide information on living conditions at municipal level. The move is important for local government planning, monitoring and evaluation, as the current lack of comprehensive data, in the context of oversight of local government under the Municipal Finance Management Act (MFMA), limits analysis to mainly trend developments at municipal level.
Source: Stats SA
Western Cape Provincial Economic Review & Outlook 2006196
8 This definition is slightly different to the definition used in the rest of this chapter in that it excludes individuals aged 65 years. This is due to the fact that the model projects the population in five-year age-groups, for example, 0-4 years, 5-9 years, 10-14 years, and so on. The final age group within the working age population, therefore, is 60-64 years. This, however, should not have major implications for the estimates, as the September 2004 LFS reveals that only 0,21 per cent of the employed and 0,19 per cent of the broadly unemployed are 65 years old.
5. The future labour market to 20155.1 Setting up the scenarios
Considerable attention is focused nationally and Provincially on interventions that may boost job creation and lower unemployment, a fundamental tenet of the shared growth and integrated development agenda.
Underlying the policy debate are questions such as 'how many jobs need to be created in order to reduce unemployment?' and 'how will population growth affect efforts to reduce unemployment?'.
These questions are difficult to answer and depend on numerous variables, some less predictable than others.
The analysis that follows presents scenarios that are intended to initiate and frame debate. It is important to remember that the scenarios represent just a few of many possible outcomes, given the underlying assumptions. Furthermore, they do not attempt to model or take account of any of the recently announced economic stimuli within the national Accelerated and Shared Growth Initiative for SA (Asgisa) or the Province’s PGDS processes.
The scenarios presented are very simple approximations of some of the labour market outcomes that are possible under various conditions in the Western Cape and are by no means definitive, since they are, due to their simple nature, unable to account for a wide variety of factors.
The scenarios presented are derived from various demographic and economic data. The demographic model commissioned by the Western Cape Department of Social Services provides detailed projections of the Western Cape population and is based on the ASSA2003 model. The model was used to generate, under its standard assumptions, population projections up to 2015, by race and age group. The working age population for each race group is calculated as the number of individuals aged between 15 and 64 years8.
The LFPR refers to the fraction of working age individuals who decide to enter the labour force. In 2004, the LFPR for the Western Cape was 72,9 per cent, compared to 67,3 per cent for the country as a whole. The Provincial figure for 2004 is not statistically different from Provincial estimates of labour force participation based on any of the other September LFSs, with all estimates ranging between 69 per cent and 73 per cent.
197Chapter 4 – Employment Dynamics
As shown above, LFPRs are related to various demographic characteristics. In order to account for some of this variation, while also trying to balance the requirement of detailed data with the limitations of the small provincial samples in the LFSs, LFPRs have been calculated according to race and age group. The small asian sample means that reliable estimates of asian labour force participation are not possible. In order to overcome this problem, it was assumed that asians in the Western Cape are similar to asians in the rest of the country in terms of their LFPRs.
In terms of projecting LFPRs into the future, three options are taken into account: the assumption of constant LFPRs between 2004 and 2015, the assumption of linear convergence of LFPRs towards white LFPRs over a specified period of time (the achievement of full convergence can be set between 2015 and 2050), or the assumption of specific LFPRs for each race and age group for 2015, with change towards these targets being linear.
To cross over between the LFS and the demographic model, the LFPRs are used to calculate the labour force based on the working age population projected by the demographic model. As a result, the calculated total LFPR for the Western Cape in 2004 of 73,7 per cent is 0,8 percentage points above the 72,9 per cent estimate of the September 2004 LFS9.
The economic growth rates and formal employment elasticities used derive from the BER’s Western Cape econometric model that was commissioned by the Western Cape Provincial Treasury. Since the model only contains formal sector employment data, and to keep the scenarios consistent with the labour market analysis presented above, employment data for 2000 to 2004 has been taken from the September issues of the LFS for these years.
In the LFSs, employment can be classified as formal sector employment, informal sector employment, or domestic worker employment. There are also categories that indicate that the sector cannot be determined (labelled as ‘don’t know’ or ‘unspecified’ in the datasets). Workers for whom it is not possible to allocate a sector constitute a small proportion of the employed, ranging between 0 per cent and 0,8 per cent.
For the purpose of the scenarios, it was assumed that these workers were all informal sector workers, or, stated differently, that employment of this group of workers would vary in line with informal sector employment.
Since only output elasticities for formal sector employment are included in the BER’s model, the scenarios need to make assumptions on the paths of employment in the informal and domestic worker sector. It was individually assumed that informal sector and domestic worker employment either remain constant or track the change in formal sector employment over the period.
9 This difference is also partly related to the fact that the LFSs ‘other’ and ‘unspecified’ racial categories, which the demographic model does not have, were omitted from the scenarios.
Western Cape Provincial Economic Review & Outlook 2006198
Therefore, the LFPRs based on LFS data combine with the working age population projections from the demographic model to estimate the broad labour force.
The output-formal sector employment elasticity relates projected output growth over the period to formal sector employment growth, with a pair of assumptions (not necessarily the same for both) that relate formal sector employment growth to informal sector and domestic worker employment growth.
These estimated growth rates are applied to the 2004 employment levels for all three sectors that, combined, give total employment. Total employment estimates are subtracted from the broad labour force estimates to obtain estimates of the number of broadly unemployed individuals in the Province, as well as the Province’s broad unemployment rate.
5.2 Possible future labour market scenarios
Scenarios are mapped by changing some of the variables in the model. Considering that the demographic projections and the BER’s economic growth and formal sector employment-output elasticities are given, there are only three variables that can be changed to estimate possible labour market outcomes in 2015. These depend on the three assumptions made regarding the path of LFPRs over the period, and the relationships between formal sector employment growth and informal sector employment growth on the one hand and between formal sector employment growth and domestic worker employment growth on the other.
There are clearly numerous scenario possibilities in terms of these assumptions, but for brevity only two are presented here.
Scenario A assumes that LFPRs for the various race and age-group combinations remain constant, that informal sector employment remains constant and that domestic worker employment remains constant between 2004 and 2015.
In contrast, scenario B, while assuming constant LFPRs, assumes that informal sector employment and domestic worker employment track formal sector employment growth (that is, that these two sectors grow employment at the same rate as the formal sector). This is a relatively optimistic set of assumptions given that informal sector employment growth has been lacklustre between 2000 and 2004, according the LFSs.
Then, based on these two scenarios, we look at the feasibility of targeting a broad unemployment rate of 10 per cent in the Western Cape by 2015. Extra jobs would be required and, in order to allow for the economy to ‘create’ these jobs in the scenarios, flexibility can be allowed in the projected GDPR growth rates (higher output growth leads
199Chapter 4 – Employment Dynamics
to higher employment growth) or, alternatively, in the total employment-output elasticity (higher employment-output elasticities lead to higher employment growth for a given output growth rate). The results of scenarios A and B are presented in tables 10 and 11.
Scenario A in table 10 shows an increase in employment from 1,69-million in 2004 to 2,07-million in 2015, an increase of around 374 000 jobs and averaging almost 2 per cent per annum from 2010 onwards.
Non-formal sector employment (that is, informal sector and domestic worker employment) remains constant at around 272 000 jobs, by assumption. At the same time, the labour force increases from 2,42-million to 2,65-million.
Broad unemployment increases slightly to 2008, whereafter slowing labour force growth is surpassed by employment growth, and the absolute number of broadly unemployed individuals begins to decline.
By 2015, there are 584 000 broadly unemployed individuals in the Province, implying a broad unemployment rate of 22 per cent.
Scenario B in table 11 projects a higher level of employment by 2015, which is unsurprising given the change in assumptions. In 2015, 2,14-million people are employed, representing an increase of 446 000 from 2004, and 72 000 jobs more than projected under scenario A. Non-formal sector employment rises from 272 000 in 2004 to 345 000 in 2015.
Total employment growth is therefore higher under this scenario by a margin of around 0,2 percentage points to 0,4 percentage points from 2007 onwards. Consequently, unemployment is lower in 2015 under these assumptions, totalling around 512 000, the peak having come slightly earlier, and is equivalent to an unemployment rate of about 19,3 per cent.
Interestingly, the assumptions on whether informal sector and domestic worker employment grows as fast as formal sector employment or whether it does not grow at all have a relatively small impact on total employment and the unemployment rate at the end of the period. Employment in 2015 is higher by 72 000 jobs, or about 6 500 per year under the assumption of non-formal sector employment growth keeping pace with formal sector employment growth, while the unemployment rate is 2,7 percentage points lower. This is largely due to two factors: the relatively small size of non-formal sector employment within total employment in the Western Cape and the relatively short time period.
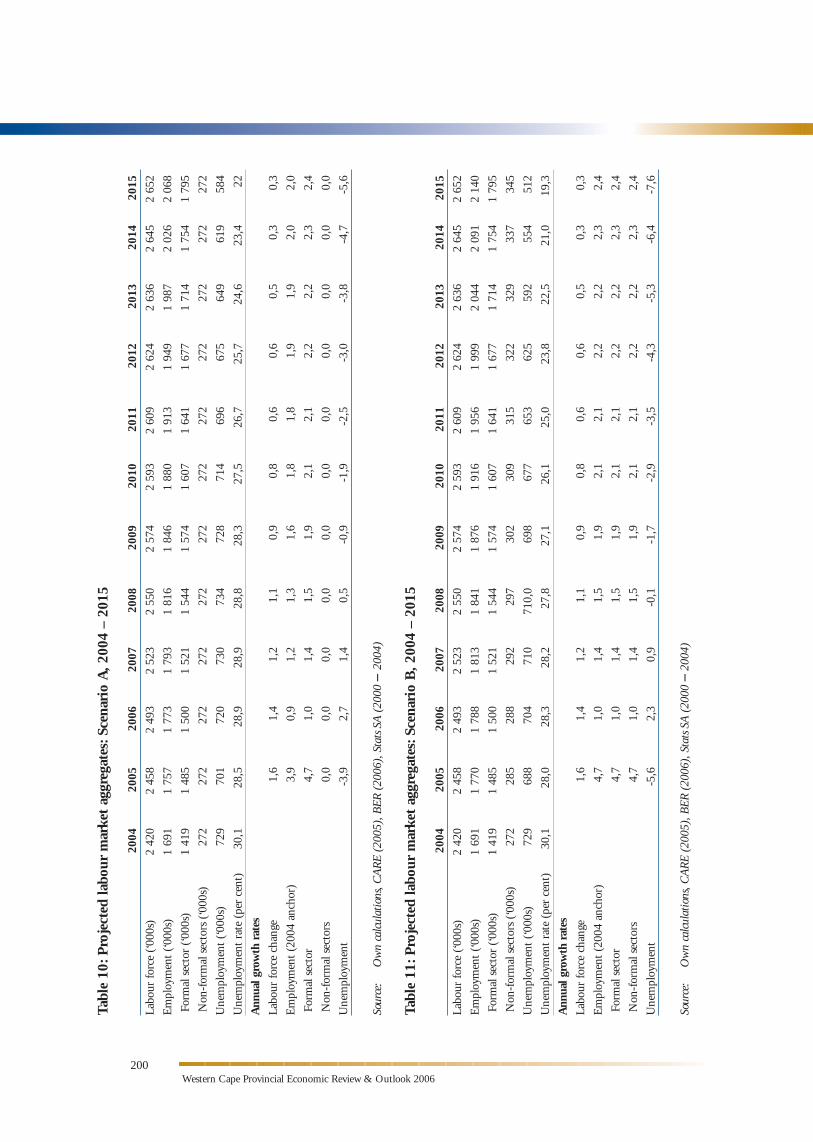
Western Cape Provincial Economic Review & Outlook 2006200
Tabl
e 10
: Pro
ject
ed la
bour
mar
ket
aggr
egat
es: S
cena
rio
A, 2
004
– 20
15
20
04
2005
20
06
2007
20
08
2009
20
10
2011
20
12
2013
20
14
2015
Labo
ur f
orce
(‘0
00s)
2
420
2 45
8 2
493
2 52
3 2
550
2 57
4 2
593
2 60
9 2
624
2 63
6 2
645
2 65
2
Em
ploy
men
t (‘0
00s)
1
691
1 75
7 1
773
1 79
3 1
816
1 84
6 1
880
1 91
3 1
949
1 98
7 2
026
2 06
8
For
mal
sec
tor
(‘000
s)
1 41
9 1
485
1 50
0 1
521
1 54
4 1
574
1 60
7 1
641
1 67
7 1
714
1 75
4 1
795
Non
-for
mal
sec
tors
(‘0
00s)
27
2 27
2 27
2 27
2 27
2 27
2 27
2 27
2 27
2 27
2 27
2 27
2
Une
mpl
oym
ent
(‘000
s)
729
701
720
730
734
728
714
696
675
649
619
584
Une
mpl
oym
ent
rate
(pe
r ce
nt)
30,1
28
,5
28,9
28
,9
28,8
28
,3
27,5
26
,7
25,7
24
,6
23,4
22
Ann
ual g
row
th r
ates
Labo
ur f
orce
cha
nge
1,
6 1,
4 1,
2 1,
1 0,
9 0,
8 0,
6 0,
6 0,
5 0,
3 0,
3
Em
ploy
men
t (2
004
anch
or)
3,
9 0,
9 1,
2 1,
3 1,
6 1,
8 1,
8 1,
9 1,
9 2,
0 2,
0
For
mal
sec
tor
4,
7 1,
0 1,
4 1,
5 1,
9 2,
1 2,
1 2,
2 2,
2 2,
3 2,
4
Non
-for
mal
sec
tors
0,0
0,0
0,0
0,0
0,0
0,0
0,0
0,0
0,0
0,0
0,0
Une
mpl
oym
ent
-3
,9
2,7
1,4
0,5
-0,9
-1
,9
-2,5
-3
,0
-3,8
-4
,7
-5,6
Sour
ce:
O
wn
calc
ulat
ions
, CA
RE
(200
5), B
ER (
2006
), S
tats
SA (
2000
– 2
004)
Tabl
e 11
: Pro
ject
ed la
bour
mar
ket
aggr
egat
es: S
cena
rio
B, 2
004
– 20
15
20
04
2005
20
06
2007
20
08
2009
20
10
2011
20
12
2013
20
14
2015
Labo
ur f
orce
(‘0
00s)
2
420
2 45
8 2
493
2 52
3 2
550
2 57
4 2
593
2 60
9 2
624
2 63
6 2
645
2 65
2
Em
ploy
men
t (‘0
00s)
1
691
1 77
0 1
788
1 81
3 1
841
1 87
6 1
916
1 95
6 1
999
2 04
4 2
091
2 14
0
For
mal
sec
tor
(‘000
s)
1 41
9 1
485
1 50
0 1
521
1 54
4 1
574
1 60
7 1
641
1 67
7 1
714
1 75
4 1
795
Non
-for
mal
sec
tors
(‘0
00s)
27
2 28
5 28
8 29
2 29
7 30
2 30
9 31
5 32
2 32
9 33
7 34
5
Une
mpl
oym
ent
(‘000
s)
729
688
704
710
710,
0 69
8 67
7 65
3 62
5 59
2 55
4 51
2
Une
mpl
oym
ent
rate
(pe
r ce
nt)
30,1
28
,0
28,3
28
,2
27,8
27
,1
26,1
25
,0
23,8
22
,5
21,0
19
,3
Ann
ual g
row
th r
ates
Labo
ur f
orce
cha
nge
1,
6 1,
4 1,
2 1,
1 0,
9 0,
8 0,
6 0,
6 0,
5 0,
3 0,
3
Em
ploy
men
t (2
004
anch
or)
4,
7 1,
0 1,
4 1,
5 1,
9 2,
1 2,
1 2,
2 2,
2 2,
3 2,
4
For
mal
sec
tor
4,
7 1,
0 1,
4 1,
5 1,
9 2,
1 2,
1 2,
2 2,
2 2,
3 2,
4
Non
-for
mal
sec
tors
4,7
1,0
1,4
1,5
1,9
2,1
2,1
2,2
2,2
2,3
2,4
Une
mpl
oym
ent
-5
,6
2,3
0,9
-0,1
-1
,7
-2,9
-3
,5
-4,3
-5
,3
-6,4
-7
,6
Sour
ce:
Ow
n ca
lcul
atio
ns, C
AR
E (2
005)
, BER
(20
06),
Sta
ts SA
(20
00 –
200
4)
201Chapter 4 – Employment Dynamics
Given these two scenarios, how viable is a strategy to attain a broad unemployment rate of, say, 10 per cent in 2015? Table 12 presents the requirements to attain this goal under the assumptions of scenario A (constant labour force participation rates and constant non-formal employment), the more pessimistic of the two scenarios.
In order to attain 10 per cent broad unemployment in 2015, total unemployment is required to fall to 265 000 compared to 729 000 in 2004, a reduction of 464 000.
Given a constant labour force, this requires that employment growth be accelerated so that, by 2015, total employment equals 2,39-million, which is 319 000 more jobs than was initially projected under scenario A’s assumptions. Given the structure of the scenarios, there are two variables that can be adjusted to account for these extra jobs: economic growth and the total employment-output elasticity.
Assuming that the changed labour market performance is to be derived from changed economic growth, in 2015, GDPR would have to be approximately R114bn (measured in 2000 rands) higher than the BER’s provincial econometric model projects.
In other words, the BER model projects an increase in real GDPR of around 84 per cent between 2004 and 2015, while attaining a 10 per cent broad unemployment rate under scenario A’s assumptions would require an increase of around 218 per cent, or average annual growth rates above 8 per cent a year over the period.
If the required extra jobs are to be generated instead via a change in the total employment-output elasticity, required economic growth would not change from the BER’s projections, but the elasticity would have to increase by around 0,29. Given that the elasticities in the model range between 0,2 and 0,7 but tend to be around 0,5, this is a very substantial increase. This would mean that for every 1 per cent increase in GDPR, the Province would have to generate an extra 0,29 per cent growth in employment over and above the increase in employment that the BER’s model predicts will occur.
Table 13 presents the required changes in the two economic variables required to attain 10 per cent broad unemployment by 2015, subject to the assumptions of scenario B.
To attain a 10 per cent unemployment rate, an extra 247 000 jobs need to be created over the period, leading to a total employment increase over the period of 696 000 jobs. Since it is assumed that non-formal employment is growing at the same pace as formal employment, total employment growth is more rapid over the period, as mentioned earlier.
This means that, assuming that raised economic growth is to account for the extra jobs, GDPR should total over R303bn (2000 rands) by 2015, compared to the original projection of R234bn. Consequently, annual economic growth rates over the period are

Western Cape Provincial Economic Review & Outlook 2006202
Tabl
e 12
: Req
uire
men
ts t
o at
tain
10%
bro
ad u
nem
ploy
men
t ra
te b
y 20
15: S
cena
rio
A
20
04
2005
20
06
2007
20
08
2009
20
10
2011
20
12
2013
20
14
2015
Labo
ur f
orce
(‘0
00s)
2
420
2 45
8 2
493
2 52
3 2
550
2 57
4 2
593
2 60
9 2
624
2 63
6 2
645
2 65
2
Tota
l em
ploy
men
t (‘0
00s)
1
691
1 78
0 1
820
1 86
5 1
914
1 97
1 2
033
2 09
6 2
164
2 23
4 2
309
2 38
7
Ori
gina
l em
ploy
men
t (‘0
00s)
1
691
1 75
7 1
773
1 79
3 1
816
1 84
6 1
880
1 91
3 1
949
1 98
7 2
026
2 06
8
Ext
ra jo
bs r
equi
red
(‘000
s)
0 23
47
72
97
12
4 15
3 18
3 21
5 24
8 28
2 31
9
Une
mpl
oym
ent
(‘000
s)
729
678
673
658
637
603
560
513
460
401
336
265
Une
mpl
oym
ent
rate
(pe
r ce
nt)
30,1
27
,6
27,0
26
,1
25,0
23
,4
21,6
19
,7
17,5
15
,2
12,7
10
Ori
gina
l eco
nom
ic p
erfo
rman
ce
GD
PR (
2000
R-b
illio
n)
140,
9 14
8,3
155,
1 16
1,7
169,
0 17
7,0
185,
4 19
4,2
203,
5 21
3,2
223,
5 23
4,2
Eco
nom
ic g
row
th r
ate
(per
cen
t)
5,3
5,3
4,6
4,3
4,5
4,7
4,8
4,7
4,8
4,8
4,8
4,8
Out
put-
tota
l em
ploy
men
t el
asti
city
0,7
0,2
0,3
0,3
0,3
0,4
0,4
0,4
0,4
0,4
0,4
Tota
l em
ploy
men
t gr
owth
rat
e (p
er c
ent)
3,9
0,9
1,2
1,3
1,6
1,8
1,8
1,9
1,9
2,0
2,0
Cha
nge
via
econ
omic
gro
wth
Req
uire
d ec
onom
ic p
erfo
rman
ce
GD
PR (
2000
R-b
illio
n)
140,
9 15
0,9
168,
2 18
3,6
200,
3 21
7,6
235,
6 25
5,2
276,
0 29
8,4
322,
3 34
8,0
Eco
nom
ic g
row
th r
ate
(per
cen
t)
5,3
7,1
11,4
9,
2 9,
1 8,
6 8,
3 8,
3 8,
2 8,
1 8,
0 8,
0
Out
put-
tota
l em
ploy
men
t el
asti
city
0,74
0,
19
0,27
0,
29
0,34
0,
38
0,37
0,
39
0,40
0,
41
0,42
Tota
l em
ploy
men
t gr
owth
rat
e (p
er c
ent)
5,3
2,2
2,5
2,6
3,0
3,2
3,1
3,2
3,3
3,3
3,4
Cha
nges
req
uire
d
Incr
ease
in G
DP
grow
th r
ate
(per
cen
t)
0,0
1,8
6,9
4,9
4,6
3,9
3,5
3,6
3,4
3,3
3,2
3,2
Ext
ra G
DP
each
yea
r (2
000
R-b
illio
n)
0,0
2,6
13,1
21
,9
31,3
40
,6
50,1
60
,9
72,5
85
,1
98,9
11
3,8
Run
ning
tot
al e
xtra
GD
P (2
000
R-b
illio
n)
0,0
2,6
15,7
37
,5
68,9
10
9,5
159,
6 22
0,5
293,
0 37
8,1
477,
0 59
0,8
Cha
nge
via
empl
oym
ent
elas
tici
ty
Req
uire
d ec
onom
ic p
erfo
rman
ce
GD
PR (
2000
R-b
illio
n)
140,
9 14
8,3
155,
1 16
1,7
169,
0 17
7,0
185,
4 19
4,2
203,
5 21
3,2
223,
5 23
4,2
Eco
nom
ic g
row
th r
ate
(per
cen
t)
5,3
5,3
4,6
4,3
4,5
4,7
4,8
4,7
4,8
4,8
4,8
4,8
Out
put-
tota
l em
ploy
men
t el
asti
city
1,00
0,
48
0,58
0,
58
0,63
0,
66
0,66
0,
67
0,68
0,
69
0,70
Tota
l em
ploy
men
t gr
owth
rat
e (p
er c
ent)
5,3
2,2
2,5
2,6
3,0
3,2
3,1
3,2
3,3
3,3
3,4
Cha
nges
req
uire
d
Out
put-
tota
l em
ploy
men
t el
asti
city
0,
00
0,26
0,
29
0,31
0,
30
0,28
0,
28
0,28
0,
28
0,28
0,
28
0,28
Sour
ce:
Ow
n ca
lcul
atio
ns, C
AR
E (2
005)
, BER
(20
06),
Sta
ts SA
(20
00 –
200
4)
203Chapter 4 – Employment Dynamics
required to remain above 7 per cent for most of the period. Thus, over the period, the Western Cape economy would be required to generate a cumulative total of R364bn in GDPR, over and above the projected cumulative increase of R515bn.
Assuming the extra jobs are to result from a higher total employment-output elasticity, the required elasticities in each year would have to increase by between 0,2 and 0,24, which is only slightly less than the increases required under scenario A’s assumptions.
The scenarios presented here represent only two sets of assumptions regarding LFPRs and non-formal sector employment growth. As cautioned earlier, the figures presented in this section are merely hypothetical, having been generated by simple means, and are characterised by numerous assumptions. Clearly, different assumptions and the inclusion of more variables may alter the results. Therefore it is evident that the figures presented should only be used as very broad guides.
The scenarios presented both assume constant LFPRs (at a race-age-group level, not at the aggregate level), but differ in their assumptions as to the expected growth rates of employment in the informal sector and amongst domestic workers. Nevertheless, the scenarios do give rise to similar conclusions.
Given the demographic trends projected by the demographic model commissioned by the Provincial Government and given the economic trends projected by the BER’s provincial economic model, it appears that unemployment is likely to stabilise and then decline, in both absolute and relative terms.
Assuming no employment growth outside the formal sector, the broad unemployment rate in 2015 is likely to amount to about 22,1 per cent and, assuming uniform employment growth in all three employment sectors, the broad unemployment rate is projected to be 19,4 per cent in 2015.
Further, the scenarios begin to tease out the massive challenge required to lower unemployment. Both scenarios show that arguably unattainably high rates of economic growth or high employment-output elasticities would be required to generate a sufficient number of new jobs in order to reduce unemployment to this level. This suggests that relatively high levels of unemployment are likely to persist beyond this admittedly relatively short time horizon, while also beginning to cast some light on the extent of the changes required to reduce unemployment levels significantly.
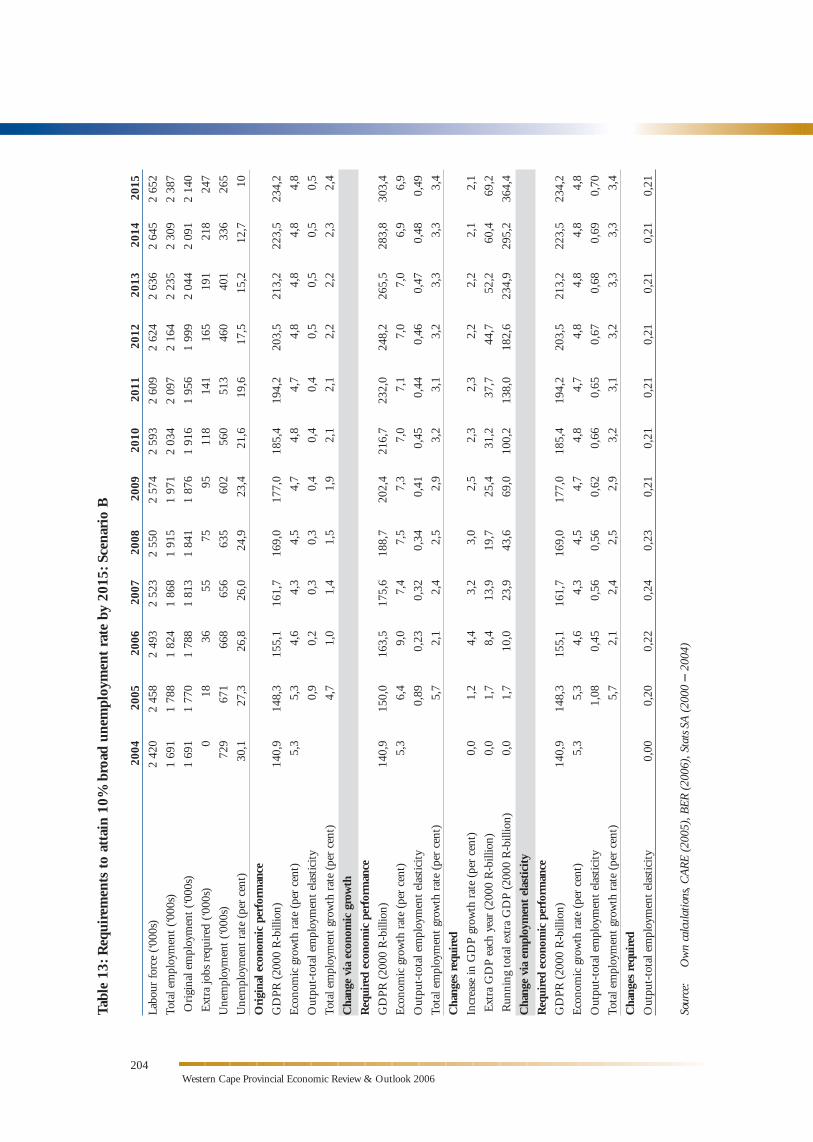
Western Cape Provincial Economic Review & Outlook 2006204
Tabl
e 13
: Req
uire
men
ts t
o at
tain
10%
bro
ad u
nem
ploy
men
t ra
te b
y 20
15: S
cena
rio
B
20
04
2005
20
06
2007
20
08
2009
20
10
2011
20
12
2013
20
14
2015
Labo
ur f
orce
(‘0
00s)
2
420
2 45
8 2
493
2 52
3 2
550
2 57
4 2
593
2 60
9 2
624
2 63
6 2
645
2 65
2
Tota
l em
ploy
men
t (‘0
00s)
1
691
1 78
8 1
824
1 86
8 1
915
1 97
1 2
034
2 09
7 2
164
2 23
5 2
309
2 38
7
Ori
gina
l em
ploy
men
t (‘0
00s)
1
691
1 77
0 1
788
1 81
3 1
841
1 87
6 1
916
1 95
6 1
999
2 04
4 2
091
2 14
0
Ext
ra jo
bs r
equi
red
(‘000
s)
0 18
36
55
75
95
11
8 14
1 16
5 19
1 21
8 24
7
Une
mpl
oym
ent
(‘000
s)
729
671
668
656
635
602
560
513
460
401
336
265
Une
mpl
oym
ent
rate
(pe
r ce
nt)
30,1
27
,3
26,8
26
,0
24,9
23
,4
21,6
19
,6
17,5
15
,2
12,7
10
Ori
gina
l eco
nom
ic p
erfo
rman
ce
GD
PR (
2000
R-b
illio
n)
140,
9 14
8,3
155,
1 16
1,7
169,
0 17
7,0
185,
4 19
4,2
203,
5 21
3,2
223,
5 23
4,2
Eco
nom
ic g
row
th r
ate
(per
cen
t)
5,3
5,3
4,6
4,3
4,5
4,7
4,8
4,7
4,8
4,8
4,8
4,8
Out
put-
tota
l em
ploy
men
t el
asti
city
0,9
0,2
0,3
0,3
0,4
0,4
0,4
0,5
0,5
0,5
0,5
Tota
l em
ploy
men
t gr
owth
rat
e (p
er c
ent)
4,7
1,0
1,4
1,5
1,9
2,1
2,1
2,2
2,2
2,3
2,4
Cha
nge
via
econ
omic
gro
wth
Req
uire
d ec
onom
ic p
erfo
rman
ce
GD
PR (
2000
R-b
illio
n)
140,
9 15
0,0
163,
5 17
5,6
188,
7 20
2,4
216,
7 23
2,0
248,
2 26
5,5
283,
8 30
3,4
Eco
nom
ic g
row
th r
ate
(per
cen
t)
5,3
6,4
9,0
7,4
7,5
7,3
7,0
7,1
7,0
7,0
6,9
6,9
Out
put-
tota
l em
ploy
men
t el
asti
city
0,89
0,
23
0,32
0,
34
0,41
0,
45
0,44
0,
46
0,47
0,
48
0,49
Tota
l em
ploy
men
t gr
owth
rat
e (p
er c
ent)
5,7
2,1
2,4
2,5
2,9
3,2
3,1
3,2
3,3
3,3
3,4
Cha
nges
req
uire
d
Incr
ease
in G
DP
grow
th r
ate
(per
cen
t)
0,0
1,2
4,4
3,2
3,0
2,5
2,3
2,3
2,2
2,2
2,1
2,1
Ext
ra G
DP
each
yea
r (2
000
R-b
illio
n)
0,0
1,7
8,4
13,9
19
,7
25,4
31
,2
37,7
44
,7
52,2
60
,4
69,2
Run
ning
tot
al e
xtra
GD
P (2
000
R-b
illio
n)
0,0
1,7
10,0
23
,9
43,6
69
,0
100,
2 13
8,0
182,
6 23
4,9
295,
2 36
4,4
Cha
nge
via
empl
oym
ent
elas
tici
ty
Req
uire
d ec
onom
ic p
erfo
rman
ce
GD
PR (
2000
R-b
illio
n)
140,
9 14
8,3
155,
1 16
1,7
169,
0 17
7,0
185,
4 19
4,2
203,
5 21
3,2
223,
5 23
4,2
Eco
nom
ic g
row
th r
ate
(per
cen
t)
5,3
5,3
4,6
4,3
4,5
4,7
4,8
4,7
4,8
4,8
4,8
4,8
Out
put-
tota
l em
ploy
men
t el
asti
city
1,08
0,
45
0,56
0,
56
0,62
0,
66
0,65
0,
67
0,68
0,
69
0,70
Tota
l em
ploy
men
t gr
owth
rat
e (p
er c
ent)
5,7
2,1
2,4
2,5
2,9
3,2
3,1
3,2
3,3
3,3
3,4
Cha
nges
req
uire
d
Out
put-
tota
l em
ploy
men
t el
asti
city
0,
00
0,20
0,
22
0,24
0,
23
0,21
0,
21
0,21
0,
21
0,21
0,
21
0,21
Sour
ce:
Ow
n ca
lcul
atio
ns, C
AR
E (2
005)
, BER
(20
06),
Sta
ts SA
(20
00 –
200
4)
205Chapter 4 – Employment Dynamics
6. Conclusion
The Western Cape faces important challenges in its efforts to ensure that there are sufficient employment opportunities for its population. The first challenge is the fact that the working age population is expected to continue to grow. The number of individuals between the ages of 15 and 65 years is expected to expand by 287 000 between 2005 and 2015, with all the growth occurring within the 35-65 year age group. Thus, the population is expected to become older over time. Migration into the Province is expected to play an important role in terms of aggregate population growth over the period, thereby presenting both opportunities and challenges.
The labour force has grown rapidly since 2000, mainly as a result of an increase in the number of broadly unemployed individuals. This, in turn, can be linked to rapid growth in the number of discouraged workseekers living in the Province. The number of discouraged workseekers in the Western Cape has been relatively small compared to the numbers in other provinces, although this is beginning to change. As a result, it is expected that the relatively narrow numerical gap between the official and expanded definitions of unemployment will begin to widen.
Although it appears from the LFS estimates that total employment has increased, this cannot be confirmed due to the small Provincial sample size. Within total employment, however, one important positive development is the rapid increase in the number of employed matriculants, pointing to increasing average educational attainment amongst the Province’s employed population.
Sectorally, the LFSs point to a substantial reduction in primary sector employment, almost completely accounted for by the decline in employment in agriculture, forestry & fishing, between 2000 and 2004. Employment in this sector was down 83 000 jobs to 152 000, equivalent to an average annual decline in employment of 10,3 per cent. This has important policy implications, as this sector was the fifth-largest employer in the Province in 2004, down from fourth in 2000. The dominance of this sector within Provincial employment means that a large proportion of the population is dependent on this sector and has been impacted negatively by employment contraction. This, in turn, has implications for rural-urban migration and, consequently, for service and housing delivery within urban areas in particular.
Broad unemployment has increased substantially. The number of unemployed males has increased by 96 000, while unemployment amongst those with Grade 9 to 11 education and amongst matriculants has increased by 116 000 and 59 000, respectively. However, younger members of the labour force experience the highest unemployment rates. Labour force members between the ages of 15 and 34 years are more likely to be unemployed than their older counterparts, even when controlling for education.
Western Cape Provincial Economic Review & Outlook 2006206
Thus, the unemployment rate of matriculants between 15 and 34 years of age is more than 2,5 times higher than that of individuals between 35 and 65 years of age with the same level of education.
The evidence is mounting that older people are tending to keep their jobs, while younger people are struggling to find employment. This has important implications for future economic growth, as long-term unemployment begins to erode the skills and knowledge that younger labour force members currently have but are unable to extend or even maintain through employment.
Growing employment is clearly a key priority going forward. There are perhaps three critical issues that emerge and that should be kept in mind during policy formulation. First, there are important spatial differences within the Western Cape and this is true even within the district municipalities. It is therefore essential that policy is not formulated in such a way that it is unable to cater for local conditions. These spatial differences also mean that the decline of specific sectors, such as agriculture, forestry & fishing, will impact differently on, and have differing consequences for, the residents of the various municipalities.
Second, the problem of youth unemployment is becoming increasingly dire, despite the fact that the educational profile of young people is superior to that of their older counterparts. This suggests a disjuncture between levels of education and skills levels, and poses serious challenges to the education sector.
Finally, the challenge of making a significant impact on unemployment levels over short periods of time has been shown to be immense, requiring rates of economic growth and levels of employment intensity significantly higher than those currently experienced. However, it is important to emphasise that the scenario exercise does not take account of recent announcements of economic stimuli packages under the national Asgisa initiative and the upcoming Provincial Growth and Development Strategy.
207Chapter 4 – Employment Dynamics
Glossary of terms
• ASSA demographic model The ASSA 2003 Aids and Demographic Model was released on 28 November 2004.
ASSA 2003 is the first Aids and Demographic model to take the government’s Comprehensive Plan for HIV and Aids into account at a provincial level. The model has been designed by SA demographers and actuaries based on detailed SA data. Using these data, the model projects the numbers of South Africans living with HIV, new infections, Aids deaths, Aids sickness and many more statistics into the future. The ASSA model was developed under the auspices of the Aids committee of the Actuarial Society of SA with financial support to researchers in CARE at the University of Cape Town and the MRC Burden of Disease Research Unit by the Secure the Future Project of Bristol-Myers Squibb and UNICEF.
See www.assa.org.za
• Cohort In statistics and demography, a cohort is a group of subjects – most often individuals
from a given population - defined by a condition on their date of birth. For example, SA women born in the year 1985 would form a cohort when studied from a point of view such as their health, mortality or education. A cohort study often tracks a cohort over extended periods of time and returns to the same sample groups decades later.
• Demography Demography is the study of human population dynamics. It encompasses the study
of the size, structure and distribution of populations, and how populations change over time due to births, deaths, migration and ageing. Demographic analysis can relate to whole societies or to groups defined by criteria such as education, nationality, religion and ethnicity.
• Discouraged workseekers Discouraged workseekers are those individuals who are unemployed but have given
up actively looking for work.
• Elasticity Elasticity is the concept in economics that measures the responsiveness of one variable
to another. The best measure of such responsiveness is the proportional or per cent change in the variables, which gives the most usable results for any type or range of data. Thus elasticity is the proportional change in one variable relative to the proportional change in another.
Western Cape Provincial Economic Review & Outlook 2006208
• Employment absorption rate The EAR is the ratio between the actual employment growth and the desired (or
‘target’) rate, and is expressed as a percentage. The closer the EAR is to 100, the better the actual relative to the desired employment performance.
• Labour force In economics, the labour force is the group of people who have a potential for
being employed. Normally, the labour force consists of everyone of working age (typically above a certain age, around 14-16) and below retirement (around 65) who are participating workers, that is people actively employed or seeking employment. People not counted include students, retired people, stay-at-home parents, people in prisons or similar institutions, as well as discouraged workers who simply do not want work.
• Labour force participation rate The LFPR is defined as the share of the working age population that is part of the
labour force. When individuals enter the labour force, they are either taken up into employment or they remain unemployed. Since there are two definitions of unemployment, there are two ‘labour forces’ and, correspondingly, two LFPRs can be calculated.
• Narrow and broad unemployment Two standard definitions of unemployment are used: narrow unemployment and
broad unemployment. The narrow definition of unemployment, used as the official definition in SA by
government and Stats SA, identifies Individuals as narrowly unemployed if they: (a) did not work during the seven days prior to the interview; (b) want to work and are available to start work within a week of the interview; and (c) have taken active steps to look for work or to start some form of self-employment
in the four weeks prior to the interview. (Stats SA Statistical Release P0210 2002: xv).
The expanded/broad definition of unemployment does not include criterion (c). Although the narrow definition of unemployment is the official definition, there is a
strong argument that in developing countries such as SA it is more appropriate to use the expanded definition of unemployment.
• Net in-migration Net in-migration as a share of population growth is calculated as the net number of
immigrants in a given year, divided by the change in the total population from the given year to the following year.
209Chapter 4 – Employment Dynamics
• Non-formal employment Non-formal employment is defined as total employment less formal sector
employment.
• Target employment growth rate The TGR measures how fast employment should have expanded over the period to
provide work for all net entrants to the labour market. The TGR is independent of the rate or level of unemployment in the base year, because it captures the growth rate required to provide employment to only new entrants. If actual employment growth reached the target rate, the overall rate of unemployment would decline. This is because, considering new labour market entrants as a group on their own, if employment grew at the target growth rate, thereby absorbing all new entrants into employment, their unemployment rate would be zero. The fact that, in reality, not all new jobs go to new entrants does not impact on this reduction in the overall unemployment rate.
• Unemployment rate The fraction of the labour force that cannot find work determines the unemployment
rate.
• Working age population The working age population is made up of individuals between 15 and 64 years of
age. Individuals in this group can choose to be part of the labour force or not. As a result, the size of the working age population will impact on the size of the labour force.
Related Documents