P OLICY R ESEARCH WORKING P APER 4433 Mexican Employment Dynamics: Evidence from Matched Firm-Worker Data David S. Kaplan Gabriel Martínez González Raymond Robertson The World Bank Financial Private Sector Development Department Enterprise Analysis Unit December 2007 WPS4433 Public Disclosure Authorized Public Disclosure Authorized Public Disclosure Authorized Public Disclosure Authorized

Welcome message from author
This document is posted to help you gain knowledge. Please leave a comment to let me know what you think about it! Share it to your friends and learn new things together.
Transcript
Policy ReseaRch WoRking PaPeR 4433
Mexican Employment Dynamics:
Evidence from Matched Firm-Worker Data
David S. KaplanGabriel Martínez González
Raymond Robertson
The World BankFinancial Private Sector Development DepartmentEnterprise Analysis UnitDecember 2007
WPS4433P
ublic
Dis
clos
ure
Aut
horiz
edP
ublic
Dis
clos
ure
Aut
horiz
edP
ublic
Dis
clos
ure
Aut
horiz
edP
ublic
Dis
clos
ure
Aut
horiz
ed
Produced by the Research Support Team
Abstract
The Policy Research Working Paper Series disseminates the findings of work in progress to encourage the exchange of ideas about development issues. An objective of the series is to get the findings out quickly, even if the presentations are less than fully polished. The papers carry the names of the authors and should be cited accordingly. The findings, interpretations, and conclusions expressed in this paper are entirely those of the authors. They do not necessarily represent the views of the International Bank for Reconstruction and Development/World Bank and its affiliated organizations, or those of the Executive Directors of the World Bank or the governments they represent.
Policy ReseaRch WoRking PaPeR 4433
Using a census of all workers in private establishments in the formal sector in Mexico to track workers and establishments over time, this paper presents the first Mexican worker and job flow statistics. The data allow for comparing these flows across time, space, and worker characteristics. Although many patterns are similar to those documented in developing countries, the analysis
This paper—a product of the Enterprise Analysis Unit, Financial Private Sector Development Department—is part of a larger effort in the Financial Private Sector Development VPU. Policy Research Working Papers are also posted on the Web at http://econ.worldbank.org. The author may be contacted at [email protected].
uncovers patterns that have potentially important policy implications. The authors compare the results to the literature, illustrate how the statistics change during times of reform and crisis, and present novel findings that contribute to the broader literature on worker reallocations.
Mexican Employment Dynamics: Evidence from Matched Firm-Worker Data
David S. Kaplan* World Bank
and Instituto Tecnológico Autónomo de México (ITAM)
E-mail: [email protected]
Gabriel Martínez González General Secretariat
Interamerican Social Security Conference E-mail: [email protected]
Raymond Robertson
Department of Economics Macalester College
E-mail: [email protected]
Acknowledgements
This paper had been distributed under the title “Worker and Job Flows in Mexico. We gratefully acknowledge financial support from the Inter-American Development Bank for the project “Market Institutions, Labor Market Dynamics, Growth and Productivity: An Analysis of Latin America and the Caribbean.” We also acknowledge financial support from the Asociación Mexicana de Cultura.
* Corresponding author.

1. Introduction
The purpose of this paper is to examine Mexican employment dynamics at the micro
level. An important and growing body of literature suggests employment expansions and
contractions at the establishment level ("job flows") hide a considerable amount of employee-
level turnover ("worker flows").1 Prior to the IDB project “Market Institutions, Labor Market
Dynamics, Growth and Productivity: An Analysis of Latin America and the Caribbean,” of
which this paper is a part, nearly all2 of the literature on worker flows or job flows had focused
on developed countries. Understanding these gross worker and job flows, however, is especially
critical in developing countries that seem to consistently experience larger shocks or are
experiencing substantial reform.
For our analysis, we use established techniques on a novel data set. We match workers
and firms over time using Mexican social security records. This matching capability, which is
rare, allows us to calculate within-establishment employee turnover as well as labor reallocations
across establishments that differ across time period, firm size, geographic location, and worker
characteristics (gender and age).
Our analysis produces many new results. First, although Mexico differs from the United
States in several important ways,3 Mexico's basic patterns are similar to the patterns in the U.S.
and in other developed countries. Perhaps most importantly, we show that aggregate statistics
hide a great deal of labor market churning. Constant creation and destruction implies that job
destruction is a consistent characteristic of Mexican labor markets (even in economic
expansions).
Although many Mexican patterns are similar to those in developed countries, we find that
worker flows - but not job flows - increased during the late 1980s, which was a period of
significant policy reform. Small firms suffered disproportionate employment declines during the
December 1994 peso crisis, during which the credit market essentially shut down. Worker and
job flows increased between 1997 and 2001, as the economy recovered from the peso crisis and
additional reforms were implemented. Unlike during the peso crisis, the data suggest that the
2001 recession hit large manufacturing establishments along the U.S. border especially hard.
We also find differences between workers with different demographic characteristics.
Workers between the ages of 60 and 65 are hired at rates that are only slightly lower than those
for younger workers. Although these older workers separate from their firms at substantially
higher rates, many of these people attempt to find new employment. Furthermore, while worker
and job flow statistics are quite similar for men and women, establishments are born mainly with
men. Establishments quickly move to hire women in their early years.
Our results reveal a wide variety of opportunities for policy makers that go beyond
established reasons why understanding worker and job flows are important.4 Continuous
turnover imposes substantial risk on workers and may justify an expansion of unemployment
insurance. Adjustment may be less costly than in developed countries, but adjustment costs are
still significant for workers and firms.5 Changes in these flows may be linked to policy reforms,
which would provide a way to evaluate the impacts of these reforms. Secondly, understanding
these flows can be used to enhance the efficiency of policies designed to aid dislocated workers.
Mexico's training program PROBECAT (Programa de Becas de Capacitactión para
Trabajadores), for example, uses a nonlinear selection mechanism to determine eligibility [see
Revenga, Riboud, and Tan (1994) for more details], which could be tailored to reflect
2
demographic and geographic groups most in need of help to find employment.
Third, understanding worker and job flows can help policymakers determine the kinds of
policies that might best foster employment growth. Unlike in developed countries, younger
Mexican firms in all periods tend to have lower percentage employment growth than older firms.
To the extent that smaller firms and younger firms are more susceptible to poorly functioning
credit markets,6 these results provide microeconomic evidence consistent with Tornell,
Westerman, and Martínez (2004) who suggest that Mexico’s relatively slow growth is related to
a lack of credit. The finding that women participate less in firm births may be an indication that
women have less access to credit than men. Since a large majority of workers are employed in
small firms, policies that ease credit during credit-driven recessions may help smooth job
creation and destruction along the business cycle.
The format of the rest of the paper is as follows. In the next section, we describe how we
created our worker- and job-flows data set from social-security records in Mexico. In section 3,
we describe the methodology we use to calculate worker- and job-flows statistics. In section 4,
we present the statistics. We include results separated by establishment age, establishment size,
gender, and employee age. In section 5 we add some final concluding remarks.
2. Creation of a Job- and Worker-Flows Data Set for Mexico
The raw data come from the Mexican Social Security Institute (Instituto Mexicano del
Seguro Social, or IMSS), which is the agency that manages the social-security accounts for all
private-sector tax-registered workers in Mexico. Since filing with the IMSS has been used as a
criterion for formal sector participation,7 the data can be thought of as a census of formal-sector
establishments in the private sector. The IMSS uses its own 4-digit industry classification system
3
consisting of 271 separate industries that span all economic activity in the formal sector.
Unfortunately, if an employee leaves the formal (tax-registered) sector, we are unable to observe
if the employee becomes unemployed or finds a job in the informal sector.
Individual records in the raw data contain an identifying number for the person, an
identifying code for the establishment, the daily wage, the date when the information of this
record became valid, and the date when the information stopped being valid. If the worker leaves
the establishment, the old record is closed. If the worker’s salary changes, the old record is
closed and a new record is opened with the updated wage information but with the same
identifier for the establishment. Importantly, we have both an establishment identifier and a
person identifier that are consistently coded over time. Our first step was to convert this
information into annual information. We chose December 31 as the date for which we would
extract the relevant information each year from 1985 to 2001.8
For each December 31 of the 17 years for which we have data, we selected the records
that were applicable to the particular date. If a person had two apparently applicable records from
the same establishment, we chose the record with the later start date. If a person had two
applicable records from different establishments, we assumed the person really was working in
both establishments. We only selected workers with strictly positive wages. This restriction
mainly excludes students from the database, many of whom are insured by the IMSS although
they are not really employees.
The files mentioned above include wage and employment histories of all workers
registered with the IMSS. The files also contain the age and gender for nearly all workers. We
also merged in industry and location information of the establishment using separate files
provided by the IMSS. The match rate was nearly 100%.
4
Since we are using a new data set, we believe it is useful to look at some simple statistics
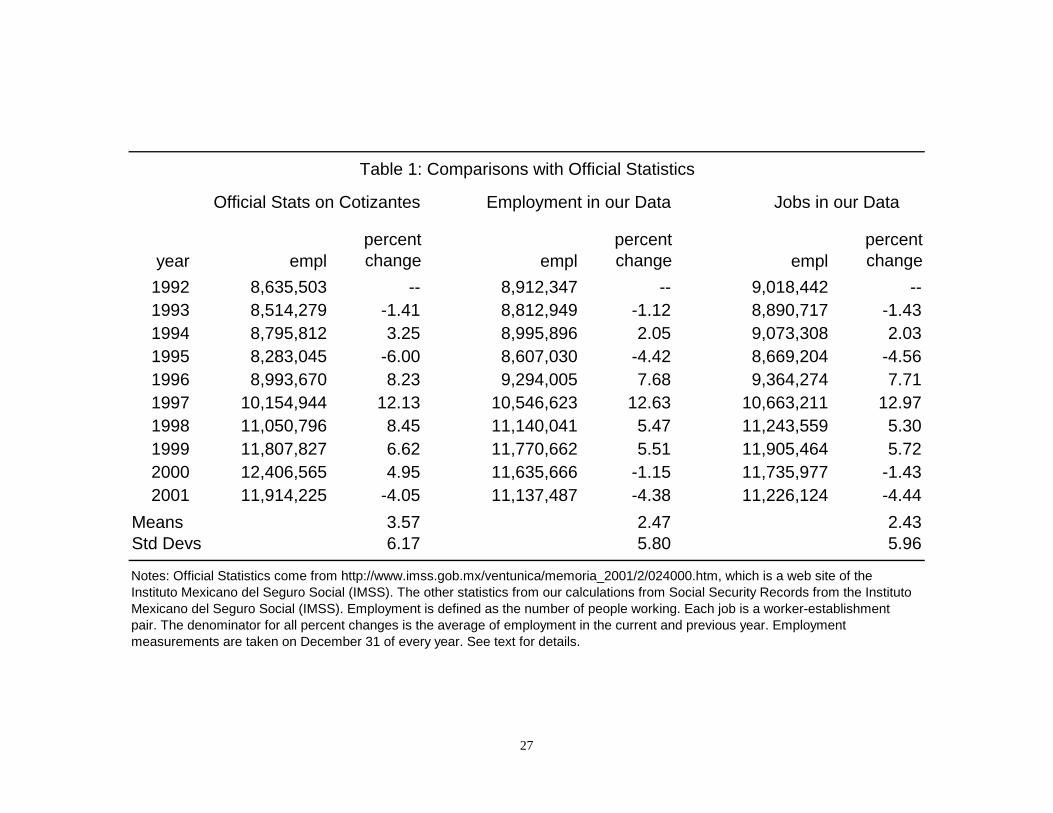
and compare them to official statistics of the IMSS. We do this comparison in table 1, although it
should be noted that we made no attempt to replicate the precise methodology used in the
generation of these official statistics. In fact, we do not know the precise methodology used by
the IMSS although we are using the same raw data.
The first employment figures in table 1 are official IMSS statistics on cotizantes on
December 31 of each year. 9 Cotizantes are employees who pay social-security taxes or for
whom social-security taxes are paid. Of the official statistics we have found, we suspect that
these statistics use the definition that most closely matches our definition of all individuals who
receive positive salaries. Unfortunately, however, we could not find statistics on cotizantes
before 1992.
(Table 1 here)
The second set of employment observations presents our calculations of employment on
December 31 of each year. The figures match up fairly well, although the net-growth percentages
in our data tend to be slightly smaller than in the official statistics. The third set of statistics gives
our counts of “jobs” which will correspond to our worker- and job-flows statistics. The
difference between the statistics on jobs and employment is that one employee may have more
than one job.
Our data represent all sectors of the Mexican economy, but, as an additional check, we
also compared our 1993 average employment in manufacturing with the 1993 average total
employment in the 1993 Mexican Industrial Census. One would expect the majority of
employees in manufacturing to be formally registered, implying that manufacturing employment
registered with the IMSS should be similar to manufacturing employment recorded in a
5
manufacturing census. Our 1993 manufacturing employment is 2,836,277 and the 1993 Census
manufacturing employment is 3,246,039, suggesting that our data cover about 87.4% of total
manufacturing employment. Based on these comparisons, we believe that our data are reliable.
3. Methodology
We now turn to our methodology for studying job and worker flows. To facilitate
comparison with the developed countries that dominate the existing literature, we use established
definitions of both job flows and worker flows (e.g. Davis and Haltiwanger 1992). We begin
with the methodology for our worker-flows statistics. When an establishment hires a new
employee, we refer to this event as an accession. For a given year, we define the accession
percentage according to the following formula
⎟⎟⎟
⎠
⎞
⎜⎜⎜
⎝
⎛
+=
∑∑∑
−j
tjj
tj
jtj
t emplempl
accaccper
1,,
,
*200
where is the number of employees in establishment tjacc , j in year t who were not working in
establishment j in year , is the number of employees of establishment 1−t tjempl , j in year ,
and is the number of employees of establishment
t
1, −tjempl j in year 1−t . Similarly we define
the separation percentage as
⎟⎟⎟
⎠
⎞
⎜⎜⎜
⎝
⎛
+=
∑∑∑
−j
tjj
tj
jtj
t emplempl
sepsepper
1,,
,
*200 ,
where is the number of employees in establishment tjsep , j in year 1−t who were not working
in establishment j in year t . It is now natural to define the net-growth percentage in
6
employment, which is simply
ttt sepperaccpernetper −= .
Our two statistics on worker flows, and give us information of
reallocations of people within and across establishments. As we mentioned in the introduction,
however, it is also common to examine reallocations of jobs across establishments.
taccper tsepper
10 Job flows
statistics give us information about establishment-level changes in employment without taking
into consideration the identities of the employees. For example, consider an establishment in
which five employees have left since the last year and were replaced by five new employees. We
would say that this establishment experienced worker flows in the form of five accessions and
five separations. Since total employment has not changed, however, we would say that the
establishment neither created nor destroyed jobs.
More precisely, define net employment growth in establishment j and period t as
1,,, −−= tjtjtj emplemplnet .
Now denote job creation in establishment j and period as t
( )tjtj netpos ,, ,0max=
and denote job destruction in establishment j and period t as
( )tjtj netneg ,, ,0max −= .
We can now define the job-creation percentage and job-destruction percentage in period t as
⎟⎟⎟
⎠
⎞
⎜⎜⎜
⎝
⎛
+=
∑∑∑
−j
tjj
tj
jtj
t emplempl
posposper
1,,
,
*200 and ⎟⎟⎟
⎠
⎞
⎜⎜⎜
⎝
⎛
+=
∑∑∑
−j
tjj
tj
jtj
t emplempl
negnegper
1,,
,
*200
respectively.
7
It should be clear that statistics on job flows and statistics on worker flows are related. If
an establishment increases its total employment by one, at least one current employee must be
new. If an establishment reduces its total employment by one, at least one employee must have
left. In this sense, statistics of job flows give us a lower bound on our worker-flows statistics.
Along these lines, we will now explain our decomposition of worker flows into two
components: the component explained by job flows and the “excess” component. First, we will
define the sum of worker flows
ttt sepperaccpersumwf +=
as our summary measure of worker flows. Similarly, we will define our summary measure of job
flows as
ttt negperpospersumjf += .
As we mentioned earlier, the sum of job flows ( ) can be thought of as a component of
worker flows ( ). Our definition of “excess” worker flows will simply be
tsumjf
tsumwf
ttt sumjfsumwfexcwf −= .
In words, excess worker flows are the worker flows not accounted for by job flows.
One common practice in the literature on job flows is to separate jobs created by births
(establishments that had zero employment in the previous year) from jobs created by expansions
(establishments that had positive employment in the previous year and expanded). Similarly, it is
common to distinguish jobs destroyed by deaths (establishments whose employment fell to zero)
from jobs destroyed by contractions (establishments that reduced employment but continue to
employ at least one employee). Our data are particularly well suited for studying births and
deaths because we observe all establishments, no matter how small they are. We do not, for
8

example, only observe establishments only when they cross some employment-size threshold.
It is also common to decompose the sum of job creation and destruction ( ) into an
aggregate component, an industry component, and an idiosyncratic component. In our data,
however, we find that the industry-level changes in employment at any level of aggregation
explain a small fraction of gross employment flows. Therefore, we do not present these results
here. Instead, they are available from the authors upon request.
tsumjf
4. Job and Worker Flow Results
4.1 A Brief Overview of Macroeconomic Conditions
Since our data cover a period of changing policy, crisis, and recovery, a brief overview of
Mexican macroeconomic conditions may help the reader put some of the subsequent statistics
into context. We summarize Mexican macroeconomic conditions with four key variables: the
unemployment rate (the open unemployment rate calculated by INEGI), inflation (measured as
the annual average of year-on-year changes in the consumer price index), real GDP growth
(calculated by INEGI using 1993 as the base year), and the nominal exchange rate (expressed in
pesos per dollar). Figure 1 contains the movements of these four variables over the 1987-2002
period.
While these four variables describe slightly different aspects of the Mexican economy,
they clearly tell similar stories. The most immediately obvious is the severe recession that
occurred with the December 1994 peso crisis. Prior to the crisis, growth was relatively robust
and inflation, reaching well over 100 per cent in 1988, was coming under control. With the
contraction of GDP came a sharp devaluation of the peso (shown as an increase in the
peso/dollar exchange rate), a rise in unemployment, and an increase in inflation. The economy
9
recovered until the turn of the century, when another economic slowdown becomes apparent.
4.2 Magnitude of Job and Worker Flows in Mexico
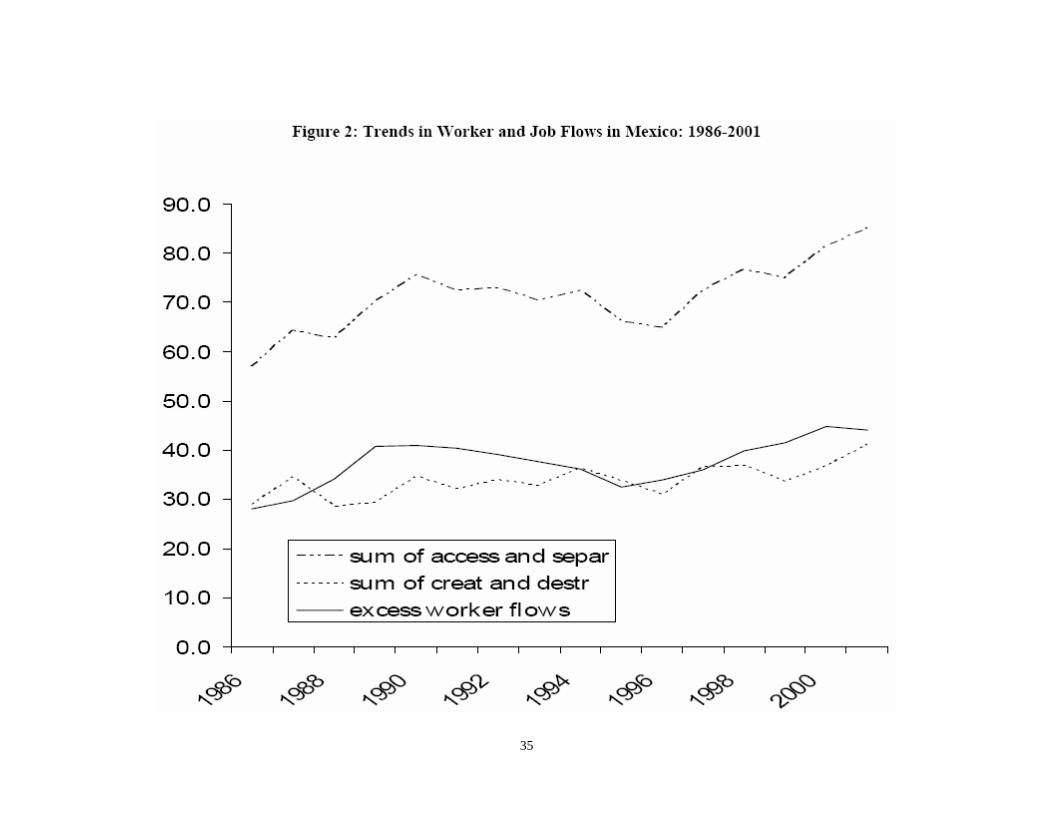
Table 2 presents all of the statistics on worker flows and job flows discussed in the
methodology section for each year 1986-2001. Table 2 is the central table of our paper and we
will discuss its implications quite thoroughly. Table 2 contains twelve columns that are grouped
and numbered. Several of the columns are algebraically related. Column 1, net employment
growth, is equal to the sum of columns 2 and 3. Column 1 is the difference between jobs created
(column 7) and jobs destroyed (column 10). Furthermore, the sum of accessions and separations
(column 4) can be decomposed as the sum of job creation and destruction (column 11) and
excess worker flows (column 12). To further illustrate the main trends, figure 2 graphs columns
4, 11, and 12.
(Table 2 here)
Job flows in Mexico on average appear to be not very different from job flows in the
U.S., although both job creation and job destruction are somewhat higher in Mexico. For
example, using data from West Virginia, Spletzer (2000), finds an annual job-creation
percentage of 15.8%, which is lower than the 19.0% we observe on average in our data (column
7). Spletzer reports an annual job-destruction percentage of 14.4%, which is slightly lower than
our figure of 14.8%.
Davis and Haltiwanger (1992) cover the period 1972-1986. If we compare their results to
our Mexican results, we again find that both job creation and job destruction are higher in
Mexico. If we restrict the sample to manufacturing establishments, we get an average job-
creation percentage of 16.4%, substantially higher than the figure of 9.2% from Davis and
10
Haltiwanger. The average figure for job destruction in Mexico is 12.8%, marginally higher than
the 11.3% from Davis and Haltiwanger. Tables analogous to table 2 calculated separately for the
manufacturing and non-manufacturing sectors are available upon request.
As in Hamermesh et al. (1996) and Abowd et al. (1999), we find that a substantial share
of worker flows cannot be accounted for by job flows. As described in the previous section, we
can summarize worker flows by using the sum of the accession percentage and the separation
percentage. The average of this statistic in our data is 71.3% (column 4). We can similarly
summarize job flows by using the sum of the percent of jobs created and the percent of jobs
destroyed. The average of this statistic in our data is 33.8% (column 11). Job flows therefore
account for slightly less than half of total worker flows.
4.3 Changes over Time: Recession, Recovery, and Reform
The period we study encompasses several important reforms, policies, and economic
events in Mexico. Mexico joined the General Agreement on Tariffs and Trade on January 1,
1986 and implemented deep tariff cuts. A peso devaluation in 1987 was followed by an
economic "Solidarity Pact" that effectively reduced inflation from over 100% per year. Foreign
investment laws were liberalized in 1988, 1989, and 1990 and the new laws induced a rapid
inflow of foreign capital. In 1990, Mexico announced it was pursuing a free trade agreement
with the United States (with Canada to join the negotiations soon thereafter). The North
American Free Trade Agreement was signed in 1992 and went into effect in January 1994. The
peso crashed in December 1994 and was followed by a very deep, but relatively brief, recession
that was followed by a four-year recovery. We consider our results in the context of these
changes.
It is interesting to note that the pace of job flows and worker flows has been increasing
11
over time, although not in a linear fashion. From roughly 1986-1990, the pace of worker flows
was accelerating. In fact, both the accession percentage and the separation percentage increased
from 1988 to 1989, and again from 1989 to 1990. The pace of job flows was fairly flat over this
period, which highlights the importance of observing worker flows, which are a more complete
measure of reallocations than job flows.11 The timing of these accelerations in worker flows is
consistent with the hypothesis that inflows of foreign capital and the implementation of GATT
led to an increase in worker turnover.
The economic crisis of 1995 looks like a fairly calm period in terms of worker flows.
Although the net growth was –4.6% in 1995 compared with 2.0% in 1994, the separation
percentage barely changed. Almost all of the change in the net-growth percentage came from a
reduction in the accession percentage. Once again the results using job flows are not as stark as
the results using worker flows, although the job-creation percentage did fall more than the job
destruction rose from 1994 to 1995.
The period of 1997-2001 is the most active period in terms of job flows and worker
flows. One way to see this is by a series of comparisons. When one compares two years with
similar net percent changes in employment, one finds that both the accession rate and the
separation rate are higher in the more recent year. One finds similar results for the percent of jobs
created and the percent of jobs destroyed when making these comparisons.
To illustrate this point, note that the net percent change in employment of –4.4% in 2001
is similar to the net percent change in employment of –4.6% in 1995. The accession percentage
and the separation percentage, however, were 9.6 and 9.5 percentage points higher respectively
in 2001 compared with 1995. The analogous figures for the percent of jobs created and destroyed
are 3.7 and 3.6 percentage points respectively.
12
One might think that using the year 1995 is a strange choice due to the economic crisis,
so we should do at least one more comparison. The net percent change in employment of –1.4%
in 2000 is almost identical to the net percent change in employment in 1993. Note, however, that
in 2000, both the accession percentage and the separation percentage were both 5.5 percentage
points higher than in 1993. The analogous figure for the percent of jobs created and destroyed is
1.9 percentage points. One obtains similar results comparing either the year 1998 or the year
1999 to the year 1991, and by comparing the year 1997 to the year 1987.
We also note that the accession percentage, the separation percentage, the percent of jobs
created, and the percent of jobs destroyed were all higher in 1997 compared to the year 1996. We
observe this same increase in all of our measures of reallocation from the year 2000 to 2001.
Finally we note that the sum of the accession percentage and the separation percentage attained
its two highest values in the last two years of our data (2000 and 2001). The same is true for the
sum of the percent of jobs created and the percent of jobs destroyed. It seems quite clear that
labor reallocations have been accelerating in recent years.
Why have labor reallocations been so high in recent years? There are at least two possible
explanations. The first is that NAFTA has a bigger and bigger impact each year and that the
economy is adjusting to the more open trade environment. Another hypothesis worth considering
is that the 1997 pension reform (reform of the IMSS) reduced labor-market rigidities. The 1997
reform reduced the quotas that firms and workers had to pay to become registered with the
IMSS. This change was designed to encourage the formalization of the Mexican workforce by
lowering the costs of formalization. While a formal analysis of these effects is beyond the scope
of this paper, it is worth noting that the acceleration in worker flows apparently began in 1997,
just as the reform was implemented.
13
The result that both worker flows and job flows have been accelerating in recent years is
complemented by other work as well. Castellanos, García-Verdú, and Kaplan (2004) show that
the percent of workers with nominal-wage freezes has been declining dramatically in recent
years, while both nominal-wage increases and nominal-wage decreases have been increasing.
Budar-Mejía and García-Verdú (2003) estimate the probabilities that a worker moves from the
formal sector to the informal sector and vice versa. They find that both probabilities have been
increasing over time, that is, that transitions from the formal sector to the informal sector are
becoming more common as are transitions from the informal sector to the formal sector. The
results from the two papers above, combined with the results on worker flows and job flows in
the present paper, paint a clear picture. The labor market in Mexico has become more dynamic in
recent years.
Table 2 also presents the two decompositions of job creation and destruction mentioned
in the methodology section. Job creation is separated into the component due to establishment
births and the component due to establishment expansions. Analogously, job destruction is
separated into the component due to establishment deaths and the component due to
establishment contractions.
4.4 Flows by Age and Size of the Firm
Before turning to some of the more novel results of our paper, we first show that some of
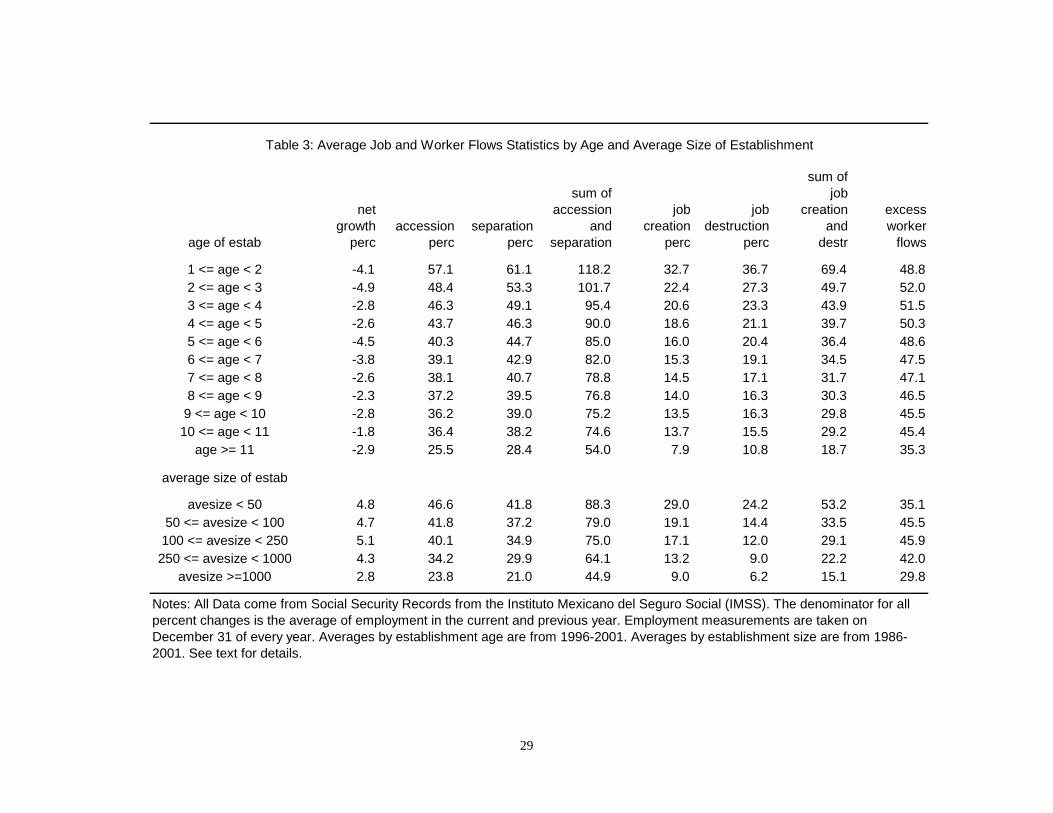
the other stylized facts of job and worker flows also appear to be true in Mexico. Table 3
presents averages of worker- and job-flows statistics for the period 1996-2001 for several
establishment-age categories beginning with establishments that are at least one year old but less
than two years old. Each successive age category is one year older than the previous category,
until we reach the maximum category of 11 years old or more. Since our data begin in 1985 we
14
have to wait until the year 1996 before we can observe whether an establishment first appeared
in the data 11 or more years earlier.12
(Table 3 here)
Table 3 also shows many of the results one would expect. The accession percentage,
separation percentage, job-creation percentage, and the job-destruction percentage all decrease
with establishment age. Excess worker flows show this same general trend with the exception of
the youngest age category. Table 3, however, does yield two results that may be surprising. First,
net employment growth for firms 1-11 years old is negative. The overall positive growth (4.3%)
comes from births (firms 0 years old).13 We also observe that net-growth percentages are lowest
for the youngest establishments, which contrasts with the results in Davis and Haltiwanger
(1992). This result may point to the importance of credit-market failures that may impede
younger firms from expanding.
Table 3 also shows the average of worker- and job-flows statistics for the period 1986-
2001 separated by size category of the establishment. We define five categories based on the
average of current- and previous-year employment of the establishment. The categories are: less
than 50 employees, at least 50 employees but less than 100, at least 100 employees but less than
250, at least 250 employees but less than 1000, and at least 1000 employees. We see here that the
accession percentage, separation percentage, job-creation percentage, and job-destruction
percentage all decline with establishment size. That is, small establishments exhibit higher rates
of both job and worker flows. This is consistent with the stylized facts of the literature.
We now turn to some of the more novel results of our study. Perhaps the most important
economic event in Mexico over the period studied was the economic crisis of 1995. Indeed, the
net-growth percentage of –4.6% in 1995 is the lowest net-growth percentage we observe. Earlier
15
in the paper we established that gross flows indicate a great deal of churning in the labor market.
In terms of identifying the characteristics of firms hurt most by the crisis, which policymakers
are rightly concerned about, we focus the next stage of the analysis on net flows.
Since problems in the credit markets were an important component of the economic
crisis, smaller establishments may have been particularly hard hit by the crisis. The crisis also
had a significant trade component, and, since large and small firms may differ in their propensity
to export, different export responses may also generate different results across size categories.
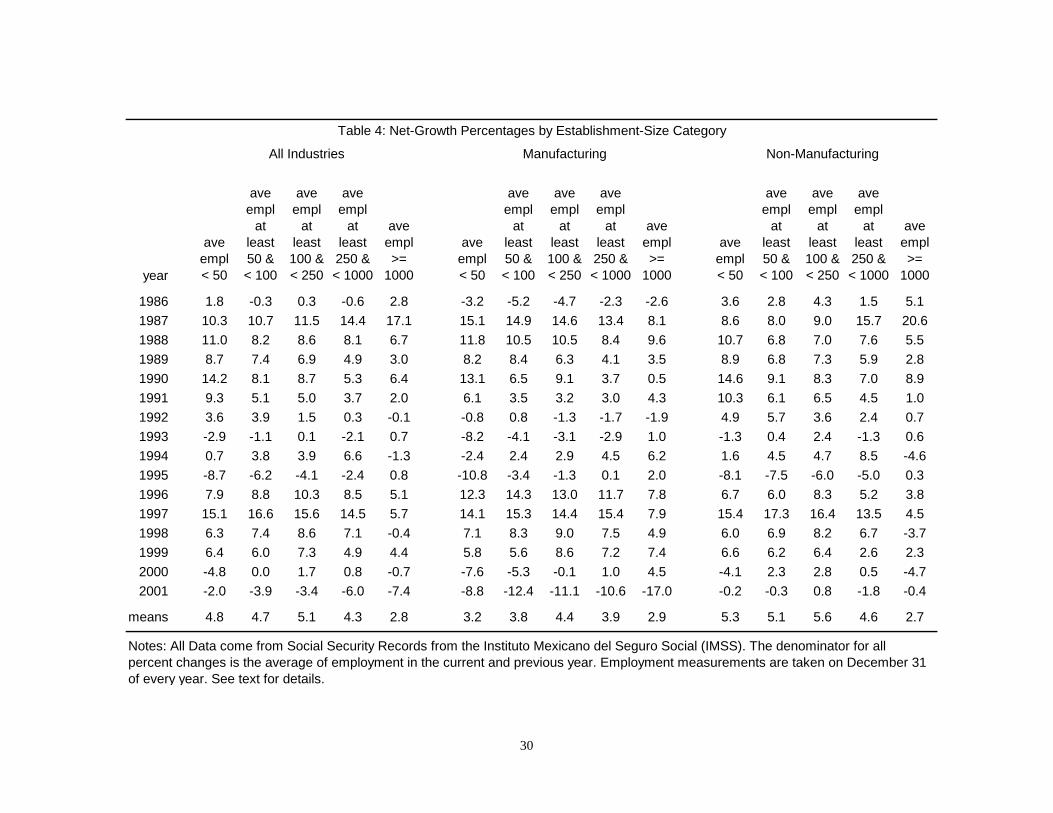
Table 4 shows net-growth percentages from 1986-2001 separated by the same establishment-size
categories used in table 3. These results are presented for the formal sector overall and separately
for the manufacturing and non-manufacturing sectors. Table 4 indeed shows that small
establishments suffered the most during the economic crisis. Over the whole period, we observe
that establishments with average employment greater than 1000 grew at a slower rate than did
establishments in the other size categories. In 1995, however, the pattern was quite different.
(Table 4 here)
Table 4 shows that net-growth percentages rose monotonically with establishment size in
1995. For example, the net-growth percentage in establishments with average employment of at
least 1000 employees was 0.8%. The same figure for establishments with less than 50 employees
is –8.7%. Beginning in 1996, as the economy began to recover its losses, smaller establishments
outperformed their larger counterparts. This general pattern was true both inside and outside of
manufacturing.
We also see from table 4, however, that 2001 was a terrible year for large manufacturing
establishments, but not for large establishments outside of manufacturing. Noting that large
manufacturing establishments are likely to be exporters,14 we believe the likely cause for these
16
employment declines to be a weakening export market caused by a weakening U.S. economy and
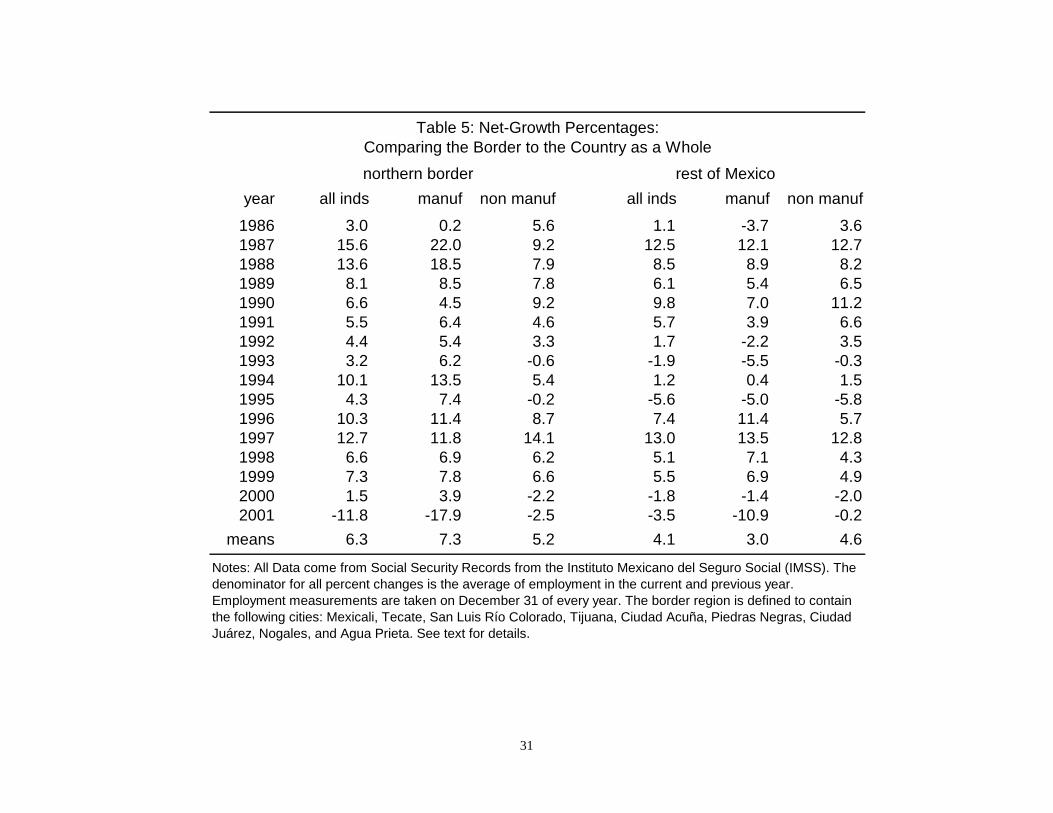
by increased competition from other countries. To follow up on this point, table 5 presents net-
growth percentages separately for establishments near the U.S. border and for establishments in
the rest of the country.15 We present net-growth percentages for all industries combined as well
as separately for manufacturing and non-manufacturing.
(Table 5 here)
Recall that the North American Free Trade Agreement came into effect in 1994. From
1994-2000, employment grew faster in percentage terms in the border region than in the rest of
Mexico, with the small exception of 1997 when the difference was minimal. In 2001, however,
the region that borders the U.S. experienced a huge decline in employment of 11.8%. This
represents the only employment contraction in the border region during the period we study. This
fact lends even further weight to the argument that the results from earlier tables for the year
2001 are picking up Mexico’s recent problems for establishments that export to the U.S.
Let us now focus on manufacturing versus non-manufacturing. Although it is true that the
non-manufacturing sector experienced larger net percent employment declines on the border
compared with the rest of the country (-2.5% compared with –0.2%), the big difference between
the border and the rest of Mexico occurred in manufacturing. The manufacturing sector
contracted a staggering 17.9% at the border compared to a contraction of 10.9% in the rest of the
country. Once again we find that in 2001 those establishments that are most likely to export, in
this case those located at the border with the U.S., experienced the largest percent employment
declines.
Summarizing the evidence for the year 2001, a fairly convincing case can be made that a
large fraction of the reduction in employment was due to the weakening of U.S. manufacturing.
17
Although the manufacturing sector in Mexico apparently had benefited from NAFTA for many
years, things changed dramatically in the year 2001. This experience lends credence to the
argument that Mexico has exposed itself to more economic volatility by linking its fortunes so
tightly to the U.S. economy.
4.5 Gender Differences
One attractive feature of our data is that we observe the gender of the vast majority of
workers in our data. This allows us to calculate the job- and worker-flows statistics presented in
table 2 separately for men and women. One might wonder to what extent women might tend to
hold less stable jobs, which might translate into higher accession rates and separation rates.
Perhaps surprisingly, statistics on worker flows and job flows are quite similar for men and
women. These tables are available upon request.
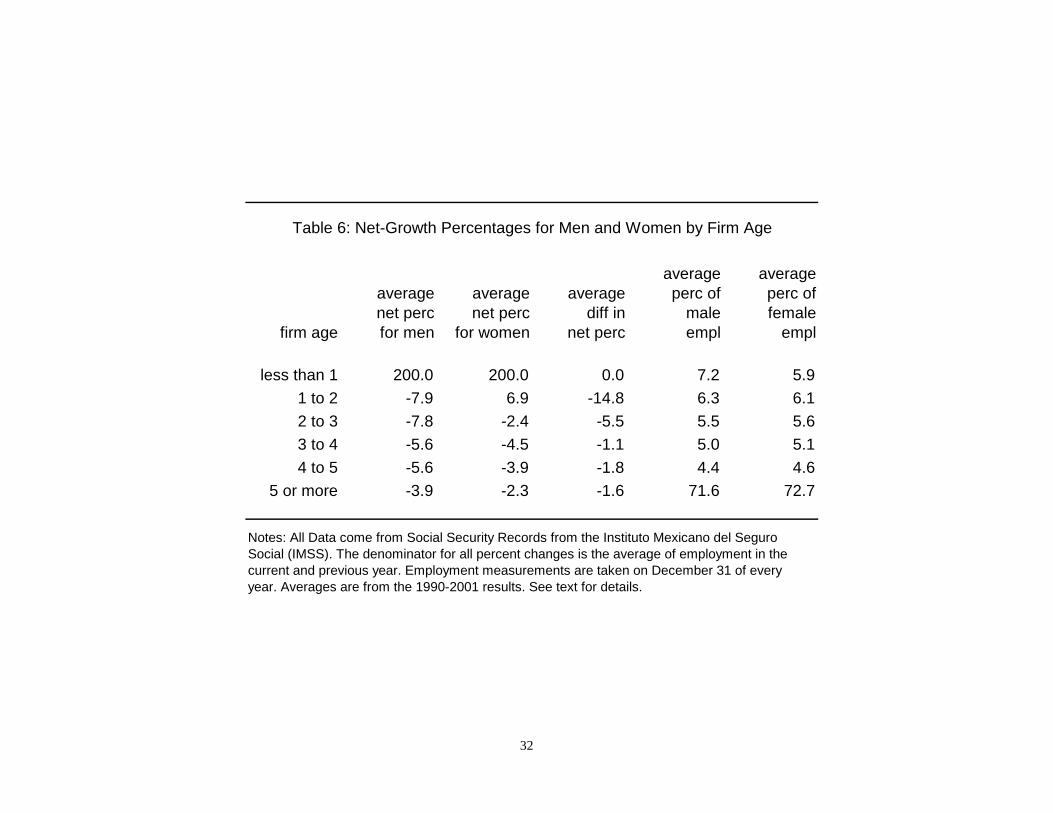
When we interact gender with establishment age, however, we see an interesting result on
the life cycle of establishments. In table 6, we divide establishments into six establishment-age
categories. The difference between the establishment-age categories in table 6 and those in table
4 is that the oldest age category aggregates all establishments that are five years old or older. We
present average net-growth percentages separately for men and women along with the average
percentage of male and female employment in each establishment-age category. The averages
are taken from the period 1990-2001.
(Table 6 here)
We find the percent of men working in the youngest establishments (as a percentage of
the male labor force) is larger than the analogous statistic for women. That is, men are more
likely to work in establishments that are less than one year old (new establishments).
Establishments one to two years old, however, show an average net-growth percentage for men
18
of –7.9 percent while the analogous statistic for women is 6.9%. In other words, establishments
are born mainly with men, but then quickly move to hire women in their early years. These
differences disappear for the older establishments. This result raises the possibility that
differences in risk aversion may explain participation decisions in young establishments.16
Another explanation is that when new establishments start up, they mainly employ managers,
who tend to be disproportionately male. Then as things get up and running, they expand their
blue collar workforce, which has a larger proportion of females.17
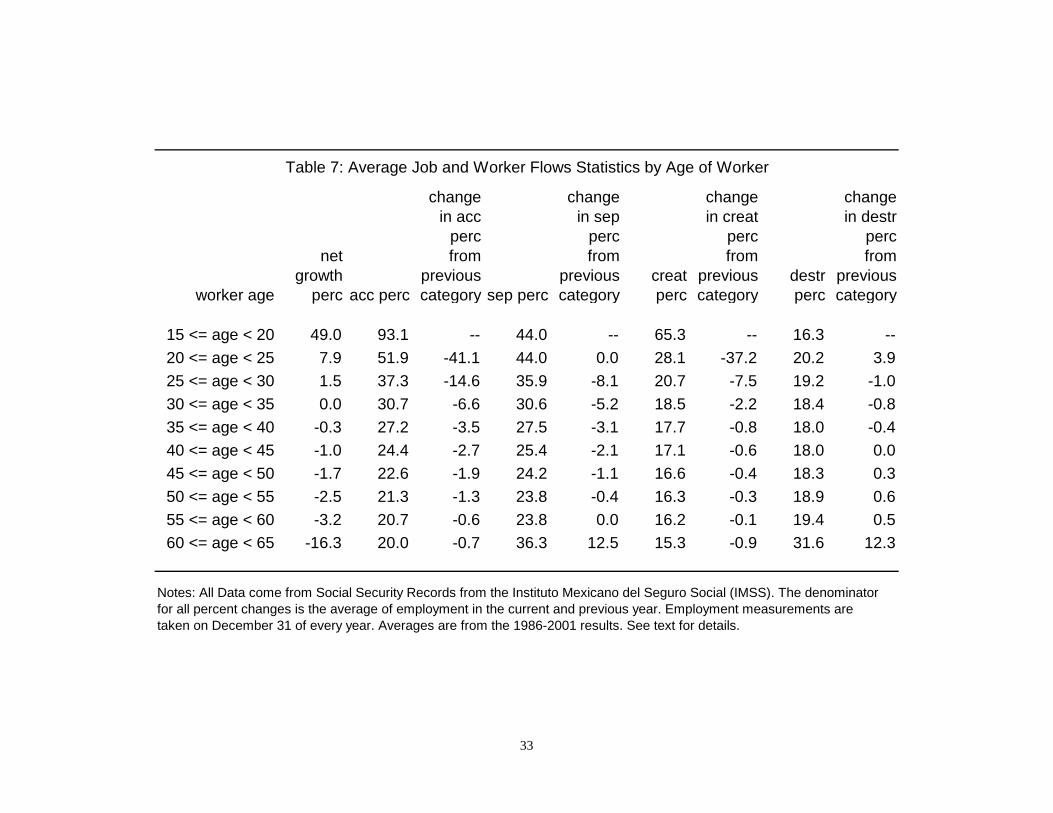
Another attractive feature of our data is that we observe the age of the workers. Table 7,
for example, shows averages of job and worker-flows statistics separately for several age-of-
worker categories over the period 1986-2001. The first category is at least 15 years old but less
than 20 years old. We use categories of five-year increments until the oldest category of at least
60 years old but less than 65 years old.18 Net-growth percentages decline as the age of the
workers increases.
(Table 7 here)
At the extreme ends of the table we see some extreme results. For example, net
employment growth for workers 15-20 years old is 49.0% while net growth is 7.9% for workers
20-25 years old. To what is this difference due? The accession percentage for the younger group
is 41.1 percentage points higher while the separation percentage is identical. That is, all of the
difference is due to differences in accession percentages, which is probably explained by the
younger workers entering the workforce. Turning to job creation and destruction, we see that the
job-creation percentage for the younger group is 37.2 percentage points higher. The job-
destruction percentage for the younger group is only 3.9 percentage points lower.
As workers approach retirement, we again see dramatic results. The net-growth
19
percentage for workers 50-55 years old is –3.2% while net growth is –16.3% for workers 55-60
years old. The difference in accession percentages is minimal; the younger group has an
accession percentage that is 0.7 percentage points higher. The difference in separation
percentages, however, is dramatic. The separation percentage for workers 55-60 years old is
23.8% while the separation percentage for workers 60-65 years old is 36.3%. That is, almost all
of the difference between these two groups comes from the separation percentage, which is
probably explained by workers in the older group entering retirement.
As we mentioned in the introduction, these results imply that people in the 60-65 years of
age category are being hired at what might be considered a surprisingly high rate. Given the
apparently high demand for these people to find new employment, and given the demographic
trends that indicate that the population is aging, programs aimed at aiding dislocated employees
like PROBECAT might consider targeting this group for additional support.
Turning to the age groups between 20 and 55 years old, the pattern is clear. As we move
from a younger age category to an older one, both the accession percentage and the separation
percentage fall. The drop in the accession percentage, however, is always more pronounced. The
patterns for job creation and destruction are less clear.
5. Conclusions
During times of economic reform, understanding gross worker and job flows is critical
for forming efficient policy. Significant data requirements, however, have kept the focus of
these studies away from developing countries. In this paper, we present the first results on
worker and job flows from Mexico. Some results found in other countries are also true in
Mexico. In particular, older establishments and larger establishments exhibit lower rates of job
20
and worker turnover and the majority of job reallocations occur within industries. One key
difference from the existing literature, however, is that younger establishments in Mexico have
lower net-growth percentages than older establishments.
In addition to examining whether our results fit previously established patterns from other
countries, we generate some new results as well. We find, for example, that large establishments
dramatically outperformed smaller establishments during the economic crisis. In 2001, however,
large manufacturing establishments and manufacturing establishments near the U.S. border
exhibited dramatic declines in employment, which suggests that difficulties in the export market
are having serious ramifications on the labor market.
We further found that younger establishments (in the first two years after appearing in the
data) exhibit much higher net-growth percentages for women than for men. Men, however,
disproportionately tend to work in establishments that are just entering the market. Looking at
age of workers, we found that net-growth percentages decline with worker age. The general
pattern is that accession percentages and separation percentages both decline with worker age,
but accession percentages decline faster.
Our results have several implications for policy. The contrasting effects of the 1995 and
2001 recessions suggest that policy must retain some flexibility to remain effective. In
particular, the crisis of 1995, which was probably linked to domestic credit problems, adversely
affected small firms. The recession of 2001, however, was probably linked to the decline in U.S.
manufacturing, adversely affected large manufacturing firms and manufacturing firms located at
the U.S. border.
We also found evidence that reducing barriers to trade can have the effect of increasing
reallocations of labor. During the late 1980s, worker flows accelerated at the same time when
21
22
GATT was being implemented and restrictions against foreign investment were being relaxed.
The period of 1997-2001, that last five years in our data, was the most active period for both
worker flows and job flows. Again the relaxation of trade barriers, this time due to NAFTA, is a
possible source of this acceleration.
Administrators of training programs, such as Mexico’s PROBECAT, may find some of
our geographic and demographic results helpful. In particular, the recession of 2001 induced
larger contractions in the border, which suggests that, for foreign-induced recessions, resources
for training may be more effective in the border region. Furthermore, we found that older
workers, although exhibiting predictably high rates of separations from firms, exhibit
surprisingly high accession rates. Training programs might therefore consider targeting this
group as one with high demand for re-employment.
Endnotes
1 Key contributions include Davis and Haltiwanger (1990, 1992, 1999) and Hamermesh et al. (1996). 2 The only exception that our search of the literature revealed is Roberts (1996).
3 Robertson and Dutkowsky (2002) find, for example, that worker adjustment costs in Mexico are an order of magnitude smaller than in the United States. 4 Davis and Haltiwanger (1998) offer twelve additional reasons why it is important to understand gross worker and job flows. 5 For more detail about how adjustment costs may matter for Mexican firms and workers, see Kaplan et al. (2005). 6 Although debated, a positive link between firm size and access to credit seems to pervade the
literature. See Gertler and Gilchrist (1994) for an example.
7 For example, see Roberts (1991) or Marcouiller, Ruiz de Castilla, and Woodruff (1997).
8 We chose December 31 because it often is used to represent annual statistics and because data
from other countries participating in the same IDB project used this date.
9 The official statistics were obtained from Instituto Mexicano del Seguro Social (2001).
10 Most of the work in the literature focuses on job flows due to data constraints.
11 It is worth noting that both the job-creation percentage and the job-destruction percentage rose
from 1989 to 1990.
12 A concern about Table 6 is the endogenous movement of establishments into different size categories over time. This concern is related to other regression-to-the-mean criticisms discussed in Davis et al. (1996) and Davis and Haltiwanger (1999, pp. 2743-2744). If we assign firms on the basis of base year size, then our analysis is accurate. Nevertheless, the results seem robust to the way of allocating firms into size categories. To address this problem, however, we use the average of the two employment measurements to allocate firms. 13 Recall that the denominator for all percent-change formulae is the sum of current and previous-
year’s employment. Since previous-year’s employment is zero by definition for all births, the
formula reduces to 200 times current employment divided by current employment or simply 200.
14 See Alvarez and Robertson (2004).
15 We define the border region to consist of the following cities: Mexicali, Tecate, San Luis Río
Colorado, Tijuana, Ciudad Acuña, Piedras Negras, Ciudad Juárez, Nogales, and Agua Prieta.
16 Gender differences in risk aversion have been the subject of growing academic debate. See
Schubert et al (1999) for a review of an aspect of this debate.
17 We thank a referee for this possibility.
18 An employee is placed in an age category based on his or her age on December 31 of the year
listed in the table. For example, if an employee who is 59 on December 31, 1999 is no longer
with the establishment on December 31, 2000, we treat this as a separation for the age category
60-65 in the year 2000.
23
References
Abowd, J. M., Corbel, P., & Kramarz, F. (1999). The Entry and Exit of Workers and the Growth
of Employment: An Analysis of French Establishments. Review of Economics and
Statistics, v81 (2), 170-187.
Alvarez, R. & Robertson, R. (2004). Exposure to Foreign Markets and Plant-Level Innovation:
Evidence from Chile and Mexico. Journal of International Trade and Economic
Development, v13 (1), 57-87.
Anderson, P.M., & Meyer, B.D. (1994). The Extent and Consequences of Job Turnover.
Brookings Papers on Economic Activity: Microeconomics, v6, 177-236.
Budar-Mejía, O. & García-Verdú, R. (2003). A Dynamic Model of Formal and Informal
Aggregate Labor Force Participation. Unpublished manuscript, Banco de México,
Mexico City.
Castellanos, S.G., García-Verdú, R., & Kaplan, D.S. (2004). Nominal Wage Rigidities in
Mexico: Evidence from Social Security Records. Journal of Development Economics,
v75 (2), 507-533.
Davis, S.J. & Haltiwanger, J. (1990). Gross Job Creation and Destruction:
Microeconomic Evidence and Macroeconomic Implications. NBER Macroeconomics
Annual, v5, 123-168.
Davis, S.J. & Haltiwanger, J.C. (1992). Gross Job Creation, Gross Job Destruction,
and Employment Reallocation. Quarterly Journal of Economics, v107 (3), 819-863.
Davis, S.J. & Haltiwanger, J. (1998). Measuring Gross Worker and Job Flows. In J. Haltiwanger,
M.E. Manser, & R. Topel (Eds) Labor Statistics Measurement Issues, v60, (pp. 77-119).
24
New York, USA: University of Chicago Press.
Davis, S.J. & Haltiwanger, J. (1999). Gross Job Flows. In O. Ashenfelter & D. Card (eds)
Handbook of Labor Economics, v3b, (pp. 2711-2805). New York, USA: Elsevier
Science, North-Holland.
Gertler, M. & Gilchrist, S. (1994). Monetary Policy, Business Cycles, and the Behavior of Small
Manufacturing Firms. Quarterly Journal of Economics, v109 (2), 309-340.
Hamermesh, D.S., Hassink, W.H.J., & von Ours, J.C. (1996). Job Turnover and Labor Turnover:
A Taxonomy of Employment Dynamics. Annales d’Économie et de Statistique, v41/42,
21-40.
Instituto Mexicano del Seguro Social (2001). Cotizantes de los Módulos de Aseguramiento 10,
13 Y 17, por región: 1992-2001.
http://www.imss.gob.mx/ventunica/memoria_2001/2/024000.htm.
Kaplan, D. S.; Maritínez González, G.; Robertson, R. “What Happens to Wages after
Displacement?” Economia, The Journal of the Latin American and Caribbean Economic
Association Spring 2005, v5 (2), 197-242.
Marcouiller, D., Ruiz de Castilla, V., & Woodruff, C. (1997). Formal Measures of the Informal-
Sector Wage Gap in Mexico, El Salvador, and Peru. Economic Development and
Cultural Change, v45 (2), 367-392.
Revenga, A., Riboud, M., & Tan, H. (1994). The Impact of Mexico's Retraining Program on
Employment and Wages. World Bank Economic Review v8 (2), 247-277.
Roberts, B. (1991). The Changing Nature of Informal Employment: The Case of Mexico. In G.
Standing & V. Tokman (Eds) Towards social adjustment: Labour market issues in
structural adjustment (pp. 115-140). Geneva, Switzerland: International Labour Office.
25
26
Roberts, M.J. (1996). Employment Flows and Producer Turnover. In M.J. Roberts & J.R. Tybout
(Eds), Industrial Evolution in Developing Countries: Micro Patterns of Turnover,
Productivity and Market Structure (pp. 18-42 ). New York, USA: Oxford University
Press.
Robertson, R. and Dutkowsky, D. H. (2002) “Labor Adjustment Costs in a Destination Country:
The Case of Mexico” Journal of Development Economics v67 (1), 29-54.
Schubert, R., & Brown, M., Gysler, M., & Brachinger, H.W. (1999). Financial Decision-Making:
Are Women Really More Risk-Averse? American Economic Review, v89 (2), 381-385.
Spletzer, J.R. (2000). The Contribution of Establishment Births and Deaths to Employment
Growth. Journal of Business and Economic Statistics, v18 (1), 113-126.
Tornell, A., Westerman, F., & Martínez, L. (2004). NAFTA and Mexico’s Less-than-Stellar
Performance. NBER Working Paper No. 10289.
year emplpercent change empl
percent change empl
percent change
1992 8,635,503 -- 8,912,347 -- 9,018,442 --1993 8,514,279 -1.41 8,812,949 -1.12 8,890,717 -1.431994 8,795,812 3.25 8,995,896 2.05 9,073,308 2.031995 8,283,045 -6.00 8,607,030 -4.42 8,669,204 -4.561996 8,993,670 8.23 9,294,005 7.68 9,364,274 7.711997 10,154,944 12.13 10,546,623 12.63 10,663,211 12.971998 11,050,796 8.45 11,140,041 5.47 11,243,559 5.301999 11,807,827 6.62 11,770,662 5.51 11,905,464 5.722000 12,406,565 4.95 11,635,666 -1.15 11,735,977 -1.432001 11,914,225 -4.05 11,137,487 -4.38 11,226,124 -4.44
Means 3.57 2.47 2.43Std Devs 6.17 5.80 5.96
Employment in our Data Jobs in our Data
Table 1: Comparisons with Official Statistics
Official Stats on Cotizantes
Notes: Official Statistics come from http://www.imss.gob.mx/ventunica/memoria_2001/2/024000.htm, which is a web site of the Instituto Mexicano del Seguro Social (IMSS). The other statistics from our calculations from Social Security Records from the Instituto Mexicano del Seguro Social (IMSS). Employment is defined as the number of people working. Each job is a worker-establishment pair. The denominator for all percent changes is the average of employment in the current and previous year. Employment measurements are taken on December 31 of every year. See text for details.
27
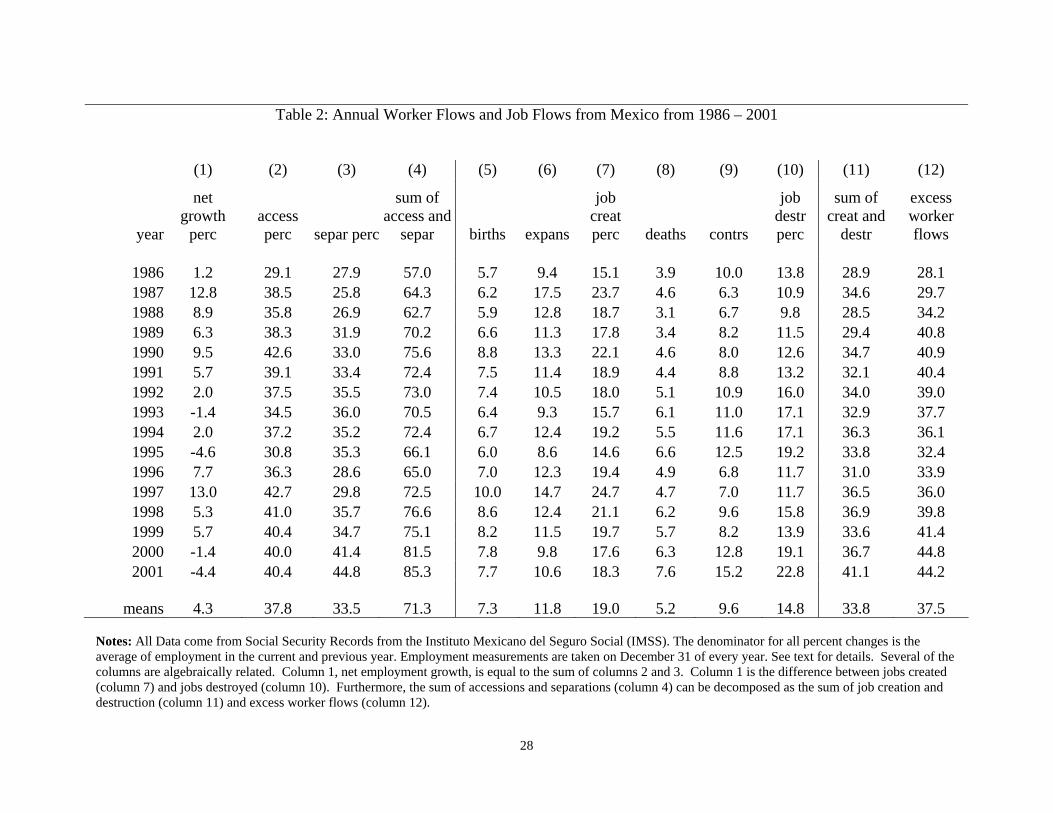
Table 2: Annual Worker Flows and Job Flows from Mexico from 1986 – 2001
(1) (2) (3) (4) (5) (6) (7) (8) (9) (10) (11) (12)
year
net growth
perc access perc separ perc
sum of access and
separ births expans
job creat perc deaths contrs
job destr perc
sum of creat and
destr
excess worker flows
1986 1.2 29.1 27.9 57.0 5.7 9.4 15.1 3.9 10.0 13.8 28.9 28.1 1987 12.8 38.5 25.8 64.3 6.2 17.5 23.7 4.6 6.3 10.9 34.6 29.7 1988 8.9 35.8 26.9 62.7 5.9 12.8 18.7 3.1 6.7 9.8 28.5 34.2 1989 6.3 38.3 31.9 70.2 6.6 11.3 17.8 3.4 8.2 11.5 29.4 40.8 1990 9.5 42.6 33.0 75.6 8.8 13.3 22.1 4.6 8.0 12.6 34.7 40.9 1991 5.7 39.1 33.4 72.4 7.5 11.4 18.9 4.4 8.8 13.2 32.1 40.4 1992 2.0 37.5 35.5 73.0 7.4 10.5 18.0 5.1 10.9 16.0 34.0 39.0 1993 -1.4 34.5 36.0 70.5 6.4 9.3 15.7 6.1 11.0 17.1 32.9 37.7 1994 2.0 37.2 35.2 72.4 6.7 12.4 19.2 5.5 11.6 17.1 36.3 36.1 1995 -4.6 30.8 35.3 66.1 6.0 8.6 14.6 6.6 12.5 19.2 33.8 32.4 1996 7.7 36.3 28.6 65.0 7.0 12.3 19.4 4.9 6.8 11.7 31.0 33.9 1997 13.0 42.7 29.8 72.5 10.0 14.7 24.7 4.7 7.0 11.7 36.5 36.0 1998 5.3 41.0 35.7 76.6 8.6 12.4 21.1 6.2 9.6 15.8 36.9 39.8 1999 5.7 40.4 34.7 75.1 8.2 11.5 19.7 5.7 8.2 13.9 33.6 41.4 2000 -1.4 40.0 41.4 81.5 7.8 9.8 17.6 6.3 12.8 19.1 36.7 44.8 2001 -4.4 40.4 44.8 85.3 7.7 10.6 18.3 7.6 15.2 22.8 41.1 44.2
means 4.3 37.8 33.5 71.3 7.3 11.8 19.0 5.2 9.6 14.8 33.8 37.5
Notes: All Data come from Social Security Records from the Instituto Mexicano del Seguro Social (IMSS). The denominator for all percent changes is the average of employment in the current and previous year. Employment measurements are taken on December 31 of every year. See text for details. Several of the columns are algebraically related. Column 1, net employment growth, is equal to the sum of columns 2 and 3. Column 1 is the difference between jobs created (column 7) and jobs destroyed (column 10). Furthermore, the sum of accessions and separations (column 4) can be decomposed as the sum of job creation and destruction (column 11) and excess worker flows (column 12).
28
age of estab
net growth
percaccession
percseparation
perc
sum of accession
and separation
job creation
perc
job destruction
perc
sum of job
creation and
destr
excess worker
flows
1 <= age < 2 -4.1 57.1 61.1 118.2 32.7 36.7 69.4 48.82 <= age < 3 -4.9 48.4 53.3 101.7 22.4 27.3 49.7 52.03 <= age < 4 -2.8 46.3 49.1 95.4 20.6 23.3 43.9 51.54 <= age < 5 -2.6 43.7 46.3 90.0 18.6 21.1 39.7 50.35 <= age < 6 -4.5 40.3 44.7 85.0 16.0 20.4 36.4 48.66 <= age < 7 -3.8 39.1 42.9 82.0 15.3 19.1 34.5 47.57 <= age < 8 -2.6 38.1 40.7 78.8 14.5 17.1 31.7 47.18 <= age < 9 -2.3 37.2 39.5 76.8 14.0 16.3 30.3 46.59 <= age < 10 -2.8 36.2 39.0 75.2 13.5 16.3 29.8 45.510 <= age < 11 -1.8 36.4 38.2 74.6 13.7 15.5 29.2 45.4
age >= 11 -2.9 25.5 28.4 54.0 7.9 10.8 18.7 35.3
average size of estab
avesize < 50 4.8 46.6 41.8 88.3 29.0 24.2 53.2 35.150 <= avesize < 100 4.7 41.8 37.2 79.0 19.1 14.4 33.5 45.5100 <= avesize < 250 5.1 40.1 34.9 75.0 17.1 12.0 29.1 45.9250 <= avesize < 1000 4.3 34.2 29.9 64.1 13.2 9.0 22.2 42.0
avesize >=1000 2.8 23.8 21.0 44.9 9.0 6.2 15.1 29.8
Table 3: Average Job and Worker Flows Statistics by Age and Average Size of Establishment
Notes: All Data come from Social Security Records from the Instituto Mexicano del Seguro Social (IMSS). The denominator for all percent changes is the average of employment in the current and previous year. Employment measurements are taken on December 31 of every year. Averages by establishment age are from 1996-2001. Averages by establishment size are from 1986-2001. See text for details.
29
year
ave empl < 50
ave empl
at least 50 & < 100
ave empl
at least 100 & < 250
ave empl
at least 250 & < 1000
ave empl >=
1000
ave empl < 50
ave empl
at least 50 & < 100
ave empl
at least 100 & < 250
ave empl
at least 250 & < 1000
ave empl >=
1000
ave empl < 50
ave empl
at least 50 & < 100
ave empl
at least 100 & < 250
ave empl
at least 250 & < 1000
ave empl >=
1000
1986 1.8 -0.3 0.3 -0.6 2.8 -3.2 -5.2 -4.7 -2.3 -2.6 3.6 2.8 4.3 1.5 5.11987 10.3 10.7 11.5 14.4 17.1 15.1 14.9 14.6 13.4 8.1 8.6 8.0 9.0 15.7 20.61988 11.0 8.2 8.6 8.1 6.7 11.8 10.5 10.5 8.4 9.6 10.7 6.8 7.0 7.6 5.51989 8.7 7.4 6.9 4.9 3.0 8.2 8.4 6.3 4.1 3.5 8.9 6.8 7.3 5.9 2.81990 14.2 8.1 8.7 5.3 6.4 13.1 6.5 9.1 3.7 0.5 14.6 9.1 8.3 7.0 8.91991 9.3 5.1 5.0 3.7 2.0 6.1 3.5 3.2 3.0 4.3 10.3 6.1 6.5 4.5 1.01992 3.6 3.9 1.5 0.3 -0.1 -0.8 0.8 -1.3 -1.7 -1.9 4.9 5.7 3.6 2.4 0.71993 -2.9 -1.1 0.1 -2.1 0.7 -8.2 -4.1 -3.1 -2.9 1.0 -1.3 0.4 2.4 -1.3 0.61994 0.7 3.8 3.9 6.6 -1.3 -2.4 2.4 2.9 4.5 6.2 1.6 4.5 4.7 8.5 -4.61995 -8.7 -6.2 -4.1 -2.4 0.8 -10.8 -3.4 -1.3 0.1 2.0 -8.1 -7.5 -6.0 -5.0 0.31996 7.9 8.8 10.3 8.5 5.1 12.3 14.3 13.0 11.7 7.8 6.7 6.0 8.3 5.2 3.81997 15.1 16.6 15.6 14.5 5.7 14.1 15.3 14.4 15.4 7.9 15.4 17.3 16.4 13.5 4.51998 6.3 7.4 8.6 7.1 -0.4 7.1 8.3 9.0 7.5 4.9 6.0 6.9 8.2 6.7 -3.71999 6.4 6.0 7.3 4.9 4.4 5.8 5.6 8.6 7.2 7.4 6.6 6.2 6.4 2.6 2.32000 -4.8 0.0 1.7 0.8 -0.7 -7.6 -5.3 -0.1 1.0 4.5 -4.1 2.3 2.8 0.5 -4.72001 -2.0 -3.9 -3.4 -6.0 -7.4 -8.8 -12.4 -11.1 -10.6 -17.0 -0.2 -0.3 0.8 -1.8 -0.4
means 4.8 4.7 5.1 4.3 2.8 3.2 3.8 4.4 3.9 2.9 5.3 5.1 5.6 4.6 2.7
Table 4: Net-Growth Percentages by Establishment-Size Category
All Industries Manufacturing Non-Manufacturing
Notes: All Data come from Social Security Records from the Instituto Mexicano del Seguro Social (IMSS). The denominator for all percent changes is the average of employment in the current and previous year. Employment measurements are taken on December 31 of every year. See text for details.
30
year all inds manuf non manuf all inds manuf non manuf
1986 3.0 0.2 5.6 1.1 -3.7 3.61987 15.6 22.0 9.2 12.5 12.1 12.71988 13.6 18.5 7.9 8.5 8.9 8.21989 8.1 8.5 7.8 6.1 5.4 6.51990 6.6 4.5 9.2 9.8 7.0 11.21991 5.5 6.4 4.6 5.7 3.9 6.61992 4.4 5.4 3.3 1.7 -2.2 3.51993 3.2 6.2 -0.6 -1.9 -5.5 -0.31994 10.1 13.5 5.4 1.2 0.4 1.51995 4.3 7.4 -0.2 -5.6 -5.0 -5.81996 10.3 11.4 8.7 7.4 11.4 5.71997 12.7 11.8 14.1 13.0 13.5 12.81998 6.6 6.9 6.2 5.1 7.1 4.31999 7.3 7.8 6.6 5.5 6.9 4.92000 1.5 3.9 -2.2 -1.8 -1.4 -2.02001 -11.8 -17.9 -2.5 -3.5 -10.9 -0.2
means 6.3 7.3 5.2 4.1 3.0 4.6
Table 5: Net-Growth Percentages: Comparing the Border to the Country as a Wholenorthern border rest of Mexico
Notes: All Data come from Social Security Records from the Instituto Mexicano del Seguro Social (IMSS). The denominator for all percent changes is the average of employment in the current and previous year. Employment measurements are taken on December 31 of every year. The border region is defined to contain the following cities: Mexicali, Tecate, San Luis Río Colorado, Tijuana, Ciudad Acuña, Piedras Negras, Ciudad Juárez, Nogales, and Agua Prieta. See text for details.
31
firm age
average net perc for men
average net perc
for women
average diff in
net perc
average perc of
male empl
average perc of female
empl
less than 1 200.0 200.0 0.0 7.2 5.91 to 2 -7.9 6.9 -14.8 6.3 6.12 to 3 -7.8 -2.4 -5.5 5.5 5.63 to 4 -5.6 -4.5 -1.1 5.0 5.14 to 5 -5.6 -3.9 -1.8 4.4 4.6
5 or more -3.9 -2.3 -1.6 71.6 72.7
Table 6: Net-Growth Percentages for Men and Women by Firm Age
Notes: All Data come from Social Security Records from the Instituto Mexicano del Seguro Social (IMSS). The denominator for all percent changes is the average of employment in the current and previous year. Employment measurements are taken on December 31 of every year. Averages are from the 1990-2001 results. See text for details.
32
worker age
net growth
perc acc perc
change in acc
perc from
previous category sep perc
change in sep
perc from
previous category
creat perc
change in creat
perc from
previous category
destr perc
change in destr
perc from
previous category
15 <= age < 20 49.0 93.1 -- 44.0 -- 65.3 -- 16.3 --20 <= age < 25 7.9 51.9 -41.1 44.0 0.0 28.1 -37.2 20.2 3.925 <= age < 30 1.5 37.3 -14.6 35.9 -8.1 20.7 -7.5 19.2 -1.030 <= age < 35 0.0 30.7 -6.6 30.6 -5.2 18.5 -2.2 18.4 -0.835 <= age < 40 -0.3 27.2 -3.5 27.5 -3.1 17.7 -0.8 18.0 -0.440 <= age < 45 -1.0 24.4 -2.7 25.4 -2.1 17.1 -0.6 18.0 0.045 <= age < 50 -1.7 22.6 -1.9 24.2 -1.1 16.6 -0.4 18.3 0.350 <= age < 55 -2.5 21.3 -1.3 23.8 -0.4 16.3 -0.3 18.9 0.655 <= age < 60 -3.2 20.7 -0.6 23.8 0.0 16.2 -0.1 19.4 0.560 <= age < 65 -16.3 20.0 -0.7 36.3 12.5 15.3 -0.9 31.6 12.3
Table 7: Average Job and Worker Flows Statistics by Age of Worker
Notes: All Data come from Social Security Records from the Instituto Mexicano del Seguro Social (IMSS). The denominator for all percent changes is the average of employment in the current and previous year. Employment measurements are taken on December 31 of every year. Averages are from the 1986-2001 results. See text for details.
33
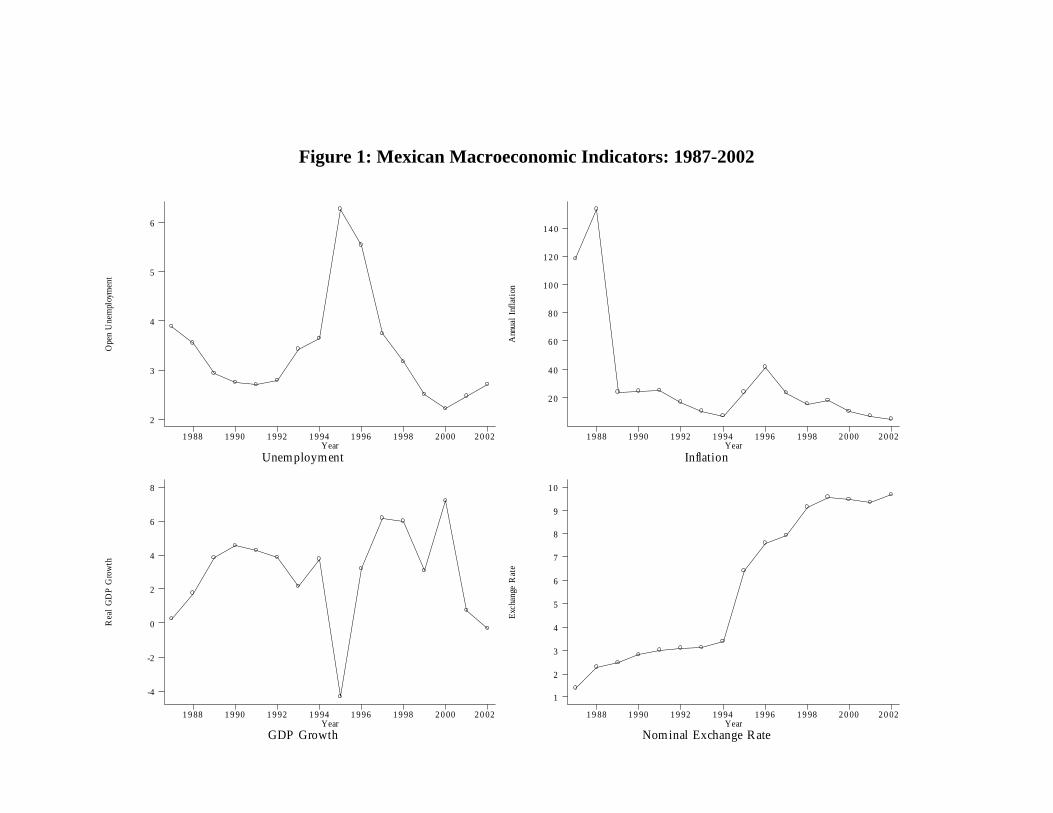
Figure 1: Mexican Macroeconomic Indicators: 1987-2002
34
Ope
n U
nem
ploy
men
t
UnemploymentYear
1 9 88 1 9 90 1 9 92 1 9 94 1 9 96 1 9 98 2 0 00 2 0 02
2
3
4
5
6
Ann
ual I
nfla
tion
InflationYear
1 9 88 1 9 90 1 9 92 1 9 94 1 9 96 1 9 98 2 0 00 2 0 02
2 0
4 0
6 0
8 0
1 0 0
1 2 0
1 4 0
Rea
l GD
P G
row
th
GDP GrowthYear
1 9 88 1 9 90 1 9 92 1 9 94 1 9 96 1 9 98 2 0 00 2 0 02
-4
-2
0
2
4
6
8
Exch
ange
Rat
e
Nominal Exchange RateYear
1 9 88 1 9 90 1 9 92 1 9 94 1 9 96 1 9 98 2 0 00 2 0 02
1
2
3
4
5
6
7
8
9
1 0
35
Related Documents


