Rochester Institute of Technology Rochester Institute of Technology RIT Scholar Works RIT Scholar Works Theses 1991 Employee turnover: Housekeeping department of Rochester Employee turnover: Housekeeping department of Rochester hotels hotels Monica Nyamusa Tembi Follow this and additional works at: https://scholarworks.rit.edu/theses Recommended Citation Recommended Citation Tembi, Monica Nyamusa, "Employee turnover: Housekeeping department of Rochester hotels" (1991). Thesis. Rochester Institute of Technology. Accessed from This Thesis is brought to you for free and open access by RIT Scholar Works. It has been accepted for inclusion in Theses by an authorized administrator of RIT Scholar Works. For more information, please contact [email protected].

Welcome message from author
This document is posted to help you gain knowledge. Please leave a comment to let me know what you think about it! Share it to your friends and learn new things together.
Transcript

Rochester Institute of Technology Rochester Institute of Technology
RIT Scholar Works RIT Scholar Works
Theses
1991
Employee turnover: Housekeeping department of Rochester Employee turnover: Housekeeping department of Rochester
hotels hotels
Monica Nyamusa Tembi
Follow this and additional works at: https://scholarworks.rit.edu/theses
Recommended Citation Recommended Citation Tembi, Monica Nyamusa, "Employee turnover: Housekeeping department of Rochester hotels" (1991). Thesis. Rochester Institute of Technology. Accessed from
This Thesis is brought to you for free and open access by RIT Scholar Works. It has been accepted for inclusion in Theses by an authorized administrator of RIT Scholar Works. For more information, please contact [email protected].

EMPLOYEE TURNOVER: HOUSEKEEPING DEPARTMENT OF
ROCHESTER HOTELS
by
MONICA NYAMUSA TEMBI
A Thesis submitted ·to theFaculty of the School of Food, Hotel and Tourism Management
atRochester Institute of Technology
in partial fulfillment of the requirementsfor the degree
ofMaster of Science
December, 1991

FORM IROCHESTER INSTITUTE OF TECHNOLOGY
School of Food, Hotel and Travel ManagementDepartment of Graduate Studies
M.S. Hospitality-Tourism ManagementPresentation of Thesis/Project Findines
Name: MONICA A. TEt\.1B1 Date:12118/91SS#:__--l.~~::=:.:....:'---.-:-~~=~___ _ _
Title of Research: EMPLOYEE TURNOVER: HOUSEKEEPING DEPARTMENT
OF ROCHESTER HOTELS
Specific Recommendations: (Use other side if necessary.)
Thesis Committee: (1) E=D=-:....;W...:-.A:..:..R=D::...-:=B:..;....=ST..:...O=C-'-=K"-=H"-'A:..:...;M-=--- ( Chairperson)
EDWARD PERO
Faculty Advisor: EDWARD B. STOCKHAM, Ph.D.
Number of Credits Approved: 8 _
G}-}hLl I
Date
&/ti III 2Date
Committee Chairperson's Signature
Department Chairperson's Signature
Note: This fonn will not be signed by the Department Chairperson until all corrections,as suggested in the specific recommendations (above) are completed.
cc: Departmental Student Record File - OriginalStudent

FORMKROCHESTER INSTITlITE OF TECHNOLOGY
School of Food, Hotel and Travel ManagementDepartment of Graduate Studies
M.S. Hospitality-Tourism ManagementStatement Grantin!: or Denyin!: Pennission to Reproduce Thesis/Project
The author of a thesis or project should complete one of the following statementsand include this statement as the page following the title page.
Title of thesis/project: EMPLOYEE TURNOVER: HOUSEKEEPING DEPARfMENT
OF ROCHESTER HOTELS
I, MONICA A. TEMBI , hereby (grant, -.) permission to the
Wallace Memorial Library of R.I.T., to reproduce the document titled above in
whole or part. Any reproduction will not be for commercial use or profit.
OR
I, , prefer to be contacted each time a
request for reproduction is made. I can be reached at the following address:

ACKNOWLEDGEMENTS
I would like to express my sincere appreciation to the
members of my thesis committee, Dr. Stockham, Professor
Crumb and Mr. Ed Pero for their support, advice and
encouragement in these studies.
This work is dedicated to Ed Nyamusa, my husband, and my
daughters Menkeh, Mah & Angwi. Special thanks go to my
sister and brothers, Rose Martin and Jacob for their moral
support .
I will also like to thank my dear friend Nicole Harley
for being such a source of encouragement during my research.

TABLE OF CONTENTS
Page
ACKNOWLEDGEMENTS ......... ........ . ............ i
LIST OF TABLES iv
LIST OF FIGURES v
CHAPTER I. INTRODUCTION AND STATEMENT OF THE STUDY
Introduction. 1
Significance of the study. .................... 3
Problem statement ............................. 7
Purpose of the study. 7
Assumption. ................................... 8
Explanation of terms 8
Scope and limitations 9
CHAPTER II . REVIEW OF THE LITERATURE 17
Causes of employee turnover 17
Consequences of turnover 22
Control of turnover 27
CHAPTER III . METHODOLOGY. 36
Selection of sample population 36
Instrumentation and questionnaire content 37
Survey administration. 39
Data collection 40
Data processing and analysis 40
CHAPTER IV. FINDINGS 42
Responses to questions . 42
Job dissatisfaction factors 59
Job satisfaction factors 60
CHAPTER V. CONCLUSION 68
Conclusion 68
Recommendation 70
ii

TABLE OF CONTENTS (continued)
REFERENCES AND BIBLIOGRAPHY. ....................... 73
APPENDICES
A. A Copy of letter to hotel managers........ 79
B . Questionnaire 80
in

LIST OF TABLES
Page
1 . Rochester/Monroe population trends ................ 11
2 . Quality of life indicators ........................ 13
3 . Cost of living in Rochester. ...................... 15
4. Estimated cost of turnover in six hotel chains.... 23
5. New jobs created each year by the industry........ 34
6. A list of hotels that participated in the survey.. 37
7. Planned length of stay on the job. ............... . 45
8. What respondents indicate as best thing about job. 47
9 . Worst thing about j ob ............................ . 48
10 . Size of the hotel 49
11 . Causes of turnover among those who had worked at
another hotel 58
12 . Turnover rates at Rochester 58
13 . Factors of job dissatisfaction. 59
14. Factors of job satisfaction 60
15 . Cross -source of income by sex . 61
16. Cross -source of income by age 61
17. Cross -source of income by marital status 62
18. Cross -source of length of stay on job by sex 63
19 . Cross -source of sex by hours of work 63
20. Cross -source of help by age 64
21. Cross -source of more supplies by age 65
22. Cross -source of increase wages by age 66
23. Cross -source of least liked job by those who quit. 67
iv

LIST OF FIGURES
Page
1 . Declining youth labor pool ........................ 4
2 . Employment in the industry. ....................... 6
3 . Average hourly earnings lodging vs . total US
4 . Cost of lost production for staff ................. 25
5 . Reasons for quitting previous job. ............... . 43
6 . Previous work experience .......................... 50
7 . Those who quit 52
O o .ClinpXOyiTlSIlC. JDy SGXo O>ooo*o<>oe*oo<>*o*<><.<oeoo*a<>aoa* D4
J7 DOU3TCG OT. iriCOItl o oooooooooooovoaooooooooaoooooooao 3D

Abstract
This study was undertaken in order to ascertain the
high rate of turnover and to find out the causes of turnover
in the housekeeping department of Rochester hotels. The
survey population was made up of housekeeping employees from
17 hotels. Information for the study was from responses to
a four page questionnaire that was designed and later
approved by the Rochester Hotel and Motel Association. Data
gathered was computed using the Statistical Package for the
Social Sciences, (SPSS) . Statistics generated showed the
response rates to each question. Responses were later used
to do cross tabulations in order to find out how variables
are related. Independent variables such as sex, age, and
marital status were cross -tabulated with dependent variables
such as wages and job satisfaction.
Results generated indicate that a majority of employees
had worked at another hotel and had left their job due to
poor wages .
Other factors of dissatisfaction cited include lack of
upward mobility, poor quality of supervision, job insecurity
and working weekends. Respondents indicated that they would
be satisfied with their job if they worked with colleagues
they liked, had enough supplies and if management would have
regard for their concerns. Although turnover cannot be
eliminated, it is important to develop strategies to control it
vi

CHAPTER I
Introduction
Employee turnover is a problem that faces all
industries, but the situation is different for every
industry. Turnover can be caused by any of the following:
lack of career advancement, availability of other job
opportunities, lack of job security and low wages.
Depending on the individual case, turnover can have either
negative or positive consequences on the individual or
company (Mobley, 1982) . At some point in time, turnover can
be acceptable but at others it might not be acceptable
because of the expenses involved.
There are two major types of turnover: voluntary-
when the employee decides to stop working, and involuntary-
when the employee is forced for some reason by management
to stop working.
The hotel industry is one that is greatly affected by
high turnover and spends millions of dollars each year in an
effort to recruit and train new employees.
The reason for incurring these costs can be associated
with the fact that turnover was viewed as okay by the hotel
industry because two decades ago labor supply was still very
high and the demand was less competitive (Woods & Macaulay,
1989) . Today the situation has changed because during the
past decade many new hotels were built and other new

industries are now competing for the labor pool of hourly
employees .
Within the last five years, Rochester has experienced a
large population increase as well as the number of
industries. By implication Rochester hotels face so much
competition for hourly employees from these industries even
though the population has increased.
While several studies have addressed the problem of
turnover in other industries as well as the hotel industry,
very little has been done to address turnover among
housekeeping employees of the Rochester hotels. What gives
the impetus for this study is the fact that turnover in the
housekeeping department is on the increase and therefore
needs some attention especially because this department has
the highest rate of turnover when compared to the other
departments (Wasmuth & Davis, 1983) .
The fact that the labor pool of 16-25 year olds is on
the decline makes it important for hoteliers to find ways to
retain employees .
This study is intended to help find out why
housekeeping employees are not satisfied with their job and
subsequently quitting. The study will also research
strategies that can be used to retain employees and what the
consequences of turnover are.
Significance of Study
Turnover in the housekeeping department, like most
hourly jobs in the hotel industry, has been very high (Woods
& Macaulay, 1983) . For a decade now there has been a rise
in labor shortage as influenced by the decline in
birthrates. This decline is high among the age group 16-19
and 20-24 from 1985 to present and is expected to extend
into the future. This is shown on Figure 1.

Figure l. Declining youth labor pool (1975-1985) :
number of workers aged 16-19 and 20-24 in
millions.
20-24y
1975 1980 1985 1990 1995
Source: Lodging Official Publication of the American Hotel
and Motel Association (1983)
Bureau of labor statistics.

Each year the hotel industry creates several new jobs
as more hotels are built. Employment for hourly employees
such as housekeepers has more than doubled within the past
decade (Leposky, 1987) . Figure 2 shows employment in the
industry as it increases year after year and how it is
projected to increase by the year 2000. Bearing in mind the
above mentioned points, it becomes important to address the
problem of turnover so management knows the causes, that way
measures can be taken to identify employee problems and
possibly find ways to resolve them.. Subsequently turnover
and the costs incurred when new people have to be recruited
and trained will be reduced.

Figure 2 . Employment in the hotel /motel industry(all workers projected by year 2000)
workers (000)
1975 1980 1985 1990 1995 2000
Source: AH & MA hospitality lodging + travel Research Foundation 1 989
Problem Statement
A need assessment study of employee turnover in the
housekeeping department is carried out as a preliminary step
toward assessing reasons for turnover and the establishment
of employee retention methods for the management of the
Rochester hotels.
Purpose of Study
The purpose of this study was to find out reasons for
turnover among the housekeeping employees of Rochester
hotels, analyze measures that have been used to control
turnover and finally to recommend other strategies
management could use to further reduce turnover.
Emphasis will be laid on the effects of variables that
either directly or indirectly affect turnover such as
motivation, training, recognition, job satisfaction and
awards and the consequences of turnover.
As a matter of fact, the study will aid supervisors and
managers to view labor shortage and turnover as not only a
problem for now but as one that can also extend into the
future. Therefore, they must develop strategies now to deal
with the problem especially since demographics accelerate
labor shortage. As was noted in the introduction there is a
decrease in the labor pool for housekeeping jobs especially
the 16-24 year old group which is heavily employed by

the industry. The study was also meant to see if the
assumptions will prove to be true for Rochester hotels.
Assumptions
The following were looked into to see if they were
true:
1. Employee turnover is due to poor wages paid to
housekeeping staff;
2. Employees like their job because of medical
insurance and retirement benefits;
3 . Employees will not stay longer than one year on
the job; and,
4 . Employees are dissatisfied with their work because
of work pressure, lack of upward mobility and lack
of enough supplies.
Explanation of Terms
Turnover: The cessation of membership in an
organization by an employee who received monetary
compensation from an organization. This definition excludes
those who leave as a result of transfers or promotions but
refers to those who voluntarily leave their work or are
fired.
Retention: The ability of an organization to continue
to have or retain its employees over long periods of time.
This can be done by management trying to maintain a good
8

relationship with its employees.
Motivation: The art of making employees feel happy by
providing inducements or incentives that will boost their
ego and make them feel happy about their jobs or even make
them able to put in more time and efforts.
Consequences: The after effects of turnover which can
either be negative or positive to the individual or
organization .
Control: Developing of strategies to reduce turnover.
Scope and Limitation
The study was limited to housekeeping employees of
Rochester hotels particularly hotels that are members of the
Rochester Hotel & Motel Association. This study was limited
to Rochester because of its population size, commercial
activities and its strong buying power.
Limitations to the study were caused by language which
was a problem for the employees, some of whom could not read
or write. Secondly, it was not possible to conduct an
interview with the housekeeping staff due to time
constraints on their part. However, the questionnaires were
mailed to and from the hotels.

Background
Rochester has many types of businesses and there is
such a high competition and demand for hourly employees.
For this reason hoteliers must be very concerned about
turnover and possibly the loss of their good employees.
Looking at the population trends of Rochester it can be
seen that the population is on the rise from 702,23 8
thousand in 1980 to 726,727 thousand in 1990. This
population is estimated to increase to 743,384 thousand by
the year 2000. Table 1 shows the population trends of
Rochester from 1980 to 1990. The population is so
diversified in ethnic origin that it provides a good source
of labor and in turn has a large number of customers to the
hotels. These customers come in for various reasons which
include business, recreation and education (Rochester
Chamber of Commerce, 1990) .
10

Table 1.
Monroe County Population Trends
City of: 1980 1990 2000 2010
Rochester 241,741 245,140 245,364 244,770
Brighton 35,776 36,850 38,500 38,990
Chili 23,676 23,760 24,700 24,680
Clarkson 4,016 4,130 4,140 4,140
Gates 29,756 30,620 31,565 31,930
Greece 81,367 87,675 92,175 94,307
Hamlin 7,675 8,495 8,540 8,395
Henrietta 36,134 37,210 38,430 38,830
Irondequoit 57,648 57,190 56,230 55,115
Mendon 5,434 5,835 6,050 6,390
Ogden 14,693 15,940 16,310 16,705
Parma 12,585 13,525 13,650 13,570
Penfield 27,210 28,940 29,870 30,620
Perinton 41,802 44,035 46,035 47,100
Pittsford 26,743 28,230 29,890 30,820
Riga 4,309 4,625 4,480 4,390
Rush 3,001 3,210 3,490 3,670
Sweden 14,859 15,242 16,185 16,598
Webster 28,925 31,357 33,145 33,950
Wheatland 4,897 4,720 4,635 4,630
Monroe County 702,238 726,729 743,384 749.-600
Source: Rochester Chamber of Commerce, 1990.
11
Rochester/Monroe County has a very high buying power
and quality of life when compared with other major cities of
the United States. Rochester also has the nation's highest
percentage of professional and technically skilled employees
and several attractions for visitors who in turn are
customers to the hotels. Cost of living and medical care
are very high while income and wealth are lower than for
most U.S. cities. Data from the annual survey of
manufacturers, the U.S. Department of Commerce, and the U.S.
Bureau of the Census confirms these facts. This can also be
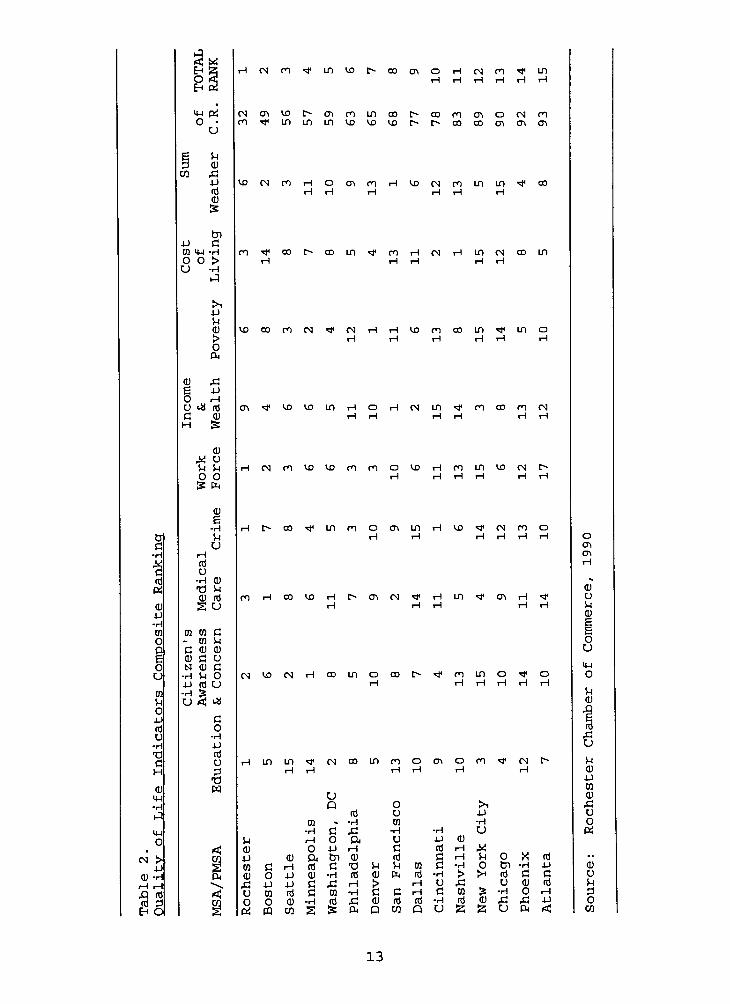
seen from Table 2 where Rochester has been compared to other
cities of the US.
The figures in table 2 show that the cost of living is
very high in Rochester as she ranks 3rd among other cities.
Medical care is also high. Other important figures on the
table include income and wealth and education where
Rochester ranks 9 th and 1st respectively -
12
ti-H
XcrS
&
CUXi
ri
tn
O
ocj
cq
o
(fl
U
-H
C
CH
CD
CM
-rH
iJ
CM
O
CN >
JJ
CU -H
ri rH
.Q rtJ
rd 3En O
CU JZ
e jj
O rH
CJ <H rd
ti a)
H |S
a)
u u
o o
e-H
iH
UrH
rd
CJ
-H CU
!H
(U rd
SO
CQ CQ
CQ
c a> cu
cj
ao
CD flN CU
H Uxi ti cj-H ES
o <r; ia
ao-H
JJ
rd
CJ
TJ
r3
CO
S
CO
(N ro in w > ffl o\ H cn ro cf tn
H H H H H
Noiwhcimincti
ro^mininvoujvs
vo cn ro
ro * co
o
H
r> co ro cn o cn roC~ r> co CO CTl cr cn
vo cn ro m m >* oo
H H H
ro H CN in cn co in
H H
VO oo ro CN ^ CN
CTi
ro
vo ro oo tn ^
H ri ri
IT) O
H
vo vo tn
cn ro vo vd ro ro
CN m "di ro co ro CN
o VD H ro m vo CNr--
H H H H H H
oo J< m ro o ch in
h H
VO tf CN
H H
m w <f h in * m
H H
O
H
H
CN VO CN Hcoinooot^'jroino^o
H H H H H H
Hmm'fcNcoinroo
H H H H
CT
Qrd
H
-H c 43
rH 0 ft0 JJ rH
CU 04 Cn CU
d H rd ti TJ Vi
o JJ cu H rd cu
JJ JJ C X3 H >CQ rd C CQ H co CU -H
.Jm cu
m CO S !S ft p
ou
CQ
-H
CJ
crd
Crd
co
jj
rd
Ca-H
U
aH
u
cu
H
H
-H
CQ
rd
S3
n <t (N
jj
H
CJ
rJ
O>H
CU
S3
oCn
rd
CJ
-H
.G
U
X-H
CU
0JZ
ft
rdjj
Crd
rH
JJ
<
u
V)
oCO
13

In considering cost of living, Rochester is very
expensive. Everything including homes, utilities, taxes and
hospital care are very expensive. Table 3 shows how well
Rochester ranks with other cities in terms of cost of
living.
14

IM
O tn tJ
_AJ HOOOVO^COHOHOCNCOCNcN CD
g C csroin^rHrocNroHinrorO'tfroro jj ir,3 rd u JJ
CO PJ cu
ri
CD
CO
TJ r
& ti O vo
g c rOin^CNCNrH^iC^HintncorOOOOo rd -n oo
O rd H H H H H rd cn
U OS cn
CD
jj
S H
C! CSJJ JJ M cd -H -H
rH ra C C^lrnnoln^Ho^MU3cD^flnt^l* jj
rd O cu rd H H H H H H CO CQ CQ
U CJ-H 0! CU CU
CU JJ U CJ CJ
CS H rd vo 0 CS CS
cu rd ftoo MH cd rd
O JJ ti cn CS CS
-H H H rd -H -H
ft QJCNOr>ror>Osi<!HLncTVDrOVDVDH jj Pn Cn
Cn tn U >i jJvotNinrotnvo^roooinvDcn^'inin rd
> O cu rd rdromvDvoininvovo^LninvoovDin P JJ JJ
raj ffi ft P OS <
CO ~
CO vo
cn co
>!m<THVD^jiroc^oHincocNCNin^i H cn u U -H
rH CS H rH H H H H H CD CD JJ
rd rd rH > >-H
U U OS -iH CQ O O TJ
O CD U CD O OH1-1 ft 9-Ei rd Hroorooonr--invocTiin'#coino < o rH cd r>
<D CQ JJ * ooovocNHHCNrom^inroHCTCT ffi rd jj oo
4J CU -H
rd X ftoojj rd rd cn
CUOlCTlOCOVDVDOOCTrOOOCOiniHOVO
cn ft
cu ffi
V cd CT
0 JJ H
iJ COCdcNiHCNHHr-tiHHr-ICNHrHCNiHCN
CO En CJ H oi-w-
rH tn
rd
CO -
- CQ
CQ CQ U
QJ JJ ti 3>h-h CD ti co CQ JJ
JJ CD g cu CS CS CQ
H C CQ ^ o g CD CD -H
. H rH -H Q) CmHCNrOVO^HOO^mmoroC^CN ffi ft U U JJ
> rd -H CO g rd H H H H H H O rd
TJ 3 JJ O oi CTIrH CD CD JJ
ti C CD UH ffi ti CD JZ JZ Ui
JJ
f? ^ >1
-H > JJ JJ
CO OCOP-CTCTOOOLnVDrOHOOr-lin JJ CD rH
CQ rH ncr>cncNcTcoHcNrooint~-ooin .. tn p MH MH rd
CU OJ xi -H VD 4Jint-~(THinHcnvD^<^vovocNVDH CQ -H O O JJ
KH cn rd tn 6 co CD K ti H
-H > 0) O rd cn OrlHHINriM HrHCNHHiHiHiH o w id ti ti ft
r? < k cj fe h CJ U JZ
ti - urd rd cq
cu cu O
CMw- O CQ t> U UX
o CO Vl
O TJti ticq m -
> JJ ti tiJJ MH CD M rH rd - 0
-H O Coh^Hriom^roininwrncoo) cd CD CU -H
ri O rd H H H H H H cu Cn CJ CJ JJ
rd CD >iffi ec; es cs U U rd
ti U iHH CU CU -H
O -H CO TJ MH CQ g g CJ
!h rJ <D ooooooooooooooo O ti g goft O -H ooooooooooooooo O O VO O CQ
CT
ti-H
H ft> ti t>
Cn (D CJ oo
<uoooooooHCT\inininc~a\'JHroLn CS ffiOH CM
cj oo o cn
CT fi,MH H MH-HcsHvoovDcncooincoooHC^co
> > U V CT ^|fC0>CTVD000D00C~r~0000r~CDO JJ 0 O 1 O ri
-H < ft O H ft H H H H cq rd in rd
rl
M- rd -h 4J
CD CJ CS
4J 00 4J ii
ti CT CS -H
MH 5-i O Q) CD H CD ft
o < CQ gCQ JJ
g g CQ4J JJ O
XJ >,< )H CQ M CQ U ffi
CQ u jj rd cd rd cd rd
o >i OP CSi-HftCDfttDftCS
Ujj rd cj ti rd cu U CD U CD td
cn -H -H CQ OCDfllQflSQU
H -H CJ JZ -h a CJ O -H
i_l 14 JJ H CD ft CJ O -iH U
QJ CD rd O H M ri ti JJ rH 4J CO CO CO CD
ro JJ jj rd 0 a ftrH in cu X rd cu tn rd td gtn cajJCCnficQWrd-HO'cJ-HkrHC USD ID CD r?
QJ QJfl)CO(d-H(ti(U(D>tHtdCfaJJ-rH jj
ri JZ rf Hitl O UH > C rHQJ JJ.C CS
.Q CJ OrHtn-HCHCCcnS-iHOCrdcn CD
rd O OJJO^-H(dQ)-H(dQ)GX3cd<ucd u
tH OS grilcacjCjPPSSSiSftftcocolS *
15

Due to this high cost of living as shown in figure 3
it is worthwhile for hoteliers to consider the wage issue as
very important and to do something about it so hourly
employees like the housekeeping staff, should be able to
live up to the standards of the area.
16

CHAPTER II
Review of Literature
Causes of Employee Turnover in the Hospitality Industry
In order to successfully control turnover in the
housekeeping department, it is imperative for hoteliers to
make an effort to understand the remote and immediate
causes, costs, and consequences of turnover. Perceived
causes of turnover can be grouped into four categories :
a) Employer not satisfied with employee- - This may be
due to unsatisfactory work performance, excessive absence or
tardiness, repeated rule violations, alcohol or drug abuse
and insubordination.
b) Employee not satisfied with employer resulting in
quitting --In most cases this is caused by insufficient
pay, or fringe benefits, dissatisfaction with working
conditions, sexual harassment, job insecurity, lack of
career growth on the job, and poor working conditions.
c) Independent reasons such as: retirement, end of
contract, transfer and going back to school.
d) Another category is not influenced by either
employee or employer but can be attributed to natural
causes. These include the fact that turnover can be caused
by resignation resulting from health problems, accident or
death, injury on the job and house responsibilities (Wasmuth
and Davis, 1983) .
17

Most of the causes listed above are the root causes of
turnover in the housekeeping department. Other important
causes are associated with poor communication between
supervisors and employees and lack of employee voice
(Skinner 1964) . Turnover can in itself cause further
turnover as a result of under staffing which leads to too
much work left for the employees remaining.
Although there have been many efforts to stop employees
from quitting their jobs it is really not possible to stop
turnover; it can only be reduced.
A study conducted at hotels in Greece by Leondinas
Chritiris (1988) found turnover to be very high among hourly
employees and to be related to culture and lack of employee
voice and recognition, lack of job security and lack of
career growth. He also noted that due to an existing
culture at these hotels wherein hourly employees, like
housekeeping employees, have always been paid the minimum
wage and have remained in this category for many years as
management classifies them as people with a low education.
Therefore, in spite of all the hard work they do, they are
only entitled to low wages.
Organizational differences in pay can greatly account
for a lot of turnover. For example when hotels pay their
hourly employees different wages for the same type of job,
it is very likely that those who pay higher wages will
attract employees from the other hotels. In order for
18

hotels to keep good employees it is good for them to stay
competitive with other industries as far as wages are
concerned (Mobley, 1982 , pp. 10-20).
The state of the economy can greatly contribute to
forced turnover as was experienced in the early1980'
s
observed Mobley (1982) . Due to the recession resulting from
the Gulf War many employers of the hotel industry have been
forced to cut back on employment and some have had to
terminate employees. This cutback on labor was influenced
by the declining number of customers that used the hotels at
the time (Stevens, 1991) .
Studies conducted by other researchers validate the
argument that turnover is highly related to the type of job.
The hourly paying jobs and the low level jobs experience a
higher rate of turnover than jobs for salaried employees at
higher levels (Armhnecht & Early 1972) .
The Bureau of National Affairs also confirmed this fact
when it conducted its studies on employee turnover and the
results showed that organizations with less than 250
employees and had more hourly paying jobs than its
counterparts experienced an average monthly turnover rate of
12.2% while organizations with more than 250 employees and
fewer hourly positions experienced a lower monthly turnover
average rate of 1.3%.
Turnover in the hospitality industry tends to follow
this pattern too. Also the bigger hotel chains are more
19

likely to retain hourly employees than do the smaller
chains . Another reason for high turnover in the hotel
industry can be attributed to the fact that wages are
comparatively lower here than in other industries. Figure 3
compares wages in the hospitality industry to the total U.S.
economy. It shows that wages are very low in the hotel
industry.
20

Figure 3 . Average hourly earnings, lodging industry vs
total US economy.
Average hourly earnings
Lodging Industry vs Total U.S. Economy
1958 1963 1968 1972 1977 1982 1984
Source: Panr^ll Kerr Forster U.S. Bureau of tabor Statistics
21

Seasonality of the hotel business is yet another factor
that contributes to turnover. Due to the fact that the
hotel business in most parts of the country has fluctuating
occupancy rates between seasons every year, there tends to
be opportunities for management to terminate employees
because there are not any customers to use the rooms cleaned
by housekeeping staff. The work load reduces and becomes
uneconomical to keep employees without work.
Consequences of Turnover
Employee turnover can result in negative or positive
consequences to the industry or individual depending on the
situation (Mobley, 1982, pp. 15-20).
Negatively, employee turnover has the potential to
reduce the quality of service. This is usually the case
when the labor force is reduced and the same amount of work
is left for fewer hands to do as is always the case with the
housekeeping employees (Wasmuth & Stanley, 19 83) . Employees
remaining after others have quit', their jtfrbs usually find the
work too much for them and in trying to do more work than
they used to do they usually do not have a choice but to do
a poor job.
Training employees is very necessary but it can be very
costly in terms of money, time and lost production. The cost
of turnover can be seen in Table 4 which gives one an idea
of how much it costs management to hire and train hourly
22
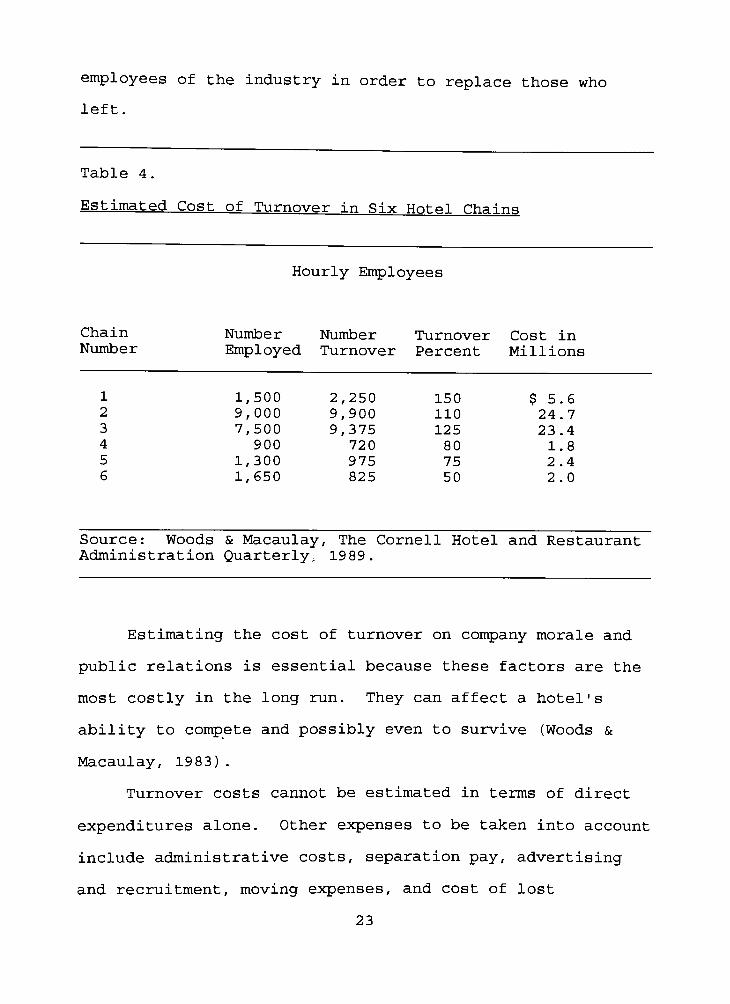
employees of the industry in order to replace those who
left.
Table 4.
Estimated Cost of Turnover in Six Hotel Chains
Hourly Employees
Chain Number Number Turnover Cost in
Number Employed Turnover Percent Millions
1 1,500 2,250 150 $ 5.6
2 9,000 9,900 110 24.7
3 7,500 9,375 125 23.4
4 900 720 80 1.8
5 1,300 975 75 2.4
6 1,650 825 50 2.0
Source: Woods & Macaulay, The Cornell Hotel and Restaurant
Administration Quarterly, 1989.
Estimating the cost of turnover on company morale and
public relations is essential because these factors are the
most costly in the long run. They can affect a hotel's
ability to compete and possibly even to survive (Woods &
Macaulay, 1983) .
Turnover costs cannot be estimated in terms of direct
expenditures alone. Other expenses to be taken into account
include administrative costs, separation pay, advertising
and recruitment, moving expenses, and cost of lost
23

production (Wasmuth and Davis, 1983) . Figure 4, shows how
cost of lost production can be very high. It is estimated
that the cost of lost production assumes that the average
staff person requires two months to reach acceptable break
even level and that four months of salary and effort
constitute the total cost of break- even point. It is also
assumed that two more months of production time are needed
to overcome the initial two months loss (i.e. area W = area
Z) . For hourly employees it is assumed that standard
performance levels can be reached and sustained after one
month. For these individuals two months of salary and
effort will put the company atbreak-
even point (Woods &
Macaulay, 1988) .
24

Figure 4. Cost of lost production for staff.
Performance
Break-even
Initial costs
Months
Initial costs = separation, replacement, and trainingProduction costs = performance costs
X = point of maximum loss
Y = real break-even point (Area W = Area Z)
Source: The Cornell Hotel and Restaurant Administration
Quarterly, 1983.
25
Turnover also reduces the possibility of a company
expanding if the quit rate increases for hourly employees
like those in housekeeping (Wasmuth & Davis, 1983) .
Turnover does not only limit the chances of an industry
expanding but also affects the company's stock since most
stock holders have the tendency of associating turnover with
poor management and would hold up buying more of the
hotel /company1 s stock (Armknecht, 1972). If the hotel does
not expand, this will also have an impact on employees whose
carrier growth will be limited and many employees will be
forced to remain on the same jobs and level for longer
periods of time.
Turnover in most instances will result in lower output
and therefore lower returns on investment. Turnover also
causes disruption of social and communication patterns.
This usually occurs when employees who quit the job belonged
to a group of employees who worked as a team (Mobley, 1982,
pp. 25-30) .
Positively, turnover can be advantageous to the
individual who is leaving a stressful job for a less
stressful one. If overall job satisfaction has been poor
for someone, it is good he quits the job as his performance
will usually start diminishing. With turnover, employees
have the opportunity to get new and exciting jobs while also
making a new circle of friends. Turnover is also healthy
for the organization in that it provides an opportunity to
26
replace less productive employees with new energetic people
who are ready to work.
Due to the pressure of work at the housekeeping
department, it is good that turnover occurs because people
easily get bored doing the same thing everyday and only a
few people can afford to do this job everyday so it is
better to get new people at times. Besides, turnover brings
more challenge to the supervisor as he gets to meet and
train new people more often. Finally, turnover can create
an opportunity for upward mobility for those who remain in
an organization.
Control of Turnover
Although turnover still remains a problem in the hotel
industry many efforts have been made and are still being
made to address the issue. Turnover can be controlled in a
number of ways such as: contract services and by addressing
variables that can encourage job satisfaction. These
include motivation, quality of supervision, recognition,
compensation, communication, feedback, child care services,
and competition which can boost employee morale. Lastly,
turnover can be controlled through good hiring techniques.
Training and looking for other sources of labor like the
older worker.
Some hotels have resolved the headache of turnover by
hiring contractors to do all the housekeeping jobs. This
27
hiring contractors to do all the housekeeping jobs. This
gives them the advantage of not having to worry about
storage space for laundry facilities (Herbick, 1990) .
Another advantage is that they can limit how much work they
want to give out especially during the slow periods. They
really don't have to worry about where to employ their
surplus labor during the slow periods.
Dramatic turnover reduction occurred at the Westin
hotel chain starting with the one in San Francisco. This
occurred when the hotel decided to renovate their training
programs. Training did not just end with the new employees
but continued with the old as well. They also sought new
ways of communication between management and employees by
introducing a newsletter that was published weekly (Lodging,
19 87) . Through such innovations, supervisors and employees
were given the opportunity to report problems freely and
they were respected for their contribution.
Keeping employees motivated can greatly reduce
turnover. Motivated employees love their job and can
contribute very positively to the well-being of the hotel.
Many hotels have, however, done a lot to motivate employees
and have realized positive results. Feedback, one form of
communication, improves performance. "Employees need a
measure of daily performance and a basis for relating to the
bigpicture" (Lewis C, 1990). Feedback helps them know
what they are doing right or wrong and gives them a sense of
28

direction. Motivation through rewards such as gifts, fringe
benefits, increased wages and praise all boost employee
morale and make them more committed (Herlong, 1990) . Praise
can work magic in the workplace; it can be used to call
attention to company goals, reinforce behavior, shape
behavior and improve morale. Praise is a tool of
recognition and leadership (Ensman, 1990) . When a
supervisor takes upon himself to give praise to employees
who deserve it, he helps build a positive attachment to his
employees. When this happens the supervisor tends to
demonstrate consideration for the employee as well as a
supportive work environment. As a result, employees are
less likely to quit (Lathan, 1980) .
Good compensation can be a good method to reduce
turnover. The Carlson Hospitality Group developed a
compensation strategy which worked well for them. They
decided to pay their housekeeping employees by the number of
rooms cleaned rather than by the hour. With the
introduction of this method, productivity greatly increased
and costs were reduced per room from $2.25 to $2.22, a
reduction of 11% (Kirwin, 1990) .
At the Manhattan Eye and Throat Hospital, turnover at
the housekeepingdepartment was greatly reduced due to their
nice compensation program. They gave employees monthly
awards for on- time arrivals, scoring high on incentive
examinations, and absenteeism. This resulted in employees
29
1980). Hinrichs'compensation strategy also worked for the
housekeeping department of the Renaissance Hotel. Their
compensation package was called "Paying by thePiece."
Through their method employees could earn up to $6.00 an
hour and cleaned as many as 22 rooms per day. Initially,
employees were paid less than $6.00 an hour for 8 hours a
day cleaning 15 rooms per day. If they exceeded this
number, they were paid more than their regular hourly wage
for the extra rooms. This method helped employees to get
more money and management realized a decrease in both labor
cost and a reduction in turnover rate.
The Marriott hotel chain reduced its turnover by
building pride in their employees. Marriott became very
supportive of employee safety programs and took the pains to
find out aboutemployees'
personal problems, and then took
measures to solve them. This hotel chain experienced a lot
of reduction in turnover.
Providing child care services has become a popular
method of controlling turnover that many hotels are
beginning to adopt. The Marriott hotel and resorts and
McDonald's restaurantsare'
pioneers of this method. Since
55% of the labor force in both hotels and restaurants are
made up of women and approximately 45% are of child bearing
age, providing child care is a very wise thing to do. The
need for providing child care is greatly influenced by the
business hours and the dependence by management on employee
30

performance at peak periods (Willis, 1990) . For working
mothers, knowing that their child is safe and near while
working provides a lot of motivation and security.
Employee recognition is a very big motivator and gives
employees a lot of encouragement to do even better. Collins
Service System, a commercial janitorial service, had a
turnover rate of 20% as opposed to 250% company rate. A lot
of credit should be given to Collins'management for making
efforts to retain employees (Zelinsky, 1989).Collins'
management was successful because of its very highly
sophisticated employee recognition program. Everyone who
provides quality service to customers with a smile is
rewarded. Management encourages communication with its
employees . They are encouraged to make suggestions on how
to run the company. Collins hires motivational guest
speakers to their employees. Incentives are given to
employees who try to lower overhead costs . Here employees
are motivated also by the fact that they know someone is
there to listen to them. Listening to employees and giving
them room for expressing their views can have a great impact
on the way employees feel about their job (Daniel, 1986) .
In order to recognize employees, boost their morale,
and make them know they are valued, some hotels have
organized picnics, recreational associations and
tournaments, and employee of the month program. Margaret
Kappa (1990) ,Director of Housekeeping at the Greenbrier
31

Hotel, realizes that offering the above incentives have
actually raised staff morale and increased productivity
(Kappa, 1990) .
Motivation can also be in the form of competition. In
an effort to help housekeeping employees gain a little
recognition, one Nashville property has set the pace for
unique competition that increase recognition among members
of this often slighted department (Lima, 1989) . One of such
competition took place in Opryland Hotel, Nashville, where
housekeeping employees competed in a housekeeping contest in
bed making and room cleaning. The winners were given large
cash awards .
Another such competition was organized by the New York
Hotel & Motel Association and this entailed bed making.
Enthusiasm generated by the bed making contest was greater
than anyone's wildest expectations (Carol, 1990). It is
hoped that many more hotels will follow this example and
boost the morales of their employees .
Hiring techniques can play a very important part in
influencing turnover. If job interviews are well done, good
employees that will last can be selected. After hiring,
employees should not be left alone. There should be a
continuous training process which will provide learning
opportunities for the employees (Stevens, 1991) . "Training
has a high correlation with retention ofemployees"
notes
David C. Milds (1987) ,Director of Training and Development
32

for Food and Service Management at Marriott. When a company
invests in training employees, it makes employees feel
committed to the company. Training gives employees the
satisfaction of feeling qualified, adept at what they do,
and a sense of job security. Training results in better
service, increased productivity, job security, and lower
turnover. Lack of training on the other hand may result in
high turnover, low morale and high absenteeism (Minor and
Cichy, 1989) . Successful training must have an evaluation
or a feedback stage so as to know how much training is
catching on (Cichy and Clark, 1989) . Training will help
career growth among employees and also helps attract good
employees to a company. If applicants know a company has a
good training program they will likely join the company
(Martin, 1987) . If people are a resource they can and should
be developed and refined to increase their ultimatevalue"
says the chairman of the New York Hotel & Motel Association
(Ronzemke & Dick, 1989) . Training is a never ending process
which includes formal and on-the-job training, guided
experience, effective supervision, performance review and
organizational support (Woods & Macaulay, 1989) .
Considering the fact that the hotel industry creates
new jobs each year, it becomes very important for hoteliers
to put in a lot of effort to control turnover. Table 5
shows that many new jobs are created each year by the hotel
industry and how many people actually get employed each year
33

from 1983 to 1990.
Table 5
New Jobs Created and Number of People Employed by the Hotel
Industry (1983-1990)
New Jobs in the Number of People
Year Hotel Industry Employed in Millions
1990 40,000 1.64
1989 53,000 1.6
1988 76,000 1.57
1987 84,000 1.51
1986 78,000 1.45
1985 100,562 1.4
1984 86,000 1.2
1983 22,600 1.1
Source: American Hotel & Motel Association
In response to increasing staffing problems, Marriott
hotel chains, Kentucky Fried Chicken, and Pizza Hut have led
the industry in tapping the older workers, especially for
its hourly positions. "Older workers are a more mature work
force which offers substantial benefits, older workers learn
fast, perform well and remain stable on the job" (Demico &
Reid, 1988) Older workers are also advantageous for the
following reasons: fewer absences than younger workers,
34

they are more satisfied with their job and have fewer on-
the-job injuries.
In order to reduce turnover in the housekeeping
department, hoteliers need to look at other sources of
labor. These sources include retirees, the handicapped,
immigrants, and young mothers. Contacting employment
agencies also provides a good source of trustworthy
applicants. Retirees looking for a part-time job will be
very suitable because of their experience and reliability.
Also by updating its wage structure and staying above or
abreast with competitors, a company can have a good
opportunity of getting good employees. To retain them the
company needs to communicate with the employees, find out
what they like or don't like about their job, what they want
to be improved upon, developing good orientation programs
that fit the organization culture greatly helps retain
people as they are reminded of what is expected of their
behavior.
35

CHAPTER III
Methodology
Selection of Population
A convenience sample was selected for this study. It
encompassed 17 hotels of the Rochester area with 265
housekeeping employees. Hotels selected range from low to
high priced and were from midtown, airport, and suburban
Rochester, Monroe County. Selection of this population was
aided by communicating with the hotel managers. A letter
was sent to all the hotel managers introducing the study to
be conducted and its purpose. It turned out that not every
hotel was willing to participate. The survey was conducted
with those hotels that were willing to participate. The
hotels that participated are members of the Rochester Hotel
& Motel Association. Table 6 shows a list of the hotels
that participated and the number of responses returned.
36

Table 6.
Rochester Hotel Participation in Study
Hotel
Courtyard by Marriott
Denoville
Best Western Diplomat
Raddisson Inn
Super 8 Motel
Welesly Inn
Residence Inn
Rochester Marriott Greece
Marriott ThruwayMicrotel
Red Roof
Journey's End Rochester Gates
The Lodge at Woodcliff
Econolodge
Best Western Sunrise
Comfort Inn West
Hampton Inn
Total
Number of
Employees
15
7
8
12
10
10
20
35
40
10
12
7
29
10
15
14
11
265
Number of
Responses
1
1
4
6
7
6
13
10
15
5
6
5
12
3
5
6
3
110
Instrumentation. Questionnaire Design, and Content
The survey instrument selected for the study included a
confidential 4 page questionnaire which was either mailed to
the hotel or delivered in person.
The survey instrument was designed based on facts noted
in the literature and was later reviewed by the Rochester
Hotel and Motel Association. Executive Committee members
made some changes by deleting some questions. They deleted
questions that specifically asked how much employees were
37

being paid per hour and the questions that asked employees
to indicate what the supervisors were not doing right.
The survey instrument was designed so related questions
could be grouped together. Group one was made up of
Question 1-8, 10-22. These were meant to find out employees
perception about their job. The second group was made of
demographic questions about respondents which have been used
for analysis and classification of material. Group three
consisted of questions that asked for respondents
suggestions of how working conditions could be made better.
Question 1 was for respondents to identify how they
knew about the job. It specified various means by which
they could have known about the job. Question 2 found out
if respondents had a motive other than wages to work for
this department . Question 3 measured length of training
which plays a big influence on the employee's job security -
Question 4 found out what their perception is of the
training they received. Question 5 found out if supplies
were always enough. Questions 6 required respondents to
state length of time they have been on the job. Question 7
asked for the length of time employees planned to stay on
the job. Question 7 was a key question as from the
responses we can tell who is likely going to turnover.
Questions 8, 10, and 11 tried to find out employees
perceptions of their job and department. Question 9
provided an opportunity for respondents to air their views
38

about how they want their jobs to be organized so they will
enjoy it. Questions 12 and 13 were to find out what
employees like or dislike about their job. Questions 14 and
15 tried to find out if employees have had any recognition
or promotion since they started work on their job. Question
16 was to determine job satisfaction. Question 17 was to
determine the size of the hotel. Question 18, 19, 20 and 21
tried to determine how many employees have worked somewhere
else, how long they lasted on the job and the type of duty
they performed at their previous job. Question 22 tried to
find out reasons for discontinuing work at the other hotels.
Questions 23-25, 29, and 30 tried to gather demographic data
that includes age, sex, marital status, and source of income
pertaining to respondents. Question 26 and 27 asked for
level of education and major respectively. Question 31
provided room for respondents to make suggestions as to what
things could be done to improve work conditions. Question
32 established respondents belief about sharing their
opinions .
Survey Administration
Following approval by the Hotel & Motel Association of
Rochester to conduct a survey at the various hotels, a
letter was sent to all the hotel managers that contained a
sample questionnaire. This was immediately followed by
phone calls to schedule an appointment to conduct the
39

survey. A copy of the letter is provided in Appendix A.
After setting a schedule, the survey was conducted from
the I0th-31st of July and by August 30th the survey
responses were returned.
Data Collection and Recording
Two hundred and forty- five questionnaires were mailed
out to the sample population and 108 were returned. Of this
number, 6 were rejected for the following reasons: two of
the hotels sent back only a copy each, and these were
responded to by a management staff not a housekeeping staff
as intended. The other four surveys had incomplete
information. In the final analysis, only 102 valid
responses were obtained. This is approximately a 42%
response rate.
Incoming data was entered on an SPSS data file.
Data Processing and Analysis
The imputed data was run on the SPSS frequency program
and cross -tabs. From this program the number of respondents
who responded with either a"yes"
or a"no"
to individual
questions could be determined.
At a later stage, cross -tabulation was done using SPSS.
This generated meaningful comparisons of responses. For
example, demographic variables which include age, sex,
marital status, level of education, and source of income
40

were cross -tabulated with variables such as length of time
respondents plan to stay on the job, reasons for terminating
previous job, motivation and likes and dislikes of their
job.
41

CHAPTER IV
Findings
This chapter will reveal the responses to the questions
as indicated by the population surveyed. Special note will
be made to such factors that cause job satisfaction and job
dissatisfaction and turnover rate at the time of the survey.
Later cross -tabulation results will be discussed.
The questionnaire and frequencies of responses is
provided in Appendix B.
In responding to question one, 41.2% of the respondents
said they received information through the ad; 22% through a
friend; and, 11% through either a relative or hotel
employee.
The results to question two which asked for multiple
responses are shown in Figure 5. It shows that 38.2% of the
respondents chose the job because it was the only job
available; 35% because of the flexible schedule; and 29.4%
because of medical and health benefits, while 24.5% choose
other: some said they needed extra money to spend in school
while others said they took their job so they can stay busy.
42

IT)
a>u
tiCn
H
O
CO
H
JZXi
tC-H
CO
O
o
JZ
u
rH
o
*4H
CO
co
w
fO
CD
CC
S 3 8

Question three asked for the length of time the
employee received training. The responses showed 80.4%
received training for one week; 31.4% one month; and, 7.8%
were trained for longer than one month.
The results of question four showed 68.6% of the
respondents received the proper training in line with what
the supervisor expected for their job performance.
Results to question five showed that response rate of
57.8% of employers did not always provide enough supplies
for employees to adequately perform their jobs.
In question six, 31.4% of the respondents have been on
the job for more than 2 years; 25% for 1-2 years; while 22%
of them have been on the job for less than 6 months and the
rest have been for 3-6 months.
In response to question 7, the majority of the
respondents plan to be on the job for 3 years or more.
Table 7 shows in more detail the length of stay on the job.
44

Table 7.
Planned Length of Stay on the Job
Length of Stay Percent of Respondents
6 months 25.5%
6 months to a year 10.8%
1 - 2 years 12.7%
3 years and above 51.0%
The responses to question 8 indicate that 67.6% of the
employees'
perceptions of their jobs met their expectations,
while 27.5% felt that their job was not as they initially
perceived it to be.
In question 9 respondents had to choose from a list of
things they felt could make their jobs easier. Results
showed that 53.9% of the respondents felt that more supplies
should be given; 29% indicated they wanted the amount of
work reduced; and the remaining responses were equally split
between"other"
and making the job less routine. Those who
chose"other" suggested that management provide them with
some form of transportation like bus services and some
wanted to work every other weekend.
In responding to question 10 an overwhelming majority
45

of 59.8% of the respondents felt that the housekeeping
department is considered important. The remaining 41.2%
didn 't regard the department as important .
Question eleven involved respondent's opinions on what
things could be done to improve the image of the department.
From the list provided, 43.1% indicated that management
should share in employee concerns; 39.2% indicated that they
wanted new uniforms; and, 37.3% wanted a nice locker room.
The respondents who indicated "other"suggested that hourly
employees be given the opportunity to work in other
departments of the hotel on a rotating basis.
Results for question 12 have been shown in Table 8.
According to the responses, results show that the best thing
about their job is working with colleagues. This reason was
chosen by 45.6% of the respondents while 43.1% indicated
that they like the job because of their flexible work
schedule; 26% liked their supervisors; and, 18.6% reflects
dissatisfaction with wages. Those who indicated "other"
said that what they liked about the job is the environment.
Some of the respondents said they liked the close proximity
between their homes and the hotel .
46

Table 8 .
Best Thing About the Job
Reasons Response Rate
Colleagues 45.1%
Flexible schedule 43.1%
Supervisor 26.5%
Training 21.6%
Insurance & retirement benefits 20.6%
Wages 18.6%
Other 15.7%
Responses to question 13 are shown on Table 9 . The
results show that the least liked thing about the job is
working weekends. This was indicated by 40.2% of
respondents, 29.4% said they did not like the wages. 15.7%
said the job was too routine. 13.7% complained of the work
pressure and 1% said they had very little training.
47

Table 9.
Worst Thing About the Job
Reasons Response Rate
Work weekends 40.2%
My wages 29 .4%
Routines of job 15.7%
The work pressure 13 . 7%
Little training 1.0%
In question 14, 69.6% of the respondents said they had
been recognized while the rest have never been recognized.
In question 15, 55.9% of the respondents indicated that
they have never been promoted while the rest have been
promoted.
Results to question 16 show that 36% of the respondents
like to be front desk clerks, 17% like to wait tables. The
rest of the respondents choose"other"
and indicated the
following things they like to be instead of working as house
keepers: general manager or a sales manager.
The results for question 17 are shown in Table 10 and
they show that 30.4% of the respondents work for hotels with
48

50-100 rooms while 25.5% said they worked for hotels with
100-200 rooms and 3% worked for hotels with 400 rooms and
over.
Table 10.
Size of Hotel
Hotel Size Response Rate
Under 50 rooms 2.9%
50 - 100 rooms 30.4%
100 200 rooms 25.5%
200 - 300 rooms 37.3%
400 rooms and over 3.9%
Responses for question 18 are shown in Figure 6 which
shows that 58.8% of the respondents had worked at another
hotel while the rest were working at the first hotel.
49

Figure 6 . Previous work experience
worked at another hotel
58.80%
working at a first hotel
41.20%
50

In question 19, the results show that 45% of the
respondents worked at a previous job for less than 6 months,
28% worked for 6 months to 1 year, 15% worked for 1-2 years.
and 11.7% had worked for 3 years and above.
In question 20, 55% of respondents indicate that on
their previous job they had worked for housekeeping while
16% had worked as housemen and the rest had worked as
waiters and banquet servers .
In responding to question 21, 41.6% of the respondents
indicated that they were working at a first hotel while the
rest said they worked somewhere else.
In question 22, 50% of the respondents indicated that
they quit their jobs because of low wages, 33% quit because
of their supervisors, and the rest quit because of no
motivational activities. Those who chose"other"
cited the
following reasons, lack of transportation and lack of a full
time job. These results are shown in Figure 7.
51

Figure 7. Those who quit
50.00%
Reason for quiting the job
Lowwages Your Transfer of No
supervisor spouse motivational
activities
Other
52

The responses to question 25 are shown in Figure 8 and
they indicate that 76.5% of employees are females while the
rest are males.
53

Figure 8 . Number employed by sex.
Employment by sex (Rochester)
80.00%76.50%
70.00%
60.00%
50.00%
40.00% -1
30.00% -
20.00%
10.00%
0.00%
Male Female
54
In question 24, results show that 46.1% of the
respondents are between the ages of 16 and 24, 20.6% are 41
years and above while the rest are between the ages of 25
and 40.
In question 25, results show that 46% of the
respondents are single and 42.2% are married while the rest
are either divorced or separated.
In question 26, 56.7% of the respondents indicated that
the source of income from this job is primary and for the
rest it is secondary. These results are shown in Figure 9.
55

Figure 9 . Income source.
Primary
56.74%
^, Secondary
43.26%
56

In question 27, 66.7% of the respondents indicated that
they have a high school education, 10% have a technical
school education and the rest either have a college
education or an 8th grade education.
The results for question 28 show that 23% of
respondents were business majors, 19.6% were hospitality
majors and 14.7% were home economics majors. Those who
chose"other" indicated other majors such as, nursing, arts
and computer science.
In question 29, 78.4% of the respondents said they
worked full time and the rest worked part time.
Results for question 30 showed that 51.1% of the
respondents have a working spouse.
In question 31, 54.9% of the respondents indicated that
they would like more help, 42.2% wanted more supplies and
29.4% wanted more wages.
Results for question 32 show that 79.4% of the
respondents believe that their suggestions on how to improve
work conditions will be accepted.
Table 11 shows the causes of turnover among the 58% of
respondents who had worked at other hotels.
57

Table 11.
Causes of Turnover Among the 58% Who Had Worked at Another
Property
Reasons
1 . Low Pay
2 . Supervisor
3. Transfer of Spouse
4 . Lack of Motivation
5 . Other
Percent of Employee Citings
50%
33.3%
5.0%
8.3%
3.4%
A further breakdown of the data shows the turnover rates
for Rochester. These are shown in Table 12 whose results
show that the age group with the highest number of turnover
is within the 18 -24 age range.
Table 12.
Turnover Rates at Rochester Among Those Who Had Worked at
Another Hotel
Age of Respondents Rate of Turnover
18-24
25-30
31-40
41 and above
46.6%
23.3%
16.7%
13.4%
58

When the total population survey was considered, it was
realized that many things were cited that cause job
dissatisfaction and can subsequently cause turnover. These
are shown in Table 13 . They also cited things that cause
satisfaction which are shown in Table 14.
Table 13.
Factors of Job Dissatisfaction
Frequency of Job dissatisfaction causes. Percent of
Employee Citing
1. Lack of upward mobility
2 . Working conditions
3 . Job security
4. Pay and benefits
5. Quality of Supervision
55.9%
55.8%
55.6%
50.0%
33.0%
59

Table 14.
Factors of Job Satisfaction
Frequency of Things that Percent of
Bring Satisfaction Frequency of Citing
1. Provide enough supplies
2 . Nice colleagues
3 . Flexible work schedules
4 . Share in employee concerns
5 . Attractive uniforms
53%
45. 5%
43. 1%
43%
39. 2%
Table 15 shows that the source of income is secondary
for more women than it is for men. 42.1% of women indicated
that this source of income from this job is secondary.
While for 10.8% of the men the income source is secondary.
60

Table 15.
Cross -Tab Source of Income by Sex
Male Female Total
Primary 12.7 31.4 44.1
Secondary 10.8 42.1 55.9
Number 24 78 102
Total % Of 23.5 76.5 100
Table 16 shows that most 18-24 year olds receive the
income from this job as a second source.
Table 16
<J_WOO J.O.J-' ^->^y
18-24 25-30 31-40 41+ Total
Primary
Secondary
Number
14.6
26.5
47
7.8
10.8
19
7.8
6.9
15
8.8
11.8
21
44.1
55.9
102
Total % 46.1 18.6 14.7 20.6 100
61

The source of income is secondary for most people
especially the married as show in Table 17. The income from
this job is secondary for 19.5% married people, 24% single
and 2% divorced.
Table 17.
Cross -Tab Source of Income by Marital Status
Married Divorced Widowed Single Total
Primary 12.8 3.9 5.9 21.6 44.1
Secondary 29.5 2.0 0 24.5 55.9
Number 43 6 6 47 102
Total % 42.3 5.9 5.9 46.1 100
Results seen in Table 18 show that more women are
likely to stay on the job past 3 years.
62

Table 18.
Cross -Tab Length of Stay on the Job by Sex
Sex
Less Than
6 Months
6 Months
to 1 year
1-2
Years
3 +
Years Total
Male
Female
Number
6.9
18.6
26
9.9
6.8
11
3.9
8.8
13
9.8
34.2
52
30.5
76.4
102
Total % 25.4 10.8 12.7 51.1 100
Table 19 shows that more women than men work full time.
Table 19.
Cross -Tab Sex by the Hours of Work
Part-Time Full -Time Total
Male 2.9 20.6 23.5
Female 16.7 59.8 76.5
Number 20 82 102
Total % 19-6 78.4 100
63

Table 20 shows that more men in the 18-24 age group and
41 and above age group would like more help than women
would .
Table 20
18-24 25-30 31-40 41+ Total
Yes
No
Number
24.5
21.6
47
8.8
9.8
19
7.8
6.9
15
31.7
6.9
21
54.9
45.1
102
Total % 46.1 18.6 14.7 20.6 100
Table 21 shows that more females want more supplies than
males. The females who need more supplies are in the age
group 18 to 24.
64

Table 21.
Cross -Tab More Supplies by Age
18-24 25-30 31-40 41+ Total
Yes 21.6 6.9 3.9 9.8 42.2
No 24.5 11.8 10.8 10.8 57.8
Number 47 19 15 21 102
Total % 46.1 18.6 14.7 20.6 100
Table 22 shows that 70.6% of the respondents do not even
care if wages are increased or not.
65

Table 22.
Cross -Tab Increase Wages by Age
18-24 25-30 31-40 41+ Total
Yes 16.7 4.9 2.9 4.9 29.4
No 29.4 13.7 11.8 15.7 70.6
Number 47 19 15 21 102
Total % 46.1 18.6 14.7 20.6 100
Table 23 tries to show the cross tabulation of two
variables, least liked thing about the job by those who quit
a previous job. Results show that most people do not like
to work weekends .
66

m
CN
cu
iH
X!rci
XIO
i^
CQ
flo
>CD
iH
CU
rt
-H
o
o
CD
CQ
o
flEh
>X)
XIo
U
tio
a&a-H
.a
Eh
cu
x-H
U
CQ
ctS
CD
I-H
.Q
riEh
I
CQ
CQ
OU
a
ri4->
O
H
Cn
fla) -H
rH fl4-> -H
XJ rci
H M
J Eh
(1)
H
flOQ
^ CQ
u CD
o 5H
is cu
cn
CD
Cn
i
cq cu
-H fl-H
^ U
rH flo oS2 PcS
CQ
o
flCD
^^H CD
O CTJ
vo
c^ CN CN O
vo n o o
H H
o
o
o
0
H
H CN ro ro
H a
C m CN
H
H CN C^ ro
. ro o
VO o VD
CN H m
ro o m ro
0 0 H
oo in ro
H
H o > H
ro
tn CN >
CN H ro
CQ
CT} ii
Xi flfl cu
CD -o
-o flfl o
o &ft CQ
cn cu
0)
OSo\
t-i
o rH
CQ u
CD O o o
>H s s Eh
l>
vo

CHAPTER V
Conclusions and Recommendations
The purpose of this study was to determine reasons for
employee dissatisfaction and consequently turnover among the
housekeeping employees .
The results show that turnover in this department will
remain high for these reasons:
Many people took the job just because it was the only
job available (38.2%) as opposed to the rest who chose the
job for several other reasons may imply that, respondents
don't really see this job as one they hope to stay at. This
means if they, in the future, find something better they
will quit.
Only 51% of the respondents indicated they would stay
on the job for 2 years or more which means the rest will
quit either within 6 months or one year; so, it is very
likely turnover will continue to be on the rise.
Another point of importance is that most of the
employees for the department are within the 18-24 age range.
Due to the fact that the population of this age group is on
a decline, there is going to be a labor shortage.
Respondents who have worked at other hotels have
indicated that they left their other jobs because of low
wages this means that if the present wages are not
satisfactory, its very likely they will quit too. Even when
68
the total sample population was also considered it was seen
that wages was a problem. Almost everyone seemed
dissatisfied with their wages.
54.9% of the sample population indicated that there
were poor working conditions resulting from quality of
supervision, lack of recognition, too much work, and
shortage of supplies is an indication of dissatisfaction
which if not controlled, can result in turnover.
43 . 1% of the sample population have never had any
promotion makes them not to consider the job as one they can
hope to have growth opportunities.
The assumption about turnover being related to wages
appeared to be true when the population that had worked at
another hotel is considered. This could be seen from their
responses and from cross -tabulations. Even when the whole
population is considered wage is problem that causes
dissatisfaction.
The assumption that employees liked their job because
of medical insurance and health benefits was not in time
with what respondents indicated. A majority indicated that
they liked the job because of their colleagues.
It was also assumed that a majority of employees will
not stay longer than one year on the job. This doesn't
appear to be true because about 73% of the population plan
to stay on the job for a year and more and 56.9% have
alreadybeen on the job for more than a year.
69

The assumption that employees are dissatisfied with
their job because of the work pressure, lack of upward
mobility, quality of supervision, and lack of concern for
employee concerns appear to be true for the following
reasons. In responding to questions about job satisfaction
most of them indicated they would be satisfied if the amount
of work was reduced and enough supplies provided, if the
quality of supervision were improved and if management
provided opportunities for career growth and shared in their
concerns. All the above points are in line with what was
discussed in the literature which means that if management
tries to meet these needs turnover can be greatly reduced.
Recommendations
Due to the fact that a majority of respondents
indicated that they liked their job because of their
colleagues, it is important for supervisors and management
to understand this and be sure to create a positive
environment for the employees, one in which people can be
encouraged to work with the team members they like.
A majority of the respondents indicated that they got
word about their job opening from the ad. This would be a
good source so management should use it most of the time.
From responses to the question on wages, a majority of
respondents indicated a dissatisfaction with wages. It
might be a good idea for management to address the issue and
70

it might even be worthwhile developing the pay strategy used
by one hotel . Here employees were paid by the room instead
of by the hour. This was discussed in the literature.
From the survey conducted and the literature read, it
was seen that turnover was very high among the age group18-
24. This means that it might be a better idea to employ
more older people than they have been doing.
Providing child care to mothers will be a very good
thing for management to do as this will further reduce
turnover .
Respondents showed a lot of concerns about working
conditions and it shouldn't be over- emphasized that
management should supply employees with the supplies they
need so as to improve working conditions.
I would recommend further research studies to be done
in this area especially at the national level so it becomes
possible to compare the results of individual areas of the
U.S. studied.
Qualitative research can uncover dimensions of an issue
and relevant factors for further study. Scherer, M.J.
(19 86) studies have been done on turnover in some hotels but
as of the moment there seems to be no information on that at
the national level; so, it's not really possible to make
manycomparisons to see if factors that influence turnover
in one geographic area hold true for other parts of the
country. Research could be done to determine the needs of
71

housekeeping employees in hotel establishments. This could
give highlights where supervisors and management could
effectively focus their skills and management techniques to
satisfy these employees and curb turnover.
Further research in this field needs to be done. In
carrying out further reasearch in this field, it would be
recommended that a better questionnaire be designed to
permit other tests like the T-test or chi-squared to be
done.
72
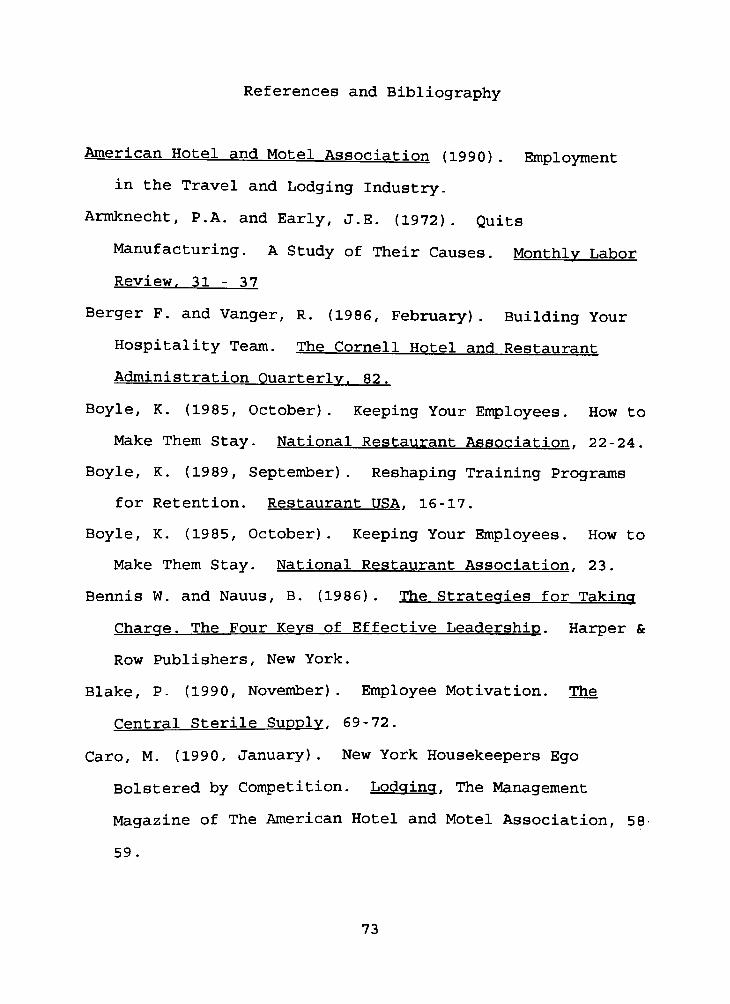
References and Bibliography
American Hotel and Motel Association (1990) . Employment
in the Travel and Lodging Industry.
Armknecht, P. A. and Early, J.E. (1972) . Quits
Manufacturing. A Study of Their Causes. Monthly Labor
Review. 31 - 3 7
Berger F. and Vanger, R. (1986, February). Building Your
Hospitality Team. The Cornell Hotel and Restaurant
Administration Quarterly. 82.
Boyle, K. (19 85, October) . Keeping Your Employees. How to
Make Them Stay. National Restaurant Association. 22-24.
Boyle, K. (19 89, September) . Reshaping Training Programs
for Retention. Restaurant USA. 16-17.
Boyle, K. (1985, October) . Keeping Your Employees. How to
Make Them Stay. National Restaurant Association. 23.
Bennis W. and Nauus, B. (1986) . The Strategies for Taking
Charge. The Four Keys of Effective Leadership. Harper &
Row Publishers, New York.
Blake, P- (1990, November) . Employee Motivation. The
Central Sterile Supply. 69-72.
Caro, M. (1990, January). New York Housekeepers Ego
Bolstered by Competition. Lodging . The Management
Magazine of The American Hotel and Motel Association, 58
59.
73

Brooks, M. (1989, February). Using Employment Applications
to Screen New Hires. The Cornell Hotel and Restaurant
Administration Quarterly. 69-72.
Bureau of National Affairs (BNA) . (1983, March). A Report
on Job Absence and Turnover. BNA Quarterly.
Cichy, R. and Mark, C. (1989, May). Training a Proven
Strategy to Refer Housekeeping Staff. Lodging
Hospitality. 49-53.
Daniel, S. (1986). Employee Voice and Employee Retention.
Academy of Management Journal . 488-502.
Demico, F. and Reid, R. (1988, May) . Older Workers - A
Hiring Resource for the Hospitality Industry.
The Cornell Hotel and Restaurant Administration
Quarterly.
Ensman, R. (1990, October) . Restaurant USA.
East, L. (1982) . Reducing Employee Turnover. Educational
Institute of American Hotel and Motel Association.
Elder, M. (1987, September) . How to Find and Retain
Workers. Restaurant Business.
Evans, J. (1987) . Factors in Dramatic Turnover Reduction.
Lodging .Official Publication of the American Hotel and
Motel Association.
. (1988, October) Eight Reasons Why
Managers Exit. Nation's Restaurant News. F26.
Fitzenjac, (1990) . Getting and Keeping Good Employees.
Personnel Journal, 25-28.
74

Graen, G. and Johnson, T. (1973) . Role Assimilation Process
in a Complex Organization. Journal of Vocational
Behavior. 395-420.
Gordon, G. (1990) . Brakes for the Revolving Door. The
Executive Journal. 42-43.
Hinrichs, J. (1980) . Controlling Absenteeism and Turnover.
Scarsdale New York, Work in American Institute, Inc.
Herbick, T. (1990) . Cure Housekeeping Headaches with
Contract Labor Services. Lodging. Official Publication
of the American Hotel and Motel Association, 27.
Herlog, J. (1990, October) . Motivating Employees.
Restaurant USA. 18-22.
Hiemstra, S. and Lee, K. (1984). Manpower Resources and
Trends in the Lodging Industry: Past and Future. Travel
and Research Foundation.
John, L, and Jeffery, M. (1986, November). Employee
Turnover: An Analysis and Review with Implications for
Research. American Management Association Review, 55-70.
Kappa, M. (1990, February). Employee Turnover: An Analysis
and Review with Implications for Research. American
Management Association Review. 55-70.
Kirwin, P. (1990, November). Hotel Operations: A Cost
Saving Approach to Housekeeping. The Cornell Hotel and
RestaurantAdministration Quarterly. 25.
75

Kirwin, P. (1990) . Hotel Operations, A Cost Saving Approach
to Housekeeping. The Cornell Hotel and Restaurant
Administration Quarterly. 25-27.
Lathan, G.P. and Wexley, K.N. (1981). Increasing
Productivity Through Performance Appraisal . Reading
Massachusetts: Adison Wesley -
Leonidas, C. (1988). Herzberg's Proposal and Their
Applicability to the Hotel Industry. The Journal of
Hospitality Education and Research. 67-77.
Lewis, C. (1990) . Feedback Improves Performance.
Restaurant USA.
Lewis, J., and Minor, F. (1984). Human Resource Management
Food Service Systems Management. 206-208.
Leposky, G. (1987) . Recruit and Retain New; Strategies.
Lodging, Official Publication of the American Hotel and
Motel Association.
Leposky, G. (1987, March). Tapping New Labor Sources.
Lodging, Official Publication of the American Hotel and
Motel Association.
Lima, T. (1989. February). Housekeepers go for the Goal.
Lodging Hospitality.
March, J., & Simon, H. (1958). Organizations. New York:
Wiley, 100.
Mobley, W. (1982) .Employee Turnover Causes Consequences
and Control. aHHH son Wesley Publishing Company.
76

(1988) Mothering a Grand Resort.
Lodging, 39-40.
National Restaurant Association (NRA) (1990) . Food Service
and Labor Shortage.
. Existing House Sales. National
Association of Realtors.
Peter, D. (1974) . Management Tasks and Responsibilities.
Practice. New York: Harper & Row, 567.
Robert, C.L., et.al. (1986). The Practice of Hospitality
Management . pp. 281-283.
Scherer, M. (1986) . Values in the Creation Prescription and
Use of Technological Aids and Assistive Devices for
People with Physical Disabilities. University of
Rochester. New York on Microfilm International.
Skinner, E. (1969) . Relationships Between Leadership
Behavior Patterns and Organizational Variables. Personnel
Psychology.
Stevens, B. (1991, August) . Six Ways to Reduce Turnover.
Restaurant USA, 23-24.
. (1990) The Rochester Chamber of
Commerce, 10-24.
U.S. Department of Commerce, Bureau of the Census (1986).
State Government Finances. Washington. DC.
U.S. Bureau of Labor Statistics (1990). Employment and
Earnings. Washington. DC. Department of Labor.
77

Wasmuth, W. and Stanley, D. (1983, May). Why Employees
Leave. The Cornell Hotel and Restaurant Administration
Quarterly -
Wasmuth, W. and Stanley, D. (1982) . Strategies for Managing
Turnover. The Cornell Hotel and Restaurant
Administration. 65-80.
Wagner, G. (1990, September). Piecework Enhances
Productivity. Lodging Hospitality. 54-55.
Woods, R. and Macaulay, J. (1989, May). The Cornell Hotel
and Restaurant Administration Quarterly. 79 .
Zelinsky, M. (1989) . A Spotless Program, A Building Service
Firm Cleans up its Turnover Rate. Personnel Journal 10-
13.
Zembe, R. and Davis, S. (1989). The Service Edge. 101
Companies that Profit from Customer Care. Penguin Books
Canada Limited, Markham Ontario.
78

RIT
Appendix a
Rochester Institute ofTechnology
School ofFood, Hotel and
Travel Management
Department ofGraduate Studies
George Eastman BuildingPost Office Box 9887
Rochester, NewYork 14623-0887
716-475-5666 Fax 716-475-5099
July 12, 1991
Dear General Manager,
Thank you for taking time out of your busy schedule to address this matter of importance. Two research
studies are being sponsored by the School of Food, Hotel and Travel Management at the Rochester
Institute of Technology and they are being supported by the Rochester Hotel and Motel Association.
These projects are a hotel operation study focusing on the training of front desk agents and the relative
effects training has on employee retention, and a housekeeping study focussing on employee
satisfaction and turnover.
We would appreciate it if your hotel would participate in these studies. The first stage involves two
questionnaires, one each to be completed by the front desk agents, the front desk manager and the
housekeeping staff. All appointments to administer these studies will be made at your convenience. All
participant responses will be held in the strictest confidence. Completion of the questionnaires should
take no more than five minutes. Upon request, the results of these studies can be shared with hotels that
participate.
Enclosed are copies of the questionnaires for your review. We will call you to confirm your participation
and to arrange a mutually convenient time to conduct these important studies. If you have any question
regarding the studies, or the intent of this research, please contact our faculty advisors, Dr. Edward
Stockham, at (716) 475-5666 or Mr. David Crumb at (716) 475-2355.
Sincerely
iAA.iCc^]Gc^OIftcv
Edward Stockham, Ph.D.
Department of Graduate Studies
Enclosure
xc: Front Office Manager
Front Desk Manager
Housekeeping Manager
Monica Tembi
Research Assistant
79

Appendix s
Housekeeping Employee Questionnaire.
Thank you for taking the time to answer this questionnaire. The objective is to evaluate the needsof the employees and the resons for turnover in the Rochester hotels. We ask that you take a few
moments to complete this questionnaire because your input is of tremendous importance to thestudy. Your responses will be held in strictest confidence. Please circle the responses for each
question. Once again thank you for your cooperation.
1 . How did you leam about this job? (choose all that applies.)
A) Job advertisement.
B) Through a friend.
Q A relative.
D) A hotel employee.
E) Other please specify
2. Why did you choose to work for housekeeping? choose all that applies
A) Free employee meals.
B) Free uniforms.
C) This was the only job available.
D)Medical/ health benefits.
E) Flexible work schedule.
F) Good wages.
G) Other please specify .
3. How long were you trained for the job?
A) One week
B) Onemonth
C)More than a month.
4. Is there a difference between what you were trained to do and what your supervisor expects
you to do?
A)Yes 32 31.4
B) No 70 68.6
5. Do you always have enough supplies.
A)YesB)No
6. How long have you been on this job?
A) Less than 3 months.
B) 3 months to 6 months.
C) 1-2 yrs.
D) 2 yrs and above.
7. How long do you plan to be on this job?
A) 6 months.
B) 6 months to 1 yr.
C) 1-2 yrs.
D) 3 yrs and above.
Frequencies Valid*;
42 41.2
23 22.5
16 15.7
12 11.8
21 20.6
t applies.
8 7.8
7 6.9
39 38.2
30 29.4
36 35.3
20 19.6
25 24.5
82 80.4
12 31.4
8 7.8
42
59
41.2
57.8
23
21
26
32
22.5
20.6
25.5
31.4
26
11
13
52
25.5
10.8
12.7
51.0
80

Frequencies Valid %
8. Is the job what you thought it was before you came in?
A)Yes 68 67.6
B) No 28 27.5
9. How do you think your job could be made easier? ( choose all that applies.)
A) Provide enough supplies. 55 53.9
B) Reduce amount of work. 30 29.4
C)Make the job less routine. 22 21.6
D) Assign a specific amount ofwork per day. 25 24.5
E) Other please specify . 25 24.5
10. Do you feelHousekeeping is recognized as an important department in this hotel ?
A)Yes 61 59.8
B) No 41 40.2
11. In your opinion what can be done to improve the image of this department?
( choose all that applies.)
A) Provide a nice locker room. 38 37.3
B) Allow all employees to come in through front door. 22 21.6
C) Change uniforms. 40 39.2
D) Share in employee concerns. 44 43. 1
E) Other please specify . 30 29.4
12. What do you like best about your job? ( choose all that applies.)
A) Flexible work schedule. 44 43 . 1
B)My wages. 19 18.6
Q Insurance and retirement benefits. 21 20.6
D)My supervisor.27 26.5
E)My colleagues.46 45.5
F) The training I received.22 21.6
G) Other please specify16 15.7
13. What do you like the least about your job? ( choose only one.)
A)Working weekends.37 36.3
B) The work is too routine.J
JJ'
C)My wages.3 35.3
D) The work pressure.l* li'
E)Very little training.1 * u
14 Have you ever been recognized for good work sinceyou started work at this hotel?
AWeQ71 69.6
B) No2y Z8-4
15 Have you had a promotion since you started workinghere?
A>Ycs57 55 9
B) No57 D:>y
81

3 2.9
31 30.4
26 25.5
38 37.3
4 3.9
Frequencies Valid %16. Given the opportunity what other job would you choose as opposed to housekeeping at this
hotel?
A) Front desk clerk. 37 36
B)Waiting tables. 18 17.6
Q Receiving clerk. 2 2.0
D) Front line cook. 4 3.9
E) Other please specify 41 40.2
17. What is the size of the hotel?
A) Under 50 rooms.
B) 50 - 100 rooms.
C) 100 - 200 rooms.
D) 200 - 300 rooms.
E) 400 rooms and over.
18. Have you worked at another hotel in Rochester before? ( If yes, answer question 19 - 22. If
No, skip to question 23.)A)Yes 60 58.8
B)No 42 41.2
19. If yes, how long were you on your other job?
A) Less than 6 months. 27 45.0
B) 6 months to one year. 17 28.3
C) 1-2 yrs. 9 15.0
D) 3 yrs ormore. 7 11.7
20. What was your job at the other hotel?
A) Housekeeping. 33 55.0
B)Waiter /Waitress. 4 6.6
C) Banquet server. 5 8.3
D) Steward. 8 13.3
E) Houseman. 10 16.0
21 . How many hotels including this one have you worked for ?
A)l 25 41.6
B)2 12 20.0
C)3 21 35.0
D) 5 or more2 3.4
22. Why did you leave your previous job?
A) Low pay.
B) Your supervisor.
C) Transfer of spouse.
D) No motivational activities. 5 8.3
E) Other please specify ___.
2 3.4
30 50.0
20 33.3
3 5.0
23 lam A)Male. 24 23.5
B) Female. 78 76.5
82

24. My age is between,A) 18 - 24.
B) 25 - 30.
C)31-40.
D) 41 and above.
25. What is yourmarital status?
A)Married.
B) Divorced.
C)Widowed.
D) Single.
E) Separated.
26. What source of income is your job in your family unit?
A) Primary.
B) Secondary.
27. The highest level of education I have achieved is,
A) High school degree.
B) Technical school degree.
C) Two year college.
D) Four year college.
E) Other please specify. .
28. What was your major.
A) Hospitality.
B) Business.
C) Home Economics.
D) Other please specify.
29. Are you working,
A) part time?
B) Full time?
30. Is your spouse also working?
A)YesB)No
Frequencies Valid 91
47
19
15
21
46.1
18.6
14.7
20.6
43
6
6
47
0
42.2
5.9
5.9
46.1
0.0
45
55
41.1
53.9
68
11
6
4
13
66.7
10.8
5.9
3.9
12.7
20
24
15
42
19.6
23.5
14.7
41.2
20
80
19.6
78.4
48
46
51.1
48.9
31. I would suggest the following changes to be made to improve the workingconditions in the
housekeeping department, (choose all that applies)
A)More help56 54.9
B) More supplies 43 42.2
C) Increase wages 30 29.4
32. I believe that my suggestions and opinion will be used toimprove the working conditions of
the housekeeping department.
A) Yes 81 79.4
B) No 21 20.6
83
Related Documents