Page | 1 Employee Morale Survey July 2020 Campus Dates Recipients Responses Response Rate May 2020 13,950 5,686 41% July 2020 13,950 4,270 31% How are you feeling in general? (Campus May vs. July)

Welcome message from author
This document is posted to help you gain knowledge. Please leave a comment to let me know what you think about it! Share it to your friends and learn new things together.
Transcript
Page | 1
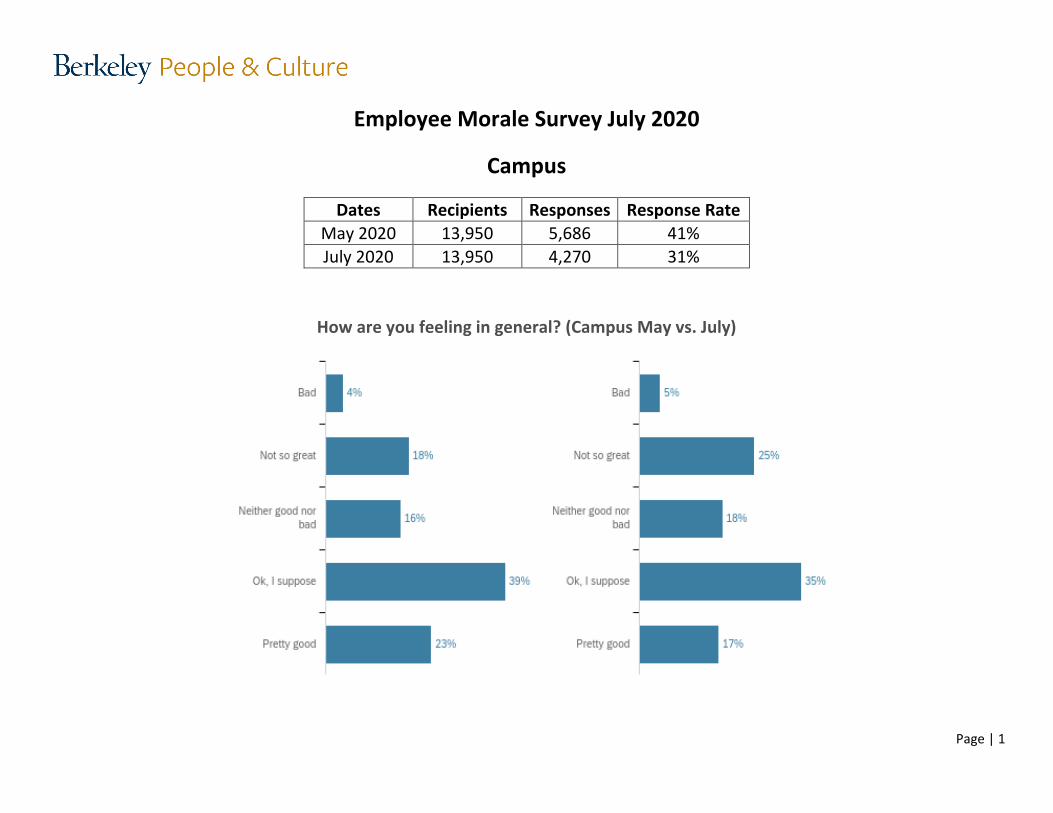
Employee Morale Survey July 2020
Campus
Dates Recipients Responses Response Rate May 2020 13,950 5,686 41% July 2020 13,950 4,270 31%
How are you feeling in general? (Campus May vs. July)
Page | 2
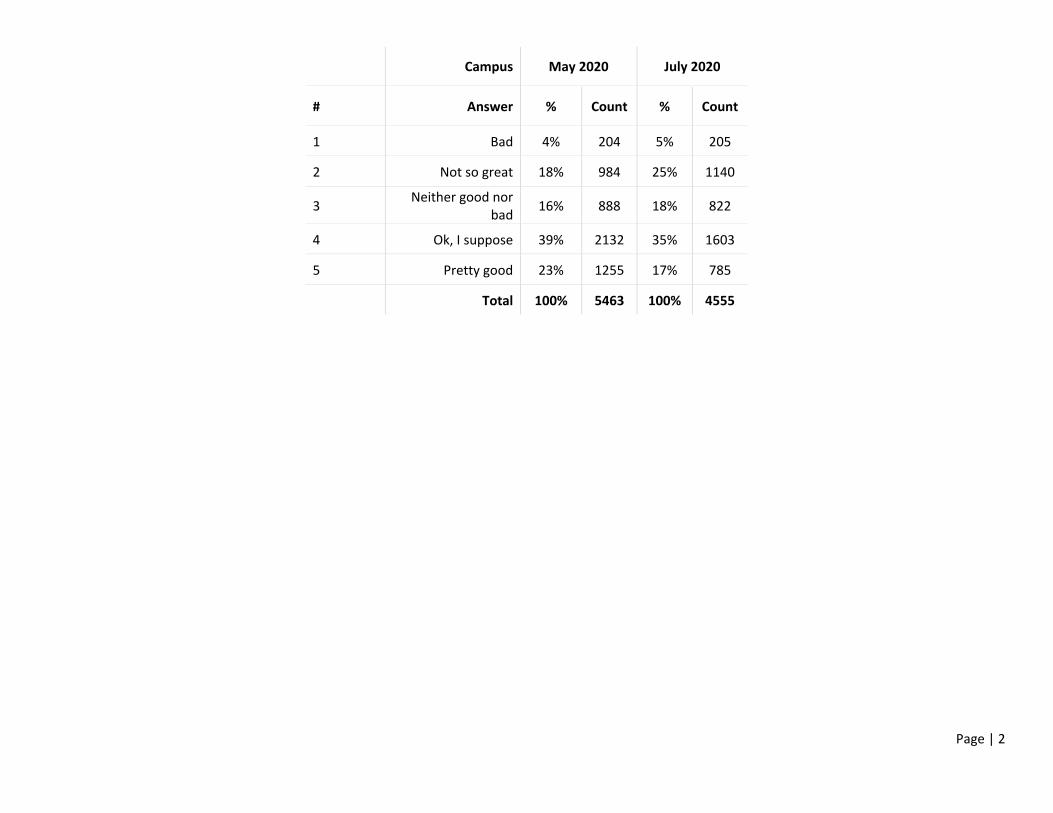
Campus May 2020 July 2020
# Answer % Count % Count
1 Bad 4% 204 5% 205
2 Not so great 18% 984 25% 1140
3 Neither good nor bad 16% 888 18% 822
4 Ok, I suppose 39% 2132 35% 1603
5 Pretty good 23% 1255 17% 785
Total 100% 5463 100% 4555
Page | 3
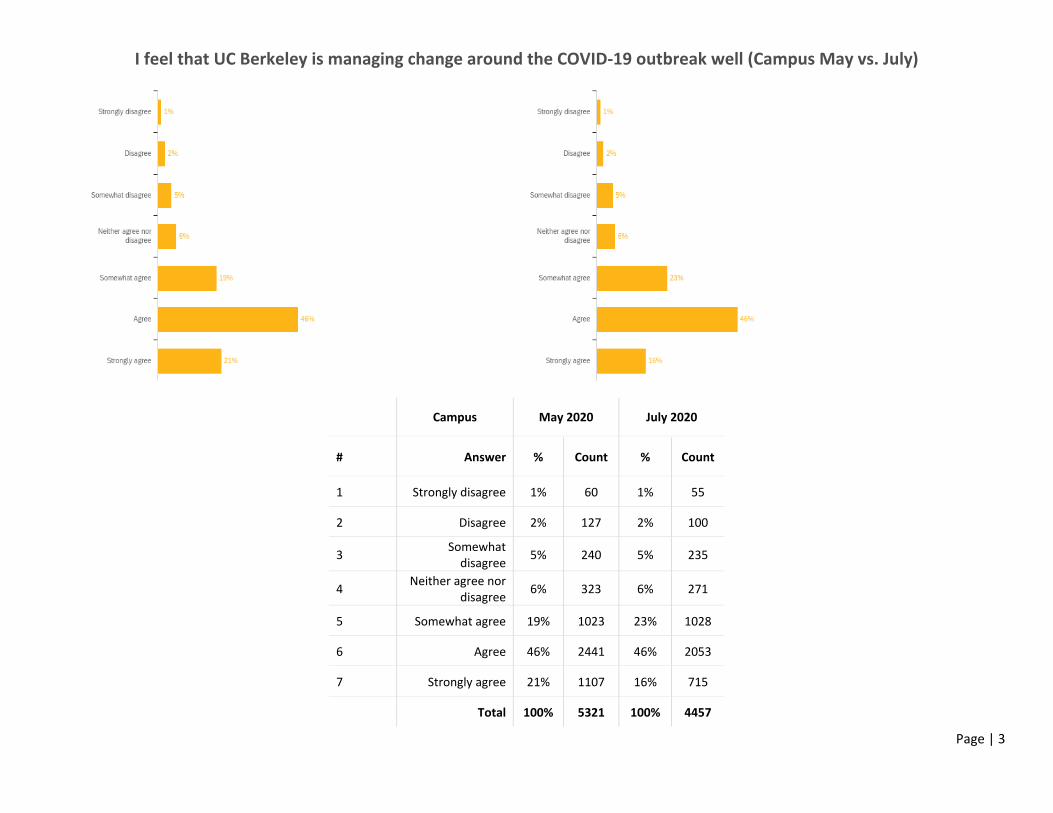
I feel that UC Berkeley is managing change around the COVID-19 outbreak well (Campus May vs. July)
Campus May 2020 July 2020
# Answer % Count % Count
1 Strongly disagree 1% 60 1% 55
2 Disagree 2% 127 2% 100
3 Somewhat disagree 5% 240 5% 235
4 Neither agree nor disagree 6% 323 6% 271
5 Somewhat agree 19% 1023 23% 1028
6 Agree 46% 2441 46% 2053
7 Strongly agree 21% 1107 16% 715
Total 100% 5321 100% 4457

Page | 4
I feel that UC Berkeley is communicating change around the COVID-19 outbreak well (Campus May vs. July)
Campus May 2020 July 2020
# Answer % Count % Count
1 Strongly disagree 1% 78 1% 57
2 Disagree 3% 149 2% 108
3 Somewhat disagree 6% 309 5% 233
4 Neither agree nor disagree 5% 265 5% 221
5 Somewhat agree 19% 991 21% 915
6 Agree 44% 2334 47% 2072
7 Strongly agree 22% 1178 19% 837
Total 100% 5304 100% 4443

Page | 5
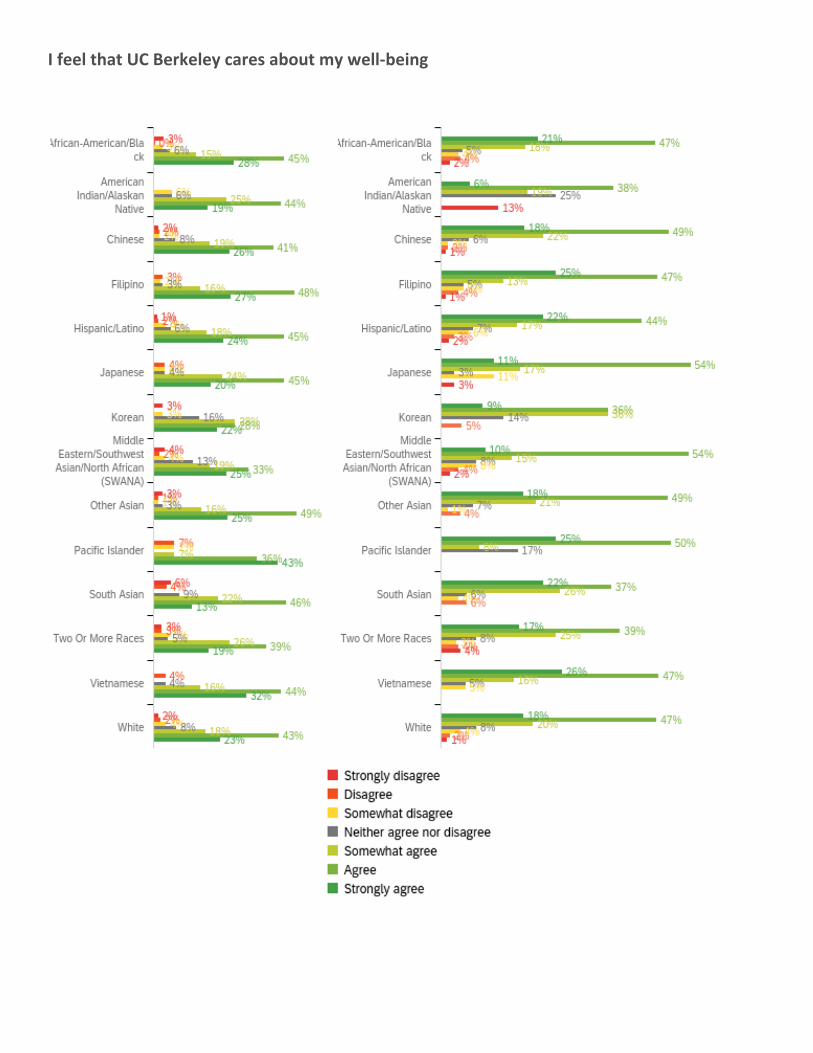
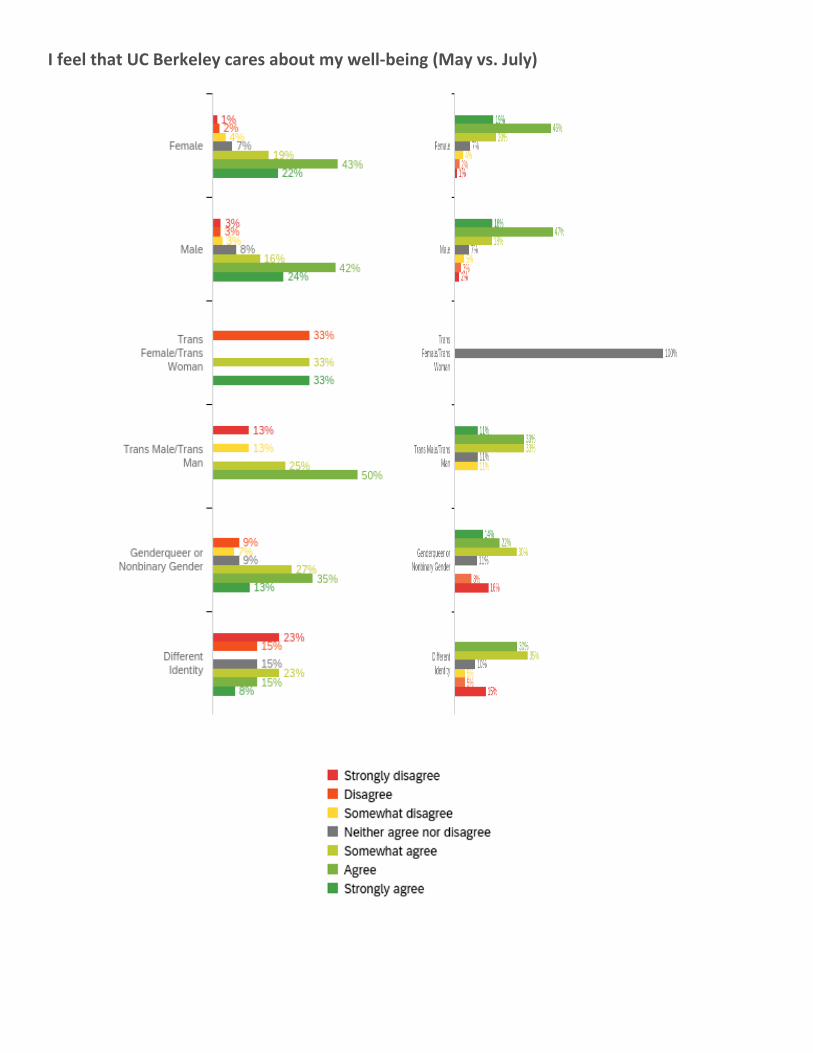
I feel that UC Berkeley cares about my well-being (Campus May vs. July)
Campus May 2020 July 2020
# Answer % Count % Count
1 Strongly disagree 2% 123 2% 92
2 Disagree 3% 160 3% 130
3 Somewhat disagree 5% 254 5% 212
4 Neither agree nor disagree 8% 448 8% 357
5 Somewhat agree 19% 985 20% 885
6 Agree 42% 2204 45% 2000
7 Strongly agree 21% 1129 17% 764
Total 100% 5303 100% 4440
Page | 6
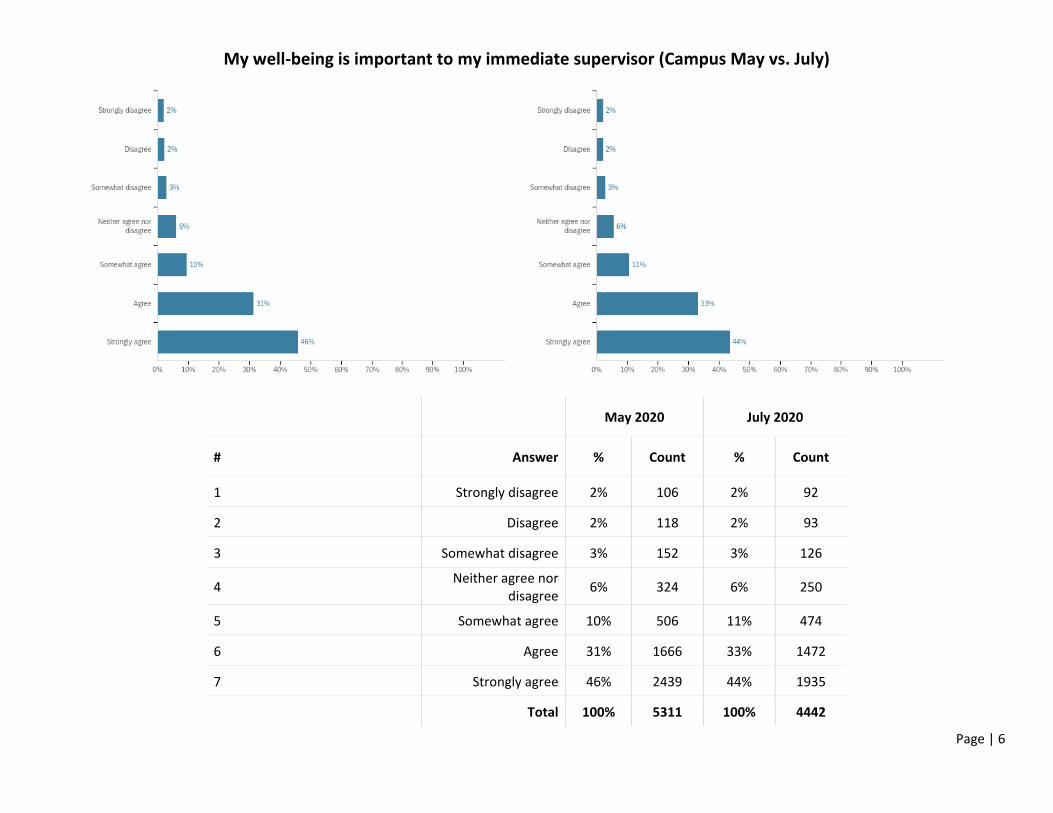
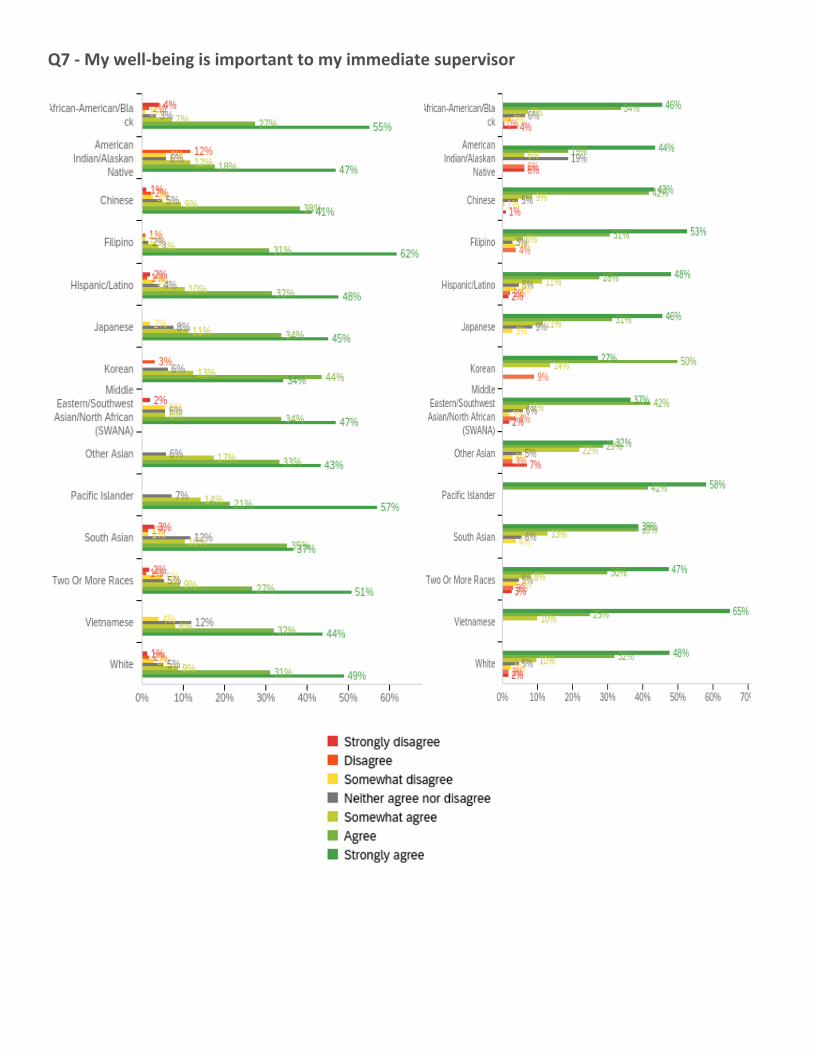
My well-being is important to my immediate supervisor (Campus May vs. July)
May 2020 July 2020
# Answer % Count % Count
1 Strongly disagree 2% 106 2% 92
2 Disagree 2% 118 2% 93
3 Somewhat disagree 3% 152 3% 126
4 Neither agree nor disagree 6% 324 6% 250
5 Somewhat agree 10% 506 11% 474
6 Agree 31% 1666 33% 1472
7 Strongly agree 46% 2439 44% 1935
Total 100% 5311 100% 4442
Page | 7
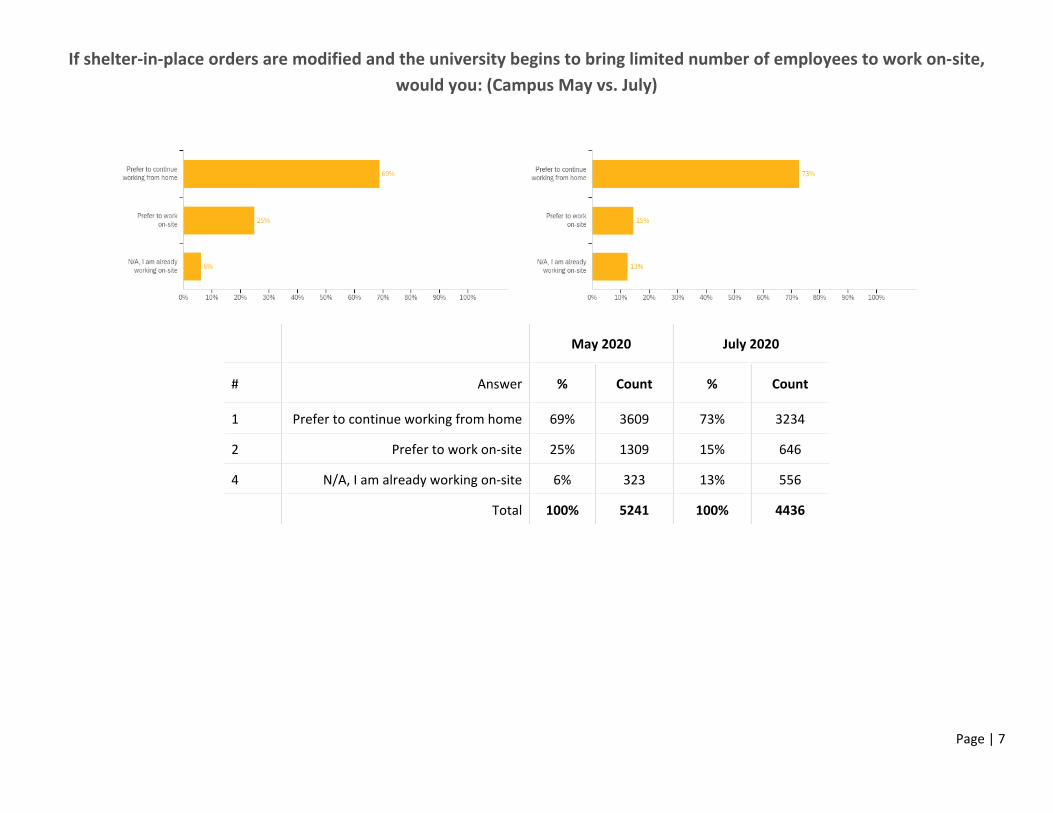
If shelter-in-place orders are modified and the university begins to bring limited number of employees to work on-site, would you: (Campus May vs. July)
May 2020 July 2020
# Answer % Count % Count
1 Prefer to continue working from home 69% 3609 73% 3234
2 Prefer to work on-site 25% 1309 15% 646
4 N/A, I am already working on-site 6% 323 13% 556
Total 100% 5241 100% 4436
Page | 8
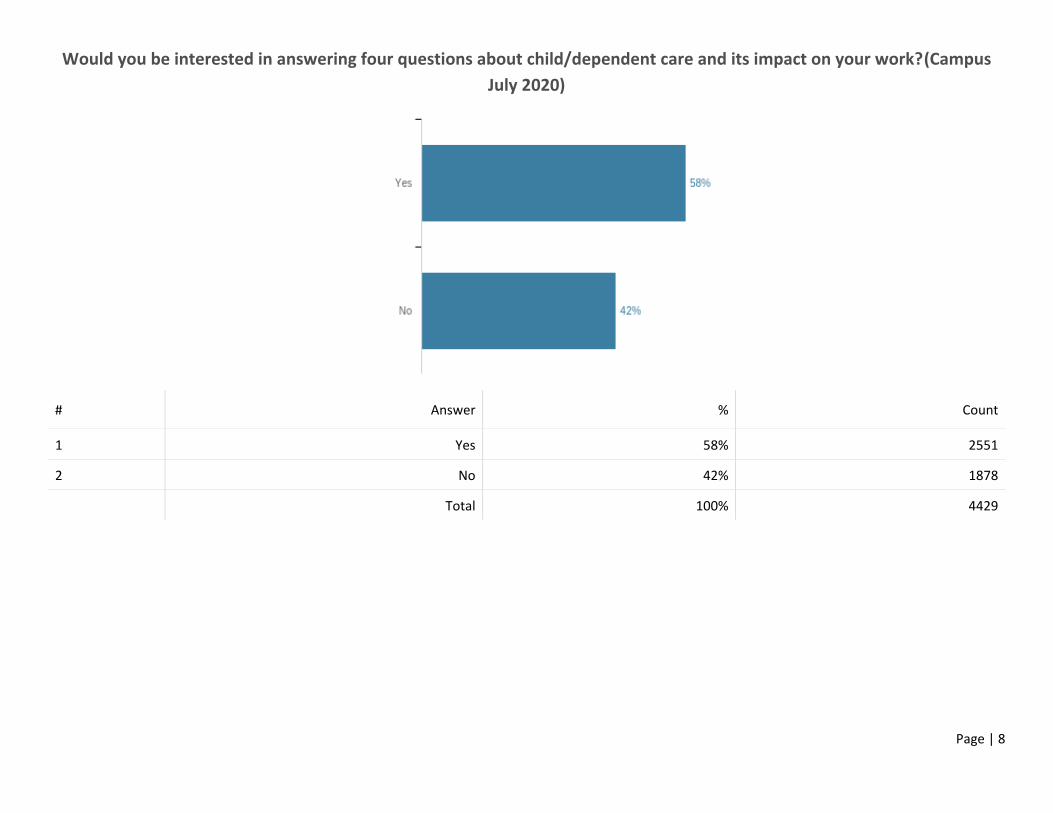
Would you be interested in answering four questions about child/dependent care and its impact on your work? (Campus July 2020)
# Answer % Count
1 Yes 58% 2551
2 No 42% 1878
Total 100% 4429

Page | 9
How many more hours per week do you personally spend on caregiving (childcare, caring for adult dependents) during what would be your normal working hours compared to prior to the shutdowns and shelter-in-place restrictions imposed
by public health officials? (Campus July 2020)
Page | 10
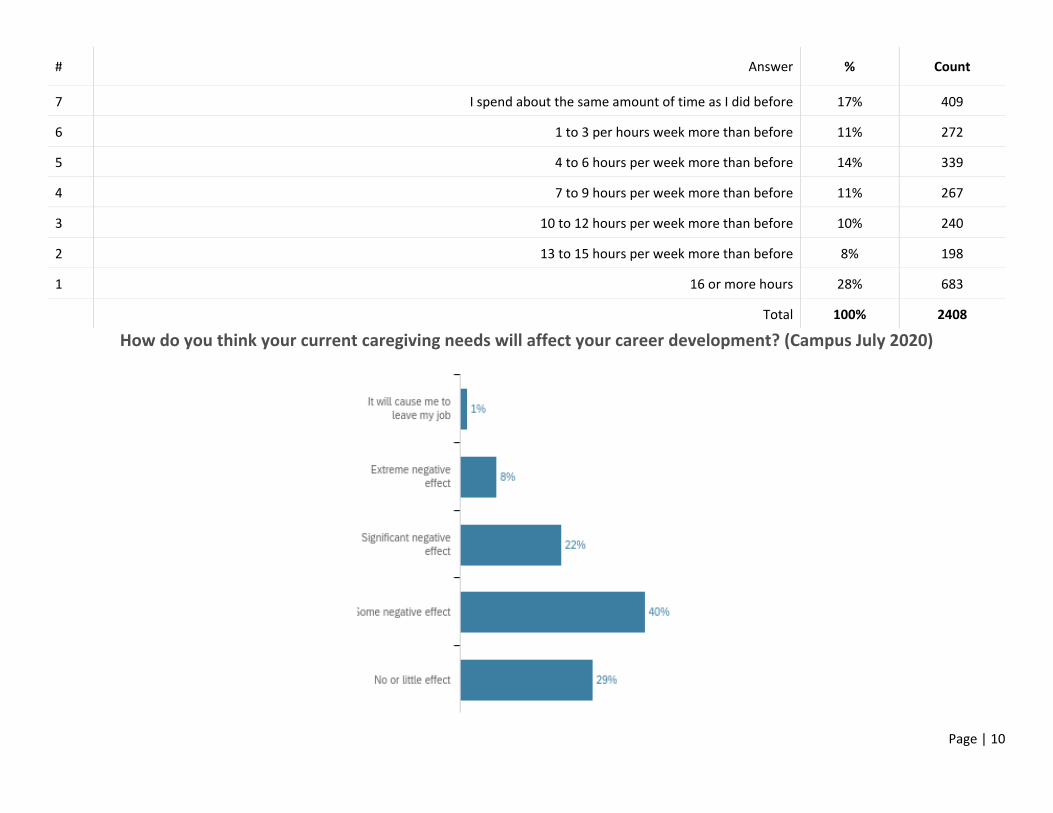
# Answer % Count
7 I spend about the same amount of time as I did before 17% 409
6 1 to 3 per hours week more than before 11% 272
5 4 to 6 hours per week more than before 14% 339
4 7 to 9 hours per week more than before 11% 267
3 10 to 12 hours per week more than before 10% 240
2 13 to 15 hours per week more than before 8% 198
1 16 or more hours 28% 683
Total 100% 2408
How do you think your current caregiving needs will affect your career development? (Campus July 2020)

Page | 11
# Answer % Count
5 No or little effect 29% 691
4 Some negative effect 40% 966
3 Significant negative effect 22% 527
2 Extreme negative effect 8% 188
1 It will cause me to leave my job 1% 33
Total 100% 2405
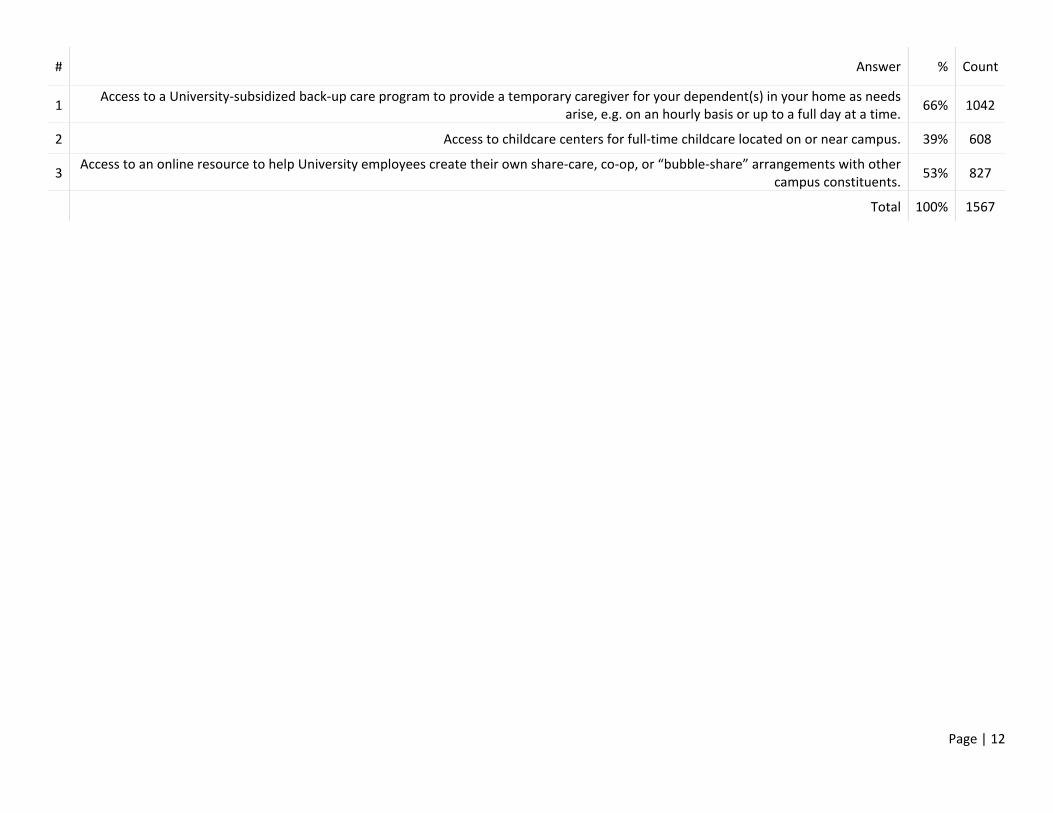
Which of the following services would you be likely to use if the University were to make it available (check all that apply)?
Page | 12
# Answer % Count
1 Access to a University-subsidized back-up care program to provide a temporary caregiver for your dependent(s) in your home as needs arise, e.g. on an hourly basis or up to a full day at a time. 66% 1042
2 Access to childcare centers for full-time childcare located on or near campus. 39% 608
3 Access to an online resource to help University employees create their own share-care, co-op, or “bubble-share” arrangements with other campus constituents. 53% 827
Total 100% 1567

Page | 13
(Optional) Please select your ethnicity:
May 2020 July 2020
# Answer % Count % Count
1 African-American/Black 6% 231 7% 220
2 American Indian/Alaskan Native 0% 16 0% 16
3 Chinese 6% 239 6% 198
4 Filipino 3% 125 3% 103
5 Hispanic/Latino 11% 430 11% 361
6 Japanese 1% 52 1% 35
7 Korean 1% 32 1% 22
8 Middle Eastern/Southwest Asian/North African (SWANA) 1% 52 2% 52
9 Other Asian 2% 67 2% 73
10 Pacific Islander 0% 14 0% 12
11 South Asian 2% 68 2% 54
12 Two Or More Races 7% 280 7% 236
13 Vietnamese 1% 25 1% 20
14 White 59% 2368 58% 1954
Total 100% 3999 100% 3356
Page | 14
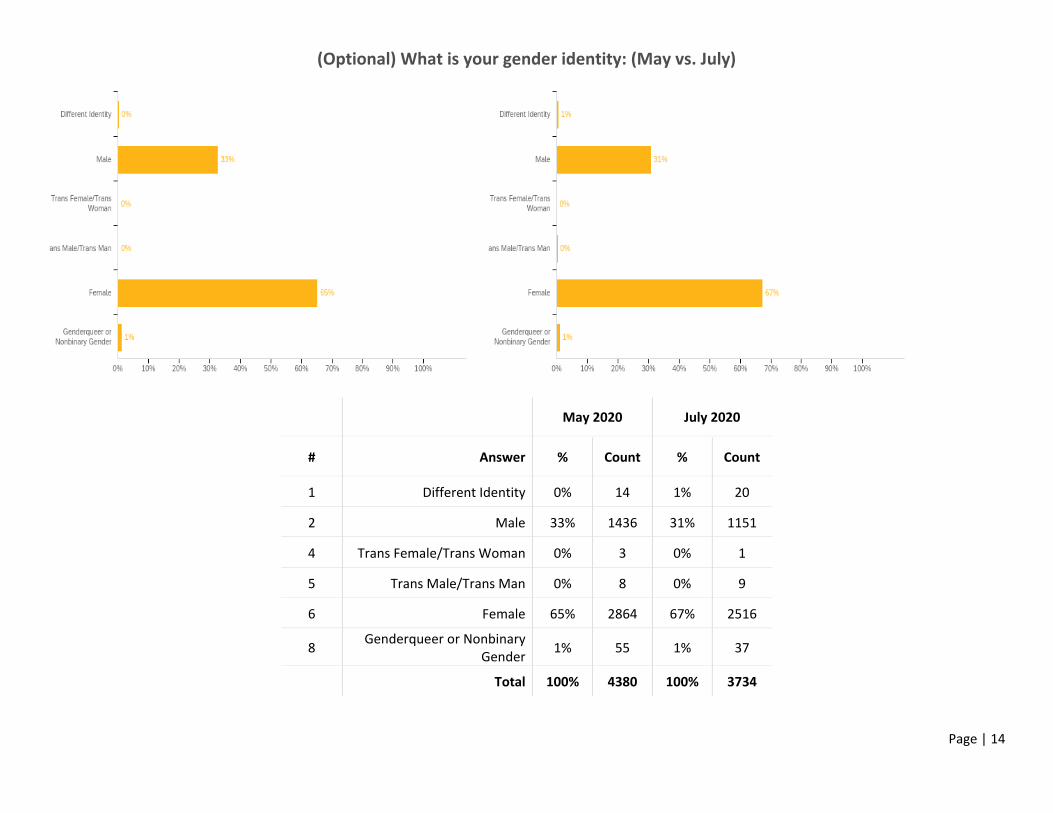
(Optional) What is your gender identity: (May vs. July)
May 2020 July 2020
# Answer % Count % Count
1 Different Identity 0% 14 1% 20
2 Male 33% 1436 31% 1151
4 Trans Female/Trans Woman 0% 3 0% 1
5 Trans Male/Trans Man 0% 8 0% 9
6 Female 65% 2864 67% 2516
8 Genderqueer or Nonbinary Gender 1% 55 1% 37
Total 100% 4380 100% 3734
Page | 15
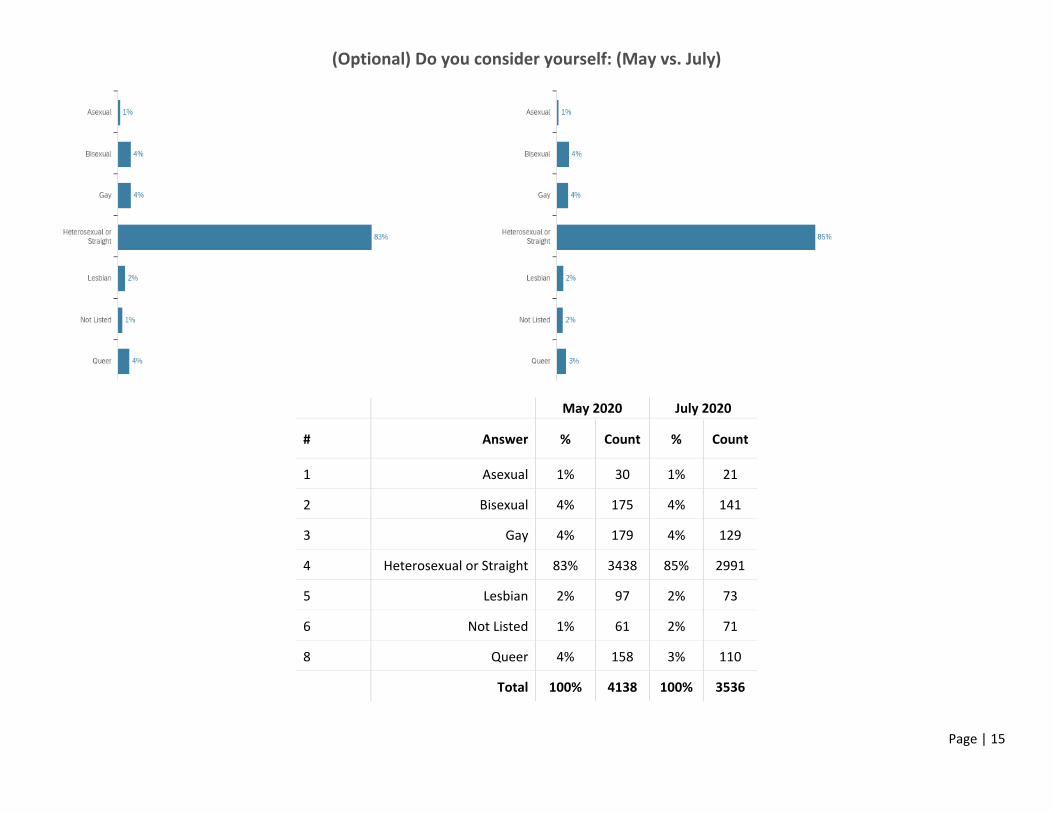
(Optional) Do you consider yourself: (May vs. July)
May 2020 July 2020
# Answer % Count % Count
1 Asexual 1% 30 1% 21
2 Bisexual 4% 175 4% 141
3 Gay 4% 179 4% 129
4 Heterosexual or Straight 83% 3438 85% 2991
5 Lesbian 2% 97 2% 73
6 Not Listed 1% 61 2% 71
8 Queer 4% 158 3% 110
Total 100% 4138 100% 3536
Page | 16
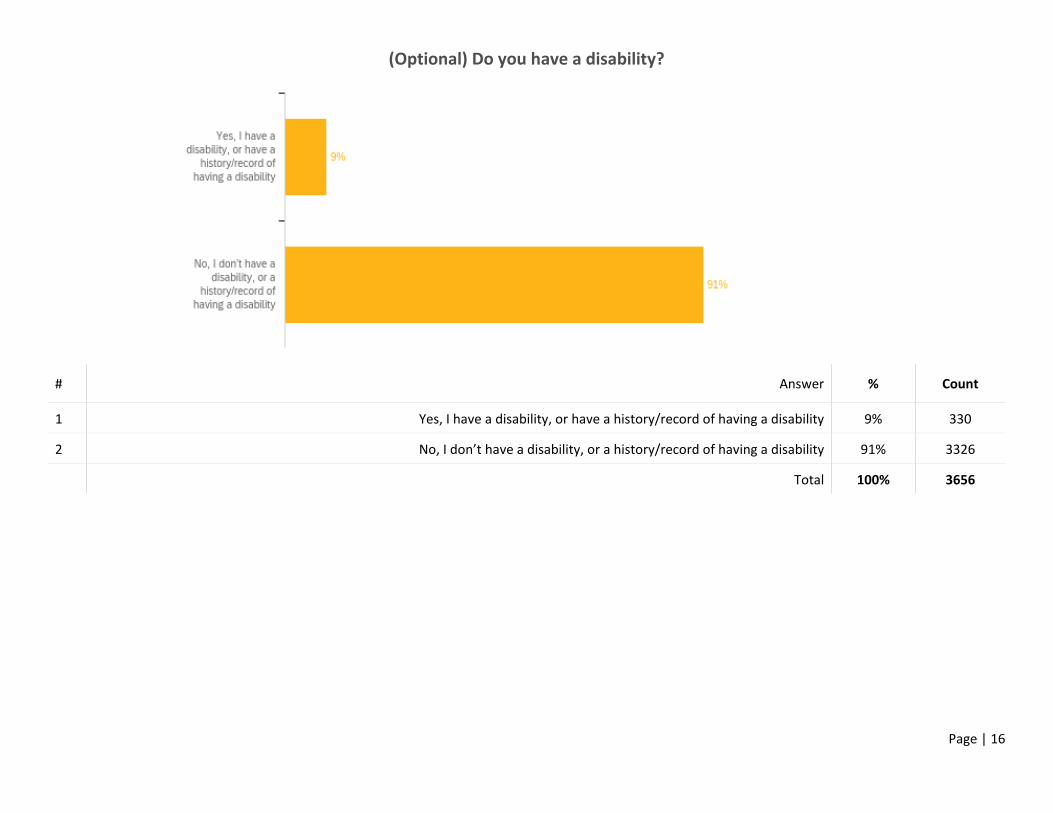
(Optional) Do you have a disability?
# Answer % Count
1 Yes, I have a disability, or have a history/record of having a disability 9% 330
2 No, I don’t have a disability, or a history/record of having a disability 91% 3326
Total 100% 3656
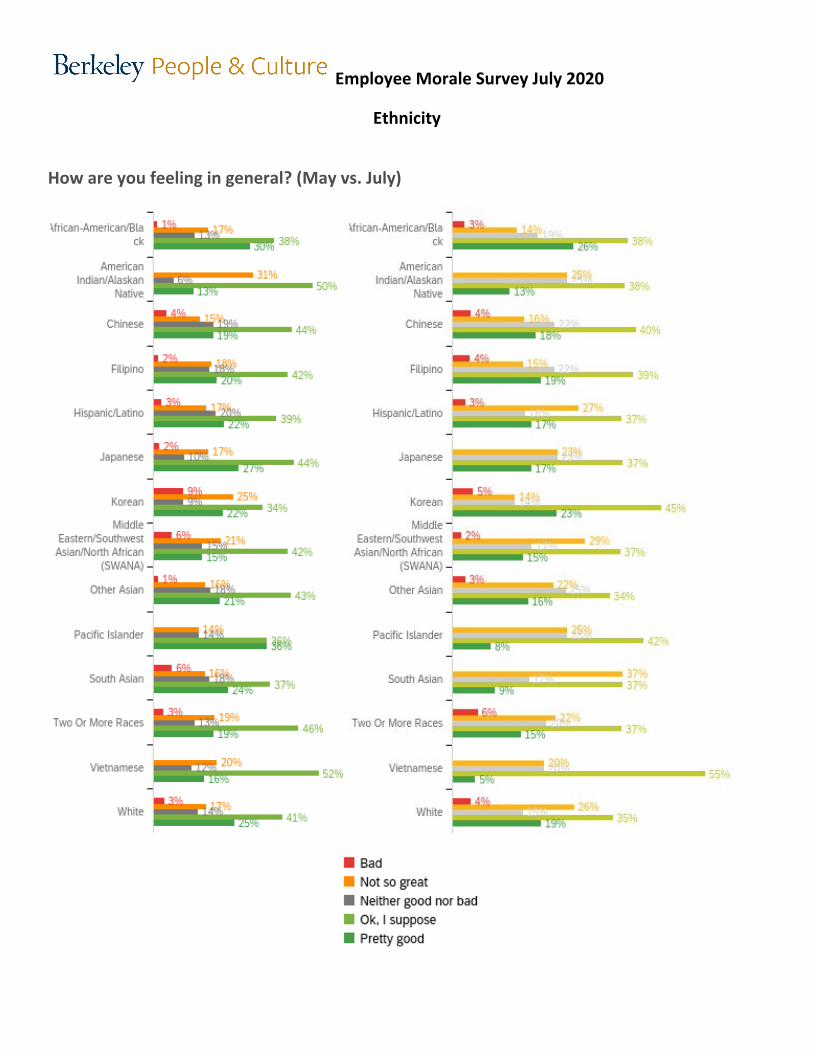
Employee Morale Survey July 2020
Ethnicity
How are you feeling in general? (May vs. July)
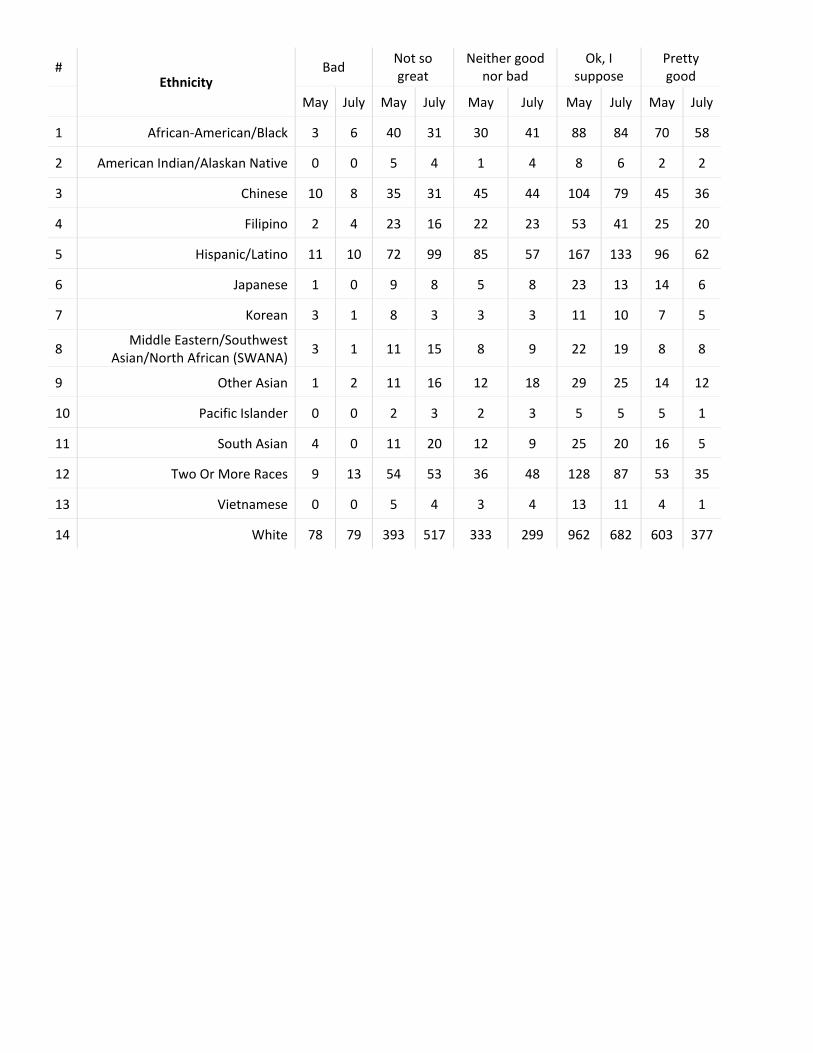
# Ethnicity
Bad Not so great
Neither good nor bad
Ok, I suppose
Pretty good
May July May July May July May July May July
1 African-American/Black 3 6 40 31 30 41 88 84 70 58
2 American Indian/Alaskan Native 0 0 5 4 1 4 8 6 2 2
3 Chinese 10 8 35 31 45 44 104 79 45 36
4 Filipino 2 4 23 16 22 23 53 41 25 20
5 Hispanic/Latino 11 10 72 99 85 57 167 133 96 62
6 Japanese 1 0 9 8 5 8 23 13 14 6
7 Korean 3 1 8 3 3 3 11 10 7 5
8 Middle Eastern/Southwest Asian/North African (SWANA) 3 1 11 15 8 9 22 19 8 8
9 Other Asian 1 2 11 16 12 18 29 25 14 12
10 Pacific Islander 0 0 2 3 2 3 5 5 5 1
11 South Asian 4 0 11 20 12 9 25 20 16 5
12 Two Or More Races 9 13 54 53 36 48 128 87 53 35
13 Vietnamese 0 0 5 4 3 4 13 11 4 1
14 White 78 79 393 517 333 299 962 682 603 377
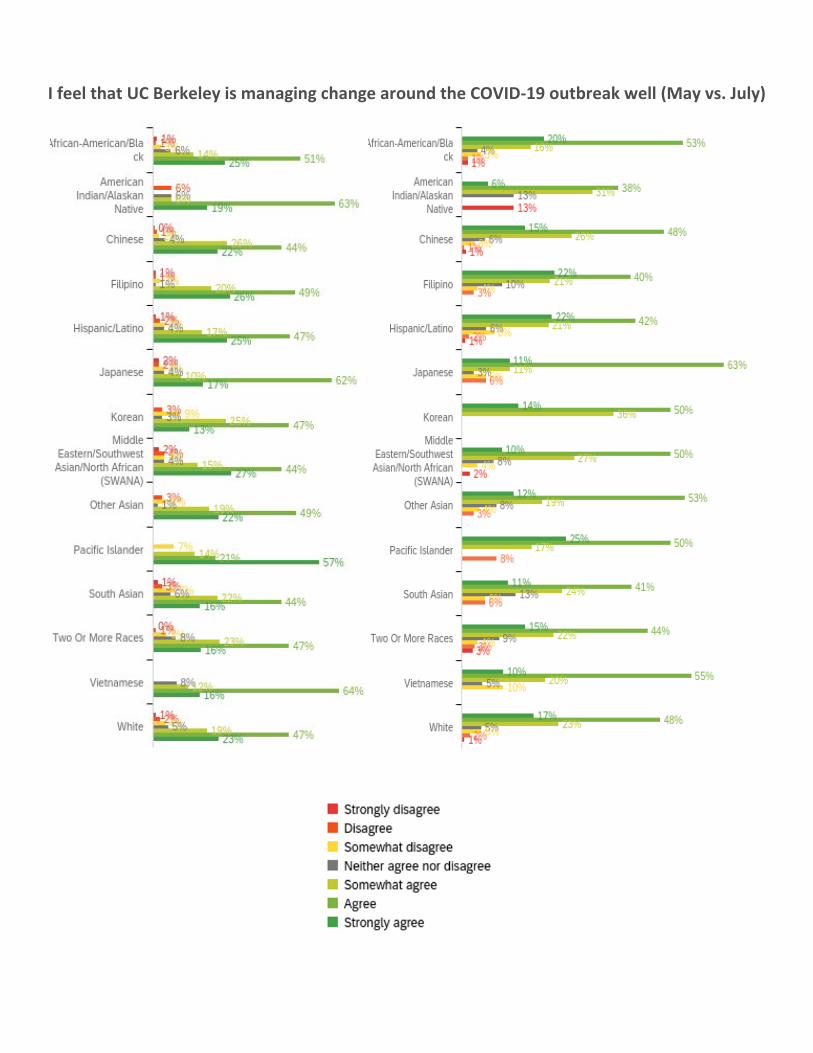
I feel that UC Berkeley is managing change around the COVID-19 outbreak well (May vs. July)

# Ethnicity
Strongly agree Agree Somewhat
agree
Neither agree nor disagree
Somewhat disagree Disagree Strongly
disagree
May July May July May July May July May July May July May July
1 African-American/Black 57 43 117 116 32 36 14 8 6 10 2 3 3 3
2 American
Indian/Alaskan Native
3 1 10 6 1 5 1 2 0 0 1 0 0 2
3 Chinese 53 30 106 96 61 52 10 11 5 6 3 1 1 2
4 Filipino 33 23 61 42 25 22 1 10 3 4 1 3 1 0
5 Hispanic/Latino 109 78 203 150 73 75 16 21 16 28 10 6 4 3
6 Japanese 9 4 32 22 5 4 2 1 2 2 1 2 1 0
7 Korean 4 3 15 11 8 8 1 0 3 0 1 0 0 0
8
Middle Eastern/Southwest
Asian/North African (SWANA)
14 5 23 26 8 14 2 4 2 2 2 0 1 1
9 Other Asian 15 9 33 39 13 14 1 6 3 3 2 2 0 0
10 Pacific Islander 8 3 3 6 2 2 0 0 1 0 0 1 0 0
11 South Asian 11 6 30 22 15 13 4 7 5 3 2 3 1 0
12 Two Or More Races 46 36 131 105 64 52 22 21 13 9 3 7 1 6
13 Vietnamese 4 2 16 11 3 4 2 1 0 2 0 0 0 0
14 White 533 338 1107 929 438 454 120 91 94 93 54 36 20 13
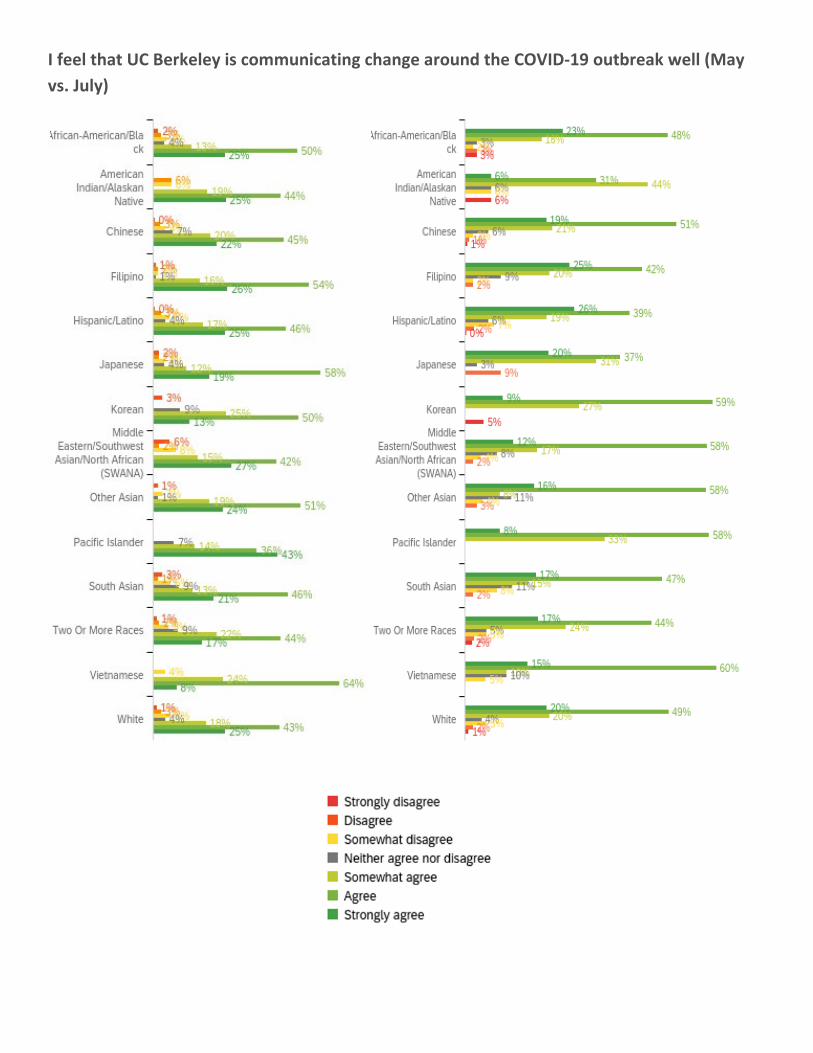
I feel that UC Berkeley is communicating change around the COVID-19 outbreak well (May vs. July)
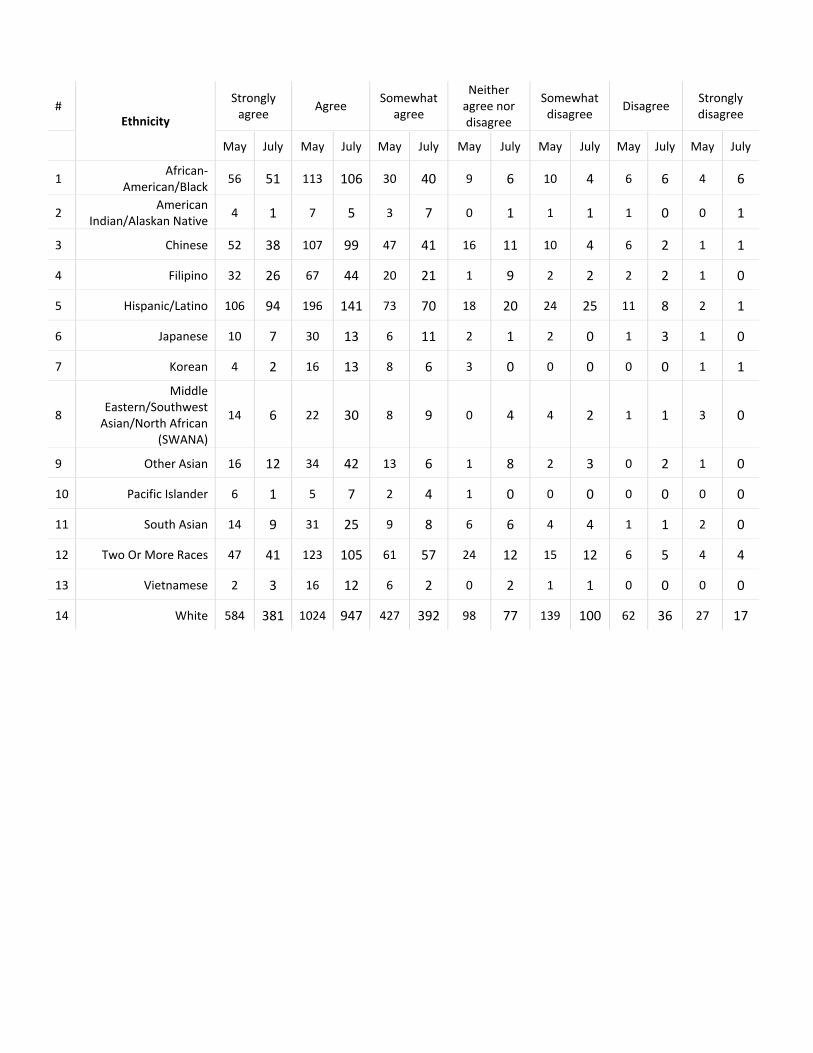
# Ethnicity
Strongly agree Agree Somewhat
agree
Neither agree nor disagree
Somewhat disagree Disagree Strongly
disagree
May July May July May July May July May July May July May July
1 African-American/Black 56 51 113 106 30 40 9 6 10 4 6 6 4 6
2 American Indian/Alaskan Native 4 1 7 5 3 7 0 1 1 1 1 0 0 1
3 Chinese 52 38 107 99 47 41 16 11 10 4 6 2 1 1
4 Filipino 32 26 67 44 20 21 1 9 2 2 2 2 1 0
5 Hispanic/Latino 106 94 196 141 73 70 18 20 24 25 11 8 2 1
6 Japanese 10 7 30 13 6 11 2 1 2 0 1 3 1 0
7 Korean 4 2 16 13 8 6 3 0 0 0 0 0 1 1
8
Middle Eastern/Southwest
Asian/North African (SWANA)
14 6 22 30 8 9 0 4 4 2 1 1 3 0
9 Other Asian 16 12 34 42 13 6 1 8 2 3 0 2 1 0
10 Pacific Islander 6 1 5 7 2 4 1 0 0 0 0 0 0 0
11 South Asian 14 9 31 25 9 8 6 6 4 4 1 1 2 0
12 Two Or More Races 47 41 123 105 61 57 24 12 15 12 6 5 4 4
13 Vietnamese 2 3 16 12 6 2 0 2 1 1 0 0 0 0
14 White 584 381 1024 947 427 392 98 77 139 100 62 36 27 17
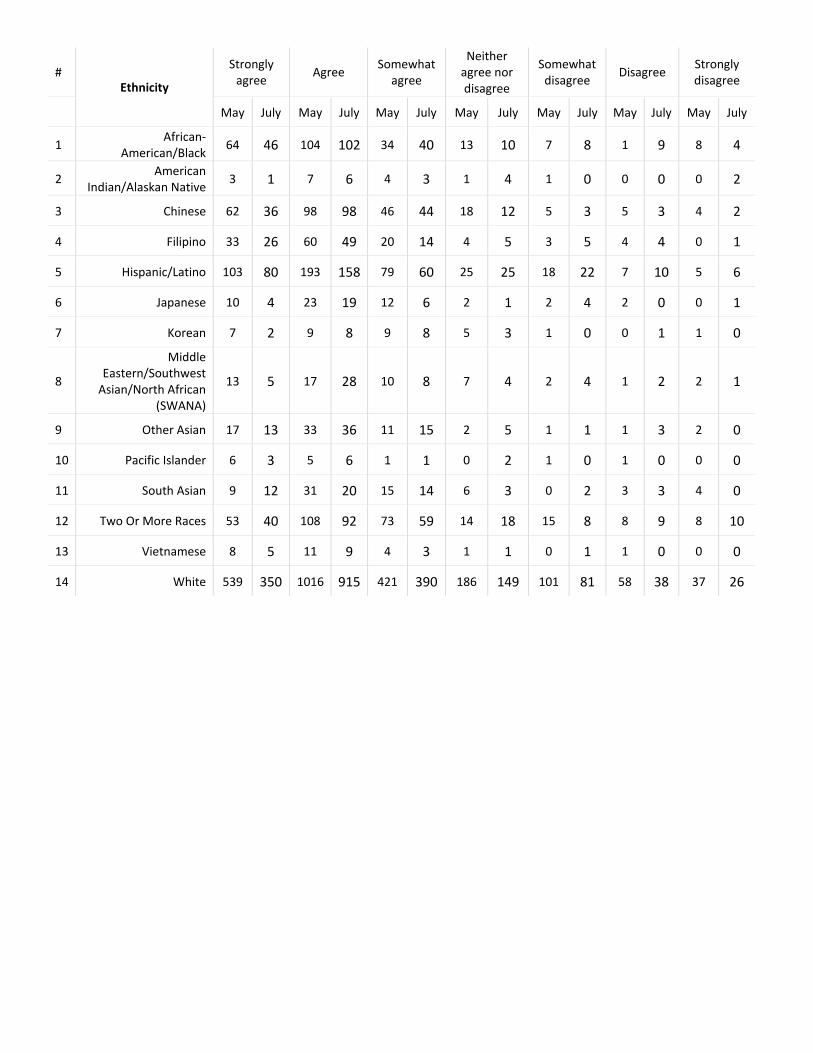
I feel that UC Berkeley cares about my well-being
# Ethnicity
Strongly agree Agree Somewhat
agree
Neither agree nor disagree
Somewhat disagree Disagree Strongly
disagree
May July May July May July May July May July May July May July
1 African-American/Black 64 46 104 102 34 40 13 10 7 8 1 9 8 4
2 American Indian/Alaskan Native 3 1 7 6 4 3 1 4 1 0 0 0 0 2
3 Chinese 62 36 98 98 46 44 18 12 5 3 5 3 4 2
4 Filipino 33 26 60 49 20 14 4 5 3 5 4 4 0 1
5 Hispanic/Latino 103 80 193 158 79 60 25 25 18 22 7 10 5 6
6 Japanese 10 4 23 19 12 6 2 1 2 4 2 0 0 1
7 Korean 7 2 9 8 9 8 5 3 1 0 0 1 1 0
8
Middle Eastern/Southwest
Asian/North African (SWANA)
13 5 17 28 10 8 7 4 2 4 1 2 2 1
9 Other Asian 17 13 33 36 11 15 2 5 1 1 1 3 2 0
10 Pacific Islander 6 3 5 6 1 1 0 2 1 0 1 0 0 0
11 South Asian 9 12 31 20 15 14 6 3 0 2 3 3 4 0
12 Two Or More Races 53 40 108 92 73 59 14 18 15 8 8 9 8 10
13 Vietnamese 8 5 11 9 4 3 1 1 0 1 1 0 0 0
14 White 539 350 1016 915 421 390 186 149 101 81 58 38 37 26
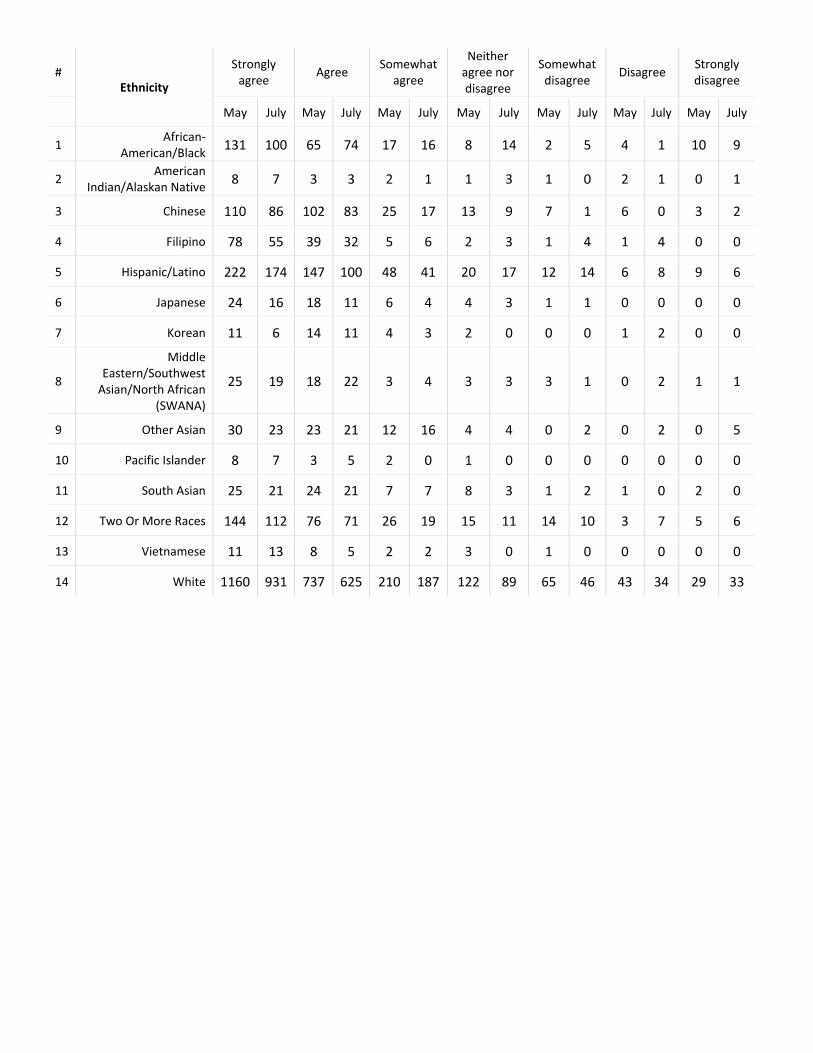
Q7 - My well-being is important to my immediate supervisor
# Ethnicity
Strongly agree Agree Somewhat
agree
Neither agree nor disagree
Somewhat disagree Disagree Strongly
disagree
May July May July May July May July May July May July May July
1 African-American/Black 131 100 65 74 17 16 8 14 2 5 4 1 10 9
2 American Indian/Alaskan Native 8 7 3 3 2 1 1 3 1 0 2 1 0 1
3 Chinese 110 86 102 83 25 17 13 9 7 1 6 0 3 2
4 Filipino 78 55 39 32 5 6 2 3 1 4 1 4 0 0
5 Hispanic/Latino 222 174 147 100 48 41 20 17 12 14 6 8 9 6
6 Japanese 24 16 18 11 6 4 4 3 1 1 0 0 0 0
7 Korean 11 6 14 11 4 3 2 0 0 0 1 2 0 0
8
Middle Eastern/Southwest
Asian/North African (SWANA)
25 19 18 22 3 4 3 3 3 1 0 2 1 1
9 Other Asian 30 23 23 21 12 16 4 4 0 2 0 2 0 5
10 Pacific Islander 8 7 3 5 2 0 1 0 0 0 0 0 0 0
11 South Asian 25 21 24 21 7 7 8 3 1 2 1 0 2 0
12 Two Or More Races 144 112 76 71 26 19 15 11 14 10 3 7 5 6
13 Vietnamese 11 13 8 5 2 2 3 0 1 0 0 0 0 0
14 White 1160 931 737 625 210 187 122 89 65 46 43 34 29 33

If shelter-in-place orders are modified and the university begins to bring limited number of employees to work on-site, would you:
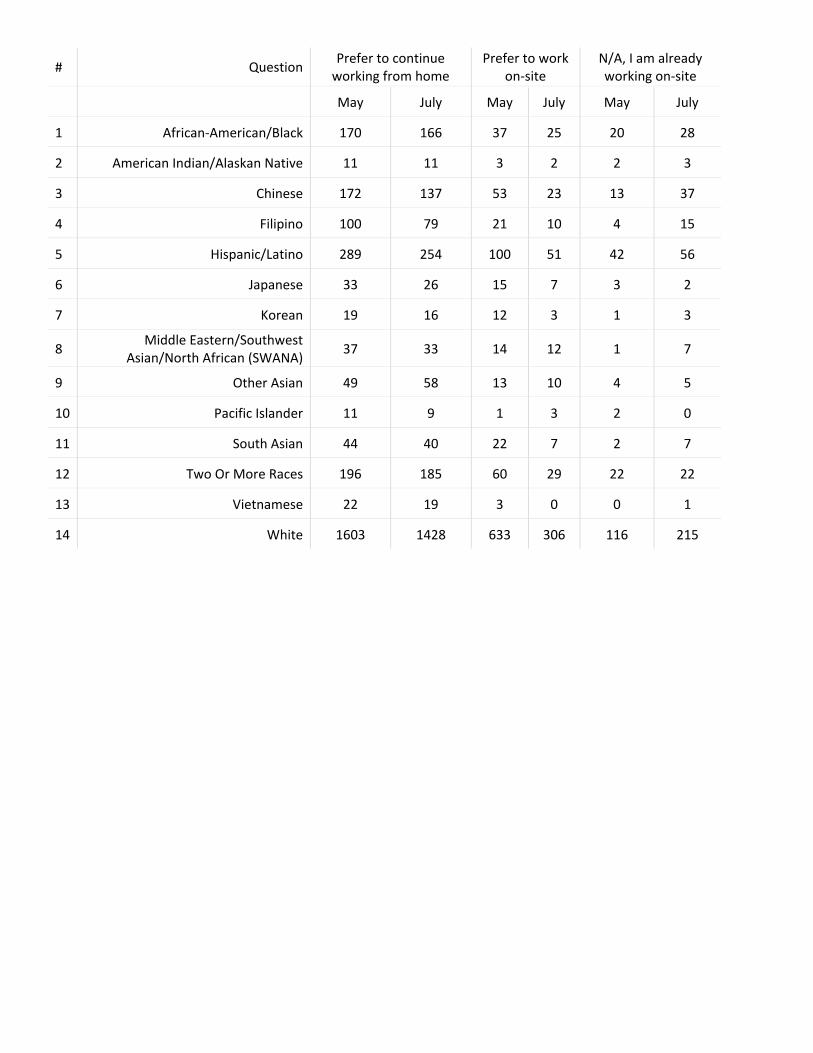
# Question Prefer to continue working from home
Prefer to work on-site
N/A, I am already working on-site
May July May July May July
1 African-American/Black 170 166 37 25 20 28
2 American Indian/Alaskan Native 11 11 3 2 2 3
3 Chinese 172 137 53 23 13 37
4 Filipino 100 79 21 10 4 15
5 Hispanic/Latino 289 254 100 51 42 56
6 Japanese 33 26 15 7 3 2
7 Korean 19 16 12 3 1 3
8 Middle Eastern/Southwest Asian/North African (SWANA) 37 33 14 12 1 7
9 Other Asian 49 58 13 10 4 5
10 Pacific Islander 11 9 1 3 2 0
11 South Asian 44 40 22 7 2 7
12 Two Or More Races 196 185 60 29 22 22
13 Vietnamese 22 19 3 0 0 1
14 White 1603 1428 633 306 116 215
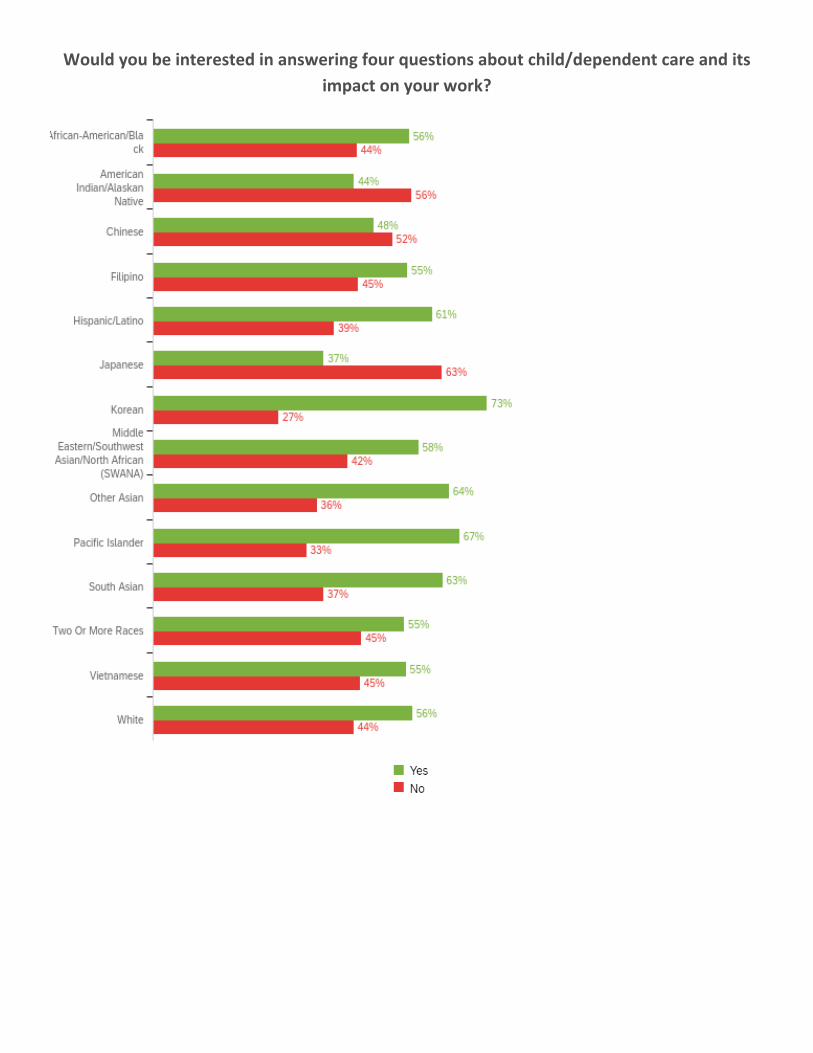
Would you be interested in answering four questions about child/dependent care and its impact on your work?
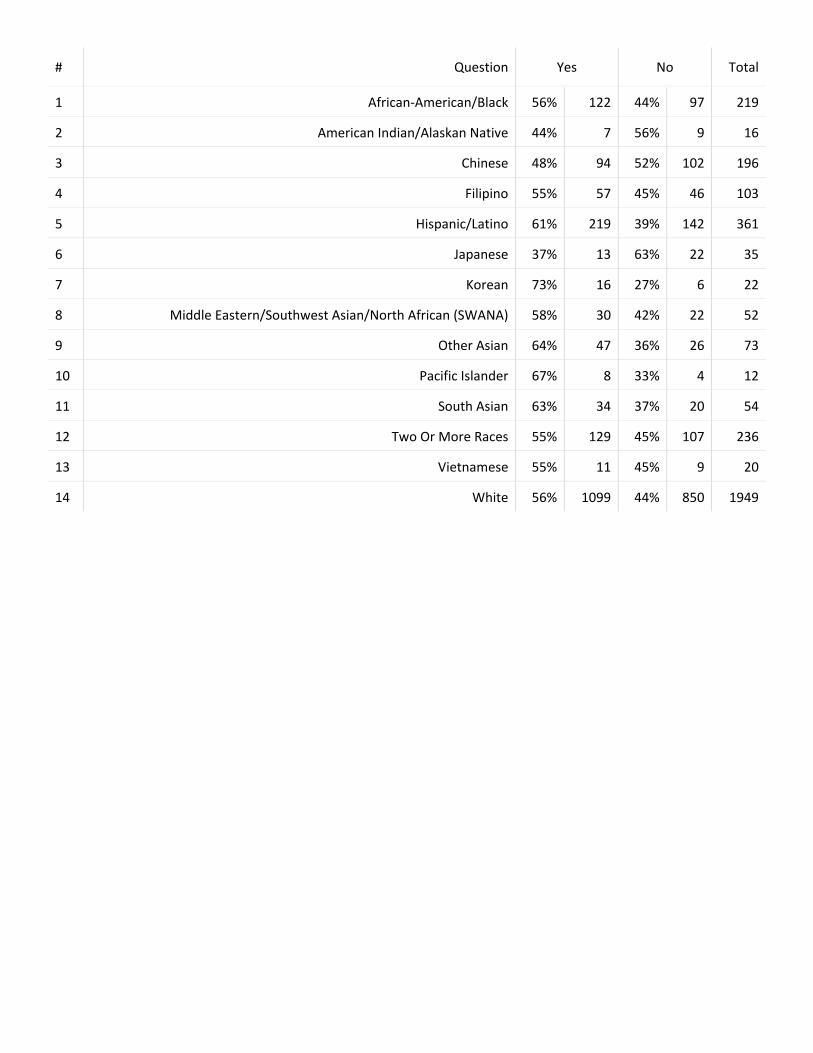
# Question Yes No Total
1 African-American/Black 56% 122 44% 97 219
2 American Indian/Alaskan Native 44% 7 56% 9 16
3 Chinese 48% 94 52% 102 196
4 Filipino 55% 57 45% 46 103
5 Hispanic/Latino 61% 219 39% 142 361
6 Japanese 37% 13 63% 22 35
7 Korean 73% 16 27% 6 22
8 Middle Eastern/Southwest Asian/North African (SWANA) 58% 30 42% 22 52
9 Other Asian 64% 47 36% 26 73
10 Pacific Islander 67% 8 33% 4 12
11 South Asian 63% 34 37% 20 54
12 Two Or More Races 55% 129 45% 107 236
13 Vietnamese 55% 11 45% 9 20
14 White 56% 1099 44% 850 1949
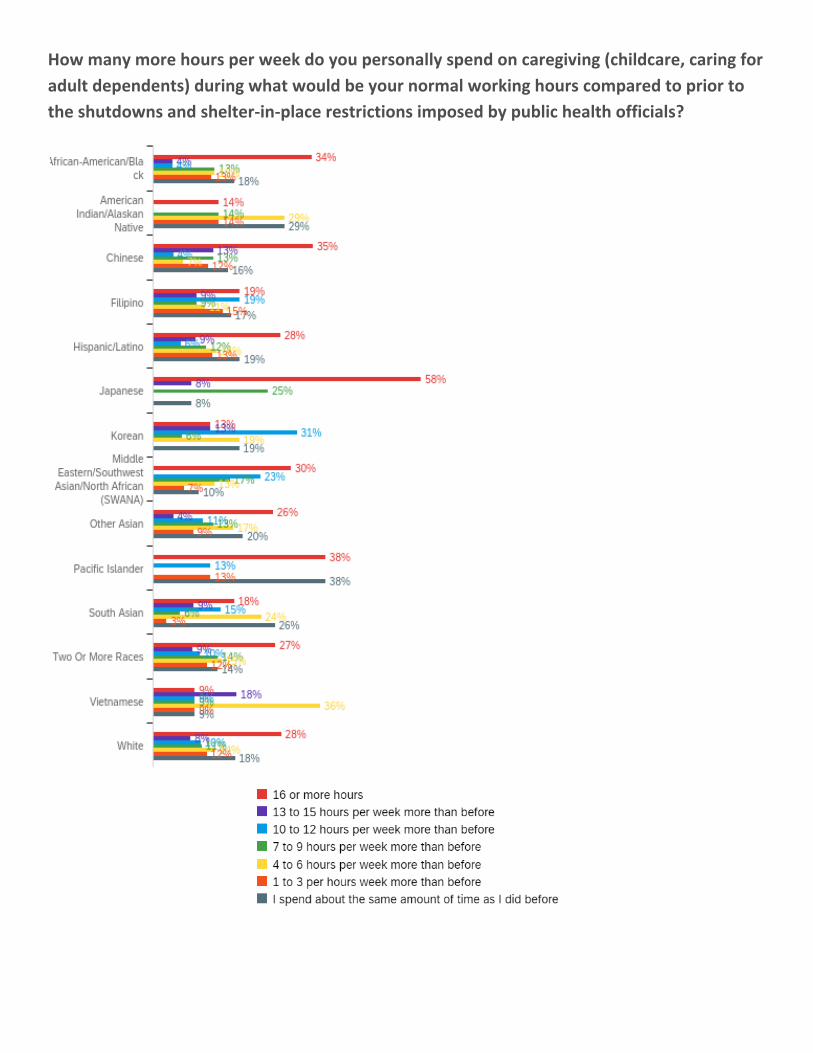
How many more hours per week do you personally spend on caregiving (childcare, caring for adult dependents) during what would be your normal working hours compared to prior to the shutdowns and shelter-in-place restrictions imposed by public health officials?

# Question
I spend about the
same amount of
time as I did before
1 to 3 per hours
week more than
before
4 to 6 hours per
week more than
before
7 to 9 hours per
week more than
before
10 to 12 hours per
week more than
before
13 to 15 hours per
week more than
before
16 or more hours
Total
1 African-American/Black 18% 21 13% 15 13% 16 13% 16 4% 5 4% 5 34% 41 119
2 American
Indian/Alaskan Native
29% 2 14% 1 29% 2 14% 1 0% 0 0% 0 14% 1 7
3 Chinese 16% 15 12% 11 7% 6 13% 12 4% 4 13% 12 35% 32 92
4 Filipino 17% 9 15% 8 11% 6 9% 5 19% 10 9% 5 19% 10 53
5 Hispanic/Latino 19% 41 13% 28 14% 30 12% 25 6% 13 9% 20 28% 60 217
6 Japanese 8% 1 0% 0 0% 0 25% 3 0% 0 8% 1 58% 7 12
7 Korean 19% 3 0% 0 19% 3 6% 1 31% 5 13% 2 13% 2 16
8
Middle Eastern/Southwest
Asian/North African (SWANA)
10% 3 7% 2 13% 4 17% 5 23% 7 0% 0 30% 9 30
9 Other Asian 20% 9 9% 4 17% 8 13% 6 11% 5 4% 2 26% 12 46
10 Pacific Islander 38% 3 13% 1 0% 0 0% 0 13% 1 0% 0 38% 3 8
11 South Asian 26% 9 3% 1 24% 8 6% 2 15% 5 9% 3 18% 6 34
12 Two Or More Races 14% 18 12% 15 15% 19 14% 18 10% 13 9% 11 27% 34 128
13 Vietnamese 9% 1 9% 1 36% 4 9% 1 9% 1 18% 2 9% 1 11
14 White 18% 189 12% 124 14% 144 11% 112 10% 110 8% 87 28% 296 1062
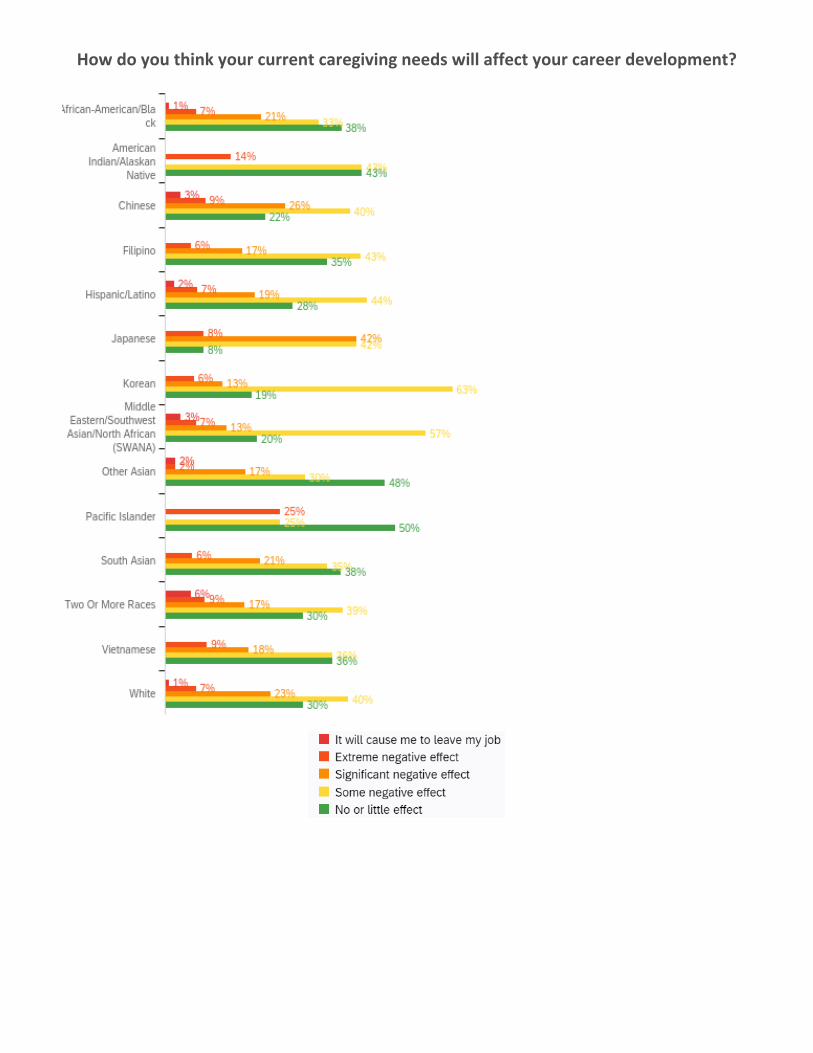
How do you think your current caregiving needs will affect your career development?
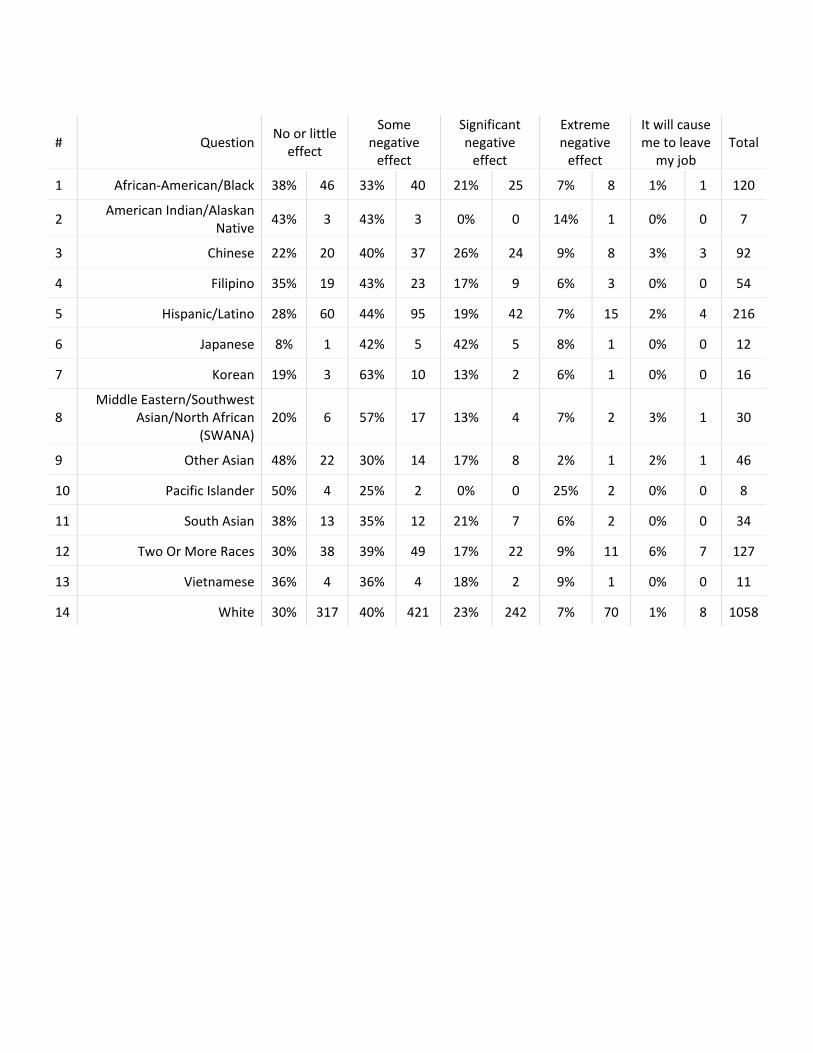
# Question No or little effect
Some negative
effect
Significant negative
effect
Extreme negative
effect
It will cause me to leave
my job Total
1 African-American/Black 38% 46 33% 40 21% 25 7% 8 1% 1 120
2 American Indian/Alaskan Native 43% 3 43% 3 0% 0 14% 1 0% 0 7
3 Chinese 22% 20 40% 37 26% 24 9% 8 3% 3 92
4 Filipino 35% 19 43% 23 17% 9 6% 3 0% 0 54
5 Hispanic/Latino 28% 60 44% 95 19% 42 7% 15 2% 4 216
6 Japanese 8% 1 42% 5 42% 5 8% 1 0% 0 12
7 Korean 19% 3 63% 10 13% 2 6% 1 0% 0 16
8 Middle Eastern/Southwest
Asian/North African (SWANA)
20% 6 57% 17 13% 4 7% 2 3% 1 30
9 Other Asian 48% 22 30% 14 17% 8 2% 1 2% 1 46
10 Pacific Islander 50% 4 25% 2 0% 0 25% 2 0% 0 8
11 South Asian 38% 13 35% 12 21% 7 6% 2 0% 0 34
12 Two Or More Races 30% 38 39% 49 17% 22 9% 11 6% 7 127
13 Vietnamese 36% 4 36% 4 18% 2 9% 1 0% 0 11
14 White 30% 317 40% 421 23% 242 7% 70 1% 8 1058
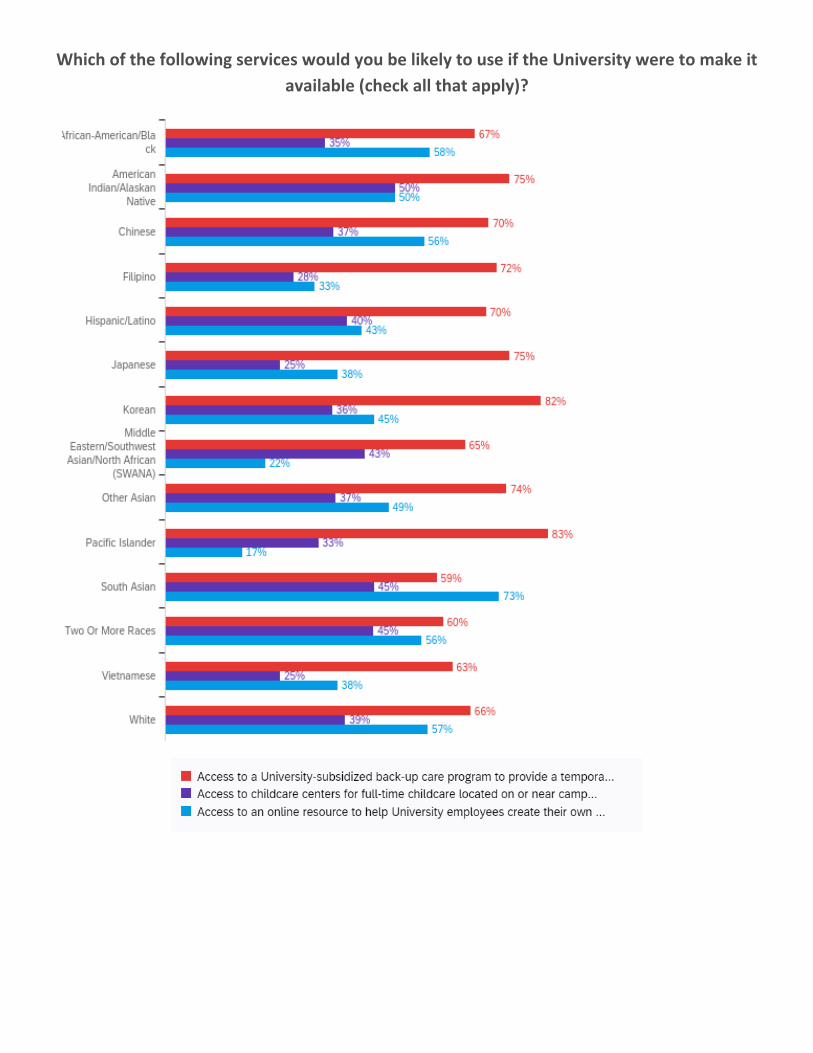
Which of the following services would you be likely to use if the University were to make it available (check all that apply)?

# Question
Access to a University-subsidized back-up care
program to provide a temporary caregiver for your dependent(s) in your home as needs arise, e.g. on an hourly basis or up to a full day at a
time.
Access to childcare
centers for full-time childcare located on or near campus.
Access to an online resource to help University employees create their own
share-care, co-op, or “bubble-share”
arrangements with other campus constituents.
Total
1 African-American/Black 67% 62 35% 32 58% 53 92
2 American Indian/Alaskan Native 75% 3 50% 2 50% 2 4
3 Chinese 70% 50 37% 26 56% 40 71
4 Filipino 72% 31 28% 12 33% 14 43
5 Hispanic/Latino 70% 111 40% 63 43% 68 159
6 Japanese 75% 6 25% 2 38% 3 8
7 Korean 82% 9 36% 4 45% 5 11
8
Middle Eastern/Southwest
Asian/North African (SWANA)
65% 15 43% 10 22% 5 23
9 Other Asian 74% 26 37% 13 49% 17 35
10 Pacific Islander 83% 5 33% 2 17% 1 6
11 South Asian 59% 13 45% 10 73% 16 22
12 Two Or More Races 60% 52 45% 39 56% 48 86
13 Vietnamese 63% 5 25% 2 38% 3 8
14 White 66% 414 39% 244 57% 356 623
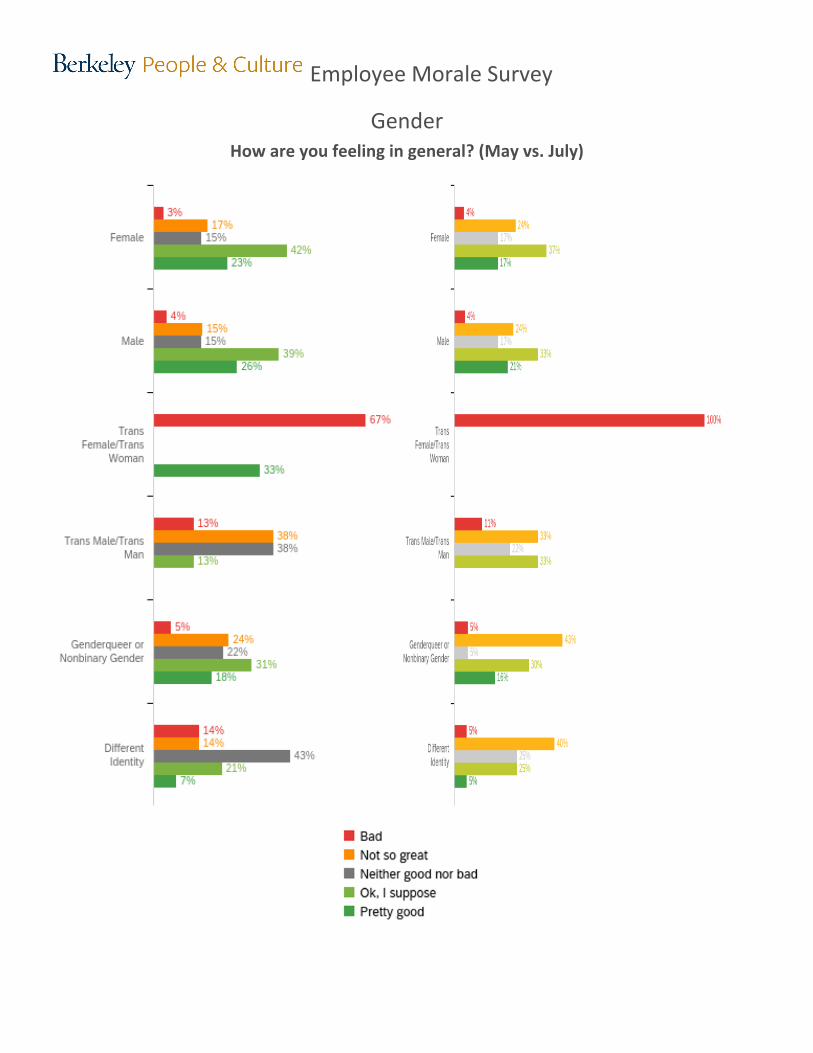
Employee Morale Survey
Gender How are you feeling in general? (May vs. July)
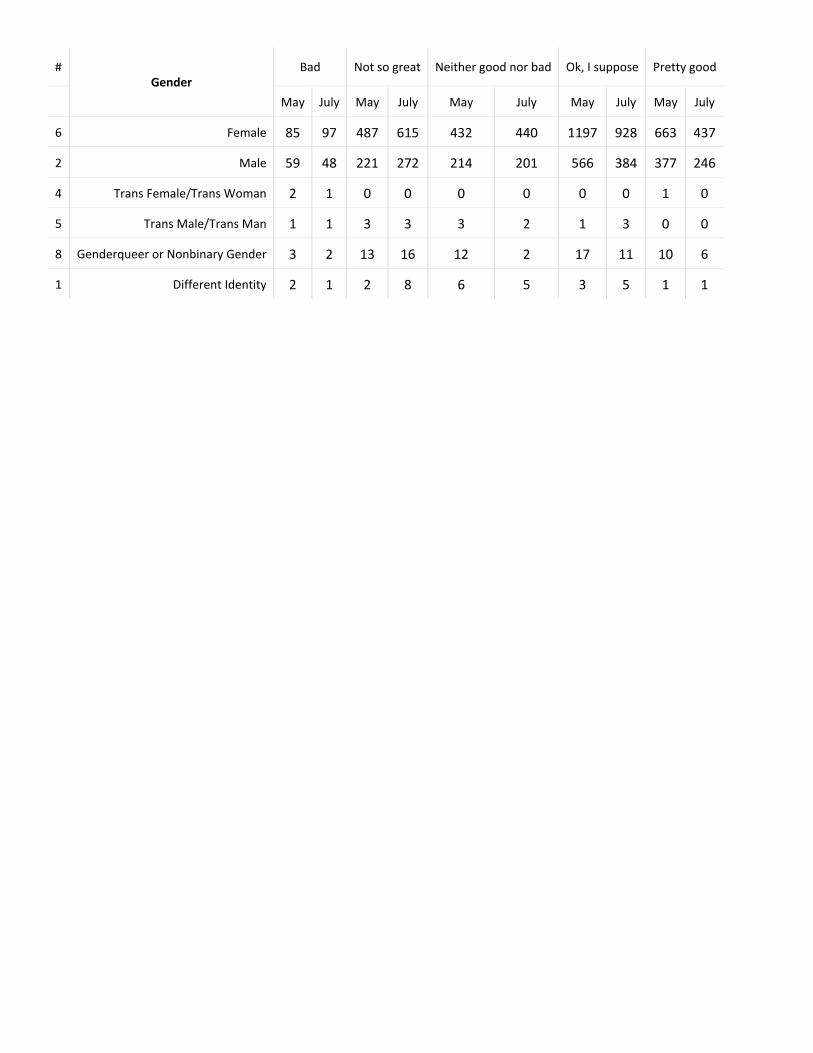
# Gender
Bad Not so great Neither good nor bad Ok, I suppose Pretty good
May July May July May July May July May July
6 Female 85 97 487 615 432 440 1197 928 663 437
2 Male 59 48 221 272 214 201 566 384 377 246
4 Trans Female/Trans Woman 2 1 0 0 0 0 0 0 1 0
5 Trans Male/Trans Man 1 1 3 3 3 2 1 3 0 0
8 Genderqueer or Nonbinary Gender 3 2 13 16 12 2 17 11 10 6
1 Different Identity 2 1 2 8 6 5 3 5 1 1
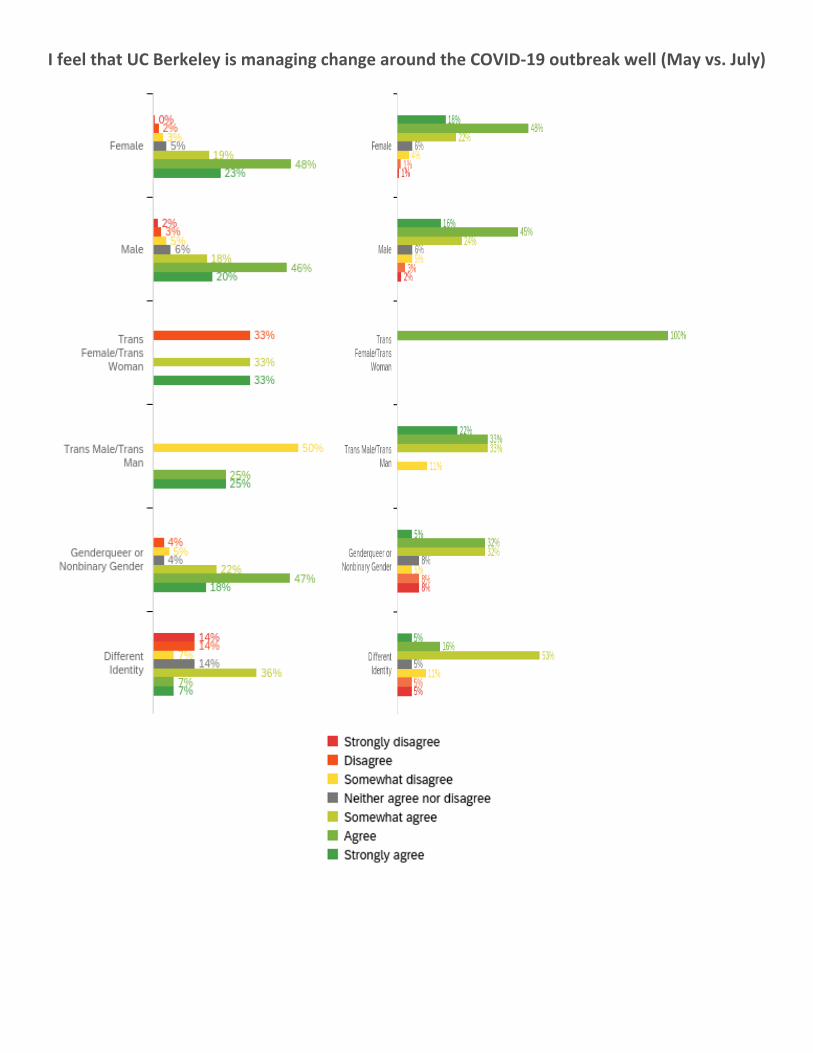
I feel that UC Berkeley is managing change around the COVID-19 outbreak well (May vs. July)
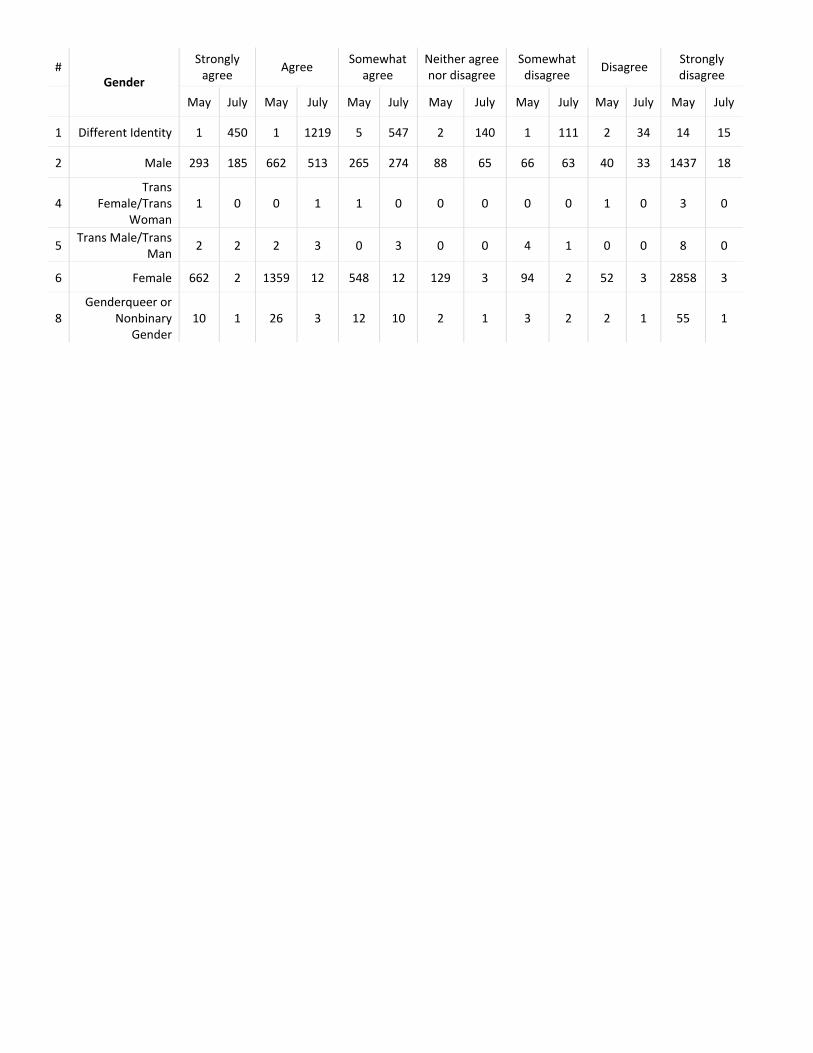
# Gender
Strongly agree Agree Somewhat
agree Neither agree nor disagree
Somewhat disagree Disagree Strongly
disagree
May July May July May July May July May July May July May July
1 Different Identity 1 450 1 1219 5 547 2 140 1 111 2 34 14 15
2 Male 293 185 662 513 265 274 88 65 66 63 40 33 1437 18
4 Trans
Female/Trans Woman
1 0 0 1 1 0 0 0 0 0 1 0 3 0
5 Trans Male/Trans Man 2 2 2 3 0 3 0 0 4 1 0 0 8 0
6 Female 662 2 1359 12 548 12 129 3 94 2 52 3 2858 3
8 Genderqueer or
Nonbinary Gender
10 1 26 3 12 10 2 1 3 2 2 1 55 1

I feel that UC Berkeley is communicating change around the COVID-19 outbreak well (May vs. July)
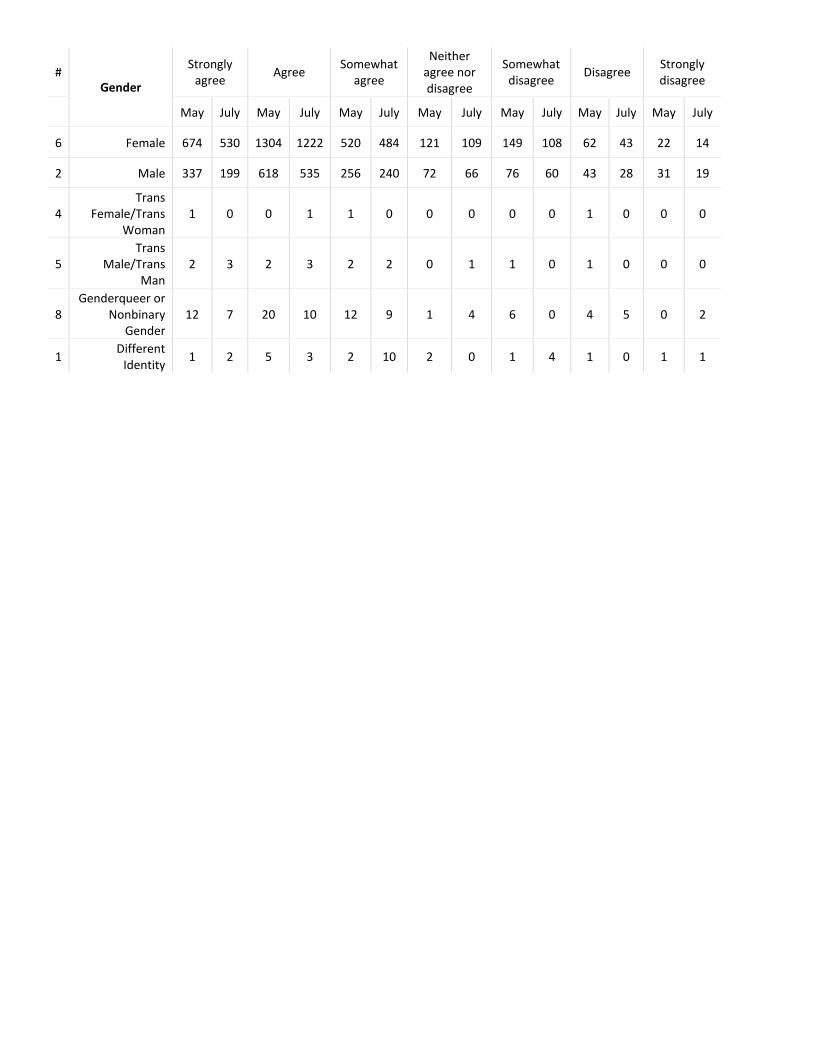
# Gender
Strongly agree Agree Somewhat
agree
Neither agree nor disagree
Somewhat disagree Disagree Strongly
disagree
May July May July May July May July May July May July May July
6 Female 674 530 1304 1222 520 484 121 109 149 108 62 43 22 14
2 Male 337 199 618 535 256 240 72 66 76 60 43 28 31 19
4 Trans
Female/Trans Woman
1 0 0 1 1 0 0 0 0 0 1 0 0 0
5 Trans
Male/Trans Man
2 3 2 3 2 2 0 1 1 0 1 0 0 0
8 Genderqueer or
Nonbinary Gender
12 7 20 10 12 9 1 4 6 0 4 5 0 2
1 Different Identity 1 2 5 3 2 10 2 0 1 4 1 0 1 1
I feel that UC Berkeley cares about my well-being (May vs. July)

# Gender
Strongly agree Agree Somewhat
agree
Neither agree nor disagree
Somewhat disagree Disagree Strongly
disagree
May July May July May July May July May July May July May July
6 Female 641 469 1231 1159 553 499 193 188 124 107 65 58 42 30
2 Male 351 208 607 542 234 206 116 80 47 54 38 35 41 25
4 Trans
Female/Trans Woman
1 0 0 0 1 0 0 1 0 0 1 0 0 0
5 Trans
Male/Trans Man
0 1 4 3 2 3 0 1 1 1 0 0 1 0
8 Genderqueer or
Nonbinary Gender
7 5 19 8 15 11 5 4 4 0 5 3 0 6
1 Different Identity 1 0 2 6 3 7 2 2 0 1 2 1 3 3

My well-being is important to my immediate supervisor (May vs. July)
# Gender
Strongly agree Agree Somewhat
agree
Neither agree nor disagree
Somewhat disagree Disagree Strongly
disagree
May July May July May July May July May July May July May July
6 Female 1417 1164 888 818 288 256 143 120 80 65 51 44 38 44
2 Male 670 517 495 383 117 115 93 56 37 30 29 23 29 21
4 Trans
Female/Trans Woman
1 0 0 0 0 0 1 1 0 0 1 0 0 0
5 Trans
Male/Trans Man
4 6 2 3 2 0 0 0 0 0 0 0 0 0
8 Genderqueer or
Nonbinary Gender
33 19 17 10 1 2 1 1 2 3 0 1 1 1
1 Different Identity 5 4 1 6 2 4 4 2 0 1 1 2 1 1
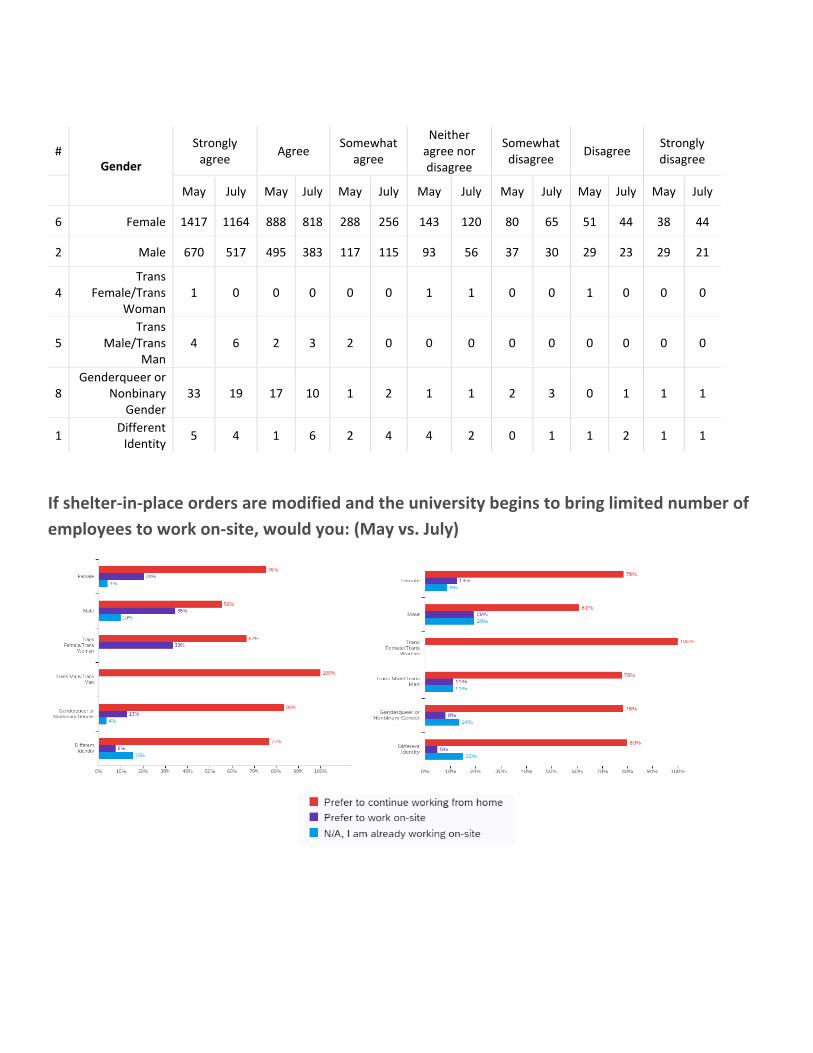
If shelter-in-place orders are modified and the university begins to bring limited number of employees to work on-site, would you: (May vs. July)
Question Female Male Trans
Female/Trans Woman
Trans Male/Trans
Man
Genderqueer or Nonbinary Gender
Different Identity
May July May July May July May July May July May July Prefer to continue
working from home
2145 1971 797 701 2 1 8 7 46 29 10 16
Prefer to work on-site 579 316 495 222 1 0 0 1 7 3 1 1
N/A, I am already working on-site 116 222 141 225 0 0 0 1 2 5 2 3
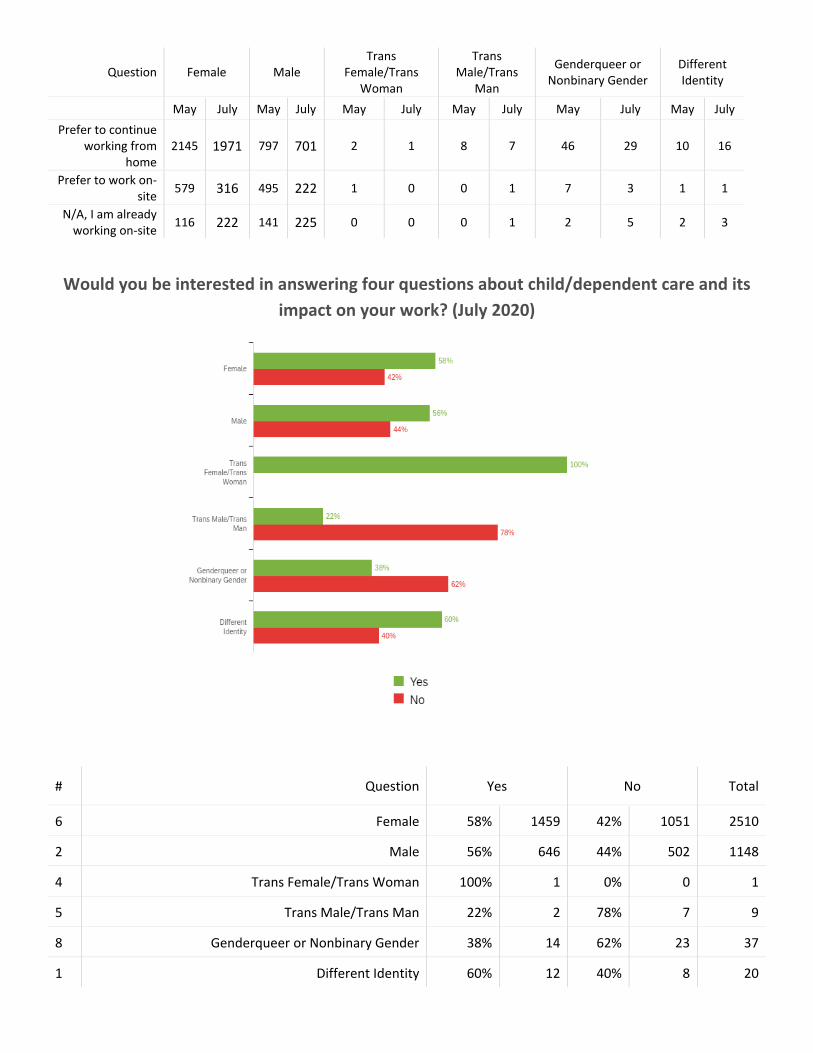
Would you be interested in answering four questions about child/dependent care and its impact on your work? (July 2020)
# Question Yes No Total
6 Female 58% 1459 42% 1051 2510
2 Male 56% 646 44% 502 1148
4 Trans Female/Trans Woman 100% 1 0% 0 1
5 Trans Male/Trans Man 22% 2 78% 7 9
8 Genderqueer or Nonbinary Gender 38% 14 62% 23 37
1 Different Identity 60% 12 40% 8 20

How many more hours per week do you personally spend on caregiving (childcare, caring for adult dependents) during what would be your normal working hours compared to prior to the shutdowns and shelter-in-place restrictions imposed by public health officials? (July 2020)
Question Female Male Trans
Female/Trans Woman
Trans Male/Trans
Man
Genderqueer or
Nonbinary Gender
Different Identity
I spend about the same amount of time as I did before 17% 239 19% 122 0% 0 50% 1 43% 6 17% 2
1 to 3 per hours week more than before 12% 166 10% 62 100% 1 0% 0 7% 1 25% 3
4 to 6 hours per week more than before 14% 205 13% 81 0% 0 0% 0 7% 1 33% 4
7 to 9 hours per week more than before 11% 153 10% 66 0% 0 0% 0 21% 3 8% 1
10 to 12 hours per week more than before 9% 121 12% 73 0% 0 0% 0 21% 3 0% 0
13 to 15 hours per week more than before 8% 113 8% 53 0% 0 0% 0 0% 0 8% 1
16 or more hours 30% 419 28% 176 0% 0 50% 1 0% 0 8% 1
Total Total 1416 Total 633 Total 1 Total 2 Total 14 Total 12

How do you think your current caregiving needs will affect your career development? (July 2020)
# Question No or little effect
Some negative effect
Significant negative effect
Extreme negative effect
It will cause me to leave my job Total
6 Female 28% 390 41% 577 22% 317 8% 108 2% 23 1415
2 Male 34% 214 37% 232 20% 129 8% 49 1% 7 631
4 Trans Female/Trans Woman 0% 0 100% 1 0% 0 0% 0 0% 0 1
5 Trans Male/Trans Man 50% 1 0% 0 50% 1 0% 0 0% 0 2
8 Genderqueer or Nonbinary Gender 64% 9 14% 2 14% 2 7% 1 0% 0 14
1 Different Identity 33% 4 42% 5 25% 3 0% 0 0% 0 12
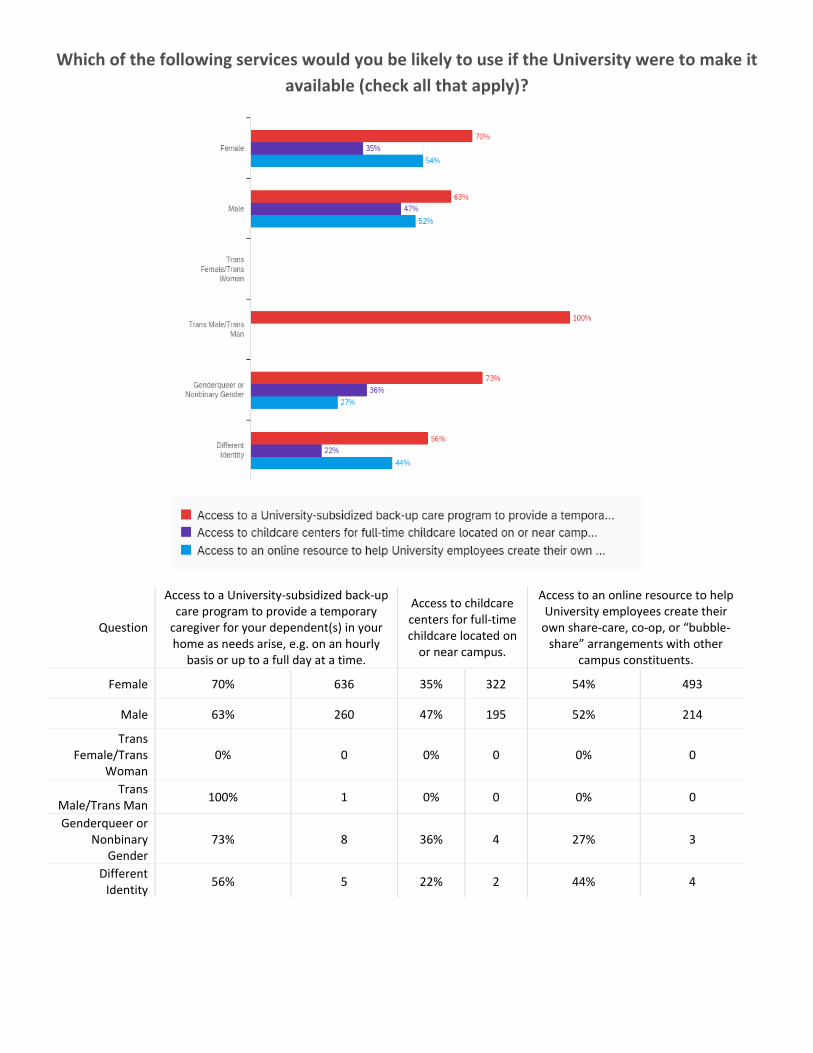
Which of the following services would you be likely to use if the University were to make it available (check all that apply)?
Question
Access to a University-subsidized back-up care program to provide a temporary
caregiver for your dependent(s) in your home as needs arise, e.g. on an hourly
basis or up to a full day at a time.
Access to childcare centers for full-time childcare located on
or near campus.
Access to an online resource to help University employees create their
own share-care, co-op, or “bubble-share” arrangements with other
campus constituents.
Female 70% 636 35% 322 54% 493
Male 63% 260 47% 195 52% 214
Trans Female/Trans
Woman 0% 0 0% 0 0% 0
Trans Male/Trans Man 100% 1 0% 0 0% 0
Genderqueer or Nonbinary
Gender 73% 8 36% 4 27% 3
Different Identity 56% 5 22% 2 44% 4
Employee Morale Survey
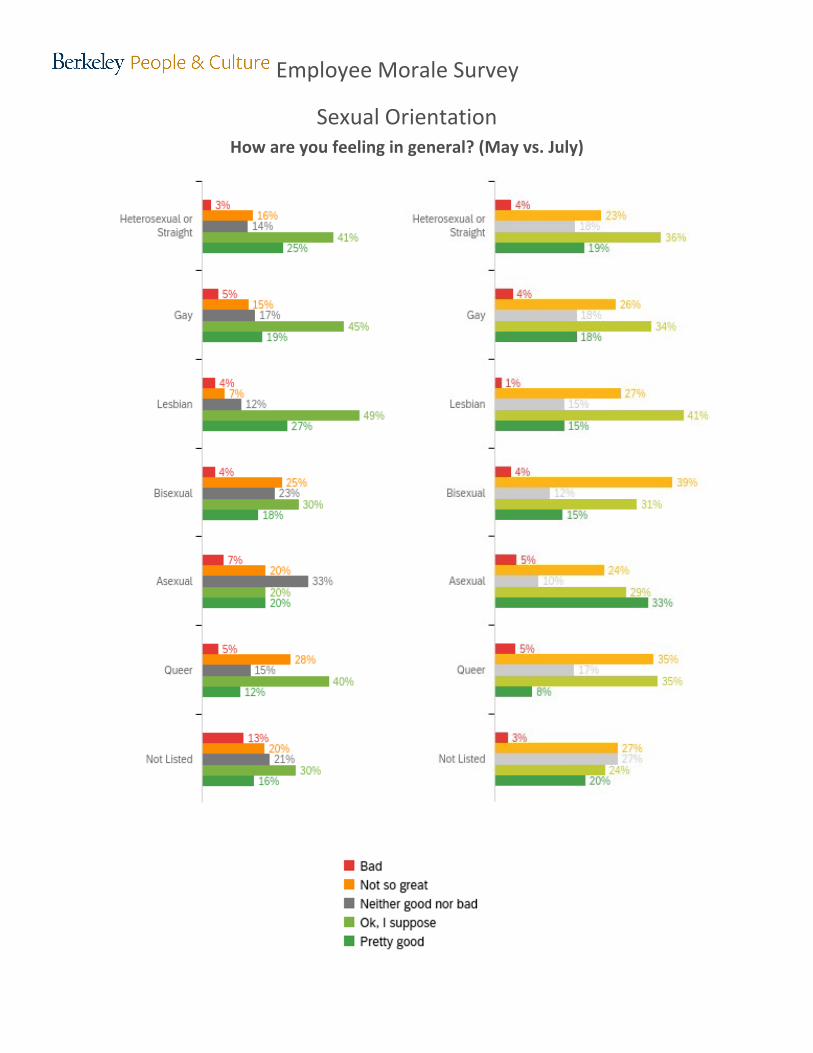
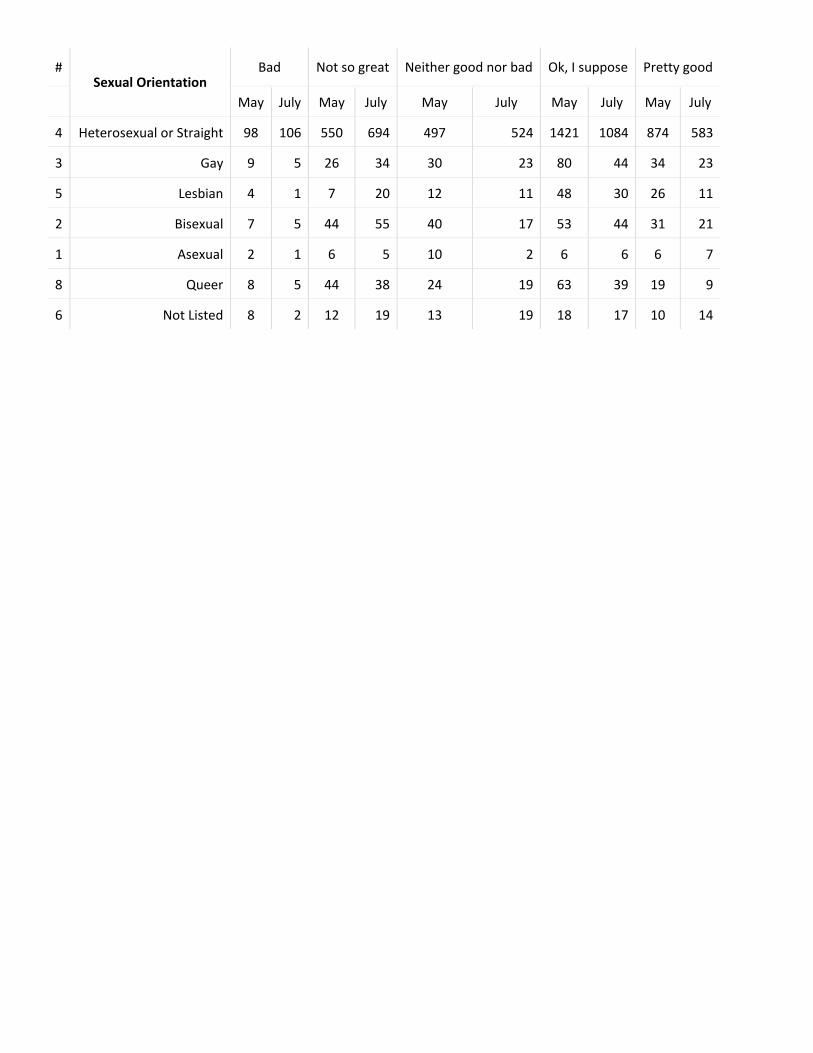
Sexual Orientation How are you feeling in general? (May vs. July)
# Sexual Orientation
Bad Not so great Neither good nor bad Ok, I suppose Pretty good
May July May July May July May July May July
4 Heterosexual or Straight 98 106 550 694 497 524 1421 1084 874 583
3 Gay 9 5 26 34 30 23 80 44 34 23
5 Lesbian 4 1 7 20 12 11 48 30 26 11
2 Bisexual 7 5 44 55 40 17 53 44 31 21
1 Asexual 2 1 6 5 10 2 6 6 6 7
8 Queer 8 5 44 38 24 19 63 39 19 9
6 Not Listed 8 2 12 19 13 19 18 17 10 14
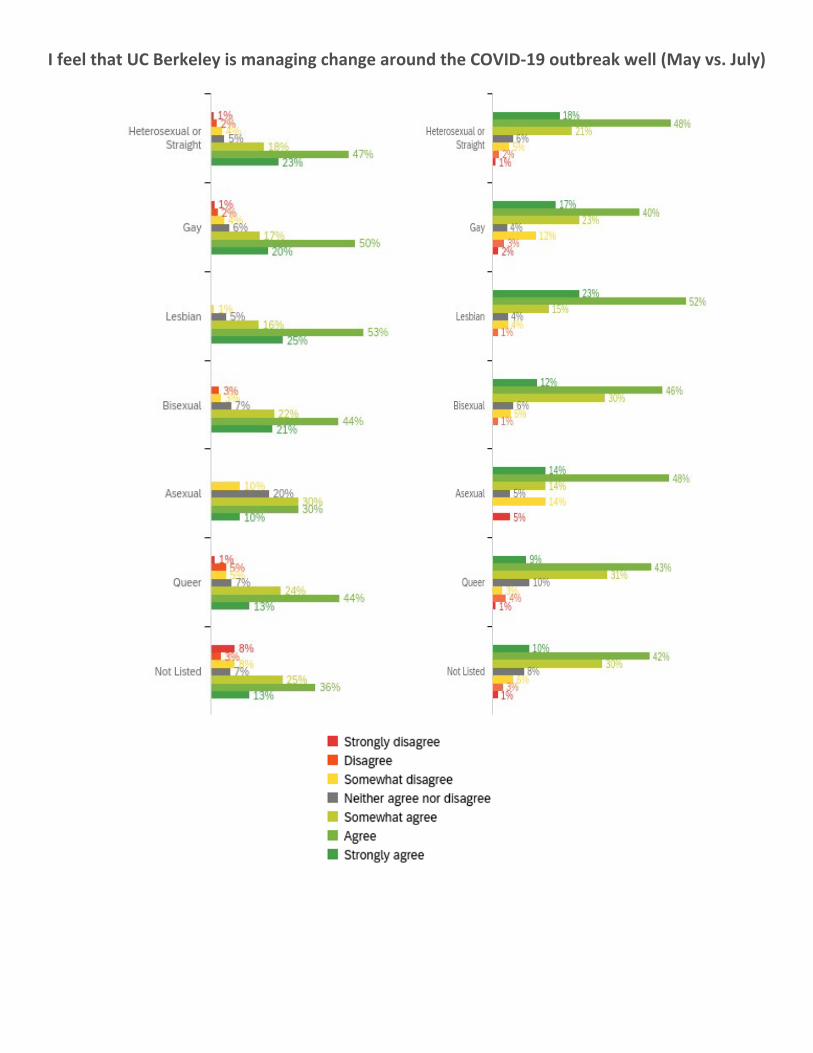
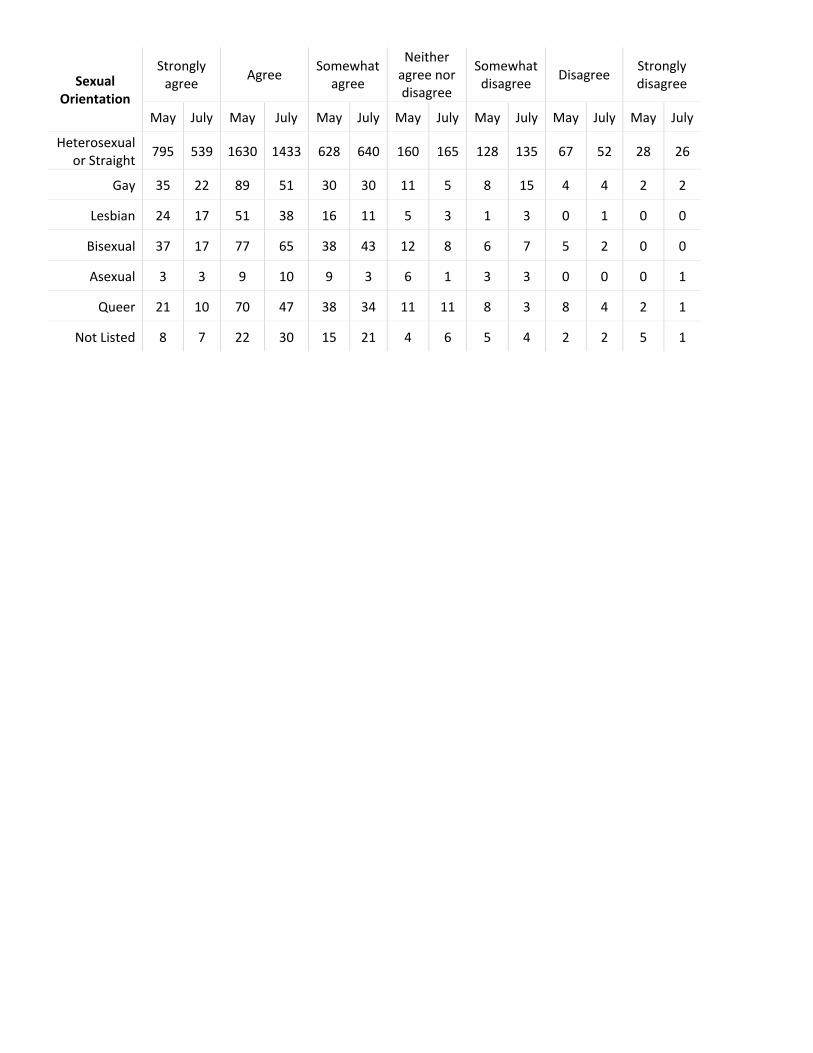
I feel that UC Berkeley is managing change around the COVID-19 outbreak well (May vs. July)
Sexual Orientation
Strongly agree Agree Somewhat
agree
Neither agree nor disagree
Somewhat disagree Disagree Strongly
disagree
May July May July May July May July May July May July May July
Heterosexual or Straight 795 539 1630 1433 628 640 160 165 128 135 67 52 28 26
Gay 35 22 89 51 30 30 11 5 8 15 4 4 2 2
Lesbian 24 17 51 38 16 11 5 3 1 3 0 1 0 0
Bisexual 37 17 77 65 38 43 12 8 6 7 5 2 0 0
Asexual 3 3 9 10 9 3 6 1 3 3 0 0 0 1
Queer 21 10 70 47 38 34 11 11 8 3 8 4 2 1
Not Listed 8 7 22 30 15 21 4 6 5 4 2 2 5 1
I feel that UC Berkeley is communicating change around the COVID-19 outbreak well (May vs. July)
# Sexual Orientation
Strongly agree Agree Somewhat
agree
Neither agree nor disagree
Somewhat disagree Disagree Strongly
disagree
May July May July May July May July May July May July May July
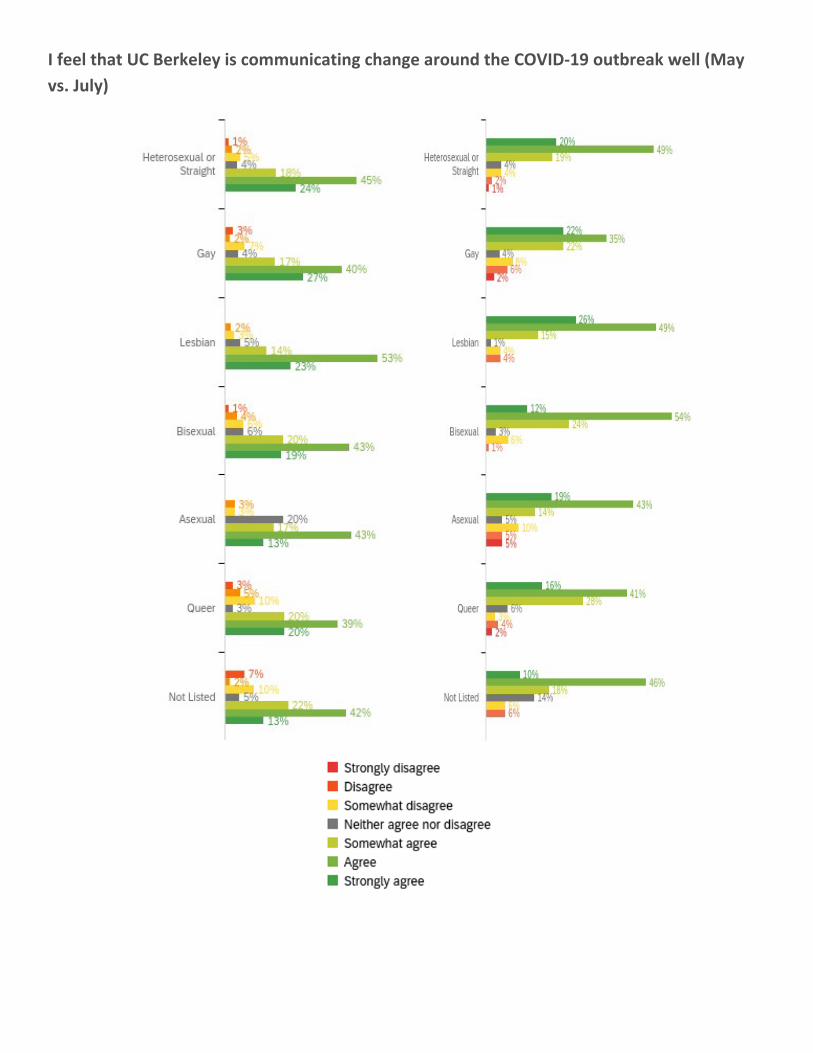
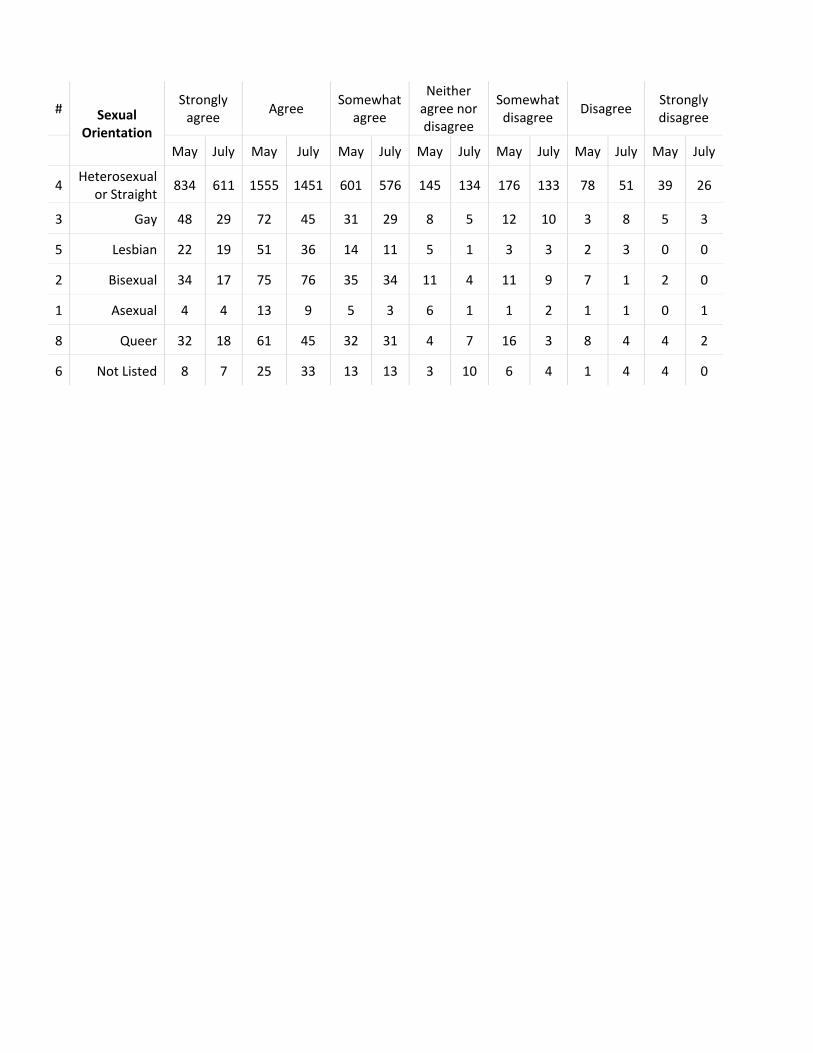
4 Heterosexual or Straight 834 611 1555 1451 601 576 145 134 176 133 78 51 39 26
3 Gay 48 29 72 45 31 29 8 5 12 10 3 8 5 3
5 Lesbian 22 19 51 36 14 11 5 1 3 3 2 3 0 0
2 Bisexual 34 17 75 76 35 34 11 4 11 9 7 1 2 0
1 Asexual 4 4 13 9 5 3 6 1 1 2 1 1 0 1
8 Queer 32 18 61 45 32 31 4 7 16 3 8 4 4 2
6 Not Listed 8 7 25 33 13 13 3 10 6 4 1 4 4 0
I feel that UC Berkeley cares about my well-being (May vs. July)

# Sexual Orientation
Strongly agree Agree Somewhat
agree
Neither agree nor disagree
Somewhat disagree Disagree Strongly
disagree
May July May July May July May July May July May July May July
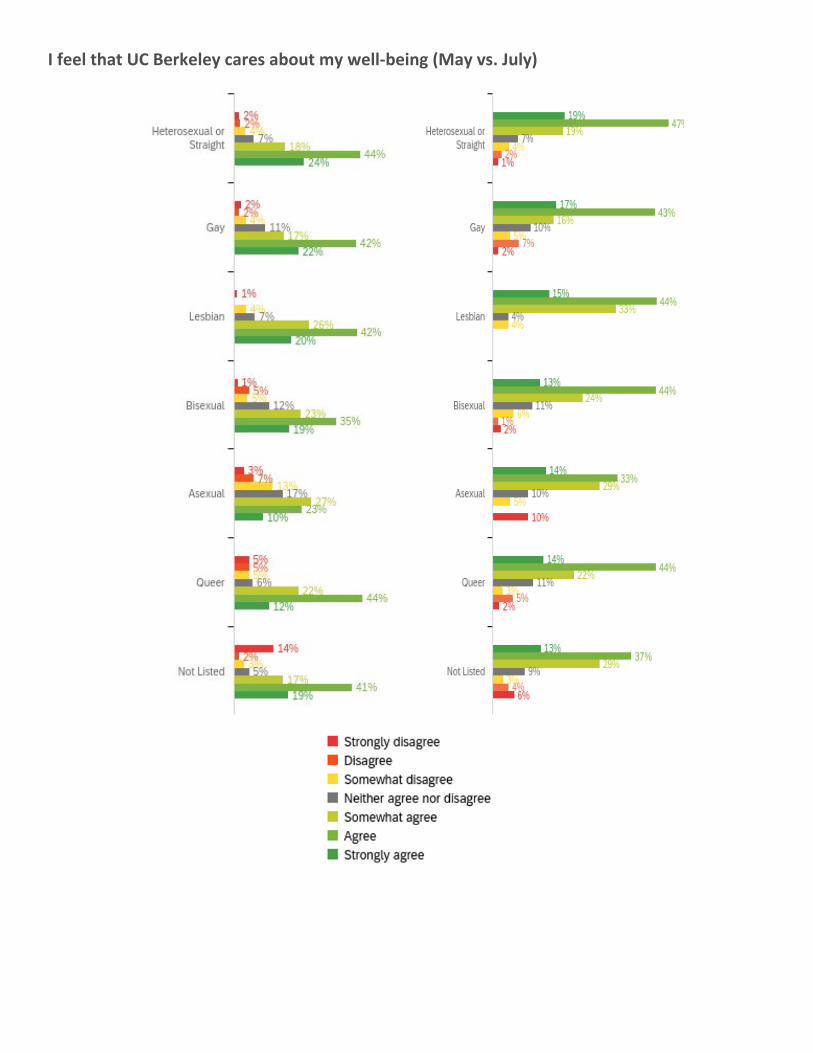
4 Heterosexual or Straight 829 576 1494 1403 603 559 235 202 134 130 74 70 59 44
3 Gay 39 22 74 56 30 21 19 13 7 6 3 9 4 2
5 Lesbian 19 11 41 32 25 24 7 3 4 3 0 0 1 0
2 Bisexual 33 18 61 62 40 34 21 15 8 8 9 2 2 3
1 Asexual 3 3 7 7 8 6 5 2 4 1 2 0 1 2
8 Queer 19 15 70 48 35 24 10 12 8 3 8 6 8 2
6 Not Listed 11 9 24 26 10 20 3 6 2 2 1 3 8 4
Q7 - My well-being is important to my immediate supervisor (May vs. July)

Question Strongly agree Agree Somewhat
agree
Neither agree nor disagree
Somewhat disagree Disagree Strongly
disagree
May July May July May July May July May July May July May July
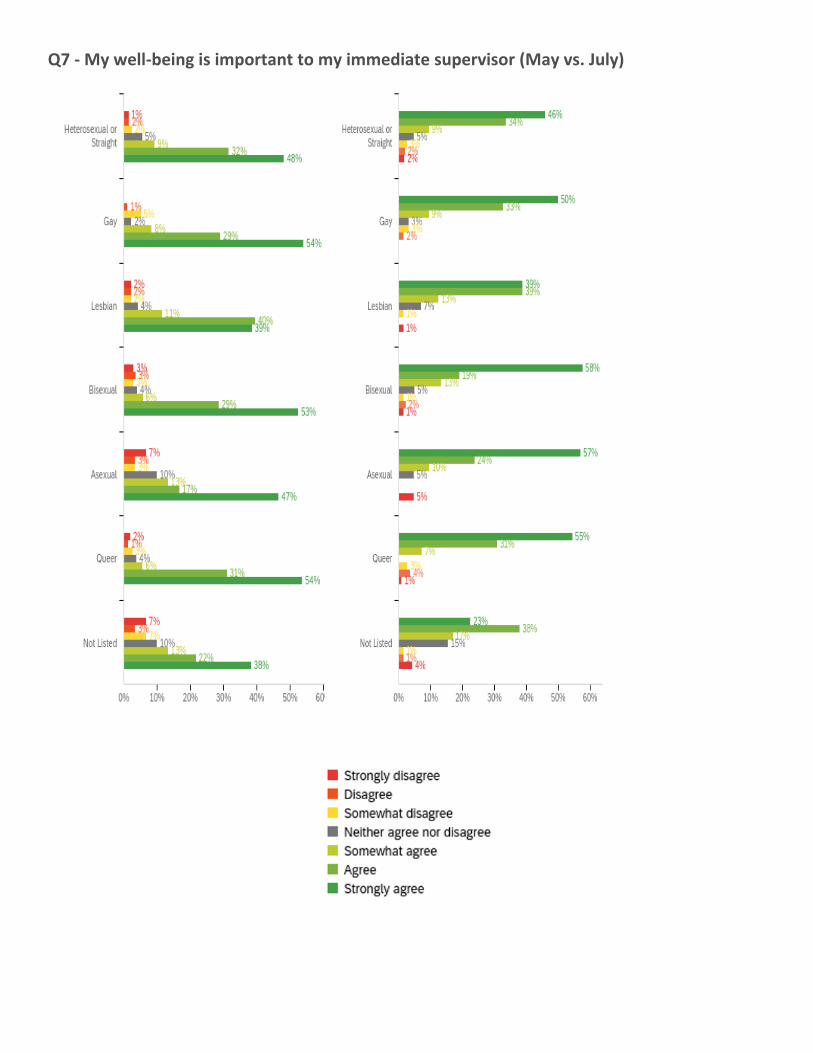
Heterosexual or Straight 1656 1371 1086 1001 317 282 188 142 81 76 53 56 48 53
Gay 97 64 52 42 15 12 4 4 9 4 2 2 0 0
Lesbian 37 28 38 28 11 9 4 5 2 1 2 0 2 1
Bisexual 92 82 50 27 10 19 7 7 5 2 6 3 5 2
Asexual 14 12 5 5 4 2 3 1 1 0 1 0 2 1
Queer 85 60 49 34 9 8 6 0 4 3 2 4 3 1
Not Listed 23 16 13 27 8 12 6 11 4 1 2 1 4 3
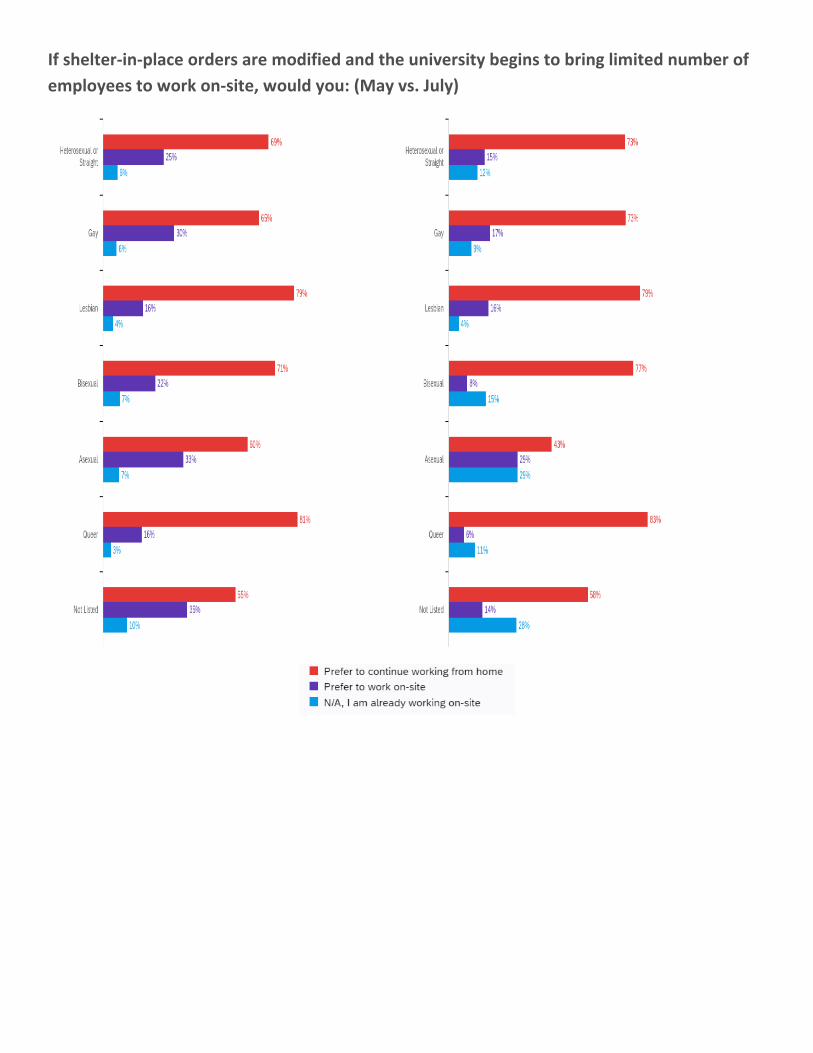
If shelter-in-place orders are modified and the university begins to bring limited number of employees to work on-site, would you: (May vs. July)
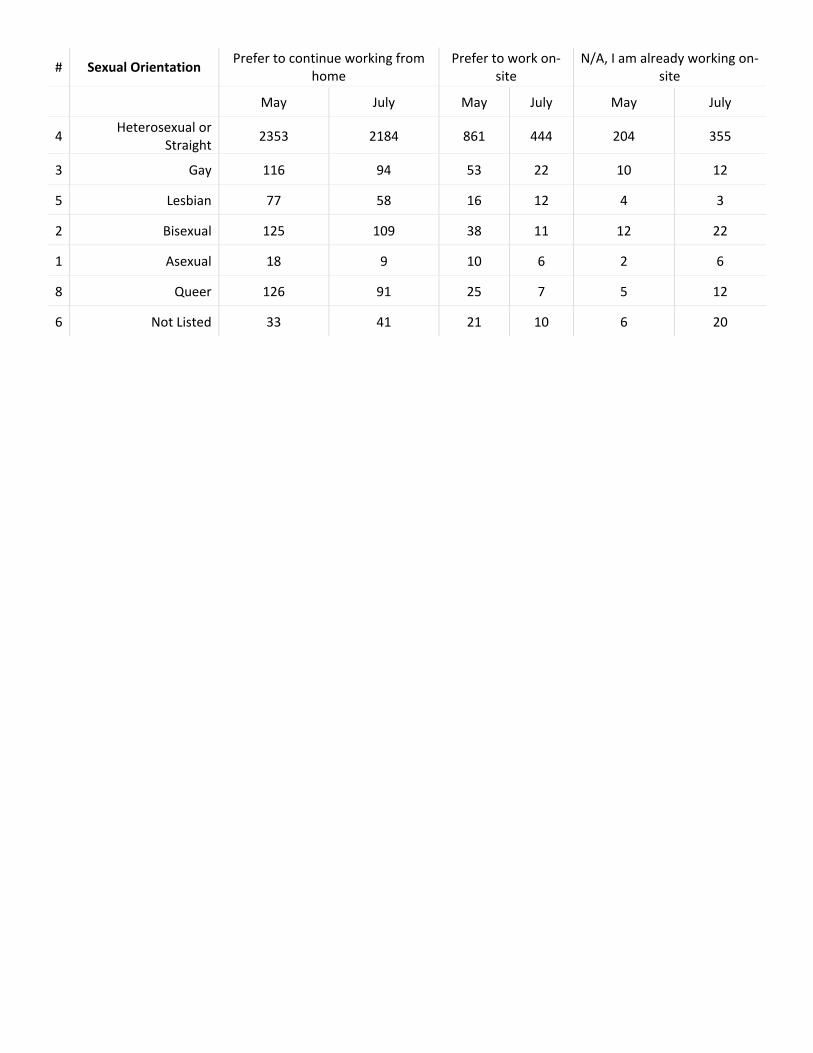
# Sexual Orientation Prefer to continue working from home
Prefer to work on-site
N/A, I am already working on-site
May July May July May July
4 Heterosexual or Straight 2353 2184 861 444 204 355
3 Gay 116 94 53 22 10 12
5 Lesbian 77 58 16 12 4 3
2 Bisexual 125 109 38 11 12 22
1 Asexual 18 9 10 6 2 6
8 Queer 126 91 25 7 5 12
6 Not Listed 33 41 21 10 6 20

Would you be interested in answering four questions about child/dependent care and its impact on your work? (July 2020)
# Question Yes No Total
4 Heterosexual or Straight 60% 1796 40% 1185 2981
3 Gay 17% 22 83% 107 129
5 Lesbian 53% 39 47% 34 73
2 Bisexual 46% 66 54% 76 142
1 Asexual 10% 2 90% 19 21
8 Queer 41% 45 59% 65 110
6 Not Listed 54% 38 46% 33 71
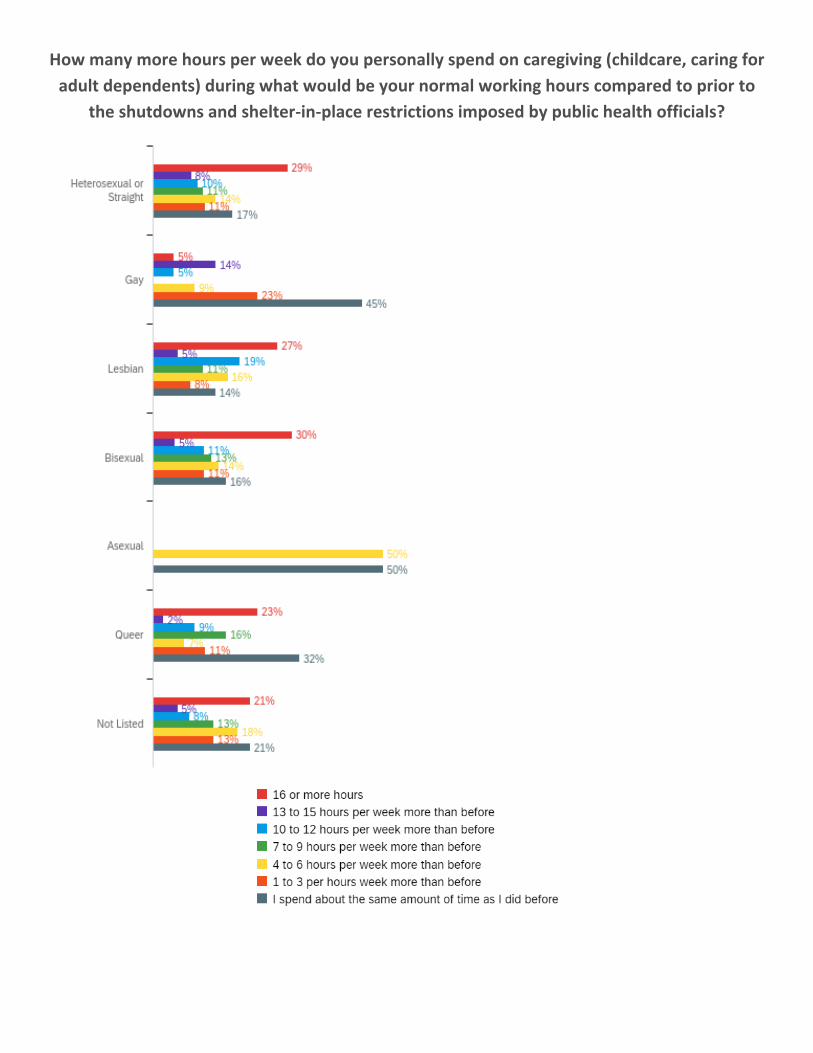
How many more hours per week do you personally spend on caregiving (childcare, caring for adult dependents) during what would be your normal working hours compared to prior to
the shutdowns and shelter-in-place restrictions imposed by public health officials?
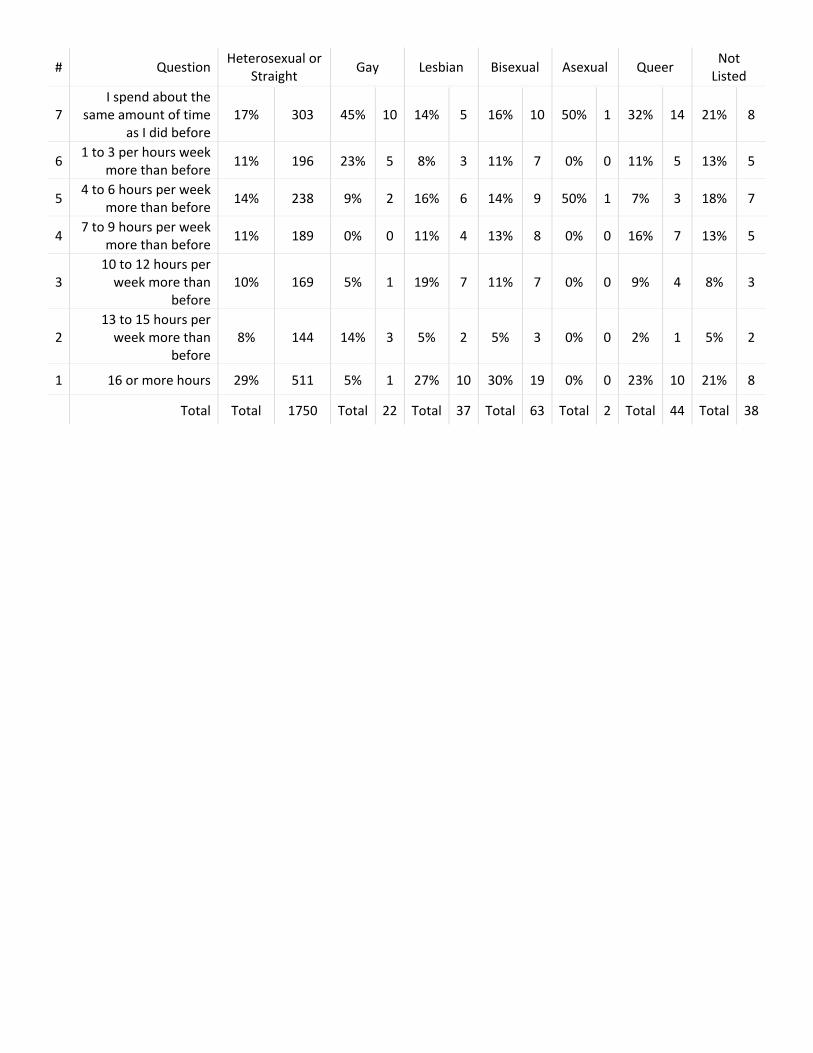
# Question Heterosexual or Straight Gay Lesbian Bisexual Asexual Queer Not
Listed
7 I spend about the
same amount of time as I did before
17% 303 45% 10 14% 5 16% 10 50% 1 32% 14 21% 8
6 1 to 3 per hours week more than before 11% 196 23% 5 8% 3 11% 7 0% 0 11% 5 13% 5
5 4 to 6 hours per week more than before 14% 238 9% 2 16% 6 14% 9 50% 1 7% 3 18% 7
4 7 to 9 hours per week more than before 11% 189 0% 0 11% 4 13% 8 0% 0 16% 7 13% 5
3 10 to 12 hours per
week more than before
10% 169 5% 1 19% 7 11% 7 0% 0 9% 4 8% 3
2 13 to 15 hours per
week more than before
8% 144 14% 3 5% 2 5% 3 0% 0 2% 1 5% 2
1 16 or more hours 29% 511 5% 1 27% 10 30% 19 0% 0 23% 10 21% 8
Total Total 1750 Total 22 Total 37 Total 63 Total 2 Total 44 Total 38

How do you think your current caregiving needs will affect your career development?
# Question No or little effect
Some negative
effect
Significant negative effect
Extreme negative effect
It will cause me to leave my job Total
4 Heterosexual or Straight 29% 512 40% 699 22% 380 7% 128 2% 27 1746
3 Gay 55% 12 27% 6 14% 3 5% 1 0% 0 22
5 Lesbian 22% 8 59% 22 14% 5 5% 2 0% 0 37
2 Bisexual 33% 21 34% 22 20% 13 9% 6 3% 2 64
1 Asexual 50% 1 0% 0 50% 1 0% 0 0% 0 2
8 Queer 39% 17 43% 19 16% 7 2% 1 0% 0 44
6 Not Listed 29% 11 47% 18 11% 4 11% 4 3% 1 38
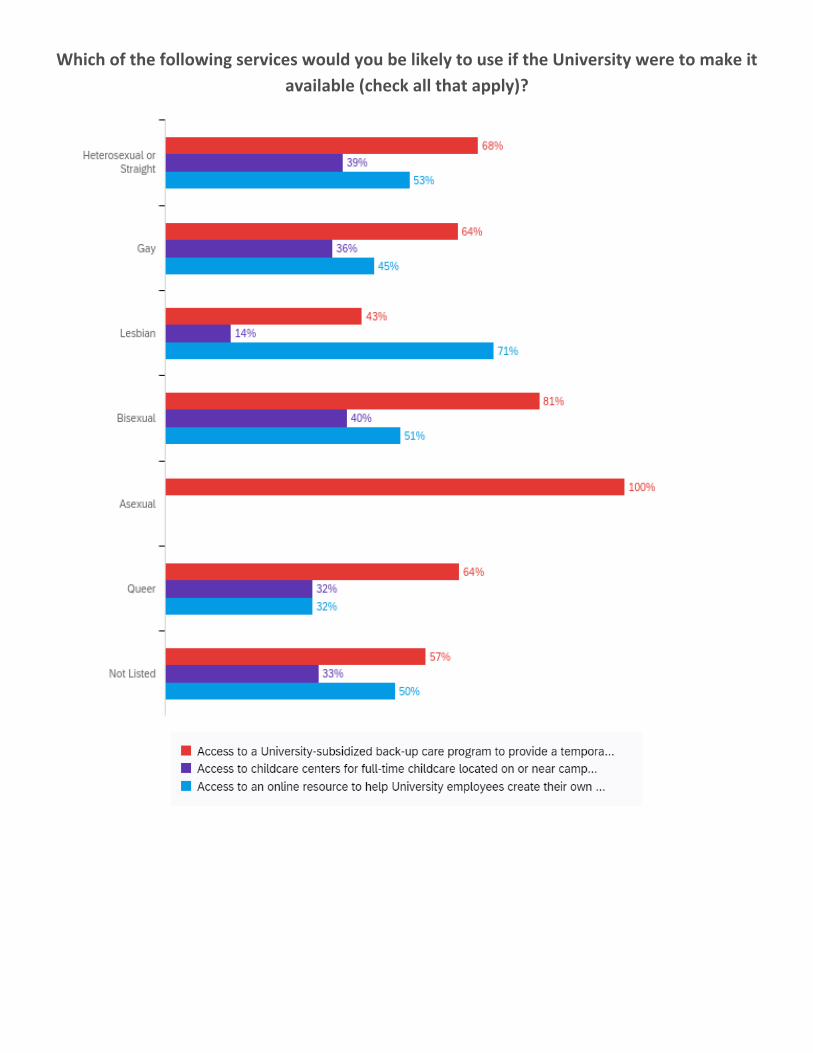
Which of the following services would you be likely to use if the University were to make it available (check all that apply)?
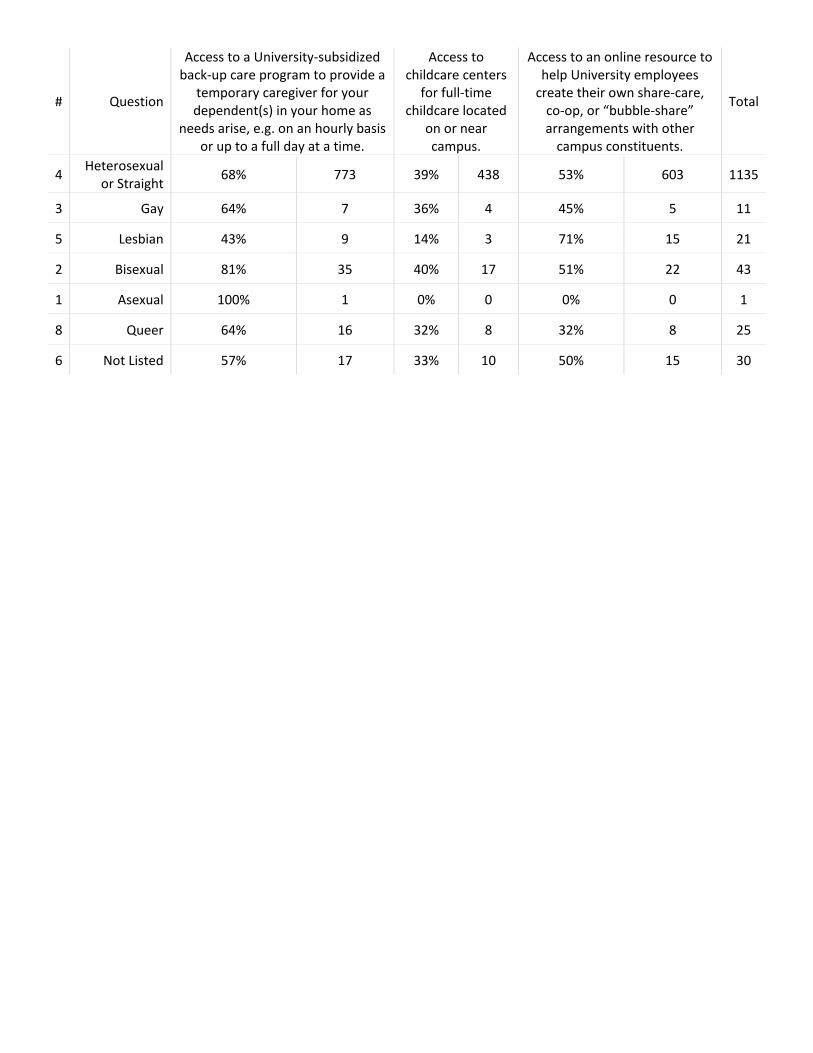
# Question
Access to a University-subsidized back-up care program to provide a
temporary caregiver for your dependent(s) in your home as
needs arise, e.g. on an hourly basis or up to a full day at a time.
Access to childcare centers
for full-time childcare located
on or near campus.
Access to an online resource to help University employees
create their own share-care, co-op, or “bubble-share” arrangements with other
campus constituents.
Total
4 Heterosexual or Straight 68% 773 39% 438 53% 603 1135
3 Gay 64% 7 36% 4 45% 5 11
5 Lesbian 43% 9 14% 3 71% 15 21
2 Bisexual 81% 35 40% 17 51% 22 43
1 Asexual 100% 1 0% 0 0% 0 1
8 Queer 64% 16 32% 8 32% 8 25
6 Not Listed 57% 17 33% 10 50% 15 30
Employee Morale Survey July 2020
Disability Status
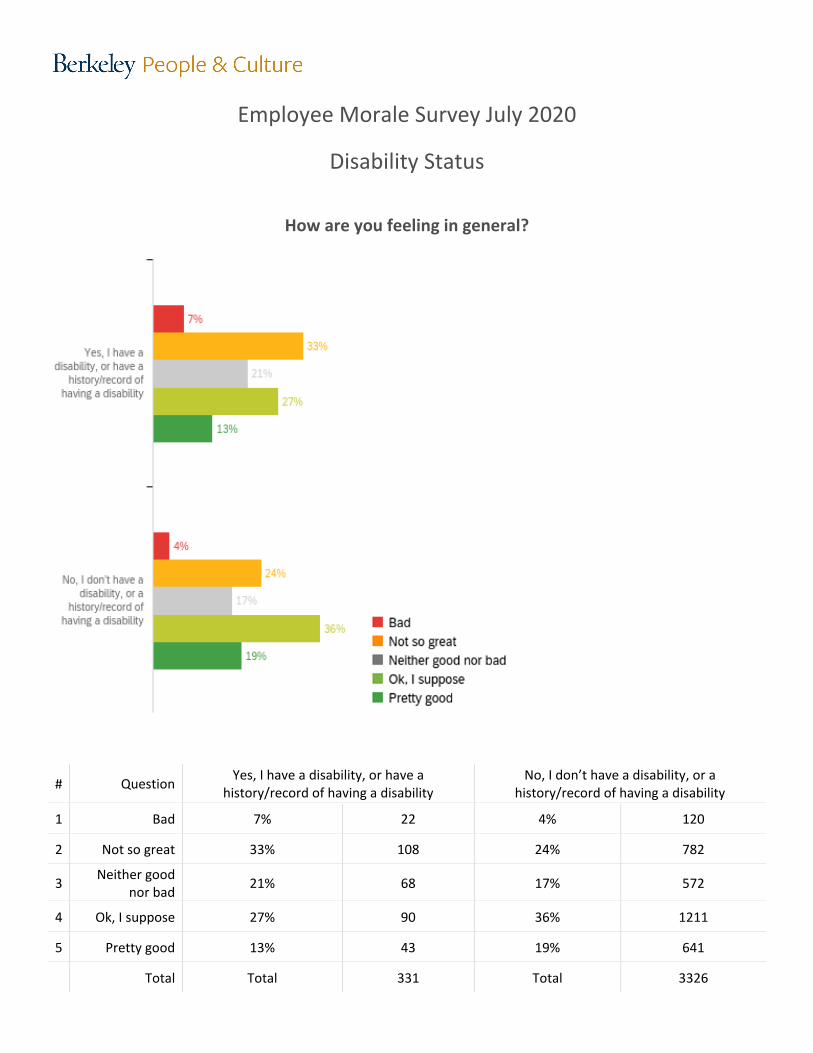
How are you feeling in general?
# Question Yes, I have a disability, or have a history/record of having a disability
No, I don’t have a disability, or a history/record of having a disability
1 Bad 7% 22 4% 120
2 Not so great 33% 108 24% 782
3 Neither good nor bad 21% 68 17% 572
4 Ok, I suppose 27% 90 36% 1211
5 Pretty good 13% 43 19% 641
Total Total 331 Total 3326
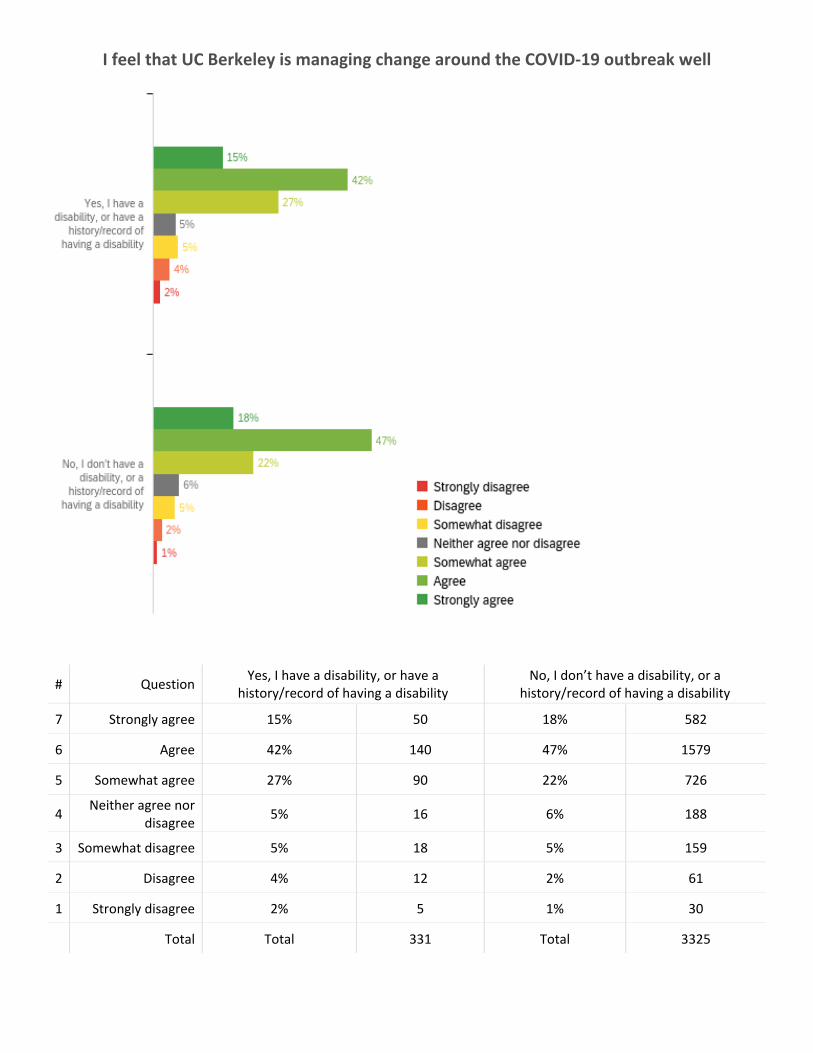
I feel that UC Berkeley is managing change around the COVID-19 outbreak well
# Question Yes, I have a disability, or have a history/record of having a disability
No, I don’t have a disability, or a history/record of having a disability
7 Strongly agree 15% 50 18% 582
6 Agree 42% 140 47% 1579
5 Somewhat agree 27% 90 22% 726
4 Neither agree nor disagree 5% 16 6% 188
3 Somewhat disagree 5% 18 5% 159
2 Disagree 4% 12 2% 61
1 Strongly disagree 2% 5 1% 30
Total Total 331 Total 3325
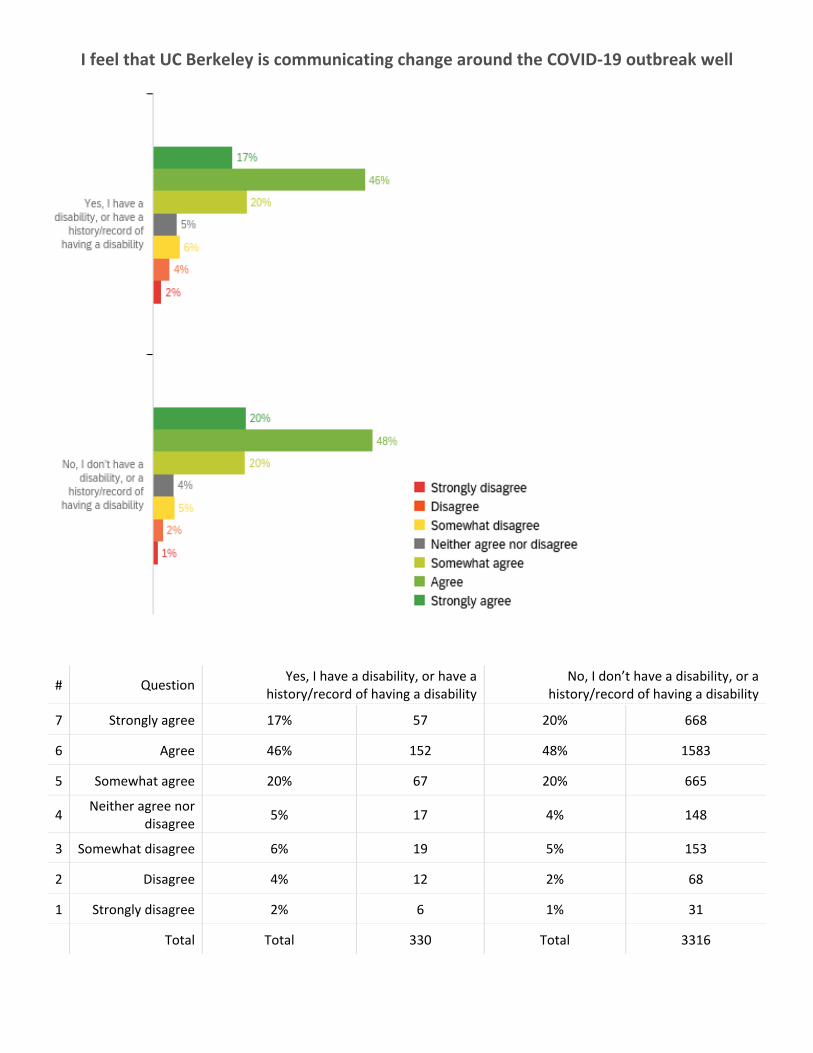
I feel that UC Berkeley is communicating change around the COVID-19 outbreak well
# Question Yes, I have a disability, or have a history/record of having a disability
No, I don’t have a disability, or a history/record of having a disability
7 Strongly agree 17% 57 20% 668
6 Agree 46% 152 48% 1583
5 Somewhat agree 20% 67 20% 665
4 Neither agree nor disagree 5% 17 4% 148
3 Somewhat disagree 6% 19 5% 153
2 Disagree 4% 12 2% 68
1 Strongly disagree 2% 6 1% 31
Total Total 330 Total 3316
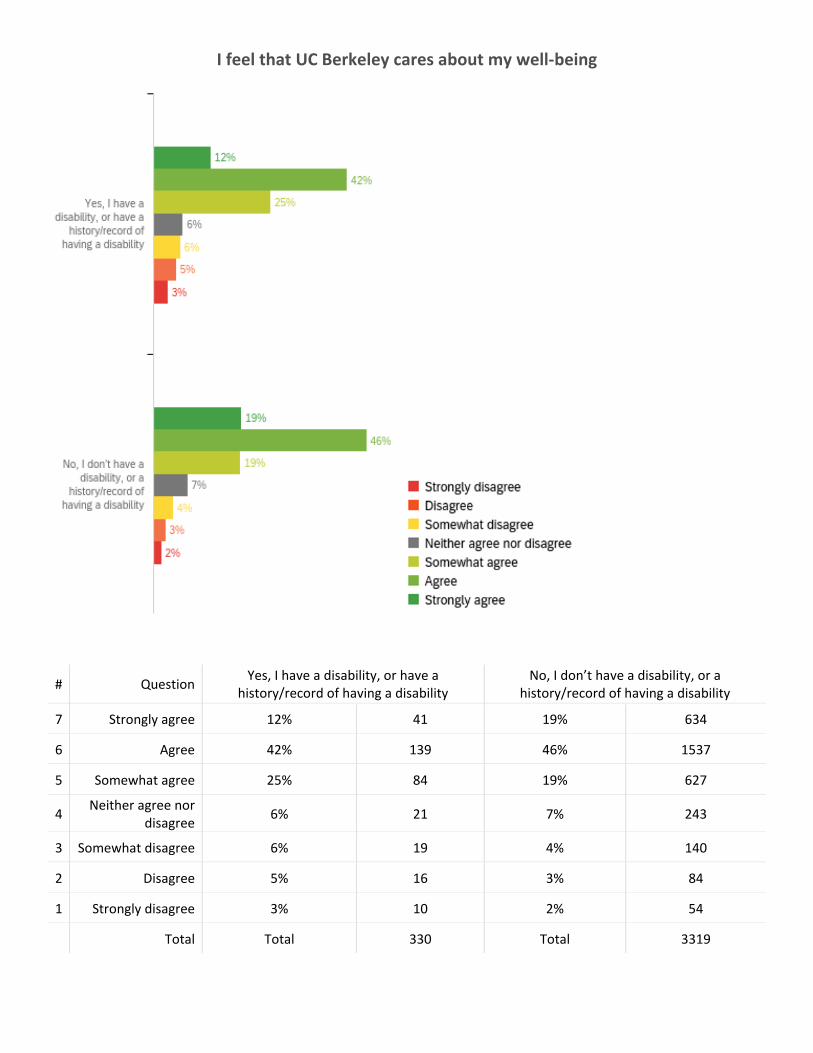
I feel that UC Berkeley cares about my well-being
# Question Yes, I have a disability, or have a history/record of having a disability
No, I don’t have a disability, or a history/record of having a disability
7 Strongly agree 12% 41 19% 634
6 Agree 42% 139 46% 1537
5 Somewhat agree 25% 84 19% 627
4 Neither agree nor disagree 6% 21 7% 243
3 Somewhat disagree 6% 19 4% 140
2 Disagree 5% 16 3% 84
1 Strongly disagree 3% 10 2% 54
Total Total 330 Total 3319
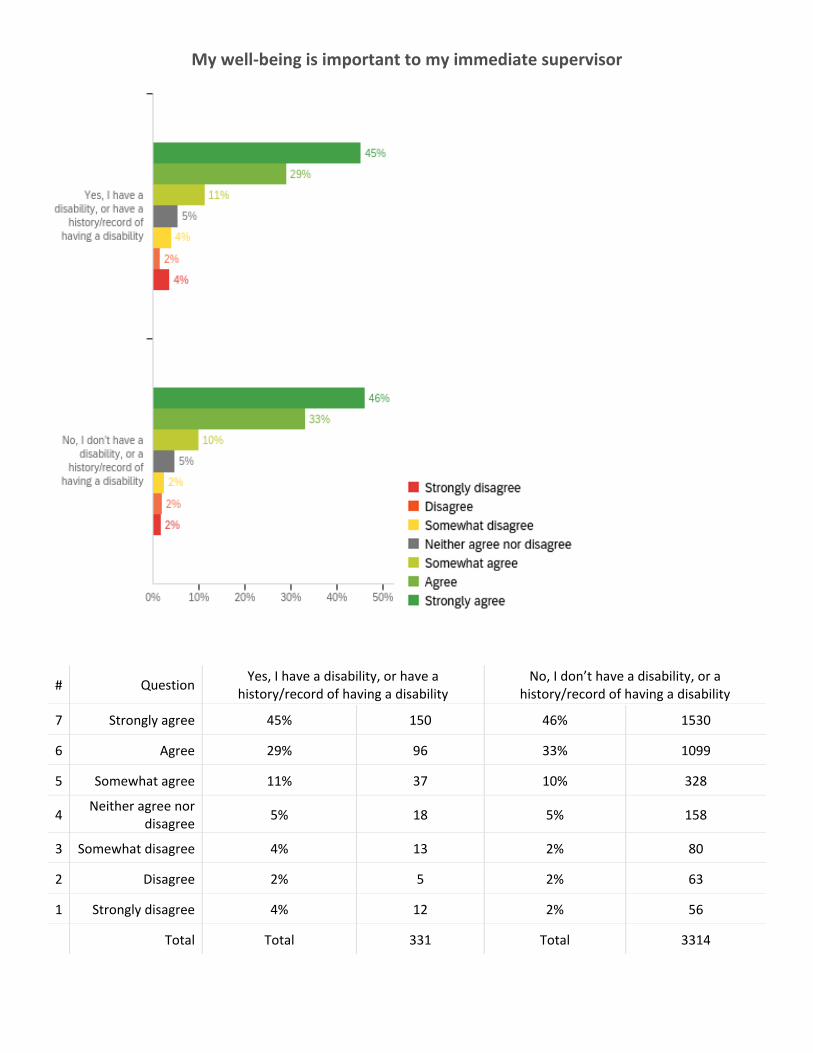
My well-being is important to my immediate supervisor
# Question Yes, I have a disability, or have a history/record of having a disability
No, I don’t have a disability, or a history/record of having a disability
7 Strongly agree 45% 150 46% 1530
6 Agree 29% 96 33% 1099
5 Somewhat agree 11% 37 10% 328
4 Neither agree nor disagree 5% 18 5% 158
3 Somewhat disagree 4% 13 2% 80
2 Disagree 2% 5 2% 63
1 Strongly disagree 4% 12 2% 56
Total Total 331 Total 3314

If shelter-in-place orders are modified and the university begins to bring limited number of employees to work on-site, would you:
# Question Yes, I have a disability, or have a history/record of having a disability
No, I don’t have a disability, or a history/record of having a disability
1 Prefer to continue working from home 76% 253 73% 2413
2 Prefer to work on-site 11% 38 15% 490
4 N/A, I am already working on-site 12% 40 12% 412
Total Total 331 Total 3315
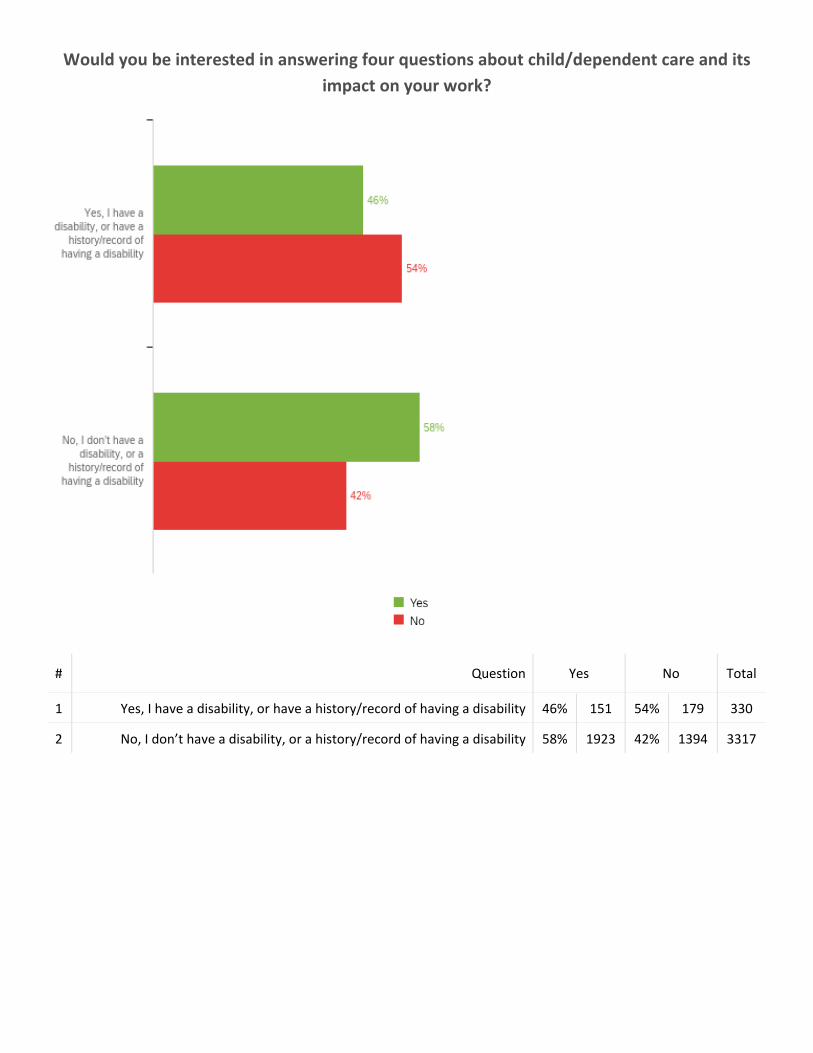
Would you be interested in answering four questions about child/dependent care and its impact on your work?
# Question Yes No Total
1 Yes, I have a disability, or have a history/record of having a disability 46% 151 54% 179 330
2 No, I don’t have a disability, or a history/record of having a disability 58% 1923 42% 1394 3317
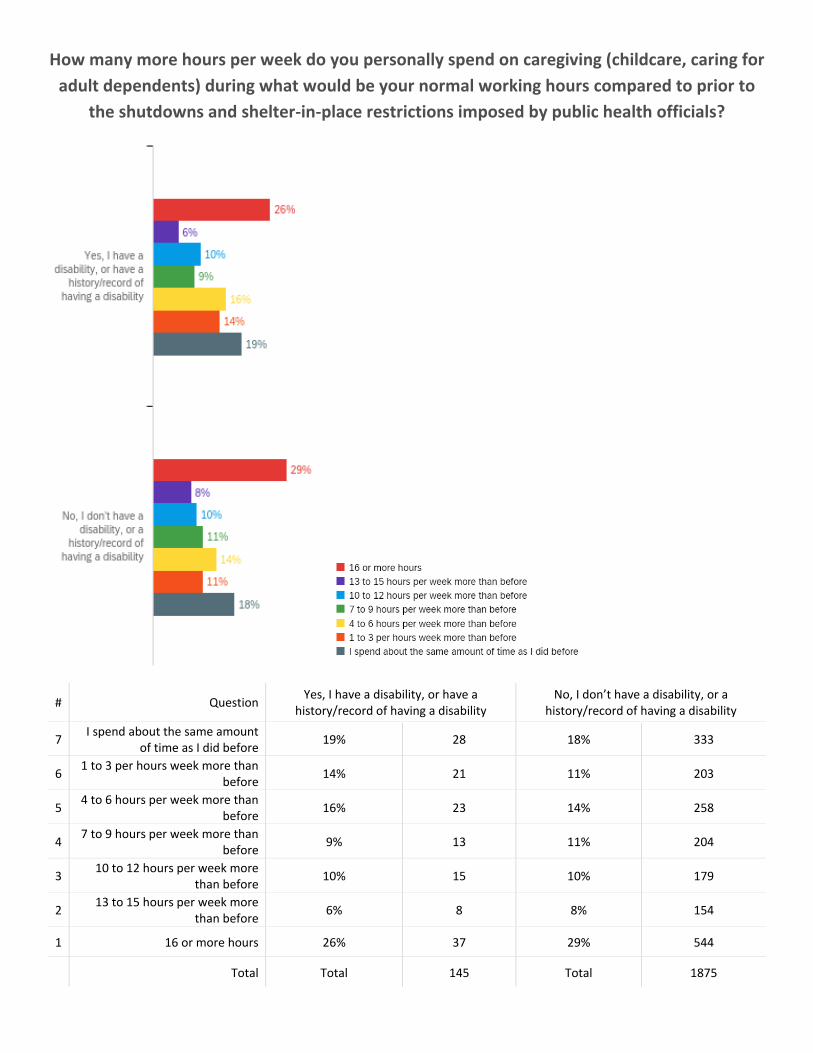
How many more hours per week do you personally spend on caregiving (childcare, caring for adult dependents) during what would be your normal working hours compared to prior to
the shutdowns and shelter-in-place restrictions imposed by public health officials?
# Question Yes, I have a disability, or have a history/record of having a disability
No, I don’t have a disability, or a history/record of having a disability
7 I spend about the same amount of time as I did before 19% 28 18% 333
6 1 to 3 per hours week more than before 14% 21 11% 203
5 4 to 6 hours per week more than before 16% 23 14% 258
4 7 to 9 hours per week more than before 9% 13 11% 204
3 10 to 12 hours per week more than before 10% 15 10% 179
2 13 to 15 hours per week more than before 6% 8 8% 154
1 16 or more hours 26% 37 29% 544
Total Total 145 Total 1875
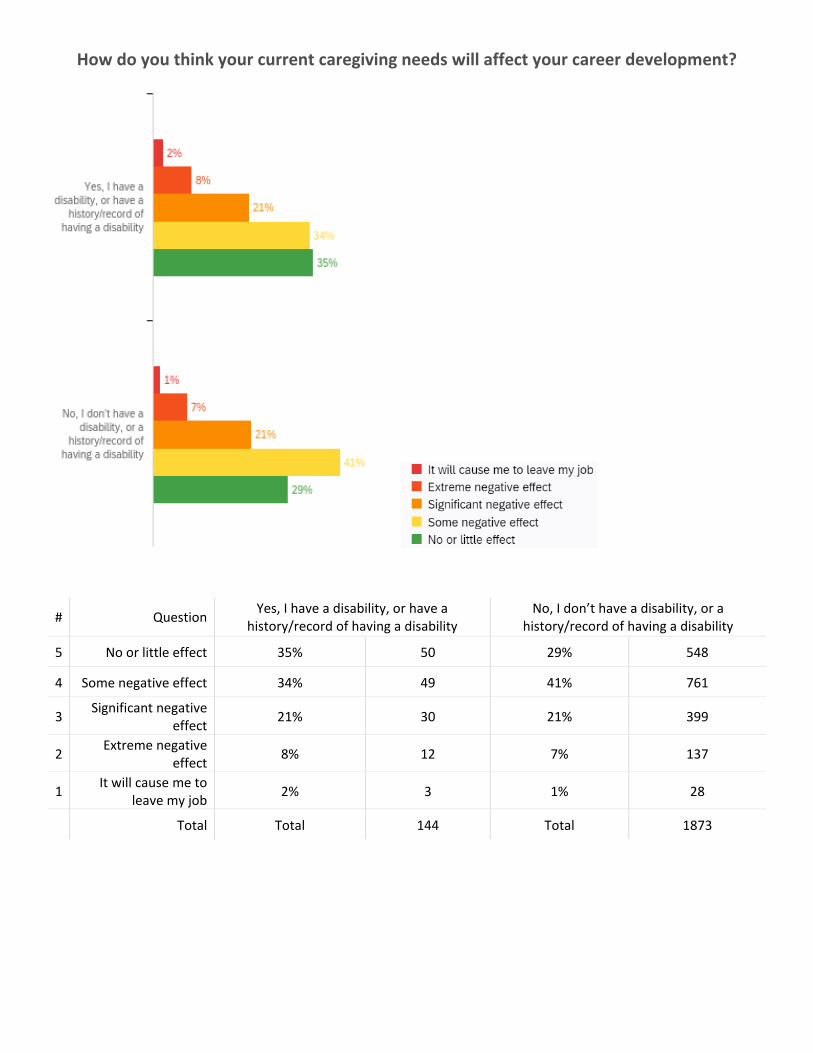
How do you think your current caregiving needs will affect your career development?
# Question Yes, I have a disability, or have a history/record of having a disability
No, I don’t have a disability, or a history/record of having a disability
5 No or little effect 35% 50 29% 548
4 Some negative effect 34% 49 41% 761
3 Significant negative effect 21% 30 21% 399
2 Extreme negative effect 8% 12 7% 137
1 It will cause me to leave my job 2% 3 1% 28
Total Total 144 Total 1873
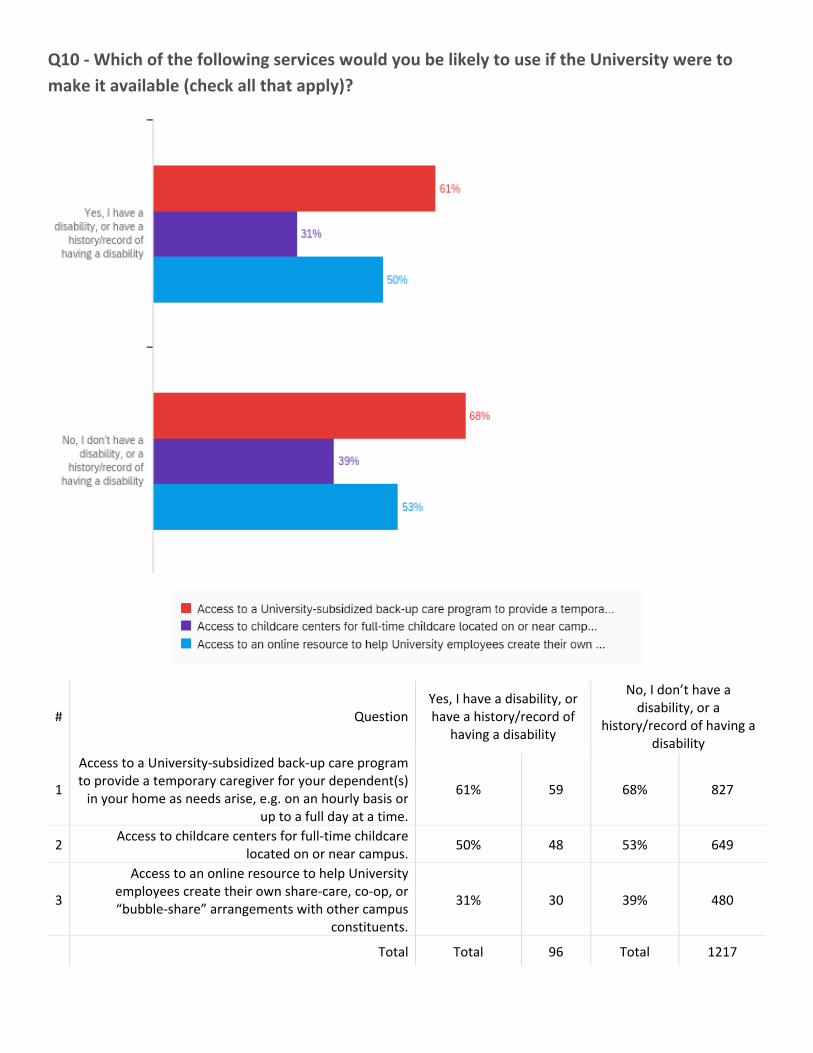
Q10 - Which of the following services would you be likely to use if the University were to make it available (check all that apply)?
# Question Yes, I have a disability, or have a history/record of
having a disability
No, I don’t have a disability, or a
history/record of having a disability
1
Access to a University-subsidized back-up care program to provide a temporary caregiver for your dependent(s)
in your home as needs arise, e.g. on an hourly basis or up to a full day at a time.
61% 59 68% 827
2 Access to childcare centers for full-time childcare located on or near campus. 50% 48 53% 649
3
Access to an online resource to help University employees create their own share-care, co-op, or “bubble-share” arrangements with other campus
constituents.
31% 30 39% 480
Total Total 96 Total 1217
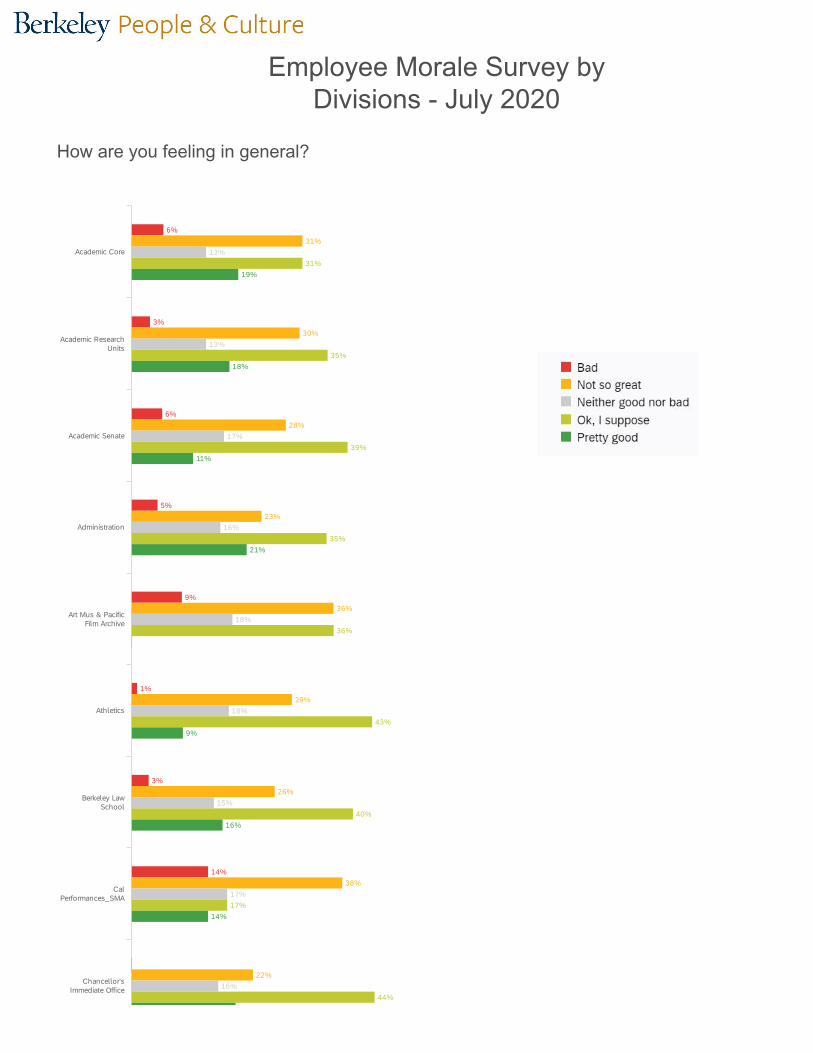
Employee Morale Survey by Divisions - July 2020
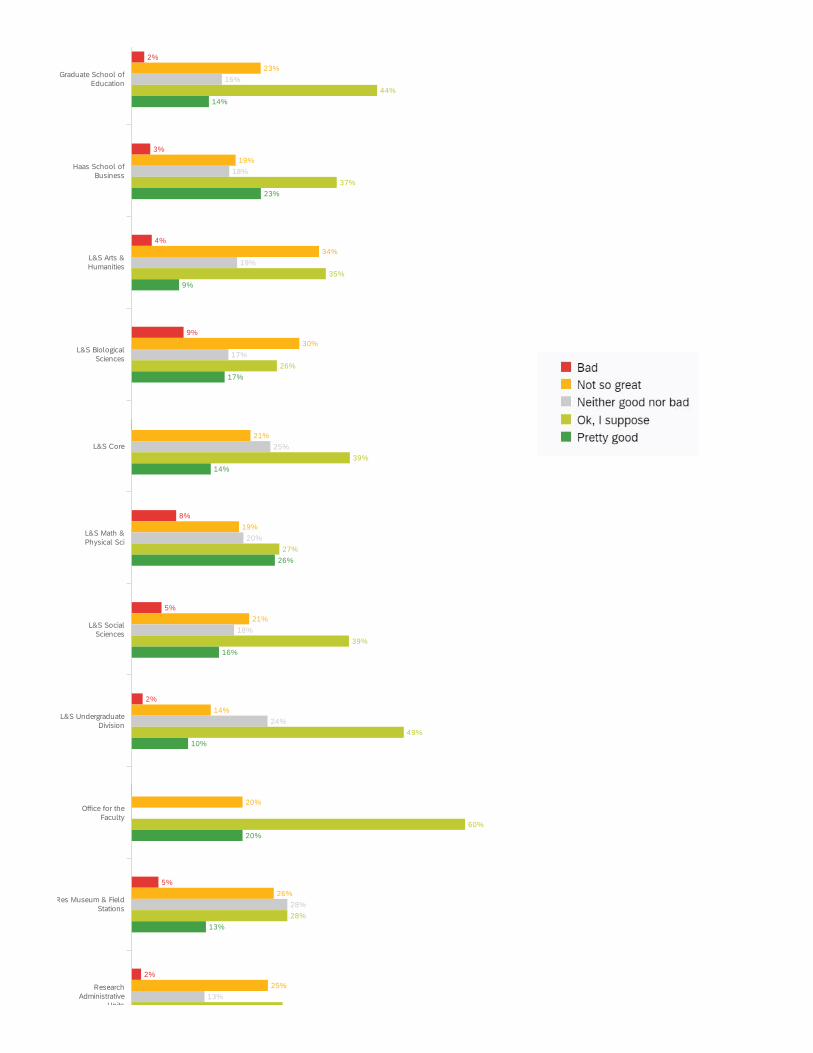
How are you feeling in general?
6%
3%
6%
5%
9%
1%
3%
14%
31%
30%
28%
23%
36%
29%
26%
38%
22%
13%
13%
17%
16%
18%
18%
15%
17%
16%
31%
35%
39%
35%
36%
43%
40%
17%
44%
19%
18%
11%
21%
9%
16%
14%
Academic Core
Athletics
Academic ResearchUnits
Academic Senate
Administration
Art Mus & PacificFilm Archive
Berkeley LawSchool
CalPerformances_SMA
Chancellor'sImmediate Office

3%
8%
6%
2%
11%
5%
2%
5%
16%
13%
38%
25%
24%
25%
17%
33%
11%
35%
16%
27%
18%
13%
22%
16%
17%
23%
21%
15%
11%
47%
36%
28%
32%
41%
33%
24%
42%
40%
42%
19%
13%
5%
25%
16%
16%
22%
15%
24%
5%
16%
Col ofEnvironmental
Design
Equity & InclusionDiv
Central AccountingLedger
College ofChemistry
College ofEngineering
College of NaturalResources
Division of DataScience
Finance
Goldman Sch ofPublic Policy
Graduate Division
2%
3%
4%
9%
8%
5%
2%
5%
2%
23%
19%
34%
30%
21%
19%
21%
14%
20%
26%
25%
16%
18%
19%
17%
25%
20%
18%
24%
28%
13%
44%
37%
35%
26%
39%
27%
39%
49%
60%
28%
2
14%
23%
9%
17%
14%
26%
16%
10%
20%
13%
Haas School ofBusiness
L&S SocialSciences
Graduate School ofEducation
L&S Arts &Humanities
L&S BiologicalSciences
L&S Core
L&S Math &Physical Sci
L&S UndergraduateDivision
Office for theFaculty
Res Museum & FieldStations
ResearchAdministrative
Units

2%
4%
4%
6%
29%
45%
27%
24%
21%
17%
22%
35%
30%
18%
21%
18%
22%
23%
16%
50%
16%
13%
18%
18%
27%
32%
27%
33%
32%
47%
39%
43%
34%
36%
33%
18%
9%
16%
17%
16%
33%
19%
9%
11%
28%
School ofInformation
Strategic Acad andFac Plan
Units
School ofJournalism
School ofOptometry
School of PublicHealth
School of SocialWelfare
Student Affairs
Summer Sessn,Study Abrd, OLLI
UC Library
UndergraduateEducation

3%
1%
6%
23%
22%
100%
29%
12%
17%
14%
41%
49%
33%
21%
11%
18%
Univ Developmt andAlumni Rel
UniversityExtension
VP Agriculture&Natural Resour
VP Research - MRUs
# Field Bad Not so great Neither good nor bad Ok, I suppose Pretty good Total
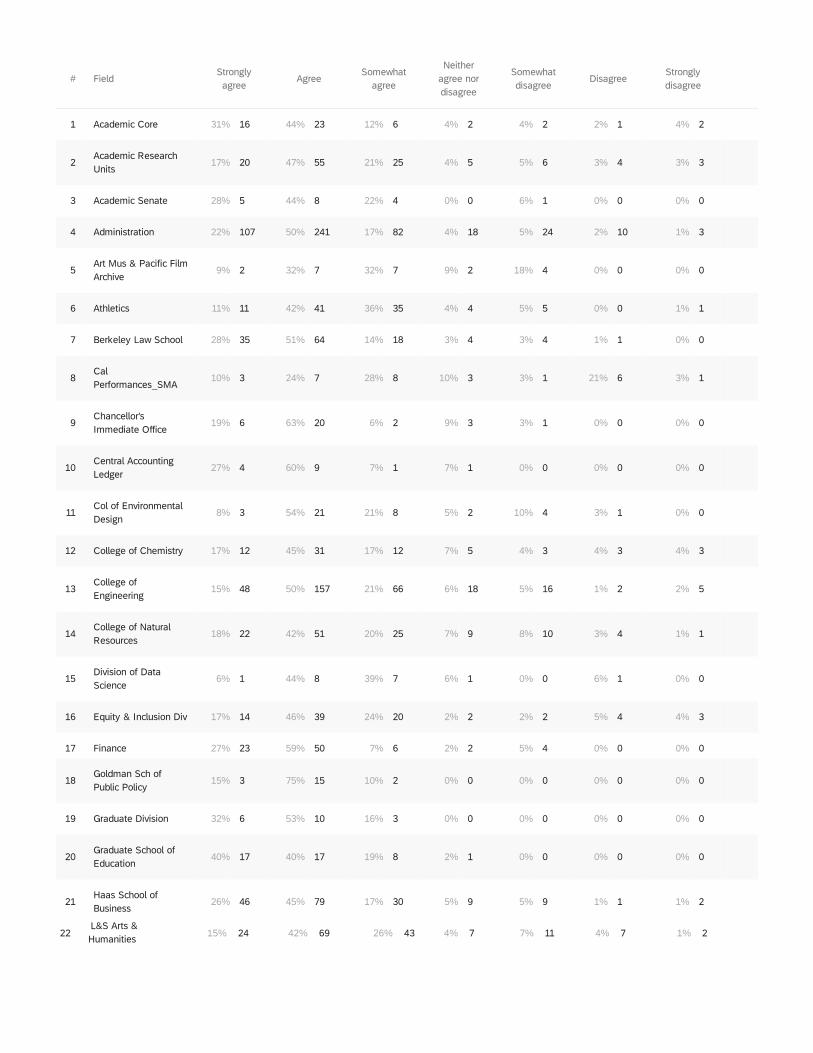
1 Academic Core 6% 3 31% 16 13% 7 31% 16 19% 10 52
2 Academic Research Units 3% 4 30% 36 13% 16 35% 42 18% 21 119
3 Academic Senate 6% 1 28% 5 17% 3 39% 7 11% 2 18
4 Administration 5% 23 23% 114 16% 78 35% 171 21% 101 487
5 Art Mus & Pacific Film Archive 9% 2 36% 8 18% 4 36% 8 0% 0 22
6 Athletics 1% 1 29% 28 18% 17 43% 42 9% 9 97
7 Berkeley Law School 3% 4 26% 33 15% 19 40% 51 16% 21 128
8 Cal Performances_SMA 14% 4 38% 11 17% 5 17% 5 14% 4 29
9 Chancellor's Immediate Office 0% 0 22% 7 16% 5 44% 14 19% 6 32
10 Central Accounting Ledger 0% 0 13% 2 27% 4 47% 7 13% 2 15
11 Col of Environmental Design 3% 1 38% 15 18% 7 36% 14 5% 2 39
12 College of Chemistry 8% 6 25% 18 13% 9 28% 20 25% 18 71
13 College of Engineering 6% 19 24% 76 22% 68 32% 99 16% 51 313
14 College of Natural Resources 2% 2 25% 30 16% 20 41% 50 16% 20 122
15 Division of Data Science 11% 2 17% 3 17% 3 33% 6 22% 4 18
16 Equity & Inclusion Div 5% 4 33% 28 23% 19 24% 20 15% 13 84
17 Finance 2% 2 11% 9 21% 18 42% 36 24% 20 85
Showing rows 1 - 44 of 44
# Field Bad Not so great Neither good nor bad Ok, I suppose Pretty good Total
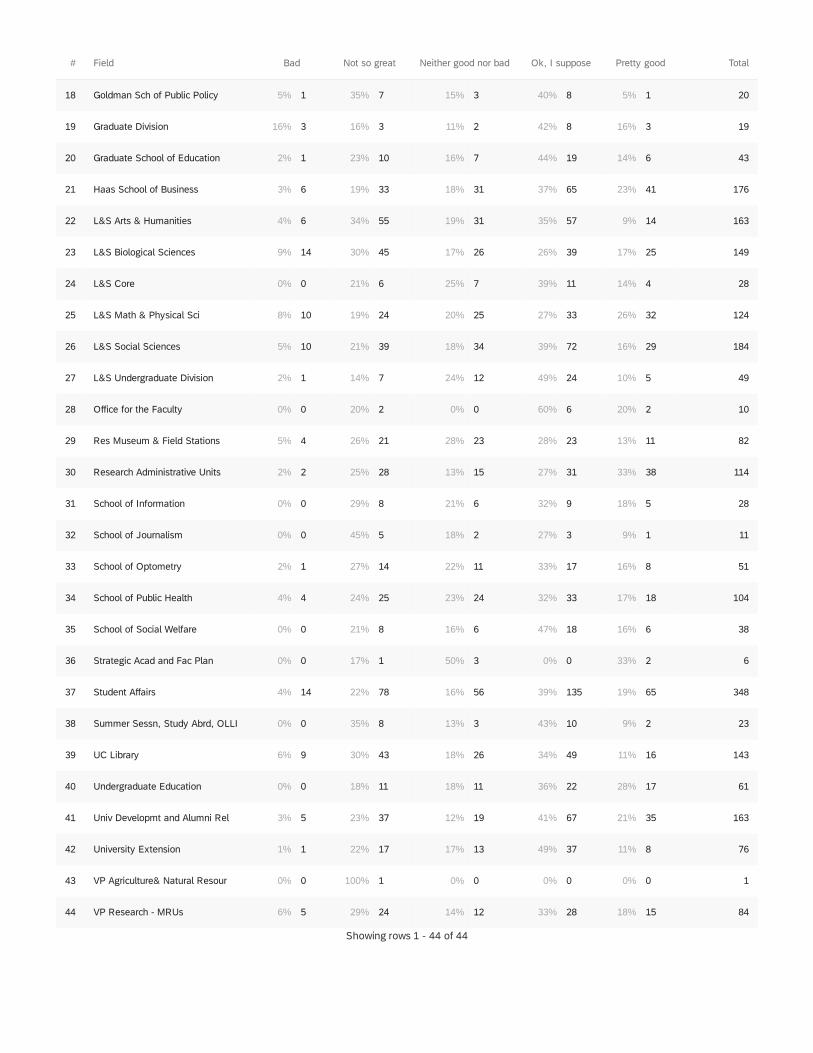
18 Goldman Sch of Public Policy 5% 1 35% 7 15% 3 40% 8 5% 1 20
19 Graduate Division 16% 3 16% 3 11% 2 42% 8 16% 3 19
20 Graduate School of Education 2% 1 23% 10 16% 7 44% 19 14% 6 43
21 Haas School of Business 3% 6 19% 33 18% 31 37% 65 23% 41 176
22 L&S Arts & Humanities 4% 6 34% 55 19% 31 35% 57 9% 14 163
23 L&S Biological Sciences 9% 14 30% 45 17% 26 26% 39 17% 25 149
24 L&S Core 0% 0 21% 6 25% 7 39% 11 14% 4 28
25 L&S Math & Physical Sci 8% 10 19% 24 20% 25 27% 33 26% 32 124
26 L&S Social Sciences 5% 10 21% 39 18% 34 39% 72 16% 29 184
27 L&S Undergraduate Division 2% 1 14% 7 24% 12 49% 24 10% 5 49
28 Office for the Faculty 0% 0 20% 2 0% 0 60% 6 20% 2 10
29 Res Museum & Field Stations 5% 4 26% 21 28% 23 28% 23 13% 11 82
30 Research Administrative Units 2% 2 25% 28 13% 15 27% 31 33% 38 114
31 School of Information 0% 0 29% 8 21% 6 32% 9 18% 5 28
32 School of Journalism 0% 0 45% 5 18% 2 27% 3 9% 1 11
33 School of Optometry 2% 1 27% 14 22% 11 33% 17 16% 8 51
34 School of Public Health 4% 4 24% 25 23% 24 32% 33 17% 18 104
35 School of Social Welfare 0% 0 21% 8 16% 6 47% 18 16% 6 38
36 Strategic Acad and Fac Plan 0% 0 17% 1 50% 3 0% 0 33% 2 6
37 Student Affairs 4% 14 22% 78 16% 56 39% 135 19% 65 348
38 Summer Sessn, Study Abrd, OLLI 0% 0 35% 8 13% 3 43% 10 9% 2 23
39 UC Library 6% 9 30% 43 18% 26 34% 49 11% 16 143
40 Undergraduate Education 0% 0 18% 11 18% 11 36% 22 28% 17 61
41 Univ Developmt and Alumni Rel 3% 5 23% 37 12% 19 41% 67 21% 35 163
42 University Extension 1% 1 22% 17 17% 13 49% 37 11% 8 76
43 VP Agriculture& Natural Resour 0% 0 100% 1 0% 0 0% 0 0% 0 1
44 VP Research - MRUs 6% 5 29% 24 14% 12 33% 28 18% 15 84
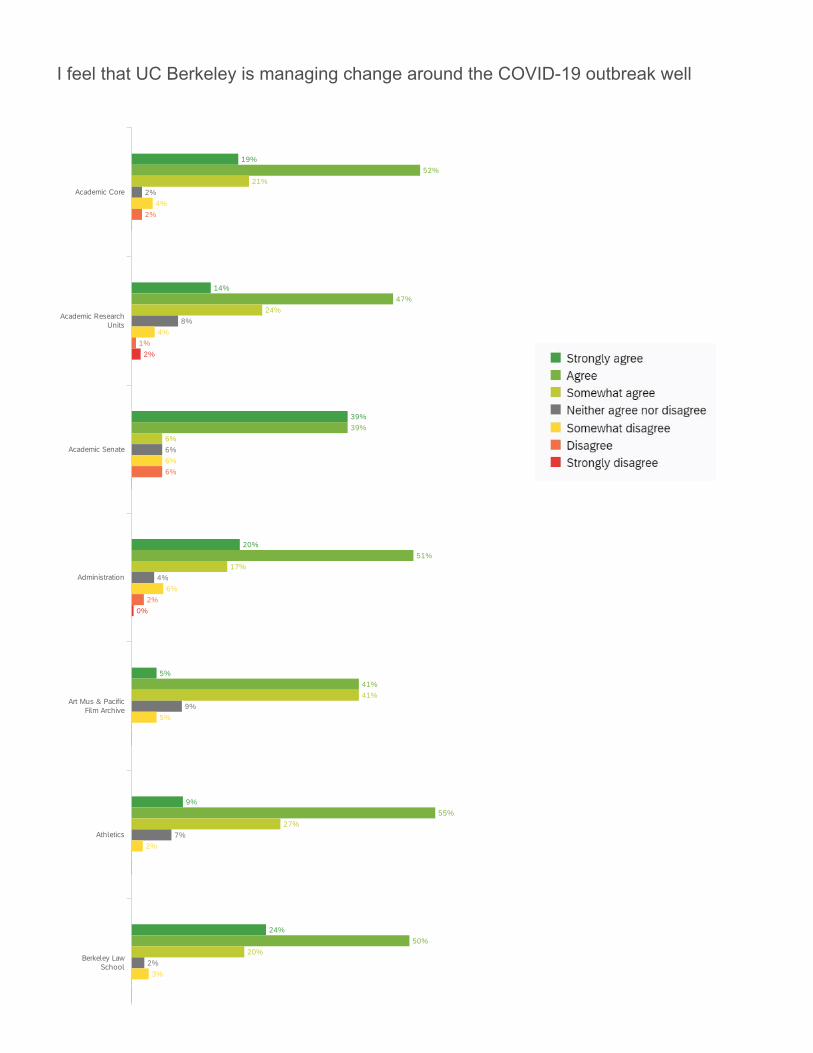
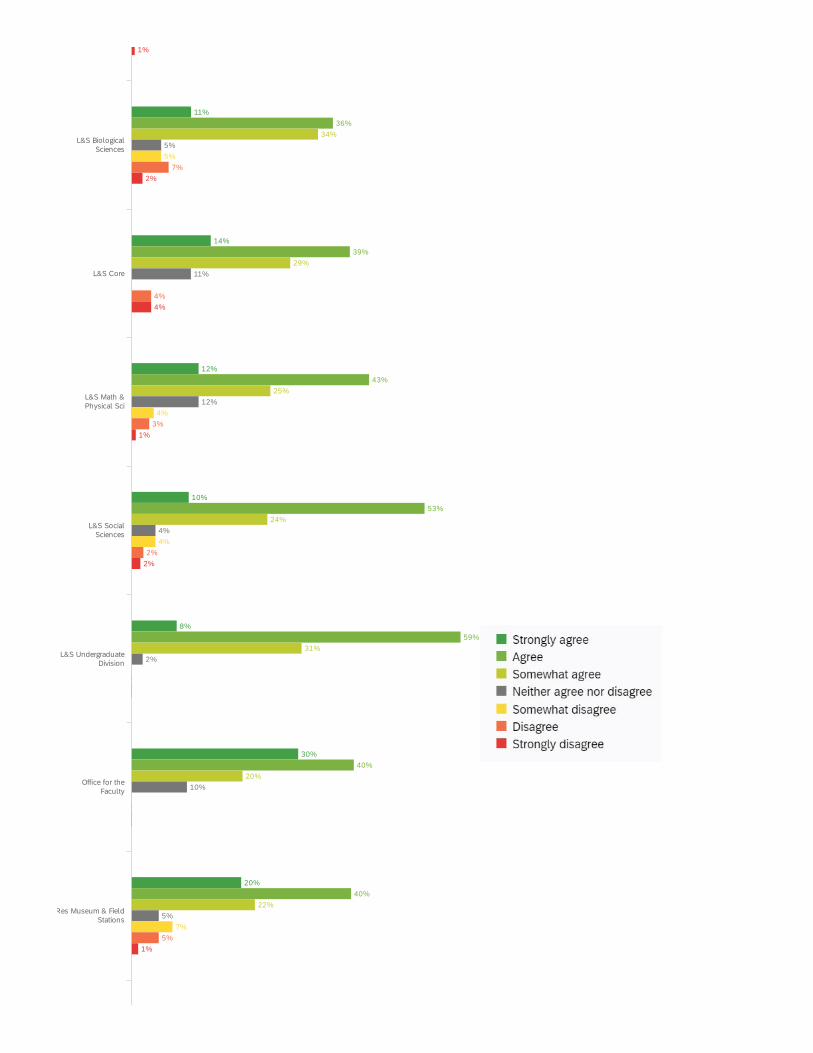
I feel that UC Berkeley is managing change around the COVID-19 outbreak well
19%
14%
39%
20%
5%
9%
24%
52%
47%
39%
51%
41%
55%
50%
21%
24%
6%
17%
41%
27%
20%
2%
8%
6%
4%
9%
7%
2%
4%
4%
6%
6%
5%
2%
3%
2%
1%
6%
2%
2%
0%
Academic Core
Athletics
Academic ResearchUnits
Academic Senate
Administration
Art Mus & PacificFilm Archive
Berkeley LawSchool

10%
25%
33%
3%
14%
14%
11%
6%
28%
56%
47%
36%
45%
47%
46%
28%
9%
13%
44%
23%
24%
27%
10%
9%
13%
4%
8%
6%
17%
7%
7%
4%
8%
7%
3%
3%
2%
1%
3%
4%
2%
2%
Col ofEnvironmental
Design
CalPerformances_SMA
Chancellor'sImmediate Office
Central AccountingLedger
College ofChemistry
College ofEngineering
College of NaturalResources

12%
24%
15%
21%
33%
22%
15%
50%
50%
62%
50%
58%
44%
41%
39%
28%
21%
8%
20%
21%
21%
23%
28%
11%
5%
2%
5%
2%
7%
6%
6%
5%
2%
10%
4%
7%
2%
2%
4%
5%
1%
1%
1%
Equity & InclusionDiv
Haas School ofBusiness
Division of DataScience
Finance
Goldman Sch ofPublic Policy
Graduate Division
Graduate School ofEducation
L&S Arts &Humanities
11%
14%
12%
10%
8%
30%
20%
36%
39%
43%
53%
59%
40%
40%
34%
29%
25%
24%
31%
20%
22%
5%
11%
12%
4%
2%
10%
5%
5%
4%
4%
7%
7%
4%
3%
2%
5%
1%
2%
4%
1%
2%
1%
L&S SocialSciences
L&S BiologicalSciences
L&S Core
L&S Math &Physical Sci
L&S UndergraduateDivision
Office for theFaculty
Res Museum & FieldStations

19%
11%
10%
16%
26%
33%
11%
45%
43%
82%
43%
42%
53%
50%
41%
23%
21%
18%
31%
24%
16%
17%
26%
4%
14%
10%
11%
3%
7%
5%
4%
4%
7%
3%
9%
4%
7%
3%
2%
School ofInformation
Strategic Acad andFac Plan
ResearchAdministrative
Units
School ofJournalism
School ofOptometry
School of PublicHealth
School of SocialWelfare
Student Affairs
26%
15%
15%
29%
24%
18%
57%
49%
52%
56%
53%
44%
13%
24%
25%
12%
17%
21%
4%
2%
5%
1%
3%
8%
8%
3%
2%
1%
4%
3%
1%
1%
4%
2%
1%
1%
100%
1%
Univ Developmt andAlumni Rel
Summer Sessn,Study Abrd, OLLI
UC Library
UndergraduateEducation
UniversityExtension
VP Agriculture&Natural Resour
VP Research - MRUs
# FieldStrongly
agreeAgree
Somewhatagree
Neitheragree nordisagree
Somewhatdisagree
DisagreeStronglydisagree
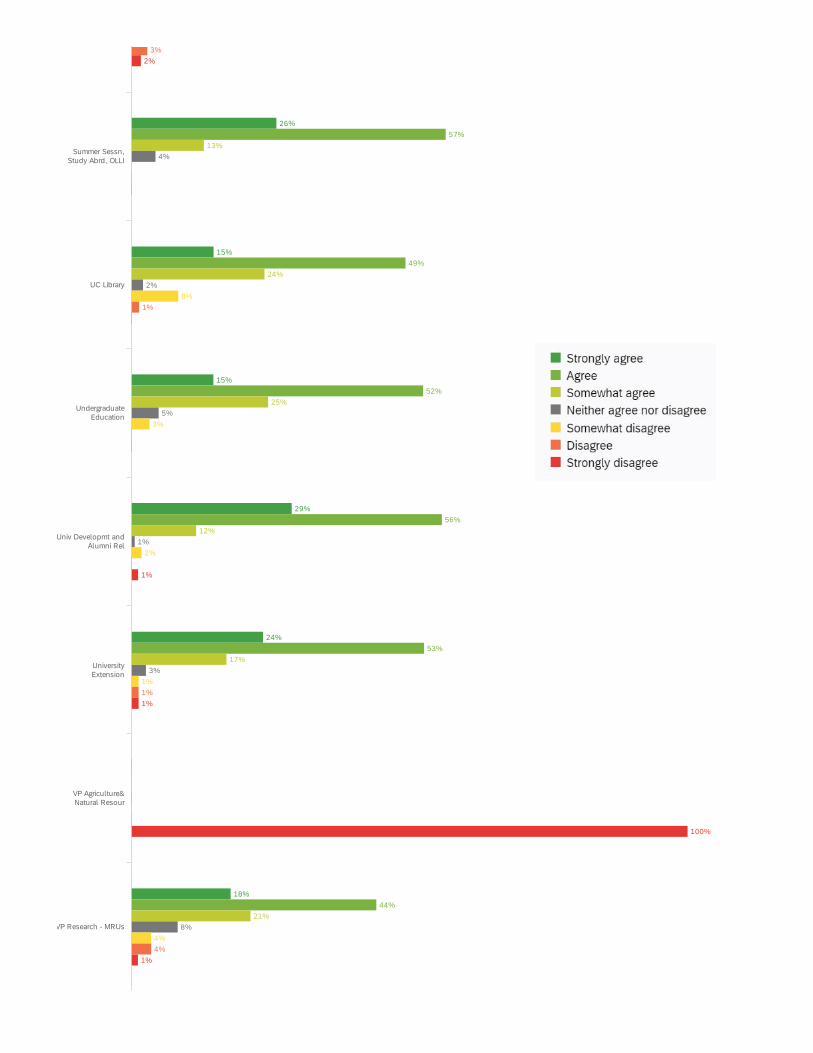
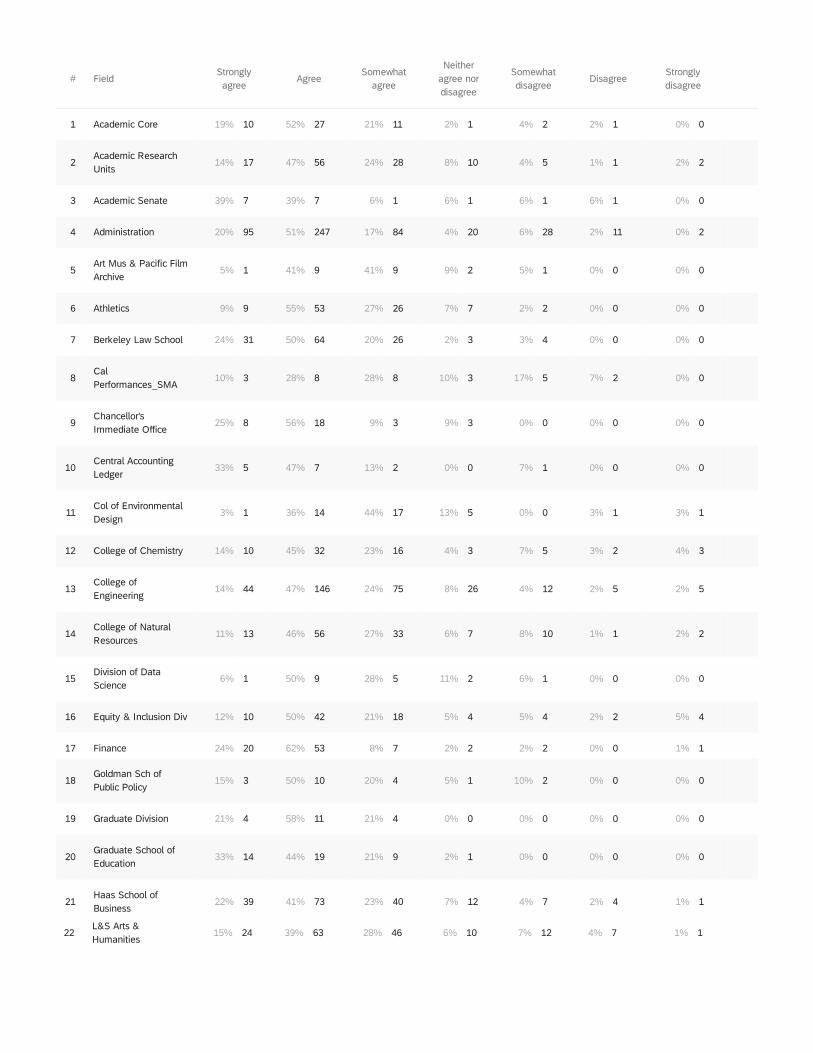
1 Academic Core 19% 10 52% 27 21% 11 2% 1 4% 2 2% 1 0% 0
2Academic ResearchUnits
14% 17 47% 56 24% 28 8% 10 4% 5 1% 1 2% 2
3 Academic Senate 39% 7 39% 7 6% 1 6% 1 6% 1 6% 1 0% 0
4 Administration 20% 95 51% 247 17% 84 4% 20 6% 28 2% 11 0% 2
5Art Mus & Pacific FilmArchive
5% 1 41% 9 41% 9 9% 2 5% 1 0% 0 0% 0
6 Athletics 9% 9 55% 53 27% 26 7% 7 2% 2 0% 0 0% 0
7 Berkeley Law School 24% 31 50% 64 20% 26 2% 3 3% 4 0% 0 0% 0
8CalPerformances_SMA
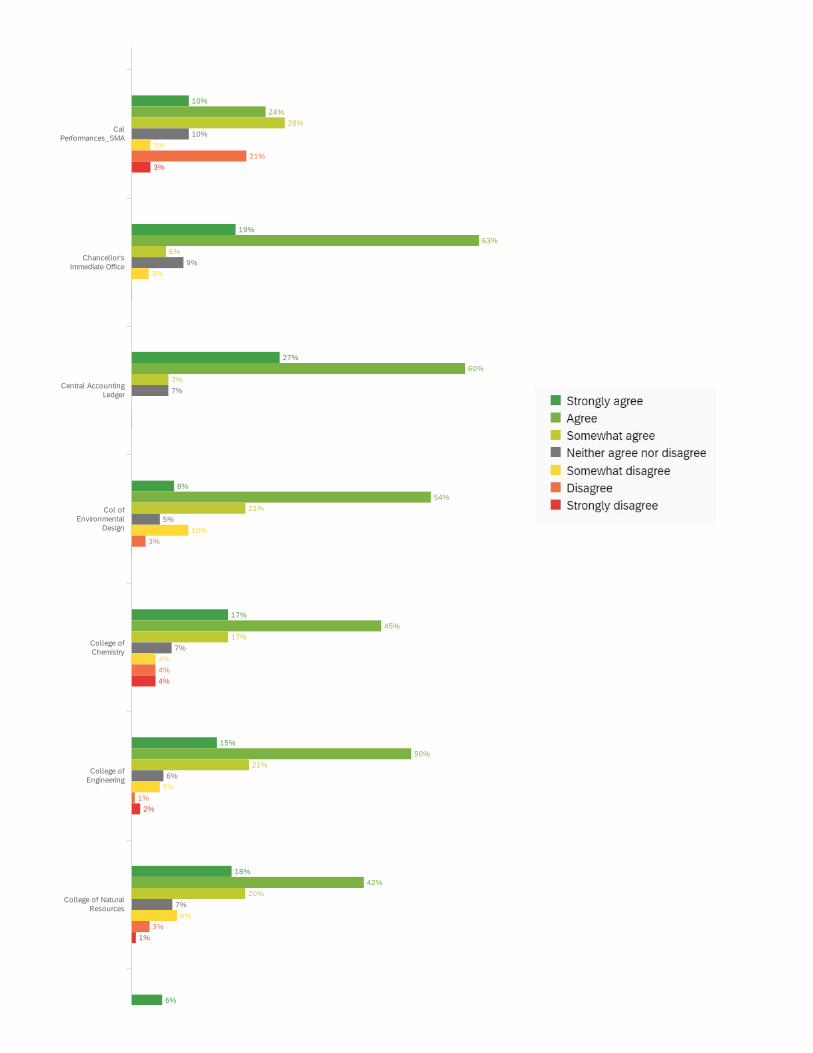
10% 3 28% 8 28% 8 10% 3 17% 5 7% 2 0% 0
9Chancellor'sImmediate Office
25% 8 56% 18 9% 3 9% 3 0% 0 0% 0 0% 0
10Central AccountingLedger
33% 5 47% 7 13% 2 0% 0 7% 1 0% 0 0% 0
11Col of EnvironmentalDesign
3% 1 36% 14 44% 17 13% 5 0% 0 3% 1 3% 1
12 College of Chemistry 14% 10 45% 32 23% 16 4% 3 7% 5 3% 2 4% 3
13College ofEngineering
14% 44 47% 146 24% 75 8% 26 4% 12 2% 5 2% 5
14College of NaturalResources
11% 13 46% 56 27% 33 6% 7 8% 10 1% 1 2% 2
15Division of DataScience
6% 1 50% 9 28% 5 11% 2 6% 1 0% 0 0% 0
16 Equity & Inclusion Div 12% 10 50% 42 21% 18 5% 4 5% 4 2% 2 5% 4
17 Finance 24% 20 62% 53 8% 7 2% 2 2% 2 0% 0 1% 1
18Goldman Sch ofPublic Policy
15% 3 50% 10 20% 4 5% 1 10% 2 0% 0 0% 0
19 Graduate Division 21% 4 58% 11 21% 4 0% 0 0% 0 0% 0 0% 0
20Graduate School ofEducation
33% 14 44% 19 21% 9 2% 1 0% 0 0% 0 0% 0
21Haas School ofBusiness
22% 39 41% 73 23% 40 7% 12 4% 7 2% 4 1% 1
22L&S Arts &Humanities
15% 24 39% 63 28% 46 6% 10 7% 12 4% 7 1% 1

# FieldStrongly
agree
AgreeSomewhat
agree
Neitheragree nordisagree
Somewhat
disagreeDisagree
Strongly
disagree
23L&S BiologicalSciences
11% 16 36% 54 34% 50 5% 8 5% 8 7% 10 2% 3
24 L&S Core 14% 4 39% 11 29% 8 11% 3 0% 0 4% 1 4% 1
25L&S Math & PhysicalSci
12% 15 43% 53 25% 31 12% 15 4% 5 3% 4 1% 1
26 L&S Social Sciences 10% 19 53% 97 24% 45 4% 8 4% 8 2% 4 2% 3
27L&S UndergraduateDivision
8% 4 59% 29 31% 15 2% 1 0% 0 0% 0 0% 0
28 Office for the Faculty 30% 3 40% 4 20% 2 10% 1 0% 0 0% 0 0% 0
29Res Museum & FieldStations
20% 16 40% 32 22% 18 5% 4 7% 6 5% 4 1% 1
30ResearchAdministrative Units
19% 22 45% 51 23% 26 4% 4 5% 6 4% 5 0% 0
31 School of Information 11% 3 43% 12 21% 6 14% 4 4% 1 7% 2 0% 0
32 School of Journalism 0% 0 82% 9 18% 2 0% 0 0% 0 0% 0 0% 0
33 School of Optometry 10% 5 43% 22 31% 16 10% 5 4% 2 0% 0 2% 1
34School of PublicHealth
16% 17 42% 44 24% 25 11% 11 7% 7 0% 0 0% 0
35School of SocialWelfare
26% 10 53% 20 16% 6 3% 1 3% 1 0% 0 0% 0
36Strategic Acad andFac Plan
33% 2 50% 3 17% 1 0% 0 0% 0 0% 0 0% 0
37 Student Affairs 11% 40 41% 143 26% 92 7% 25 9% 32 3% 10 2% 6
38Summer Sessn,Study Abrd, OLLI
26% 6 57% 13 13% 3 4% 1 0% 0 0% 0 0% 0
39 UC Library 15% 21 49% 70 24% 34 2% 3 8% 12 1% 2 0% 0
40UndergraduateEducation
15% 9 52% 32 25% 15 5% 3 3% 2 0% 0 0% 0
41Univ Developmt andAlumni Rel
29% 47 56% 91 12% 19 1% 1 2% 3 0% 0 1% 2
42 University Extension 24% 18 53% 40 17% 13 3% 2 1% 1 1% 1 1% 1
43VP Agriculture&Natural Resour
0% 0 0% 0 0% 0 0% 0 0% 0 0% 0 100% 1
44 VP Research - MRUs 18% 15 44% 37 21% 18 8% 7 4% 3 4% 3 1% 1

I feel that UC Berkeley is communicating change around the COVID-19 outbreak well
31%
17%
28%
22%
9%
11%
28%
44%
47%
44%
50%
32%
42%
51%
12%
21%
22%
17%
32%
36%
14%
4%
4%
4%
9%
4%
3%
4%
5%
6%
5%
18%
5%
3%
2%
3%
2%
1%
4%
3%
1%
1%
Academic Core
Athletics
Academic ResearchUnits
Academic Senate
Administration
Art Mus & PacificFilm Archive
Berkeley LawSchool
10%
19%
27%
8%
17%
15%
18%
6%
24%
63%
60%
54%
45%
50%
42%
28%
6%
7%
21%
17%
21%
20%
10%
9%
7%
5%
7%
6%
7%
3%
3%
10%
4%
5%
8%
21%
3%
4%
1%
3%
3%
4%
2%
1%
Col ofEnvironmental
Design
CalPerformances_SMA
Chancellor'sImmediate Office
Central AccountingLedger
College ofChemistry
College ofEngineering
College of NaturalResources

17%
27%
15%
32%
40%
26%
15%
44%
46%
59%
75%
53%
40%
45%
42%
39%
24%
7%
10%
16%
19%
17%
26%
6%
2%
2%
2%
5%
4%
2%
5%
5%
7%
6%
5%
1%
4%
4%
1%
1%
Equity & InclusionDiv
Haas School ofBusiness
Division of DataScience
Finance
Goldman Sch ofPublic Policy
Graduate Division
Graduate School ofEducation
L&S Arts &Humanities

14%
7%
13%
15%
16%
30%
17%
38%
46%
46%
47%
59%
40%
51%
29%
25%
24%
25%
20%
20%
19%
4%
4%
7%
3%
2%
2%
9%
11%
7%
5%
5%
5%
7%
2%
3%
2%
10%
5%
1%
1%
2%
1%
1%
L&S SocialSciences
L&S BiologicalSciences
L&S Core
L&S Math &Physical Sci
L&S UndergraduateDivision
Office for theFaculty
Res Museum & FieldStations
20%
7%
18%
16%
22%
37%
17%
13%
42%
50%
55%
43%
46%
37%
67%
43%
24%
25%
27%
25%
22%
16%
17%
23%
5%
11%
6%
6%
11%
7%
5%
4%
10%
3%
8%
3%
4%
1%
4%
1%
School ofInformation
Strategic Acad andFac Plan
ResearchAdministrative
Units
School ofJournalism
School ofOptometry
School of PublicHealth
School of SocialWelfare
Student Affairs
35%
17%
18%
30%
29%
14%
52%
52%
52%
51%
54%
50%
4%
20%
21%
15%
9%
21%
4%
4%
5%
1%
4%
7%
4%
7%
3%
1%
1%
4%
4%
1%
1%
1%
2%
1%
1%
1%
100%
1%
Univ Developmt andAlumni Rel
Summer Sessn,Study Abrd, OLLI
UC Library
UndergraduateEducation
UniversityExtension
VP Agriculture&Natural Resour
VP Research - MRUs
# FieldStrongly
agreeAgree
Somewhatagree
Neitheragree nordisagree
Somewhatdisagree
DisagreeStronglydisagree
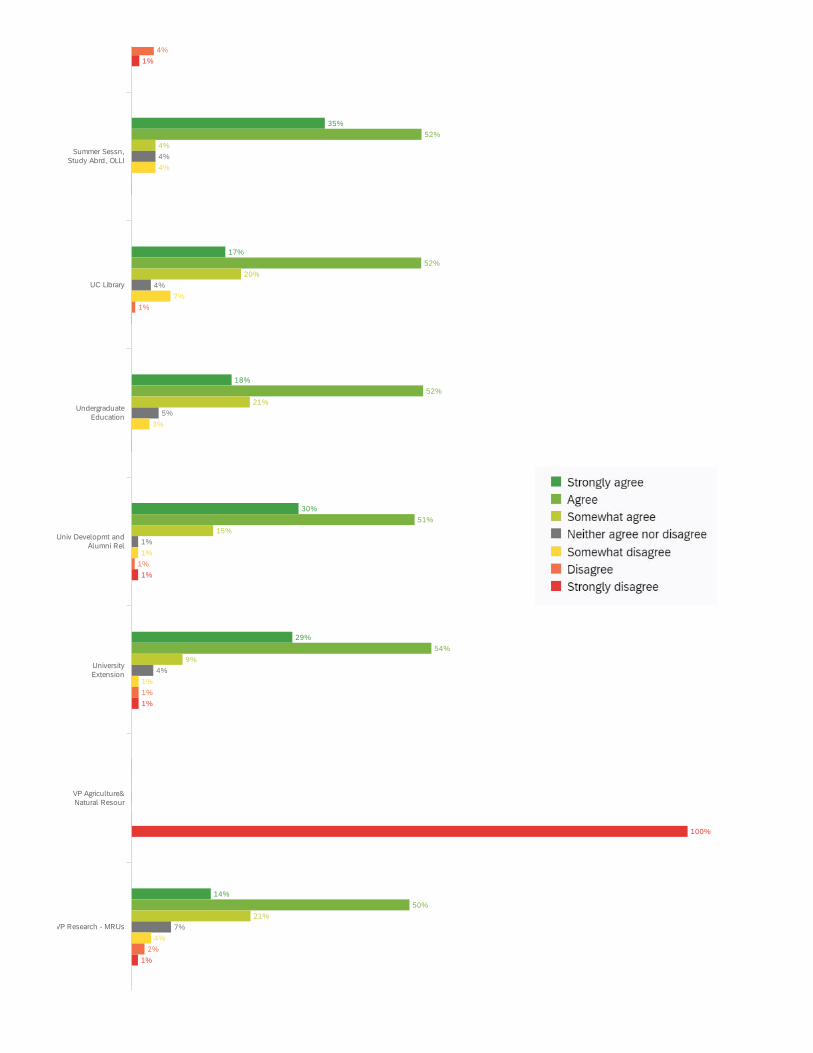
1 Academic Core 31% 16 44% 23 12% 6 4% 2 4% 2 2% 1 4% 2
2Academic ResearchUnits
17% 20 47% 55 21% 25 4% 5 5% 6 3% 4 3% 3
3 Academic Senate 28% 5 44% 8 22% 4 0% 0 6% 1 0% 0 0% 0
4 Administration 22% 107 50% 241 17% 82 4% 18 5% 24 2% 10 1% 3
5Art Mus & Pacific FilmArchive
9% 2 32% 7 32% 7 9% 2 18% 4 0% 0 0% 0
6 Athletics 11% 11 42% 41 36% 35 4% 4 5% 5 0% 0 1% 1
7 Berkeley Law School 28% 35 51% 64 14% 18 3% 4 3% 4 1% 1 0% 0
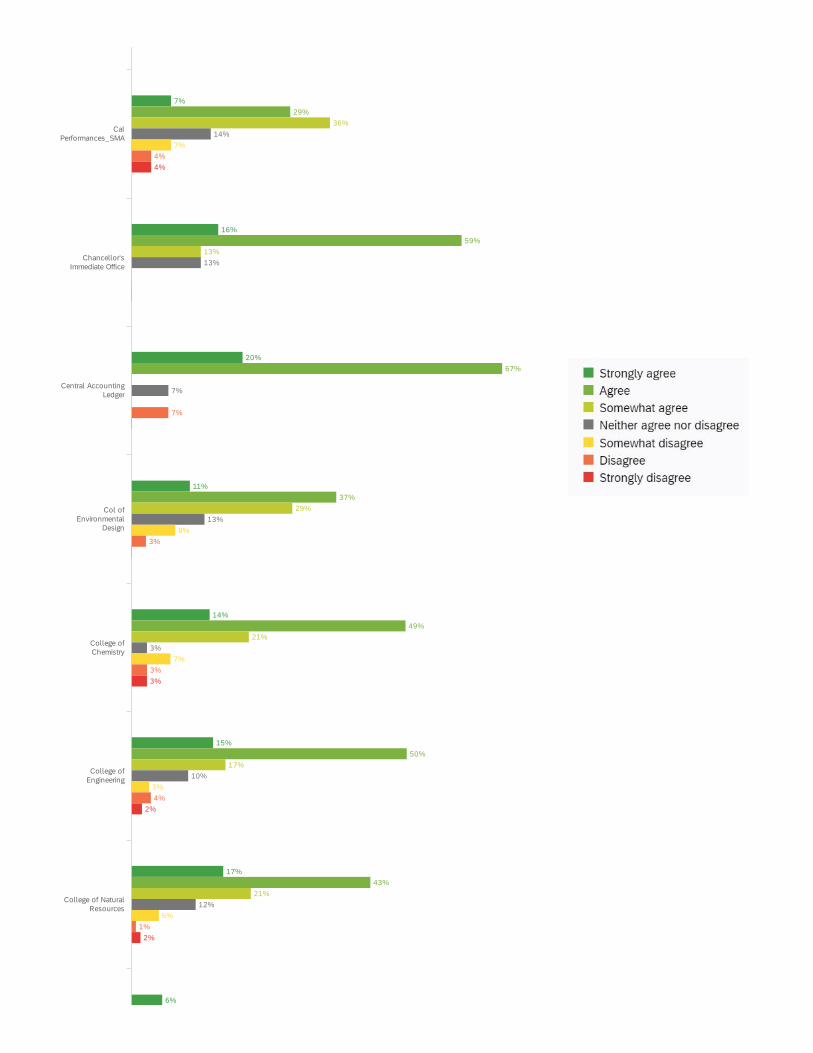
8CalPerformances_SMA
10% 3 24% 7 28% 8 10% 3 3% 1 21% 6 3% 1
9Chancellor'sImmediate Office
19% 6 63% 20 6% 2 9% 3 3% 1 0% 0 0% 0
10Central AccountingLedger
27% 4 60% 9 7% 1 7% 1 0% 0 0% 0 0% 0
11Col of EnvironmentalDesign
8% 3 54% 21 21% 8 5% 2 10% 4 3% 1 0% 0
12 College of Chemistry 17% 12 45% 31 17% 12 7% 5 4% 3 4% 3 4% 3
13College ofEngineering
15% 48 50% 157 21% 66 6% 18 5% 16 1% 2 2% 5
14College of NaturalResources
18% 22 42% 51 20% 25 7% 9 8% 10 3% 4 1% 1
15Division of DataScience
6% 1 44% 8 39% 7 6% 1 0% 0 6% 1 0% 0
16 Equity & Inclusion Div 17% 14 46% 39 24% 20 2% 2 2% 2 5% 4 4% 3
17 Finance 27% 23 59% 50 7% 6 2% 2 5% 4 0% 0 0% 0
18Goldman Sch ofPublic Policy
15% 3 75% 15 10% 2 0% 0 0% 0 0% 0 0% 0
19 Graduate Division 32% 6 53% 10 16% 3 0% 0 0% 0 0% 0 0% 0
20Graduate School ofEducation
40% 17 40% 17 19% 8 2% 1 0% 0 0% 0 0% 0
21Haas School ofBusiness
26% 46 45% 79 17% 30 5% 9 5% 9 1% 1 1% 2
22L&S Arts &Humanities
15% 24 42% 69 26% 43 4% 7 7% 11 4% 7 1% 2

# FieldStrongly
agreeAgree
Somewhatagree
Neitheragree nordisagree
Somewhatdisagree
DisagreeStronglydisagree
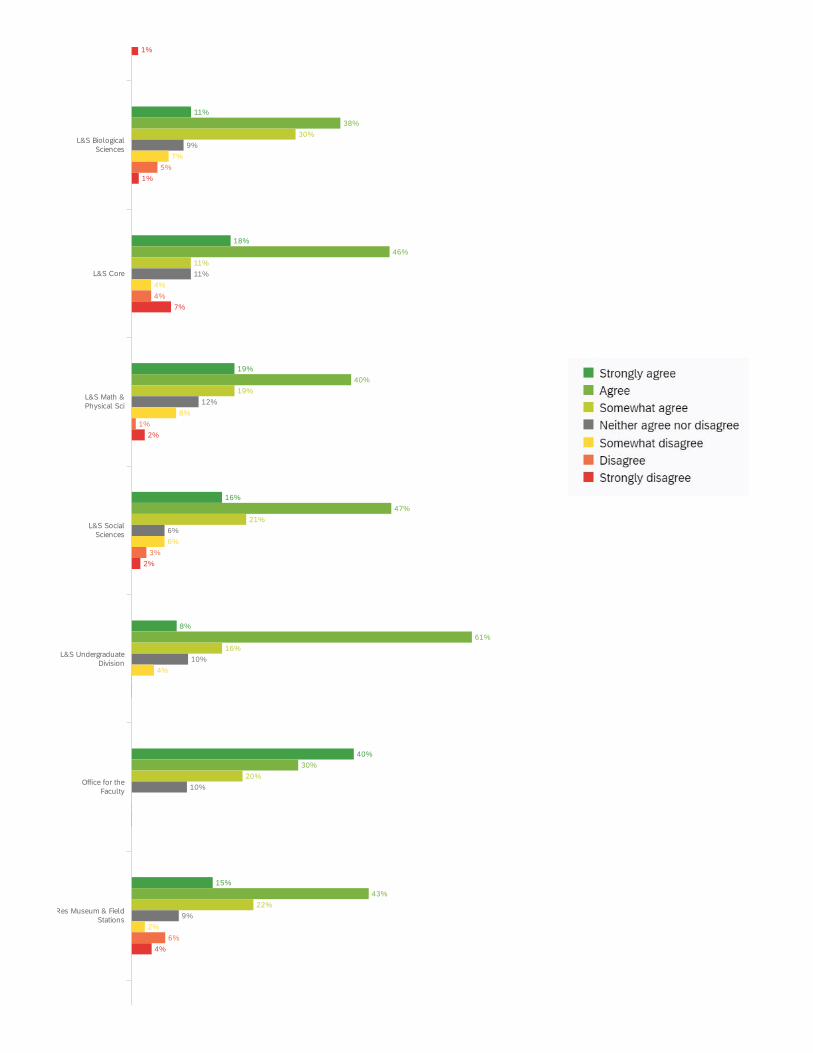
23L&S BiologicalSciences
14% 21 38% 57 29% 43 4% 6 9% 14 5% 7 1% 1
24 L&S Core 7% 2 46% 13 25% 7 4% 1 11% 3 7% 2 0% 0
25L&S Math & PhysicalSci
13% 16 46% 57 24% 30 7% 8 7% 8 2% 2 2% 2
26 L&S Social Sciences 15% 28 47% 86 25% 45 3% 6 5% 10 3% 6 1% 2
27L&S UndergraduateDivision
16% 8 59% 29 20% 10 2% 1 0% 0 2% 1 0% 0
28 Office for the Faculty 30% 3 40% 4 20% 2 0% 0 0% 0 10% 1 0% 0
29Res Museum & FieldStations
17% 14 51% 41 19% 15 2% 2 5% 4 5% 4 1% 1
30ResearchAdministrative Units
20% 23 42% 48 24% 27 5% 6 5% 6 3% 3 1% 1
31 School of Information 7% 2 50% 14 25% 7 11% 3 4% 1 4% 1 0% 0
32 School of Journalism 18% 2 55% 6 27% 3 0% 0 0% 0 0% 0 0% 0
33 School of Optometry 16% 8 43% 22 25% 13 6% 3 10% 5 0% 0 0% 0
34School of PublicHealth
22% 23 46% 48 22% 23 6% 6 3% 3 1% 1 0% 0
35School of SocialWelfare
37% 14 37% 14 16% 6 11% 4 0% 0 0% 0 0% 0
36Strategic Acad andFac Plan
17% 1 67% 4 17% 1 0% 0 0% 0 0% 0 0% 0
37 Student Affairs 13% 46 43% 150 23% 79 7% 25 8% 27 4% 14 1% 5
38Summer Sessn,Study Abrd, OLLI
35% 8 52% 12 4% 1 4% 1 4% 1 0% 0 0% 0
39 UC Library 17% 24 52% 74 20% 28 4% 5 7% 10 1% 1 0% 0
40UndergraduateEducation
18% 11 52% 32 21% 13 5% 3 3% 2 0% 0 0% 0
41Univ Developmt andAlumni Rel
30% 49 51% 83 15% 24 1% 2 1% 2 1% 1 1% 2
42 University Extension 29% 22 54% 41 9% 7 4% 3 1% 1 1% 1 1% 1
43VP Agriculture&Natural Resour
0% 0 0% 0 0% 0 0% 0 0% 0 0% 0 100% 1
44 VP Research - MRUs 14% 12 50% 42 21% 18 7% 6 4% 3 2% 2 1% 1

I feel that UC Berkeley cares about my well-being
18%
17%
33%
22%
9%
11%
23%
43%
43%
33%
49%
50%
53%
47%
22%
17%
11%
15%
23%
22%
21%
2%
10%
11%
4%
14%
9%
5%
10%
3%
11%
5%
5%
5%
3%
6%
5%
3%
2%
5%
2%
Academic Core
Athletics
Academic ResearchUnits
Academic Senate
Administration
Art Mus & PacificFilm Archive
Berkeley LawSchool
7%
16%
20%
11%
14%
15%
17%
6%
29%
59%
67%
37%
49%
50%
43%
36%
13%
29%
21%
17%
21%
14%
13%
7%
13%
3%
10%
12%
7%
8%
7%
3%
5%
4%
7%
3%
3%
4%
1%
4%
3%
2%
2%
Col ofEnvironmental
Design
CalPerformances_SMA
Chancellor'sImmediate Office
Central AccountingLedger
College ofChemistry
College ofEngineering
College of NaturalResources

13%
24%
10%
21%
30%
26%
12%
61%
42%
61%
65%
47%
40%
46%
35%
17%
23%
9%
20%
21%
19%
14%
31%
11%
8%
4%
5%
7%
7%
9%
5%
1%
5%
5%
2%
7%
6%
5%
5%
2%
6%
5%
1%
3%
1%
Equity & InclusionDiv
Haas School ofBusiness
Division of DataScience
Finance
Goldman Sch ofPublic Policy
Graduate Division
Graduate School ofEducation
L&S Arts &Humanities
11%
18%
19%
16%
8%
40%
15%
38%
46%
40%
47%
61%
30%
43%
30%
11%
19%
21%
16%
20%
22%
9%
11%
12%
6%
10%
10%
9%
7%
4%
8%
6%
4%
2%
5%
4%
1%
3%
6%
1%
1%
7%
2%
2%
4%
L&S SocialSciences
L&S BiologicalSciences
L&S Core
L&S Math &Physical Sci
L&S UndergraduateDivision
Office for theFaculty
Res Museum & FieldStations

21%
11%
9%
6%
14%
26%
50%
14%
46%
46%
36%
47%
42%
45%
17%
39%
19%
18%
27%
24%
24%
24%
33%
24%
8%
4%
18%
10%
15%
5%
10%
4%
11%
9%
6%
5%
7%
2%
7%
6%
1%
3%
4%
2%
School ofInformation
Strategic Acad andFac Plan
ResearchAdministrative
Units
School ofJournalism
School ofOptometry
School of PublicHealth
School of SocialWelfare
Student Affairs
22%
16%
21%
34%
18%
17%
39%
49%
46%
47%
54%
45%
22%
20%
21%
16%
16%
21%
9%
5%
10%
2%
8%
5%
7%
1%
7%
3%
9%
3%
2%
2%
1%
3%
1%
3%
100%
4%
Univ Developmt andAlumni Rel
Summer Sessn,Study Abrd, OLLI
UC Library
UndergraduateEducation
UniversityExtension
VP Agriculture&Natural Resour
VP Research - MRUs
# FieldStrongly
agreeAgree
Somewhatagree
Neitheragree nordisagree
Somewhatdisagree
DisagreeStronglydisagree
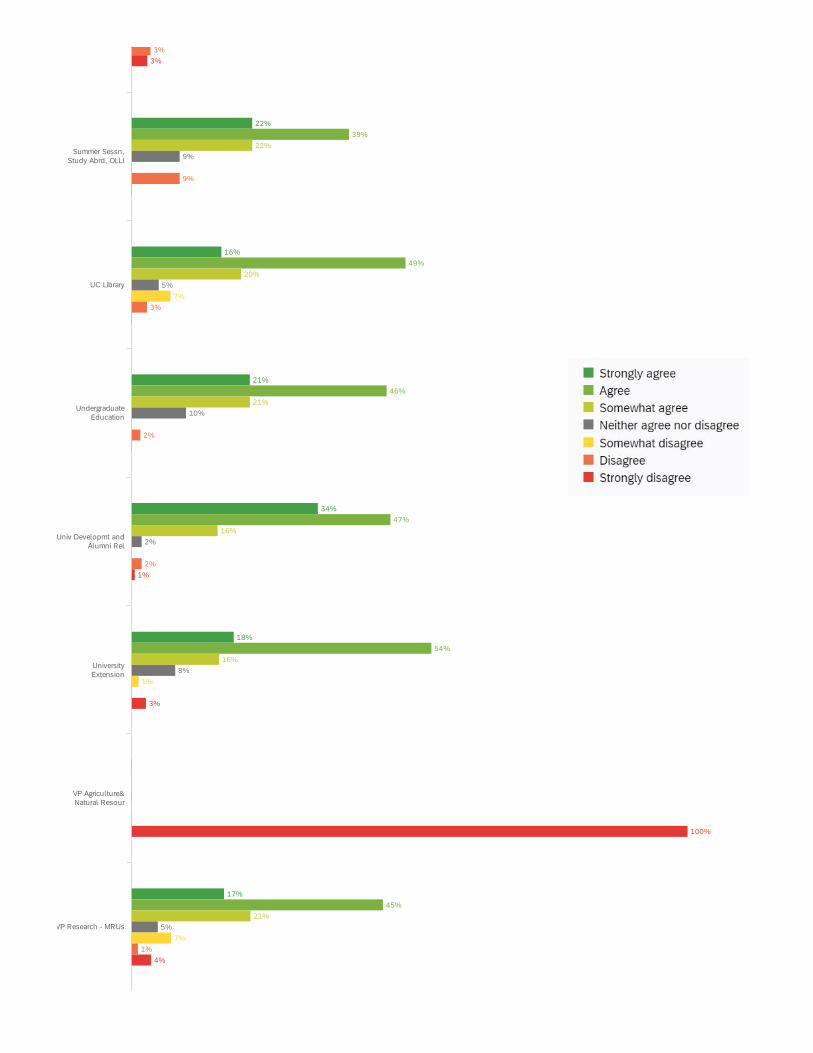
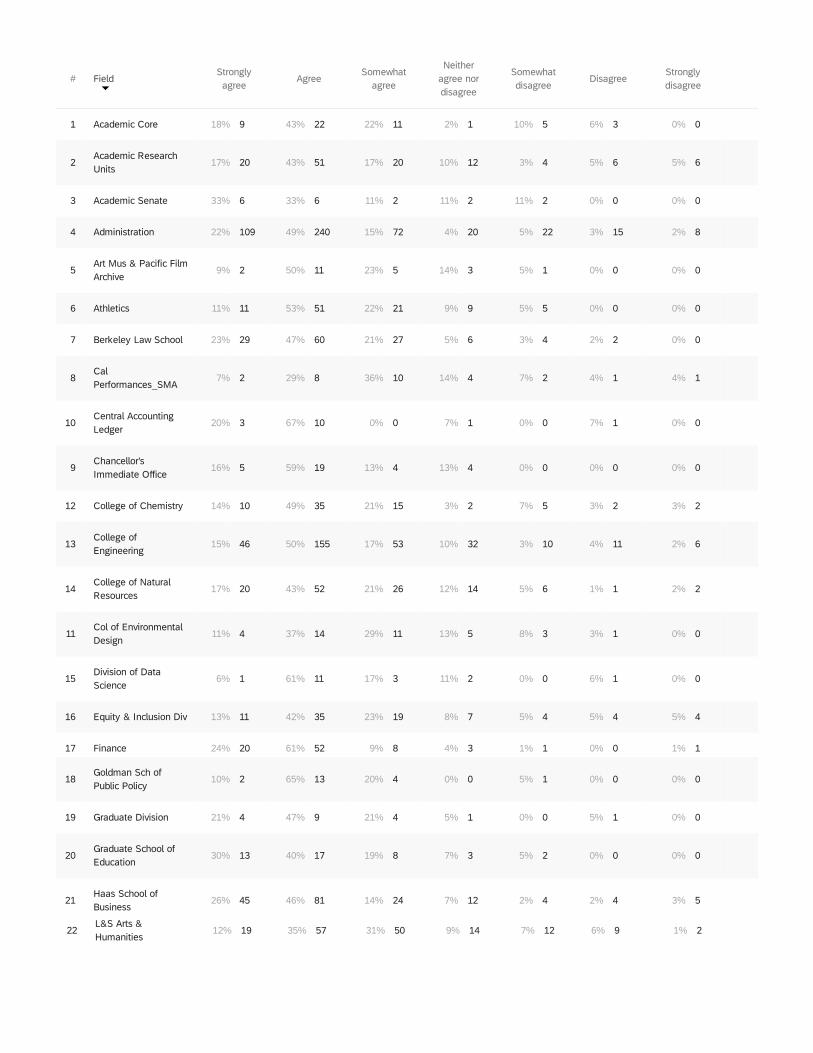
1 Academic Core 18% 9 43% 22 22% 11 2% 1 10% 5 6% 3 0% 0
2Academic ResearchUnits
17% 20 43% 51 17% 20 10% 12 3% 4 5% 6 5% 6
3 Academic Senate 33% 6 33% 6 11% 2 11% 2 11% 2 0% 0 0% 0
4 Administration 22% 109 49% 240 15% 72 4% 20 5% 22 3% 15 2% 8
5Art Mus & Pacific FilmArchive
9% 2 50% 11 23% 5 14% 3 5% 1 0% 0 0% 0
6 Athletics 11% 11 53% 51 22% 21 9% 9 5% 5 0% 0 0% 0
7 Berkeley Law School 23% 29 47% 60 21% 27 5% 6 3% 4 2% 2 0% 0
8CalPerformances_SMA
7% 2 29% 8 36% 10 14% 4 7% 2 4% 1 4% 1
10Central AccountingLedger
20% 3 67% 10 0% 0 7% 1 0% 0 7% 1 0% 0
9Chancellor'sImmediate Office
16% 5 59% 19 13% 4 13% 4 0% 0 0% 0 0% 0
12 College of Chemistry 14% 10 49% 35 21% 15 3% 2 7% 5 3% 2 3% 2
13College ofEngineering
15% 46 50% 155 17% 53 10% 32 3% 10 4% 11 2% 6
14College of NaturalResources
17% 20 43% 52 21% 26 12% 14 5% 6 1% 1 2% 2
11Col of EnvironmentalDesign
11% 4 37% 14 29% 11 13% 5 8% 3 3% 1 0% 0
15Division of DataScience
6% 1 61% 11 17% 3 11% 2 0% 0 6% 1 0% 0
16 Equity & Inclusion Div 13% 11 42% 35 23% 19 8% 7 5% 4 5% 4 5% 4
17 Finance 24% 20 61% 52 9% 8 4% 3 1% 1 0% 0 1% 1
18Goldman Sch ofPublic Policy
10% 2 65% 13 20% 4 0% 0 5% 1 0% 0 0% 0
19 Graduate Division 21% 4 47% 9 21% 4 5% 1 0% 0 5% 1 0% 0
20Graduate School ofEducation
30% 13 40% 17 19% 8 7% 3 5% 2 0% 0 0% 0
21Haas School ofBusiness
26% 45 46% 81 14% 24 7% 12 2% 4 2% 4 3% 5
22L&S Arts &Humanities
12% 19 35% 57 31% 50 9% 14 7% 12 6% 9 1% 2
# FieldStrongly
agreeAgree
Somewhatagree
Neitheragree nordisagree
Somewhatdisagree
DisagreeStronglydisagree
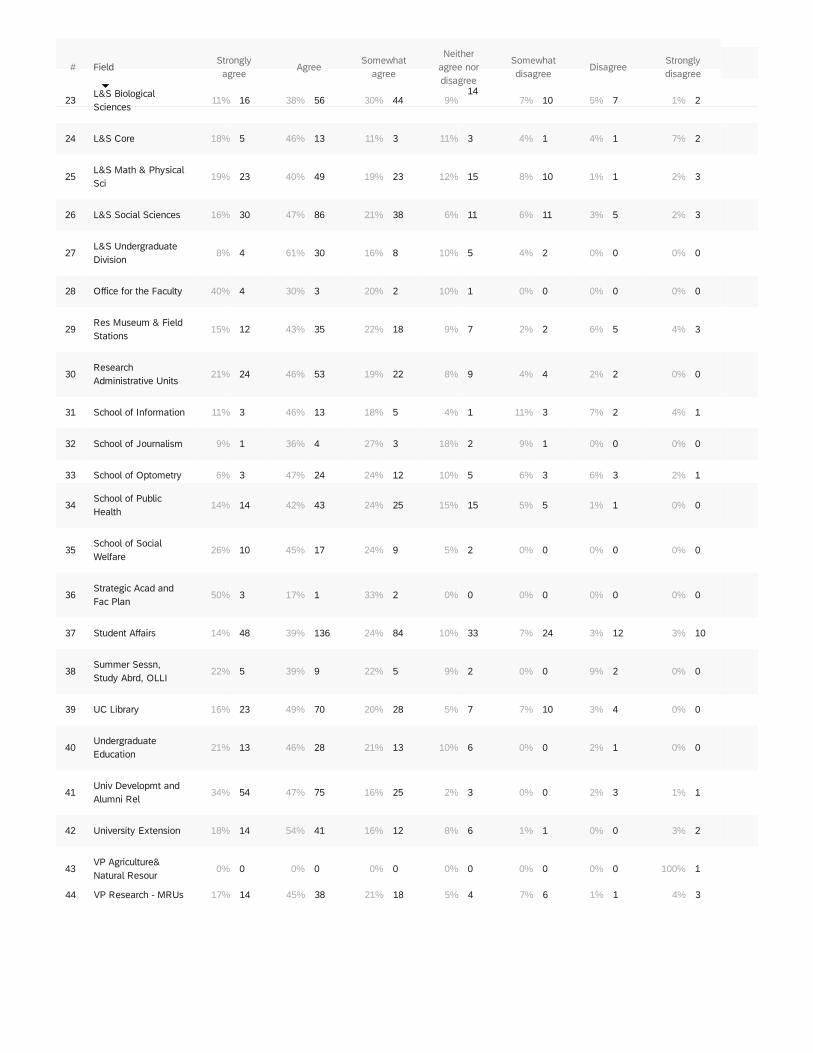
23L&S BiologicalSciences
11% 16 38% 56 30% 44 9%14
7% 10 5% 7 1% 2
24 L&S Core 18% 5 46% 13 11% 3 11% 3 4% 1 4% 1 7% 2
25L&S Math & PhysicalSci
19% 23 40% 49 19% 23 12% 15 8% 10 1% 1 2% 3
26 L&S Social Sciences 16% 30 47% 86 21% 38 6% 11 6% 11 3% 5 2% 3
27L&S UndergraduateDivision
8% 4 61% 30 16% 8 10% 5 4% 2 0% 0 0% 0
28 Office for the Faculty 40% 4 30% 3 20% 2 10% 1 0% 0 0% 0 0% 0
29Res Museum & FieldStations
15% 12 43% 35 22% 18 9% 7 2% 2 6% 5 4% 3
30ResearchAdministrative Units
21% 24 46% 53 19% 22 8% 9 4% 4 2% 2 0% 0
31 School of Information 11% 3 46% 13 18% 5 4% 1 11% 3 7% 2 4% 1
32 School of Journalism 9% 1 36% 4 27% 3 18% 2 9% 1 0% 0 0% 0
33 School of Optometry 6% 3 47% 24 24% 12 10% 5 6% 3 6% 3 2% 1
34School of PublicHealth
14% 14 42% 43 24% 25 15% 15 5% 5 1% 1 0% 0
35School of SocialWelfare
26% 10 45% 17 24% 9 5% 2 0% 0 0% 0 0% 0
36Strategic Acad andFac Plan
50% 3 17% 1 33% 2 0% 0 0% 0 0% 0 0% 0
37 Student Affairs 14% 48 39% 136 24% 84 10% 33 7% 24 3% 12 3% 10
38Summer Sessn,Study Abrd, OLLI
22% 5 39% 9 22% 5 9% 2 0% 0 9% 2 0% 0
39 UC Library 16% 23 49% 70 20% 28 5% 7 7% 10 3% 4 0% 0
40UndergraduateEducation
21% 13 46% 28 21% 13 10% 6 0% 0 2% 1 0% 0
41Univ Developmt andAlumni Rel
34% 54 47% 75 16% 25 2% 3 0% 0 2% 3 1% 1
42 University Extension 18% 14 54% 41 16% 12 8% 6 1% 1 0% 0 3% 2
43VP Agriculture&Natural Resour
0% 0 0% 0 0% 0 0% 0 0% 0 0% 0 100% 1
44 VP Research - MRUs 17% 14 45% 38 21% 18 5% 4 7% 6 1% 1 4% 3
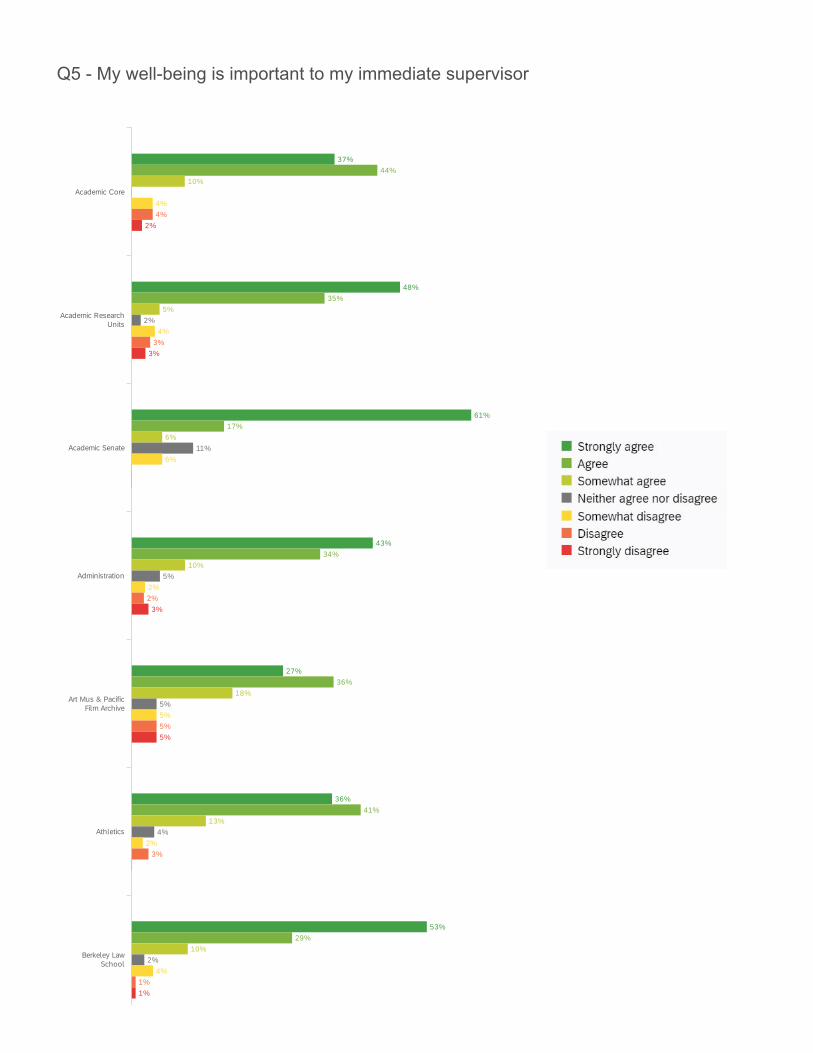
Q5 - My well-being is important to my immediate supervisor
37%
48%
61%
43%
27%
36%
53%
44%
35%
17%
34%
36%
41%
29%
10%
5%
6%
10%
18%
13%
10%
2%
11%
5%
5%
4%
2%
4%
4%
6%
2%
5%
2%
4%
4%
3%
2%
5%
3%
1%
2%
3%
3%
5%
1%
Academic Core
Athletics
Academic ResearchUnits
Academic Senate
Administration
Art Mus & PacificFilm Archive
Berkeley LawSchool

31%
56%
47%
15%
38%
44%
40%
33%
21%
31%
40%
51%
44%
31%
34%
22%
28%
6%
7%
5%
8%
13%
12%
7%
6%
21%
1%
7%
9%
3%
7%
3%
1%
3%
2%
10%
3%
4%
2%
2%
3%
3%
1%
Col ofEnvironmental
Design
CalPerformances_SMA
Chancellor'sImmediate Office
Central AccountingLedger
College ofChemistry
College ofEngineering
College of NaturalResources
45%
48%
35%
53%
63%
55%
39%
22%
30%
34%
45%
47%
28%
25%
34%
28%
5%
11%
5%
7%
11%
6%
6%
4%
5%
6%
9%
6%
7%
1%
2%
3%
4%
6%
4%
5%
2%
1%
2%
2%
2%
5%
5%
3%
2%
Equity & InclusionDiv
Haas School ofBusiness
Division of DataScience
Finance
Goldman Sch ofPublic Policy
Graduate Division
Graduate School ofEducation
L&S Arts &Humanities

37%
54%
39%
48%
67%
50%
49%
42%
29%
39%
33%
33%
27%
30%
26%
40%
13%
10%
10%
4%
10%
18%
14%
10%
5%
10%
2%
1%
4%
2%
2%
2%
1%
3%
4%
3%
1%
1%
3%
2%
2%
2%
L&S SocialSciences
L&S BiologicalSciences
L&S Core
L&S Math &Physical Sci
L&S UndergraduateDivision
Office for theFaculty
Res Museum & FieldStations

46%
27%
24%
37%
53%
33%
42%
40%
39%
36%
31%
27%
39%
50%
35%
11%
7%
18%
16%
17%
5%
17%
12%
2%
9%
14%
11%
4%
4%
7%
10%
5%
3%
4%
2%
3%
1%
9%
4%
2%
School ofInformation
Strategic Acad andFac Plan
ResearchAdministrative
Units
School ofJournalism
School ofOptometry
School of PublicHealth
School of SocialWelfare
Student Affairs

35%
51%
56%
63%
47%
43%
26%
27%
28%
23%
41%
31%
13%
11%
13%
7%
4%
17%
4%
4%
3%
100%
2%
9%
1%
2%
3%
3%
4%
4%
1%
4%
13%
1%
2%
1%
1%
4%
Univ Developmt andAlumni Rel
Summer Sessn,Study Abrd, OLLI
UC Library
UndergraduateEducation
UniversityExtension
VP Agriculture&Natural Resour
VP Research - MRUs
0% 10% 20% 30% 40% 50% 60% 70% 80% 90% 100%
# FieldStrongly
agreeAgree
Somewhatagree
Neitheragree nordisagree
Somewhatdisagree
DisagreeStronglydisagree
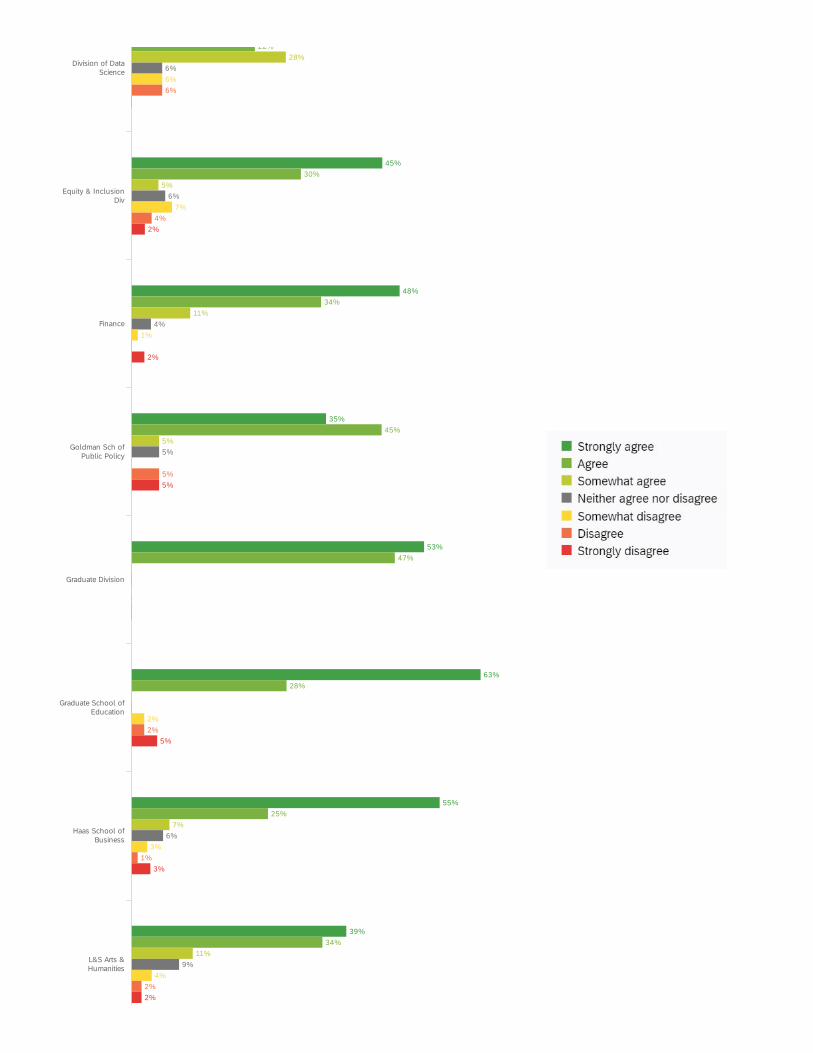
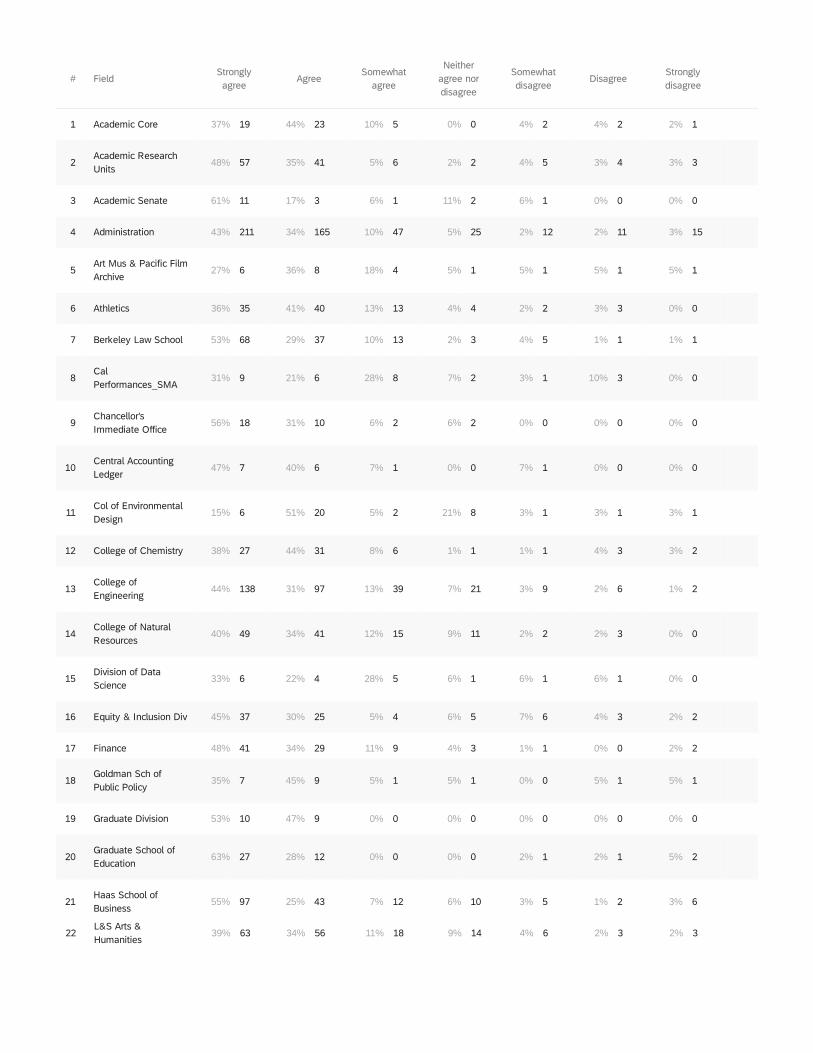
1 Academic Core 37% 19 44% 23 10% 5 0% 0 4% 2 4% 2 2% 1
2Academic ResearchUnits
48% 57 35% 41 5% 6 2% 2 4% 5 3% 4 3% 3
3 Academic Senate 61% 11 17% 3 6% 1 11% 2 6% 1 0% 0 0% 0
4 Administration 43% 211 34% 165 10% 47 5% 25 2% 12 2% 11 3% 15
5Art Mus & Pacific FilmArchive
27% 6 36% 8 18% 4 5% 1 5% 1 5% 1 5% 1
6 Athletics 36% 35 41% 40 13% 13 4% 4 2% 2 3% 3 0% 0
7 Berkeley Law School 53% 68 29% 37 10% 13 2% 3 4% 5 1% 1 1% 1
8CalPerformances_SMA
31% 9 21% 6 28% 8 7% 2 3% 1 10% 3 0% 0
9Chancellor'sImmediate Office
56% 18 31% 10 6% 2 6% 2 0% 0 0% 0 0% 0
10Central AccountingLedger
47% 7 40% 6 7% 1 0% 0 7% 1 0% 0 0% 0
11Col of EnvironmentalDesign
15% 6 51% 20 5% 2 21% 8 3% 1 3% 1 3% 1
12 College of Chemistry 38% 27 44% 31 8% 6 1% 1 1% 1 4% 3 3% 2
13College ofEngineering
44% 138 31% 97 13% 39 7% 21 3% 9 2% 6 1% 2
14College of NaturalResources
40% 49 34% 41 12% 15 9% 11 2% 2 2% 3 0% 0
15Division of DataScience
33% 6 22% 4 28% 5 6% 1 6% 1 6% 1 0% 0
16 Equity & Inclusion Div 45% 37 30% 25 5% 4 6% 5 7% 6 4% 3 2% 2
17 Finance 48% 41 34% 29 11% 9 4% 3 1% 1 0% 0 2% 2
18Goldman Sch ofPublic Policy
35% 7 45% 9 5% 1 5% 1 0% 0 5% 1 5% 1
19 Graduate Division 53% 10 47% 9 0% 0 0% 0 0% 0 0% 0 0% 0
20Graduate School ofEducation
63% 27 28% 12 0% 0 0% 0 2% 1 2% 1 5% 2
21Haas School ofBusiness
55% 97 25% 43 7% 12 6% 10 3% 5 1% 2 3% 6
22L&S Arts &Humanities
39% 63 34% 56 11% 18 9% 14 4% 6 2% 3 2% 3
# FieldStrongly
agreeAgree
Somewhatagree
Neitheragree nordisagree
Somewhatdisagree
DisagreeStronglydisagree
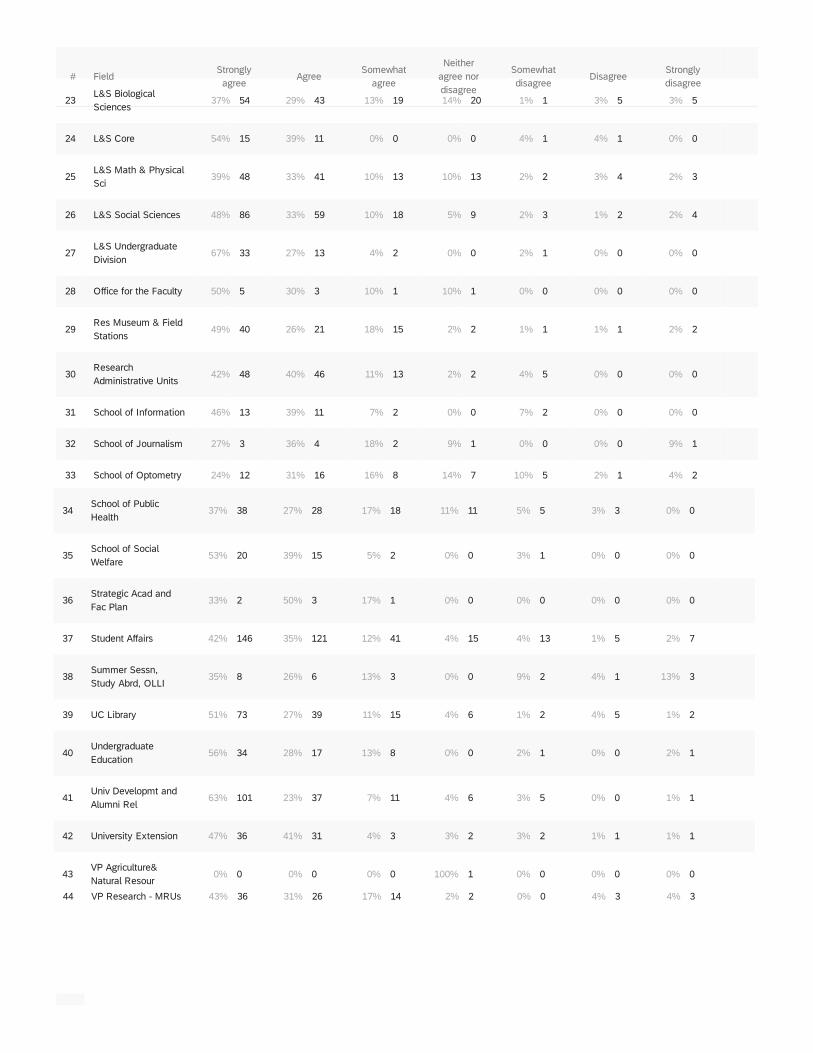
23L&S BiologicalSciences
37% 54 29% 43 13% 19 14% 20 1% 1 3% 5 3% 5
24 L&S Core 54% 15 39% 11 0% 0 0% 0 4% 1 4% 1 0% 0
25L&S Math & PhysicalSci
39% 48 33% 41 10% 13 10% 13 2% 2 3% 4 2% 3
26 L&S Social Sciences 48% 86 33% 59 10% 18 5% 9 2% 3 1% 2 2% 4
27L&S UndergraduateDivision
67% 33 27% 13 4% 2 0% 0 2% 1 0% 0 0% 0
28 Office for the Faculty 50% 5 30% 3 10% 1 10% 1 0% 0 0% 0 0% 0
29Res Museum & FieldStations
49% 40 26% 21 18% 15 2% 2 1% 1 1% 1 2% 2
30ResearchAdministrative Units
42% 48 40% 46 11% 13 2% 2 4% 5 0% 0 0% 0
31 School of Information 46% 13 39% 11 7% 2 0% 0 7% 2 0% 0 0% 0
32 School of Journalism 27% 3 36% 4 18% 2 9% 1 0% 0 0% 0 9% 1
33 School of Optometry 24% 12 31% 16 16% 8 14% 7 10% 5 2% 1 4% 2
34School of PublicHealth
37% 38 27% 28 17% 18 11% 11 5% 5 3% 3 0% 0
35School of SocialWelfare
53% 20 39% 15 5% 2 0% 0 3% 1 0% 0 0% 0
36Strategic Acad andFac Plan
33% 2 50% 3 17% 1 0% 0 0% 0 0% 0 0% 0
37 Student Affairs 42% 146 35% 121 12% 41 4% 15 4% 13 1% 5 2% 7
38Summer Sessn,Study Abrd, OLLI
35% 8 26% 6 13% 3 0% 0 9% 2 4% 1 13% 3
39 UC Library 51% 73 27% 39 11% 15 4% 6 1% 2 4% 5 1% 2
40UndergraduateEducation
56% 34 28% 17 13% 8 0% 0 2% 1 0% 0 2% 1
41Univ Developmt andAlumni Rel
63% 101 23% 37 7% 11 4% 6 3% 5 0% 0 1% 1
42 University Extension 47% 36 41% 31 4% 3 3% 2 3% 2 1% 1 1% 1
43VP Agriculture&Natural Resour
0% 0 0% 0 0% 0 100% 1 0% 0 0% 0 0% 0
44 VP Research - MRUs 43% 36 31% 26 17% 14 2% 2 0% 0 4% 3 4% 3

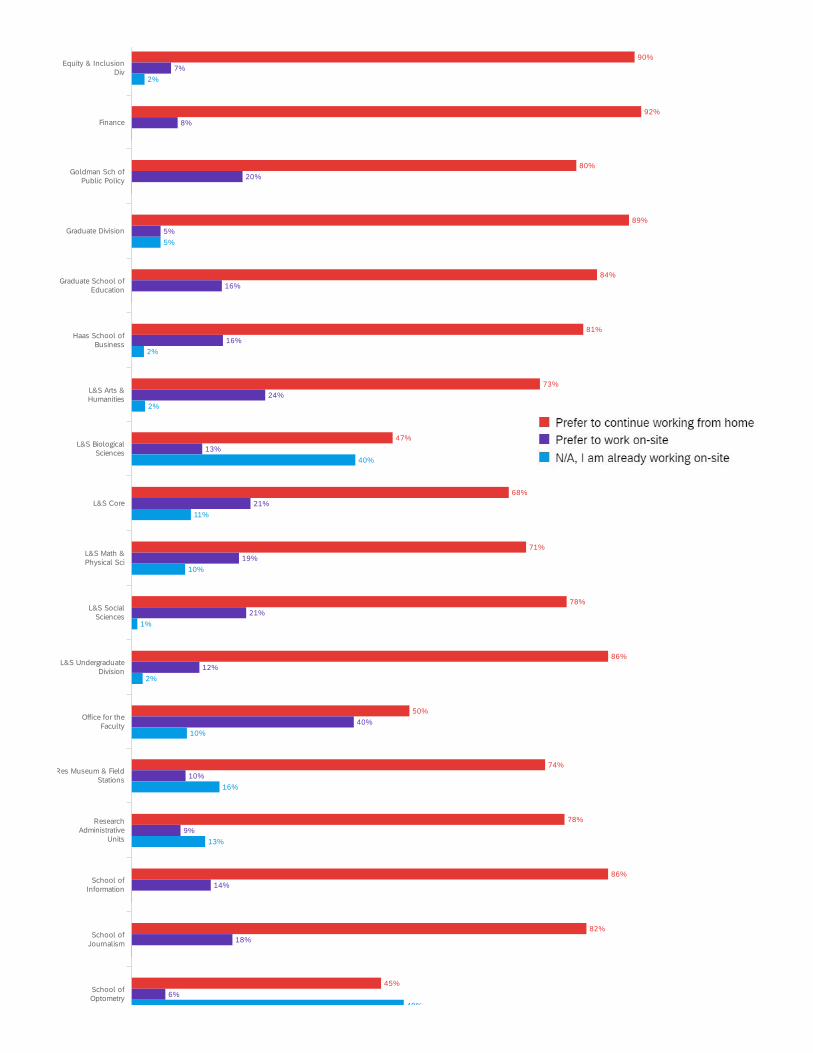
Q6 - If shelter-in-place orders are modified and the university begins to bring limited
number of employees to work on-site, would you:
62%
79%
61%
82%
59%
47%
77%
59%
94%
73%
74%
58%
70%
59%
94%
13%
10%
22%
10%
27%
32%
18%
38%
6%
20%
23%
24%
20%
24%
6%
25%
11%
17%
8%
14%
21%
5%
3%
7%
3%
18%
10%
17%
Academic Core
Athletics
Col ofEnvironmental
Design
Academic ResearchUnits
Academic Senate
Administration
Art Mus & PacificFilm Archive
Berkeley LawSchool
CalPerformances_SMA
Chancellor'sImmediate Office
Central AccountingLedger
College ofChemistry
College ofEngineering
College of NaturalResources
Division of DataScience
90%
92%
80%
89%
84%
81%
73%
47%
68%
71%
78%
86%
50%
74%
78%
86%
82%
45%
7%
8%
20%
5%
16%
16%
24%
13%
21%
19%
21%
12%
40%
10%
9%
14%
18%
6%
2%
5%
2%
2%
40%
11%
10%
1%
2%
10%
16%
13%
49%
Equity & InclusionDiv
Haas School ofBusiness
L&S SocialSciences
School ofInformation
Finance
Goldman Sch ofPublic Policy
Graduate Division
Graduate School ofEducation
L&S Arts &Humanities
L&S BiologicalSciences
L&S Core
L&S Math &Physical Sci
L&S UndergraduateDivision
Office for theFaculty
Res Museum & FieldStations
ResearchAdministrative
Units
School ofJournalism
School ofOptometry

78%
100%
100%
63%
96%
80%
93%
90%
83%
77%
19%
9%
4%
14%
5%
9%
13%
10%
49%
3%
28%
6%
2%
1%
4%
100%
13%
Strategic Acad andFac Plan
Univ Developmt andAlumni Rel
School of PublicHealth
School of SocialWelfare
Student Affairs
Summer Sessn,Study Abrd, OLLI
UC Library
UndergraduateEducation
UniversityExtension
VP Agriculture&Natural Resour
VP Research - MRUs
0% 10% 20% 30% 40% 50% 60% 70% 80% 90% 100%
# FieldPrefer to continue working from
homePrefer to work on-
siteN/A, I am already working on-
siteTotal
1 Academic Core 62% 32 13% 7 25% 13 52
2 Academic Research Units 79% 94 10% 12 11% 13 119
3 Academic Senate 61% 11 22% 4 17% 3 18
4 Administration 82% 400 10% 47 8% 39 486
5 Art Mus & Pacific Film Archive 59% 13 27% 6 14% 3 22
6 Athletics 47% 46 32% 31 21% 20 97
7 Berkeley Law School 77% 99 18% 23 5% 6 128
8 Cal Performances_SMA 59% 17 38% 11 3% 1 29

# FieldPrefer to continue working from
homePrefer to work on-
siteN/A, I am already working on-
siteTotal
9 Chancellor's Immediate Office 94% 30 6% 2 0% 0 32
10 Central Accounting Ledger 73% 11 20% 3 7% 1 15
11 Col of Environmental Design 74% 29 23% 9 3% 1 39
12 College of Chemistry 58% 41 24% 17 18% 13 71
13 College of Engineering 70% 220 20% 62 10% 31 313
14 College of Natural Resources 59% 72 24% 29 17% 21 122
15 Division of Data Science 94% 17 6% 1 0% 0 18
16 Equity & Inclusion Div 90% 76 7% 6 2% 2 84
17 Finance 92% 77 8% 7 0% 0 84
18 Goldman Sch of Public Policy 80% 16 20% 4 0% 0 20
19 Graduate Division 89% 17 5% 1 5% 1 19
20 Graduate School of Education 84% 36 16% 7 0% 0 43
21 Haas School of Business 81% 143 16% 29 2% 4 176
22 L&S Arts & Humanities 73% 119 24% 39 2% 4 162
23 L&S Biological Sciences 47% 70 13% 19 40% 60 149
24 L&S Core 68% 19 21% 6 11% 3 28
25 L&S Math & Physical Sci 71% 88 19% 24 10% 12 124
26 L&S Social Sciences 78% 144 21% 38 1% 2 184
27 L&S Undergraduate Division 86% 42 12% 6 2% 1 49
28 Office for the Faculty 50% 5 40% 4 10% 1 10
29 Res Museum & Field Stations 74% 61 10% 8 16% 13 82
30 Research Administrative Units 78% 88 9% 10 13% 15 113
31 School of Information 86% 24 14% 4 0% 0 28
32 School of Journalism 82% 9 18% 2 0% 0 11
33 School of Optometry 45% 22 6% 3 49% 24 49
34 School of Public Health 78% 80 19% 20 3% 3 103
35 School of Social Welfare 100% 38 0% 0 0% 0 38

Showing rows 1 - 44 of 44
# FieldPrefer to continue working from
homePrefer to work on-
siteN/A, I am already working on-
siteTotal
36 Strategic Acad and Fac Plan 100% 6 0% 0 0% 0 6
37 Student Affairs 63% 218 9% 31 28% 98 347
38Summer Sessn, Study Abrd,OLLI
96% 22 4% 1 0% 0 23
39 UC Library 80% 113 14% 20 6% 9 142
40 Undergraduate Education 93% 57 5% 3 2% 1 61
41 Univ Developmt and Alumni Rel 90% 146 9% 14 1% 2 162
42 University Extension 83% 63 13% 10 4% 3 76
43 VP Agriculture& Natural Resour 0% 0 0% 0 100% 1 1
44 VP Research - MRUs 77% 64 10% 8 13% 11 83

Q7 - Would you be interested in answering four questions about child/dependent care
and its impact on your work?
55%
64%
67%
54%
27%
57%
63%
41%
66%
47%
64%
46%
56%
63%
56%
56%
59%
45%
47%
65%
55%
64%
62%
45%
36%
33%
46%
73%
43%
38%
59%
34%
53%
36%
54%
44%
37%
44%
44%
41%
55%
53%
35%
45%
36%
Academic Core
Athletics
Col ofEnvironmental
Design
Equity & InclusionDiv
Haas School ofBusiness
Academic ResearchUnits
Academic Senate
Administration
Art Mus & PacificFilm Archive
Berkeley LawSchool
CalPerformances_SMA
Chancellor'sImmediate Office
Central AccountingLedger
College ofChemistry
College ofEngineering
College of NaturalResources
Division of DataScience
Finance
Goldman Sch ofPublic Policy
Graduate Division
Graduate School ofEducation
L&S Arts &Humanities
L&S Biological
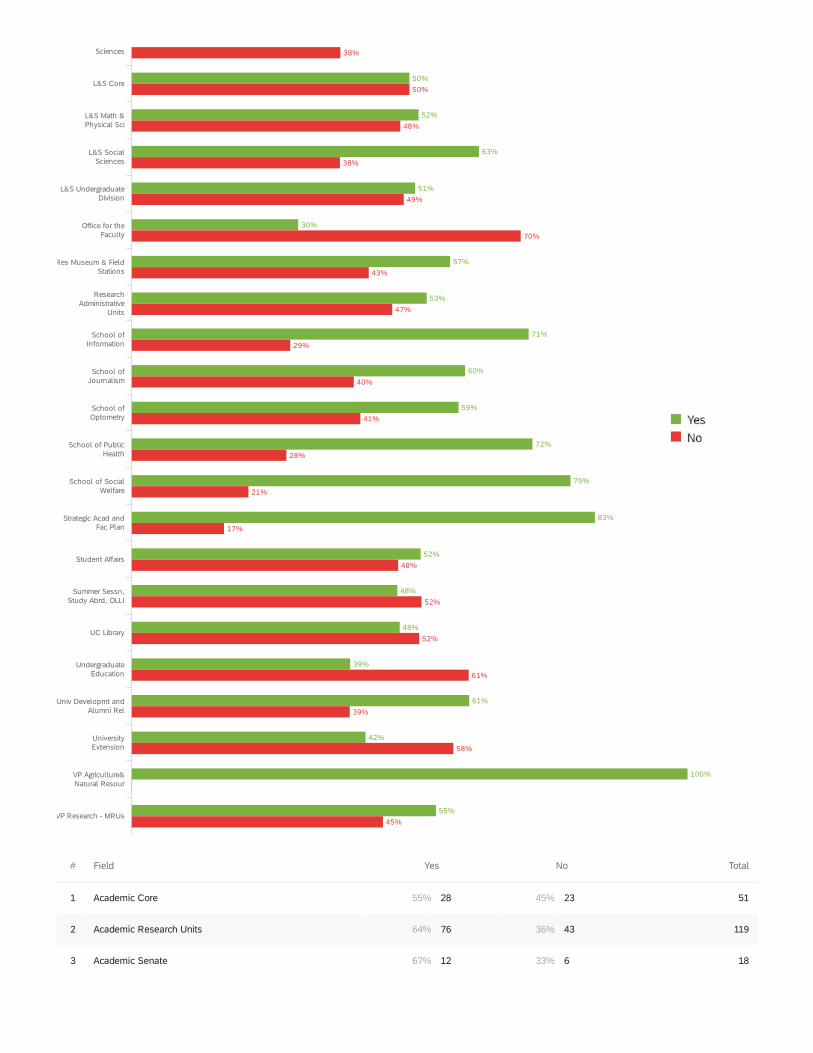
50%
52%
63%
51%
30%
57%
53%
71%
60%
59%
72%
79%
83%
52%
48%
48%
39%
61%
42%
100%
55%
38%
50%
48%
38%
49%
70%
43%
47%
29%
40%
41%
28%
21%
17%
48%
52%
52%
61%
39%
58%
45%
L&S SocialSciences
School ofInformation
Strategic Acad andFac Plan
Univ Developmt andAlumni Rel
Sciences
L&S Core
L&S Math &Physical Sci
L&S UndergraduateDivision
Office for theFaculty
Res Museum & FieldStations
ResearchAdministrative
Units
School ofJournalism
School ofOptometry
School of PublicHealth
School of SocialWelfare
Student Affairs
Summer Sessn,Study Abrd, OLLI
UC Library
UndergraduateEducation
UniversityExtension
VP Agriculture&Natural Resour
VP Research - MRUs
# Field Yes No Total
1 Academic Core 55% 28 45% 23 51
2 Academic Research Units 64% 76 36% 43 119
3 Academic Senate 67% 12 33% 6 18
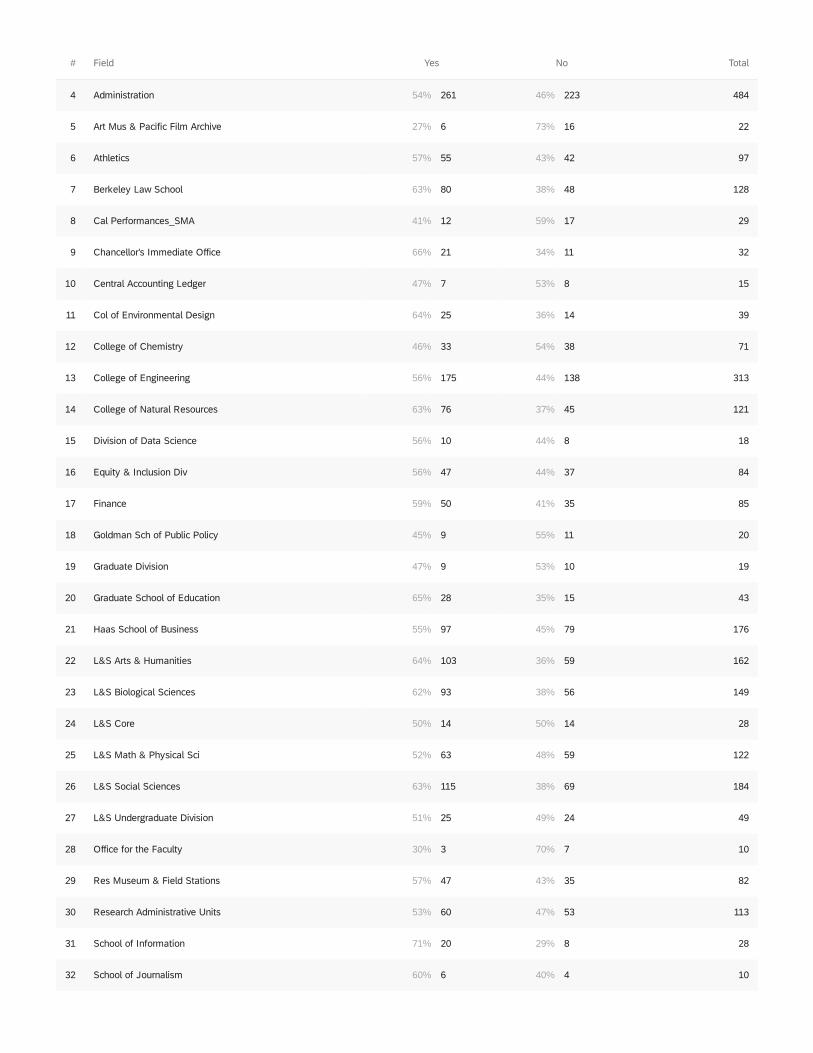
# Field Yes No Total
4 Administration 54% 261 46% 223 484
5 Art Mus & Pacific Film Archive 27% 6 73% 16 22
6 Athletics 57% 55 43% 42 97
7 Berkeley Law School 63% 80 38% 48 128
8 Cal Performances_SMA 41% 12 59% 17 29
9 Chancellor's Immediate Office 66% 21 34% 11 32
10 Central Accounting Ledger 47% 7 53% 8 15
11 Col of Environmental Design 64% 25 36% 14 39
12 College of Chemistry 46% 33 54% 38 71
13 College of Engineering 56% 175 44% 138 313
14 College of Natural Resources 63% 76 37% 45 121
15 Division of Data Science 56% 10 44% 8 18
16 Equity & Inclusion Div 56% 47 44% 37 84
17 Finance 59% 50 41% 35 85
18 Goldman Sch of Public Policy 45% 9 55% 11 20
19 Graduate Division 47% 9 53% 10 19
20 Graduate School of Education 65% 28 35% 15 43
21 Haas School of Business 55% 97 45% 79 176
22 L&S Arts & Humanities 64% 103 36% 59 162
23 L&S Biological Sciences 62% 93 38% 56 149
24 L&S Core 50% 14 50% 14 28
25 L&S Math & Physical Sci 52% 63 48% 59 122
26 L&S Social Sciences 63% 115 38% 69 184
27 L&S Undergraduate Division 51% 25 49% 24 49
28 Office for the Faculty 30% 3 70% 7 10
29 Res Museum & Field Stations 57% 47 43% 35 82
30 Research Administrative Units 53% 60 47% 53 113
31 School of Information 71% 20 29% 8 28
32 School of Journalism 60% 6 40% 4 10
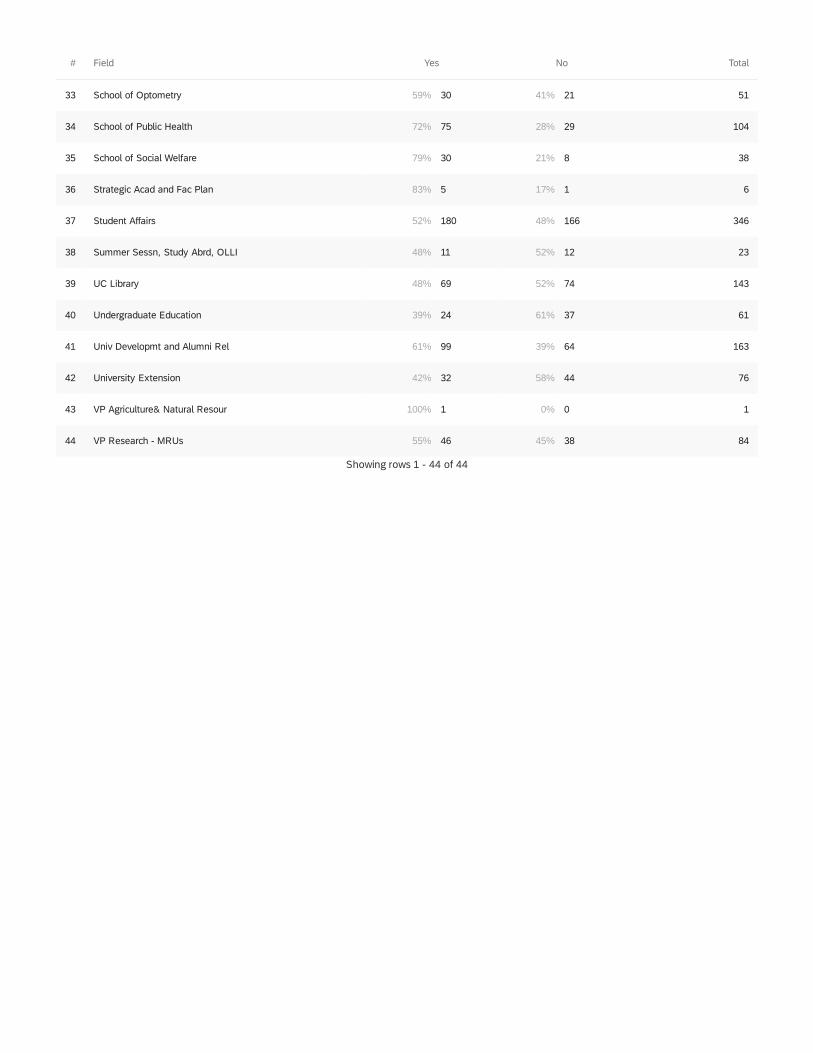
Showing rows 1 - 44 of 44
# Field Yes No Total
33 School of Optometry 59% 30 41% 21 51
34 School of Public Health 72% 75 28% 29 104
35 School of Social Welfare 79% 30 21% 8 38
36 Strategic Acad and Fac Plan 83% 5 17% 1 6
37 Student Affairs 52% 180 48% 166 346
38 Summer Sessn, Study Abrd, OLLI 48% 11 52% 12 23
39 UC Library 48% 69 52% 74 143
40 Undergraduate Education 39% 24 61% 37 61
41 Univ Developmt and Alumni Rel 61% 99 39% 64 163
42 University Extension 42% 32 58% 44 76
43 VP Agriculture& Natural Resour 100% 1 0% 0 1
44 VP Research - MRUs 55% 46 45% 38 84

Q8 - How many more hours per week do you personally spend on caregiving (childcare,
caring for adult dependents) during what would be your normal working hours compared
to prior to the shutdowns and shelter-in-place restrictions imposed by public health
officials?
36%
27%
33%
19%
17%
30%
14%
7%
17%
6%
9%
4%
14%
17%
10%
17%
6%
25%
16%
11%
33%
13%
7%
7%
8%
18%
33%
7%
7%
8%
17%
16%
7%
22%
8%
21%
Academic Core
Athletics
Academic ResearchUnits
Academic Senate
Administration
Art Mus & PacificFilm Archive
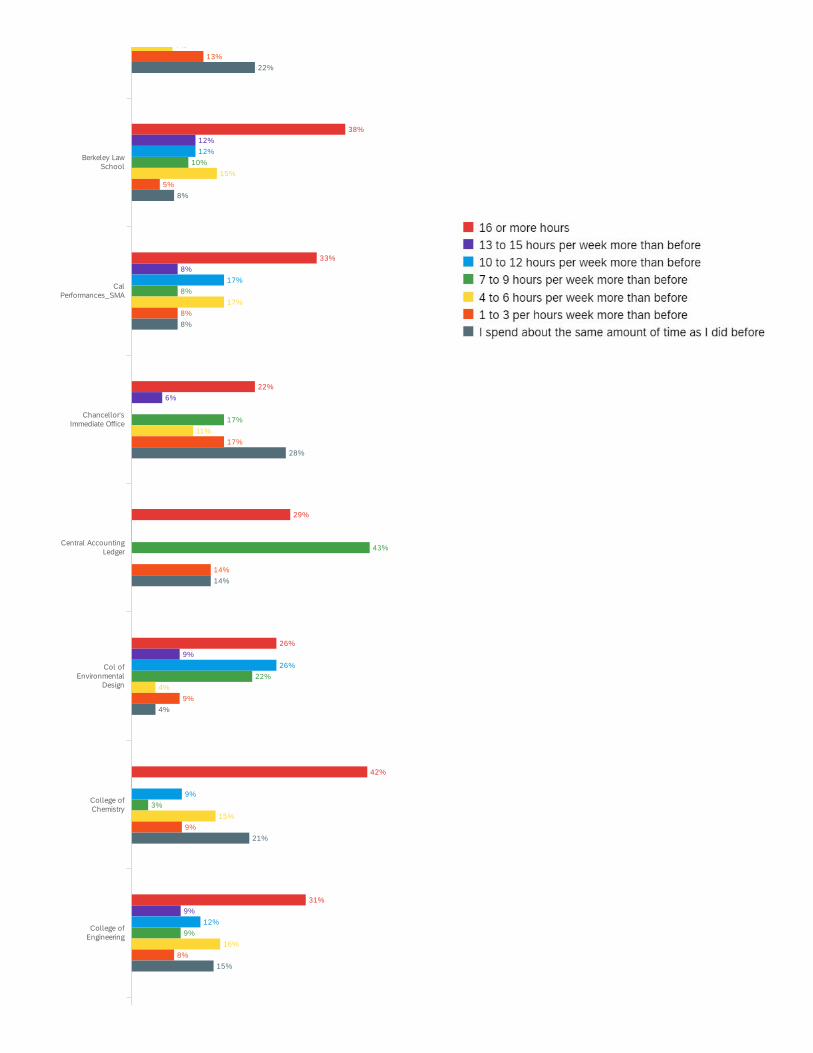
38%
33%
22%
29%
26%
42%
31%
12%
8%
6%
9%
9%
12%
17%
26%
9%
12%
10%
8%
17%
43%
22%
3%
9%
7%
15%
17%
11%
4%
15%
16%
13%
5%
8%
17%
14%
9%
9%
8%
22%
8%
8%
28%
14%
4%
21%
15%
Col ofEnvironmental
Design
Berkeley LawSchool
CalPerformances_SMA
Chancellor'sImmediate Office
Central AccountingLedger
College ofChemistry
College ofEngineering

31%
40%
20%
19%
56%
33%
37%
26%
13%
10%
11%
4%
11%
7%
7%
8%
20%
8%
11%
11%
7%
11%
11%
14%
6%
22%
19%
12%
15%
10%
7%
15%
11%
11%
11%
9%
20%
18%
27%
22%
7%
13%
20%
9%
21%
11%
11%
Equity & InclusionDiv
Haas School ofB i
College of NaturalResources
Division of DataScience
Finance
Goldman Sch ofPublic Policy
Graduate Division
Graduate School ofEducation
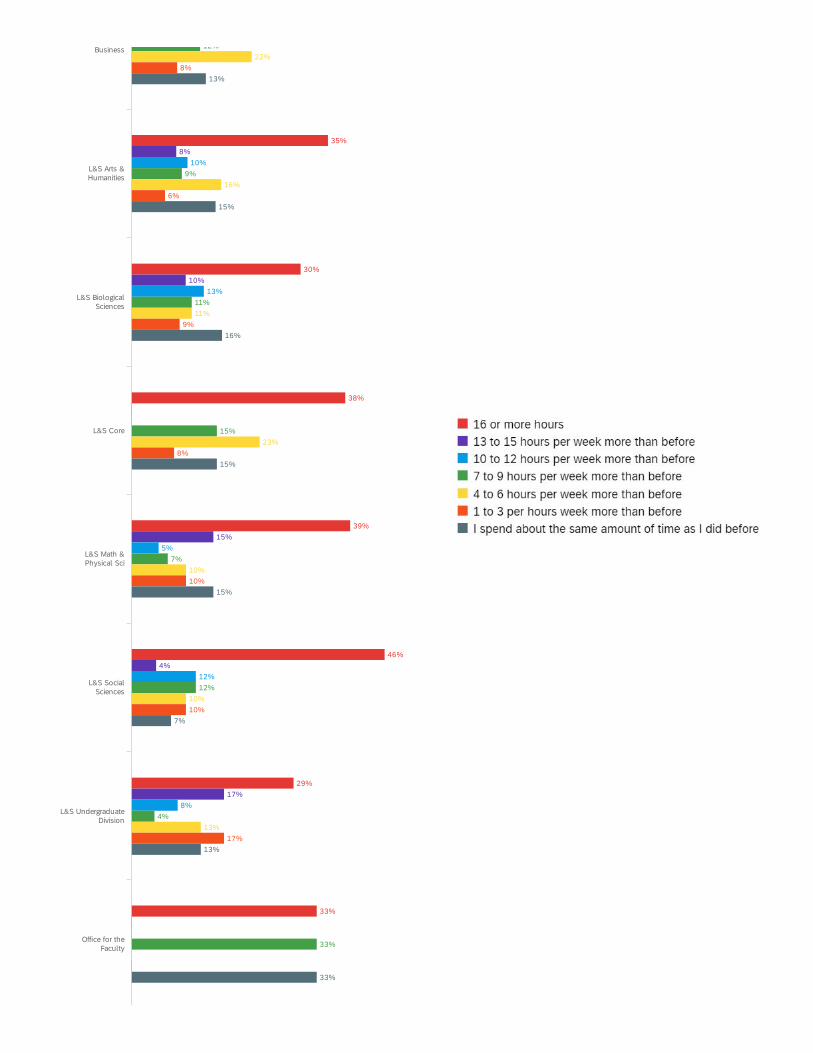
35%
30%
38%
39%
46%
29%
33%
8%
10%
15%
4%
17%
10%
13%
5%
12%
8%
12%
9%
11%
15%
7%
12%
4%
33%
22%
16%
11%
23%
10%
10%
13%
8%
6%
9%
8%
10%
10%
17%
13%
15%
16%
15%
15%
7%
13%
33%
Business
L&S SocialSciences
L&S Arts &Humanities
L&S BiologicalSciences
L&S Core
L&S Math &Physical Sci
L&S UndergraduateDivision
Office for theFaculty

22%
25%
50%
17%
20%
27%
36%
40%
4%
3%
5%
17%
7%
11%
7%
13%
12%
10%
10%
15%
7%
9%
12%
15%
33%
13%
11%
7%
13%
15%
5%
17%
15%
18%
20%
8%
10%
17%
10%
7%
14%
20%
24%
5%
17%
23%
13%
11%
School ofInformation
Res Museum & FieldStations
ResearchAdministrative
Units
School ofJournalism
School ofOptometry
School of PublicHealth
School of SocialWelfare
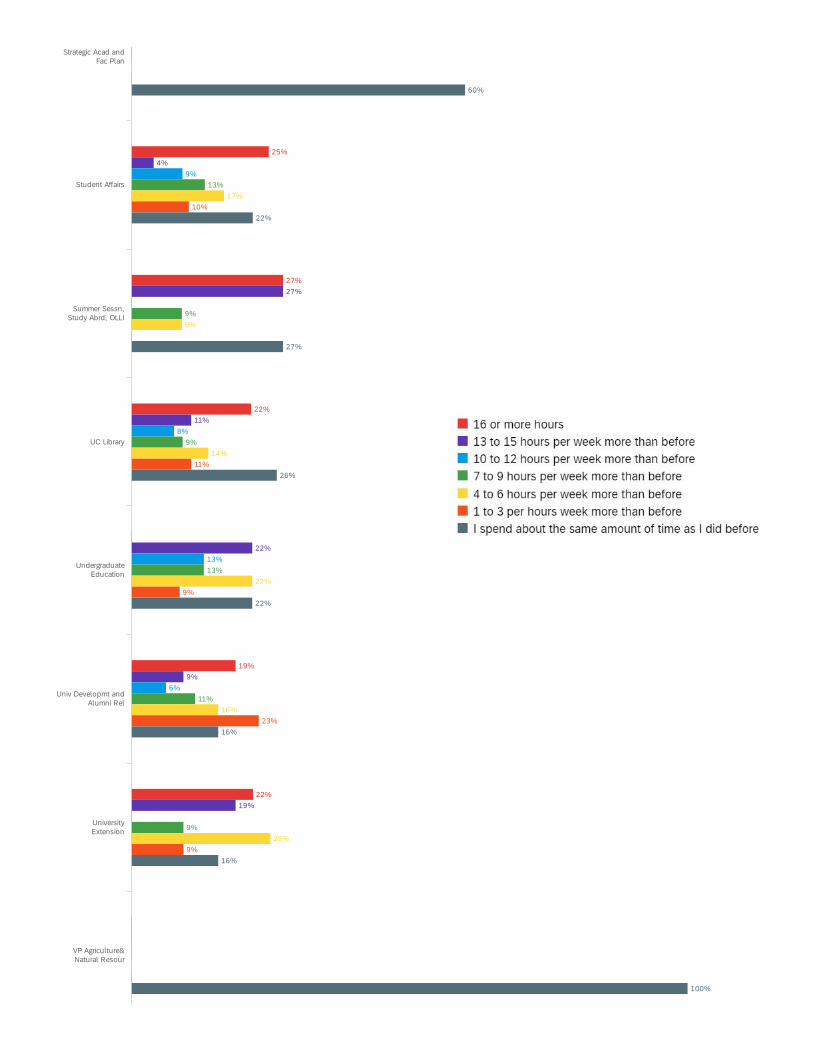
25%
27%
22%
19%
22%
4%
27%
11%
22%
9%
19%
9%
8%
13%
6%
13%
9%
9%
13%
11%
9%
17%
9%
14%
22%
16%
25%
10%
11%
9%
23%
9%
60%
22%
27%
26%
22%
16%
16%
100%
Strategic Acad andFac Plan
Univ Developmt andAlumni Rel
Student Affairs
Summer Sessn,Study Abrd, OLLI
UC Library
UndergraduateEducation
UniversityExtension
VP Agriculture&Natural Resour
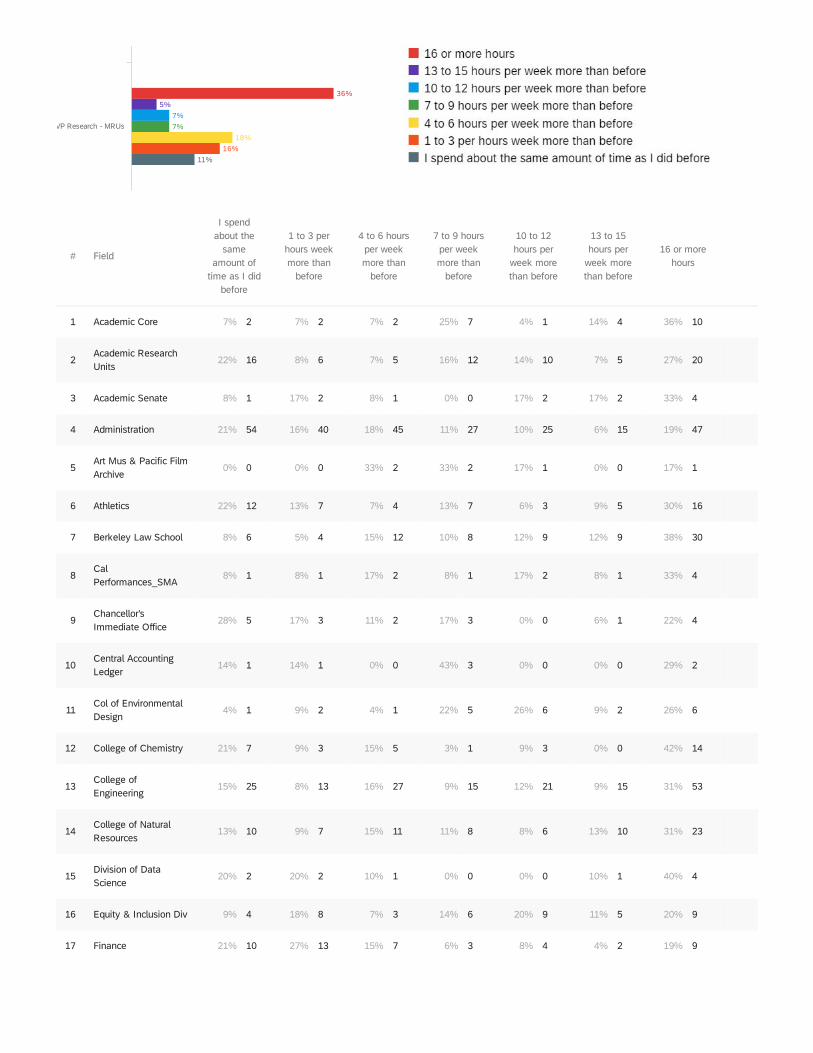
36%
5%
7%
7%
18%
16%
11%
VP Research - MRUs
# Field
I spendabout the
sameamount of
time as I didbefore
1 to 3 perhours weekmore than
before
4 to 6 hoursper weekmore than
before
7 to 9 hoursper weekmore than
before
10 to 12hours per
week morethan before
13 to 15hours per
week morethan before
16 or morehours
1 Academic Core 7% 2 7% 2 7% 2 25% 7 4% 1 14% 4 36% 10
2Academic ResearchUnits
22% 16 8% 6 7% 5 16% 12 14% 10 7% 5 27% 20
3 Academic Senate 8% 1 17% 2 8% 1 0% 0 17% 2 17% 2 33% 4
4 Administration 21% 54 16% 40 18% 45 11% 27 10% 25 6% 15 19% 47
5Art Mus & Pacific FilmArchive
0% 0 0% 0 33% 2 33% 2 17% 1 0% 0 17% 1
6 Athletics 22% 12 13% 7 7% 4 13% 7 6% 3 9% 5 30% 16
7 Berkeley Law School 8% 6 5% 4 15% 12 10% 8 12% 9 12% 9 38% 30
8CalPerformances_SMA
8% 1 8% 1 17% 2 8% 1 17% 2 8% 1 33% 4
9Chancellor'sImmediate Office
28% 5 17% 3 11% 2 17% 3 0% 0 6% 1 22% 4
10Central AccountingLedger
14% 1 14% 1 0% 0 43% 3 0% 0 0% 0 29% 2
11Col of EnvironmentalDesign
4% 1 9% 2 4% 1 22% 5 26% 6 9% 2 26% 6
12 College of Chemistry 21% 7 9% 3 15% 5 3% 1 9% 3 0% 0 42% 14
13College ofEngineering
15% 25 8% 13 16% 27 9% 15 12% 21 9% 15 31% 53
14College of NaturalResources
13% 10 9% 7 15% 11 11% 8 8% 6 13% 10 31% 23
15Division of DataScience
20% 2 20% 2 10% 1 0% 0 0% 0 10% 1 40% 4
16 Equity & Inclusion Div 9% 4 18% 8 7% 3 14% 6 20% 9 11% 5 20% 9
17 Finance 21% 10 27% 13 15% 7 6% 3 8% 4 4% 2 19% 9
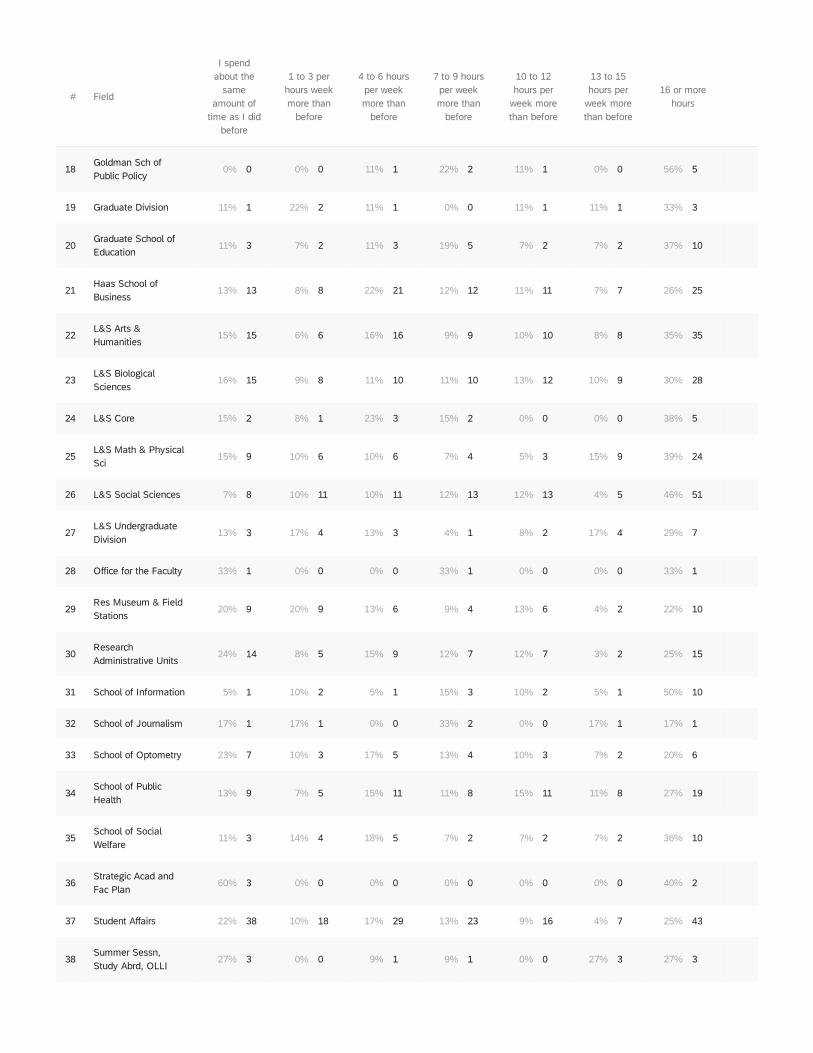
# Field
I spendabout the
sameamount of
time as I didbefore
1 to 3 perhours weekmore than
before
4 to 6 hoursper weekmore than
before
7 to 9 hoursper weekmore than
before
10 to 12hours per
week morethan before
13 to 15hours per
week morethan before
16 or morehours
18Goldman Sch ofPublic Policy
0% 0 0% 0 11% 1 22% 2 11% 1 0% 0 56% 5
19 Graduate Division 11% 1 22% 2 11% 1 0% 0 11% 1 11% 1 33% 3
20Graduate School ofEducation
11% 3 7% 2 11% 3 19% 5 7% 2 7% 2 37% 10
21Haas School ofBusiness
13% 13 8% 8 22% 21 12% 12 11% 11 7% 7 26% 25
22L&S Arts &Humanities
15% 15 6% 6 16% 16 9% 9 10% 10 8% 8 35% 35
23L&S BiologicalSciences
16% 15 9% 8 11% 10 11% 10 13% 12 10% 9 30% 28
24 L&S Core 15% 2 8% 1 23% 3 15% 2 0% 0 0% 0 38% 5
25L&S Math & PhysicalSci
15% 9 10% 6 10% 6 7% 4 5% 3 15% 9 39% 24
26 L&S Social Sciences 7% 8 10% 11 10% 11 12% 13 12% 13 4% 5 46% 51
27L&S UndergraduateDivision
13% 3 17% 4 13% 3 4% 1 8% 2 17% 4 29% 7
28 Office for the Faculty 33% 1 0% 0 0% 0 33% 1 0% 0 0% 0 33% 1
29Res Museum & FieldStations
20% 9 20% 9 13% 6 9% 4 13% 6 4% 2 22% 10
30ResearchAdministrative Units
24% 14 8% 5 15% 9 12% 7 12% 7 3% 2 25% 15
31 School of Information 5% 1 10% 2 5% 1 15% 3 10% 2 5% 1 50% 10
32 School of Journalism 17% 1 17% 1 0% 0 33% 2 0% 0 17% 1 17% 1
33 School of Optometry 23% 7 10% 3 17% 5 13% 4 10% 3 7% 2 20% 6
34School of PublicHealth
13% 9 7% 5 15% 11 11% 8 15% 11 11% 8 27% 19
35School of SocialWelfare
11% 3 14% 4 18% 5 7% 2 7% 2 7% 2 36% 10
36Strategic Acad andFac Plan
60% 3 0% 0 0% 0 0% 0 0% 0 0% 0 40% 2
37 Student Affairs 22% 38 10% 18 17% 29 13% 23 9% 16 4% 7 25% 43
38Summer Sessn,Study Abrd, OLLI
27% 3 0% 0 9% 1 9% 1 0% 0 27% 3 27% 3
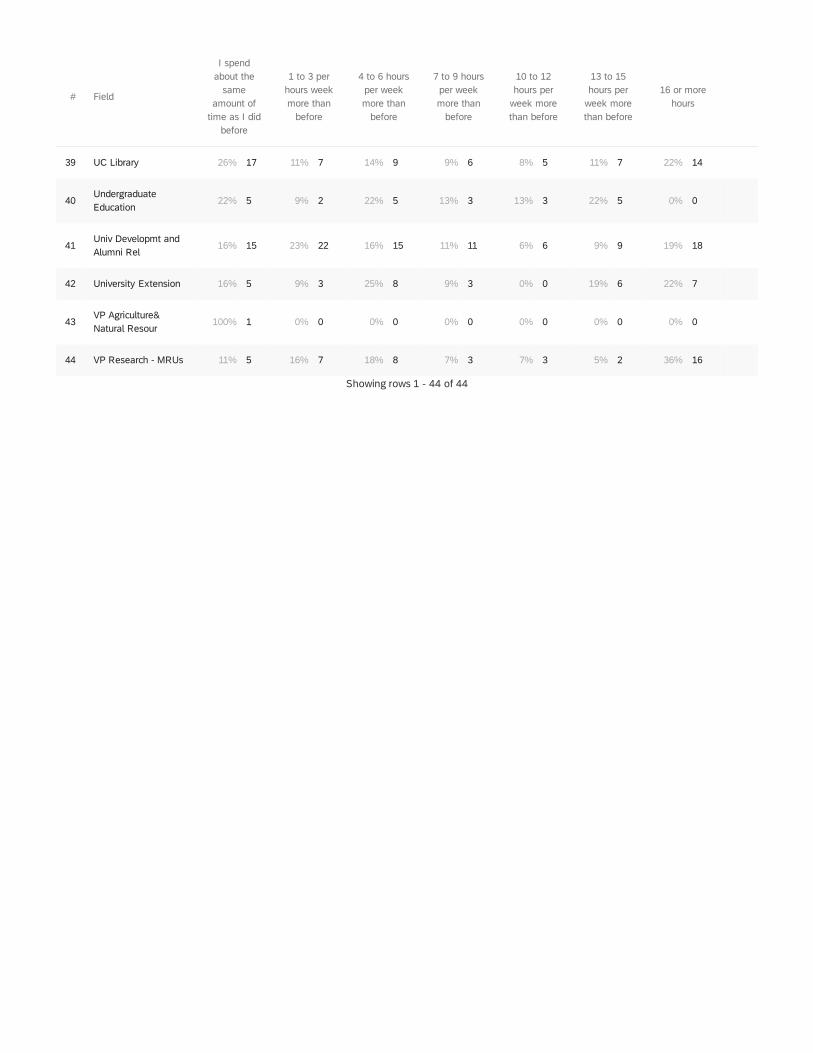
Showing rows 1 - 44 of 44
# Field
I spendabout the
sameamount of
time as I didbefore
1 to 3 perhours weekmore than
before
4 to 6 hoursper weekmore than
before
7 to 9 hoursper weekmore than
before
10 to 12hours per
week morethan before
13 to 15hours per
week morethan before
16 or morehours
39 UC Library 26% 17 11% 7 14% 9 9% 6 8% 5 11% 7 22% 14
40UndergraduateEducation
22% 5 9% 2 22% 5 13% 3 13% 3 22% 5 0% 0
41Univ Developmt andAlumni Rel
16% 15 23% 22 16% 15 11% 11 6% 6 9% 9 19% 18
42 University Extension 16% 5 9% 3 25% 8 9% 3 0% 0 19% 6 22% 7
43VP Agriculture&Natural Resour
100% 1 0% 0 0% 0 0% 0 0% 0 0% 0 0% 0
44 VP Research - MRUs 11% 5 16% 7 18% 8 7% 3 7% 3 5% 2 36% 16
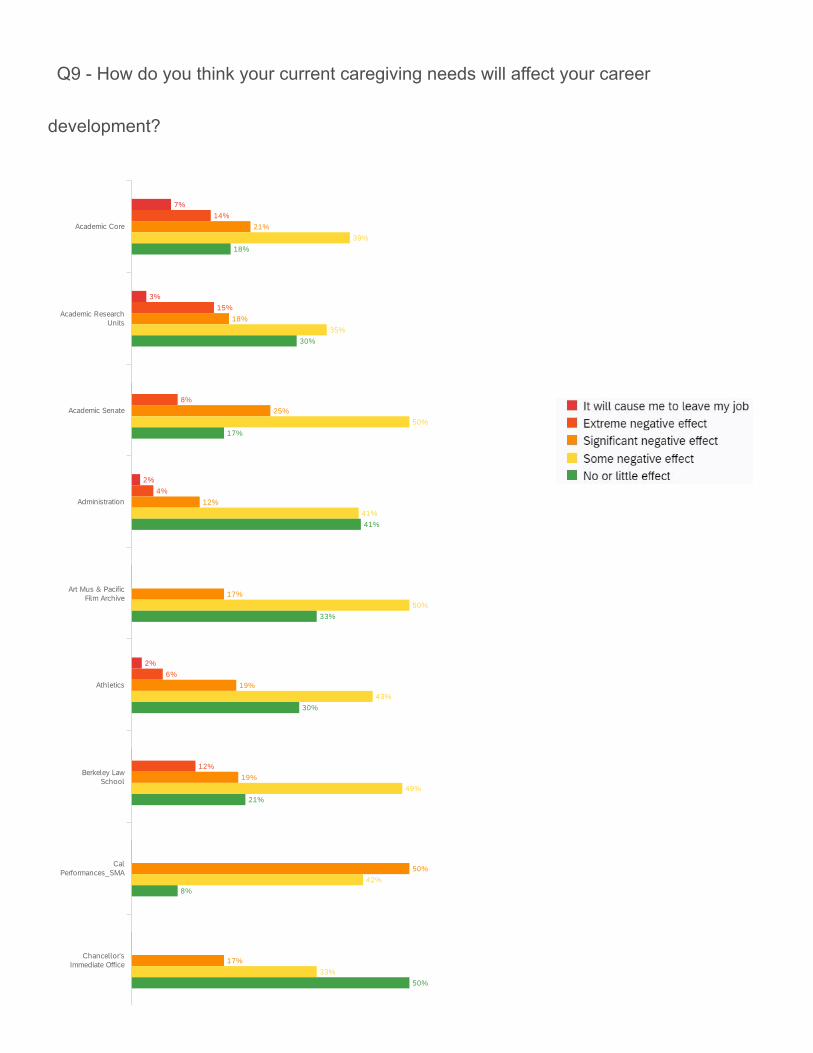
Q9 - How do you think your current caregiving needs will affect your career
development?
7%
3%
2%
2%
14%
15%
8%
4%
6%
12%
21%
18%
25%
12%
17%
19%
19%
50%
17%
39%
35%
50%
41%
50%
43%
49%
42%
33%
18%
30%
17%
41%
33%
30%
21%
8%
50%
Academic Core
Athletics
Academic ResearchUnits
Academic Senate
Administration
Art Mus & PacificFilm Archive
Berkeley LawSchool
CalPerformances_SMA
Chancellor'sImmediate Office

9%
1%
1%
11%
14%
13%
9%
11%
4%
11%
2%
11%
11%
29%
48%
9%
23%
32%
10%
23%
15%
11%
22%
29%
26%
31%
39%
43%
60%
50%
23%
44%
44%
29%
13%
41%
27%
20%
30%
16%
60%
22%
33%
Col ofEnvironmental
Design
Equity & InclusionDiv
Central AccountingLedger
College ofChemistry
College ofEngineering
College of NaturalResources
Division of DataScience
Finance
Goldman Sch ofPublic Policy
Graduate Division
G d t S h l f
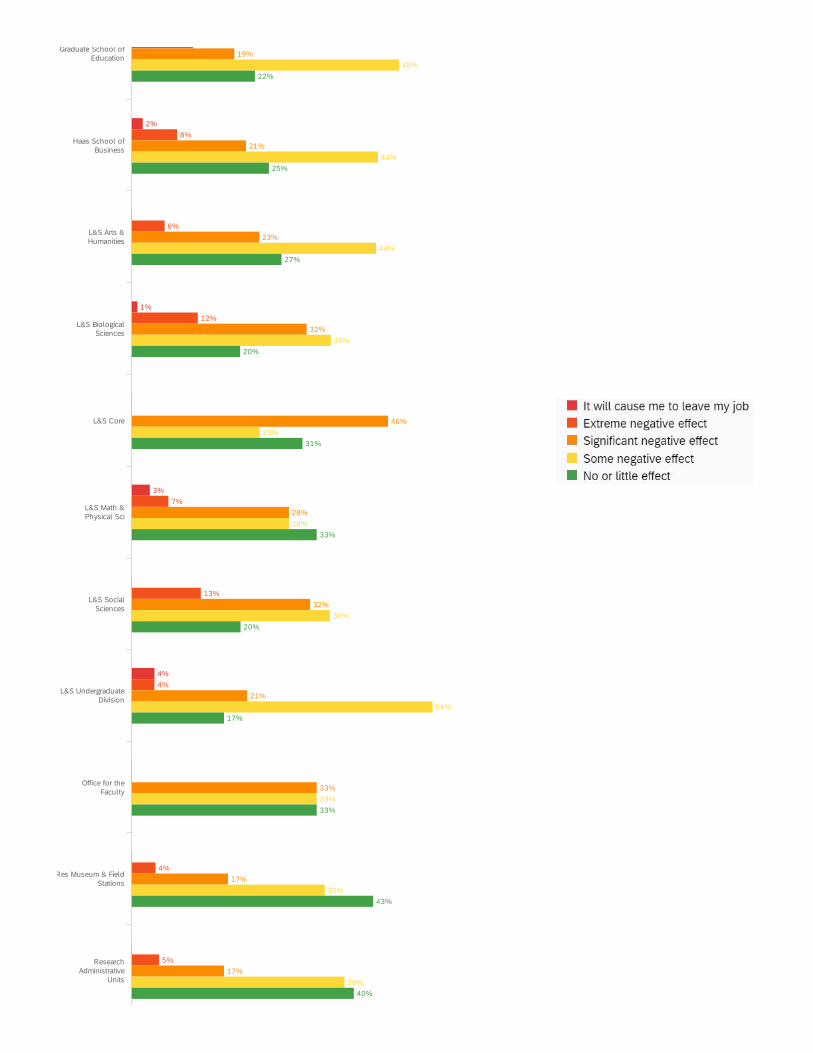
2%
1%
3%
4%
8%
6%
12%
7%
13%
4%
4%
5%
19%
21%
23%
32%
46%
28%
32%
21%
33%
17%
17%
48%
44%
44%
36%
23%
28%
36%
54%
33%
35%
38%
22%
25%
27%
20%
31%
33%
20%
17%
33%
43%
40%
Haas School ofBusiness
L&S SocialSciences
Graduate School ofEducation
L&S Arts &Humanities
L&S BiologicalSciences
L&S Core
L&S Math &Physical Sci
L&S UndergraduateDivision
Office for theFaculty
Res Museum & FieldStations
ResearchAdministrative
Units

3%
20%
2%
2%
10%
17%
7%
11%
18%
5%
18%
5%
25%
33%
27%
24%
25%
20%
24%
9%
18%
17%
50%
33%
43%
48%
32%
20%
40%
55%
36%
42%
15%
17%
20%
17%
25%
40%
28%
18%
39%
42%
School ofInformation
Strategic Acad andFac Plan
School ofJournalism
School ofOptometry
School of PublicHealth
School of SocialWelfare
Student Affairs
Summer Sessn,Study Abrd, OLLI
UC Library
UndergraduateEducation
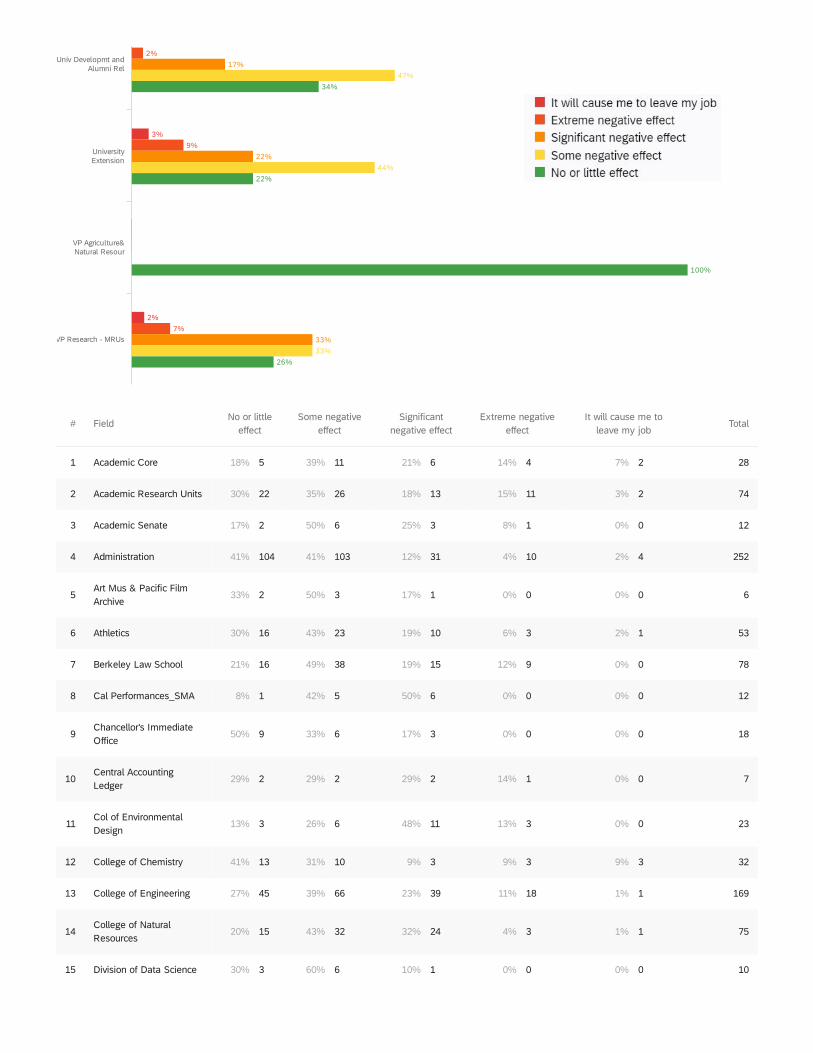
3%
2%
2%
9%
7%
17%
22%
33%
47%
44%
33%
34%
22%
100%
26%
Univ Developmt andAlumni Rel
UniversityExtension
VP Agriculture&Natural Resour
VP Research - MRUs
# FieldNo or little
effectSome negative
effectSignificant
negative effectExtreme negative
effectIt will cause me to
leave my jobTotal
1 Academic Core 18% 5 39% 11 21% 6 14% 4 7% 2 28
2 Academic Research Units 30% 22 35% 26 18% 13 15% 11 3% 2 74
3 Academic Senate 17% 2 50% 6 25% 3 8% 1 0% 0 12
4 Administration 41% 104 41% 103 12% 31 4% 10 2% 4 252
5Art Mus & Pacific FilmArchive
33% 2 50% 3 17% 1 0% 0 0% 0 6
6 Athletics 30% 16 43% 23 19% 10 6% 3 2% 1 53
7 Berkeley Law School 21% 16 49% 38 19% 15 12% 9 0% 0 78
8 Cal Performances_SMA 8% 1 42% 5 50% 6 0% 0 0% 0 12
9Chancellor's ImmediateOffice
50% 9 33% 6 17% 3 0% 0 0% 0 18
10Central AccountingLedger
29% 2 29% 2 29% 2 14% 1 0% 0 7
11Col of EnvironmentalDesign
13% 3 26% 6 48% 11 13% 3 0% 0 23
12 College of Chemistry 41% 13 31% 10 9% 3 9% 3 9% 3 32
13 College of Engineering 27% 45 39% 66 23% 39 11% 18 1% 1 169
14College of NaturalResources
20% 15 43% 32 32% 24 4% 3 1% 1 75
15 Division of Data Science 30% 3 60% 6 10% 1 0% 0 0% 0 10

# FieldNo or little
effectSome negative
effectSignificant
negative effectExtreme negative
effectIt will cause me to
leave my jobTotal
16 Equity & Inclusion Div 16% 7 50% 22 23% 10 11% 5 0% 0 44
17 Finance 60% 29 23% 11 15% 7 2% 1 0% 0 48
18Goldman Sch of PublicPolicy
22% 2 44% 4 11% 1 11% 1 11% 1 9
19 Graduate Division 33% 3 44% 4 22% 2 0% 0 0% 0 9
20Graduate School ofEducation
22% 6 48% 13 19% 5 11% 3 0% 0 27
21 Haas School of Business 25% 24 44% 43 21% 20 8% 8 2% 2 97
22 L&S Arts & Humanities 27% 27 44% 44 23% 23 6% 6 0% 0 100
23 L&S Biological Sciences 20% 18 36% 33 32% 29 12% 11 1% 1 92
24 L&S Core 31% 4 23% 3 46% 6 0% 0 0% 0 13
25 L&S Math & Physical Sci 33% 20 28% 17 28% 17 7% 4 3% 2 60
26 L&S Social Sciences 20% 22 36% 40 32% 36 13% 14 0% 0 112
27L&S UndergraduateDivision
17% 4 54% 13 21% 5 4% 1 4% 1 24
28 Office for the Faculty 33% 1 33% 1 33% 1 0% 0 0% 0 3
29Res Museum & FieldStations
43% 20 35% 16 17% 8 4% 2 0% 0 46
30Research AdministrativeUnits
40% 24 38% 23 17% 10 5% 3 0% 0 60
31 School of Information 15% 3 50% 10 25% 5 10% 2 0% 0 20
32 School of Journalism 17% 1 33% 2 33% 2 17% 1 0% 0 6
33 School of Optometry 20% 6 43% 13 27% 8 7% 2 3% 1 30
34 School of Public Health 17% 12 48% 34 24% 17 11% 8 0% 0 71
35 School of Social Welfare 25% 7 32% 9 25% 7 18% 5 0% 0 28
36Strategic Acad and FacPlan
40% 2 20% 1 20% 1 0% 0 20% 1 5
37 Student Affairs 28% 49 40% 69 24% 42 5% 9 2% 3 172
38Summer Sessn, StudyAbrd, OLLI
18% 2 55% 6 9% 1 18% 2 0% 0 11
39 UC Library 39% 26 36% 24 18% 12 5% 3 2% 1 66
40 Undergraduate Education 42% 10 42% 10 17% 4 0% 0 0% 0 24
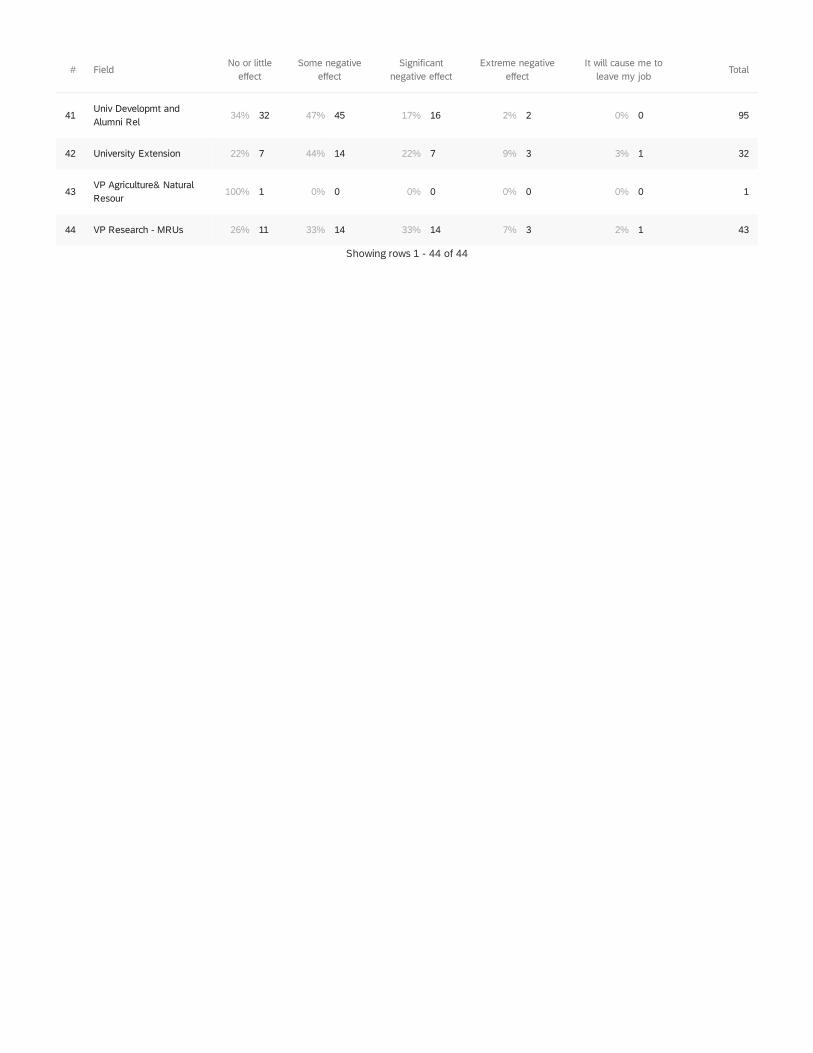
Showing rows 1 - 44 of 44
# FieldNo or little
effectSome negative
effectSignificant
negative effectExtreme negative
effectIt will cause me to
leave my jobTotal
41Univ Developmt andAlumni Rel
34% 32 47% 45 17% 16 2% 2 0% 0 95
42 University Extension 22% 7 44% 14 22% 7 9% 3 3% 1 32
43VP Agriculture& NaturalResour
100% 1 0% 0 0% 0 0% 0 0% 0 1
44 VP Research - MRUs 26% 11 33% 14 33% 14 7% 3 2% 1 43

Q10 - Which of the following services would you be likely to use if the University were to
make it available (check all that apply)?
57%
80%
38%
69%
50%
56%
63%
90%
67%
50%
82%
76%
69%
63%
57%
43%
40%
25%
34%
25%
59%
37%
30%
33%
50%
59%
36%
41%
27%
14%
61%
29%
50%
45%
75%
44%
67%
90%
67%
100%
65%
48%
46%
63%
57%
Academic Core
Athletics
Col ofEnvironmental
Design
Academic ResearchUnits
Academic Senate
Administration
Art Mus & PacificFilm Archive
Berkeley LawSchool
CalPerformances_SMA
Chancellor'sImmediate Office
Central AccountingLedger
College ofChemistry
College ofEngineering
College of NaturalResources
Division of DataScience
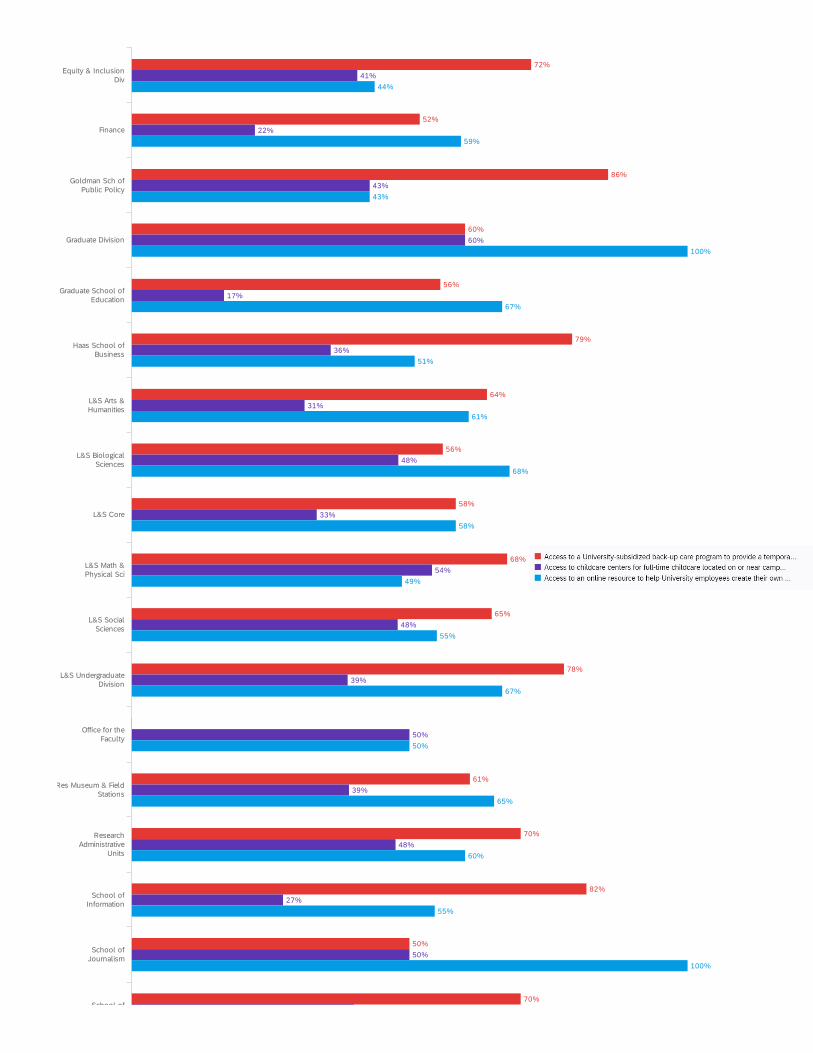
72%
52%
86%
60%
56%
79%
64%
56%
58%
68%
65%
78%
61%
70%
82%
50%
70%
41%
22%
43%
60%
17%
36%
31%
48%
33%
54%
48%
39%
50%
39%
48%
27%
50%
44%
59%
43%
100%
67%
51%
61%
68%
58%
49%
55%
67%
50%
65%
60%
55%
100%
Equity & InclusionDiv
Haas School ofBusiness
L&S SocialSciences
School ofInformation
Finance
Goldman Sch ofPublic Policy
Graduate Division
Graduate School ofEducation
L&S Arts &Humanities
L&S BiologicalSciences
L&S Core
L&S Math &Physical Sci
L&S UndergraduateDivision
Office for theFaculty
Res Museum & FieldStations
ResearchAdministrative
Units
School ofJournalism
School of

67%
83%
100%
63%
60%
65%
81%
77%
62%
59%
40%
21%
22%
50%
51%
40%
28%
6%
25%
45%
48%
70%
57%
72%
50%
49%
60%
63%
44%
49%
52%
59%
Strategic Acad andFac Plan
Univ Developmt andAlumni Rel
School ofOptometry
School of PublicHealth
School of SocialWelfare
Student Affairs
Summer Sessn,Study Abrd, OLLI
UC Library
UndergraduateEducation
UniversityExtension
VP Agriculture&Natural Resour
VP Research - MRUs
# Field
Access to a University-subsidized back-upcare program to provide a temporary
caregiver for your dependent(s) in your homeas needs arise, e.g. on an hourly basis or up
to a full day at a time.
Access tochildcare centers
for full-timechildcare located
on or nearcampus.
Access to an online resource to helpUniversity employees create theirown share-care, co-op, or “bubble-
share” arrangements with othercampus constituents.
Total
1 Academic Core 35% 13 27% 10 38% 14 37
2Academic ResearchUnits
54% 36 27% 18 19% 13 67
3 Academic Senate 33% 3 22% 2 44% 4 9
4 Administration 47% 111 23% 54 30% 72 237
5Art Mus & Pacific FilmArchive
33% 2 17% 1 50% 3 6
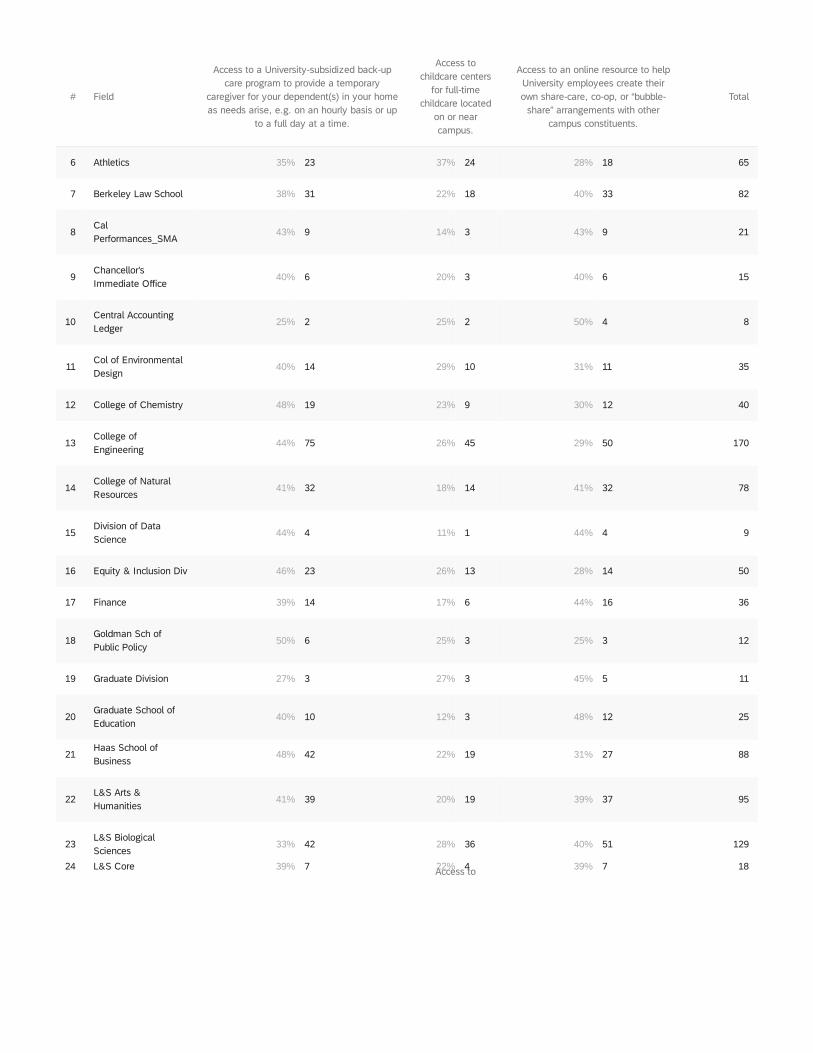
# Field
Access to a University-subsidized back-upcare program to provide a temporary
caregiver for your dependent(s) in your homeas needs arise, e.g. on an hourly basis or up
to a full day at a time.
Access tochildcare centers
for full-timechildcare located
on or nearcampus.
Access to an online resource to helpUniversity employees create theirown share-care, co-op, or “bubble-
share” arrangements with othercampus constituents.
Total
6 Athletics 35% 23 37% 24 28% 18 65
7 Berkeley Law School 38% 31 22% 18 40% 33 82
8CalPerformances_SMA
43% 9 14% 3 43% 9 21
9Chancellor'sImmediate Office
40% 6 20% 3 40% 6 15
10Central AccountingLedger
25% 2 25% 2 50% 4 8
11Col of EnvironmentalDesign
40% 14 29% 10 31% 11 35
12 College of Chemistry 48% 19 23% 9 30% 12 40
13College ofEngineering
44% 75 26% 45 29% 50 170
14College of NaturalResources
41% 32 18% 14 41% 32 78
15Division of DataScience
44% 4 11% 1 44% 4 9
16 Equity & Inclusion Div 46% 23 26% 13 28% 14 50
17 Finance 39% 14 17% 6 44% 16 36
18Goldman Sch ofPublic Policy
50% 6 25% 3 25% 3 12
19 Graduate Division 27% 3 27% 3 45% 5 11
20Graduate School ofEducation
40% 10 12% 3 48% 12 25
21Haas School ofBusiness
48% 42 22% 19 31% 27 88
22L&S Arts &Humanities
41% 39 20% 19 39% 37 95
23L&S BiologicalSciences
33% 42 28% 36 40% 51 129
A2c2c%ess 4to24 L&S Core 39% 7 39% 7 18

# Field
Access to a University-subsidized back-upcare program to provide a temporary
caregiver for your dependent(s) in your homeas needs arise, e.g. on an hourly basis or up
to a full day at a time.
childcare centers
for full-timechildcare located
on or nearcampus.
Access to an online resource to helpUniversity employees create their
own share-care, co-op, or “bubble-share” arrangements with other
campus constituents.
Total25L&S Math & PhysicalSci
40% 25 32% 20 29% 18 63
26 L&S Social Sciences 39% 46 29% 34 33% 39 119
27L&S UndergraduateDivision
42% 14 21% 7 36% 12 33
28 Office for the Faculty 0% 0 50% 1 50% 1 2
29Res Museum & FieldStations
37% 14 24% 9 39% 15 38
30ResearchAdministrative Units
39% 28 27% 19 34% 24 71
31 School of Information 50% 9 17% 3 33% 6 18
32 School of Journalism 25% 2 25% 2 50% 4 8
33 School of Optometry 39% 14 22% 8 39% 14 36
34School of PublicHealth
46% 28 15% 9 39% 24 61
35School of SocialWelfare
47% 15 13% 4 41% 13 32
36Strategic Acad andFac Plan
50% 2 25% 1 25% 1 4
37 Student Affairs 38% 75 31% 61 30% 59 195
38Summer Sessn,Study Abrd, OLLI
38% 3 25% 2 38% 3 8
39 UC Library 42% 26 18% 11 40% 25 62
40UndergraduateEducation
62% 13 5% 1 33% 7 21
41Univ Developmt andAlumni Rel
51% 41 16% 13 33% 26 80
42 University Extension 39% 18 28% 13 33% 15 46
43VP Agriculture&Natural Resour
0% 0 0% 0 0% 0 0
44 VP Research - MRUs 35% 17 29% 14 35% 17 48
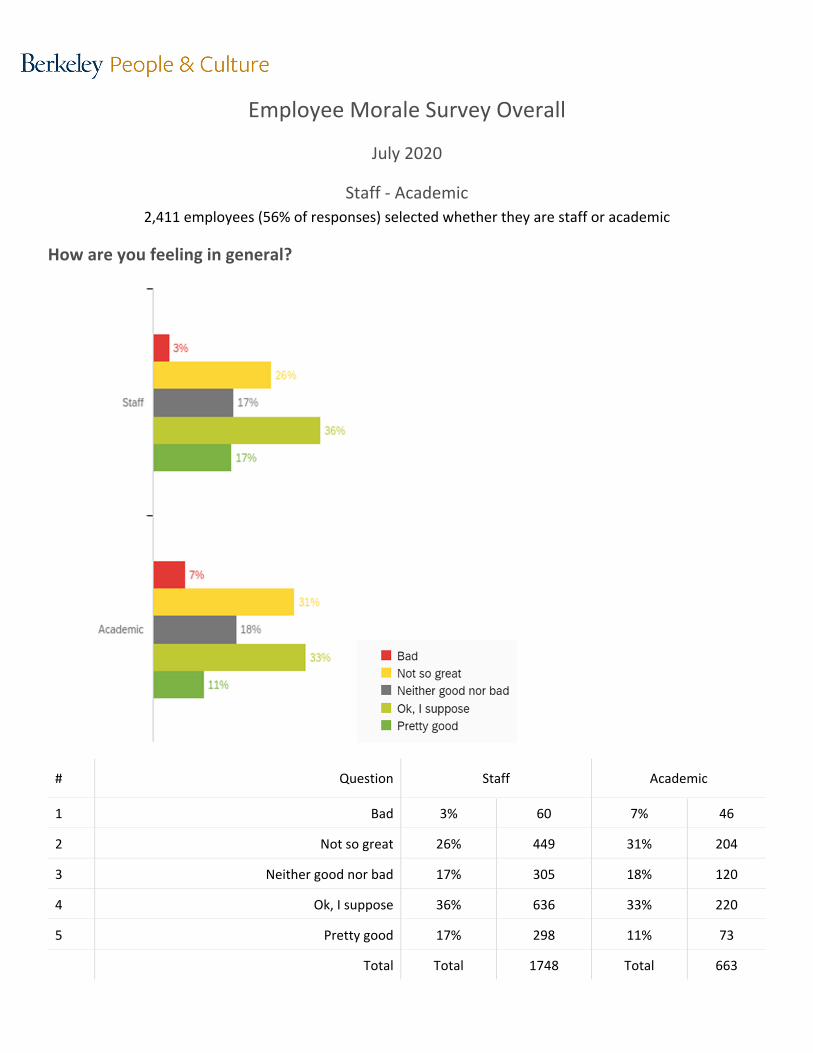
Employee Morale Survey Overall
July 2020
Staff ‐ Academic
2,411 employees (56% of responses) selected whether they are staff or academic
How are you feeling in general?
# Question Staff Academic
1 Bad 3% 60 7% 46
2 Not so great 26% 449 31% 204
3 Neither good nor bad 17% 305 18% 120
4 Ok, I suppose 36% 636 33% 220
5 Pretty good 17% 298 11% 73
Total Total 1748 Total 663
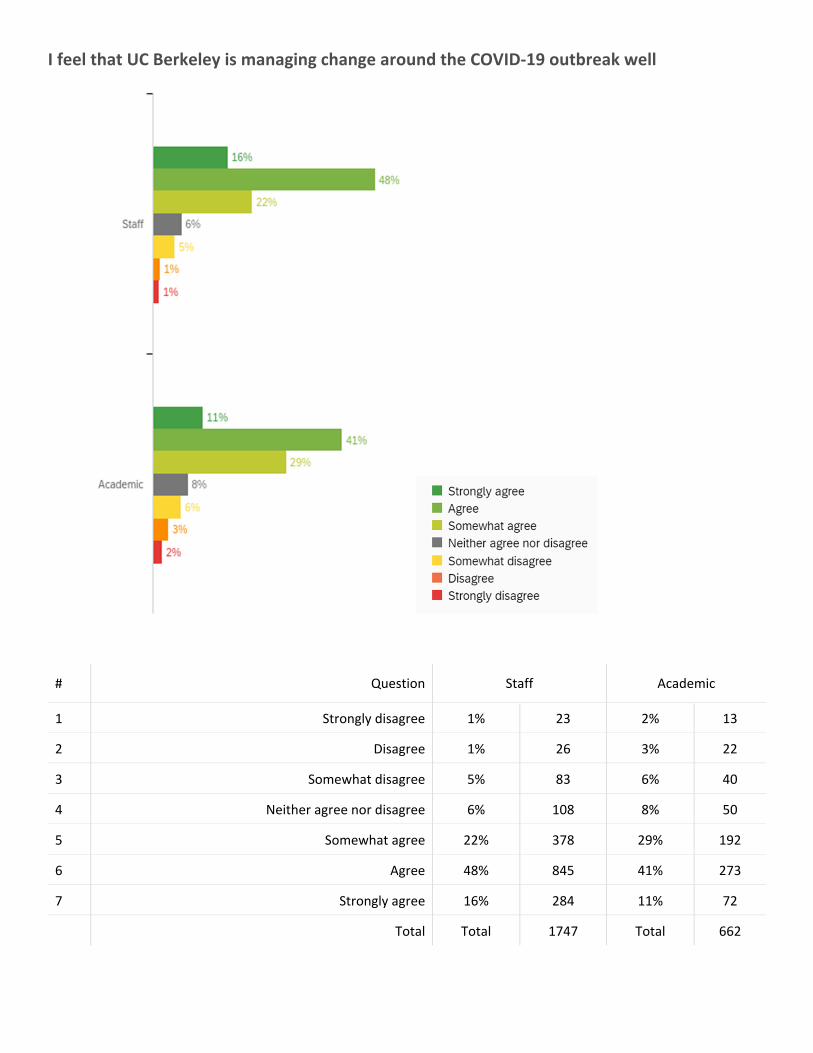
I feel that UC Berkeley is managing change around the COVID‐19 outbreak well
# Question Staff Academic
1 Strongly disagree 1% 23 2% 13
2 Disagree 1% 26 3% 22
3 Somewhat disagree 5% 83 6% 40
4 Neither agree nor disagree 6% 108 8% 50
5 Somewhat agree 22% 378 29% 192
6 Agree 48% 845 41% 273
7 Strongly agree 16% 284 11% 72
Total Total 1747 Total 662
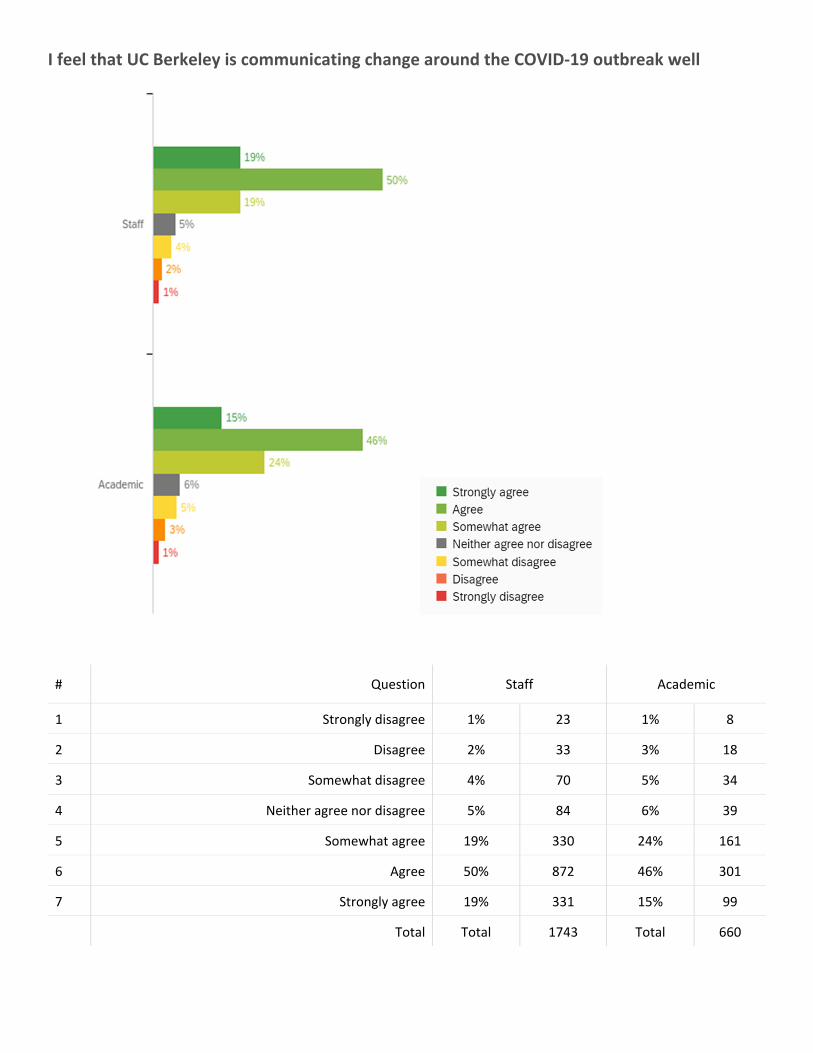
I feel that UC Berkeley is communicating change around the COVID‐19 outbreak well
# Question Staff Academic
1 Strongly disagree 1% 23 1% 8
2 Disagree 2% 33 3% 18
3 Somewhat disagree 4% 70 5% 34
4 Neither agree nor disagree 5% 84 6% 39
5 Somewhat agree 19% 330 24% 161
6 Agree 50% 872 46% 301
7 Strongly agree 19% 331 15% 99
Total Total 1743 Total 660
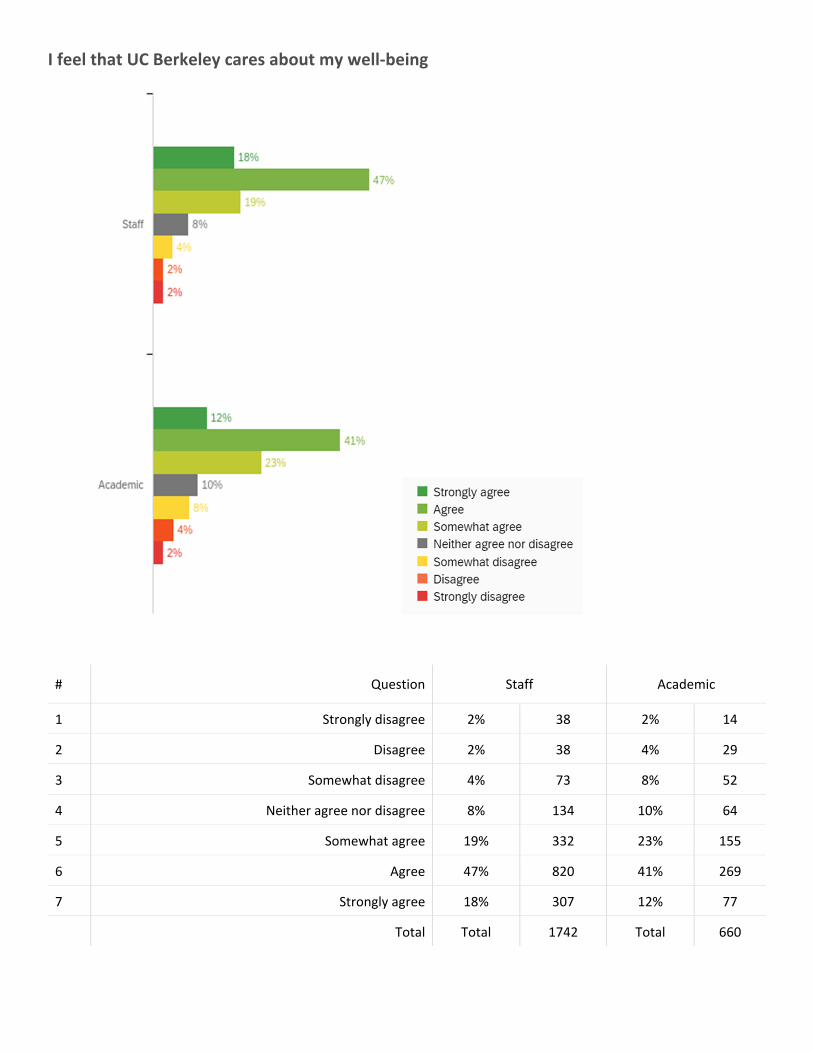
I feel that UC Berkeley cares about my well‐being
# Question Staff Academic
1 Strongly disagree 2% 38 2% 14
2 Disagree 2% 38 4% 29
3 Somewhat disagree 4% 73 8% 52
4 Neither agree nor disagree 8% 134 10% 64
5 Somewhat agree 19% 332 23% 155
6 Agree 47% 820 41% 269
7 Strongly agree 18% 307 12% 77
Total Total 1742 Total 660
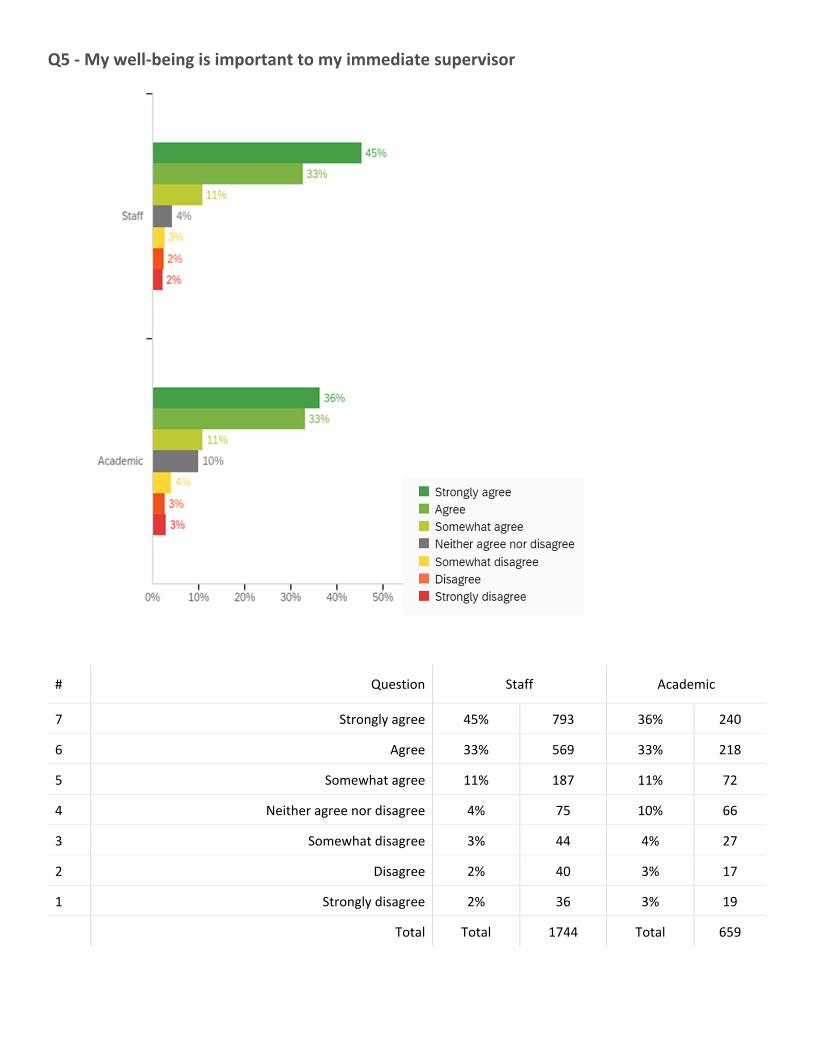
Q5 ‐ My well‐being is important to my immediate supervisor
# Question Staff Academic
7 Strongly agree 45% 793 36% 240
6 Agree 33% 569 33% 218
5 Somewhat agree 11% 187 11% 72
4 Neither agree nor disagree 4% 75 10% 66
3 Somewhat disagree 3% 44 4% 27
2 Disagree 2% 40 3% 17
1 Strongly disagree 2% 36 3% 19
Total Total 1744 Total 659
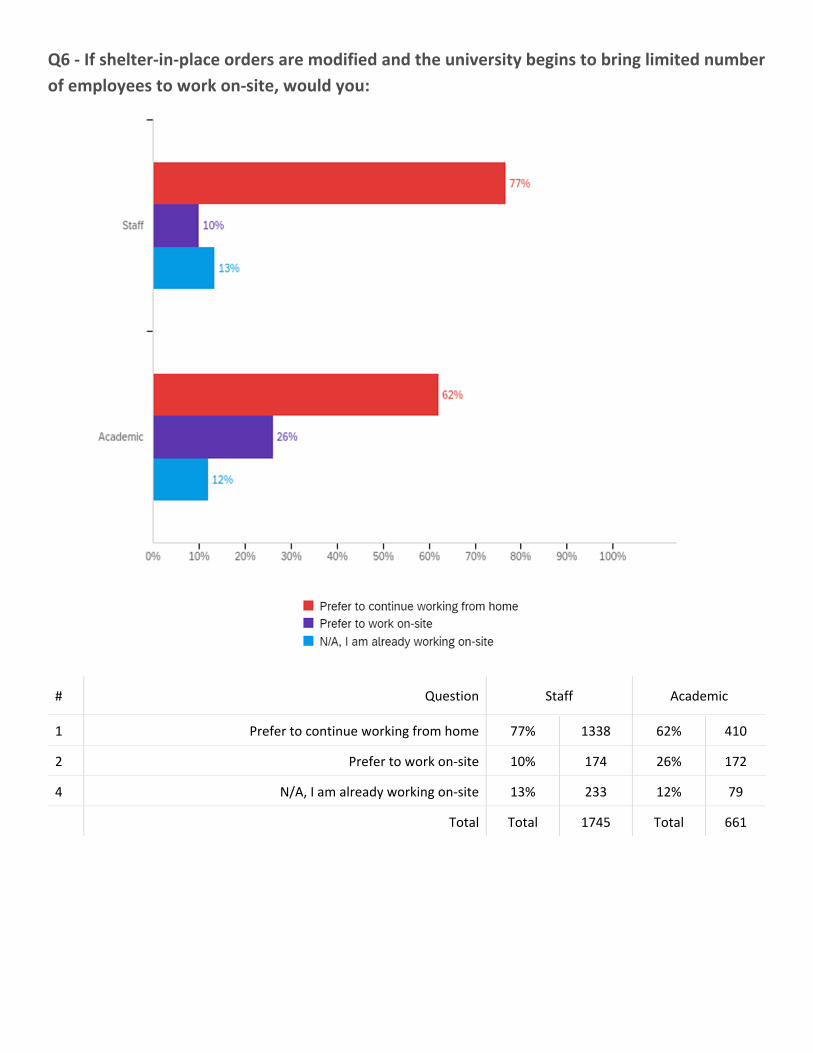
Q6 ‐ If shelter‐in‐place orders are modified and the university begins to bring limited number
of employees to work on‐site, would you:
# Question Staff Academic
1 Prefer to continue working from home 77% 1338 62% 410
2 Prefer to work on‐site 10% 174 26% 172
4 N/A, I am already working on‐site 13% 233 12% 79
Total Total 1745 Total 661
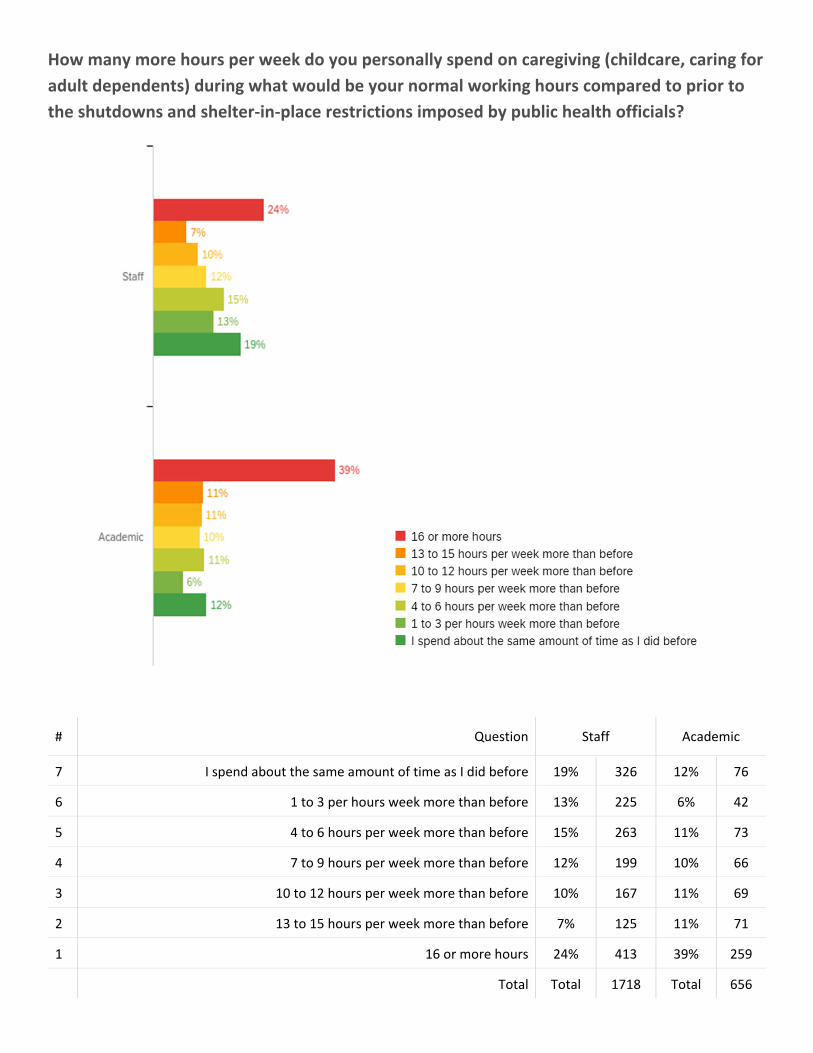
How many more hours per week do you personally spend on caregiving (childcare, caring for
adult dependents) during what would be your normal working hours compared to prior to
the shutdowns and shelter‐in‐place restrictions imposed by public health officials?
# Question Staff Academic
7 I spend about the same amount of time as I did before 19% 326 12% 76
6 1 to 3 per hours week more than before 13% 225 6% 42
5 4 to 6 hours per week more than before 15% 263 11% 73
4 7 to 9 hours per week more than before 12% 199 10% 66
3 10 to 12 hours per week more than before 10% 167 11% 69
2 13 to 15 hours per week more than before 7% 125 11% 71
1 16 or more hours 24% 413 39% 259
Total Total 1718 Total 656
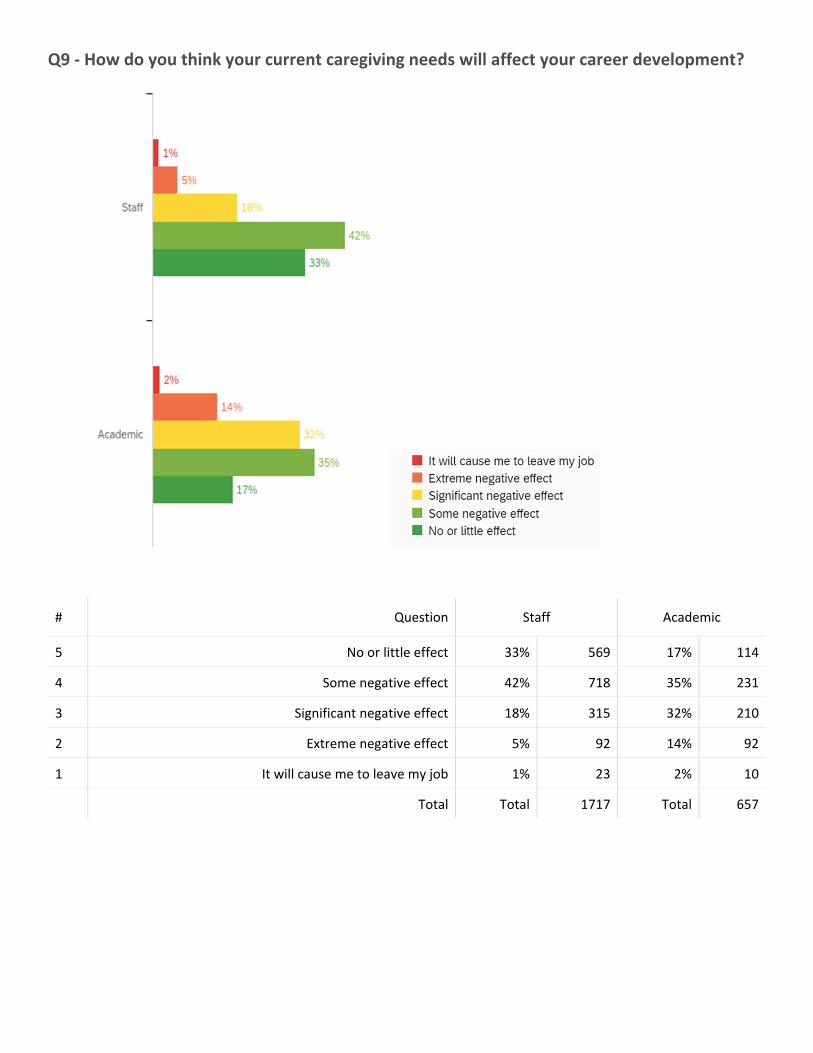
Q9 ‐ How do you think your current caregiving needs will affect your career development?
# Question Staff Academic
5 No or little effect 33% 569 17% 114
4 Some negative effect 42% 718 35% 231
3 Significant negative effect 18% 315 32% 210
2 Extreme negative effect 5% 92 14% 92
1 It will cause me to leave my job 1% 23 2% 10
Total Total 1717 Total 657
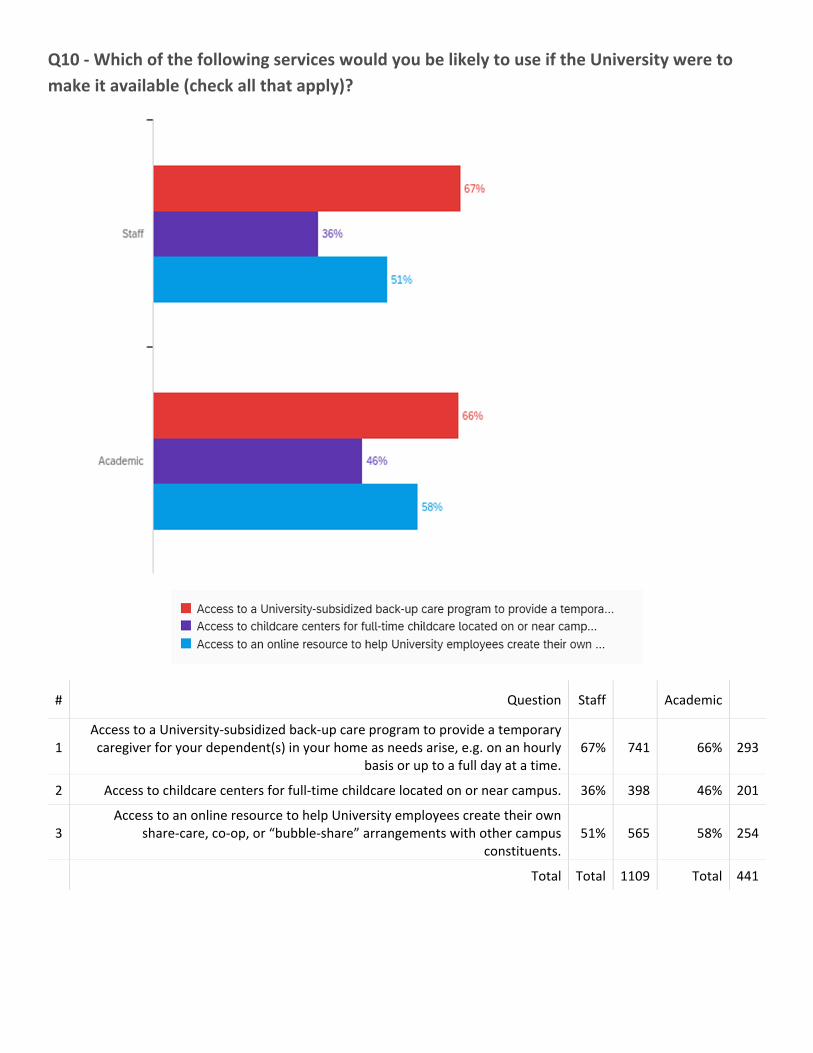
Q10 ‐ Which of the following services would you be likely to use if the University were to
make it available (check all that apply)?
# Question Staff Academic
1 Access to a University‐subsidized back‐up care program to provide a temporary caregiver for your dependent(s) in your home as needs arise, e.g. on an hourly
basis or up to a full day at a time. 67% 741 66% 293
2 Access to childcare centers for full‐time childcare located on or near campus. 36% 398 46% 201
3 Access to an online resource to help University employees create their own
share‐care, co‐op, or “bubble‐share” arrangements with other campus constituents.
51% 565 58% 254
Total Total 1109 Total 441
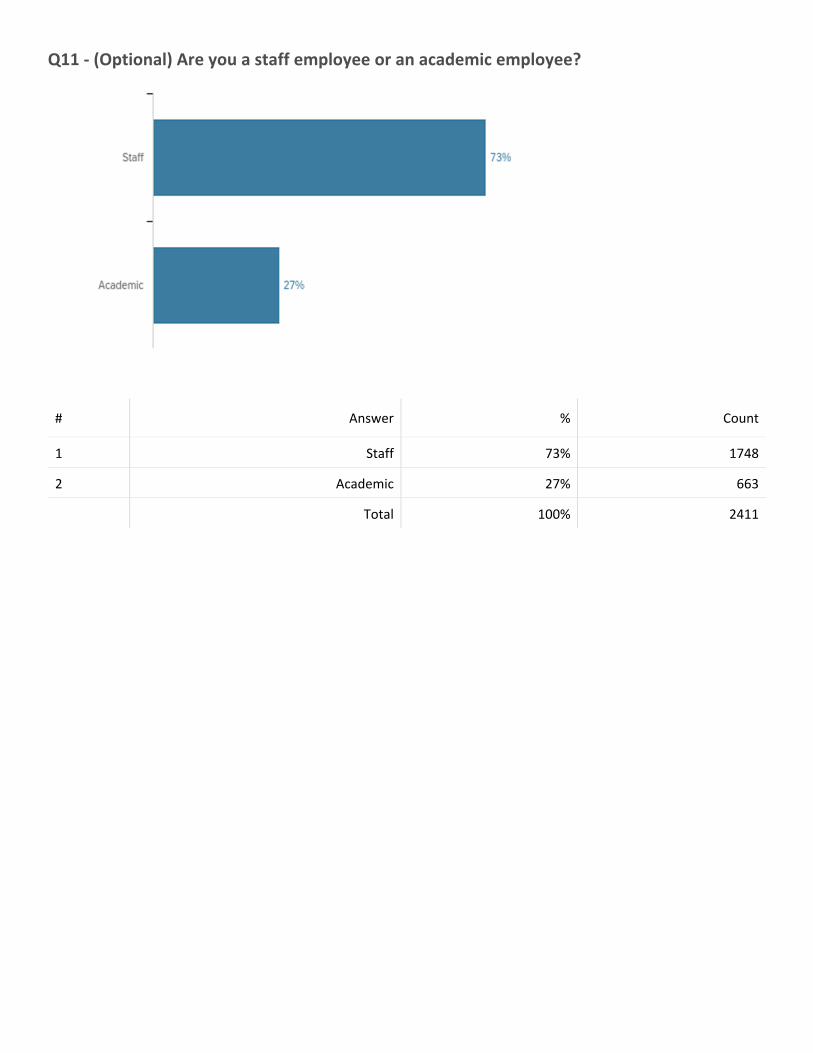
Q11 ‐ (Optional) Are you a staff employee or an academic employee?
# Answer % Count
1 Staff 73% 1748
2 Academic 27% 663
Total 100% 2411
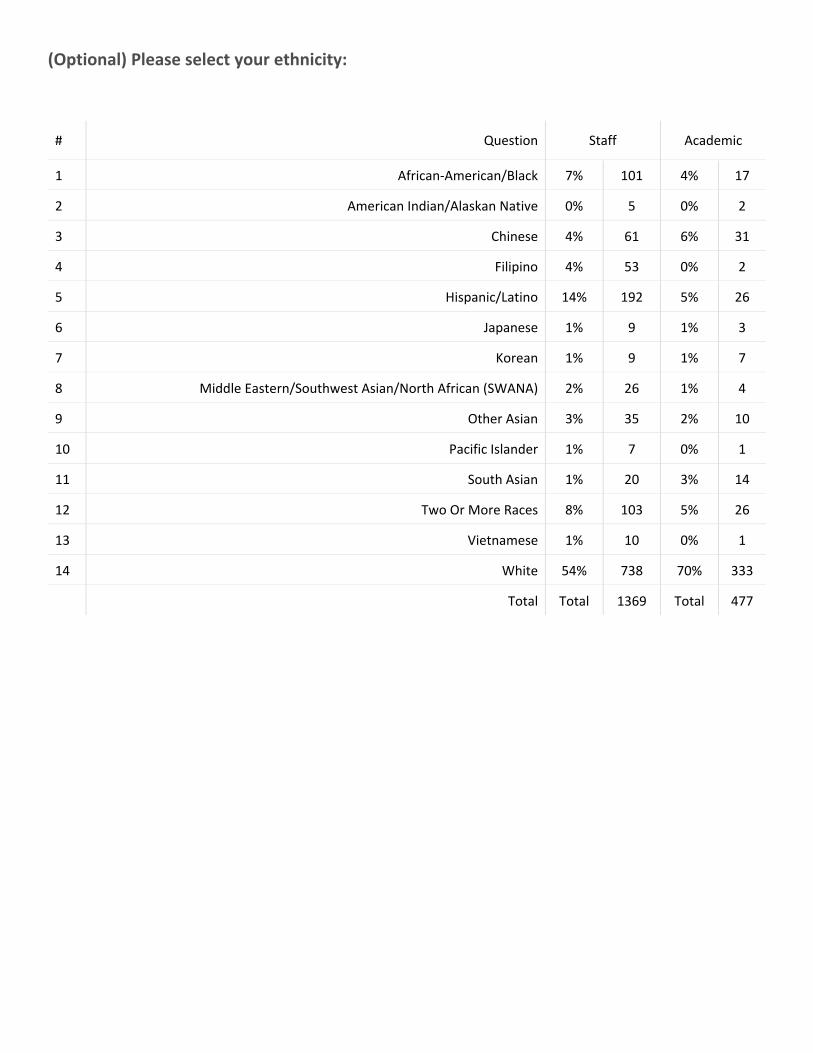
(Optional) Please select your ethnicity:
# Question Staff Academic
1 African‐American/Black 7% 101 4% 17
2 American Indian/Alaskan Native 0% 5 0% 2
3 Chinese 4% 61 6% 31
4 Filipino 4% 53 0% 2
5 Hispanic/Latino 14% 192 5% 26
6 Japanese 1% 9 1% 3
7 Korean 1% 9 1% 7
8 Middle Eastern/Southwest Asian/North African (SWANA) 2% 26 1% 4
9 Other Asian 3% 35 2% 10
10 Pacific Islander 1% 7 0% 1
11 South Asian 1% 20 3% 14
12 Two Or More Races 8% 103 5% 26
13 Vietnamese 1% 10 0% 1
14 White 54% 738 70% 333
Total Total 1369 Total 477
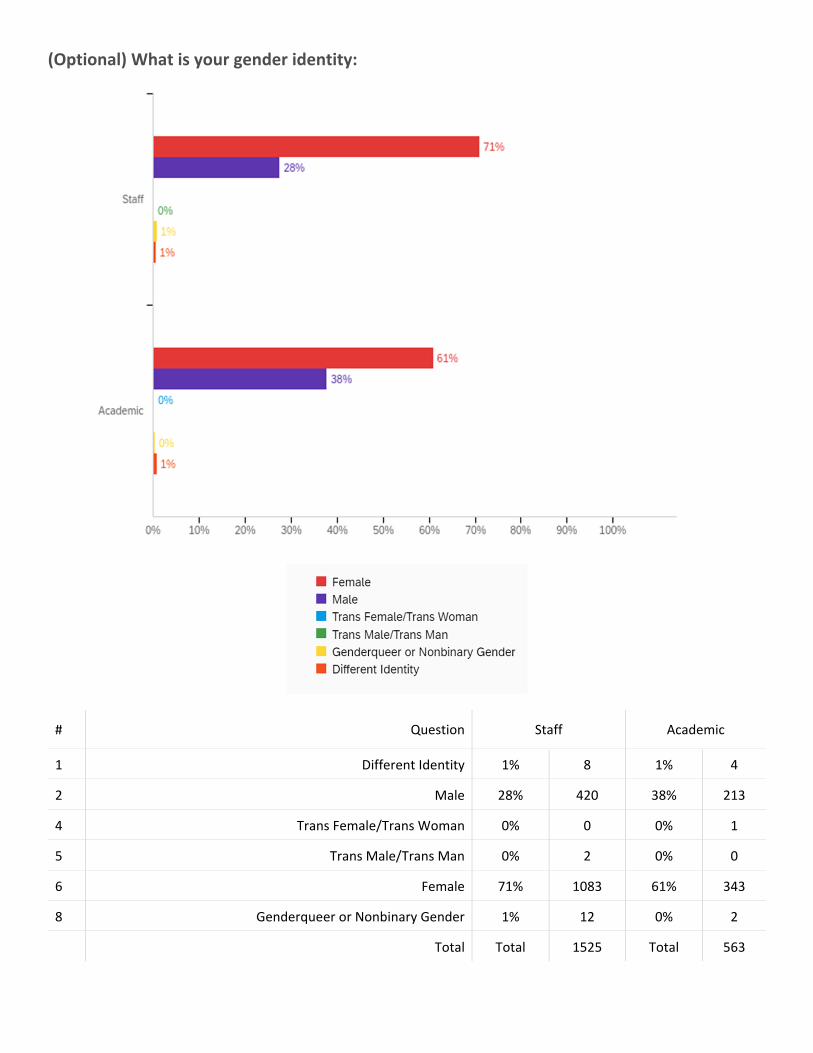
(Optional) What is your gender identity:
# Question Staff Academic
1 Different Identity 1% 8 1% 4
2 Male 28% 420 38% 213
4 Trans Female/Trans Woman 0% 0 0% 1
5 Trans Male/Trans Man 0% 2 0% 0
6 Female 71% 1083 61% 343
8 Genderqueer or Nonbinary Gender 1% 12 0% 2
Total Total 1525 Total 563
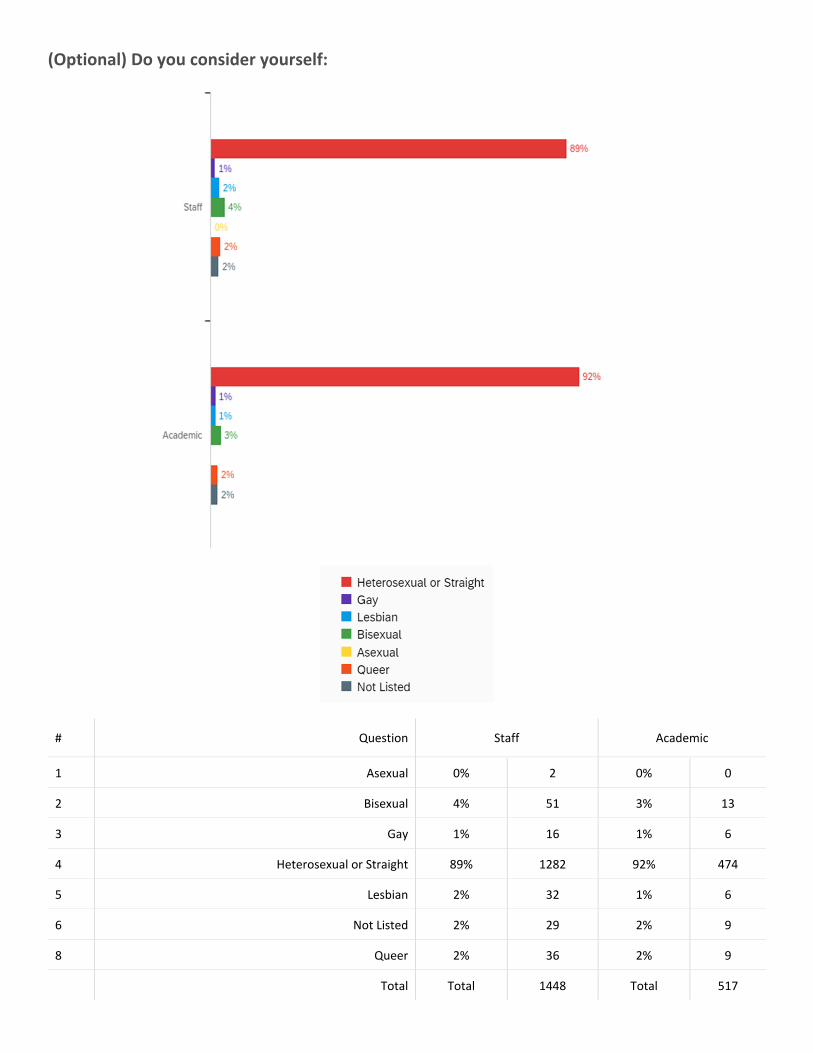
(Optional) Do you consider yourself:
# Question Staff Academic
1 Asexual 0% 2 0% 0
2 Bisexual 4% 51 3% 13
3 Gay 1% 16 1% 6
4 Heterosexual or Straight 89% 1282 92% 474
5 Lesbian 2% 32 1% 6
6 Not Listed 2% 29 2% 9
8 Queer 2% 36 2% 9
Total Total 1448 Total 517
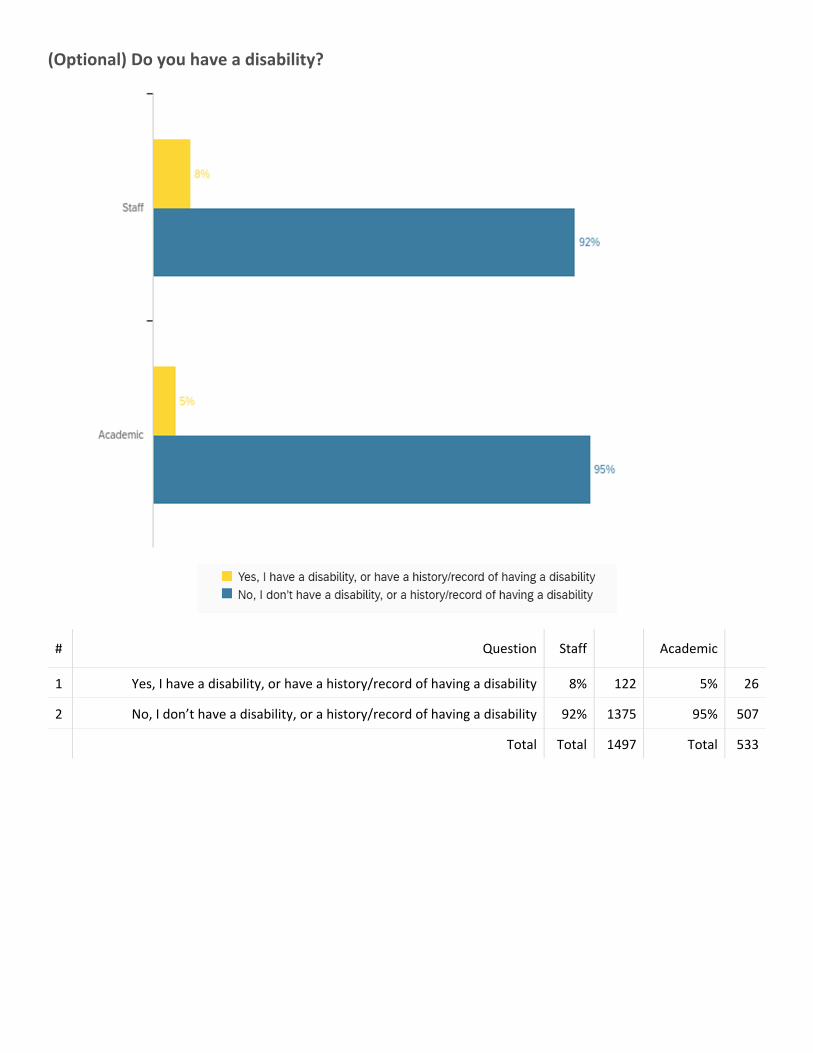
(Optional) Do you have a disability?
# Question Staff Academic
1 Yes, I have a disability, or have a history/record of having a disability 8% 122 5% 26
2 No, I don’t have a disability, or a history/record of having a disability 92% 1375 95% 507
Total Total 1497 Total 533
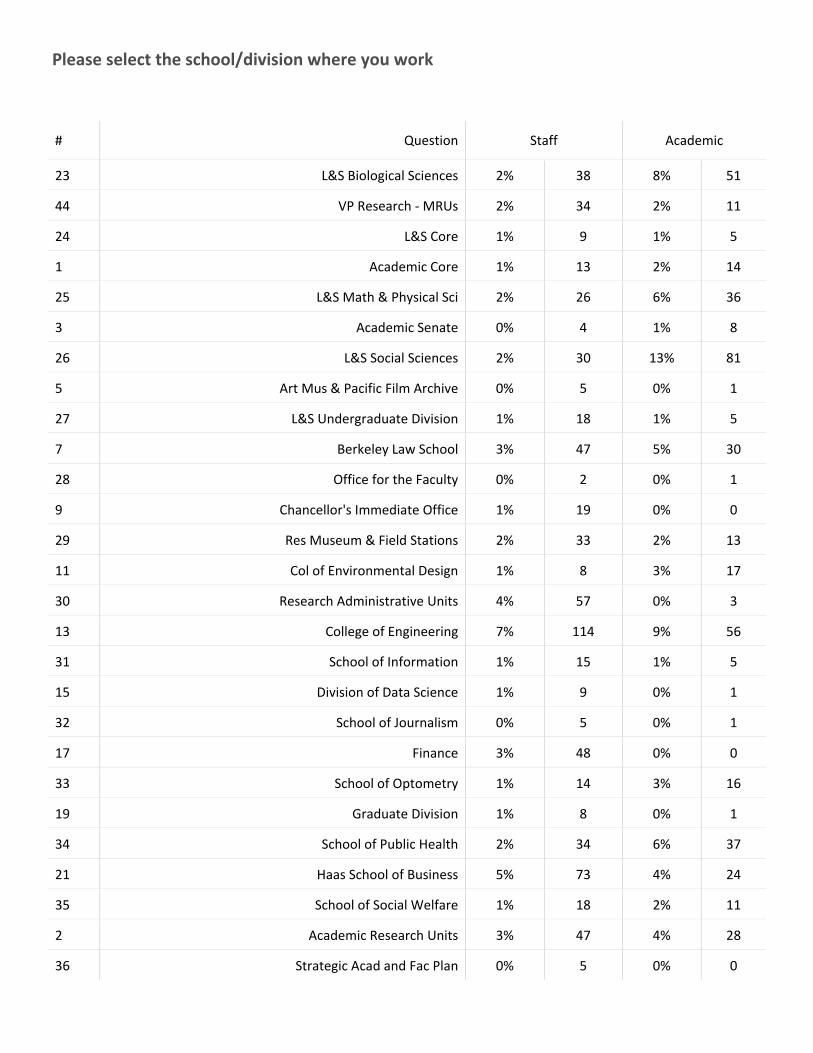
Please select the school/division where you work
# Question Staff Academic
23 L&S Biological Sciences 2% 38 8% 51
44 VP Research ‐ MRUs 2% 34 2% 11
24 L&S Core 1% 9 1% 5
1 Academic Core 1% 13 2% 14
25 L&S Math & Physical Sci 2% 26 6% 36
3 Academic Senate 0% 4 1% 8
26 L&S Social Sciences 2% 30 13% 81
5 Art Mus & Pacific Film Archive 0% 5 0% 1
27 L&S Undergraduate Division 1% 18 1% 5
7 Berkeley Law School 3% 47 5% 30
28 Office for the Faculty 0% 2 0% 1
9 Chancellor's Immediate Office 1% 19 0% 0
29 Res Museum & Field Stations 2% 33 2% 13
11 Col of Environmental Design 1% 8 3% 17
30 Research Administrative Units 4% 57 0% 3
13 College of Engineering 7% 114 9% 56
31 School of Information 1% 15 1% 5
15 Division of Data Science 1% 9 0% 1
32 School of Journalism 0% 5 0% 1
17 Finance 3% 48 0% 0
33 School of Optometry 1% 14 3% 16
19 Graduate Division 1% 8 0% 1
34 School of Public Health 2% 34 6% 37
21 Haas School of Business 5% 73 4% 24
35 School of Social Welfare 1% 18 2% 11
2 Academic Research Units 3% 47 4% 28
36 Strategic Acad and Fac Plan 0% 5 0% 0
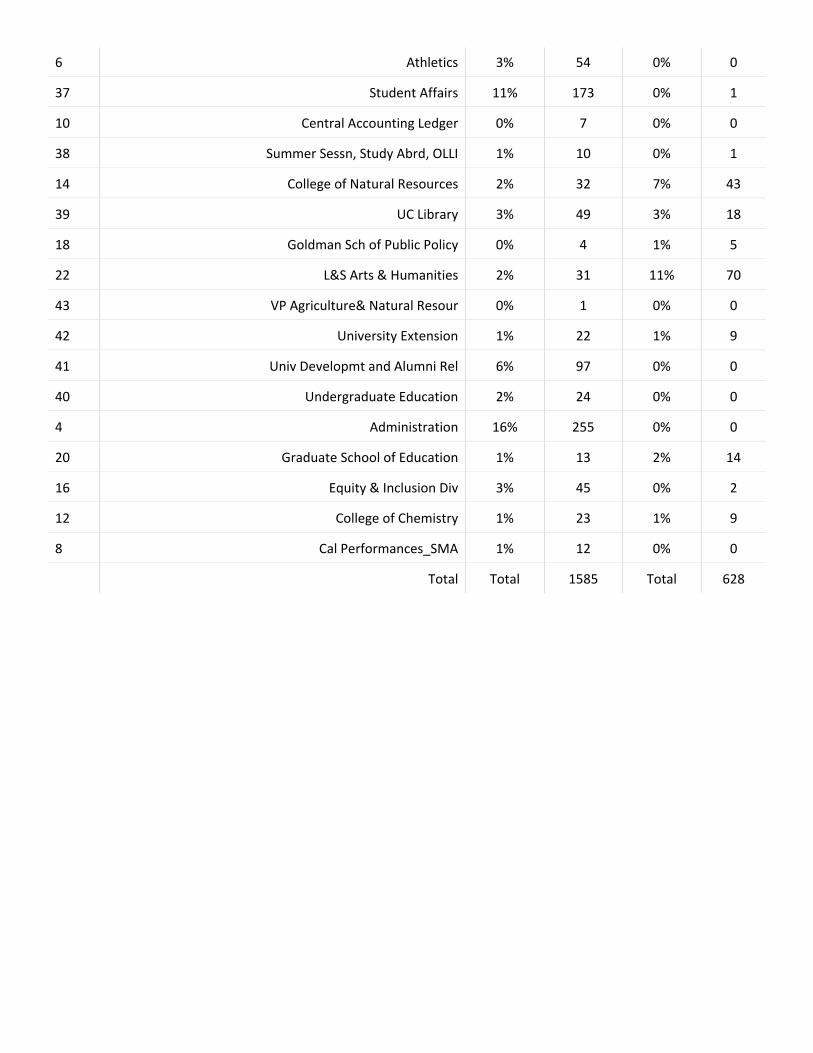
6 Athletics 3% 54 0% 0
37 Student Affairs 11% 173 0% 1
10 Central Accounting Ledger 0% 7 0% 0
38 Summer Sessn, Study Abrd, OLLI 1% 10 0% 1
14 College of Natural Resources 2% 32 7% 43
39 UC Library 3% 49 3% 18
18 Goldman Sch of Public Policy 0% 4 1% 5
22 L&S Arts & Humanities 2% 31 11% 70
43 VP Agriculture& Natural Resour 0% 1 0% 0
42 University Extension 1% 22 1% 9
41 Univ Developmt and Alumni Rel 6% 97 0% 0
40 Undergraduate Education 2% 24 0% 0
4 Administration 16% 255 0% 0
20 Graduate School of Education 1% 13 2% 14
16 Equity & Inclusion Div 3% 45 0% 2
12 College of Chemistry 1% 23 1% 9
8 Cal Performances_SMA 1% 12 0% 0
Total Total 1585 Total 628
Related Documents


