JOURNAL OF PETROLOGY VOLUME 39 NUMBER 9 PAGES 1669–1687 1998 Emplacement and Crystallization Time for the Bushveld Complex R. GRANT CAWTHORN 1 * AND FEODOR WALRAVEN 2 1 DEPARTMENT OF GEOLOGY, UNIVERSITY OF THE WITWATERSRAND, PO WITS, 2050, SOUTH AFRICA 2 924 KEYTER STREET, DASPOORT, 0082, SOUTH AFRICA RECEIVED JULY 20, 1997; REVISED TYPESCRIPT ACCEPTED APRIL 16, 1998 The Bushveld Complex formed by the crystallization of successive basaltic magmatism may be of the order of several million years. For example, the Columbia River Basalts (Hooper, injections of magma, which were sufficiently closely spaced in time that each previous magma had not cooled and differentiated 1988) were erupted in the period 17–12 Ma, with minor eruptions for a further 5 my, although most outpouring significantly before the addition of the next one. To constrain the emplacement and crystallization times, a thermal model is presented occurred within the first 2 my. It is now recognized that large intrusions were not emplaced in a single pulse, but which permits the investigation of the rate of cooling of magma in an intrusion repeatedly subjected to magma addition (and sub- result from multiple magma injection. The question is how rapidly were magma chambers, such as the BC, traction). Such modelling indicates that magmas injected into the Bushveld Complex were emplaced within 75 000 years. At that filled and how much magma was involved. Answers are relevant to the dynamics of melt production, storage and time injection into the Complex ceased. The volume of rock in the Eastern and Western limbs is 370 000–600 000 km 3 . However, transport in the mantle and crust. This paper describes a thermal modelling technique (not previously applied a quantitative evaluation of the Cr budget in the formation of chromitite layers indicates that large volumes of magma cannot be to magma chambers) which can be used to analyse this process, and to obtain an estimate of the emplacement accounted for in the preserved rock sequence. Similarly, an evaluation of the incompatible trace-element abundances, such as those for Zr time. To present this model it is necessary to discuss the stratigraphy, size, and connectivity of the different limbs and K, suggests that the chamber was open and that large volumes of differentiated magma escaped. The volume of magma therefore of the Bushveld Complex, and to consider the extent of tapping of the magma chamber as well as its filling. greatly exceeded the preserved volume of cumulate rocks, giving an estimated magma volume of over 1 × 10 6 km 3 . An average The term ‘Bushveld Complex’ has been given several meanings in the literature, and according to the South emplacement rate of 13 km 3 /year is indicated by these calculations. African Commission on Stratigraphy (1980) includes not only the ultramafic–mafic layered rocks, but also the sills beneath the intrusion, volcanic rocks which pre-date the KEY WORDS: Bushveld Complex; differentiation; magma emplacement main mafic emplacement event, and the granitic and rates; multiple intrusion; tapping of magma granophyric rocks which occur in the roof. However, in this paper the term refers only to the layered ultramafic– mafic sequence. INTRODUCTION The Bushveld Complex (BC) is a large layered intrusion, SETTING AND STRATIGRAPHY OF emplaced into a stable cratonic setting. It has been THE BUSHVELD COMPLEX considered an intrusive equivalent of a continental flood The BC was emplaced into the Kaapvaal craton at basalt province, and inferred to be related to a mantle plume (Hatton, 1995). The duration of continental flood 2060 Ma (Walraven et al., 1990). Generally, it was *Corresponding author. Oxford University Press 1998

Welcome message from author
This document is posted to help you gain knowledge. Please leave a comment to let me know what you think about it! Share it to your friends and learn new things together.
Transcript
JOURNAL OF PETROLOGY VOLUME 39 NUMBER 9 PAGES 1669–1687 1998
Emplacement and Crystallization Time forthe Bushveld Complex
R. GRANT CAWTHORN1∗ AND FEODOR WALRAVEN2
1DEPARTMENT OF GEOLOGY, UNIVERSITY OF THE WITWATERSRAND, PO WITS, 2050, SOUTH AFRICA2924 KEYTER STREET, DASPOORT, 0082, SOUTH AFRICA
RECEIVED JULY 20, 1997; REVISED TYPESCRIPT ACCEPTED APRIL 16, 1998
The Bushveld Complex formed by the crystallization of successive basaltic magmatism may be of the order of several millionyears. For example, the Columbia River Basalts (Hooper,injections of magma, which were sufficiently closely spaced in
time that each previous magma had not cooled and differentiated 1988) were erupted in the period 17–12 Ma, with minoreruptions for a further 5 my, although most outpouringsignificantly before the addition of the next one. To constrain the
emplacement and crystallization times, a thermal model is presented occurred within the first 2 my. It is now recognized thatlarge intrusions were not emplaced in a single pulse, butwhich permits the investigation of the rate of cooling of magma in
an intrusion repeatedly subjected to magma addition (and sub- result from multiple magma injection. The question ishow rapidly were magma chambers, such as the BC,traction). Such modelling indicates that magmas injected into the
Bushveld Complex were emplaced within 75 000 years. At that filled and how much magma was involved. Answers arerelevant to the dynamics of melt production, storage andtime injection into the Complex ceased. The volume of rock in the
Eastern and Western limbs is 370 000–600 000 km3. However, transport in the mantle and crust. This paper describesa thermal modelling technique (not previously applieda quantitative evaluation of the Cr budget in the formation of
chromitite layers indicates that large volumes of magma cannot be to magma chambers) which can be used to analyse thisprocess, and to obtain an estimate of the emplacementaccounted for in the preserved rock sequence. Similarly, an evaluation
of the incompatible trace-element abundances, such as those for Zr time. To present this model it is necessary to discuss thestratigraphy, size, and connectivity of the different limbsand K, suggests that the chamber was open and that large volumes
of differentiated magma escaped. The volume of magma therefore of the Bushveld Complex, and to consider the extent oftapping of the magma chamber as well as its filling.greatly exceeded the preserved volume of cumulate rocks, giving
an estimated magma volume of over 1× 10⁶ km3. An average The term ‘Bushveld Complex’ has been given severalmeanings in the literature, and according to the Southemplacement rate of 13 km3/year is indicated by these calculations.
African Commission on Stratigraphy (1980) includes notonly the ultramafic–mafic layered rocks, but also the sillsbeneath the intrusion, volcanic rocks which pre-date the
KEY WORDS: Bushveld Complex; differentiation; magma emplacement main mafic emplacement event, and the granitic andrates; multiple intrusion; tapping of magma granophyric rocks which occur in the roof. However, in
this paper the term refers only to the layered ultramafic–mafic sequence.
INTRODUCTIONThe Bushveld Complex (BC) is a large layered intrusion, SETTING AND STRATIGRAPHY OFemplaced into a stable cratonic setting. It has been
THE BUSHVELD COMPLEXconsidered an intrusive equivalent of a continental floodThe BC was emplaced into the Kaapvaal craton atbasalt province, and inferred to be related to a mantle
plume (Hatton, 1995). The duration of continental flood 2060 Ma (Walraven et al., 1990). Generally, it was
∗Corresponding author. Oxford University Press 1998
JOURNAL OF PETROLOGY VOLUME 39 NUMBER 9 SEPTEMBER 1998
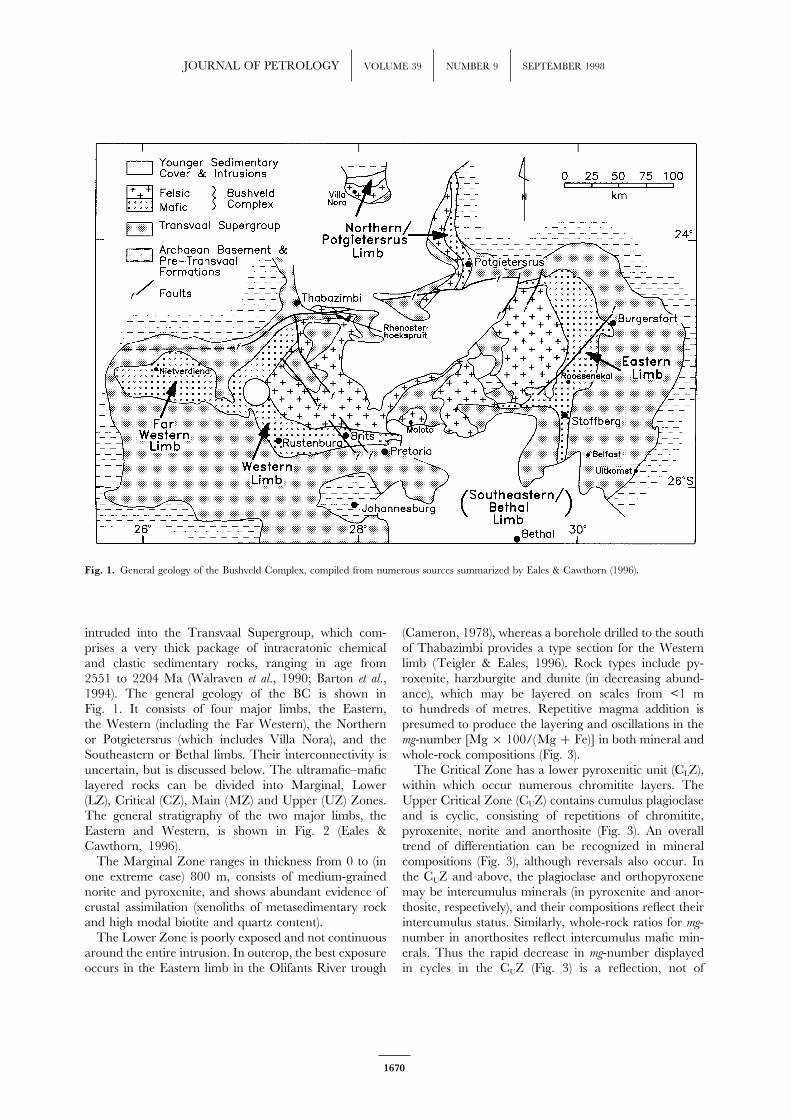
Fig. 1. General geology of the Bushveld Complex, compiled from numerous sources summarized by Eales & Cawthorn (1996).
intruded into the Transvaal Supergroup, which com- (Cameron, 1978), whereas a borehole drilled to the southof Thabazimbi provides a type section for the Westernprises a very thick package of intracratonic chemical
and clastic sedimentary rocks, ranging in age from limb (Teigler & Eales, 1996). Rock types include py-roxenite, harzburgite and dunite (in decreasing abund-2551 to 2204 Ma (Walraven et al., 1990; Barton et al.,
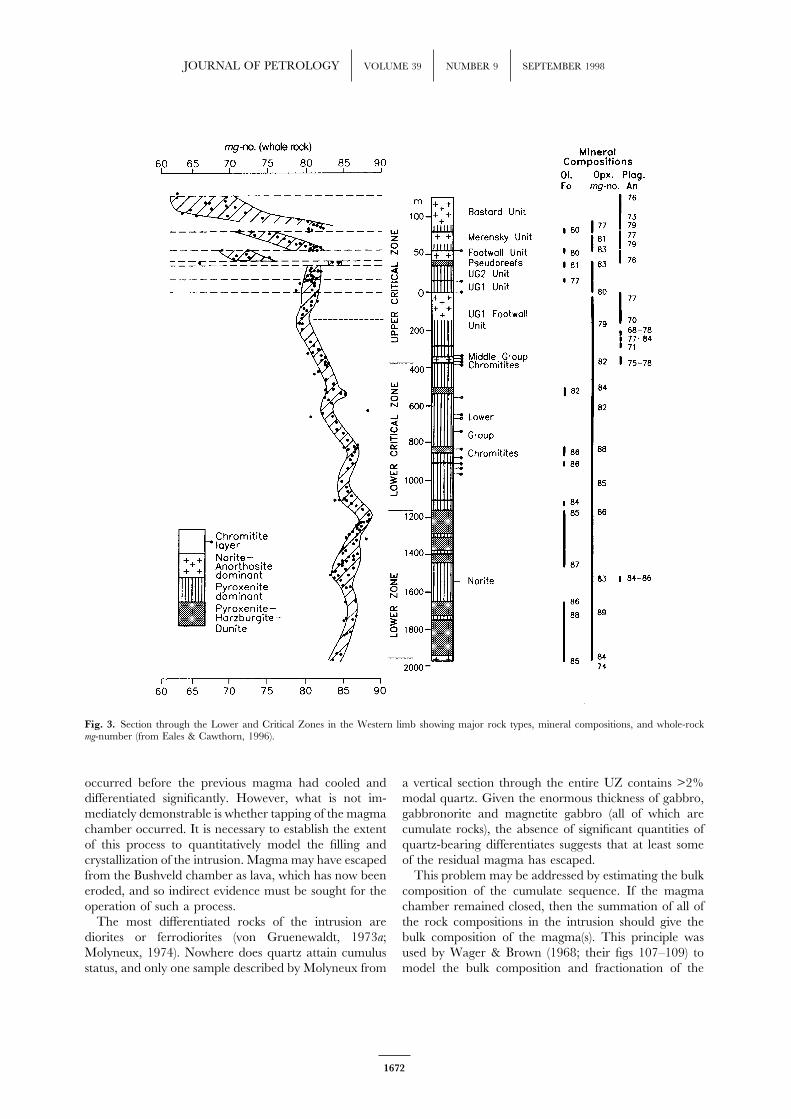
1994). The general geology of the BC is shown in ance), which may be layered on scales from <1 mto hundreds of metres. Repetitive magma addition isFig. 1. It consists of four major limbs, the Eastern,
the Western (including the Far Western), the Northern presumed to produce the layering and oscillations in themg-number [Mg× 100/(Mg+ Fe)] in both mineral andor Potgietersrus (which includes Villa Nora), and the
Southeastern or Bethal limbs. Their interconnectivity is whole-rock compositions (Fig. 3).The Critical Zone has a lower pyroxenitic unit (CLZ),uncertain, but is discussed below. The ultramafic–mafic
layered rocks can be divided into Marginal, Lower within which occur numerous chromitite layers. TheUpper Critical Zone (CUZ) contains cumulus plagioclase(LZ), Critical (CZ), Main (MZ) and Upper (UZ) Zones.
The general stratigraphy of the two major limbs, the and is cyclic, consisting of repetitions of chromitite,pyroxenite, norite and anorthosite (Fig. 3). An overallEastern and Western, is shown in Fig. 2 (Eales &
Cawthorn, 1996). trend of differentiation can be recognized in mineralcompositions (Fig. 3), although reversals also occur. InThe Marginal Zone ranges in thickness from 0 to (in
one extreme case) 800 m, consists of medium-grained the CUZ and above, the plagioclase and orthopyroxenemay be intercumulus minerals (in pyroxenite and anor-norite and pyroxenite, and shows abundant evidence of
crustal assimilation (xenoliths of metasedimentary rock thosite, respectively), and their compositions reflect theirintercumulus status. Similarly, whole-rock ratios for mg-and high modal biotite and quartz content).
The Lower Zone is poorly exposed and not continuous number in anorthosites reflect intercumulus mafic min-erals. Thus the rapid decrease in mg-number displayedaround the entire intrusion. In outcrop, the best exposure
occurs in the Eastern limb in the Olifants River trough in cycles in the CUZ (Fig. 3) is a reflection, not of
1670
CAWTHORN AND WALRAVEN BUSHVELD COMPLEX CRYSTALLIZATION TIME
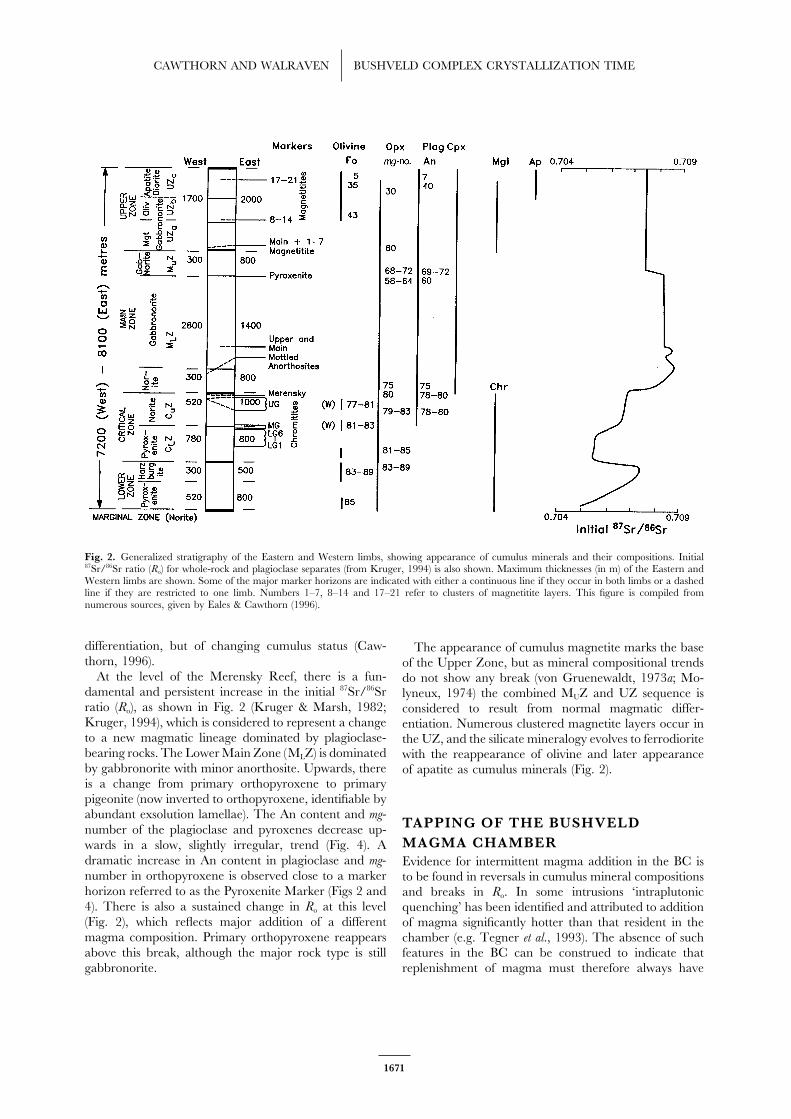
Fig. 2. Generalized stratigraphy of the Eastern and Western limbs, showing appearance of cumulus minerals and their compositions. Initial87Sr/86Sr ratio (Ro) for whole-rock and plagioclase separates (from Kruger, 1994) is also shown. Maximum thicknesses (in m) of the Eastern andWestern limbs are shown. Some of the major marker horizons are indicated with either a continuous line if they occur in both limbs or a dashedline if they are restricted to one limb. Numbers 1–7, 8–14 and 17–21 refer to clusters of magnetitite layers. This figure is compiled fromnumerous sources, given by Eales & Cawthorn (1996).
differentiation, but of changing cumulus status (Caw- The appearance of cumulus magnetite marks the basethorn, 1996). of the Upper Zone, but as mineral compositional trends
At the level of the Merensky Reef, there is a fun- do not show any break (von Gruenewaldt, 1973a; Mo-damental and persistent increase in the initial 87Sr/86Sr lyneux, 1974) the combined MUZ and UZ sequence isratio (Ro), as shown in Fig. 2 (Kruger & Marsh, 1982; considered to result from normal magmatic differ-Kruger, 1994), which is considered to represent a change entiation. Numerous clustered magnetite layers occur into a new magmatic lineage dominated by plagioclase- the UZ, and the silicate mineralogy evolves to ferrodioritebearing rocks. The Lower Main Zone (MLZ) is dominated with the reappearance of olivine and later appearanceby gabbronorite with minor anorthosite. Upwards, there of apatite as cumulus minerals (Fig. 2).is a change from primary orthopyroxene to primarypigeonite (now inverted to orthopyroxene, identifiable byabundant exsolution lamellae). The An content and mg-
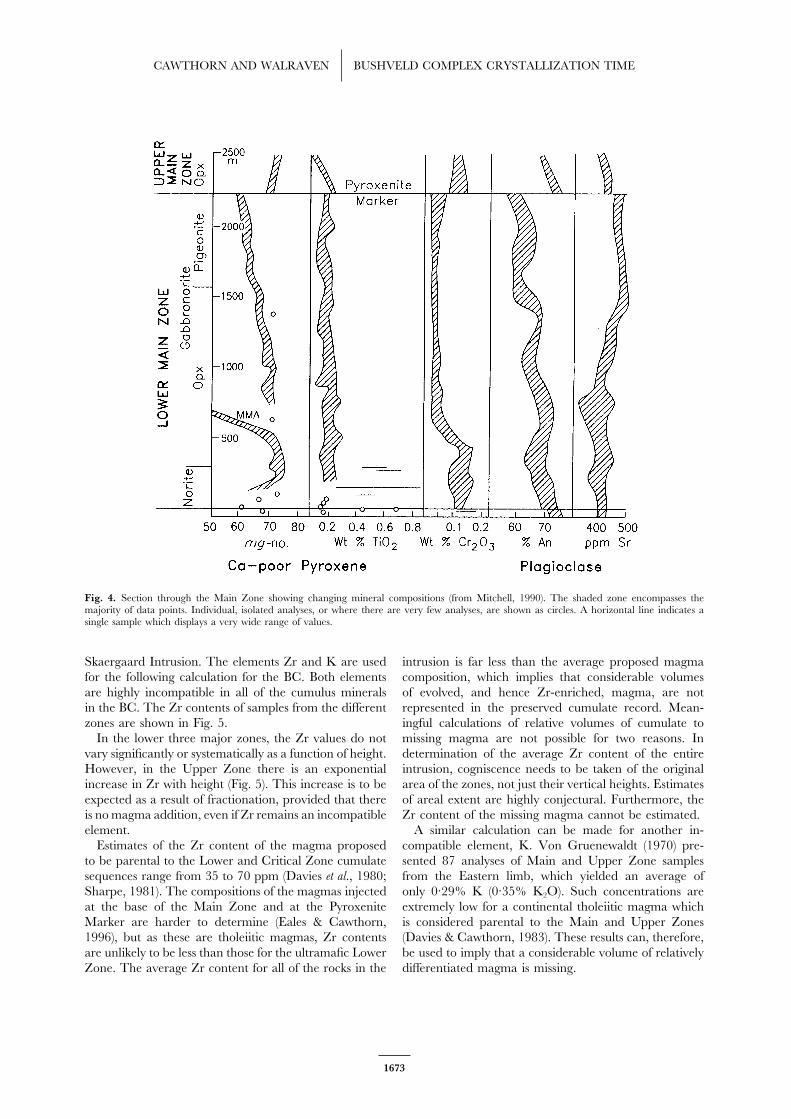
TAPPING OF THE BUSHVELDnumber of the plagioclase and pyroxenes decrease up-MAGMA CHAMBERwards in a slow, slightly irregular, trend (Fig. 4). A
dramatic increase in An content in plagioclase and mg- Evidence for intermittent magma addition in the BC isnumber in orthopyroxene is observed close to a marker to be found in reversals in cumulus mineral compositionshorizon referred to as the Pyroxenite Marker (Figs 2 and and breaks in Ro. In some intrusions ‘intraplutonic4). There is also a sustained change in Ro at this level quenching’ has been identified and attributed to addition(Fig. 2), which reflects major addition of a different of magma significantly hotter than that resident in themagma composition. Primary orthopyroxene reappears chamber (e.g. Tegner et al., 1993). The absence of suchabove this break, although the major rock type is still features in the BC can be construed to indicate that
replenishment of magma must therefore always havegabbronorite.
1671
JOURNAL OF PETROLOGY VOLUME 39 NUMBER 9 SEPTEMBER 1998
Fig. 3. Section through the Lower and Critical Zones in the Western limb showing major rock types, mineral compositions, and whole-rockmg-number (from Eales & Cawthorn, 1996).
occurred before the previous magma had cooled and a vertical section through the entire UZ contains >2%modal quartz. Given the enormous thickness of gabbro,differentiated significantly. However, what is not im-
mediately demonstrable is whether tapping of the magma gabbronorite and magnetite gabbro (all of which arecumulate rocks), the absence of significant quantities ofchamber occurred. It is necessary to establish the extent
of this process to quantitatively model the filling and quartz-bearing differentiates suggests that at least someof the residual magma has escaped.crystallization of the intrusion. Magma may have escaped
from the Bushveld chamber as lava, which has now been This problem may be addressed by estimating the bulkcomposition of the cumulate sequence. If the magmaeroded, and so indirect evidence must be sought for the
operation of such a process. chamber remained closed, then the summation of all ofthe rock compositions in the intrusion should give theThe most differentiated rocks of the intrusion are
diorites or ferrodiorites (von Gruenewaldt, 1973a; bulk composition of the magma(s). This principle wasused by Wager & Brown (1968; their figs 107–109) toMolyneux, 1974). Nowhere does quartz attain cumulus
status, and only one sample described by Molyneux from model the bulk composition and fractionation of the
1672
CAWTHORN AND WALRAVEN BUSHVELD COMPLEX CRYSTALLIZATION TIME
Fig. 4. Section through the Main Zone showing changing mineral compositions (from Mitchell, 1990). The shaded zone encompasses themajority of data points. Individual, isolated analyses, or where there are very few analyses, are shown as circles. A horizontal line indicates asingle sample which displays a very wide range of values.
Skaergaard Intrusion. The elements Zr and K are used intrusion is far less than the average proposed magmacomposition, which implies that considerable volumesfor the following calculation for the BC. Both elements
are highly incompatible in all of the cumulus minerals of evolved, and hence Zr-enriched, magma, are notrepresented in the preserved cumulate record. Mean-in the BC. The Zr contents of samples from the different
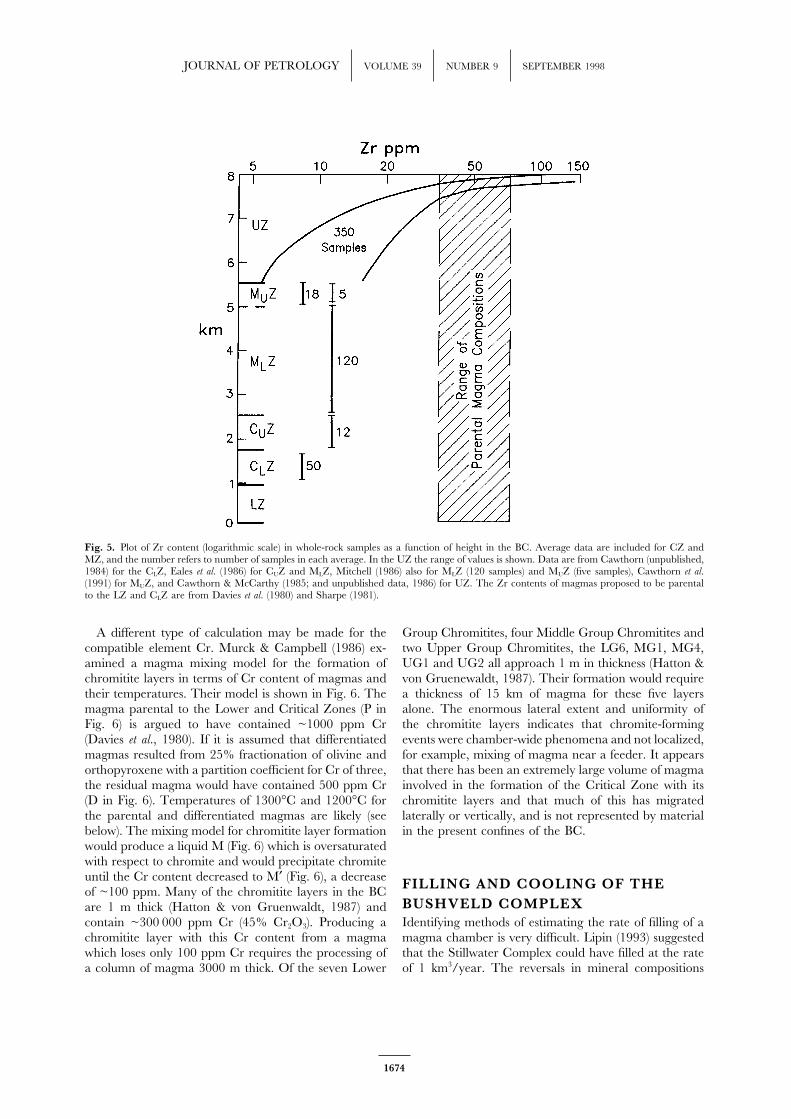
zones are shown in Fig. 5. ingful calculations of relative volumes of cumulate tomissing magma are not possible for two reasons. InIn the lower three major zones, the Zr values do not
vary significantly or systematically as a function of height. determination of the average Zr content of the entireintrusion, cogniscence needs to be taken of the originalHowever, in the Upper Zone there is an exponential
increase in Zr with height (Fig. 5). This increase is to be area of the zones, not just their vertical heights. Estimatesof areal extent are highly conjectural. Furthermore, theexpected as a result of fractionation, provided that there
is no magma addition, even if Zr remains an incompatible Zr content of the missing magma cannot be estimated.A similar calculation can be made for another in-element.
Estimates of the Zr content of the magma proposed compatible element, K. Von Gruenewaldt (1970) pre-sented 87 analyses of Main and Upper Zone samplesto be parental to the Lower and Critical Zone cumulate
sequences range from 35 to 70 ppm (Davies et al., 1980; from the Eastern limb, which yielded an average ofonly 0·29% K (0·35% K2O). Such concentrations areSharpe, 1981). The compositions of the magmas injected
at the base of the Main Zone and at the Pyroxenite extremely low for a continental tholeiitic magma whichis considered parental to the Main and Upper ZonesMarker are harder to determine (Eales & Cawthorn,
1996), but as these are tholeiitic magmas, Zr contents (Davies & Cawthorn, 1983). These results can, therefore,be used to imply that a considerable volume of relativelyare unlikely to be less than those for the ultramafic Lower
Zone. The average Zr content for all of the rocks in the differentiated magma is missing.
1673
JOURNAL OF PETROLOGY VOLUME 39 NUMBER 9 SEPTEMBER 1998
Fig. 5. Plot of Zr content (logarithmic scale) in whole-rock samples as a function of height in the BC. Average data are included for CZ andMZ, and the number refers to number of samples in each average. In the UZ the range of values is shown. Data are from Cawthorn (unpublished,1984) for the CLZ, Eales et al. (1986) for CUZ and MLZ, Mitchell (1986) also for MLZ (120 samples) and MUZ (five samples), Cawthorn et al.(1991) for MUZ, and Cawthorn & McCarthy (1985; and unpublished data, 1986) for UZ. The Zr contents of magmas proposed to be parentalto the LZ and CLZ are from Davies et al. (1980) and Sharpe (1981).
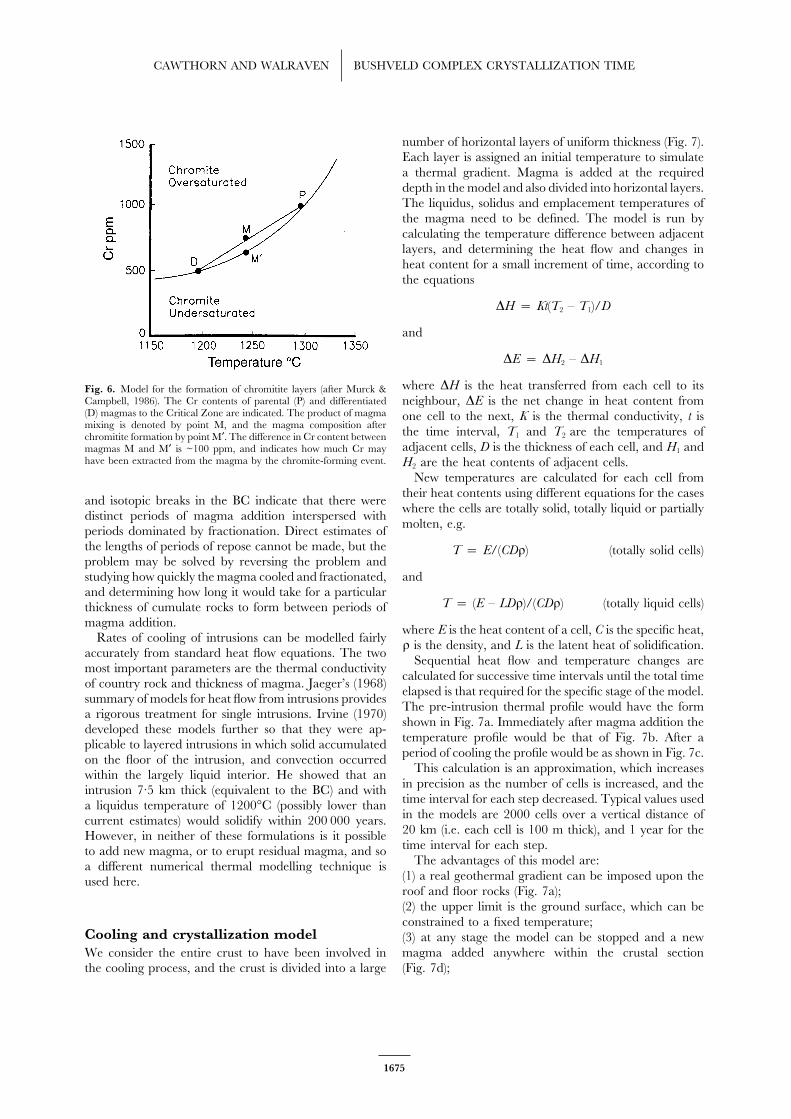
A different type of calculation may be made for the Group Chromitites, four Middle Group Chromitites andtwo Upper Group Chromitites, the LG6, MG1, MG4,compatible element Cr. Murck & Campbell (1986) ex-
amined a magma mixing model for the formation of UG1 and UG2 all approach 1 m in thickness (Hatton &von Gruenewaldt, 1987). Their formation would requirechromitite layers in terms of Cr content of magmas and
their temperatures. Their model is shown in Fig. 6. The a thickness of 15 km of magma for these five layersalone. The enormous lateral extent and uniformity ofmagma parental to the Lower and Critical Zones (P in
Fig. 6) is argued to have contained ~1000 ppm Cr the chromitite layers indicates that chromite-formingevents were chamber-wide phenomena and not localized,(Davies et al., 1980). If it is assumed that differentiated
magmas resulted from 25% fractionation of olivine and for example, mixing of magma near a feeder. It appearsthat there has been an extremely large volume of magmaorthopyroxene with a partition coefficient for Cr of three,
the residual magma would have contained 500 ppm Cr involved in the formation of the Critical Zone with itschromitite layers and that much of this has migrated(D in Fig. 6). Temperatures of 1300°C and 1200°C for
the parental and differentiated magmas are likely (see laterally or vertically, and is not represented by materialin the present confines of the BC.below). The mixing model for chromitite layer formation
would produce a liquid M (Fig. 6) which is oversaturatedwith respect to chromite and would precipitate chromiteuntil the Cr content decreased to M′ (Fig. 6), a decrease FILLING AND COOLING OF THEof ~100 ppm. Many of the chromitite layers in the BC
BUSHVELD COMPLEXare 1 m thick (Hatton & von Gruenwaldt, 1987) andcontain ~300 000 ppm Cr (45% Cr2O3). Producing a Identifying methods of estimating the rate of filling of a
magma chamber is very difficult. Lipin (1993) suggestedchromitite layer with this Cr content from a magmawhich loses only 100 ppm Cr requires the processing of that the Stillwater Complex could have filled at the rate
of 1 km3/year. The reversals in mineral compositionsa column of magma 3000 m thick. Of the seven Lower
1674
CAWTHORN AND WALRAVEN BUSHVELD COMPLEX CRYSTALLIZATION TIME
number of horizontal layers of uniform thickness (Fig. 7).Each layer is assigned an initial temperature to simulatea thermal gradient. Magma is added at the requireddepth in the model and also divided into horizontal layers.The liquidus, solidus and emplacement temperatures ofthe magma need to be defined. The model is run bycalculating the temperature difference between adjacentlayers, and determining the heat flow and changes inheat content for a small increment of time, according tothe equations
DH = Kt(T2 – T1)/D
and
DE = DH2 – DH1
where DH is the heat transferred from each cell to itsFig. 6. Model for the formation of chromitite layers (after Murck &Campbell, 1986). The Cr contents of parental (P) and differentiated neighbour, DE is the net change in heat content from(D) magmas to the Critical Zone are indicated. The product of magma one cell to the next, K is the thermal conductivity, t ismixing is denoted by point M, and the magma composition after the time interval, T1 and T2 are the temperatures ofchromitite formation by point M′. The difference in Cr content between
adjacent cells, D is the thickness of each cell, and H1 andmagmas M and M′ is ~100 ppm, and indicates how much Cr mayhave been extracted from the magma by the chromite-forming event. H2 are the heat contents of adjacent cells.
New temperatures are calculated for each cell fromtheir heat contents using different equations for the casesand isotopic breaks in the BC indicate that there werewhere the cells are totally solid, totally liquid or partiallydistinct periods of magma addition interspersed withmolten, e.g.periods dominated by fractionation. Direct estimates of
the lengths of periods of repose cannot be made, but the T = E/(CDq) (totally solid cells)problem may be solved by reversing the problem andstudying how quickly the magma cooled and fractionated, andand determining how long it would take for a particular
T = (E – LDq)/(CDq) (totally liquid cells)thickness of cumulate rocks to form between periods ofmagma addition. where E is the heat content of a cell, C is the specific heat,
Rates of cooling of intrusions can be modelled fairlyq is the density, and L is the latent heat of solidification.
accurately from standard heat flow equations. The two Sequential heat flow and temperature changes aremost important parameters are the thermal conductivity
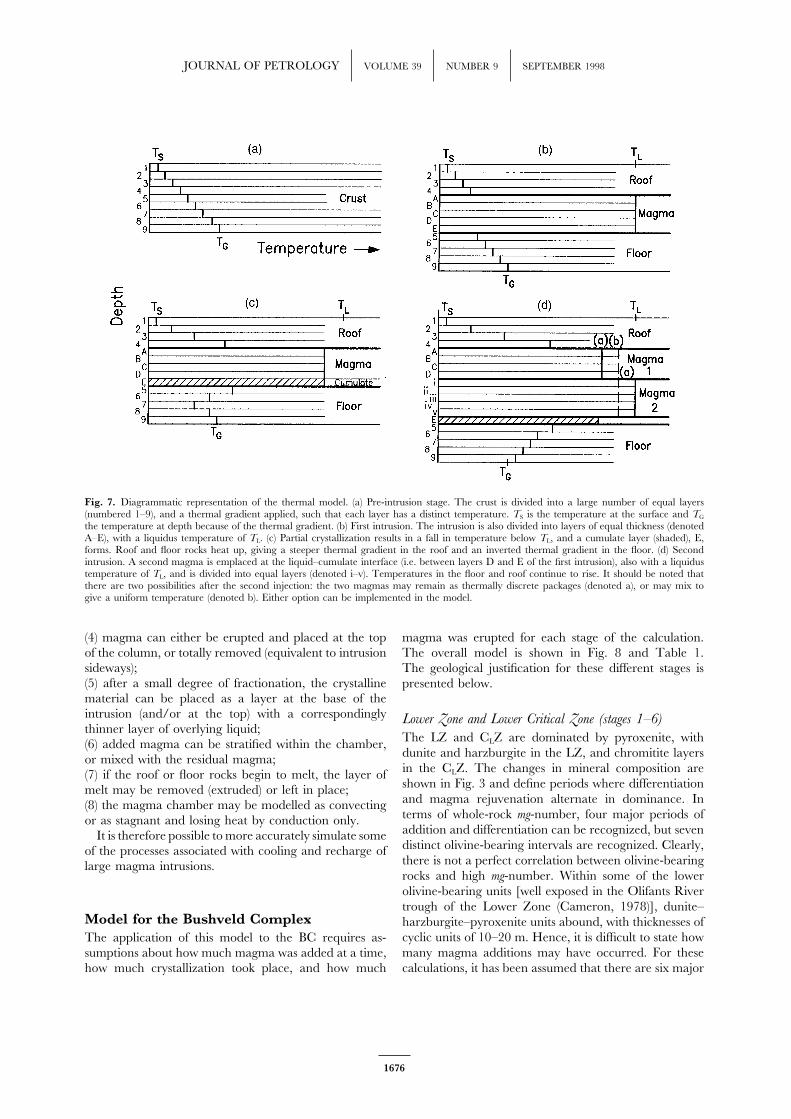
calculated for successive time intervals until the total timeof country rock and thickness of magma. Jaeger’s (1968)elapsed is that required for the specific stage of the model.summary of models for heat flow from intrusions providesThe pre-intrusion thermal profile would have the forma rigorous treatment for single intrusions. Irvine (1970)shown in Fig. 7a. Immediately after magma addition thedeveloped these models further so that they were ap-temperature profile would be that of Fig. 7b. After aplicable to layered intrusions in which solid accumulatedperiod of cooling the profile would be as shown in Fig. 7c.on the floor of the intrusion, and convection occurred
This calculation is an approximation, which increaseswithin the largely liquid interior. He showed that anin precision as the number of cells is increased, and theintrusion 7·5 km thick (equivalent to the BC) and withtime interval for each step decreased. Typical values useda liquidus temperature of 1200°C (possibly lower thanin the models are 2000 cells over a vertical distance ofcurrent estimates) would solidify within 200 000 years.20 km (i.e. each cell is 100 m thick), and 1 year for theHowever, in neither of these formulations is it possibletime interval for each step.to add new magma, or to erupt residual magma, and so
The advantages of this model are:a different numerical thermal modelling technique is(1) a real geothermal gradient can be imposed upon theused here.roof and floor rocks (Fig. 7a);(2) the upper limit is the ground surface, which can beconstrained to a fixed temperature;
Cooling and crystallization model (3) at any stage the model can be stopped and a newmagma added anywhere within the crustal sectionWe consider the entire crust to have been involved in
the cooling process, and the crust is divided into a large (Fig. 7d);
1675
JOURNAL OF PETROLOGY VOLUME 39 NUMBER 9 SEPTEMBER 1998
Fig. 7. Diagrammatic representation of the thermal model. (a) Pre-intrusion stage. The crust is divided into a large number of equal layers(numbered 1–9), and a thermal gradient applied, such that each layer has a distinct temperature. TS is the temperature at the surface and TG
the temperature at depth because of the thermal gradient. (b) First intrusion. The intrusion is also divided into layers of equal thickness (denotedA–E), with a liquidus temperature of TL. (c) Partial crystallization results in a fall in temperature below TL, and a cumulate layer (shaded), E,forms. Roof and floor rocks heat up, giving a steeper thermal gradient in the roof and an inverted thermal gradient in the floor. (d) Secondintrusion. A second magma is emplaced at the liquid–cumulate interface (i.e. between layers D and E of the first intrusion), also with a liquidustemperature of TL, and is divided into equal layers (denoted i–v). Temperatures in the floor and roof continue to rise. It should be noted thatthere are two possibilities after the second injection: the two magmas may remain as thermally discrete packages (denoted a), or may mix togive a uniform temperature (denoted b). Either option can be implemented in the model.
(4) magma can either be erupted and placed at the top magma was erupted for each stage of the calculation.of the column, or totally removed (equivalent to intrusion The overall model is shown in Fig. 8 and Table 1.sideways); The geological justification for these different stages is(5) after a small degree of fractionation, the crystalline presented below.material can be placed as a layer at the base of theintrusion (and/or at the top) with a correspondingly Lower Zone and Lower Critical Zone (stages 1–6)thinner layer of overlying liquid;
The LZ and CLZ are dominated by pyroxenite, with(6) added magma can be stratified within the chamber,dunite and harzburgite in the LZ, and chromitite layersor mixed with the residual magma;in the CLZ. The changes in mineral composition are(7) if the roof or floor rocks begin to melt, the layer ofshown in Fig. 3 and define periods where differentiationmelt may be removed (extruded) or left in place;and magma rejuvenation alternate in dominance. In(8) the magma chamber may be modelled as convectingterms of whole-rock mg-number, four major periods ofor as stagnant and losing heat by conduction only.addition and differentiation can be recognized, but sevenIt is therefore possible to more accurately simulate somedistinct olivine-bearing intervals are recognized. Clearly,of the processes associated with cooling and recharge ofthere is not a perfect correlation between olivine-bearinglarge magma intrusions.rocks and high mg-number. Within some of the lowerolivine-bearing units [well exposed in the Olifants Rivertrough of the Lower Zone (Cameron, 1978)], dunite–
Model for the Bushveld Complex harzburgite–pyroxenite units abound, with thicknesses ofcyclic units of 10–20 m. Hence, it is difficult to state howThe application of this model to the BC requires as-many magma additions may have occurred. For thesesumptions about how much magma was added at a time,
how much crystallization took place, and how much calculations, it has been assumed that there are six major
1676
CAWTHORN AND WALRAVEN BUSHVELD COMPLEX CRYSTALLIZATION TIME
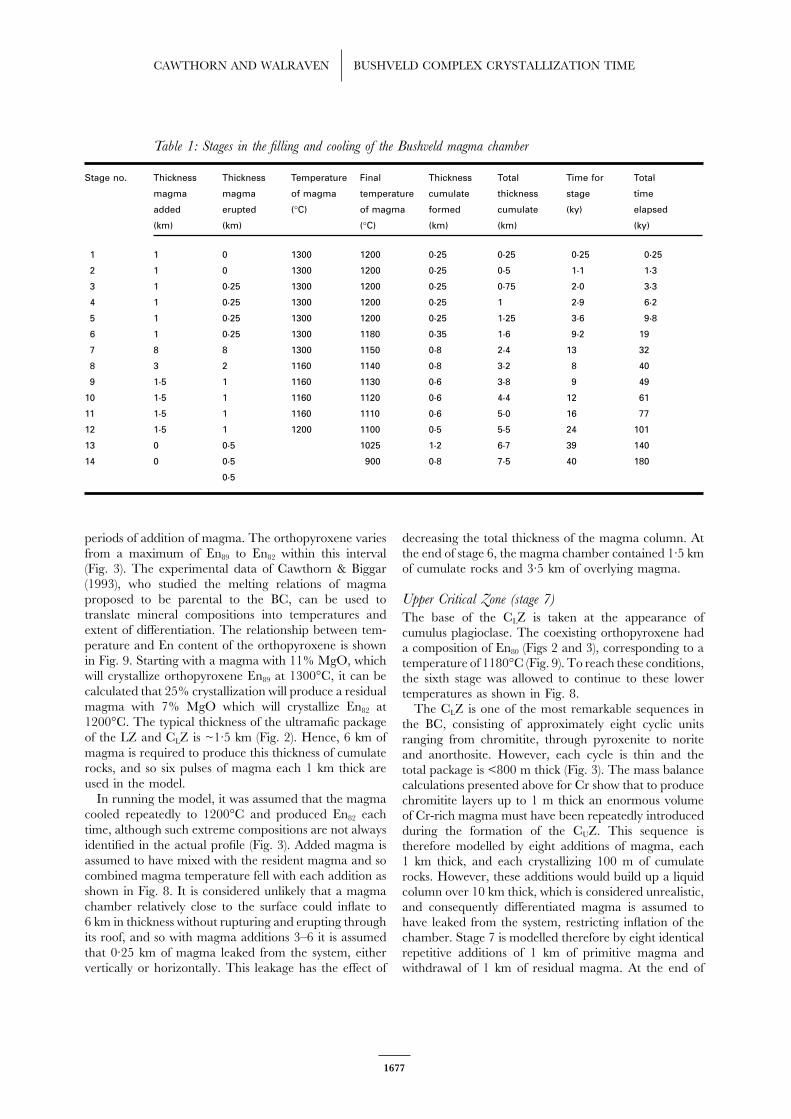
Table 1: Stages in the filling and cooling of the Bushveld magma chamber
Stage no. Thickness Thickness Temperature Final Thickness Total Time for Total
magma magma of magma temperature cumulate thickness stage time
added erupted (°C) of magma formed cumulate (ky) elapsed
(km) (km) (°C) (km) (km) (ky)
1 1 0 1300 1200 0·25 0·25 0·25 0·25
2 1 0 1300 1200 0·25 0·5 1·1 1·3
3 1 0·25 1300 1200 0·25 0·75 2·0 3·3
4 1 0·25 1300 1200 0·25 1 2·9 6·2
5 1 0·25 1300 1200 0·25 1·25 3·6 9·8
6 1 0·25 1300 1180 0·35 1·6 9·2 19
7 8 8 1300 1150 0·8 2·4 13 32
8 3 2 1160 1140 0·8 3·2 8 40
9 1·5 1 1160 1130 0·6 3·8 9 49
10 1·5 1 1160 1120 0·6 4·4 12 61
11 1·5 1 1160 1110 0·6 5·0 16 77
12 1·5 1 1200 1100 0·5 5·5 24 101
13 0 0·5 1025 1·2 6·7 39 140
14 0 0·5 900 0·8 7·5 40 180
0·5
periods of addition of magma. The orthopyroxene varies decreasing the total thickness of the magma column. Atthe end of stage 6, the magma chamber contained 1·5 kmfrom a maximum of En89 to En82 within this intervalof cumulate rocks and 3·5 km of overlying magma.(Fig. 3). The experimental data of Cawthorn & Biggar
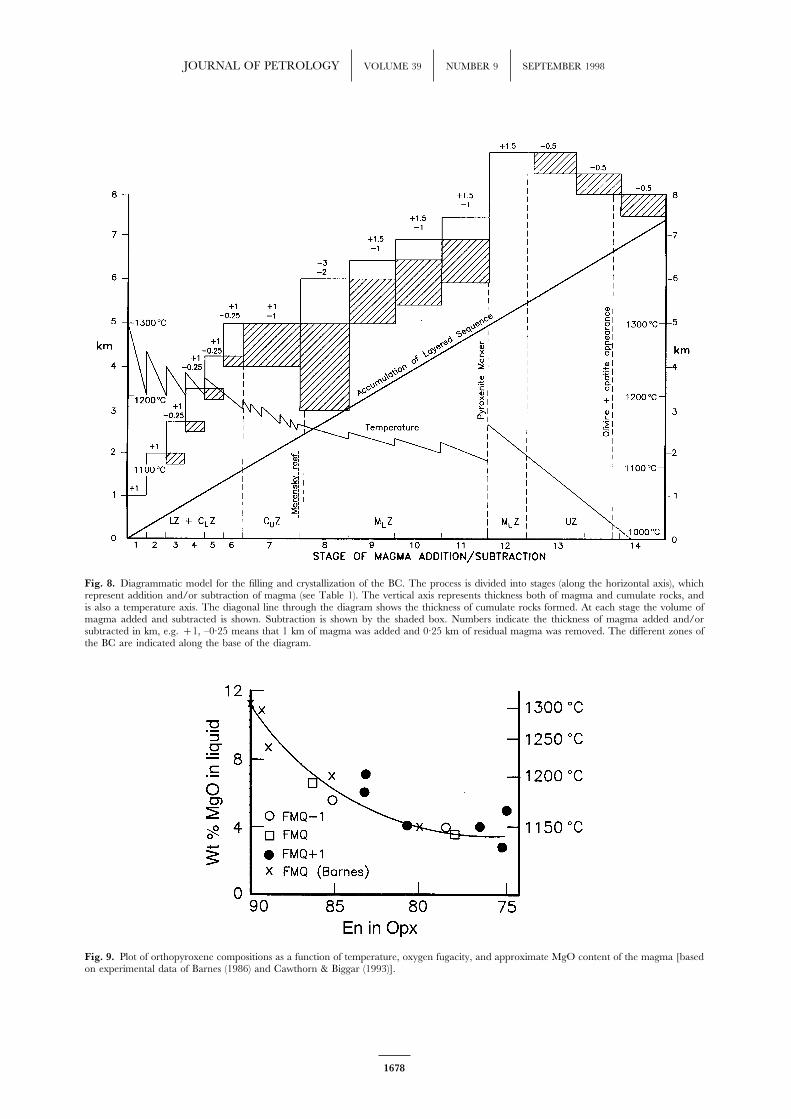
(1993), who studied the melting relations of magmaproposed to be parental to the BC, can be used to Upper Critical Zone (stage 7)translate mineral compositions into temperatures and The base of the CLZ is taken at the appearance ofextent of differentiation. The relationship between tem- cumulus plagioclase. The coexisting orthopyroxene hadperature and En content of the orthopyroxene is shown a composition of En80 (Figs 2 and 3), corresponding to ain Fig. 9. Starting with a magma with 11% MgO, which temperature of 1180°C (Fig. 9). To reach these conditions,will crystallize orthopyroxene En89 at 1300°C, it can be the sixth stage was allowed to continue to these lowercalculated that 25% crystallization will produce a residual temperatures as shown in Fig. 8.magma with 7% MgO which will crystallize En82 at The CLZ is one of the most remarkable sequences in1200°C. The typical thickness of the ultramafic package the BC, consisting of approximately eight cyclic unitsof the LZ and CLZ is ~1·5 km (Fig. 2). Hence, 6 km of ranging from chromitite, through pyroxenite to noritemagma is required to produce this thickness of cumulate and anorthosite. However, each cycle is thin and therocks, and so six pulses of magma each 1 km thick are total package is <800 m thick (Fig. 3). The mass balanceused in the model. calculations presented above for Cr show that to produce
In running the model, it was assumed that the magma chromitite layers up to 1 m thick an enormous volumecooled repeatedly to 1200°C and produced En82 each of Cr-rich magma must have been repeatedly introducedtime, although such extreme compositions are not always during the formation of the CUZ. This sequence isidentified in the actual profile (Fig. 3). Added magma is therefore modelled by eight additions of magma, eachassumed to have mixed with the resident magma and so 1 km thick, and each crystallizing 100 m of cumulatecombined magma temperature fell with each addition as rocks. However, these additions would build up a liquidshown in Fig. 8. It is considered unlikely that a magma column over 10 km thick, which is considered unrealistic,chamber relatively close to the surface could inflate to and consequently differentiated magma is assumed to6 km in thickness without rupturing and erupting through have leaked from the system, restricting inflation of theits roof, and so with magma additions 3–6 it is assumed chamber. Stage 7 is modelled therefore by eight identicalthat 0·25 km of magma leaked from the system, either repetitive additions of 1 km of primitive magma and
withdrawal of 1 km of residual magma. At the end ofvertically or horizontally. This leakage has the effect of
1677
JOURNAL OF PETROLOGY VOLUME 39 NUMBER 9 SEPTEMBER 1998
Fig. 8. Diagrammatic model for the filling and crystallization of the BC. The process is divided into stages (along the horizontal axis), whichrepresent addition and/or subtraction of magma (see Table 1). The vertical axis represents thickness both of magma and cumulate rocks, andis also a temperature axis. The diagonal line through the diagram shows the thickness of cumulate rocks formed. At each stage the volume ofmagma added and subtracted is shown. Subtraction is shown by the shaded box. Numbers indicate the thickness of magma added and/orsubtracted in km, e.g. +1, –0·25 means that 1 km of magma was added and 0·25 km of residual magma was removed. The different zones ofthe BC are indicated along the base of the diagram.
Fig. 9. Plot of orthopyroxene compositions as a function of temperature, oxygen fugacity, and approximate MgO content of the magma [basedon experimental data of Barnes (1986) and Cawthorn & Biggar (1993)].
1678
CAWTHORN AND WALRAVEN BUSHVELD COMPLEX CRYSTALLIZATION TIME
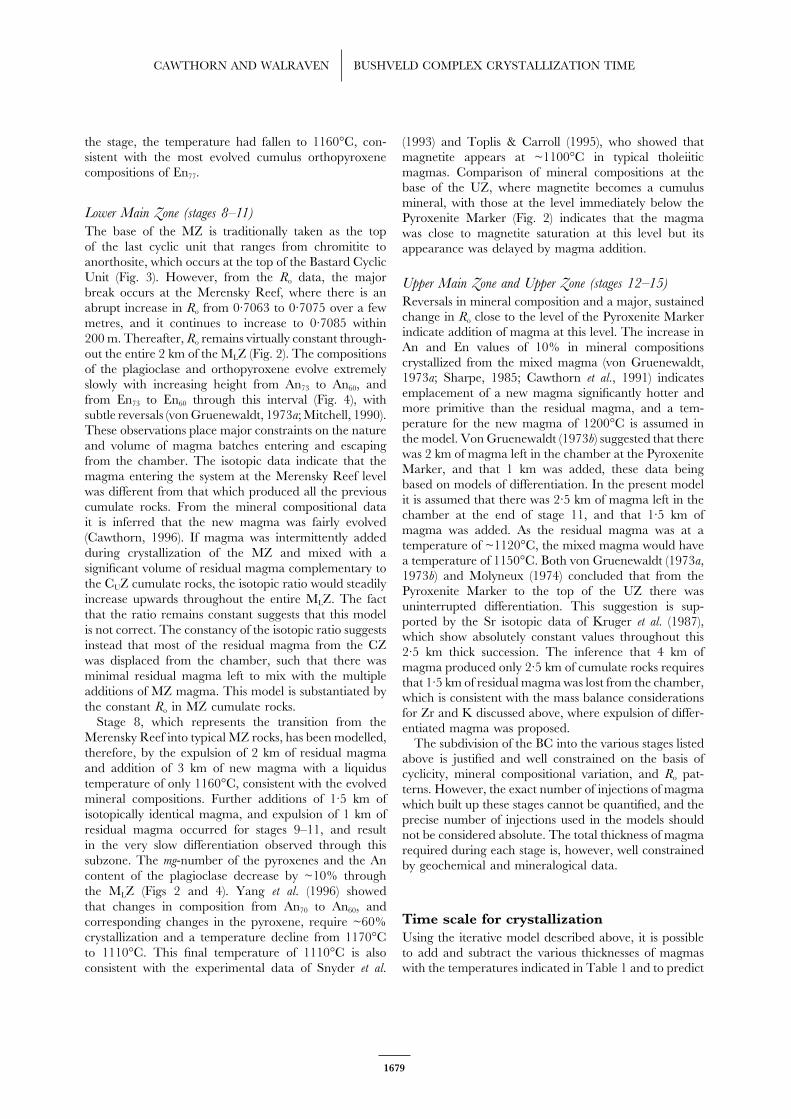
the stage, the temperature had fallen to 1160°C, con- (1993) and Toplis & Carroll (1995), who showed thatmagnetite appears at ~1100°C in typical tholeiiticsistent with the most evolved cumulus orthopyroxenemagmas. Comparison of mineral compositions at thecompositions of En77.base of the UZ, where magnetite becomes a cumulusmineral, with those at the level immediately below the
Lower Main Zone (stages 8–11) Pyroxenite Marker (Fig. 2) indicates that the magmaThe base of the MZ is traditionally taken as the top was close to magnetite saturation at this level but itsof the last cyclic unit that ranges from chromitite to appearance was delayed by magma addition.anorthosite, which occurs at the top of the Bastard CyclicUnit (Fig. 3). However, from the Ro data, the major Upper Main Zone and Upper Zone (stages 12–15)break occurs at the Merensky Reef, where there is an
Reversals in mineral composition and a major, sustainedabrupt increase in Ro from 0·7063 to 0·7075 over a fewchange in Ro close to the level of the Pyroxenite Markermetres, and it continues to increase to 0·7085 withinindicate addition of magma at this level. The increase in200 m. Thereafter, Ro remains virtually constant through-An and En values of 10% in mineral compositionsout the entire 2 km of the MLZ (Fig. 2). The compositionscrystallized from the mixed magma (von Gruenewaldt,of the plagioclase and orthopyroxene evolve extremely1973a; Sharpe, 1985; Cawthorn et al., 1991) indicatesslowly with increasing height from An73 to An60, andemplacement of a new magma significantly hotter andfrom En73 to En60 through this interval (Fig. 4), withmore primitive than the residual magma, and a tem-subtle reversals (von Gruenewaldt, 1973a; Mitchell, 1990).perature for the new magma of 1200°C is assumed inThese observations place major constraints on the naturethe model. Von Gruenewaldt (1973b) suggested that thereand volume of magma batches entering and escapingwas 2 km of magma left in the chamber at the Pyroxenitefrom the chamber. The isotopic data indicate that theMarker, and that 1 km was added, these data beingmagma entering the system at the Merensky Reef levelbased on models of differentiation. In the present modelwas different from that which produced all the previousit is assumed that there was 2·5 km of magma left in thecumulate rocks. From the mineral compositional datachamber at the end of stage 11, and that 1·5 km ofit is inferred that the new magma was fairly evolvedmagma was added. As the residual magma was at a(Cawthorn, 1996). If magma was intermittently addedtemperature of ~1120°C, the mixed magma would haveduring crystallization of the MZ and mixed with aa temperature of 1150°C. Both von Gruenewaldt (1973a,
significant volume of residual magma complementary to 1973b) and Molyneux (1974) concluded that from thethe CUZ cumulate rocks, the isotopic ratio would steadily Pyroxenite Marker to the top of the UZ there wasincrease upwards throughout the entire MLZ. The fact uninterrupted differentiation. This suggestion is sup-that the ratio remains constant suggests that this model ported by the Sr isotopic data of Kruger et al. (1987),is not correct. The constancy of the isotopic ratio suggests which show absolutely constant values throughout thisinstead that most of the residual magma from the CZ 2·5 km thick succession. The inference that 4 km ofwas displaced from the chamber, such that there was magma produced only 2·5 km of cumulate rocks requiresminimal residual magma left to mix with the multiple that 1·5 km of residual magma was lost from the chamber,additions of MZ magma. This model is substantiated by which is consistent with the mass balance considerationsthe constant Ro in MZ cumulate rocks. for Zr and K discussed above, where expulsion of differ-
Stage 8, which represents the transition from the entiated magma was proposed.Merensky Reef into typical MZ rocks, has been modelled, The subdivision of the BC into the various stages listedtherefore, by the expulsion of 2 km of residual magma above is justified and well constrained on the basis ofand addition of 3 km of new magma with a liquidus cyclicity, mineral compositional variation, and Ro pat-temperature of only 1160°C, consistent with the evolved terns. However, the exact number of injections of magmamineral compositions. Further additions of 1·5 km of which built up these stages cannot be quantified, and theisotopically identical magma, and expulsion of 1 km of precise number of injections used in the models shouldresidual magma occurred for stages 9–11, and result not be considered absolute. The total thickness of magmain the very slow differentiation observed through this required during each stage is, however, well constrainedsubzone. The mg-number of the pyroxenes and the An by geochemical and mineralogical data.content of the plagioclase decrease by ~10% throughthe MLZ (Figs 2 and 4). Yang et al. (1996) showedthat changes in composition from An70 to An60, and
Time scale for crystallizationcorresponding changes in the pyroxene, require ~60%crystallization and a temperature decline from 1170°C Using the iterative model described above, it is possibleto 1110°C. This final temperature of 1110°C is also to add and subtract the various thicknesses of magmas
with the temperatures indicated in Table 1 and to predictconsistent with the experimental data of Snyder et al.
1679
JOURNAL OF PETROLOGY VOLUME 39 NUMBER 9 SEPTEMBER 1998
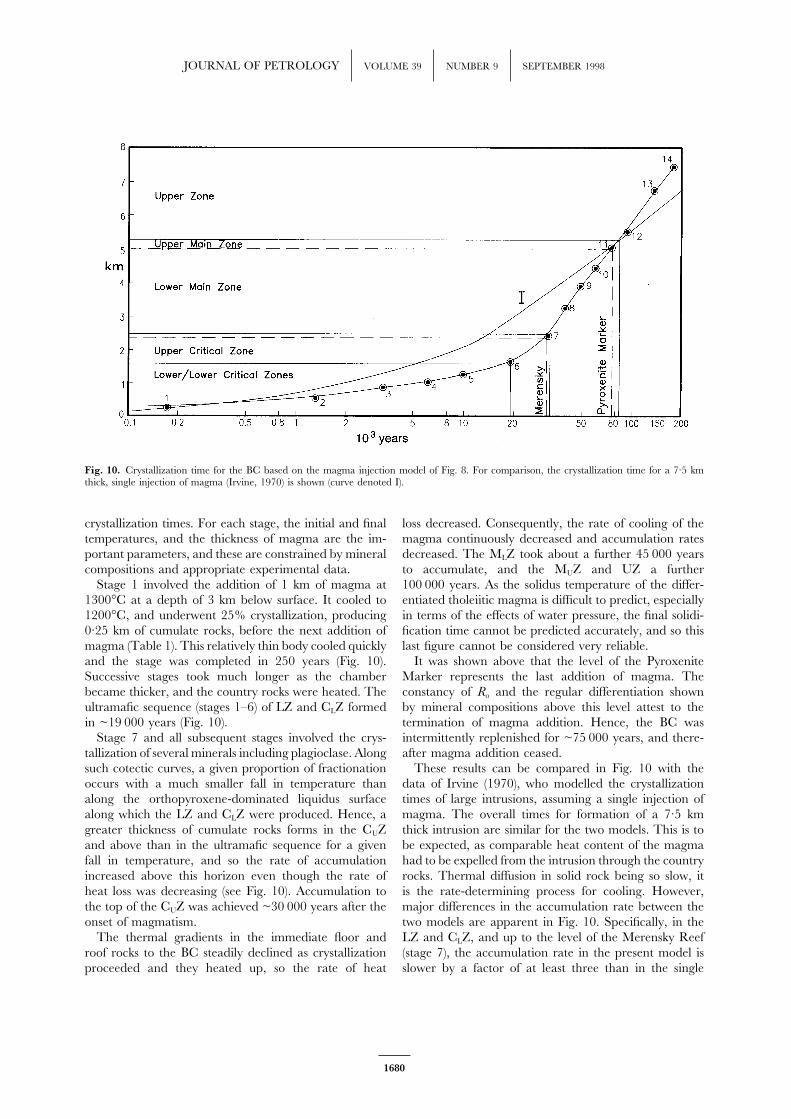
Fig. 10. Crystallization time for the BC based on the magma injection model of Fig. 8. For comparison, the crystallization time for a 7·5 kmthick, single injection of magma (Irvine, 1970) is shown (curve denoted I).
crystallization times. For each stage, the initial and final loss decreased. Consequently, the rate of cooling of themagma continuously decreased and accumulation ratestemperatures, and the thickness of magma are the im-
portant parameters, and these are constrained by mineral decreased. The MLZ took about a further 45 000 yearsto accumulate, and the MUZ and UZ a furthercompositions and appropriate experimental data.
Stage 1 involved the addition of 1 km of magma at 100 000 years. As the solidus temperature of the differ-entiated tholeiitic magma is difficult to predict, especially1300°C at a depth of 3 km below surface. It cooled to
1200°C, and underwent 25% crystallization, producing in terms of the effects of water pressure, the final solidi-fication time cannot be predicted accurately, and so this0·25 km of cumulate rocks, before the next addition of
magma (Table 1). This relatively thin body cooled quickly last figure cannot be considered very reliable.It was shown above that the level of the Pyroxeniteand the stage was completed in 250 years (Fig. 10).
Successive stages took much longer as the chamber Marker represents the last addition of magma. Theconstancy of Ro and the regular differentiation shownbecame thicker, and the country rocks were heated. The
ultramafic sequence (stages 1–6) of LZ and CLZ formed by mineral compositions above this level attest to thetermination of magma addition. Hence, the BC wasin ~19 000 years (Fig. 10).
Stage 7 and all subsequent stages involved the crys- intermittently replenished for ~75 000 years, and there-after magma addition ceased.tallization of several minerals including plagioclase. Along
such cotectic curves, a given proportion of fractionation These results can be compared in Fig. 10 with thedata of Irvine (1970), who modelled the crystallizationoccurs with a much smaller fall in temperature than
along the orthopyroxene-dominated liquidus surface times of large intrusions, assuming a single injection ofmagma. The overall times for formation of a 7·5 kmalong which the LZ and CLZ were produced. Hence, a
greater thickness of cumulate rocks forms in the CUZ thick intrusion are similar for the two models. This is tobe expected, as comparable heat content of the magmaand above than in the ultramafic sequence for a given
fall in temperature, and so the rate of accumulation had to be expelled from the intrusion through the countryrocks. Thermal diffusion in solid rock being so slow, itincreased above this horizon even though the rate of
heat loss was decreasing (see Fig. 10). Accumulation to is the rate-determining process for cooling. However,major differences in the accumulation rate between thethe top of the CUZ was achieved ~30 000 years after the
onset of magmatism. two models are apparent in Fig. 10. Specifically, in theLZ and CLZ, and up to the level of the Merensky ReefThe thermal gradients in the immediate floor and
roof rocks to the BC steadily declined as crystallization (stage 7), the accumulation rate in the present model isslower by a factor of at least three than in the singleproceeded and they heated up, so the rate of heat
1680
CAWTHORN AND WALRAVEN BUSHVELD COMPLEX CRYSTALLIZATION TIME
injection model. This difference is the consequence of younger cover, where the two are separated by theThabazimbi–Murchison Lineament, which can be tracedtwo effects. Hot (1300°C) magma was added and pro-
gressively a greater volume of cool (1200°C) magma was from Thabazimbi, eastwards, to immediately south ofPotgietersrus (Fig. 1). As some of the movement alongexpelled. Hence, the overall temperature of the magma
was kept higher in the multiple intrusion model. Further, this sinistral fault zone post-dated the emplacement ofthe BC (du Plessis & Walraven, 1990), it is probable thatinitially a large temperature fall is required for a small
percent of orthopyroxene crystallization, whereas once these two lobes were also originally contiguous.Between the Western and Eastern lobes are isolatedmagmas become saturated with several minerals, a small
decrease in temperature causes a greater percent crys- occurrences of layered rocks. Extensions to the Westerntallization. In Irvine’s model, the percent crystallization lobe can be seen at Rhenosterhoekspruit, east of Thab-was a linear function of temperature from liquidus to azimbi (Fig. 11a) where 1·5 km of Upper Zone rockssolidus. In the present model it is possible to determine with magnetite layers has been identified, and at Molotomore accurately the time interval between successive east of Pretoria (Fig. 1) where again Upper Zone rockspulses of magma, provided that there is sufficient in- have been intersected in bore-core (Walraven, 1987). Information on the change in mineral compositions, and the Eastern limb, an isolated dome at Malope (Fig. 11a)hence the temperature decrease, between each injection. exposes CLZ to UZ rocks (Marlow & van der Merwe,
1977). The similarities between rocks at these threelocalities with sections of the Bushveld stratigraphy inthe Eastern and Western limbs strongly supports the
VOLUME OF THE BUSHVELD concept of lateral continuity with these two main limbs.Evidence for a greater lateral extent of the originalMAGMA CHAMBER
chamber than its present limits can be found from aIt is difficult to estimate the total volume of magmavariety of geological information. Metamorphism of thewhich produced the mafic rocks of the BC. The mainfloor rocks (mainly the Transvaal Supergroup) can beuncertainties are:traced well beyond the present erosional limits of the(1) the original lateral extent of the intrusion beyondintrusion and can be regarded as evidence for lateralpresent erosional limits;extension. These metamorphic limits are shown in(2) whether each lobe was strictly synchronous and/orFig. 11a. Around the Eastern limb, they have beenphysically connected;precisely defined by Button (1976). In the Far Western(3) the variability of thickness;and Western limb the presence of andalusite- and(4) whether there was eruption from the chamber.cordierite-bearing rocks has been reported by En-Each of these aspects is discussed below.gelbrecht (1976) and Davies (1980), respectively. Thelimits of observable mineralogical metamorphic changeon surface do not define the limit of the Bushveld
Area chamber. They merely indicate that the dip of these floorrocks is such that, beyond these limits, the chamber wasThe present outcrop of the BC can be divided into fourat a level so far above these rocks that the effect ofmajor limbs (Fig. 1). The outcrop of the Western limbmetamorphism was minimal. Hence, these metamorphicis almost semi-circular with a radius of 60 km, and dipslimits define a minimum extension to the Bushveld cham-are of the order of 10–15°C centripetally. There is anber.extension which has been referred to as the Far Western
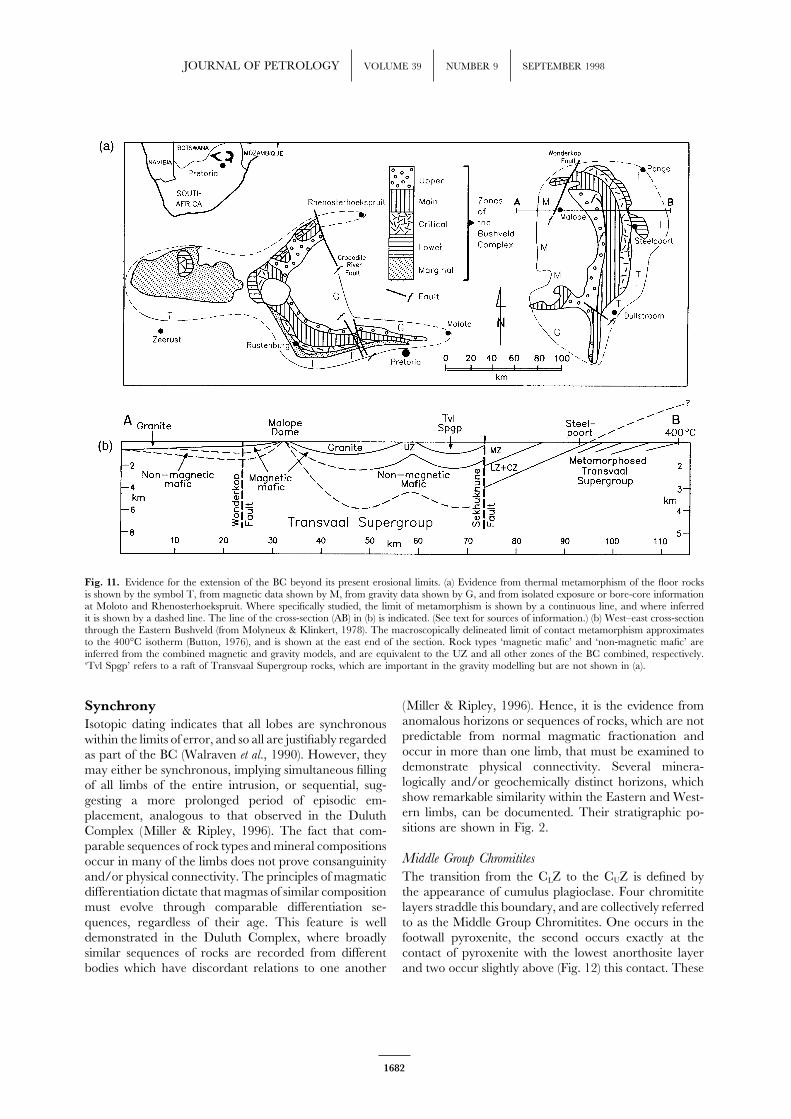
In the Eastern Bushveld a gravity and magnetic surveylimb and was probably contiguous with the Western limbby Molyneux & Klinkert (1978) indicated the probablebefore erosion. The Eastern limb is a mirror image ofwestwards extent of the intrusion. These workers definedthe Western limb, but has an extension southwards whicha limit of magnetite-rich rocks based on magnetic an-is hidden below younger sedimentary rocks to the south.omalies, which is shown in Fig. 11a. Gravity surveys byBased on gravity data and subsequent drilling, it hasthese workers and Hattingh (1980) have also been usedbeen shown that a sizeable layered mafic sequence occursto infer extensions down-dip. Such gravity interpretationsfurther to the south of this extension. It is known as theare model dependent and become less reliable withBethal lobe, and original continuity between it and theincreasing depth when traced westwards, but are alsoEastern limb was probable. The Northern or Pot-shown in Fig. 11a. A cross-section based on the inter-gietersrus limb has two exposures, one as a north-trend-pretation of the geophysical data is shown in Fig. 11b.ing, 90 km long body, and a second as an equant exposureGravity studies in the west by Walraven & Darracott50 km further west. However, these two are almost(1976) and du Plessis & Kleywegt (1987) also indicatecertainly contiguous beneath the younger sedimentarythat mafic rocks may underlie the entire semi-circle fromcover (Fig. 1). The geometrical relationships between
the Northern and Eastern lobes are also hidden under Thabazimbi to Pretoria.
1681
JOURNAL OF PETROLOGY VOLUME 39 NUMBER 9 SEPTEMBER 1998
Fig. 11. Evidence for the extension of the BC beyond its present erosional limits. (a) Evidence from thermal metamorphism of the floor rocksis shown by the symbol T, from magnetic data shown by M, from gravity data shown by G, and from isolated exposure or bore-core informationat Moloto and Rhenosterhoekspruit. Where specifically studied, the limit of metamorphism is shown by a continuous line, and where inferredit is shown by a dashed line. The line of the cross-section (AB) in (b) is indicated. (See text for sources of information.) (b) West–east cross-sectionthrough the Eastern Bushveld (from Molyneux & Klinkert, 1978). The macroscopically delineated limit of contact metamorphism approximatesto the 400°C isotherm (Button, 1976), and is shown at the east end of the section. Rock types ‘magnetic mafic’ and ‘non-magnetic mafic’ areinferred from the combined magnetic and gravity models, and are equivalent to the UZ and all other zones of the BC combined, respectively.‘Tvl Spgp’ refers to a raft of Transvaal Supergroup rocks, which are important in the gravity modelling but are not shown in (a).
(Miller & Ripley, 1996). Hence, it is the evidence fromSynchronyanomalous horizons or sequences of rocks, which are notIsotopic dating indicates that all lobes are synchronouspredictable from normal magmatic fractionation andwithin the limits of error, and so all are justifiably regardedoccur in more than one limb, that must be examined toas part of the BC (Walraven et al., 1990). However, theydemonstrate physical connectivity. Several minera-may either be synchronous, implying simultaneous fillinglogically and/or geochemically distinct horizons, whichof all limbs of the entire intrusion, or sequential, sug-show remarkable similarity within the Eastern and West-gesting a more prolonged period of episodic em-ern limbs, can be documented. Their stratigraphic po-placement, analogous to that observed in the Duluthsitions are shown in Fig. 2.Complex (Miller & Ripley, 1996). The fact that com-
parable sequences of rock types and mineral compositionsMiddle Group Chromititesoccur in many of the limbs does not prove consanguinity
and/or physical connectivity. The principles of magmatic The transition from the CLZ to the CUZ is defined bythe appearance of cumulus plagioclase. Four chromititedifferentiation dictate that magmas of similar composition
must evolve through comparable differentiation se- layers straddle this boundary, and are collectively referredto as the Middle Group Chromitites. One occurs in thequences, regardless of their age. This feature is well
demonstrated in the Duluth Complex, where broadly footwall pyroxenite, the second occurs exactly at thecontact of pyroxenite with the lowest anorthosite layersimilar sequences of rocks are recorded from different
bodies which have discordant relations to one another and two occur slightly above (Fig. 12) this contact. These
1682
CAWTHORN AND WALRAVEN BUSHVELD COMPLEX CRYSTALLIZATION TIME
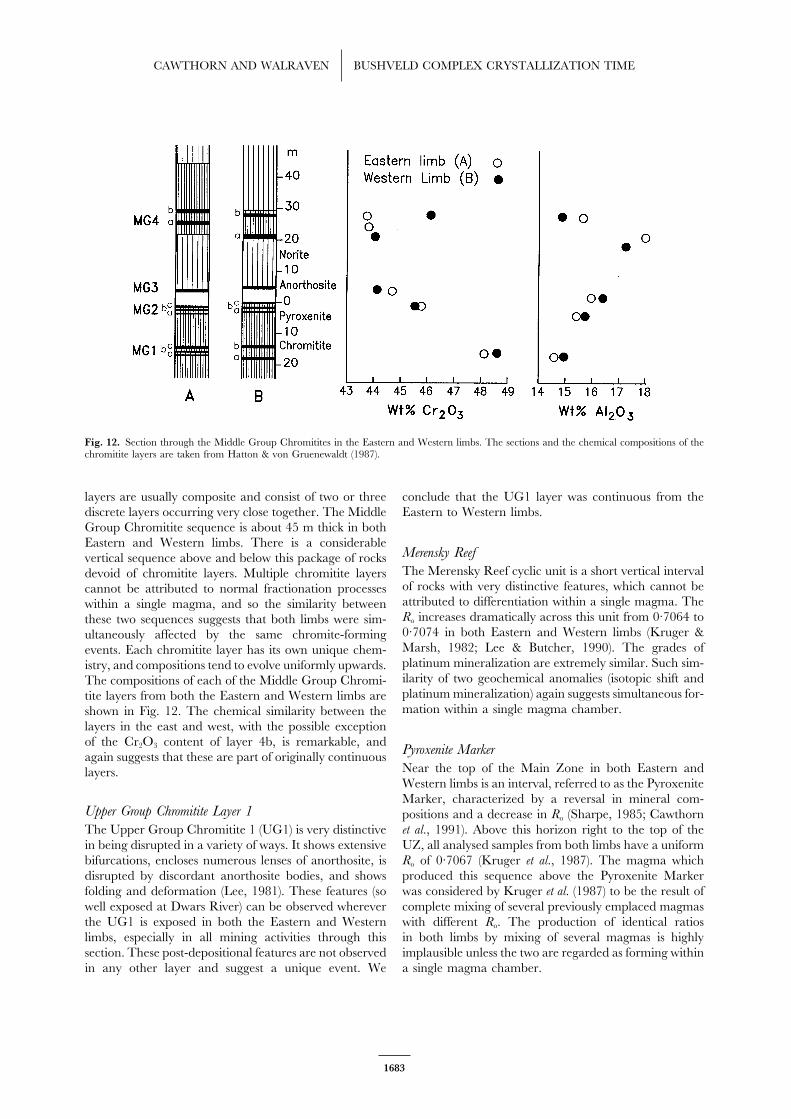
Fig. 12. Section through the Middle Group Chromitites in the Eastern and Western limbs. The sections and the chemical compositions of thechromitite layers are taken from Hatton & von Gruenewaldt (1987).
layers are usually composite and consist of two or three conclude that the UG1 layer was continuous from theEastern to Western limbs.discrete layers occurring very close together. The Middle
Group Chromitite sequence is about 45 m thick in bothEastern and Western limbs. There is a considerable
Merensky Reefvertical sequence above and below this package of rocksThe Merensky Reef cyclic unit is a short vertical intervaldevoid of chromitite layers. Multiple chromitite layersof rocks with very distinctive features, which cannot becannot be attributed to normal fractionation processesattributed to differentiation within a single magma. Thewithin a single magma, and so the similarity betweenRo increases dramatically across this unit from 0·7064 tothese two sequences suggests that both limbs were sim-0·7074 in both Eastern and Western limbs (Kruger &ultaneously affected by the same chromite-formingMarsh, 1982; Lee & Butcher, 1990). The grades ofevents. Each chromitite layer has its own unique chem-platinum mineralization are extremely similar. Such sim-istry, and compositions tend to evolve uniformly upwards.ilarity of two geochemical anomalies (isotopic shift andThe compositions of each of the Middle Group Chromi-platinum mineralization) again suggests simultaneous for-tite layers from both the Eastern and Western limbs aremation within a single magma chamber.shown in Fig. 12. The chemical similarity between the
layers in the east and west, with the possible exceptionof the Cr2O3 content of layer 4b, is remarkable, and
Pyroxenite Markeragain suggests that these are part of originally continuousNear the top of the Main Zone in both Eastern andlayers.Western limbs is an interval, referred to as the PyroxeniteMarker, characterized by a reversal in mineral com-
Upper Group Chromitite Layer 1 positions and a decrease in Ro (Sharpe, 1985; Cawthornet al., 1991). Above this horizon right to the top of theThe Upper Group Chromitite 1 (UG1) is very distinctive
in being disrupted in a variety of ways. It shows extensive UZ, all analysed samples from both limbs have a uniformRo of 0·7067 (Kruger et al., 1987). The magma whichbifurcations, encloses numerous lenses of anorthosite, is
disrupted by discordant anorthosite bodies, and shows produced this sequence above the Pyroxenite Markerwas considered by Kruger et al. (1987) to be the result offolding and deformation (Lee, 1981). These features (so
well exposed at Dwars River) can be observed wherever complete mixing of several previously emplaced magmaswith different Ro. The production of identical ratiosthe UG1 is exposed in both the Eastern and Western
limbs, especially in all mining activities through this in both limbs by mixing of several magmas is highlyimplausible unless the two are regarded as forming withinsection. These post-depositional features are not observed
in any other layer and suggest a unique event. We a single magma chamber.
1683
JOURNAL OF PETROLOGY VOLUME 39 NUMBER 9 SEPTEMBER 1998
These four sets of observations strongly support the have been as much as 740 000 to 1·2× 106 km3. As thisvolume of magma was introduced in 75 000 years, theargument that the Eastern and Western limbs wereaverage rate of addition was between 9 and 15 km3/connected (at least from the level of the Middle Groupyear.Chromitites), and that these marker horizons were ori-
ginally continuous from one limb to the other.The stratigraphic sequence in the Potgietersrus limb
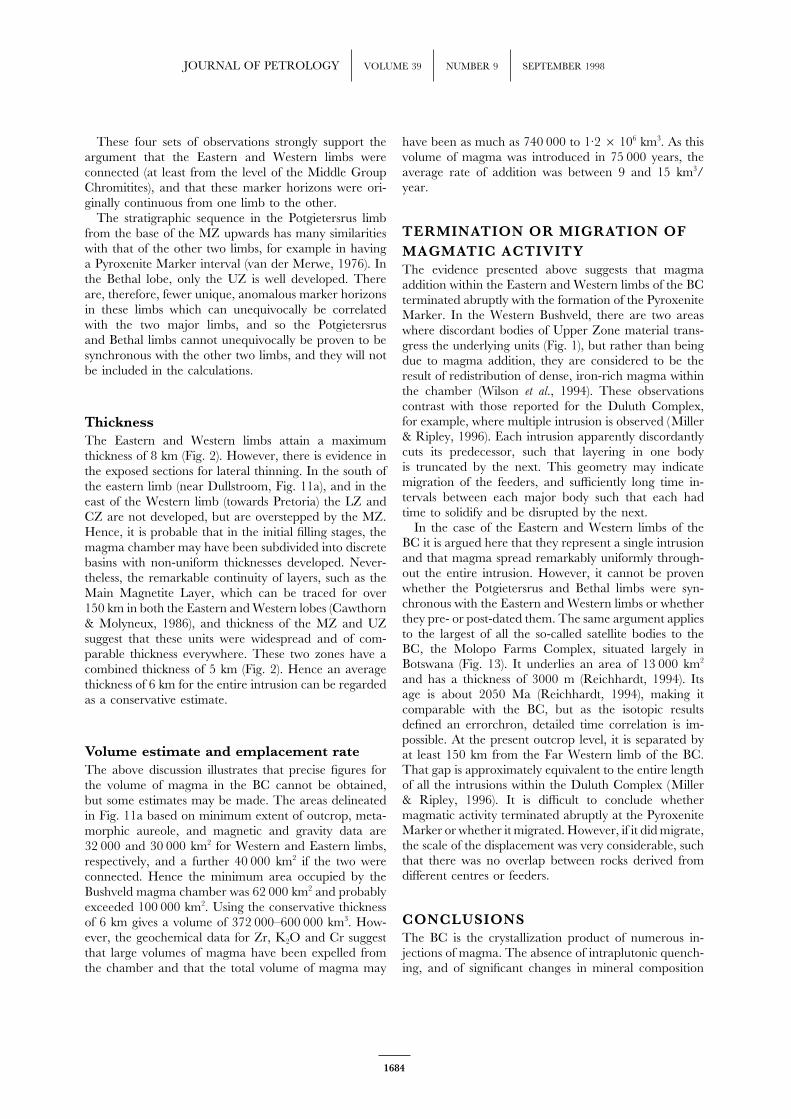
TERMINATION OR MIGRATION OFfrom the base of the MZ upwards has many similaritieswith that of the other two limbs, for example in having MAGMATIC ACTIVITYa Pyroxenite Marker interval (van der Merwe, 1976). In The evidence presented above suggests that magmathe Bethal lobe, only the UZ is well developed. There addition within the Eastern and Western limbs of the BCare, therefore, fewer unique, anomalous marker horizons terminated abruptly with the formation of the Pyroxenitein these limbs which can unequivocally be correlated Marker. In the Western Bushveld, there are two areaswith the two major limbs, and so the Potgietersrus where discordant bodies of Upper Zone material trans-and Bethal limbs cannot unequivocally be proven to be gress the underlying units (Fig. 1), but rather than beingsynchronous with the other two limbs, and they will not due to magma addition, they are considered to be thebe included in the calculations. result of redistribution of dense, iron-rich magma within
the chamber (Wilson et al., 1994). These observationscontrast with those reported for the Duluth Complex,for example, where multiple intrusion is observed (MillerThickness& Ripley, 1996). Each intrusion apparently discordantlyThe Eastern and Western limbs attain a maximumcuts its predecessor, such that layering in one bodythickness of 8 km (Fig. 2). However, there is evidence inis truncated by the next. This geometry may indicatethe exposed sections for lateral thinning. In the south ofmigration of the feeders, and sufficiently long time in-the eastern limb (near Dullstroom, Fig. 11a), and in thetervals between each major body such that each hadeast of the Western limb (towards Pretoria) the LZ andtime to solidify and be disrupted by the next.CZ are not developed, but are overstepped by the MZ.
In the case of the Eastern and Western limbs of theHence, it is probable that in the initial filling stages, theBC it is argued here that they represent a single intrusionmagma chamber may have been subdivided into discreteand that magma spread remarkably uniformly through-basins with non-uniform thicknesses developed. Never-out the entire intrusion. However, it cannot be proventheless, the remarkable continuity of layers, such as thewhether the Potgietersrus and Bethal limbs were syn-Main Magnetite Layer, which can be traced for overchronous with the Eastern and Western limbs or whether150 km in both the Eastern and Western lobes (Cawthornthey pre- or post-dated them. The same argument applies& Molyneux, 1986), and thickness of the MZ and UZto the largest of all the so-called satellite bodies to thesuggest that these units were widespread and of com-BC, the Molopo Farms Complex, situated largely inparable thickness everywhere. These two zones have aBotswana (Fig. 13). It underlies an area of 13 000 km2
combined thickness of 5 km (Fig. 2). Hence an averageand has a thickness of 3000 m (Reichhardt, 1994). Itsthickness of 6 km for the entire intrusion can be regardedage is about 2050 Ma (Reichhardt, 1994), making itas a conservative estimate.comparable with the BC, but as the isotopic resultsdefined an errorchron, detailed time correlation is im-possible. At the present outcrop level, it is separated by
Volume estimate and emplacement rate at least 150 km from the Far Western limb of the BC.That gap is approximately equivalent to the entire lengthThe above discussion illustrates that precise figures forof all the intrusions within the Duluth Complex (Millerthe volume of magma in the BC cannot be obtained,& Ripley, 1996). It is difficult to conclude whetherbut some estimates may be made. The areas delineatedmagmatic activity terminated abruptly at the Pyroxenitein Fig. 11a based on minimum extent of outcrop, meta-Marker or whether it migrated. However, if it did migrate,morphic aureole, and magnetic and gravity data arethe scale of the displacement was very considerable, such32 000 and 30 000 km2 for Western and Eastern limbs,that there was no overlap between rocks derived fromrespectively, and a further 40 000 km2 if the two weredifferent centres or feeders.connected. Hence the minimum area occupied by the
Bushveld magma chamber was 62 000 km2 and probablyexceeded 100 000 km2. Using the conservative thickness
CONCLUSIONSof 6 km gives a volume of 372 000–600 000 km3. How-ever, the geochemical data for Zr, K2O and Cr suggest The BC is the crystallization product of numerous in-that large volumes of magma have been expelled from jections of magma. The absence of intraplutonic quench-
ing, and of significant changes in mineral compositionthe chamber and that the total volume of magma may
1684
CAWTHORN AND WALRAVEN BUSHVELD COMPLEX CRYSTALLIZATION TIME
Fig. 13. Geological map showing the distribution of the Bushveld Complex and its satellites, especially the Molopo Farms Complex (Reichhardt,1994). TML, Thabazimbi–Murchison Lineament.
within cycles and short vertical sequences, suggests that Differentiation of magma produces predictable se-quences of mineral assemblages and mineral com-such injections are not widely separated in time. Using
experimental data, the changes in mineral compositions positions. However, in the Eastern and Western Bushveldthere are unique and distinct horizons which cannotcan be converted into temperatures in the magma. Hence,
the evolution of the BC can be assessed in terms of be attributed to non-unique magma differentiation, butrequire additional processes, such as magma mixing.changing magma temperature, as is shown in Fig. 8. The
thicknesses of magma involved can also be qualitatively These sequences include the Middle Group Chromitites,the Upper Group Chromitite 1, the Merensky Reef, andmodelled from a knowledge of the thickness of a particular
differentiation sequence and its changes in mineral com- the Pyroxenite Marker. Their remarkable similarity inboth the Eastern and Western limbs strongly suggestsposition, again using experimental data. From the thick-
ness of, and temperature changes in, the magma, heat that they formed simultaneously within a single magmachamber.flow models allow the time interval to be calculated. A
numerical model has been developed for studying the The volume of cumulate rocks in the Eastern andWestern limbs can be estimated. However, the extent ofcooling of magmas, which, importantly, allows for the
multiple magma addition and subtraction at any time the metamorphic aureole demonstrates that there wasoriginally a larger extent to the intrusion. Furthermore,during cooling. It also allows for accumulation of solid
rock at the base or top of the intrusion, stratification or geochemical considerations indicate an originally greatervolume of magma. The Cr budget for the formation ofmixing of magmas, the introduction of an original crustal
geothermal gradient, and removal of a melt fraction from numerous chromitite layers, up to 1 m thick, demandsfar greater volumes of magma than are now preserved.the roof.
The numerous different magma emplacement events Also, the low incompatible trace-element abundances inthe UZ suggest tapping of differentiated magma. Basedin the BC can be identified, based on reversals in mineral
compositions and sustained changes in Ro, as shown in on these considerations the volume of magma whichproduced the BC may have exceeded 1× 10⁶ km3, andFig. 2 and Table 1. The model indicates that crystal-
lization took about 200 000 years. However, the last the average rate of emplacement exceeded 9 km3/year.addition of magma took place at the level of the
Pyroxenite Marker near the top of the MZ only After the injection of magma at the Pyroxenite Marker,magmatism appears to have abruptly terminated or to75 000 years after the initiation of magmatism. These
time estimates do not differ significantly from those have jumped a distance in excess of 150 km beyond theknown limits of the BC, as there are no Bushveld rockscalculated assuming only one injection of the entire
volume of magma, but do allow for more detailed con- which cross-cut the UZ. Termination of magmatismmay therefore have been very abrupt, rather than thesideration of individual stages.
1685
JOURNAL OF PETROLOGY VOLUME 39 NUMBER 9 SEPTEMBER 1998
Eales, H. V., Marsh, J. S., Mitchell, A. A., De Klerk, W. J., Kruger,prolonged dwindling of activity as seen, for example, inF. J. & Field, M. (1986). Some geochemical constraints upon modelsthe Columbia River Basalts (Hooper, 1988).for the crystallisation of the upper Critical Zone–Main Zone interval,Northwestern Bushveld Complex. Mineralogical Magazine 50, 567–582.
Engelbrecht, J. P. (1976). Metasediments of the Pretoria Group in theEnzelberg area, Marico District. Transactions of the Geological Society ofACKNOWLEDGEMENTSSouth Africa 79, 61–75.Comments on numerous drafts of this manuscript by Ian
Hattingh, P. J. (1980). The structure of the Bushveld Complex in theCampbell, Keith Cox, Chris Hawkesworth, James Miller, Groblersdahl–Lydenburg–Belfast area of the Eastern Transvaal.Richard Price and Richard Arculus helped to clarify its Transactions of the Geological Society of South Africa 83, 125–133.assorted concepts. The Foundation for Research De- Hatton, C. J. (1995). Mantle plume origin for the Bushveld andvelopment (South Africa) is thanked for financial support Ventersdorp magmatic provinces. Journal of African Earth Sciences 21,
571–577.to R.G.C.Hatton, C. J. & von Gruenewaldt, G. (1987). The geological setting
and petrogenesis of the Bushveld chromitite layers. In: Stowe, C. W.(ed.) Evolution of Chromium Ore Fields. New York: Van Nostrand
REFERENCES Reinhold, pp. 109–143.Hooper, P. R. (1988). The Columbia River Basalt. In: Macdonald,Barnes, S. J. (1986). The distribution of chromium among or-
J. D. (ed.) Continental Flood Basalts. Dordrecht: Kluwer Academic,thopyroxene, spinel and silicate liquid at atmospheric pressure.pp. 1–33.Geochimica et Cosmochimica Acta 50, 1889–1909.
Irvine, T. N. (1970). Heat transfer during solidification of layeredBarton, E. S., Alterman, W., Williams, I. S. & Smith, C. B. (1994).U–Pb zircon age from a tuff in the Campbell Group, Griqualand intrusions. I. Sheets and sills. Canadian Journal of Earth Sciences 7,West Sequence, South Africa: implications for early Proterozoic rock 1031–1061.accumulation rates. Geology 22, 343–346. Jaeger, J. C. (1968). Cooling and solidification of igneous rocks. In:
Button, A. (1976). Stratigraphy and relations of the Bushveld floor in Hess, H. H. (ed.) Basalts. New York: Interscience, pp. 503–536.the Eastern Transvaal. Transactions of the Geological Society of South Africa Kruger, F. J. (1994). The Sr-isotopic stratigraphy of the western79, 3–12. Bushveld Complex. South African Journal of Geology 97, 393–398.
Cameron, E. N. (1978). The Lower Zone of the Eastern Bushveld Kruger, F. J. & Marsh, J. S. (1982). Significance of 87Sr/86Sr ratios inComplex in the Olifants River trough. Journal of Petrology 19, 437–462. the Merensky Cyclic Unit of the Bushveld Complex. Nature 298,
Cawthorn, R. G. (1996). Re-evaluation of magma compositions and 53–55.processes in the uppermost Critical Zone of the Bushveld Complex. Kruger, F. J., Cawthorn, R. G. & Walsh, K. L. (1987). StrontiumMineralogical Magazine 60, 131–148. isotope evidence against magma addition in the Upper Zone of the
Cawthorn, R. G. & Biggar, G. M. (1993). Crystallisation of titaniferous Bushveld Complex. Earth and Planetary Science Letters 84, 51–58.chromite, magnesian ilmenite and armalcolite in tholeiitic suites in Lee, C. A. (1981). Post-deposition structures in the Bushveld Complexthe Karoo Igneous Province. Contributions to Mineralogy and Petrology mafic sequence. Journal of the Geological Society, London 138, 327–341.114, 221–235. Lee, C. A. & Butcher, A. R. (1990). Cyclicity in the Sr-isotopic
Cawthorn, R. G. & McCarthy, T. S. (1985). Incompatible trace element stratigraphy through the Merensky and Bastard Reef Units, Atokbehaviour in the Bushveld Complex. Economic Geology 80, 1016–1026. Section, Eastern Bushveld Complex. Economic Geology 85, 877–883.
Cawthorn, R. G. & Molyneux, T. G. (1986). The vanadiferous mag- Lipin, B. R. (1993). Pressure increases, the formation of chromitenetite deposits of the Bushveld Complex. In: Anhaeusser, C.R. & seams, and the development of the Ultramafic Series in the StillwaterMaske, S. (eds) Mineral Deposits of Southern Africa. Johannesburg:
Complex, Montana. Journal of Petrology 34, 955–976.Geological Society of South Africa, pp. 1251–1266.
Marlow, A. G. & van der Merwe, M. J. (1977). The geology andCawthorn, R. G., Meyer, S. P. & Kruger, F. J. (1991). Major addition of
potential economic significance of the Malope area, north-easternmagma at the Pyroxenite Marker in the western Bushveld Complex,
Bushveld Complex. Transactions of the Geological Society of South AfricaSouth Africa. Journal of Petrology 32, 739–763.80, 117–124.Davies, G. (1980). Petrogenesis of the peripheral zone of the Rustenburg
Miller, J. D., Jr & Ripley, E. M. (1996). The layered intrusions of theLayered Suite and associated sills between Hartbeestpoort andDuluth Complex, Minnesota, USA. In: Cawthorn, R. G. (ed.) LayeredBuffelspoort dams, Western Bushveld Complex. Ph.D. Thesis, Uni-Intrusions. Amsterdam, Elsevier, pp. 257–302.versity of the Witwatersrand, 233 pp.
Mitchell, A. A. (1986). The petrology, mineralogy and geochemistryDavies, G. & Cawthorn, R. G. (1983). Mineralogical data on multipleof the Main Zone of the Bushveld Complex, at Rustenburg Platinumintrusion in the Rustenburg Layered Suite of the Bushveld Complex.Mines, Union Section. Ph.D. Thesis, Rhodes University, SouthMineralogical Magazine 48, 469–480.Africa, 122 pp.Davies, G., Cawthorn, R. G., Barton, J. M. & Morton, M. (1980).
Mitchell, A. A. (1990). The stratigraphy, petrography and mineralogyParental magma to the Bushveld Complex. Nature 287, 33–35.of the Main Zone of the Northwestern Bushveld. South African Journaldu Plessis, A. & Kleywegt, R. J. (1987). A dipping sheet model for theof Geology 93, 818–831.mafic lobes of the Bushveld Complex. South African Journal of Geology
Molyneux, T. G. (1974). A geological investigation of the Bushveld90, 1–6.Complex in Sekhukhuneland and part of the Steelpoort valley.du Plessis, C. P. & Walraven, F. (1990). The tectonic setting of theTransactions of the Geological Society of South Africa 77, 329–338.Bushveld Complex in Southern Africa, Part 1. Structural deformation
Molyneux, T. G. & Klinkert, P. S. (1978). A structural interpretationand distribution. Tectonophysics 179, 305–319.of part of the eastern mafic lobe of the Bushveld Complex and itsEales, H. V. & Cawthorn, R. G. (1996). The Bushveld Complex.surroundings. Transactions of the Geological Society of South Africa 81,In: Cawthorn, R. G. (ed.) Layered Intrusions. Amsterdam: Elsevier,
pp. 181–229. 359–368.
1686
CAWTHORN AND WALRAVEN BUSHVELD COMPLEX CRYSTALLIZATION TIME
Murck, B. W. & Campbell, I. H. (1986). The effects of temperature, van der Merwe, M. J. (1976). The layered sequence of the Potgietersrusoxygen fugacity and melt composition on the behaviour of chromium limb of the Bushveld Complex. Economic Geology 71, 1337–1351.in basic and ultrabasic melts. Geochimica et Cosmochimica Acta 50, von Gruenewaldt, G. (1970). On the phase change orthopyroxene–1871–1887. pigeonite and the resulting textures in the Main and Upper Zones
Reichhardt, F. J. (1994). The Molopo Farms Complex, Botswana: of the Bushveld Complex in the Eastern Transvaal. Geological Societyhistory, stratigraphy, petrography, petrochemistry and Ni–Cu–PGE of South Africa, Special Publication 1, 67–73.mineralization. Exploration and Mining Geology 3, 263–284. von Gruenewaldt, G. (1973a). The Main and Upper Zones of the
Sharpe, M. R. (1981). The chronology of magma influxes to the eastern Bushveld Complex in the Roossenekal area, eastern Transvaal. Southcompartment of the Bushveld Complex as exemplified by its marginal African Journal of Geology 76, 207–227.border groups. Journal of the Geological Society, London 138, 307–326. von Gruenewaldt, G. (1973b). The modified differentiation index and
Sharpe, M. R. (1985). Strontium isotope evidence for preserved density the modified crystallisation index as parameters of differentiation.stratification in the Main Zone of the Bushveld Complex. Nature Transactions of the Geological Society of South Africa 76, 53–61.316, 119–126. Wager, L. R. & Brown, G. M. (1968). Layered Igneous Rocks. Edinburgh:
South African Commission on Stratigraphy (1980). Stratigraphy of South Oliver and Boyd, 588 pp.Africa. Geological Survey of South Africa, Handbook 8. Pretoria: Geological Walraven, F. (1987). Geochronological and isotopic studies of BushveldSurvey of South Africa, p. 690.
Complex rocks from the Fairfield borehole at Moloto, northeast ofSnyder, D., Carmichael, I. S. E. & Wiebe, R. A. (1993). Experimental
Pretoria. South African Journal of Geology 90, 352–360.study of liquid evolution in an Fe-rich, layered mafic intrusion:
Walraven, F. & Darracott, B. W. (1976). Quantitative interpretationconstraints of Fe–Ti oxide precipitation on the T–fO2 and T–p pathsof a gravity profile across the Western Bushveld Complex. Transactionsof tholeiitic magmas. Contributions to Mineralogy and Petrology 113,of the Geological Society of South Africa 79, 22–26.73–86.
Walraven, F., Armstrong, R. A. & Kruger, F. J. (1990). A chrono-Tegner, C., Wilson, J. R. & Brooks, C. K. (1993). Intraplutonicstratigraphic framework for the north–central Kaapvaal Craton, thequenching in the Kap Edvard Holm layered gabbro complex, EastBushveld Complex and Vredefort structure. Tectonophysics 171,Greenland. Journal of Petrology 34, 681–710.23–48.Teigler, B. & Eales, H. V. (1996). The Lower and Critical Zones of
Wilson, J. R., Cawthorn, R. G., Kruger, F. J. & Grundvig, S. (1994). Athe western limb of the Bushveld Complex as intersected by themajor unconformity in the western Bushveld Complex: the northernNooitgedagt boreholes. Geological Survey of South Africa, Bulletin 111,‘gap’. South African Journal of Geology 97, 462–472.126 pp.
Yang, H.-J., Kinzler, R. J. & Grove, T. L. (1996). Experiments andToplis, M. J. & Carroll, M. R. (1995). An experimental study of themodels of anhydrous, basaltic olivine–plagioclase–augite saturatedinfluence of oxygen fugacity on Fe–Ti oxide stability, phase relationsmelts from 0·001 to 10 kbar. Contributions to Mineralogy and Petrologyand mineral–melt equilibria in ferro-basaltic systems. Journal of
Petrology 36, 1137–1170. 124, 1–18.
1687
Related Documents