Intelligent Data Analysis 14 (2010) 265–281 265 DOI 10.3233/IDA-2010-0421 IOS Press Empirical evaluation of feature selection methods in classification Luka ˇ Cehovin ∗ and Zoran Bosni´ c Faculty of Computer and Information Science, University of Ljubljana, Ljubljana, Slovenia Abstract. In the paper, we present an empirical evaluation of five feature selection methods: ReliefF, random forest feature selector, sequential forward selection, sequential backward selection, and Gini index. Among the evaluated methods, the random forest feature selector has not yet been widely compared to the other methods. In our evaluation, we test how the implemented feature selection can affect (i.e. improve) the accuracy of six different classifiers by performing feature selection. The results show that ReliefF and random forest enabled the classifiers to achieve the highest increase in classification accuracy on the average while reducing the number of unnecessary attributes. The achieved conclusions can advise the machine learning users which classifier and feature selection method to use to optimize the classification accuracy, which may be important especially in risk-sensitive applications of Machine Learning (e.g. medicine, business decisions, control applications) as well as in the aim to reduce costs of collecting, processing and storage of unnecessary data. Keywords: Feature selection, ReliefF, random forest feature selector, sequential forward selection, sequential backward selection, Gini index 1. Introduction Feature selection represents a significant research area in the fields of data mining and machine learning. Quite often data sets contain a large number of features with different qualities, which can influence the performance of the entire learning framework. Namely, noisy features of bad quality can decrease the classifier’s performance. Nevertheless, if the performance does not decrease, the costs of collecting, processing and storage of the features, which do not yield to the learning process and consume unnecessary resources, are unnecessary and may be expensive. Although the problem of measuring information gains of each feature with respect to the target class poses itself as simple, selecting good features represents a difficult problem in practice. Namely, although an individual feature can show no correlation to a class, the dependency may become strong when the feature is interacted with other features. To find a best subset of n features in an arbitrary data set we would therefore have to evaluate all possible 2 n subsets, which can, however, become computationally expensive even for a reasonably small n. This challenge therefore called for different heuristic-based methods to be applied to this problem, which are focused on searching only a part of this large space and finding an approximate solution. Suppose we are given a typical problem in which we aim at optimizing a performance of a particular classifier by removing a number of features of which presence hinders the classification accuracy. A ∗ Corresponding author: Luka ˇ Cehovin, Faculty of Computer and Information Science, University of Ljubljana, Trˇ zaˇ ska 25, Ljubljana, Slovenia. Tel.: +386 1 4768189; E-mail: [email protected]. 1088-467X/10/$27.50 2010 – IOS Press and the authors. All rights reserved

Welcome message from author
This document is posted to help you gain knowledge. Please leave a comment to let me know what you think about it! Share it to your friends and learn new things together.
Transcript
Intelligent Data Analysis 14 (2010) 265–281 265DOI 10.3233/IDA-2010-0421IOS Press
Empirical evaluation of feature selectionmethods in classification
Luka Cehovin∗ and Zoran BosnicFaculty of Computer and Information Science, University of Ljubljana, Ljubljana, Slovenia
Abstract. In the paper, we present an empirical evaluation of five feature selection methods: ReliefF, random forest featureselector, sequential forward selection, sequential backward selection, and Gini index. Among the evaluated methods, the randomforest feature selector has not yet been widely compared to the other methods. In our evaluation, we test how the implementedfeature selection can affect (i.e. improve) the accuracy of six different classifiers by performing feature selection. The resultsshow that ReliefF and random forest enabled the classifiers to achieve the highest increase in classification accuracy on theaverage while reducing the number of unnecessary attributes. The achieved conclusions can advise the machine learning userswhich classifier and feature selection method to use to optimize the classification accuracy, which may be important especiallyin risk-sensitive applications of Machine Learning (e.g. medicine, business decisions, control applications) as well as in theaim to reduce costs of collecting, processing and storage of unnecessary data.
Keywords: Feature selection, ReliefF, random forest feature selector, sequential forward selection, sequential backward selection,Gini index
1. Introduction
Feature selection represents a significant research area in the fields of data mining and machinelearning. Quite often data sets contain a large number of features with different qualities, which caninfluence the performance of the entire learning framework. Namely, noisy features of bad qualitycan decrease the classifier’s performance. Nevertheless, if the performance does not decrease, thecosts of collecting, processing and storage of the features, which do not yield to the learning processand consume unnecessary resources, are unnecessary and may be expensive. Although the problemof measuring information gains of each feature with respect to the target class poses itself as simple,selecting good features represents a difficult problem in practice. Namely, although an individual featurecan show no correlation to a class, the dependency may become strong when the feature is interactedwith other features. To find a best subset of n features in an arbitrary data set we would therefore haveto evaluate all possible 2n subsets, which can, however, become computationally expensive even for areasonably small n. This challenge therefore called for different heuristic-based methods to be applied tothis problem, which are focused on searching only a part of this large space and finding an approximatesolution.
Suppose we are given a typical problem in which we aim at optimizing a performance of a particularclassifier by removing a number of features of which presence hinders the classification accuracy. A
∗Corresponding author: Luka Cehovin, Faculty of Computer and Information Science, University of Ljubljana, Trzaska 25,Ljubljana, Slovenia. Tel.: +386 1 4768189; E-mail: [email protected].
1088-467X/10/$27.50 2010 – IOS Press and the authors. All rights reserved

266 L. Cehovin and Z. Bosnic / Empirical evaluation of feature selection methods in classification
typical approach to this task could be by computing weights for the available features and select onlythose with weight above a particular threshold. However, such a procedure would require the knowledgeof which values are appropriate to be used as the thresholds to avoid either disregarding too many relevantfeatures or considering too many irrelevant ones. In addition, the optimality of a chosen feature subsetmay be valid for one classification algorithm and not for the other, which means that the optimal thresholdmay vary from the classifier to classifier.
In this paper, we experiment with an alternative approach, which iteratively removes one by one featureof the worst estimated quality. In each iteration it utilizes a particular classifier model, which thereforeplays an active role in the procedure, to compute its accuracy. After performing all iterations, we choosea feature set, which enables the classifier to achieve its maximum classification accuracy on the trainingdata. In our evaluation, we focus on discovering which feature selection method is the most successful,i.e. can enable the classifier to achieve its highest accuracy by removing the highest number of irrelevantfeatures.
Note, that the computational cost of iteratively removing one feature at a time is higher than the costof removing multiple features in one step at once. However, the latter approach has a disadvantage thatit requires defining a threshold for the attributes’ quality or other target criteria for the feature selectionprocess. In this work we wish to avoid such additional parameters and focus on iteratively removing onefeature at a time, following the success of the procedure by observing the accuracy of the used classifier.
In our experimental part, we present an empirical evaluation of five different methods for the featureselection: ReliefF, random forest feature selector, sequential forward selection, sequential backwardselection, and Gini index. Among these feature selection methods, comparison of random forest featureselection to other approaches presents a novelty, since practically no such empirical comparisons havebeen performed in the related work yet. Based on the results, we rank the evaluated methods accordingto that criteria which indicates their potential for the blind usage in practice, when little is known aboutthe problem domain and appropriate feature quality thresholds. In our experimental work we make andtest the hypothesis that the random forest feature selector on average outperforms other feature selectionmethods. We base this hypothesis on an expectation that the random forest performs as well in featureselection as it performs well as classifier.
The paper is organized as follows. A brief overview of similar publications and the related work isgiven in Section 2. Methods of feature selection, used in this paper, are described in Section 3. Thetesting environment, evaluation procedure and experimental results are described in Section 4, followedby Section 5 in which we conclude the paper with some general reflection and ideas for our further work.
2. Related work
In the broader context, feature selection, as well as feature transformation, is in fact a dimensionalityreduction approach. Methods for feature selection can be categorized into two classes. The first classconsists of methods which return a quality estimate for each feature and the second class consists ofmethods that aim at selecting a subset of good quality features. Despite that the former can always betransformed to the latter by selecting only features above pre-defined threshold value, the transformationin the other direction is not always possible.
The feature selection methods can be also divided to filters, wrappers and embedded methods [5,13].The first are defined as the estimation functions and used as a preprocessing step to estimate quality ofgiven features. Wrapper methods explore feature quality by moving through a feature subset space andobserving impact of selected feature set to a particular classification method which therefore acts as a

L. Cehovin and Z. Bosnic / Empirical evaluation of feature selection methods in classification 267
black box (frequently used wrapped classifiers are k nearest neighbors, decision trees, support vectormachines etc.) Third group, the embedded methods, are an integral part of particular learning algorithms(e.g. boosting, random forests) and are derived from the properties of the underlying learning algorithm.
In the related work, many categorizations and comparisons of the feature selection methods havealready been performed. Published research in this field focuses mostly on the development of new featureselection methods, theoretical and empirical comparisons of feature selection approaches and practicalapplications of such methods. In this section we present this related work, categorized according to theirmain contributions. In the following Section 3, we briefly describe the feature selection approaches, onwhich we focus in this paper.
2.1. Comparisons of feature selection methods
The majority of research publications in this area is focused mostly on the wrapper methods. E.g., Ferriet al. [11] compare wrapper methods, sequential forward selection (SFS), sequential floating forwardselection (SFFS) and genetic algorithms (GA) for high dimensional feature selection. Their goal wasto determine how the properties of the evaluated methods change when presented with a problems ofvarious difficulty magnitudes. According to their research, the SFFS method gives good results even forhigh dimensional problems. GA approach performs better in some cases, but due to its stochastic naturethe results may be in some cases worse. This motivated the authors to construct a composite featureselection method, which combines the best aspects of both methods.
Similarly, Hall and Holmes [15] compared the information gain, ReliefF, PCA, correlation-basedfeature selection, consistency-based feature evaluation and a modified SFS algorithm, when used withC4.5 and Naive Bayes classifiers. Authors make a general conclusion that the feature selection isbeneficial for boosting the performance of the learning algorithms. They also notice that there is nosingle algorithm that would perform best in all situations. Similar findings are presented by Kudoand Sklansky [23] who compare a wider set of feature selection methods among which we find SFS,SFFS, sequential backward selection (SBS) and GA with the focus on the medium and large scaleproblems. They conclude that each method has its advantages/problems and propose a unified way ofcomparing a variety of feature selection methods. The same authors [24] later also compared two typesof classifier-independent feature selection methods and proposed a two-stage feature selection. The latterhas an advantage of having the performance boost due to more complex feature evaluations that can beemployed in the second stage.
John et al. [19] explore the formal definition of feature relevance and perform several experimentswith wrapper feature selection methods and a variation of ReliefF filter feature selection method. Oneof their conclusions is that the wrapper methods are superior to the filter selection methods because theyuse a separate evaluation function whose bias can differ from the classifier used to evaluate the final set.
2.2. Surveys of the feature selection fields
With the aim to provide a field survey, Blum and Langley [5] reviewed the feature selection algorithms,focusing on the two key issues: the problem of relevant features selection and the problem of relevantexamples selection. Focusing mostly on the wrapper methods, Kohavi and John [20] similarly exploredthe relation between optimal feature subset selection and the relevance of individual features. They pointout two problems of present with the wrapper methods: overfitting and high computational overhead.
Besides performing an extensive review of the feature selection method, Dash and Liu [9] also sys-tematically described the steps to performing the feature selection (subset generation, subset evaluation,

268 L. Cehovin and Z. Bosnic / Empirical evaluation of feature selection methods in classification
stopping criterion, validation), categorized and theoretically evaluated the advantages and disadvantagesof specific methods. In one of the recent papers, Liu and Yu [27] provided a survey of the existing featureselection methods for classification and clustering. They proposed a categorization framework for thefeature selection methods based on various characteristics of the methods that reveals not yet attemptedcombinations and provides guidelines for selecting the optimal feature selection method for certain task.
One of the fundamental works in the area of feature selection is the work of Liu and Motoda [26]which introduces the basic concepts and principles, state-of-the-art algorithms, and novel applicationsof this tool.
2.3. Practical applications
Most of the related work focuses on a specific domain and on an application of the feature selectionmethods within that domain. Examples of such applications are:
– In text classification, where one of the main problems is the high feature space dimensionality, Yangand Pedersen [32] evaluate myopic metrics such as document frequency, information gain, mutualinformation and χ2 estimate. Their findings suggest that information gain and χ2 estimate havethe most favorable performance and that they are the most aggressive in terms of feature removalwithout losing accuracy of the final prediction.
– In automatic music classification, Grimaldi et al. [12] have compared feature quality metrics such asinformation gain (IG), gain ratio (GR) and PCA (Principle Component Analysis) algorithm. Theyconclude that PCA performs better than IG and GR using the k nearest neighbors classifier as abenchmark measure.
– In a medical domain, Liu et al. [25] present a comparative study of six feature selection methodsbased on entropy, correlation and χ2 and t statistics. They compare classification performancesof two classifiers: (1) classifier built using 20 randomly selected features from the original datasetand (2) classifiers built using features selected by various feature selection methods. The authorsconclude that the performance is much higher in cases when the feature selection methods are used.They also evaluate how frequently the features are selected by different feature selection methodsand conclude that the most of the discriminatory features are identified by all methods.
– Aha and Bankert [1,2] evaluate filter and wrapper feature selection methods for a cloud classificationtask from high level features. Their conclusions are that feature selection improves accuracy in theirtarget domain, that SBS does not always outperform SFS and that the beam search extensions ofwrapper feature selection methods can indeed improve the accuracy of the result.
– Jain and Zongker [17] evaluated several wrapper methods in selecting the optimal set of features forthe satellite images classification, showing that SFFS achieves the best performance.
– Sayes et al. [30] provide an overview of the appropriate feature selection and feature extractionmethods to be used in the field of bioinformatics, where the problems of high dimensionalityand small number of examples frequently appear in practice. They conclude that, even thoughunivariate feature selection methods seem to be predominantly used in this domain, multivariatefeature selection methods are also becoming recognized as a promising line of future work.
– Jeffery et al. [18] present a comparison study of feature selection methods applied to the problemof identification of differentially expressed genes in microarray data. The authors report betterperformance results of the most feature selection methods with datasets that had low levels of noiseand large number of examples.

L. Cehovin and Z. Bosnic / Empirical evaluation of feature selection methods in classification 269
In the past, several competitions and challenges in the field of feature selections were organized topromote research and creation of novel algorithms, as well. One of such events was the NIPS 2003Feature Selection Challenge [14], of which goal was to create an optimal feature selection method forthe five given problems.
While most of the previous observations confirm that there is indeed no universally optimal featureselection method that would be generically applicable, have reasonable computational demands and givethe best subset of features for a given task, there is nevertheless a need for evaluation of feature selectionmethods. From such tests, we can learn about their strengths and weaknesses, when to use a certainmethod and what do we have to keep in mind when using it.
Despite that there exists a wide range of feature selection methods, some of which are intended to beapplied in very specialized problem areas (e.g. gene analysis [18]), in our work we focused on generalmethods, which are widely used in machine learning [3,22]. In the following section, we provide thedescription of the methods evaluated in our work.
3. Evaluated feature selection methods
As noted from the previous section, a significant part of the related work was focused on the com-parisons and empirical evaluation of various feature selection methods. However, very little work wasperformed in analyzing the random forest feature evaluator and performing its comparisons with otherstandard methods. In this paper we therefore focus on comparing the following five methods for featureselection: ReliefF, random forest, sequential backward selection, sequential forward selection and Giniindex. In the next subsections, we provide the summarized descriptions of these methods.
3.1. ReliefF
The ReliefF [21] method for feature selection in classification problems is an extension of the basicRelief algorithm which works only with the two-class problems to the multiple-class problems. ReliefFalgorithm aims at estimating the quality of features according to how well their values separate theinstances according to their distance in the problem space [29]. Given a randomly selected instances, thealgorithm searches for the k nearest neighbors from the same class and k nearest neighbors from each ofthe other possible classes. Based on which class do the neighbors belong to, the algorithm updates thefeature quality information by increasing its value if the feature separates instances with different classeswell and by decreasing its value in the opposite scenario. The process of random instance selection isrepeated for several times, where the number of iterations is pre-chosen by the user. The main propertyof the ReliefF algorithm is that the quality estimation of a single feature implicitly depends on the contextof other features, meaning that the method detects their interaction as well [22]. The pseudocode of thedescribed algorithm is given below as Algorithm 1.
3.2. Random forest
Random forest [6] is generally recognized as a classifier. However, due to its capability to estimate theimportance of the features, it can also be applied as a feature quality estimator and selector (by applyinga threshold to the feature quality estimates).
Random forest classifier works by building a set of decision trees where a single tree node growingis done using a limited set of randomly chosen features. Since it includes many trees, this set is called

270 L. Cehovin and Z. Bosnic / Empirical evaluation of feature selection methods in classification
Algorithm 1 Pseudocode of the ReliefF algorithmRequire: {I1 . . . In} – dataset of n examples comprised of a features.
Each example belongs to one of c classes.m – number of examples to be selected by the algorithmpc – prior probability distribution of classes in the datasetk – number of neighbors from each class to be selected by the algorithmWj := 0, j ∈ [1 . . . a] – weights of the individual attributesdiff(a, Ii, Ij) – difference between values of the attribute a between Ii and Ij
1: for l := 1 . . . m do2: Ir := randomly selected example from {I1 . . . In}3: cIr – class of the selected example4: for t := 1 . . . c do5: Mt = k closest examples from class t6: for h := 1 . . . a do7: for IM ∈Mt do8: if cIr = t then Wh = Wh − diff(h,Ir,IM )
mk//decrease feature weight
9: if cIr �= t then Wh = Wh + pt1−pt
diff(h,Ir,IM )mk
//increase feature weight10: end for11: end for12: end for13: end for
Fig. 1. An example of dataset modification for random forest feature quality estimation. The figure illustrates randomlypermuting values of the attribute vj in the original dataset (left) to obtain a modified dataset (right).
a forest. Typically, the number of considered features is �loga� + 1 where a represents the size initialset of features, and the typical size of the forest includes 100 trees. When classifying an example, eachtree returns its decision as a vote and an overall decision is determined by aggregating votes (averaging,considering the majority decision).
The idea of using random forest for feature quality estimation is based on the difference betweenclassifier performance on the original data set and the performance on the modified data set in which thealgorithm randomly permutes values of the observed feature between examples (see an example of thismodification in Fig. 1). By measuring the performance before and after the described modification foreach tree in the forest, the algorithm combines these differences into an importance estimate.
Given a difference of the performance for tree i, denoted by di we compute the final importanceestimate for the feature Aj as I(Aj) =
∑di/(n × SEdi
), where SEdidenotes the standard error of di
considering all trees (SEdi= SDdi
/√
n), n denotes the number of elements in the dataset and SDdi
denotes the example standard deviation of di.
3.3. Sequential backward selection (SBS)
Sequential backward selection (also called backward elimination) belongs to the group of the wrappermethods [19]. The term wrapper means that the method utilizes a particular learning method to evaluate

L. Cehovin and Z. Bosnic / Empirical evaluation of feature selection methods in classification 271
Fig. 2. Illustration of two steps of SBS subset selection algorithm. The algorithm starts with all a features and sequentiallyremoves a single feature and tests the performance of this modified dataset using a wrapped classifier. Feature, which removalincreases the accuracy the most (or decreases it the least) is added to the set and the process is repeated by attempting to removeanother feature from the a− 1 remaining ones.
possible feature subsets based on the performance results of that particular learner (the model is thereforeused as a parameter of the approach).
The SBS method performs a greedy space searching technique. Starting by measuring performance onthe original (unchanged) data set it proceeds by measuring the classification performance using classifierswhich are induced on the data sets in which a single feature was omitted. Finally, the least significantfeature is detected as the one which caused the lowest drop or the highest gain in the classifier’sperformance. This feature is afterwards omitted from the data set and the procedure is recursivelyrepeated until the minimal required number of features remains or a certain stopping criteria is reached.This principle is illustrated in Fig. 2.
In our experiments, we selected the decision trees to be used as the wrapped method and estimated itsperformance using 10-fold cross-validation.
3.4. Sequential forward selection (SFS)
The main difference between sequential forward selection (SFS) and SBS method is the direction ofsearch [19]. In contrast to SBS, SFS starts with an empty data set and proceeds by expanding the dataset with the feature, of which addition to the data set boosts the wrapped model performance most. SeeFig. 3 for an illustration of the principle. The algorithm adds features in such manner recursively untilthe stopping criteria is met (e.g. when any of the available features fail to boost the model performanceabove a certain threshold level). Measurements have shown that SBS in general performs better thanSFS, since SBS is more sensitive to correlated features [1].
In our work, we use the decision trees as a wrapped method and estimated its performance using10-fold cross-validation.

272 L. Cehovin and Z. Bosnic / Empirical evaluation of feature selection methods in classification
Fig. 3. Illustration of the two steps comprising the SFS subset selection algorithm. The algorithm starts with no features andsequentially adds a single feature from a available features. After testing the classifier performance, resulting by adding eachavailable feature, it finally select the feature of which inclusion increases the accuracy the most. This feature is afterwardsadded to the set and is carried into the next iterations. The process is repeated by attempting to add another feature from thea− 1 remaining ones, until the chosen stopping criterion is met.
3.5. Gini index
Gini index [7] is a feature selection method, which observes the decrease of impurity yielded by the useof a particular feature. Measuring the magnitude of feature-class correlation, it is known to be myopicin terms of not considering other features when evaluating a certain feature. When evaluating featureswith strong correlation, its results may be misleading, since it can assign a very low scores to a subset offeatures that only give a good prediction when combined together. However, due to its low computationalrequirements, Gini index is frequently used for estimating feature quality in high dimensional domains,where the number of features incurs less manageable computational complexity of the more powerfulfeature selection methods.
Gini index is derived from the decrease of impurity where a prior and posterior impurity estimationis approximated using the Gini coefficient (this coefficient is defined using a sum of squared classprobabilities). Gini index for a feature A is defined as:
Gini(A) =∑
j
p · j∑
k
p2k|j −
∑
k
p2k·, (1)
where p·j denotes the probability that feature A takes value j, pk|j probability that a random examplefrom the dataset belongs to class k, its feature A having value j. Symbol pk� denotes the probability thata random example from the dataset belongs to class k.
Gini index is known for estimating the feature quality well for the discrete features. When estimatingthe numerical features, one must first discretize them. Applying Gini index directly to a numericalfeature may result in overestimating their quality.

L. Cehovin and Z. Bosnic / Empirical evaluation of feature selection methods in classification 273
Table 1Basic characteristics of the testing data sets
Data set # instances # classes # num. feat. # cat. feat.sonar 208 2 60 0spambase 4601 2 57 0SPECTF 267 2 44 0ionosphere 351 2 34 0wdbc 569 2 30 0flags 194 8 10 18German 1000 2 7 13credit 690 2 6 9monk1 556 2 0 7monk2 601 2 0 7monk3 554 2 0 7wine 178 3 13 0yeast 1484 10 8 0chess 3196 2 0 36hepatitis 155 2 6 13lung-cancer 32 3 56 0glass 214 6 10 0dermatology 366 6 33 1F1 200 2 10 0F2 200 2 10 0
4. Experimental results
4.1. Testing environment
We performed testing using 20 benchmark data sets, which are briefly described in Table 1. Themajority of the data sets listed in the table was acquired from the publicly accessible UCI MachineLearning Repository [4], some of them are artificial.
4.1.1. Data pre-processingSince some of the evaluated learning methods (neural networks, k nearest neighbors and support vector
machines) cannot handle discrete features, the data was preprocessed by transforming each discretefeature into a set of binary features: each discrete feature A with the set of values {v0, v1 . . . , vn} wastransformed to n numerical binary features A1, . . . , An, where Ai = 1 (and Aj = 0 for j = 1, . . . , n; j =i) denotes that the value of the original feature was A = vi (Ai = 0 for i = 1, . . . , n denotes that A = v0).
Some data sets also included missing values. We preprocessed these data sets by replacing missingvalues of numerical features with the mean feature value and the missing values of discrete feature withthe most frequent feature value.
4.2. Feature selection and learning algorithms
In our experimental work, we evaluated the performance of five feature selection methods (see Sec-tion 3) when used in conjunction with six classification algorithms. We implemented our experimentsusing statistical package R [16]. The following implementations of the feature selection methods wereused:
– ReliefF: An implementation of the function relief in R in the package dprep. The chosenparameters were: the number of repetitions was 10, number of randomly selected examples was1000 and the threshold was 0.01.

274 L. Cehovin and Z. Bosnic / Empirical evaluation of feature selection methods in classification
– Random forest: Implementation from the randomForest library, used with default parameters(500 trees in a forest). The parameter importance was set to true in order for the function tocompute the importance weights of the features.
– SFS: A custom implementation of the SFS algorithm was used, based on the function sfs1 fromthe package dprep which performs a single forward selection step. We used the decision trees asthe wrapped learning algorithm.
– SBF: A custom implementation of the SBS algorithm was used, based on the function sbs1 fromthe package dprep to perform a single backward selection step. We used the decision tree as thewrapped learning algorithm.
– Gini index: A custom implementation of Gini Index [7] defined as the classical impurity measurewas used, with no special parameters. Numerical features were discretized using the minimumentropy criterion with the minimum description length (MDL) as a stopping rule.
We evaluated the above feature selection methods when used with the following classifiers:
– Decision trees [7]: implementation from the package for recursive partitioning rpart was used,information gain was used as the splitting criterion, the trees were unpruned,
– Random forest [6]: implementation from the R package randomForest was used. The numberof trees in a forest was set to 500.
– Support Vector Machines [31]: a LIBSVM [8] implementation from the R package e1071 wasused. SVM algorithms were used for C-classification with a radial basis function (RBF) kernel, thecost parameter was set to C = 1 and the kernel parameter to γ = 1/f where f is the number offeatures in the data set.
– Artificial neural networks [28]: three-layered perceptron from package nnetwith n = √f × c�neurons in the hidden layer (f is the number of features and c is the number of classes).
– Naive Bayes: implementation from the R package e1071 was used, no explicit parameters.– k nearest neighbors: algorithm from the package class with number of neighbors set to k = 3.
4.3. Experimental evaluation and results
The goal of our experimental evaluation was to rank the feature selection methods by their effectiveness,which we measure by how the removal of poor quality features (as estimated differently by each particularfeature selection method) influences the performance of various classifiers. The testing was performediteratively by estimating the quality of the features, at each step removing the feature of the worstestimated quality, and re-computing the classifiers’ performance on the reduced data set using the 10-fold cross validation. For each experiment, we recorded the highest classification accuracy in this featureremoval sequence along with the accompanying number of features.
To achieve the unbiasedness of the testing, we separated 20% of randomly selected examples fromthe original data set as the final testing examples, prior to performing the above search for the bestperforming set of features on the remaining 80% of the examples. These independent examples wereused to evaluate the performance of the classifier on the reduced feature set, which was also the finalresult for the evaluated classifier/feature selector/domain combination. In this way, the testing data wasseparated from the feature set selection algorithm, making the result less biased according to the usedclassifier algorithms. Note that it was not feasible to evaluate the final classification accuracy using thecross-validation approach, since the best performing set of features in each training fold may be different.Measuring the performance on the multiple subsets would therefore make our final result unclear. Thistesting procedure is shown as the pseudocode in Fig. 2.

L. Cehovin and Z. Bosnic / Empirical evaluation of feature selection methods in classification 275
A change in the classification accuracy was afterwards statistically evaluated to conclude whetherthe change in the classifier’s performance was statistically significant. For the evaluation of the changein the accuracies McNemar’s nonparametric statistical test was used which allows comparing binomialoutcomes (prediction for an example is the same / prediction has changed) between two paired groupsof examples. Using the McNemar’s test we test the null hypothesis that the classification accuracy hasnot changed against the alternative hypothesis that the compared accuracies are significantly different.The changes with significance level α � 0.05 were considered as significant.
Algorithm 2 Pseudocode of the testing procedure1: DS – set of datasets2: FS – set of feature selection methods3: CS – set of classifiers4: for each DSi from DS do5: DSv
i ← 20% DSi – randomly sampled testing dataset6: DSt
i ← 80% DSi – remaining examples from the dataset7: for each CSk from CS do8: for each FSj from FS do9: Perf← measure performance of CSk on DSt
i
10: for 1 to number of features(DSi) do11: W← FSj(DSt
i ) – compute quality estimates for features in DSti using FSj
12: w← argmin W13: DSt
i ← DSti without feature w
14: PerfTemp← performance of CSk on data set DSti
15: if PerfTemp > Perf then16: Perf← PerfTemp17: FeatSet← features of(DSt
i )18: end if19: end for20: ValPerf← measure performance of CSk on DSv
i (FeatSet)21: RESULT(DSi, CSk, FSj)← (ValPerf, |FeatSet|)22: end for23: end for24: end for
The summarized results are shown in Table 2 and the detailed results in Table 5 in the Appendix. Byanalyzing the average achieved results of individual feature selection methods (which were altogethertested in 120 experiments = 20 domains × 6 classifiers) we can see that the ReliefF performed best interms of the highest number of experiments with the significant increase of the classification accuracy(22 experiments) and the lowest number of experiments with the significant decrease of the accuracy (3experiments). These results are followed by the performance of random forest feature selector (increaseof the accuracy in 21 experiments and decrease in 6 experiments). Gini index performed the worst withonly 13 experiments with the increase of classification accuracy and 27 of experiments with the decreaseof classification accuracy. We can also see that random forest feature selector achieved its results bykeeping the lowest average percentage of original features (48%).
The results, averaged for each of the tested classifiers in the summary row at the bottom of the table(each classifier was tested in 100 experiments = 20 domains × 5 feature selection methods), show thatthe accuracies of kNN and Neural network classifier were improved the most by feature selection in ourevaluation procedure. Using the former, significant increase in classification accuracy was achieved in30 experiments, and using the latter in 25 experiments. The results for these two classifiers also show thatthe significant increases of classification accuracy were achieved by reducing the unnecessary features

276 L. Cehovin and Z. Bosnic / Empirical evaluation of feature selection methods in classification
Table 2The summarized results for combinations of tested feature selection methods (rows) and classifier algorithms(columns). The data in the table cells is shown as the triplet in form +/− /A, where + denotes the numberof experiments (domains) in which the classification accuracy significantly increased and − denotes thenumber of experiments in which the classification accuracy significantly decreased. The last component Adenotes the average percentage of the features (averaged across all testing domains) that remained in thedomain at the point when the highest significant improvement of the accuracy was achieved
Decision Random SVM kNN Naive Neural AVERAGEtree forest Bayes network
+/− /A +/− /A +/− /A +/− /A +/− /A +/− /A +/− /AReliefF 2/2/52 0/0/74 4/0/60 8/1/60 2/0/57 6/0/61 22/3/61Random forest 1/1/36 1/0/59 2/1/62 7/0/43 6/1/46 4/3/44 21/6/48SBS 1/3/58 1/3/73 2/3/61 5/1/52 3/2/56 6/2/51 18/14/59SFS 1/2/58 1/2/80 1/1/66 5/0/57 4/0/59 5/1/61 17/6/64Gini index 2/6/87 0/4/78 1/3/76 5/4/78 1/5/65 4/5/70 13/27/76
AVERAGE 7/14/58 3/9/73 10/8/65 30/6/58 16/8/57 25/11/57
the most (on average, 58% of features remained in the experiments in which kNN was used, and 57%remained in the experiments in which Neural network was used).
By analyzing the individual results, we can see that the best testing performance was achieved byusing ReliefF as the feature selector for the kNN classifier (classification accuracy increased in 8(out of 20) experiments, the highest accuracy was achieved by keeping 60% of features on the average).This may come as expected since both, ReliefF and kNN, are locality-based methods (ReliefF estimatesreward such features which better optimize local learning, which therefore gives an advantage to the kNNlearner). These results were followed by the kNN/random forest combination (classification accuracyincreased in 7 experiments, 43% of the features remained on the average).
It is interesting to note, that on the average with both, feature selection methods and the classifiers,the best classification accuracies were mostly achieved by reducing the number of the features the most.This could be interpreted that some of the feature selection methods (i.e. ReliefF and random forest)are in fact more successful than the others since they better differentiate better and worse features.In our experiments, this enabled the classifiers to achieve higher classification accuracy by iterativelydisregarding the features of the lowest estimated quality.
4.4. Statistical evaluation
In the introduction we stated the hypothesis that the random forest feature selector on average out-performs other feature selection methods. We based this hypothesis on an expectation that the randomforest performs as well in feature selection as it performs well as a classifier. To test this hypothesis andevaluate other statistical differences in performance of tested classifiers and feature selection methods atthe same time, we performed the Friedman statistical test and post-hoc Nemenyi tests on the achievedsummarized results [10].
We presented the results in Table 2 using the two different criteria: (1) the achieved classifier’sperformance and (2) the number of the remaining attributes in the best performing dataset. Note, thatboth of these goals may be conflicting and may not be possible to optimize simultaneously. To considerand evaluate success of both goals, one could in practice combine them into a joint performance measure,assigning importance weights to each of the goals. However, since the classifiers are generally evaluatedby their accuracies, we focus only on analyzing the success of that goal and leave the data about the

L. Cehovin and Z. Bosnic / Empirical evaluation of feature selection methods in classification 277
Table 3P-values of the Nemenyi test for testing the equalities in performance scoreof the feature selection methods (symmetric table). Significant p-values(< 0.05) are denoted by the boldface
ReliefF Random forest SBS SFS Gini indexReliefF 0.999 0.608 0.943 0.016Random forest 0.999 0.732 0.980 0.035SBS 0.608 0.732 0.965 0.586SFS 0.943 0.980 0.965 0.187Gini index 0.016 0.035 0.586 0.187
Table 4P-values of the Nemenyi test for testing the equalities in performance score of theclassifiers (symmetric table). Significant p-values (< 0.05) are denoted by theboldface
Decision Random SVM kNN Naive Neuraltree forest Bayes network
Decision tree 0.999 0.948 0.012 0.523 0.265Random forest 0.999 0.978 0.025 0.636 0.363SVM 0.948 0.978 0.255 0.970 0.846kNN 0.012 0.025 0.255 0.782 0.944Naive Bayes 0.523 0.636 0.970 0.782 0.999Neural Network 0.265 0.363 0.846 0.944 0.999
number of remaining attributes only as an informative result. For evaluation of the classifier’s / featureselector’s success, we define the score for each classifier/feature selector combination as the difference:
score = number of CA increases− number of CA decreases.
In the statistical evaluation, we compare the achieved scores among classifiers and feature selectionmethods, as follows.
Using the Friedman test we tested the null hypothesis stating that all classifiers and feature selectionmethods perform equally (have statistically equal performance scores) against the alternative contraryhypothesis. The results of the tests showed that:
– the Friedman statistic for equality of classifiers’ perfomance equals 20.96 and has the p-value of0.00083,
– the Friedman statistic for equality of feature selectors’ perfomance equals 19.11 and has the p-valueof 0.00075.
These results therefore reject both null hypotheses and indicate that the differences exist in the per-formance of classifiers as well as feature selection methods. To analyze the performance differencesin greater detail, we performed the post-hoc Nemenyi test. The p-values of the performance compar-isons between pairs of feature selection methods and pairs of classifiers are shown in Tables 3 and 4,respectively. By combining the information from Table 2 and the p-values of the Nemenyi test we cansummarize that:
– ReliefF and random forest feature selection methods achieved significantly better score comparedto Gini index (p-value of the test for the former performance is 0.016 and p-value of the test for thelatter is 0.035),
– kNN classifier achieved significantly better score than decision tree and random forest classifier(p-value of the test for the former is 0.012 and p-value of the test for the latter is 0.025).

278 L. Cehovin and Z. Bosnic / Empirical evaluation of feature selection methods in classification
Based on the above, we can conclude that our hypothesis about the superior performance of the randomforest feature selector can be only partially confirmed, in terms of having significantly better performanceonly over Gini index (the same is true for the ReliefF feature selector, as well). Additionally, we cannote that our feature removal procedure can be used to significantly optimize the accuracy of the kNNclassifier, compared to the accuracy of the decision tree and random forest classifier. Having seen that thecombination of ReliefF feature selector and kNN classifier achieved the highest score, we can concludethat our analysis shows that these two algorithms among the others compared are the most suitable choicefor the usage in environments where similar feature selection procedures are performed.
5. Conclusion
In this paper we presented an empirical comparison of five selection methods including random forestfeature selector which has not been much empirically evaluated in the literature till now. The othercompared feature selection approaches were: ReliefF, sequential forward selection, sequential backwardselection, and Gini index.
Our testing evaluation on 20 domains involved measuring of how the usage of the feature selectionmethods can benefit classification accuracy of six different classifier models (decision tree, randomforest, SVM, kNN, Naive Bayes, and neural network). In the testing scenario, feature selection methodswere used to iteratively evaluate the quality of the features and in each step, remove the feature withthe lowest quality estimate. As a result, the best achieved classification accuracy among all iterationswas recorded, along with the number of the remaining features. We afterwards evaluated the achievedclassifiers’ performances using independent test data and ranked the feature selection methods in theorder of how they enabled the classifiers to achieve better accuracy by removing the right features thathinder their performance.
The testing results have shown that ReliefF and random forest performed best in terms of the highestpercentage of testing domains with significant increase of classification accuracy. Among the classifiers,kNN and neural network have also shown to perform best in our evaluation procedure by achieving themost frequent significant improvements in the classification accuracy on the testing domains. The abovefeature selection methods and the classifiers mostly achieved their highest accuracies in the iterationsin which the lowest number of features remained in the domain (compared to other feature selectionmethods and classifiers). This conclusion speaks in favor especially of the random forest performance,using which we successfully managed to remove more features of the worse quality and therewithimprove the accuracy of the testing classifiers.
The statistical comparison of the feature selectors and classifiers has revealed that the random forestfeature selector and ReliefF have significantly better performance over Gini index and that the kNNclassifier performed significantly better than decision tree and random forest classifier. Additionally, thecombination of ReliefF feature selector and kNN classifier achieved the highest score, appearing to bethe most suitable choice for the usage in environments where similar feature selection procedures areperformed.
To conclude, our empirical evaluation has provided the indication about the appropriateness of thetested feature selection methods for optimization of the classifiers’ accuracies. When faced with sucha task in the real-world applications of supervised learning, the achieved results may ease the decisionwhich feature selection method and classifier to use to implement the prediction task. The potentiallyachieved improvement in classification accuracy could be of a significance especially to the users ofmission critical predictive applications (e.g. medicine, business decisions, control applications), not to
L. Cehovin and Z. Bosnic / Empirical evaluation of feature selection methods in classification 279
mention reducing the costs of collecting, processing and storing features which do not benefit to thelearning process.Our further work in this area mostly includes:
– extending the current evaluation to more feature selection methods and classifiers,– implementation of the feature selection set optimization procedure on the real-world domain where
classification accuracy is of a critical importance (e.g. medical prognostics domain).
Acknowledgements
The authors would like to thank Igor Kononenko for his advice and contribution to this work.
Appendix
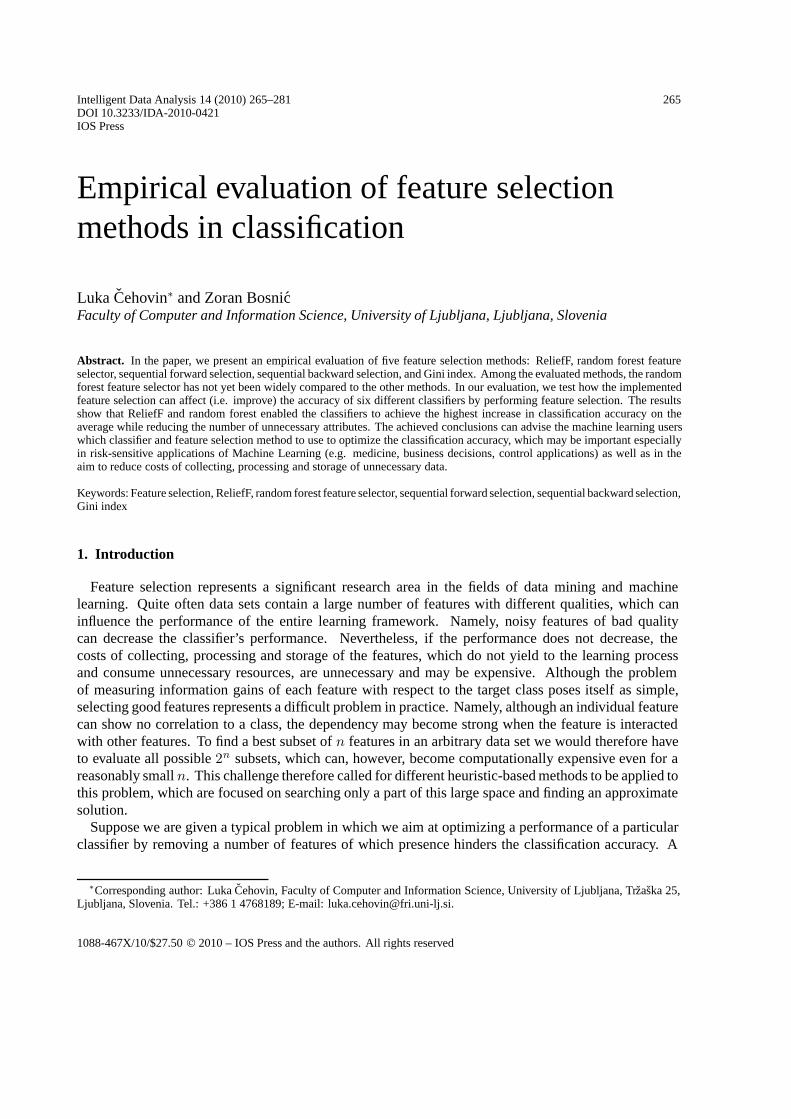
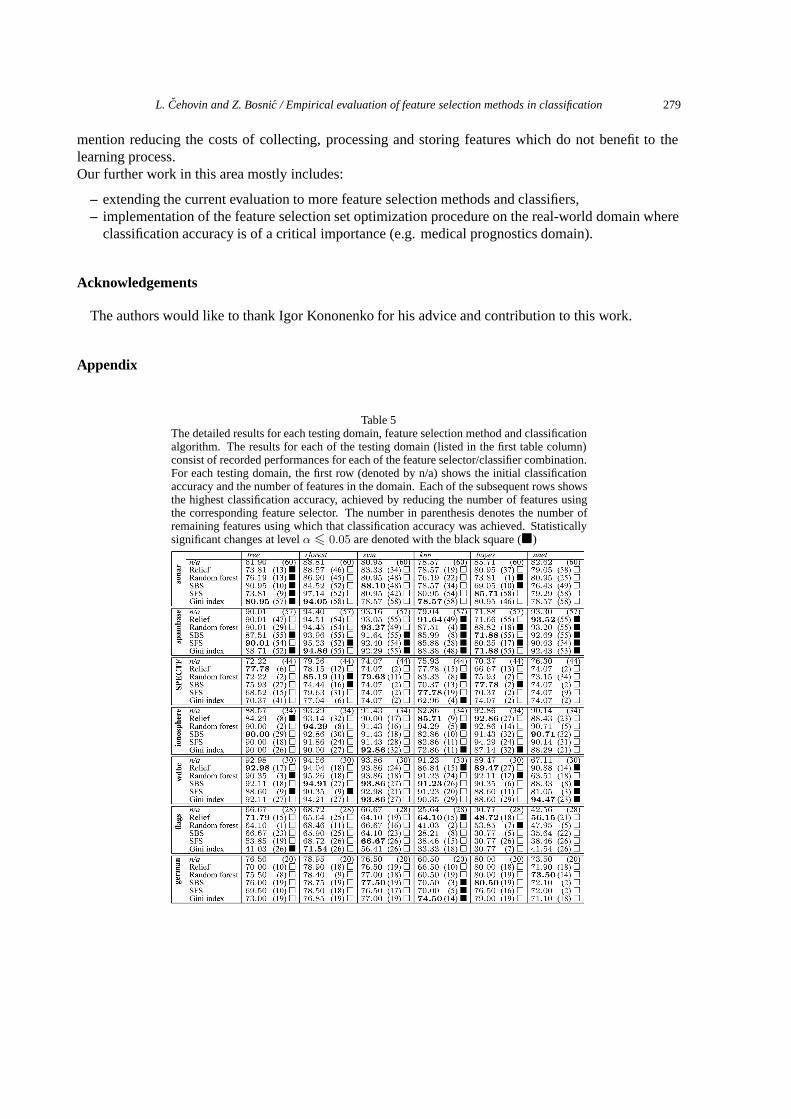
Table 5The detailed results for each testing domain, feature selection method and classificationalgorithm. The results for each of the testing domain (listed in the first table column)consist of recorded performances for each of the feature selector/classifier combination.For each testing domain, the first row (denoted by n/a) shows the initial classificationaccuracy and the number of features in the domain. Each of the subsequent rows showsthe highest classification accuracy, achieved by reducing the number of features usingthe corresponding feature selector. The number in parenthesis denotes the number ofremaining features using which that classification accuracy was achieved. Statisticallysignificant changes at level α � 0.05 are denoted with the black square (�)
280 L. Cehovin and Z. Bosnic / Empirical evaluation of feature selection methods in classification
Table 5, continued
References
[1] D.W. Aha and R.L. Bankert, Feature selection for case-based classification of cloud types: An empirical comparison,Technical report, Menlo Park, CA, USA, 1994.

L. Cehovin and Z. Bosnic / Empirical evaluation of feature selection methods in classification 281
[2] D.W. Aha and R.L. Bankert, in: A Comparative Evaluation of Sequential Feature Selection Algorithms, D. Fisher and H.Lenz, eds, Proceedings of the Fifth International Workshop on Artificial Intelligence and Statistics (Ft. Lauderdale, FL,USA) 1995, pp. 1–7.
[3] E. Alpaydin, Introduction to Machine Learning, TheMIT Press: Cambridge,Massachussetts, 2004.[4] A. Asuncion and D.J. Newman, UCI machine learning repository, http://archive.ics.uci.edu/ml/, 2007.[5] A.L. Blum and P. Langley, Selection of relevant features and examples in machine learning, Artificial Intelligence 97(1–2)
(1997), 245–271.[6] L. Breiman, Random forests, Machine Learning 45(1) (2001), 5–32.[7] L. Breiman, J.H. Friedman, R.A. Olshen and C.J. Stone, Classification and Regression Trees, Wadsworth International
Group, Belmont, CA, USA, 1984.[8] C. Chang and C. Lin, LIBSVM: A Library for Support Vector Machines, 2001, Software available at http://www.csie.
ntu.edu.tw/ cjlin/libsvm.[9] M. Dash and H. Liu, Feature selection for classification, IntelligentData Analysis 1 (1997), 131–156.
[10] J. Demsar, Statistical comparisons of classifiers over multiple data sets, J Mach Learn Res 7 (2006), 1–30.[11] F. Ferri, P. Pudil, M. Hatef and J. Kittler, Comparative Study of Techniques for Large-Scale Feature Selection, in: Pattern
Recognition in Practice IV, Multiple Paradigms, Comparative Studies and Hybrid Systems, 1994, pp. 403–413.[12] M. Grimaldi, P. Cunningham and A. Kokaram, An Evaluation of Alternative Feature Selection Strategies and Ensemble
Techniques for Classifying Music, Workshop in Multimedia Discovery and Mining (Dubrovnik, Croatia), 2003.[13] I. Guyon and A. Elisseeff, An introduction to variable and feature selection, Journal of Machine Learning Research
(2003), 1157–1182.[14] I.M. Guyon, S.R. Gunn, A. Ben-Hur and G. Dror, Result Analysis of the Nips 2003 Feature Selection Challenge, Advances
in Neural Information Processing Systems, 2004.[15] M.A. Hall and G. Holmes, Benchmarking attribute selection techniques for discrete class data mining, IEEE Transactions
on Knowledge and Data Engineering 15(6) (2003), 1437–1447.[16] R. Ihaka and R. Gentleman, R: A language for data analysis and graphics, Journal of Computational and Graphical
Statistics 5(3) (1996), 299–314.[17] A. Jain and D. Zongker, Feature selection: Evaluation, application, and small sample performance, IEEE Transactions
on Pattern Analysis and Machine Intelligence 19(2) (1997), 153–158.[18] I. Jeffery, D. Higgins and A. Culhane, Comparison and evaluation of methods for generating differentially expressed
gene lists from microarray data, BMC Bioinformatics 7(1) (2006), 359.[19] G.H. John, R. Kohavi and K. Pfleger, Irrelevant Features and the Subset Selection Problem, Proceedings of the Eleventh
International Conference on Machine Learning, 1994, 121–129.[20] R. Kohavi and G.H. John, Wrappers for feature subset selection, Artificial Intelligence 97(1–2) (1997), 273–324.[21] I. Kononenko, Estimating Attributes: Analysis and Extensions of RELIEF, European Conference on Machine Learning,
1994, 171–182.[22] I. Kononenko and M. Kukar, Machine learning and data mining, Horwood Publishing, Chichester, UK, 2007.[23] M. Kudo and J. Sklansky, A Comparative Evaluation of Medium- and Large-Scale Feature Selectors for Pattern Classifiers,
First InternationalWorkshop on Statistical Techniques in Pattern Recognition (Prague, Czech Republic), 1997, 91–96.[24] M. Kudo and J. Sklansky, Classifier-independent feature selection for two-stage feature selection, Syntactical and
Structural Pattern Recognition/Statistical Pattern Recognition (1998), 548–554.[25] H. Liu, J. Li and L. Wong, A comparative study on feature selection and classification methods using gene expression
profiles and proteomic patterns, Genome Inform 13 (2002), 51–60.[26] H. Liu and H. Motoda, Computational Methods of Feature Selection, Chapman & Hall/CRC, 2007.[27] H. Liu and L. Yu, Toward integrating feature selection algorithms for classification and clustering, IEEE Transactions on
Knowledge and Data Engineering 17(4) (2005), 491–502.[28] W.S. McCulloch and W. Pitts, A logical calculus of the ideas imminent in nervous activity, Bulletin of Mathematical
Biophysics 5 (1943), 115–133.[29] M. RobnikSikonja and I. Kononenko, Theoretical and empirical analysis of relieff and rrelieff, Machine Learning 53(1–2)
(2003), 23–69.[30] Y. Saeys, I. Inza and P. Larra?naga, A review of feature selection techniques in bioinformatics, Bioinformatics 23(19)
(2007), 2507–2517.[31] V.N. Vapnik, The Nature of Statistical Learning Theory, Springer, New York, NY, USA, November 1999.[32] Y. Yang and J.O. Pedersen, A Comparative Study on Feature Selection in Text Categorization, Proceedings of the
Fourteenth International Conference on Machine Learning (San Francisco, CA, USA), Morgan Kaufmann PublishersInc., 1997, 412–420.
Related Documents