Emission of isoprene and carbonyl compounds from a boreal forest and wetland in Sweden Robert Janson a,* , Claes De Serves b , Rodrigo Romero b a Department of Meteorology, Stockholm University, S-106 91 Stockholm, Sweden b Air Pollution Laboratory, Institute for Applied Environmental Research, Stockholm University, S-106 91, Stockholm, Sweden Abstract Emission measurements of light hydrocarbons, light carbonyl compounds, and monoterpenes have been made with canister, DNPH, and Tenax samples, respectively, on Norway spruce (Picea abies), Scots pine (Pinus sylvestris), the floor of a mixed pine and spruce forest, and a Sphagnum fen at the NOPEX site (Northern hemisphere climate Processes and land-surface Experiment) in the southern boreal zone of Sweden, in 1995. The branch and ground measurements were made with the flow- through enclosure technique and static chamber technique, respectively. Norway spruce was found to emit significant amounts of isoprene, the normalised emission rate (308 C, 1000 mmol m 2 s 1 ) averaging 24 18 nmol gdw 1 h 1 (1.4 mgC gdw 1 h 1 ), and of carbonyls with normalised rates ranging from 10 to 150 nmol gdw 1 h 1 (0.3– 4.6 mgC gdw 1 h 1 ). Acetone/acrolein and acetaldehyde dominated the carbonyl flux with 61 and 27%, respectively. The normalised monoterpene emission rate (308C) varied from 17 to 60 nmol gdw 1 h 1 (2–7 mgC gdw 1 h 1 ), with a-pinene accounting for 34% of the flux. The emission from Scots pine included only traces of isoprene, while the emission rate of acetone/acrolein was comparable to that of the monoterpenes. The BVOC flux from the forest floor made up only a few percent of the total forest flux and included ethene and propane at several tens of nmol m 2 h 1 , and the monoterpenes at rates reaching 380 nmol m 2 h 1 (50 mgC m 2 h 1 ), dominated by a-pinene. A Sphagnum fen emitted isoprene at rates fully comparable to the areal flux of isoprene from the boreal spruce forest. Highest emission rates were observed from the low and wet micro-sites, as compared to the higher and drier hummocks. The average flux in June was 912 750 nmol m 2 h 1 (55 45 mgC m 2 h 1 ) and in August 6800 4000 nmol m 2 h 1 (408 240 mgC m 2 h 1 ). Monoterpene fluxes were 160 80 nmol m 2 h 1 (19 9 mgC m 2 h 1 ) in June and 760 480 nmol m 2 h 1 (90 60 mgC m 2 h 1 ) in August. Isoprene from Norway spruce and Sphagnum wetlands, as well as acetone/acrolein from Norway spruce and Scots pine, are shown here to be important components of the boreal emission of BVOC. More diurnal and seasonal data is needed to correctly evaluate the seasonal flux. # 1999 Elsevier Science B.V. All rights reserved. Keywords: Isoprene; Carbonyl; Monoterpenes; Spruce; Pine; Wetland; Emissions 1. Introduction The biogenic volatile organic compounds (BVOC) consist of hydrocarbons and oxygenated hydrocarbons released to the atmosphere from natural sources, mainly vegetation. They have been the subject of study by atmospheric chemists for 2–3 decades, par- ticularly isoprene (C 5 H 8 ) and the monoterpenes (C 10 H 16 ), because of their influence on the chemistry of the lower atmosphere, the troposphere (e.g., Feh- Agricultural and Forest Meteorology 98–99 (1999) 671–681 * Corresponding author. 0168-1923/99/$ – see front matter # 1999 Elsevier Science B.V. All rights reserved. PII:S0168-1923(99)00134-3

Welcome message from author
This document is posted to help you gain knowledge. Please leave a comment to let me know what you think about it! Share it to your friends and learn new things together.
Transcript
Emission of isoprene and carbonyl compounds from
a boreal forest and wetland in Sweden
Robert Jansona,*, Claes De Servesb, Rodrigo Romerob
aDepartment of Meteorology, Stockholm University, S-106 91 Stockholm, SwedenbAir Pollution Laboratory, Institute for Applied Environmental Research, Stockholm University, S-106 91, Stockholm, Sweden
Abstract
Emission measurements of light hydrocarbons, light carbonyl compounds, and monoterpenes have been made with canister,
DNPH, and Tenax samples, respectively, on Norway spruce (Picea abies), Scots pine (Pinus sylvestris), the ¯oor of a mixed
pine and spruce forest, and a Sphagnum fen at the NOPEX site (Northern hemisphere climate Processes and land-surface
Experiment) in the southern boreal zone of Sweden, in 1995. The branch and ground measurements were made with the ¯ow-
through enclosure technique and static chamber technique, respectively. Norway spruce was found to emit signi®cant amounts
of isoprene, the normalised emission rate (308C, 1000 mmol mÿ2 sÿ1) averaging 24 � 18 nmol gdwÿ1 hÿ1
(1.4 mgC gdwÿ1 hÿ1), and of carbonyls with normalised rates ranging from 10 to 150 nmol gdwÿ1 hÿ1 (0.3±
4.6 mgC gdwÿ1 hÿ1). Acetone/acrolein and acetaldehyde dominated the carbonyl ¯ux with 61 and 27%, respectively. The
normalised monoterpene emission rate (308C) varied from 17 to 60 nmol gdwÿ1 hÿ1 (2±7 mgC gdwÿ1 hÿ1), with a-pinene
accounting for 34% of the ¯ux. The emission from Scots pine included only traces of isoprene, while the emission rate of
acetone/acrolein was comparable to that of the monoterpenes. The BVOC ¯ux from the forest ¯oor made up only a few
percent of the total forest ¯ux and included ethene and propane at several tens of nmol mÿ2 hÿ1, and the monoterpenes at rates
reaching 380 nmol mÿ2 hÿ1 (50 mgC mÿ2 hÿ1), dominated by a-pinene. A Sphagnum fen emitted isoprene at rates fully
comparable to the areal ¯ux of isoprene from the boreal spruce forest. Highest emission rates were observed from the low and
wet micro-sites, as compared to the higher and drier hummocks. The average ¯ux in June was 912 � 750 nmol mÿ2 hÿ1
(55 � 45 mgC mÿ2 hÿ1) and in August 6800 � 4000 nmol mÿ2 hÿ1 (408 � 240 mgC mÿ2 hÿ1). Monoterpene ¯uxes were
160 � 80 nmol mÿ2 hÿ1 (19 � 9 mgC mÿ2 hÿ1) in June and 760 � 480 nmol mÿ2 hÿ1 (90 � 60 mgC mÿ2 hÿ1) in August.
Isoprene from Norway spruce and Sphagnum wetlands, as well as acetone/acrolein from Norway spruce and Scots pine, are
shown here to be important components of the boreal emission of BVOC. More diurnal and seasonal data is needed to
correctly evaluate the seasonal ¯ux. # 1999 Elsevier Science B.V. All rights reserved.
Keywords: Isoprene; Carbonyl; Monoterpenes; Spruce; Pine; Wetland; Emissions
1. Introduction
The biogenic volatile organic compounds (BVOC)
consist of hydrocarbons and oxygenated hydrocarbons
released to the atmosphere from natural sources,
mainly vegetation. They have been the subject of
study by atmospheric chemists for 2±3 decades, par-
ticularly isoprene (C5H8) and the monoterpenes
(C10H16), because of their in¯uence on the chemistry
of the lower atmosphere, the troposphere (e.g., Feh-
Agricultural and Forest Meteorology 98±99 (1999) 671±681
* Corresponding author.
0168-1923/99/$ ± see front matter # 1999 Elsevier Science B.V. All rights reserved.
PII: S 0 1 6 8 - 1 9 2 3 ( 9 9 ) 0 0 1 3 4 - 3
senfeld et al., 1992). Estimates of the global ¯ux are on
the order of 1000 Tg C per year, methane excluded
(Guenther et al., 1995). In the atmosphere, the BVOC
are oxidised by the OH radical and some by ozone,
thus in¯uencing the oxidative capacity of the tropo-
sphere and affecting the atmospheric lifetimes of other
gases. They contribute to the production of tropo-
spheric ozone and to the carbon monoxide budget
as well as produce organic acids which in turn can
acidify the atmospheric aerosol and precipitation.
They can also contribute to aerosol formation with
possible implications for climate. As the natural VOC
are biogenic, there is an obvious relation and possible
feedback between climate change and both the com-
position and magnitude of BVOC ¯uxes.
The general rule of thumb has been that conifers
emit mainly monoterpenes while deciduous species
emit mainly isoprene. The boreal zone being a con-
iferous zone, its contribution to atmospheric chemistry
has been thought to be mainly by the emission of
monoterpenes, and the few studies to date have also
concerned monoterpenes (Isidorov et al., 1985; Jan-
son, 1992, 1993). A number of recent works have
demonstrated, however, that some conifers, in parti-
cular Norway spruce and Sikta spruce, emit signi®cant
amounts of isoprene (Steinbrecher and Rabong, 1994;
Street et al., 1996; Steinbrecher et al., 1997). The work
of Kesselmeier et al., 1997 and Steinbrecher et al.
(1993) have also shown that carbonyl compounds such
as organic acids and aldehydes are emitted at signi®-
cant rates by some conifers. Indeed, recent model
calculations of regional and global BVOC ¯uxes by
Simpson et al. (1995) and Guenther et al. (1995) have
estimated the oxygenated species, primarily alde-
hydes, ketones, organic acids, and alcohols, to be a
considerable part of the total ¯ux, although there exist
very little experimental data. As for the boreal zone,
no measurements of isoprene or carbonyl compound
emissions from Norway spruce or Scots pine, the most
common coniferous species of the European boreal
zone, have previously been done.
The forest ¯oor, i.e. soil and ®eld vegetation, also
emits VOC to the atmosphere, although the few
measurements to date are not conclusive as to the
signi®cance of these ¯uxes (Isidorov et al., 1985;
Janson, 1993; Steinbrecher et al., 1997). Lastly, while
boreal wetlands have been of interest for CH4 and CO2
budgets, only Klinger et al. (1994) have reported
measurements of isoprene and monoterpene emissions
from that ecosystem in Canada.
Here we report the ®rst measurements of isoprene
and carbonyl compound emissions, alongside mea-
surements of monoterpene emissions, from a conifer-
ous forest and a wetland in the southern boreal zone of
northern Europe. The purpose of the measurements
was to identify the natural sources of these compounds
in the European boreal zone, and to evaluate the
relative importance of those sources.
2. Methods
2.1. Sampling site
The forest experiments were performed 300 m from
the Central Tower of the NOPEX site (Northern hemi-
sphere climate Processes and land-surface Experi-
ment) at 608050N and 178300E in the southern
boreal zone in Sweden (Halldin et al., 1999). The
forest was one of mixed Norway spruce (Picea abies)
and Scots pine (Pinus sylvestris), about 50 years of age
and 20 m high. The soil is podsolic on moraine and is
covered with mosses (mainly Hylocomium spendens
and Pleurzium schreberi) and areas of blueberry
(Vaccinium myrtillus). The wetland measurements
were made on Ryggmossen, a Sphagnum fen of about
30 ha. The central parts of the fen are open with
occasional stunted pine, which at the fringes become
taller and more dominant. The fen is surrounded
mainly by Scots pine forest.
2.2. Branch emissions
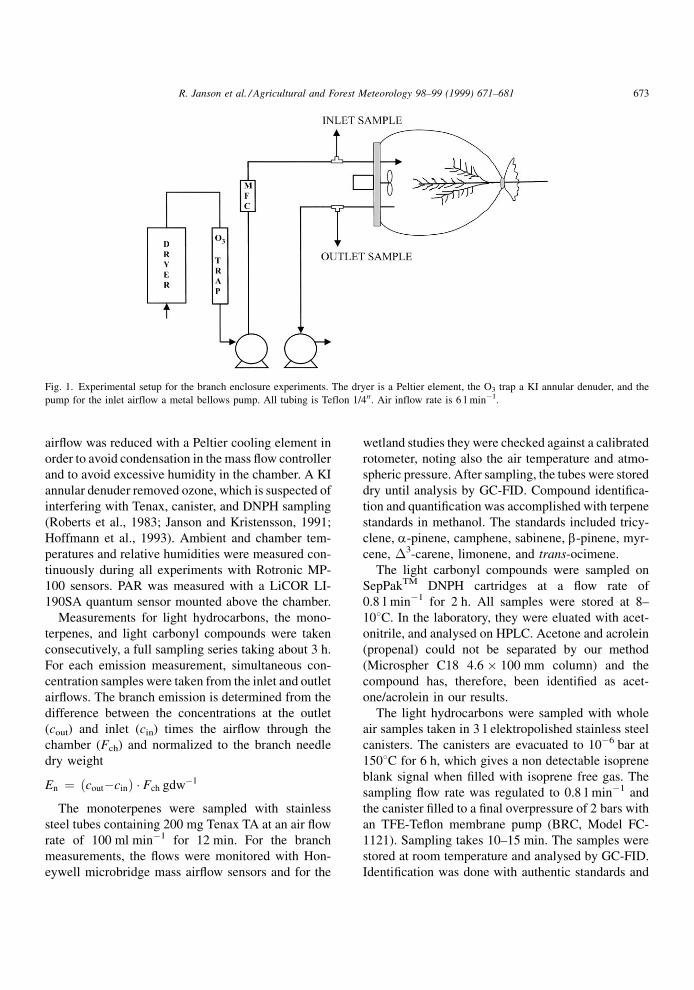
Emission measurements were made on sun-side
branches of Norway spruce and Scots pine at 15 m.
height with the dynamic branch enclosure method,
Fig. 1. The chamber was made of 0.05 mm transparent
FEP-Te¯on ®lm which is tied around a 20±30 cm
branch segment (Janson, 1993). Care was taken to
avoid contact between the branch and the walls of the
chamber in order to avoid mechanical abrasion which
can temporarily affect emission rates (Juuti et al.,
1990). The volume was about 10 l and a fan ensured
mixing. A metal bellows pump supplied the chamber
with a ¯ow of ambient air maintained at 6 l minÿ1 by a
mass ¯ow controller. The water content of the inlet
672 R. Janson et al. / Agricultural and Forest Meteorology 98±99 (1999) 671±681
air¯ow was reduced with a Peltier cooling element in
order to avoid condensation in the mass ¯ow controller
and to avoid excessive humidity in the chamber. A KI
annular denuder removed ozone, which is suspected of
interfering with Tenax, canister, and DNPH sampling
(Roberts et al., 1983; Janson and Kristensson, 1991;
Hoffmann et al., 1993). Ambient and chamber tem-
peratures and relative humidities were measured con-
tinuously during all experiments with Rotronic MP-
100 sensors. PAR was measured with a LiCOR LI-
190SA quantum sensor mounted above the chamber.
Measurements for light hydrocarbons, the mono-
terpenes, and light carbonyl compounds were taken
consecutively, a full sampling series taking about 3 h.
For each emission measurement, simultaneous con-
centration samples were taken from the inlet and outlet
air¯ows. The branch emission is determined from the
difference between the concentrations at the outlet
(cout) and inlet (cin) times the air¯ow through the
chamber (Fch) and normalized to the branch needle
dry weight
En � �coutÿcin� � Fch gdwÿ1
The monoterpenes were sampled with stainless
steel tubes containing 200 mg Tenax TA at an air ¯ow
rate of 100 ml minÿ1 for 12 min. For the branch
measurements, the ¯ows were monitored with Hon-
eywell microbridge mass air¯ow sensors and for the
wetland studies they were checked against a calibrated
rotometer, noting also the air temperature and atmo-
spheric pressure. After sampling, the tubes were stored
dry until analysis by GC-FID. Compound identi®ca-
tion and quanti®cation was accomplished with terpene
standards in methanol. The standards included tricy-
clene, a-pinene, camphene, sabinene, b-pinene, myr-
cene, �3-carene, limonene, and trans-ocimene.
The light carbonyl compounds were sampled on
SepPakTM DNPH cartridges at a ¯ow rate of
0.8 l minÿ1 for 2 h. All samples were stored at 8±
108C. In the laboratory, they were eluated with acet-
onitrile, and analysed on HPLC. Acetone and acrolein
(propenal) could not be separated by our method
(Microspher C18 4.6 � 100 mm column) and the
compound has, therefore, been identi®ed as acet-
one/acrolein in our results.
The light hydrocarbons were sampled with whole
air samples taken in 3 l elektropolished stainless steel
canisters. The canisters are evacuated to 10ÿ6 bar at
1508C for 6 h, which gives a non detectable isoprene
blank signal when ®lled with isoprene free gas. The
sampling ¯ow rate was regulated to 0.8 l minÿ1 and
the canister ®lled to a ®nal overpressure of 2 bars with
an TFE-Te¯on membrane pump (BRC, Model FC-
1121). Sampling takes 10±15 min. The samples were
stored at room temperature and analysed by GC-FID.
Identi®cation was done with authentic standards and
Fig. 1. Experimental setup for the branch enclosure experiments. The dryer is a Peltier element, the O3 trap a KI annular denuder, and the
pump for the inlet airflow a metal bellows pump. All tubing is Teflon 1/400. Air inflow rate is 6 l minÿ1.
R. Janson et al. / Agricultural and Forest Meteorology 98±99 (1999) 671±681 673
quanti®cation with a propane standard, for which the
FID carbon response is 5% higher than that for iso-
prene (Apel et al., 1994).
Laboratory studies were performed in order to
evaluate eventual losses or artefacts in measurements
of isoprene from the branch chamber. In addition to
the set up as in Fig. 1, an active charcoal scrubber was
introduced to remove organics from the inlet air¯ow as
well as a humidi®er to regulate air humidity. A
3.0 ppbv isoprene standard gas was introduced to
the chamber at relative humidities of 11, 49, and
81%. Samples were collected consecutively at the
chamber inlet and outlet in stainless steel canisters
at a ¯ow rate of 0.5 l minÿ1. The canisters were ®lled
directly without being ¯ushed with the sample air.
Samples were analysed the same day.
The effect of storage time on the recovery of the
isoprene sampled at different relative humidities was
also investigated. Three groups of 4 canisters each
were ®lled at 14, 49, and 86% relative humidity. The
canisters were stored at room temperature and the
isoprene concentrations determined at 1, 6, 14, 36, and
77 days after sampling.
2.3. Forest floor emissions
Forest ¯oor emissions were measured with the static
chamber technique in June, July, and September. Two
stainless steel frames, 60 cm � 60 cm and 20 cm high,
lined on the inside with Te¯on ®lm, were placed on the
ground about 10 m apart at the beginning of the
season. Plot F1 was covered with mosses (Pleurzium
schreberi), while Plot F2 was covered with mosses
(Hylocomium splendens), 15±30 cm high wild blue-
berry (Vaccinium myrtillus), and a few grasses and
herbs (Melampyrum sylvaticum). Both plots had pine
and spruce trees within a 10 m radius. The bottom
edge of the frame was pressed a few centimeters into
the underlying mosses a week in advance of the ®rst
measurements. Depressing the frame into the soil by
cutting a furrow has previously been found to sig-
ni®cantly alter the emission pattern of the forest ¯oor
(Janson, 1993). Care was, therefore, taken not to break
or disturb the roots of the ground vegetation, i.e.
blueberry bushes, and surrounding trees.
The chamber was a 60 cm � 60 cm � 50 cm stain-
less steel frame covered on the inside with transparent
Te¯on ®lm. The chamber volume was about 235 l
(250 l empty) and the area covered was 0.36 m2. A fan
mounted from the top of the chamber with the motor
situated on the outside ensured mixing of the chamber
air. Chamber temperature and relative humidity were
measured with a Rotronic MP-100 sensor, and PAR
with a LiCOR LI-190SA sensor situated on top of the
chamber. At the time of a measurement, the chamber
was placed in a small gutter at the top of the ground
frame, lined with foamed plastic covered with Te¯on
®lm. The VOC ¯ux was determined from the differ-
ence in concentration between the chamber air
sampled after 20 min, and the ambient air, sampled
at the beginning of an experiment. For the carbonyl
compounds, simultaneous ambient and chamber mea-
surements were made for 1 h from the beginning of the
experiment. The ground plot was left uncovered at
least 30 min between experiments.
The ground chamber was tested for artifacts and
losses by sampling from an empty chamber, i.e. the
bottom frame closed on the bottom with Te¯on ®lm,
under ®eld conditions.
2.4. Sphagnum fen emissions
The above described static chamber technique was
used to measure ¯uxes from a Sphagnum fen. Two
frames were placed about 10 m apart and about 30 m
from the border zone of dwarfed Scots pine. The one,
Plot B1, was placed on a plot of Sphagnum moss at
which the water table was within 10 cm of the surface.
The other, Plot B2 was drier, being on a small hum-
mock a couple decimeters above the level of Plot B1,
and consisted of Sphagnum moss, grasses and heather
(Calluna vulgaris). Emission measurements were made
during one day in June and one day in August 1996.
3. Results
3.1. Laboratory experiments
The difference in isoprene concentration between
outlet and inlet air samples of the controlled laboratory
experiments with the Te¯on chamber, was less than
1% for all three relative humidities. The ®eld samples
taken from the empty branch chamber and ground
chamber also demonstrated neither isoprene nor
monoterpene artefacts. The monoterpene results are
674 R. Janson et al. / Agricultural and Forest Meteorology 98±99 (1999) 671±681
in keeping with previous results reported by Janson
and Kristensson (1991). A branch chamber with a few
polyethylene details (fan, in- and outlet pieces)
showed a formaldehyde artefact and was therefore
not used for emission experiments. After exchanging
the polyethylene parts to Te¯on, the empty chamber
showed no carbonyl artefact.
In the storage experiment, the isoprene concentra-
tion in the canisters showed a 13±14% loss after 77
days of storage in all three groups of relative humid-
ities. Within a 5% analytical uncertainty, the concen-
tration did not change during the ®rst 40 days, with the
exception of the samples taken at 14% relative humid-
ity (RH). This is in good agreement with the results of
Pate et al. (1992) who investigated the stability of 10
polar organic compounds in Summa-polished and
unpolished stainless steel canisters at 3 bars initial
pressure with and without addition of 200 ml water.
They reported an excellent recovery of isoprene
(100 � 10%) from humid canisters over a 31-day
storage period, whereas the dry canisters showed a
gradual loss of more than 70% of the initial 6.1 ppbv
isoprene concentration. This severe loss of isoprene in
the dry canisters observed by Pate et al. (1992) was,
however, not reproduced in our study. Good recovery
of isoprene from humid canisters has also been
reported by Brymer et al. (1996) who examined
storage stability for 194 VOC in Summa-polished
stainless steel canisters at 2 bars and 70% RH. After
30 days, the isoprene concentration showed a loss of
7% to the initial which, again, is in very good accor-
dance with our results.
It has been suggested that the improved recovery of
many VOC, including isoprene, from humidi®ed can-
isters may be due to passivisation of active sites at the
canister surface by water (Gholson et al., 1990; Pate
et al., 1992). It has also been argued that high canister
pressure is bene®cial for recovery of many VOC
(Coutant, 1992). It is, therefore, within reason to
believe that the recovery of isoprene during normal
procedures, i.e. storage without loss of canister pres-
sure, would be even better than what our results from
this experiment indicate. We have taken samples for
analysis from the same canister 4-times prior to the
last analysis at Day 77. For each analysis, the canister
pressure decreases and was as low as 0.7 bar at Day
77. This argument ®nds support in the results of two
canisters (49% RH) that were saved untouched until
the end of the storage period. At Day 77, these two
canisters had an isoprene concentration that was
within 5% of the initial concentration, which can be
compared to the 13% loss in the 49% RH canister
group that had been analyzed 4-times.
3.2. Branch emissions
3.2.1. Norway spruce
Afternoon emission rates were measured from four
branches of Norway spruce on 20 May, 2, 4 and 20
June; 8 and 9 July, and 20 September, 1995, Fig. 2, and
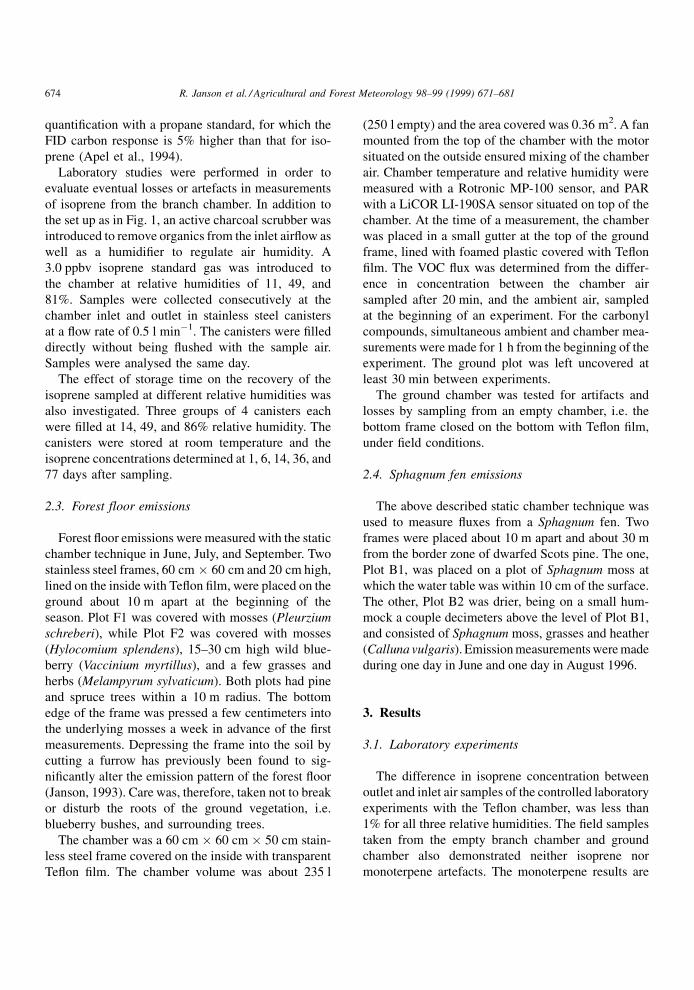
Fig. 2. Afternoon emission rates (nmol gdwÿ1 hÿ1) of isoprene, monoterpenes and carbonyls from Norway spruce (Picea Abies) at the
Norunda site, 1995. Given are the mid-time, average PAR (mmol mÿ2 sÿ1), and average chamber air temperature (8C) for each measurement.
R. Janson et al. / Agricultural and Forest Meteorology 98±99 (1999) 671±681 675
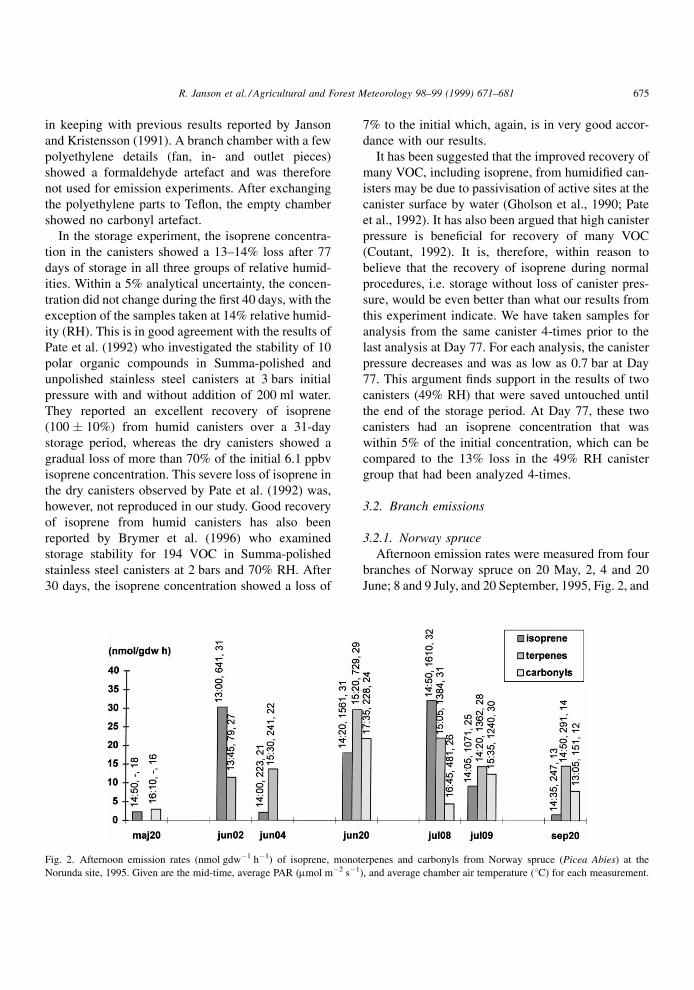
the daily variation of the ¯ux on 2 and 20 June, and 20
September, Fig. 3. The results from 2 June must be
taken with some caution as slight damage to the tip of
one side branch was observed after the experiment.
Mechanical abrasion is known to affect monoterpene
emissions, but it is unsure how it will affect the rates of
isoprene or carbonyl compounds.
Isoprene was found to be emitted at rates varying
from less than 5 in May and September to
32 nmol gdwÿ1 hÿ1 (0.06±2 mgC gdwÿ1 hÿ1) on 8
July. Traces of ethene, propane and propene were also
observed in June, generally at the pmol level except
for on 20 June, when emissions of ethene were as high
as several nmol gdwÿ1 hÿ1.
The emission of carbonyls consisted of formalde-
hyde, acetaldehyde, and acetone/acrolein at relative
rates of 10 � 16, 26 � 19, 64 � 20%, respectively.
The highest observed ¯ux was 22 nmol gdwÿ1 hÿ1
(0.67 mgC gdwÿ1 hÿ1) on 20 June.
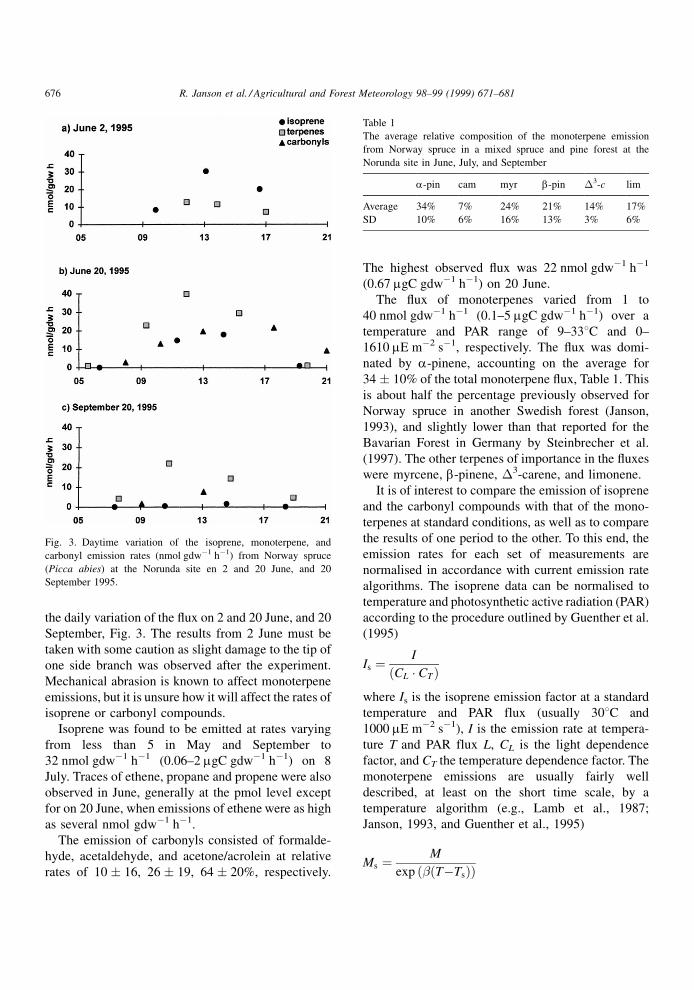
The ¯ux of monoterpenes varied from 1 to
40 nmol gdwÿ1 hÿ1 (0.1±5 mgC gdwÿ1 hÿ1) over a
temperature and PAR range of 9±338C and 0±
1610 mE mÿ2 sÿ1, respectively. The ¯ux was domi-
nated by a-pinene, accounting on the average for
34 � 10% of the total monoterpene ¯ux, Table 1. This
is about half the percentage previously observed for
Norway spruce in another Swedish forest (Janson,
1993), and slightly lower than that reported for the
Bavarian Forest in Germany by Steinbrecher et al.
(1997). The other terpenes of importance in the ¯uxes
were myrcene, b-pinene, �3-carene, and limonene.
It is of interest to compare the emission of isoprene
and the carbonyl compounds with that of the mono-
terpenes at standard conditions, as well as to compare
the results of one period to the other. To this end, the
emission rates for each set of measurements are
normalised in accordance with current emission rate
algorithms. The isoprene data can be normalised to
temperature and photosynthetic active radiation (PAR)
according to the procedure outlined by Guenther et al.
(1995)
Is � I
�CL � CT�where Is is the isoprene emission factor at a standard
temperature and PAR flux (usually 308C and
1000 mE mÿ2 sÿ1), I is the emission rate at tempera-
ture T and PAR flux L, CL is the light dependence
factor, and CT the temperature dependence factor. The
monoterpene emissions are usually fairly well
described, at least on the short time scale, by a
temperature algorithm (e.g., Lamb et al., 1987;
Janson, 1993, and Guenther et al., 1995)
Ms � M
exp ���TÿTs��
Fig. 3. Daytime variation of the isoprene, monoterpene, and
carbonyl emission rates (nmol gdwÿ1 hÿ1) from Norway spruce
(Picca abies) at the Norunda site en 2 and 20 June, and 20
September 1995.
Table 1
The average relative composition of the monoterpene emission
from Norway spruce in a mixed spruce and pine forest at the
Norunda site in June, July, and September
a-pin cam myr b-pin �3-c lim
Average 34% 7% 24% 21% 14% 17%
SD 10% 6% 16% 13% 3% 6%
676 R. Janson et al. / Agricultural and Forest Meteorology 98±99 (1999) 671±681
where Ms is the emission rate at a standard tempera-
ture Ts, usually chosen to be 308C, M is the mono-
terpene emission rate at temperature T, and � is an
empirical coefficient. Here we use � � 0.09, in accor-
dance with the discussion by Guenther et al. (1995)
who found that most of the estimates reported in the
literature fall within the range 0.09 � 0.025 Kÿ1.
Lastly, in light of the fact that very little data has
been reported on the emission of carbonyl compounds
and the factors which regulate those emissions, we
will tentatively apply the isoprene emission algorithm
also for those emissions.
The normalised data include 3±4 daytime
(PAR>100 mE mÿ2 sÿ1) measurements for each
period and are shown in Table 2. It is seen that, on
a molar basis, the isoprene and carbonyl emissions
are entirely comparable to and sometimes higher
than the emission rate of the monoterpenes. For
isoprene, the emission algorithm seems to describe
emission rate variability well, both diurnally and
over the season, with the exception of the early June
measurements. Averaging all the data yields a
standard emission factor of 24 � 18 nmol gdwÿ1 hÿ1,
(1.4 mgC gdwÿ1 hÿ1), which agrees quite well with
results reported earlier for Norway spruce in Germany
(Steinbrecher and Rabong, 1994). For both the mono-
terpenes and the carbonyl compounds, the standard
emission rates vary considerably over the summer
(Table 2).
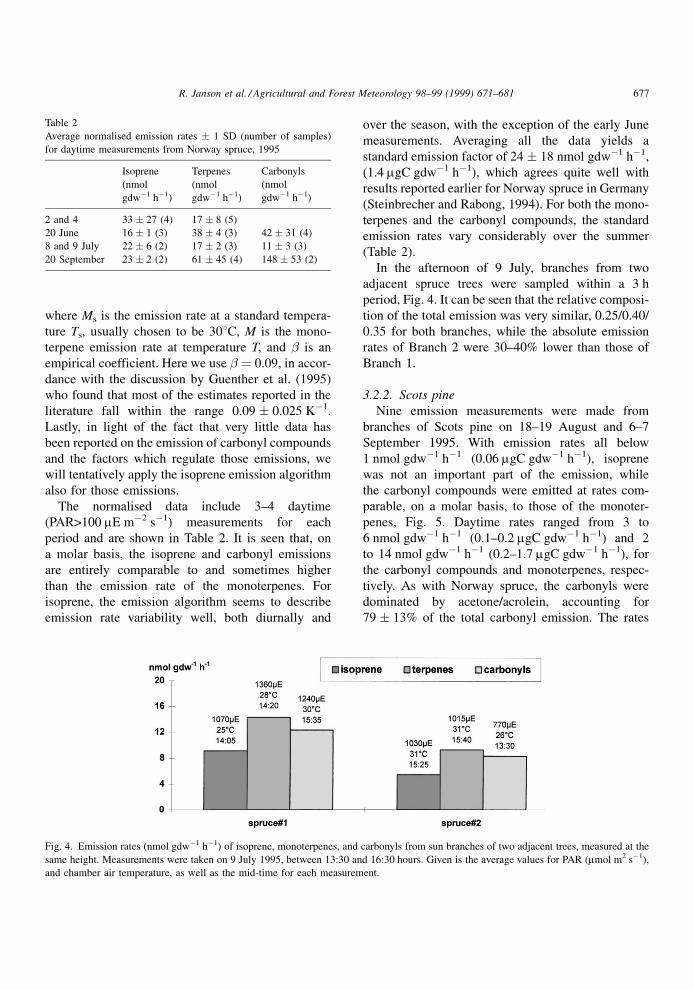
In the afternoon of 9 July, branches from two
adjacent spruce trees were sampled within a 3 h
period, Fig. 4. It can be seen that the relative composi-
tion of the total emission was very similar, 0.25/0.40/
0.35 for both branches, while the absolute emission
rates of Branch 2 were 30±40% lower than those of
Branch 1.
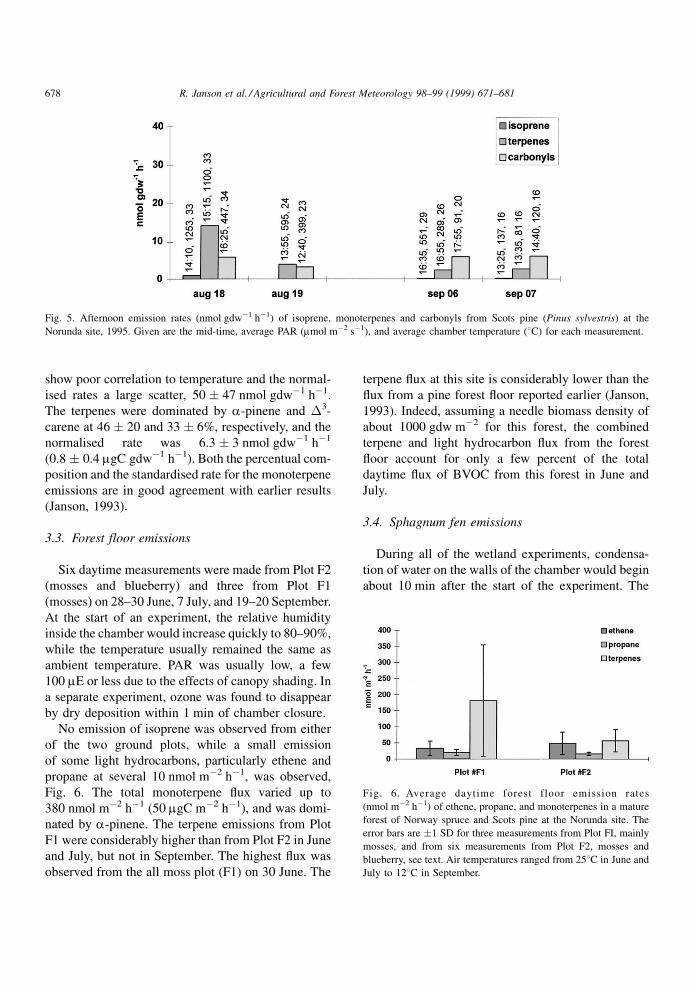
3.2.2. Scots pine
Nine emission measurements were made from
branches of Scots pine on 18±19 August and 6±7
September 1995. With emission rates all below
1 nmol gdwÿ1 hÿ1 (0.06 mgC gdwÿ1 hÿ1), isoprene
was not an important part of the emission, while
the carbonyl compounds were emitted at rates com-
parable, on a molar basis, to those of the monoter-
penes, Fig. 5. Daytime rates ranged from 3 to
6 nmol gdwÿ1 hÿ1 (0.1±0.2 mgC gdwÿ1 hÿ1) and 2
to 14 nmol gdwÿ1 hÿ1 (0.2±1.7 mgC gdwÿ1 hÿ1), for
the carbonyl compounds and monoterpenes, respec-
tively. As with Norway spruce, the carbonyls were
dominated by acetone/acrolein, accounting for
79 � 13% of the total carbonyl emission. The rates
Table 2
Average normalised emission rates � 1 SD (number of samples)
for daytime measurements from Norway spruce, 1995
Isoprene
(nmol
gdwÿ1 hÿ1)
Terpenes
(nmol
gdwÿ1 hÿ1)
Carbonyls
(nmol
gdwÿ1 hÿ1)
2 and 4 33 � 27 (4) 17 � 8 (5)
20 June 16 � 1 (3) 38 � 4 (3) 42 � 31 (4)
8 and 9 July 22 � 6 (2) 17 � 2 (3) 11 � 3 (3)
20 September 23 � 2 (2) 61 � 45 (4) 148 � 53 (2)
Fig. 4. Emission rates (nmol gdwÿ1 hÿ1) of isoprene, monoterpenes, and carbonyls from sun branches of two adjacent trees, measured at the
same height. Measurements were taken on 9 July 1995, between 13:30 and 16:30 hours. Given is the average values for PAR (mmol m2 sÿ1),
and chamber air temperature, as well as the mid-time for each measurement.
R. Janson et al. / Agricultural and Forest Meteorology 98±99 (1999) 671±681 677
show poor correlation to temperature and the normal-
ised rates a large scatter, 50 � 47 nmol gdwÿ1 hÿ1.
The terpenes were dominated by a-pinene and �3-
carene at 46 � 20 and 33 � 6%, respectively, and the
normalised rate was 6.3 � 3 nmol gdwÿ1 hÿ1
(0.8 � 0.4 mgC gdwÿ1 hÿ1). Both the percentual com-
position and the standardised rate for the monoterpene
emissions are in good agreement with earlier results
(Janson, 1993).
3.3. Forest floor emissions
Six daytime measurements were made from Plot F2
(mosses and blueberry) and three from Plot F1
(mosses) on 28±30 June, 7 July, and 19±20 September.
At the start of an experiment, the relative humidity
inside the chamber would increase quickly to 80±90%,
while the temperature usually remained the same as
ambient temperature. PAR was usually low, a few
100 mE or less due to the effects of canopy shading. In
a separate experiment, ozone was found to disappear
by dry deposition within 1 min of chamber closure.
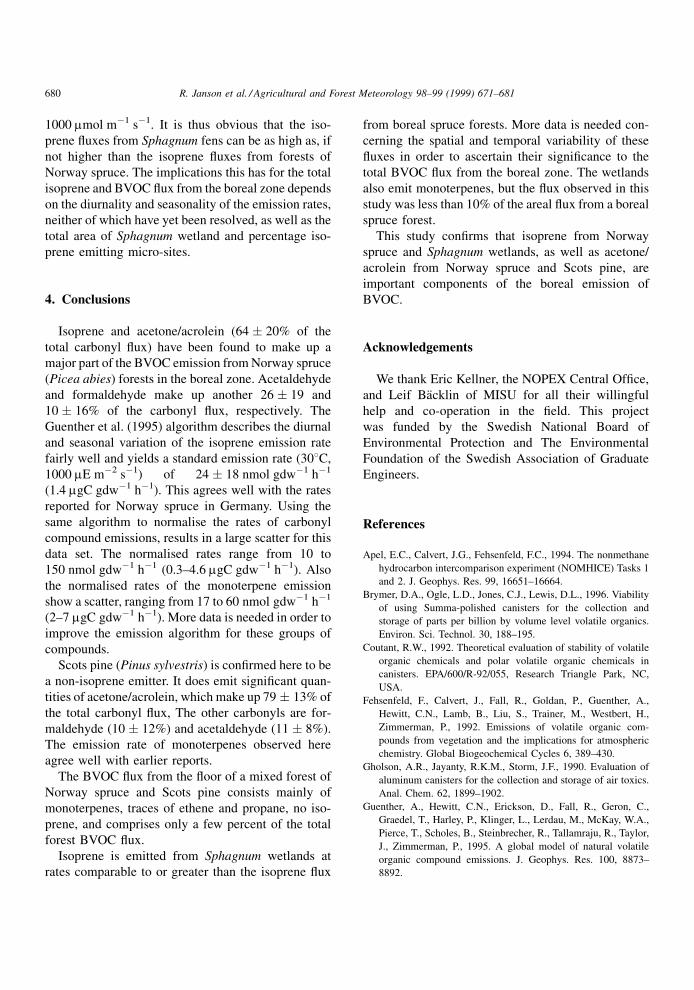
No emission of isoprene was observed from either
of the two ground plots, while a small emission
of some light hydrocarbons, particularly ethene and
propane at several 10 nmol mÿ2 hÿ1, was observed,
Fig. 6. The total monoterpene ¯ux varied up to
380 nmol mÿ2 hÿ1 (50 mgC mÿ2 hÿ1), and was domi-
nated by a-pinene. The terpene emissions from Plot
F1 were considerably higher than from Plot F2 in June
and July, but not in September. The highest ¯ux was
observed from the all moss plot (F1) on 30 June. The
terpene ¯ux at this site is considerably lower than the
¯ux from a pine forest ¯oor reported earlier (Janson,
1993). Indeed, assuming a needle biomass density of
about 1000 gdw mÿ2 for this forest, the combined
terpene and light hydrocarbon ¯ux from the forest
¯oor account for only a few percent of the total
daytime ¯ux of BVOC from this forest in June and
July.
3.4. Sphagnum fen emissions
During all of the wetland experiments, condensa-
tion of water on the walls of the chamber would begin
about 10 min after the start of the experiment. The
Fig. 5. Afternoon emission rates (nmol gdwÿ1 hÿ1) of isoprene, monoterpenes and carbonyls from Scots pine (Pinus sylvestris) at the
Norunda site, 1995. Given are the mid-time, average PAR (mmol mÿ2 sÿ1), and average chamber temperature (8C) for each measurement.
Fig. 6. Average daytime forest floor emission rates
(nmol mÿ2 hÿ1) of ethene, propane, and monoterpenes in a mature
forest of Norway spruce and Scots pine at the Norunda site. The
error bars are �1 SD for three measurements from Plot FI, mainly
mosses, and from six measurements from Plot F2, mosses and
blueberry, see text. Air temperatures ranged from 258C in June and
July to 128C in September.
678 R. Janson et al. / Agricultural and Forest Meteorology 98±99 (1999) 671±681
method is, therefore, not appropriate for water soluble
gases like the carbonyl compounds, while chamber
losses are likely to be small for less water soluble
gases like isoprene and the monoterpenes.
The weather in June was partly cloudy with air
temperatures between 15 and 188C, and ground tem-
peratures (at 5 cm) ranging from 9.58C in the morning
to a maximum of 13.58C at 17:30 hours in the after-
noon. In August it was sunny with air temperatures
around 268C and ground temperatures between 13.58Cin the morning and 17.58C at 18:00 hours.
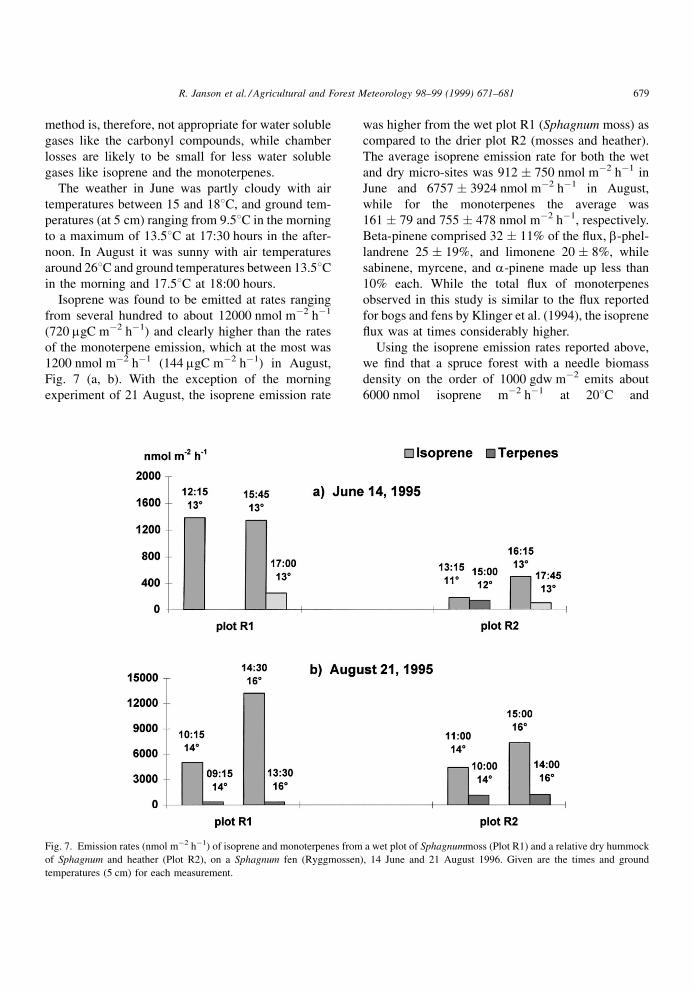
Isoprene was found to be emitted at rates ranging
from several hundred to about 12000 nmol mÿ2 hÿ1
(720 mgC mÿ2 hÿ1) and clearly higher than the rates
of the monoterpene emission, which at the most was
1200 nmol mÿ2 hÿ1 (144 mgC mÿ2 hÿ1) in August,
Fig. 7 (a, b). With the exception of the morning
experiment of 21 August, the isoprene emission rate
was higher from the wet plot R1 (Sphagnum moss) as
compared to the drier plot R2 (mosses and heather).
The average isoprene emission rate for both the wet
and dry micro-sites was 912 � 750 nmol mÿ2 hÿ1 in
June and 6757 � 3924 nmol mÿ2 hÿ1 in August,
while for the monoterpenes the average was
161 � 79 and 755 � 478 nmol mÿ2 hÿ1, respectively.
Beta-pinene comprised 32 � 11% of the ¯ux, b-phel-
landrene 25 � 19%, and limonene 20 � 8%, while
sabinene, myrcene, and a-pinene made up less than
10% each. While the total ¯ux of monoterpenes
observed in this study is similar to the ¯ux reported
for bogs and fens by Klinger et al. (1994), the isoprene
¯ux was at times considerably higher.
Using the isoprene emission rates reported above,
we ®nd that a spruce forest with a needle biomass
density on the order of 1000 gdw mÿ2 emits about
6000 nmol isoprene mÿ2 hÿ1 at 208C and
Fig. 7. Emission rates (nmol mÿ2 hÿ1) of isoprene and monoterpenes from a wet plot of Sphagnummoss (Plot R1) and a relative dry hummock
of Sphagnum and heather (Plot R2), on a Sphagnum fen (Ryggmossen), 14 June and 21 August 1996. Given are the times and ground
temperatures (5 cm) for each measurement.
R. Janson et al. / Agricultural and Forest Meteorology 98±99 (1999) 671±681 679
1000 mmol mÿ1 sÿ1. It is thus obvious that the iso-
prene ¯uxes from Sphagnum fens can be as high as, if
not higher than the isoprene ¯uxes from forests of
Norway spruce. The implications this has for the total
isoprene and BVOC ¯ux from the boreal zone depends
on the diurnality and seasonality of the emission rates,
neither of which have yet been resolved, as well as the
total area of Sphagnum wetland and percentage iso-
prene emitting micro-sites.
4. Conclusions
Isoprene and acetone/acrolein (64 � 20% of the
total carbonyl ¯ux) have been found to make up a
major part of the BVOC emission from Norway spruce
(Picea abies) forests in the boreal zone. Acetaldehyde
and formaldehyde make up another 26 � 19 and
10 � 16% of the carbonyl ¯ux, respectively. The
Guenther et al. (1995) algorithm describes the diurnal
and seasonal variation of the isoprene emission rate
fairly well and yields a standard emission rate (308C,
1000 mE mÿ2 sÿ1) of 24 � 18 nmol gdwÿ1 hÿ1
(1.4 mgC gdwÿ1 hÿ1). This agrees well with the rates
reported for Norway spruce in Germany. Using the
same algorithm to normalise the rates of carbonyl
compound emissions, results in a large scatter for this
data set. The normalised rates range from 10 to
150 nmol gdwÿ1 hÿ1 (0.3±4.6 mgC gdwÿ1 hÿ1). Also
the normalised rates of the monoterpene emission
show a scatter, ranging from 17 to 60 nmol gdwÿ1 hÿ1
(2±7 mgC gdwÿ1 hÿ1). More data is needed in order to
improve the emission algorithm for these groups of
compounds.
Scots pine (Pinus sylvestris) is con®rmed here to be
a non-isoprene emitter. It does emit signi®cant quan-
tities of acetone/acrolein, which make up 79 � 13% of
the total carbonyl ¯ux, The other carbonyls are for-
maldehyde (10 � 12%) and acetaldehyde (11 � 8%).
The emission rate of monoterpenes observed here
agree well with earlier reports.
The BVOC ¯ux from the ¯oor of a mixed forest of
Norway spruce and Scots pine consists mainly of
monoterpenes, traces of ethene and propane, no iso-
prene, and comprises only a few percent of the total
forest BVOC ¯ux.
Isoprene is emitted from Sphagnum wetlands at
rates comparable to or greater than the isoprene ¯ux
from boreal spruce forests. More data is needed con-
cerning the spatial and temporal variability of these
¯uxes in order to ascertain their signi®cance to the
total BVOC ¯ux from the boreal zone. The wetlands
also emit monoterpenes, but the ¯ux observed in this
study was less than 10% of the areal ¯ux from a boreal
spruce forest.
This study con®rms that isoprene from Norway
spruce and Sphagnum wetlands, as well as acetone/
acrolein from Norway spruce and Scots pine, are
important components of the boreal emission of
BVOC.
Acknowledgements
We thank Eric Kellner, the NOPEX Central Of®ce,
and Leif BaÈcklin of MISU for all their willingful
help and co-operation in the ®eld. This project
was funded by the Swedish National Board of
Environmental Protection and The Environmental
Foundation of the Swedish Association of Graduate
Engineers.
References
Apel, E.C., Calvert, J.G., Fehsenfeld, F.C., 1994. The nonmethane
hydrocarbon intercomparison experiment (NOMHICE) Tasks 1
and 2. J. Geophys. Res. 99, 16651±16664.
Brymer, D.A., Ogle, L.D., Jones, C.J., Lewis, D.L., 1996. Viability
of using Summa-polished canisters for the collection and
storage of parts per billion by volume level volatile organics.
Environ. Sci. Technol. 30, 188±195.
Coutant, R.W., 1992. Theoretical evaluation of stability of volatile
organic chemicals and polar volatile organic chemicals in
canisters. EPA/600/R-92/055, Research Triangle Park, NC,
USA.
Fehsenfeld, F., Calvert, J., Fall, R., Goldan, P., Guenther, A.,
Hewitt, C.N., Lamb, B., Liu, S., Trainer, M., Westbert, H.,
Zimmerman, P., 1992. Emissions of volatile organic com-
pounds from vegetation and the implications for atmospheric
chemistry. Global Biogeochemical Cycles 6, 389±430.
Gholson, A.R., Jayanty, R.K.M., Storm, J.F., 1990. Evaluation of
aluminum canisters for the collection and storage of air toxics.
Anal. Chem. 62, 1899±1902.
Guenther, A., Hewitt, C.N., Erickson, D., Fall, R., Geron, C.,
Graedel, T., Harley, P., Klinger, L., Lerdau, M., McKay, W.A.,
Pierce, T., Scholes, B., Steinbrecher, R., Tallamraju, R., Taylor,
J., Zimmerman, P., 1995. A global model of natural volatile
organic compound emissions. J. Geophys. Res. 100, 8873±
8892.
680 R. Janson et al. / Agricultural and Forest Meteorology 98±99 (1999) 671±681
Halldin, S., Gottschalk, L., Gryning, S.E., Jochum, A., Lundin,
L.C., Van de Griend, A.A., 1999, Energy, water and carbon
exchange in a boreal forest ± NOPEX experiences. Agric. For.
Meteorol. 98±99, 5±29.
Hoffmann, T., Jacob, P., Linscheid, M., Klockow, D., 1993.
Measurements of biogenic hydrocarbons and their atmospheric
degradation in forest.. Intern J. Environ. Anal. Chem. 52,
29±37.
Isidorov, V., Zenkevich, I., Ioffe, B., 1985. Volatile organic
compounds in the atmosphere of forests. Atmos. Environ. 19,
1±8.
Janson, R., Kristensson, J., 1991. Sampling and analysis of
atmospheric monoterpenes, Report CM-79. Department of
Meteorology, Stockholm University, Stockhlm, Sweden.
Janson, R., 1992. Monoterpene concentrations in and above a forest
of Scots pine. J. Atm. Chem. 14, 385±394.
Janson, R., 1993. Monoterpene emissions from Scots pine and
Norwegian spruce. J. Geophys. Res. 98, 2839±2850.
Juuti, S., Arey, J., Atkinson, R., 1990. Monoterpene emission rate
measurements from a monterey pine. J. Geophys. Res. 95,
7515±7519.
Kesselmeier, J., Bode, K., Hofmann, U., MuÈller, H., SchaÈfer, L.,
Wolf, A., Ciccioli, P., Brancaleoni, E., Cecinato, A., Frattoni,
M., Foster, P., Ferrari, C., Jacob, V., Fugit, J.L., Dutaur, L.,
Simon, V., Torres, L., 1997. The BEMA project: emission of
short chained organic acids, aldehydes and monoterpenes from
Quercus ilex L. Pinus pinea L. in relation to physiological
activities, carbon budget and emission algorithms. Atmos.
Environ., 31, 119±133.
Klinger, L.F., Zimmerman, P.R., Greenberg, J.P., Heidt, L.E.,
Guenther, A.B., 1994. Carbon trace gas fluxes along a
successional gradient in the Hudson Bay lowland. J. Geophys.
Res. 99, 1469±1494.
Lamb, B., Guenther, A., Gay, D., Westberg, H., 1987. A national
inventory of biogenic hydrocarbon emissions. Atmos. Environ.
21, 1695±1705.
Pate, B., Jayanty, R.K.M., Peterson, M.R., Evans, G.F., 1992.
Temporal stability of polar organic compounds in stainless steel
canisters. J. Air Waste Manage. Assoc. 42, 460±462.
Roberts, J., Fehsenfeld, F., Albritton, D., Sievers, F., 1983.
Measurement of monoterpene hydrocarbons at Niwot Ridge.
Colorado. J. Geophys. Res. 88, 10667±10678.
Simpson, D., Guenther, A., Hewitt, C.N., Steinbrecher, R., 1995.
Biogenic emissions in Europe 1. Estimates and uncertainties. J.
Geophys. Res. 100, 22875±22890.
Steinbrecher, R., Rabong, R., 1994. Emission of terpenoids and
C2±C6 hydrocarbons by Norway Spruce: Phytotron experi-
ments and field studies. In: Borrell, P.M., P. Borrell, T. CvitasÏ,
W. Swiler (Eds.), Proceedings of the Symposium on EURO-
TRAC, 1994. SPB Academic Publishers, The Hague, The
Netherlands, pp. 502±505.
Steinbrecher, R., Jocher, M., Wiedemann, M., Slemr, J., Hahn, J.,
1993. Low molecular weight compounds above a natural
Norway spruce forest, In: Borrell, P.M. (Ed.), Proceedings of
the Symposium on EUROTRAC 1992. SPB Academic Publish-
ers, The Hague, The Netherlands, pp. 299±302.
Steinbrecher, R., Ziegler, H., EichstaÈdter, G., Fehsenfeld, U.,
Gabriel, R., Kolb, C., Rabong, R., SchoÈnwitz, R., SchuÈrmann,
W., 1997. Monoterpene and isoprene emission in Norway
spruce forests. In: Slanina, S. (Ed.), Biosphere-Atmosphere
Exchange of Pollutants and Trace Substances. Springer±Verlag,
Berlin, pp. 352±365.
Street, R.A., Duckham, S.C., Hewitt, C.N., 1996. Laboratory and
field studies of biogenic volatile organic compounds from Sitka
spruce (Picea sitchensis Bong.) in the United Kingdom. J.
Geophys. Res. 101, 22799±22806.
R. Janson et al. / Agricultural and Forest Meteorology 98±99 (1999) 671±681 681
Related Documents