Analysis: Emeryville Retail and Food Service Employee Scheduling Chadrick Smalley, Economic Development and Housing Manager July 2016 Attachment 2

Welcome message from author
This document is posted to help you gain knowledge. Please leave a comment to let me know what you think about it! Share it to your friends and learn new things together.
Transcript

Analysis:
Emeryville Retail and Food Service Employee Scheduling
Chadrick Smalley, Economic Development and Housing Manager
July 2016
Attachment 2

The City engaged the services of Economic and Planning Systems (“EPS”) to provide assistance in generating and analyzing data related to Fair Workweek issues in Emeryville. EPS is a consulting firm that specializes in data-driven evaluation of various economic issues faced by cities. With its subconsultant, market research firm The Henne Group, EPS designed a survey to be administered to retail and food service employees in Emeryville via “intercept”, i.e. by casual encounters with a survey team in parking lots, at sidewalks and bus stops, and on transit. The instrument was designed to capture the prevalence of unstable scheduling practices, a measure of the attitudes of those experiencing such practices, incidence of unwilling part-time work and basic demographic data. For purposes of this study, the total population of potentially affected businesses was defined as all retail and restaurant outlets within the city limits of Emeryville. This list was compiled using third party business listing data, which included the number of employees at each location. The employee count was confirmed where possible through City business license data. Individual outlets were designated as “chain” stores if there were 12 or more outlets known to exist worldwide. Note that due to time and data limitations, this list does not distinguish between independently owned franchises and company-owned outlets, nor between full service restaurants and “fast food” or “fast casual” restaurant formats. The universe evaluated in this study initially included 187 businesses. During the course of fieldwork, the list of affected businesses was revised upward by four establishments, to 191 businesses, 116 of which are “chain” stores. These businesses employ approximately 4,000 people total. It should be noted that this list is believed to be substantially complete, but that certain outlets may be missing or incorrectly categorized due to data limitations and the dynamic nature of business. This business list was divided into subgroups, or “strata”, to allow sampling quotas to be developed, which if achieved would allow conclusions to be drawn about different categories of businesses. In total, 41 strata were developed. The survey quotas developed for each stratum resulted in a total of approximately 300 complete surveys needed. The survey was conducted in late June through mid-July, 2016, and 304 surveys were collected. For purposes of this survey, Large Businesses were defined as those with 56 or more employees at the establishment location, Medium Businesses have 10 to 54 employees, and Small Businesses have 10 or fewer employees. The results of this survey are intended to assist with the evaluation of policy choices for a Fair Workweek Ordinance or other retail and restaurant employee scheduling policy approach. Additionally, this survey is intended to set a “baseline” from which the effectiveness any interventions can be measured by repeating the survey at some point in the future.
Page 2

For further details, the attached memoranda from EPS and The Henne Group (Attachment 2-a) provide additional information on the methodology and results of the employee survey. ATTACHMENTS 2-a – EPS memorandum dated July 27, 2016 2-b – The Henne Group memorandum dated July 26, 2016
Page 3

July 27, 2016
Chad Smalley Economic Development and Housing Manager City of Emeryville 13333 Park Avenue Emeryville, CA 94608
Subject: Proposed Fair Work Week Ordinance Study; EPS #161091
Dear Chad:
Economic & Planning Systems (EPS) has enjoyed its efforts to assist the City of Emeryville (City) with study of Fair Work Week-related research and analysis, including the collection of reliable data and execution of data analysis around potential Fair Work Week policies. As part of this effort, EPS worked closely with the City staff and our sub-consultant The Henne Group to ensure the research, analysis, and advisory services were of high quality and well-tailored to meet the City’s research needs.
EPS and The Henne Group initiated the Fair Work Week research engagement with a conference call with City staff to clarify study goals, research methods, and the work plan. The meeting focused on identifying key issues of interest and survey research approaches. Because of the challenges associated with obtaining phone or email lists for local employees, the team decided that an intercept survey would be the optimal approach to data collection. The team discussed a sampling strategy that would provide suitable coverage of the range of retail and restaurant businesses that the City sought to study.
In concert with City staff, the EPS team then designed and executed the intercept survey and obtained statistically-valid local data concerning labor scheduling practices at retail and restaurant establishments. EPS oversaw the process, with survey research efforts conducted by The Henne Group. The survey effort successfully produced over 300 completed surveys, with strong representation achieved for key sub-groups including retail and restaurant establishments across the range of establishment sizes. The Henne group prepared the survey results and documented analytical findings in a memorandum, which EPS carefully reviewed.
Relying on survey findings, EPS collaborated with City staff to evaluate key conclusions within the context of perceived employment scheduling issues and potential policy solutions. EPS focused on the degree to which retail and restaurant employees reported that they are experiencing undesirable employer practices and the degree to which they find these practices problematic.
Attachment 2-a

Chad Smalley, City of Emeryville July 27, 2016 Page 2
P:\161000s\161091_Emeryville\Staff Report\SurveyResearchCoverLetter.docx
From this perspective, EPS offered City staff our judgments concerning the degree of employee scheduling issues and the related need, if any, for the various policy options being contemplated. In our view, based on the data collected, “underemployment” is the most significant issue facing retail and restaurant workers in Emeryville, with nearly four out of ten employees reporting that they want to work more at their job. The “Offer of Hours” approach to increasing the hours worked by current employees deserves consideration. The data indicate to us that employee scheduling practices are less of a concern. The survey data tell us that almost nine out of 10 employees have input into their schedule and that just over one in ten employees find short-notice schedule changes to be not at all problematic.
The enclosed memorandum by The Henne Group details the questionnaire design, survey sampling strategy, data collection methods, and findings from the research. EPS believes that given the time and resources allocated to this research effort, the quality of this research is quite robust. Not only will these data offer insight into the policy discussion around Fair Work Week issues, but also will provide the City a baseline assessment of employee characteristics and scheduling conditions against which future data collection efforts may be compared.
Sincerely,
ECONOMIC & PLANNING SYSTEMS, INC.
Walter Kieser Ben Sigman Senior Principal Executive Vice President

Summar y o f Resear ch F ind ing s w i t h Po l i cy Co nt ext
Advanced Notice of Schedule Change
About 30 percent of employees report scheduling less than a week in advance. Roughly two-
thirds report scheduling less than two weeks in advance. Despite the near-term nature of
scheduling, nearly nine out of ten employees report having input into their work schedules.
Conclusion: Could be an issue
Predicable Pay Provisions
Short-notice schedule changes, being called in, sent home, or having a shift cancellation is not
widely reported. Only about one in four employees report schedule changes with less than 24
hours of notice. Of those who do report these short-notice changes, half say it is no problem at
all. Only about 12 percent of employees report that short-notice schedule changes are at all
problematic.
Conclusion: Not a significant issue
Offer of Hours
Workers do report that they want more work. Almost 40 percent of respondents indicate that
they could work more hours at their current job.
Conclusion: A valid issue
Right to Refuse "Clopening" Shifts
Less than three out of ten respondents report working clopening shifts. About 40 percent of
employees reporting that they work clopenings are required to work them. Overall, clopenings
are an issue for less than 15 percent of employees.
Conclusion: Not a significant issue
Right to Request Flexible Work Arrangement
About 9 out of 10 employees report having input into the development of their work schedule.
Conclusion: Could be an issue

Suppo r t ing F igur es
Underemployment
When employees were asked if they desire to work more hours than they are currently, 39
percent of all respondents indicated that they would. This overall finding is generally consistent
with findings for large retailers and restaurants.
Yes39%
No61%
Underemployment: Do you wish you could work more hours?

Scheduling Input
When asked how best to describe the way in which their schedule was developed, 87 percent of
all respondents answered that employers created the schedules with some input taken from
employees. Only 11 percent answered that employers created schedules with no input taken
from employees, with the remained of respondents indicating that schedules were beyond the
control of both the employee and employer.
Some Input87%
No Input13%
Scheduling Input

Schedule Timing
Respondents were asked to how much in advance of the start of the work week they received
their schedules. Approximately five percent of employees appear to be affected by scheduling
that occurs with less than 24 hours of notice.
4%
26%
38%
18%
14%
Schedule Timing
Less than 24 hours in advanceof the start of the work week
24 hours to less than 1 week inadvance
1 week to less than 2 weeks inadvance
2 weeks to less than 3 weeks inadvance
3 weeks or more in advance

Called In
When asked about getting called in to cover a shift they were not originally scheduled for, only 9
percent of all respondents had gotten called in and felt that it was somewhat of a problem.
Yes, A Problem9%
Yes, Not A Problem48%
No42%
Called In

Short-Notice Change
When asked if employees had experienced changes to their schedules with less than 24 hours of
notice, 8 percent responded that they had experienced these schedule changes and they were
somewhat of a problem.
Yes, A Problem8%
Yes, Not A Problem16%
No76%
Short-Notice Change

Sent Home
When employees were asked if they had showed up for a scheduled shift, then been sent home,
just 6 percent of all employees had this experienced and seen it as somewhat of a problem.
Further, this seemed to be much less of an issue with employees of very large retailers.
Yes, A Problem6%
Yes, Not A Problem26%
No67%
Sent Home

Shift Cancellation
When employees were asked if they had a shift cancelled, approximately 90 percent responded
that they have never experienced this issue.
Yes, A Problem1%
Yes, Not A Problem8%
No91%
Shift Cancellation

Clopenings
When respondents were asked if they had been scheduled or worked shifts within 11 hours of
each other, also known as “Clopenings,” 72 percent of all respondents had not, while 19 percent
had but reported they were not a problem at all.
Yes, A Problem9%
Yes, Not A Problem19%
No72%
"Clopenings"

Figure 1 Summary of Key Data Findings
Category/Question All Large RetailLarge Retail &
Large Restaurant
Underemployment In General, do you wish you could work more hours?
Yes 39% 42% 41%
No 61% 58% 59%
Schdule Input Which of the following statements best describes how your schedule is developed?1
Employee has some input in scheduling 87% 80% 81%
Employee has no input 13% 20% 19%
Schedule Timing When is your schedule usually posted?
Less than 24 hours in advance 4.3% 4.8% 5.2%
24 hours to less than 1 week in advance 26.0% 27.9% 28.1%
1 week to less than 2 weeks in advance 37.5% 21.2% 30.4%
2 weeks to less than 3 weeks in advance 18.1% 35.6% 28.1%
3 weeks or more in advance 14.1% 10.6% 8.1%
Called In Do you ever get called in to cover a shift that you weren't originally schduled for?2
Yes, A Problem 9% 8% 7%
Yes, Not A Problem 48% 45% 50%
No 42% 47% 43%
Short-Notice Change Does your shift schedule ever change with less than 24 hours notice?2
Yes, A Problem 8.2% 6.7% 6.7%
Yes, Not A Problem 16.1% 12.5% 14.8%
No 75.7% 80.8% 78.5%
Sent Home Do you ever get sent home early from a shift?2
Yes, A Problem 6.3% 6.7% 8.1%
Yes, Not A Problem 26.3% 15.4% 25.2%
No 67.4% 77.9% 66.7%
Shift Cancellation Does a shift you were scheduled for ever get cancelled?2
Yes, A Problem 1.3% 2.1% 1.6%
Yes, Not A Problem 7.6% 7.5% 9.5%
No 91.1% 90.4% 88.9%
"Clopenings" Do you ever work consecutive shifts that are separated by 11 hours or less?2
Yes, A Problem 9.2% 7.7% 10.4%
Yes, Not A Problem 19.1% 20.2% 18.5%
No 71.7% 72.1% 71.1%
Sources: The Henne Group; Economic & Planning Systems, Inc.
1Employees were asked to identify which of five statements best described scheduling practices. One statement indicated that
employees were not consulted at all. Three statements seen above as "employee has some input in scheduling" reflect a range of
answers. Employees that indicated that scheduling was out of the control of both the employer and employee are excluded.
2After being asked the question stated above, respondents were then asked to respond to statements reflecting how often and how
much of a problem these experiences were. These data characterize not a problem when the respondent answered "not a problem
at all."

116 New Montgomery Street Suite 812 San Francisco, CA 94105
t. 415.348.1700 f. 415.348.1770
www.thehennegroup.com
To: Chadrick Smalley, City of Emeryville
Benjamin C. Sigman, Economic & Planning Systems
From: Kevin Connors, The Henne Group
Re: Summary of findings from 304 street intercept interviews with restaurant and
retail employees in Emeryville
Date: July 26, 2016
The following summarizes our key findings from 304 street intercept interviews conducted on
behalf of the City of Emeryville (Emeryville) to gather information related to the Fair Work
Week ordinance.
Project Background
In several municipalities across the country, some cities have begun drafting and implementing
ordinances to protect hourly employees from unfair labor practices. In the Bay Area, San
Francisco has enacted the Formula Retail Employee Rights Ordinances (FRERO), and
Emeryville has taken up an effort to possibly implement a similar ordinance. In a city council
meeting held in May 17, 2016, there was a motion approved to begin drafting a Fair Workweek
ordinance. At that meeting, the city set out to meet goals which were: to increase the stability of
schedules for low wage workers, reduce employee turnover in retail and increase the number of
hours worked by hourly full-time and part time employees.
In order to get a more complete picture of the issues that would need to be addressed in a possible ordinance, THG, in conjunction with Economic & Planning Systems, Inc (EPS), designed a research study to interview Emeryville hourly employees who would be affected by such an ordinance, to determine which issues might need to be addressed by a possible ordinance.
Questionnaire Design
THG staff worked with the city to design the questionnaire that was used. We were aiming to produce a
questionnaire that would take about 5 minutes to administer in the field. The average length of the final
questionnaire was just 5 minutes. .
In developing the questionnaire, research was done in order to understand what information
Emeryville would need to gather to help determine the differences in schedules and any issues
that are arising in Emeryville. The questions developed considered various scheduling scenarios
Attachment 2-b

that these employees might encounter, how often they occurred, and how bothered they were by
these practices.
Sample Stratification
On June 20, Emeryville provided THG with a list of 185 businesses operating in Emeryville. For
each business listed, THG was given a description of the industry they worked in, a tally of the
number of employees at the location, the address at which the business was located, and an
indication as to whether the business was a chain or not.
After an initial review of the sample, THG and Emeryville determined that it would be best to
establish a two-dimensional sampling frame, splitting out the total number of employees by
business type (retail versus restaurant) and size (small, medium, and large). This became the
primary sample stratification. Within these constraints, we decided to also establish loose quotas
on two other variables: Chain versus non-chain, and Geographic location. By adding these
additional layers to our sampling methodology, we could better represent all Emeryville hourly
employees.
We began constructing the sampling frame by referring to the sample file’s industry column and
designating the businesses as one of two types: restaurant or retail. We then used the employee
counts to divide the sample into small (fewer than 10 employees), medium (10-54 employees),
and large (55 employees or more) businesses. Within the large category, we identified two
businesses (Ikea and Home Depot) with more than twice as many employees (352 and 241,
respectively) as the next largest business. These businesses were assigned their own separate
size categories.
THG used the address information to develop a coding system for the businesses’ locations. We
identified six distinct geographic areas. These were:
Bay Street Emeryville, a self-contained shopping center on Bay Street
Powell Street Plaza, a separate self-contained shopping center on Christie Avenue
San Pablo Avenue, a six-block cluster of business at Emeryville’s south end
North of Powell, all of Emeryville that lies north of Powell Street and east of I-80
South of Powell, all of Emeryville that lies south of Powell Street, excluding Bay Street,
Powell Street, and San Pablo Avenue
Peninsula, all of Emeryville that lies west of I-80
Once the coding was complete, we established quotas by type, size, location, chain/non-chain
status. These were considered to be soft quotas, functioning more as guides we could use to
ensure as representative a sample as possible.

After the start of data collection, we completed interviews with employees of two Emeryville
businesses that were not in the original sample list. The sampling frame was adjusted post hoc to
include these businesses.
The following tables show how the final sample file broke down within the established quota
frames.
Table 1. Sample by Type and Size – Original Targets
Category Employee Count Percent of all
Employees
Target Number of
Completed Surveys
Restaurant
Small 121 3.0% 9
Medium 737 18.4% 55
Large 389 9.7% 29
Home Depot -- -- --
Ikea -- -- --
Total 1,247 31.2% 93
Retail
Small 255 6.4% 19
Medium 1,098 27.5% 82
Large 807 20.2% 61
Home Depot 241 6.0% 18
Ikea 352 8.8% 27
Total 2,753 68.8% 207
All
Small 376 9.4% 28
Medium 1,835 45.9% 137
Large 1,196 29.9% 90
Home Depot 241 6.0% 18
Ikea 352 8.8% 27
Grand Total 4,000 100.0% 300
Table 2. Sample by Status (Chain vs. Non-Chain) – Original Targets
Category Employee Count Percent of all
Employees
Target Number of
Completed Surveys
Chain 3,364 84.1% 252
Non-Chain 636 15.9% 48
Grand Total 4,000 100.0% 300

Table 3. Sample by Location – Original Targets
Category Employee Count Percent of all
Employees
Target Number of
Completed Surveys
Bay Street 1,413 35.3% 106
Powell Street 408 10.2% 31
San Pablo 371 9.3% 28
North of Powell 414 10.4% 31
South of Powell 1,157 28.9% 87
Peninsula 237 5.9% 18
Grand Total 4,000 100.0% 300
Data Collection Methods
Data collection for this project began on June 30th
and ended on July 13th
. During that time,
THG ran a total of 10 shifts which were staffed by an average of three interviewers and one
supervisor per shift. In nine of the ten shifts, there was at least one Spanish-speaker present
available to conduct interviews in Spanish. Seventeen of the 304 interviews were conducted in
Spanish.
To ensure representation of all employee shift types (morning, afternoon, and evening) in the
response set, THG scheduled its interviewers at a variety of times. Shifts began between 8:30
AM and 12:00 PM and ended between 3:30 PM and 7:30 PM. Interviewers were in the field an
average of six hours and 50 minutes per shift.
Interviewers were deployed individually or in groups of two or three to locations throughout the
city. We initially focused our efforts on Bay Street and Powell Street, and then branched out to
the other locations as the days went on.
Once at their designated location, the interviewers positioned themselves in shopping centers, at
bus stops, near store fronts, or in areas where workers tended to congregate for mid-shift breaks.
Interviewers also boarded the Emery Go Round to intercept workers during their commute.
Interviewers were proactive in targeting individuals, specifically seeking out anyone wearing a
uniform, apron, or name tag indicating that they worked in the area. Interviewers also
approached non-uniformed individuals waiting at bus stops or walking around shopping centers
to ask them if they worked in the area.
All interviewers were equipped with name tags that identified them as employees of THG and
representatives of Emeryville. They were also given authorization letters printed on Emeryville
letterhead which explained the purpose of the study and validated their presence in the area.
Intercepting individuals on the street became less effective after a few days out in the field
because of several reasons: 1) a high number of refusals as workers were rushing to work or
home and they didn’t have time to complete our survey; 2) interviewers were observing the same
individuals every day, and 3) a slower completion rate than expected. Then we decided to
expand our outreach strategy by going into businesses requesting permission to managers to
interview their employees. To round out the dataset, we began targeting employees of medium
and large businesses and specific areas in Emeryville. .
Many of the managers were cooperative, which made this a very effective approach. One
notable exception was that Ikea refused to allow our interviewers on their premises and
instructed their employees not to participate in the survey.1 As stated earlier, because of their
size, we had hoped to establish quotas for both Ikea as well as Home Depot. Ikea’s
unwillingness to participate made this impossible. Though we had hoped to complete 27 surveys
with Ikea’s employees, we wound up with only five. To compensate, we over-sampled Home
Depot employees (28 completes vs. 18 targeted) and other large retailers (71 completes vs. 61
targeted).
Additional efforts were made to deliver a demographically balanced dataset. For example, after
discovering that we had completed far more surveys with females than with males, interviewers
were instructed to make a point to approach more males. Similarly, after discovering that we had
a high percentage of completes with individuals younger than 30, we instructed our interviewers
to make a point to approach and interview older individuals. Since we really had no idea how
Emeryville hourly employees segmented by gender or by age, we were just trying to make sure
the final database wasn’t comprised primarily of one type of employee versus another.
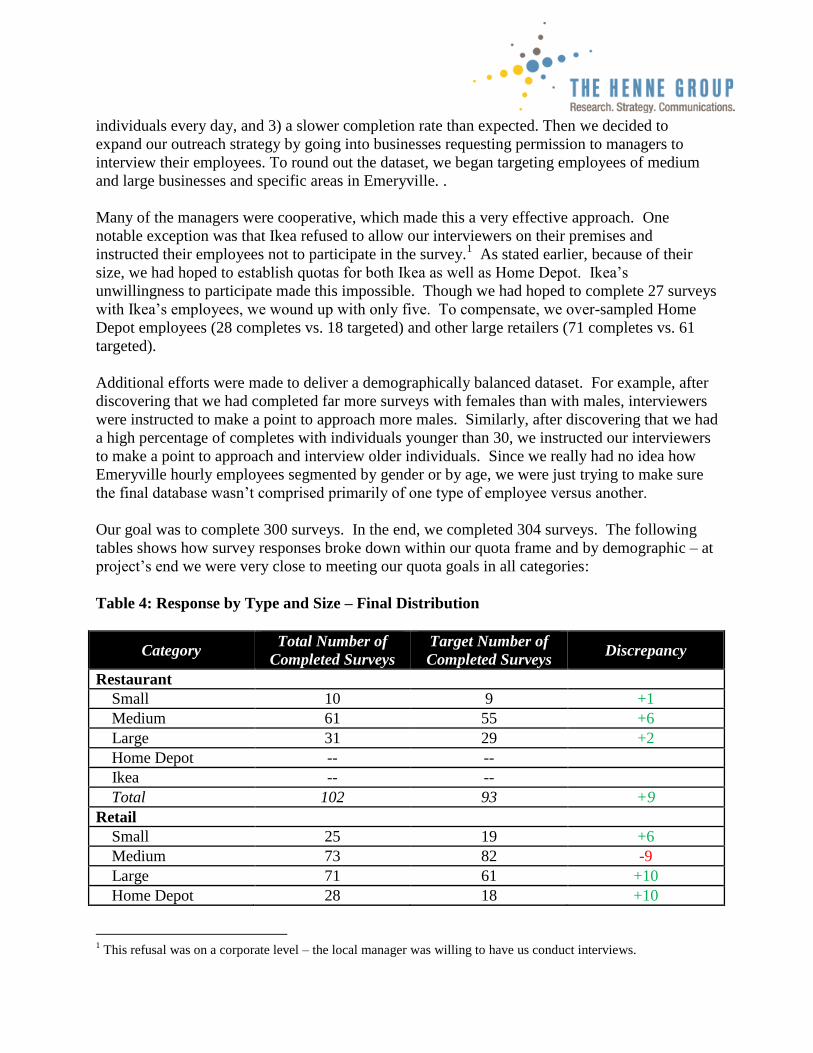
Our goal was to complete 300 surveys. In the end, we completed 304 surveys. The following
tables shows how survey responses broke down within our quota frame and by demographic – at
project’s end we were very close to meeting our quota goals in all categories:
Table 4: Response by Type and Size – Final Distribution
Category Total Number of
Completed Surveys
Target Number of
Completed Surveys Discrepancy
Restaurant
Small 10 9 +1
Medium 61 55 +6
Large 31 29 +2
Home Depot -- --
Ikea -- --
Total 102 93 +9
Retail
Small 25 19 +6
Medium 73 82 -9
Large 71 61 +10
Home Depot 28 18 +10
1 This refusal was on a corporate level – the local manager was willing to have us conduct interviews.

Category Total Number of
Completed Surveys
Target Number of
Completed Surveys Discrepancy
Ikea 5 27 -22
Total 202 207 -5
All
Small 35 28 +7
Medium 134 137 -3
Large 102 90 +12
Home Depot 28 18 +10
Ikea 5 27 -22
Grand Total 304 300 +4
Table 5. Response by Status (Chain vs. Non-Chain) – Final Distribution
Category Total Number of
Completed Surveys
Target Number of
Completed Surveys Discrepancy
Chain 250 252 -2
Non-Chain 54 48 +6
Grand Total 304 300 +4
Table 6. Response by Location – Final Distribution
Category Total Number of
Completed Surveys
Target Number of
Completed Surveys Discrepancy
Bay Street 117 106 +11
Powell Street 35 31 +4
San Pablo 28 28 0
North of Powell 30 31 -1
South of Powell 67 87 -20
Peninsula 21 18 +3
Multiple Locations2 6 -- +6
Grand Total 304 300 +4
2 Six completes were gathered from employees of Starbucks or Subway, which both have multiple locations
throughout the city. As location of business was not recorded as part of the survey, we are unable to determine
which location category these fall into.

Table 7. Response by Demographic Category – Final Distribution
Category Response Count Percent within Group
Gender
Male 133 43.7%
Female 171 56.3%
Total 304 100.0%
Race/Ethnicity
White/Caucasian 61 20.1%
Black/African-American 84 27.6%
Asian 37 12.2%
Hispanic/Latino 76 25.0%
Mixed Race 34 11.2%
Other 7 2.3%
Prefer not to say 5 1.6%
Total 304 100.0%
Age
18-24 years 126 41.4%
25-29 years 74 24.3%
30-34 years 37 12.2%
35-39 years 18 5.9%
40-44 years 19 6.3%
45-49 years 8 2.6%
50-54 years 7 2.3%
55-59 years 4 1.3%
60-64 years 7 2.3%
65 years or older 3 1.0%
Prefer not to say 1 0.3%
Residence of Employees
(County)
Alameda 179 58.9%
Butte 1 0.3%
Contra Costa 90 29.6%
San Francisco 5 1.6%
San Mateo 1 0.3%
Santa Clara 3 1.0%
Solano 6 2.0%
Stanislaus 1 0.3%
Unknown 14 4.6%
Prefer not to say 4 1.3%
Grand Total 304 100.0%

Table 7. Response by Demographic Category – Final Distribution (cont’d)
Category Response Count Percent within Group
Residence of Employees (Cities within Alameda County only)
Alameda 10 5.6%
Albany 2 1.1%
Berkeley 15 8.4%
Castro Valley 1 0.6%
Dublin 1 0.6%
Emeryville 36 20.1%
Fremont 1 0.6%
Hayward 7 3.9%
Newark 1 0.6%
Oakland 91 50.8%
San Leandro 9 5.0%
San Lorenzo 4 2.2%
Union City 1 0.6%
Grand Total 179 100.0%
About This Report
THG completed 304 interviews with respondents selected from an estimated universe of 4,000
employees working in Emeryville businesses. This sample size provides for percentage
estimates that are subject to a sampling error of no more than 5.4 percentage points at the 95
percent confidence level. That is, if the sampling process which obtained 304 respondents was
repeated 100 times within the same population universe, then in 95 cases out of 100 the sample
percentage estimates bounded by no more than 5.4 percentage points would contain the true
population percentages. The sampling error becomes smaller for sample percentage estimates
moving away from 50% in either direction.
In the analysis presented below, THG performed chi-squared analyses of the pertinent measures
along both business size, as well as type of business (restaurant vs. retail; chain vs. non-chain) to
discern any systematic relationships based on size or type of business. Results are shown that
are statistically significant at the .05 level of statistical significance.
Findings
The following summarizes the key findings from the survey, presented in the order that the
questions were administered in the field.

Q9. In general, do you wish you could work more hours at [your job]?
Four in ten respondents (39.1%) said that they wished they could work more hours at their
current job. Looking at respondents by the average number of hours they work per week, we see
that just over half (54.6%, or 65 out of 119) of those presently working less than 30 hours wish
they can work more hours. Within this group, 33.8% wished for a 26-50% increase in their
hours, 29.2% wished for a 51-75% increase, and 23.1% wished for an increase of twice as much
or more.
By comparison, three out of every ten (31.8%, or 54 out of 170) of those who are presently
working 30 hours or more per week said they wished they could work more hours. Of those,
59.3% said they wanted an increase of 25% or less while 38.9% said they wanted an increase of
26-50%.
Breaking the responses down by business type, size, and status revealed no significant
differences.
Q11. Which of the following statements best describes how your schedule is developed?
More than eight out of every ten respondents (86.5%) indicated that they had at least some
influence on how their schedule was developed. Nearly half (46.4%) said “my schedule is
decided by my employer, but with my input” and nearly one in three (29.6%) said “I can decide
what my schedule will be, but within certain limits.” Another ten percent (10.5%) said “I am
entirely free to decide what my schedule will be.”
Separating the responses by business type and status revealed no differences between restaurants
and retail shops or chains and non-chains. Looking at the responses by size, however, revealed
one key difference. Between 85% and 92% of employees at small, medium, or large businesses
indicated that they had at least some influence on how their schedule was developed, compared
to only 67% (22 of 33) of those working at Home Depot or Ikea.
Q11 Discussion: Those working at Home Depot and possibly Ikea seem to have the least control
over their schedules, but even at these stores, two-thirds say they have at least some control.3
Q12. Which of the following are consistent from week to week and which vary from week to
week?
Nearly two-thirds of all respondents (62.8%) said that their total number of hours was consistent
from week to week. Roughly the same amount of respondents (63.8%) said that the days they
3 Because we only interviewed five respondents from Ikea, it really isn’t possible to say anything definitive about
Ikea employees. For this analysis we’ve combined Home Depot employees with Ikea employees.
worked were consistent. A similar number (56.6%) said that the specific times they worked
stayed consistent.
Breaking the responses down by type, size, and status revealed several differences:
Differences by Type. While roughly the same proportion of restaurant and retail
employees (64.7% and 61.9%) could count on their total number of hours being
consistent from week to week, experiences were different when regarding specific days
and times worked. There was much more variance in retail employees’ schedules. Only
57.4% (compared to 76.5% of restaurant employees) said that their days worked stayed
consistent, and only 50.0% (compared to 69.6% of restaurant employees) said that their
times worked stayed consistent.
Differences by Size. Employees of small businesses had much more reliable schedules
than those at medium and large businesses. Eight out of ten (80.0%) small business
employees said that their total number of hours were consistent, three out of four
(74.3%) said that their days worked were consistent, and two out of three (65.7%) said
that their times worked were consistent. Employees of larger businesses dealt with
much more variance. Roughly five in ten (53.9%) of those working at large businesses
said their total number of hours were consistent. Approximately the same portion
(54.5%) of those working at Home Depot or Ikea said that their specific days stayed
consistent, while just over half (51.5%) of the same group said that their specific times
stayed consistent.
Differences by Status. Schedules were more reliable for employees of non-chains than
those of chains. More than eight out of ten (85.2%) of non-chain employees said their
specific days stayed consistent while more than two-thirds (70.4%) said their specific
times stayed consistent. For chain employees, meanwhile, only six in ten (59.2%) said
their specific days were consistent while closer to half (53.6%) said their specific times
were consistent.
Q12 Discussion: About four-in-ten DO NOT have consistent schedules, and the consistency of
schedules is less for those working in retail stores versus restaurants, and even less for those
working in chain stores and larger retail outlets.
Q13. When is your schedule usually posted?
Most employees (69.7%) have their schedule posted at least one week in advance of the start of
the work week. That leaves a fairly large portion (30.3%) of respondents, though, who have

their schedules posted with less than a week’s notice. The largest portion of this group (26.0%
of all respondents) is given between 24 hours and one week’s advance notice, while the
remainder (4.3% of all respondents) report being given less than 24 hours’ advance notice.
Breaking the responses down reveals some small differences. Three-fourths (74.3%) of those
who work at retail stores said their schedules are posted with at least one week’s advance notice,
as opposed to 60.8% of those who work at restaurants. Nearly all of those who work at Home
Depot or Ikea (93.9%) and nearly three-fourths (72.2%) of those working at small businesses
said their schedules are posted with at least one week’s advance notice as opposed to 57.8% of
those working at large businesses.
Q13 Discussion – Seven-in-ten have their schedules set more than a week in advance, with very
few given less than a day’s notice. Those working in retail stores are more likely to have more
than a week’s notice, and those working at Home Depot or small- or medium-sized companies
are more likely to have at least a week’s notice.
Q14. Do you ever get called in to cover a shift you weren’t originally scheduled for?
Nearly six in ten respondents (57.6%) said that they do get in called in to cover shifts. A fairly
large portion of those who responded “yes” to this (52.0%) said that this happens at least once a
month, although most (84.0%) said this really wasn’t a problem for them (giving a response of 1
or 2 on a 5-point scale).
Breaking the responses down revealed only one key difference: Looking at the data by business
size showed that only 42.4% of those who worked at Home Depot or Ikea have been called in to
cover a shift, compared to about six in ten (59.4%) of those who worked at small, medium, or
large businesses.
Q14 Discussion: Many do get called in to cover shifts, and this is somewhat less likely to occur
at Home Depot and Ikea than in other businesses. Most say it is not a problem when this
happens.
Q15. Does your shift schedule ever change with less than 24 hours’ advance notice?
Only a quarter (24.3%) of all respondents said that their schedule ever changed with less than 24
hours’ advance notice. Of those, just over half (51.4%) said that this happened at least once a
month and two-thirds (66.2%) said it wasn’t a problem (rating the degree to which it was a
problem as a 1 or a 2 on a 5-point scale).
Breaking the responses down by business size revealed that these kinds of changes were much
less common for those who worked at Home Depot or Ikea (9.1%).
No differences were revealed when breaking the responses down by business type.

Q15 Discussion: Just one-quarter said their shifts would change with less than a day’s notice,
and most of these said it wasn’t a problem when it happened.
Q16. Do you ever get sent home early from a shift?
Close to one-third (32.6%) of respondents said that they had been sent home early from a shift.
Nearly one of every five of those (19.2%) said that it happened once a week or more. Roughly
the same amount (19.3%) rated the degree to which it was a problem for them as either a 3 or
above.
Breaking the responses down revealed differences across some dimensions. The biggest
difference was that nearly half of all restaurant employees (48.0%) were sent home early from
shifts, compared to just one-fourth (24.8%) of retail employees. The frequency at which this
happens is also different between restaurant employees and retail employees. Six out of every
ten (61.2%) of restaurant employees who have been sent home early said that this happened at
least once a month, compared to just 24.0% of retail employees who have been sent home early.
Looking at the responses by business size revealed some interesting differences. While more
than four in ten of large business employees (44.1%) said they were sent home early, 32.0% of
those working for medium and small businesses said this happened, and none of the Home Depot
or Ikea employees said the same. Of those employees who were sent home early, just over four
in ten (42.4%) said that this happened at least once a month and one fifth (19.3%) rated the
degree to which it was a problem as a 3 or above.
Q16 Discussion: One-third do say they are sometimes sent home early, and this is a problem for
about a fifth of these employees.
Q17. Does a shift you were schedule for ever get cancelled?
This was the least common scheduling practice of any that we asked about. Fewer than one in
ten (8.9%) said that this was something that had happened to them. Of those who did have this
experience, 85.2% said that it happened less than once a month and the exact same percentage
(85.2%) said this wasn’t a problem (giving a rating of 1 or 2 on a 5-point scale)..
Breaking the responses down revealed little in the way of significant differences.
Q17 Discussion: The outright cancelation of shifts seems to be a relatively minor issue.

Q18. Do you ever work consecutive shifts that are separated by 11 hours or less?
Almost three out of every ten respondents (28.3%) said that they had worked consecutive shifts
separated by 11 hours or less. Of those, more than half (55.8%) said that this happened at least
once a month, and almost a third (32.6%) rated the degree to which this was a problem for them
as a 3 or above.
For those who had worked consecutive shifts, we also asked whether they were required to work
those shifts or if they had the option to turn them down. Two-fifths (43.0%) said they were
required while the remainder (57.0%) said they had the option to turn them down.
There were no differences by key subgroups associated with this variable.
Q18 Discussion: Scheduling back-to-back shifts happens to three out of every ten employees,
half say it happens at least once a month, many (43%) say they don’t have a choice, and 1/3 say
it’s a problem.
Related Documents