ORIGINAL RESEARCH published: 08 July 2015 doi: 10.3389/fncir.2015.00034 Frontiers in Neural Circuits | www.frontiersin.org 1 July 2015 | Volume 9 | Article 34 Edited by: Manuel S. Malmierca, University of Salamanca, Spain Reviewed by: Tim Murphy, The University of British Columbia, Canada Jian-young Wu, Georgetown University, USA *Correspondence: Ron D. Frostig, Department of Neurobiology and Behavior, University of California, Irvine, 2219 McGaugh Hall, Irvine, CA 92617, USA [email protected] Received: 23 March 2015 Accepted: 23 June 2015 Published: 08 July 2015 Citation: Jacobs NS, Chen-Bee CH and Frostig RD (2015) Emergence of spatiotemporal invariance in large neuronal ensembles in rat barrel cortex. Front. Neural Circuits 9:34. doi: 10.3389/fncir.2015.00034 Emergence of spatiotemporal invariance in large neuronal ensembles in rat barrel cortex Nathan S. Jacobs 1, 2 , Cynthia H. Chen-Bee 1 and Ron D. Frostig 1, 2, 3 * 1 Department of Neurobiology and Behavior, University of California, Irvine, Irvine, CA, USA, 2 Department of Neurobiology and Behavior, Center for the Neurobiology of Learning and Memory, University of California, Irvine, Irvine, CA, USA, 3 Department of Biomedical Engineering, University of California, Irvine, Irvine, CA, USA Invariant sensory coding is the robust coding of some sensory information (e.g., stimulus type) despite major changes in other sensory parameters (e.g., stimulus strength). The contribution of large populations of neurons (ensembles) to invariant sensory coding is not well understood, but could offer distinct advantages over invariance in single cell receptive fields. To test invariant sensory coding in neuronal ensembles evoked by single whisker stimulation as early as primary sensory cortex, we recorded detailed spatiotemporal movies of evoked ensemble activity through the depth of rat barrel cortex using microelectrode arrays. We found that an emergent property of whisker evoked ensemble activity, its spatiotemporal profile, was notably invariant across major changes in stimulus amplitude (up to >200-fold). Such ensemble-based invariance was found for single whisker stimulation as well as for the integrated profile of activity evoked by the more naturalistic stimulation of the entire whisker array. Further, the integrated profile of whisker array evoked ensemble activity and its invariance to stimulus amplitude shares striking similarities to “funneled” tactile perception in humans. We therefore suggest that ensemble-based invariance could provide a robust neurobiological substrate for invariant sensory coding and integration at an early stage of cortical sensory processing already in primary sensory cortex. Keywords: barrel cortex, stimulus invariance, multi-site recording, whisker array, sensory funneling Introduction Invariance (also known as constancy, tolerance, or robustness) of sensory systems to major changes in sensory parameters is pivotal for survivability in a continuously changing sensory environment. How invariant sensory coding emerges at the neuronal level remains elusive. Neuronal invariance is typically studied in individual cortical neurons (Lueschow et al., 1994; Anderson et al., 2000; MacEvoy and Paradiso, 2001; Quiroga et al., 2005; Li and DiCarlo, 2008; Sadagopan and Wang, 2008). Coordinated activity of neuronal ensembles (Nicolelis and Lebedev, 2009; Quiroga and Panzeri, 2009; Buzsáki, 2010), could offer distinct advantages for invariant coding. For example, neuronal ensembles could mitigate notoriously variable responses in individual cortical neurons (Shadlen and Newsome, 1998). Invariance at the neuronal ensemble level could also rely on emergent response properties, such as spatiotemporal profiles of activity, which would be particularly relevant in topographically organized primary sensory cortices.

Welcome message from author
This document is posted to help you gain knowledge. Please leave a comment to let me know what you think about it! Share it to your friends and learn new things together.
Transcript

ORIGINAL RESEARCHpublished: 08 July 2015
doi: 10.3389/fncir.2015.00034
Frontiers in Neural Circuits | www.frontiersin.org 1 July 2015 | Volume 9 | Article 34
Edited by:
Manuel S. Malmierca,
University of Salamanca, Spain
Reviewed by:
Tim Murphy,
The University of British Columbia,
Canada
Jian-young Wu,
Georgetown University, USA
*Correspondence:
Ron D. Frostig,
Department of Neurobiology and
Behavior, University of California,
Irvine, 2219 McGaugh Hall, Irvine, CA
92617, USA
Received: 23 March 2015
Accepted: 23 June 2015
Published: 08 July 2015
Citation:
Jacobs NS, Chen-Bee CH and Frostig
RD (2015) Emergence of
spatiotemporal invariance in large
neuronal ensembles in rat barrel
cortex. Front. Neural Circuits 9:34.
doi: 10.3389/fncir.2015.00034
Emergence of spatiotemporalinvariance in large neuronalensembles in rat barrel cortexNathan S. Jacobs 1, 2, Cynthia H. Chen-Bee 1 and Ron D. Frostig 1, 2, 3*
1Department of Neurobiology and Behavior, University of California, Irvine, Irvine, CA, USA, 2Department of Neurobiology
and Behavior, Center for the Neurobiology of Learning and Memory, University of California, Irvine, Irvine, CA, USA,3Department of Biomedical Engineering, University of California, Irvine, Irvine, CA, USA
Invariant sensory coding is the robust coding of some sensory information (e.g., stimulus
type) despite major changes in other sensory parameters (e.g., stimulus strength). The
contribution of large populations of neurons (ensembles) to invariant sensory coding
is not well understood, but could offer distinct advantages over invariance in single
cell receptive fields. To test invariant sensory coding in neuronal ensembles evoked
by single whisker stimulation as early as primary sensory cortex, we recorded detailed
spatiotemporal movies of evoked ensemble activity through the depth of rat barrel cortex
using microelectrode arrays. We found that an emergent property of whisker evoked
ensemble activity, its spatiotemporal profile, was notably invariant across major changes
in stimulus amplitude (up to >200-fold). Such ensemble-based invariance was found for
single whisker stimulation as well as for the integrated profile of activity evoked by the
more naturalistic stimulation of the entire whisker array. Further, the integrated profile of
whisker array evoked ensemble activity and its invariance to stimulus amplitude shares
striking similarities to “funneled” tactile perception in humans. We therefore suggest that
ensemble-based invariance could provide a robust neurobiological substrate for invariant
sensory coding and integration at an early stage of cortical sensory processing already
in primary sensory cortex.
Keywords: barrel cortex, stimulus invariance, multi-site recording, whisker array, sensory funneling
Introduction
Invariance (also known as constancy, tolerance, or robustness) of sensory systems to major changesin sensory parameters is pivotal for survivability in a continuously changing sensory environment.How invariant sensory coding emerges at the neuronal level remains elusive. Neuronal invarianceis typically studied in individual cortical neurons (Lueschow et al., 1994; Anderson et al.,2000; MacEvoy and Paradiso, 2001; Quiroga et al., 2005; Li and DiCarlo, 2008; Sadagopan andWang, 2008). Coordinated activity of neuronal ensembles (Nicolelis and Lebedev, 2009; Quirogaand Panzeri, 2009; Buzsáki, 2010), could offer distinct advantages for invariant coding. Forexample, neuronal ensembles could mitigate notoriously variable responses in individual corticalneurons (Shadlen and Newsome, 1998). Invariance at the neuronal ensemble level could alsorely on emergent response properties, such as spatiotemporal profiles of activity, which would beparticularly relevant in topographically organized primary sensory cortices.
Jacobs et al. Ensemble-based invariance
Here we analyzed invariance of neuronal ensemble activityand its spatiotemporal characteristics in barrel cortex, asubdivision of primary somatosensory cortex in rodents.Observed from a mesoscopic vantage point, ensemble activityin barrel cortex is highly spatially organized. Single whiskerevoke large “point spreads” of (mostly subthreshold) activitypeaking over the appropriate barrel (Frostig et al., 2008), andfollowing simultaneous multi-whisker stimulation unique, singlepeak integrated spatial patterns of activity emerge resultingfrom sublinear summation of simultaneously evoked pointspreads (Chen-Bee et al., 2012 see schematics in Figure 1C).The aim of the current study was to assess the potential forspatiotemporal invariance of such neuronal ensembles followingsingle whisker and whisker array stimulation by testing theirpotential for invariance to major changes in the amplitude ofwhisker stimuli (up to >200-fold changes; Figure 1C), as ratsuse and are sensitive to a wide range of whisker deflectionamplitudes (Carvell and Simons, 1990) including very smallamplitudes on the order of tens of microns (Simons, 1978;Jadhav et al., 2009). Movies of whisker evoked neuronal ensembleactivity across a mesoscopic section of barrel cortex includingmost cortical layers were created from simultaneous multi-site recordings (Figure 2). Spatiotemporal profiles of evokedactivity were then continuously monitored and quantifiedwith <1ms temporal resolution, revealing a remarkable degreeof ensemble-based spatiotemporal invariance for both singlewhisker (whisker C2) and whisker array that includes all 24 largewhiskers (vibrissae) evoked activity across the major changesin stimulus amplitude. These findings demonstrate invariant,spatially organized ensemble coding for both simple “point”stimuli (i.e., single whisker) as well as for more complex stimuli(i.e., whisker array) that involve integrated patterns of activity.Finally, we show how these findings could serve as the underlyingneuronal correlate of simultaneous multi-site tactile perceptionin humans known as “funneling,” which is also amplitude-invariant (Békésy, 1967).
Materials and Methods
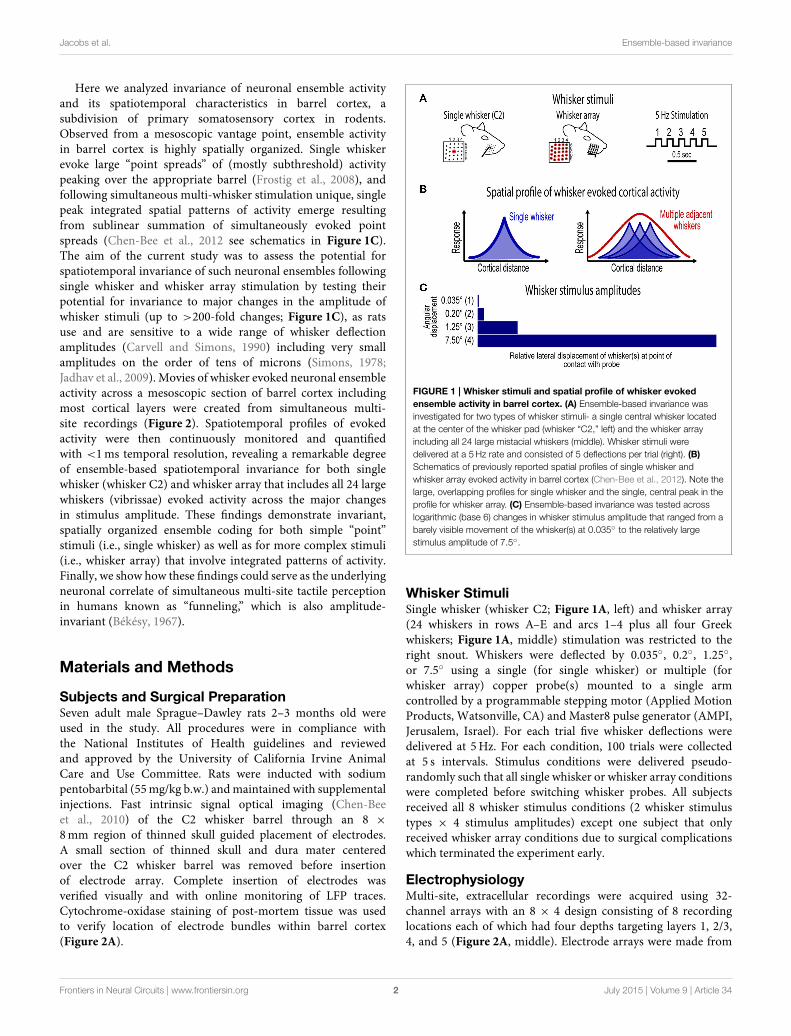
Subjects and Surgical PreparationSeven adult male Sprague–Dawley rats 2–3 months old wereused in the study. All procedures were in compliance withthe National Institutes of Health guidelines and reviewedand approved by the University of California Irvine AnimalCare and Use Committee. Rats were inducted with sodiumpentobarbital (55mg/kg b.w.) andmaintained with supplementalinjections. Fast intrinsic signal optical imaging (Chen-Beeet al., 2010) of the C2 whisker barrel through an 8 ×
8mm region of thinned skull guided placement of electrodes.A small section of thinned skull and dura mater centeredover the C2 whisker barrel was removed before insertionof electrode array. Complete insertion of electrodes wasverified visually and with online monitoring of LFP traces.Cytochrome-oxidase staining of post-mortem tissue was usedto verify location of electrode bundles within barrel cortex(Figure 2A).
FIGURE 1 | Whisker stimuli and spatial profile of whisker evoked
ensemble activity in barrel cortex. (A) Ensemble-based invariance was
investigated for two types of whisker stimuli- a single central whisker located
at the center of the whisker pad (whisker “C2,” left) and the whisker array
including all 24 large mistacial whiskers (middle). Whisker stimuli were
delivered at a 5Hz rate and consisted of 5 deflections per trial (right). (B)
Schematics of previously reported spatial profiles of single whisker and
whisker array evoked activity in barrel cortex (Chen-Bee et al., 2012). Note the
large, overlapping profiles for single whisker and the single, central peak in the
profile for whisker array. (C) Ensemble-based invariance was tested across
logarithmic (base 6) changes in whisker stimulus amplitude that ranged from a
barely visible movement of the whisker(s) at 0.035◦ to the relatively large
stimulus amplitude of 7.5◦.
Whisker StimuliSingle whisker (whisker C2; Figure 1A, left) and whisker array(24 whiskers in rows A–E and arcs 1–4 plus all four Greekwhiskers; Figure 1A, middle) stimulation was restricted to theright snout. Whiskers were deflected by 0.035◦, 0.2◦, 1.25◦,or 7.5◦ using a single (for single whisker) or multiple (forwhisker array) copper probe(s) mounted to a single armcontrolled by a programmable stepping motor (Applied MotionProducts, Watsonville, CA) and Master8 pulse generator (AMPI,Jerusalem, Israel). For each trial five whisker deflections weredelivered at 5Hz. For each condition, 100 trials were collectedat 5 s intervals. Stimulus conditions were delivered pseudo-randomly such that all single whisker or whisker array conditionswere completed before switching whisker probes. All subjectsreceived all 8 whisker stimulus conditions (2 whisker stimulustypes × 4 stimulus amplitudes) except one subject that onlyreceived whisker array conditions due to surgical complicationswhich terminated the experiment early.
ElectrophysiologyMulti-site, extracellular recordings were acquired using 32-channel arrays with an 8 × 4 design consisting of 8 recordinglocations each of which had four depths targeting layers 1, 2/3,4, and 5 (Figure 2A, middle). Electrode arrays were made from
Frontiers in Neural Circuits | www.frontiersin.org 2 July 2015 | Volume 9 | Article 34
Jacobs et al. Ensemble-based invariance
FIGURE 2 | Recording movies of continuous ensemble activity in
barrel cortex. (A) High fidelity 7× 4 electrode arrays were used to
acquire “snapshots” of ongoing activity across a mesoscopic section of
cortex extending beyond the boundaries of rat barrel cortex and
penetrating through most cortical layers (left and middle). (B)
Representative movies of evoked local field potentials (LFP, top) and
multi-unit potentials (MUP, bottom). The last frame of evoked LFP with
dark border is same as in (A). (C) It was initially surprising to see very
early, small amplitude MUP signals occurring before LFP in (B).
However, when LFP (top) and MUP (bottom) filtered traces were
compared during individual trials, the peak negative deflection of the first
detected spike waveform occurred during LFP downslopes. The
apparent discrepancy is resolved by noting the very early, small
amplitude signals in trial averaged MUP (see “onset responses” in
Figures 4D, 6D) that begin before the peak negative deflection of a
single spike which are much more visible in individual traces.
insulated 35 um tungsten wire (California Fine Wire, GroverBeach, CA; insulated with HML and VG bond coating) that wereblunt cut and threaded in groups of four through polyimide guidetubes spaced 0.5mm apart. Mean impedance of electrodes was153 k� ± 55 (measured with IMP-2, Bak electronics, Sanford,FL). Raw signals starting 1 s before and ending 1 s after stimulusonset (total of 3 s per trial) were amplified and digitized at a22 kHz sample rate (SnR system, Alpha Omega, Nazareth, Israel).
Analyses were done using custom MATLAB scripts. Raw
traces were band-pass filtered for local field potentials (LFP,1–300Hz) or multi-unit potentials (MUP, 300–3k Hz) using atwo-pole Butterworth function. LFP and MUP were averagedacross trials. Trial averages of non-rectified, spike filteredtraces have previously been interpreted as population firingsynchrony (Temereanca and Simons, 2003). Trials with electricalnoise (5.32% of trials) were excluded from trial averages.For the few bad channels in arrays (5.36% of channelsoverall, equivalent to 1.6 channels per array), trial averagesfrom adjacent channels at the same cortical depth wereaveraged. In trial averages, mean baseline values 50 to0ms before stimulus onset were subtracted. A Gaussianfilter was used to remove electrical noise near 60Hz. Forgroup analyses, trial averaged data was down-sampled toa 10 kHz sample rate. To spatially align data for groupanalyses, single whisker and whisker array data sets foreach subject were shifted horizontally to align peak LFPresponses in layers 2/3 and 4 for the strongest stimulus
amplitude (7.5◦). For suprathreshold responses, an abundanceof overlapping spike waveforms (Supplementary Figure 1; seealso Bar-Gad et al., 2001; Temereanca et al., 2008) madeit difficult to interpret PSTHs of spike times although theseresults were still consistent with main findings (SupplementaryFigures 2, 3).
Spatiotemporal AnalysesElectrophysiology data was analyzed at the mesoscopic level (i.e.,data from all electrodes were analyzed concurrently). Framesof activity were normalized by dividing by the maximum valueacross all recording locations within 50ms of stimulus onset(data for each deflection was normalized separately). Onsetframes of activity were the first frames with a maximum valuegreater than the 99% confidence interval for pre-stimulus data10 to 0ms before stimulus onset. Peak frames of activity wereframes with the maximum value within 50ms of stimulusonset.
Principal component analysis (PCA) was performed onnormalized data. Each frame of activity for each subjectand condition (stimulus amplitudes 1–4) was vectorized andtreated as a single observation without centering about themean. Loadings for each principal component correspondedto how similar each frame of activity was to that particularprincipal component. Note that unlike correlations such loadingsare sensitive to absolute magnitude, for example the weakermagnitudes in a frame of activity before peak responses would
Frontiers in Neural Circuits | www.frontiersin.org 3 July 2015 | Volume 9 | Article 34
Jacobs et al. Ensemble-based invariance
result in a reduced loading even if it had an identical relativeprofile of activity.
Pearson’s correlations were calculated separately for eachsubject and group averages reported (mixed-model). Confidenceintervals for pre-stimulus r2-values were calculated from allstimulus amplitude comparisons using a pre-stimulus timewindow (−10 to 0ms for analysis of 25ms window in Figures 3–6E and -200 to 0ms for analysis of 1.4 s window in Figure 7).Quartile-quartile plots of data at pre-stimulus, onset, andpeak responses revealed no major deviations from a normaldistribution. All spatiotemporal analyses were done withinsubjects and group statistics reported.
Statistical AnalysesAll parametric statistics (repeated measures ANOVA, paired t-tests) were performed in SYSTAT version 11. For grand means,multiple values for each subject were first averaged before grandmean and s.e.m. calculations.
Results
The current project assessed invariance in spatiotemporalprofiles of whisker evoked ensemble activity in rat barrelcortex across major changes in stimulus amplitude. Two typesof whisker stimulation were used, single whisker (C2) and
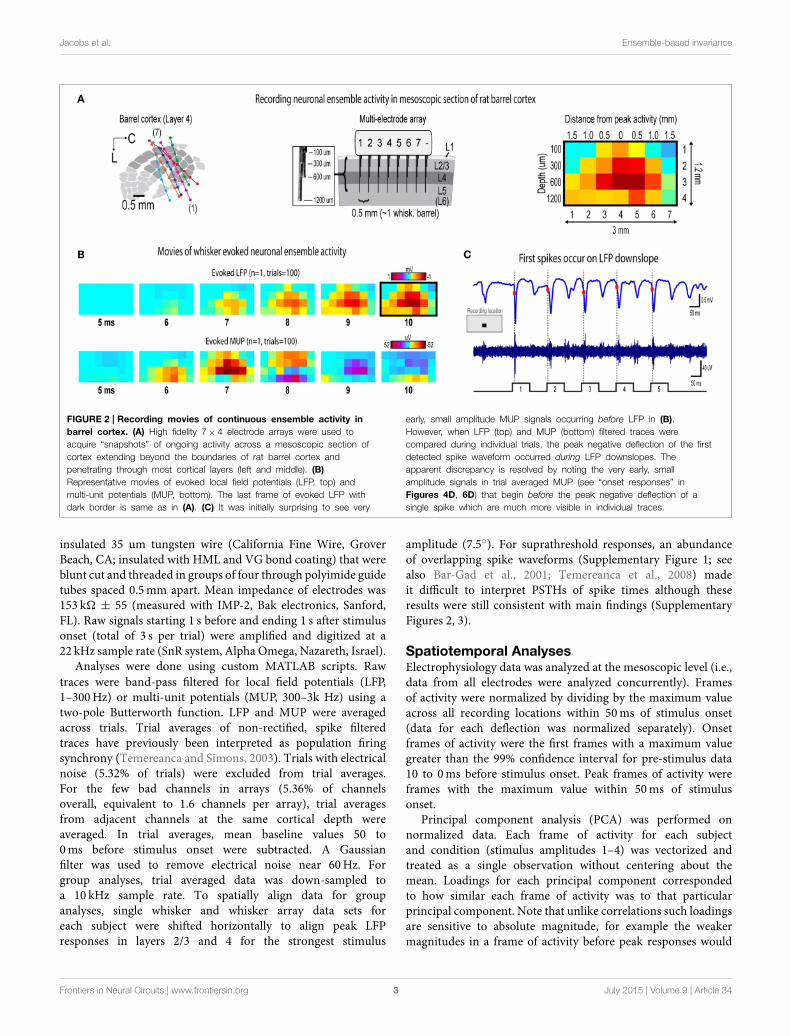
FIGURE 3 | Single whisker evoked LFP for the first deflection. (A)
Movies of averaged (n = 6) single whisker evoked LFP for the first deflection
at each of the four stimulus amplitudes (0.035◦, 0.2◦, 1.25◦, and 7.5◦). Note
the laminar and lateral spread of evoked LFP. (B) The relative spatial profile of
evoked LFP spread can be compared across stimulus amplitudes by
normalizing each movie to the maximum value across all pixels and time
points. (C,D) Continuous quantification of spatial profiles with PCA loadings
(C) and similarity between spatial profiles with correlations (D). Traces are
mean ± s.e.m. Gray shaded regions indicate mean onset and peak latencies
(± s.e.m.). (E) Raw and normalized mean onset frames. (F–H) Raw and
normalized mean peak frames (F), broken down by layer (G), and
quantification of peak response properties (H). *p < 0.05.
Frontiers in Neural Circuits | www.frontiersin.org 4 July 2015 | Volume 9 | Article 34
Jacobs et al. Ensemble-based invariance
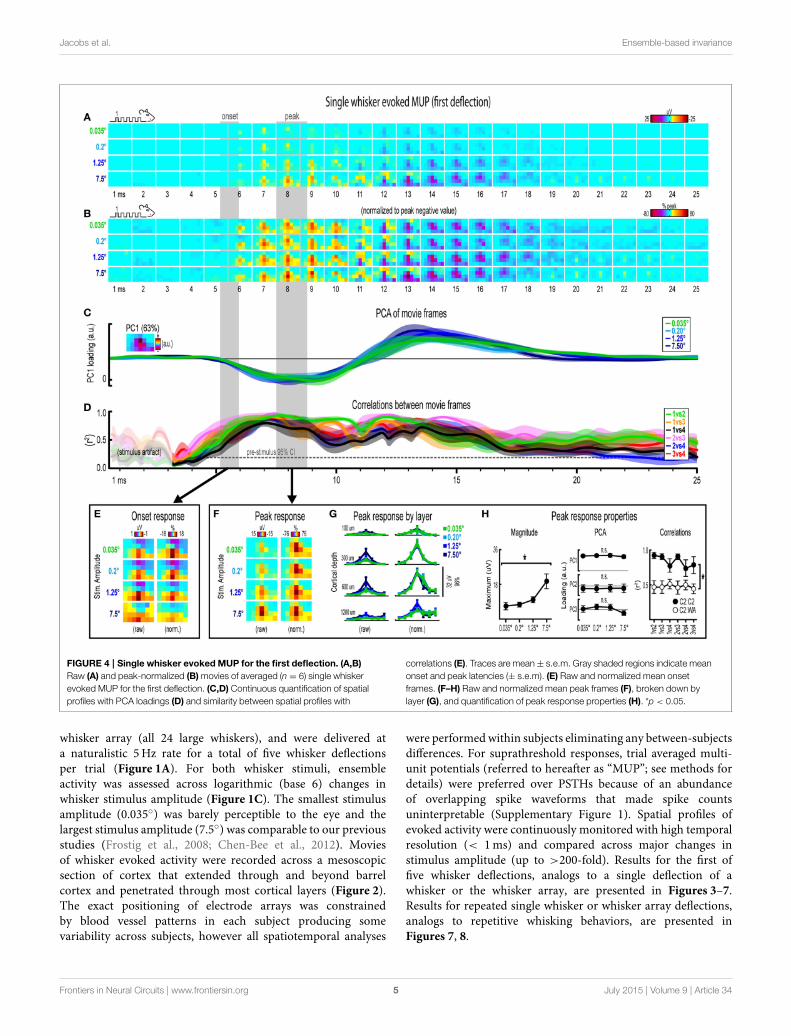
FIGURE 4 | Single whisker evoked MUP for the first deflection. (A,B)
Raw (A) and peak-normalized (B)movies of averaged (n = 6) single whisker
evoked MUP for the first deflection. (C,D) Continuous quantification of spatial
profiles with PCA loadings (D) and similarity between spatial profiles with
correlations (E). Traces are mean± s.e.m. Gray shaded regions indicate mean
onset and peak latencies (± s.e.m). (E) Raw and normalized mean onset
frames. (F–H) Raw and normalized mean peak frames (F), broken down by
layer (G), and quantification of peak response properties (H). *p < 0.05.
whisker array (all 24 large whiskers), and were delivered ata naturalistic 5Hz rate for a total of five whisker deflectionsper trial (Figure 1A). For both whisker stimuli, ensembleactivity was assessed across logarithmic (base 6) changes inwhisker stimulus amplitude (Figure 1C). The smallest stimulusamplitude (0.035◦) was barely perceptible to the eye and thelargest stimulus amplitude (7.5◦) was comparable to our previousstudies (Frostig et al., 2008; Chen-Bee et al., 2012). Moviesof whisker evoked activity were recorded across a mesoscopicsection of cortex that extended through and beyond barrelcortex and penetrated through most cortical layers (Figure 2).The exact positioning of electrode arrays was constrainedby blood vessel patterns in each subject producing somevariability across subjects, however all spatiotemporal analyses
were performedwithin subjects eliminating any between-subjectsdifferences. For suprathreshold responses, trial averaged multi-unit potentials (referred to hereafter as “MUP”; see methods fordetails) were preferred over PSTHs because of an abundanceof overlapping spike waveforms that made spike countsuninterpretable (Supplementary Figure 1). Spatial profiles ofevoked activity were continuously monitored with high temporalresolution (< 1ms) and compared across major changes instimulus amplitude (up to >200-fold). Results for the first offive whisker deflections, analogs to a single deflection of awhisker or the whisker array, are presented in Figures 3–7.Results for repeated single whisker or whisker array deflections,analogs to repetitive whisking behaviors, are presented inFigures 7, 8.
Frontiers in Neural Circuits | www.frontiersin.org 5 July 2015 | Volume 9 | Article 34

Jacobs et al. Ensemble-based invariance
FIGURE 5 | Whisker array evoked LFP for the first deflection. (A,B) Raw
(A) and peak-normalized (B)movies of averaged (n = 7) whisker array evoked
LFP for the first deflection. (C,D) Continuous quantification of spatial profiles
with PCA loadings (D) and similarity between spatial profiles with correlations
(E). Traces are mean ± s.e.m. Gray shaded regions indicate mean onset and
peak latencies (± s.e.m). (E) Raw and normalized mean onset frames. (F–H)
Raw and normalized mean peak frames (F), broken down by layer (G), and
quantification of peak response properties (H). *p < 0.05.
Invariance in Single Whisker Evoked LFP for theFirst DeflectionMovies of single whisker (C2) evoked local field potentials (LFP)for the first of five deflections and their quantification are shownin Figure 3. For the first deflection, movies are shown from 1to 25ms post-stimulus onset. The same analyses used in thissection are repeated in following sections. As discussed in detailbelow, major changes in stimulus amplitude (up to > 200-fold)affected the magnitude but not the spatiotemporal profile ofsingle whisker evoked MUP for the first deflection.
Mean single whisker evoked LFP (n = 6) for each of thefour stimulus amplitudes (0.035◦, 0.2◦, 1.25◦, 7.5◦) is shown
in Figure 3A. Single whisker evoked LFP for each stimulusamplitudes spread vertically and laterally across the field of
view within the 25ms time window. Despite differences inabsolute magnitude, a similarly broad lateral profile of evoked
LFP for each stimulus amplitude was observed by normalizingeach movie to the peak negative value across all frames withinthe 25ms window (Figure 3B). Further support for the largespatial profile of evoked LFP was that each stimulus amplitudeengaged a similarly large region of cortex including all recordinglocations within the field of view, all of which had evokedLFP within the 25ms window at least three standard deviationsabove pre-stimulus data (Supplementary Figure 4A). Thus, initial
Frontiers in Neural Circuits | www.frontiersin.org 6 July 2015 | Volume 9 | Article 34

Jacobs et al. Ensemble-based invariance
FIGURE 6 | Whisker array evoked MUP for the first deflection. (A,B)
Raw (A) and peak-normalized (B)movies of averaged (n = 7) whisker array
evoked MUP for the first deflection. (C,D) Continuous quantification of spatial
profiles with PCA loadings (D) and similarity between spatial profiles with
correlations (E). Traces are mean± s.e.m. Gray shaded regions indicate mean
onset and peak latencies (± s.e.m). (E) Raw and normalized mean onset
frames. (F–H) Raw and normalized mean peak frames (F), broken down by
layer (G), and quantification of peak response properties (H). *p < 0.05.
qualitative assessment revealed notably similar spatiotemporalprofiles of single whisker evoked LFP for the first deflection.
Spatiotemporal profiles of single whisker evoked LFP for thefirst deflection were quantified and compared across stimulusamplitudes (Figures 3C,D). The spatial profile of evoked LFPat each time point was quantified using principle componentanalysis (PCA) of normalized data (Figure 3C). The firstprincipal component (PC1; Figure 3C, top, inset) explained82% of the variance in frames of evoked LFP, with PC2 andPC3 explaining only 6 and 4% of the variance, respectively.PC1 loadings were then plotted over time for each stimulusamplitude (Figure 3C, top). Note that identical spatiotemporal
profiles would result in identical (i.e., completely overlapping)traces of PC1 loadings. Traces of PC1 loadings for each stimulusamplitude were highly overlapping from the onset of responses(left shaded region in Figure 3C) through peak responses (rightshaded region in Figure 3C). PCA results therefore matchedinitial findings of similar spatiotemporal profiles of single whiskerevoked LFP for the first deflection.
Similarity between frames of single whisker evoked LFP forthe first deflection was quantified with correlations between allpossible stimulus amplitude pairs (1 vs. 2, 1 vs. 3, 1 vs. 4, 2vs. 3, 2 vs. 4, and 3 vs. 4) at each time point within the 25mswindow (Figure 3D). Note that the “1 vs. 4” comparison (black
Frontiers in Neural Circuits | www.frontiersin.org 7 July 2015 | Volume 9 | Article 34

Jacobs et al. Ensemble-based invariance
FIGURE 7 | Continuous quantification of evoked LFP and MUP
for repeated whisker deflections. (A) Continuous quantification of
the magnitude (top panel), spatial profile (middle panel), and
similarity of spatial profiles (bottom panel) for single whisker evoked
LFP. (B–D) Same data as (A) but for single whisker evoked MUP
(B), whisker array evoked LFP (C), and whisker array evoked MUP
(D). Note the much larger time window (∼2 s) compared to
previous figures. Arrows indicate mean latencies of peak frames of
evoked activity which are further analyzed in Figure 7. All traces
indicate mean ± s.e.m.
Frontiers in Neural Circuits | www.frontiersin.org 8 July 2015 | Volume 9 | Article 34

Jacobs et al. Ensemble-based invariance
FIGURE 8 | Peak frames of activity for repeated whisker
deflections. Mean peak frames and quantification of peak response
properties for single whisker evoked LFP (A,B), single whisker evoked
MUP (C,D), whisker array evoked LFP (E,F), and whisker array evoked
MUP (G,H) for repeated whisker deflections. Results from the first
deflection are plotted for comparison. *p < 0.05.
traces in Figure 3D) between the smallest (0.035◦) and largest(7.5◦) stimulus amplitude represented a ∼215-fold differencein stimulus amplitude. At ∼7ms post-stimulus onset, meancoefficients of determination (r2-values) rose above a 95%confidence interval (gray dotted line in Figure 3D) calculatedfrom pre-stimulus data for all stimulus amplitude comparisons.Mean r2-values for all comparisons appeared to reach a
maximum at ∼10ms and then slowly tapered off after peak.These data further substantiated the similarity in spatiotemporalprofiles of evoked LFP observed in peak-normalized movies (seeFigure 3B). Together, continuous qualitative and quantitativemeasures suggested highly similar spatiotemporal profiles ofsingle whisker evoked LFP were maintained despite majorchanges in stimulus amplitude.
Frontiers in Neural Circuits | www.frontiersin.org 9 July 2015 | Volume 9 | Article 34

Jacobs et al. Ensemble-based invariance
Lastly, onset and peak frames of single whisker evoked LFP forthe first deflection warranted closer inspection. Mean onset andpeak latencies were 7.6 ± 0.4ms and 14.2 ± 0.6ms, respectively(shaded regions in Figures 3A–D; grand mean of subject andstimulus amplitude ± s.e.m.; see Supplementary Table 1 fordetails). Onset responses were difficult to see in Figure 3A dueto their small magnitude. Therefore, onset frames of evoked LFPwere aligned, averaged, and plotted with a “zoomed in” colorscale that was ∼ 20 times more sensitive (Figure 3E). The moresensitive color scale revealed a consistent pattern of positive orneutral voltages at the most superficial depth targeted at layer1 (top row of pixels in each image) and negative voltages inthe two deepest depths targeted at layers 4 and 5 (bottom tworows of pixels in each image) for all stimulus amplitudes. Similarpatterns were found for all onset frames of evoked LFP and MUP(see relevant sections below), and were likely produced by fast,synchronous activity in thalamocortical afferents (Kandel andBuzsáki, 1997).
Peak frames of single whisker evoked LFP for the firstdeflection were aligned and averaged (Figure 3F). The samedata was also broken down by recording depth to allowcloser inspection of laminar responses (Figure 3G). Similar tobefore, response magnitudes increased with increasing stimulusamplitude but had nearly indistinguishable spatial profiles.Supporting the observed change in response magnitude, themaximum value in peak frames was significantly different acrossstimulus amplitudes [F(3, 15) = 16.12, p < 0.001; Figure 3H,left]. Supporting the similarity of spatial profiles, PC1, PC2, andPC3 loadings for peak normalized frames were not significantlydifferent across stimulus amplitudes [PC1, F(3, 15) = 0.36, p =
0.780; PC2, F(3, 15) = 2.44, p = 0.105; PC3, F(3, 15) = 2.09,p = 0.145; Figure 3H, middle].
Further supporting the similarity of spatial profiles, peakframes were also highly correlated with each other (mean r2 =
0.95 ± < 0.01; grand mean of comparison and subject;Figure 3H, right, closed circles). A simple internal control wasused to test the sensitivity of correlations by comparing singlewhisker to whisker array responses, which are both characterizedby the same basic shape (a single, central peak of activity; seeschematics in Figure 2B). Importantly, this control comparisonresulted in significantly lower r2-values [Figure 3H, right, opencircles; grand mean r2 = 0.62 ± 0.06; F(1, 5) = 107.86,p < 0.001; for peak frames of whisker array evoked LFP seeFigure 5F], indicating that correlations were highly sensitive toeven subtle changes in the profile of evoked activity.
Results for single whisker evoked LFP for the first deflectionsuggested that large changes in stimulus amplitude (up to > 200-fold) affected the magnitude but not the spatiotemporal profile ofactivity.
Invariance in Single Whisker Evoked MUP for theFirst DeflectionMovies of single whisker evoked multi-unit potentials (MUP) forthe first of five deflections and their quantification are shown inFigure 4A. The exact same analyses used before were repeatedand are summarized briefly below. Note that MUP responseshad an early negative and a late positive peak within the 25ms
post-stimulus time window. All analyses of peak MUP responsesfocused on the earlier negative peak. Similar to before, majorchanges in stimulus amplitude (up to > 200-fold) again affectedthe magnitude but not the spatiotemporal profile of singlewhisker evoked MUP for the first deflection.
Mean single whisker evoked MUP (n = 6) for the firstdeflection increased in magnitude with increasing stimulusamplitude (Figure 4A), had notably similar spatiotemporalprofiles as revealed by normalizing to peak values (Figure 4B),and included evoked activity >3 standard deviations above pre-stimulus data across the entire field of view (SupplementaryFigure 4B). Continuous quantitative measures further supportedthe finding of similar spatiotemporal profiles across stimulusamplitudes. For PCA (Figure 4C), PC1 explained 63% of thevariance with PC2 and PC3 explaining only 12% and 7%,respectively. Traces of mean PC1 loadings for each stimulusamplitude were again highly overlapping, even during transitionsbetween negative and positive MUP phases. For correlationsbetween frames of evoked MUP (Figure 4D), mean r2-valuesfor all stimulus amplitude comparisons rose above the 95%pre-stimulus confidence interval at 4–5ms post-stimulus onset,appeared to reach a maximum by 7ms, and were highestduring peak negative and peak positive responses. Together,continuous qualitative and quantitative measures suggestedhighly similar spatiotemporal profiles of single whisker evokedMUP were maintained despite major changes in stimulusamplitude.
Onset and peak frames of single whisker evoked MUP for thefirst deflection were again inspectedmore closely. Onset and peaklatencies were 5.6 ± 0.4ms and 8.1 ± 0.5ms on average (shadedregions in Figure 4; see Supplementary Table 1 for details). Onsetframes of evoked MUP (Figure 4E) again had positive or neutralvoltages in the most superficial depth and negative voltages inthe two deepest depths for each stimulus amplitude. Peak framesof evoked MUP (Figures 4F–H) again demonstrated changesin response magnitude but not spatial profile. Supporting theobserved change in response magnitude, the maximum valuewithin peak frames was significantly different across stimulusamplitudes [F(3, 15) = 4.47, p = 0.02; Figure 4H, left].Supporting the similarity of spatial profiles, PC1, PC2, and PC3loadings for peak frames were not significantly different acrossstimulus amplitudes [PC1, F(3, 15) = 0.33, p = 0.805; PC2,F(3, 15) = 0.64, p = 0.602; PC3, F(3, 15) = 2.01, p = 0.156;Figure 4H, middle]. Further supporting the similarity of spatialprofiles, peak frames were also highly correlated with each other(Figure 4H, right, closed circles; grand mean r2 = 0.94 ± 0.01).Importantly, peak frames of single whisker evoked MUP weresignificantly less correlated with peak frames of whisker arrayevoked MUP [Figure 4H, right, open circles; grand mean r2 =0.51 ± 0.06; F(1, 5) = 12.09, p = 0.018; for peak frames ofwhisker array evoked MUP see Figure 6F), again indicating thatcorrelations were sensitive to even subtle changes in profiles ofactivity.
Together, results for single whisker evoked MUP and LFPfor the first deflection suggested that large changes in stimulusamplitude (up to > 200-fold) affected the magnitude but not thespatiotemporal profile of neuronal ensemble activity.
Frontiers in Neural Circuits | www.frontiersin.org 10 July 2015 | Volume 9 | Article 34
Jacobs et al. Ensemble-based invariance
Invariance in Whisker Array Evoked LFP for theFirst DeflectionMovies of whisker array evoked LFP for the first of fivedeflections and their quantification are shown in Figure 5.The exact same analyses used before were repeated and aresummarized briefly below. Similar to before, major changesin stimulus amplitude (up to > 200-fold) again affected themagnitude but not the spatiotemporal profile of whisker arrayevoked LFP for the first deflection. Z-scores for whiskerarray evoked activity within the 25ms window are shown inSupplementary Figures 4C,D.
Mean whisker array evoked LFP (n = 7) for the first deflectionincreased in magnitude with increasing stimulus amplitude(Figure 5A), had notably similar spatiotemporal profiles asrevealed by normalizing to peak values (Figure 5B), and includedevoked activity >3 standard deviations above pre-stimulus dataacross the entire field of view (Supplementary Figure 4E).Continuous quantitative measures further supported the findingof similar spatiotemporal profiles across stimulus amplitudes.For PCA (Figure 5C), PC1 explained 85% of the variancewith PC2 and PC3 both explaining only ∼4% of the variance.Traces of mean PC1 loadings for each stimulus amplitudewere again highly overlapping. For correlations between framesof evoked LFP (Figure 5D), mean r2-values for all stimulusamplitude comparisons rose above the 95% confidence intervalfor pre-stimulus data at ∼6ms, reached a maximum by ∼8msbefore slowly tapering off. Together, continuous qualitative andquantitative measures suggested highly similar spatiotemporalprofiles of whisker array evoked LFP for the first deflection weremaintained despite major changes in stimulus amplitude.
Onset and peak frames of whisker array evoked LFP for thefirst deflection were again inspectedmore closely. Onset and peaklatencies were 6.0± 0.4ms and 12.3± 0.6ms on average (shadedregions in Figure 5; see Supplementary Table 1 for details). Onsetframes of evoked LFP (Figure 5E) had positive or neutral voltagesin the two most superficial depths and negative voltages in thetwo deepest depths for each stimulus amplitude. Peak framesof evoked LFP (Figures 5F–H) again demonstrated changes inresponse magnitude but not spatial profile. In Figure 5G, notethe single, central peaks of activity at all recording depths exceptthe deepest targeted at layer 5. Supporting the observed changein response magnitude, the maximum value within peak frameswas significantly different across stimulus amplitudes [F(3, 18) =14.75, p < 0.001; Figure 5H, left]. Supporting the similarityof spatial profiles, PC1, PC2, and PC3 loadings for peak frameswere not significantly different across stimulus amplitudes [PC1,F(3, 18) = 2.80, p = 0.069; PC2, F(3, 18) = 0.35, p =
0.793; PC3, F(3, 18) = 0.63, p = 0.608; Figure 5H, middle].Further supporting the similarity of spatial profiles, peak frameswere also highly correlated with each other (Figure 5H, right,closed circles; grand mean r2 = 0.96± < 0.01). Importantly,peak frames of whisker array evoked LFP were significantlyless correlated with peak frames of single whisker evoked LFP[Figure 5H, right, open circles; grand mean r2 = 0.62 ± 0.06;F(1, 5) = 3447.61, p < 0.001; for peak frames of single whiskerevoked LFP see Figure 3F], again indicating that correlationswere sensitive to even subtle changes in profiles of activity.
Results for whisker array evoked LFP for the first deflectionagain suggested that major changes in stimulus amplitude (upto> 200-fold) affected the magnitude but not the spatiotemporalprofile of neuronal ensemble activity, but this time for the morecomplex whisker array stimulation involving all 24 large whiskersevoking a distinct pattern of sensory integration.
Invariance in Whisker Array Evoked MUP for theFirst DeflectionMovies of whisker array evoked MUP for the first of fivedeflections and their quantification are shown in Figure 6.The exact same analyses used before were repeated and aresummarized briefly below. Note again the tendency of spatialprofiles to be characterized by a single, central peak of activity atsuperficial recording depths targeted at layers 1, 2/3, and 4 butnot the deepest targeted at layer 5. All analyses of peak MUPresponses again focused on the earlier negative peak. Similar tobefore, major changes in stimulus amplitude (up to > 200-fold)again affected the magnitude but not the spatiotemporal profileof whisker array evoked MUP.
Mean whisker array evoked MUP (n = 7) for the firstdeflection increased in magnitude with increasing stimulusamplitude (Figure 6A), had notably similar spatiotemporalprofiles as revealed by normalizing to peak values (Figure 6B),and included evoked activity >3 standard deviations abovepre-stimulus data across the entire field of view (SupplementaryFigure 4F). Continuous quantitative measures further supportedthe finding of similar spatiotemporal profiles across stimulusamplitudes. For PCA (Figure 6C), PC1 explained 61% ofthe variance with PC2 and PC3 explaining only 16 and7%, respectively. Traces of mean PC1 loadings for eachstimulus amplitude were again highly overlapping, evenduring transitions between negative and positive MUPphases. For correlations between frames of evoked MUP(Figure 6D), mean r2-values for all stimulus amplitudecomparisons rose above the 95% pre-stimulus confidenceinterval just before onset latencies and were highest duringpeak negative and peak positive responses. Together, continuousqualitative and quantitative measures suggested highly similarspatiotemporal profiles of whisker array evokedMUP for the firstdeflection were maintained despite major changes in stimulusamplitude.
Onset and peak frames of whisker array evoked MUP forthe first deflection were again inspected more closely. Onset andpeak latencies were 4.4 ± 0.2ms and 6.8 ± 0.4ms on average(shaded regions in Figure 6; see Supplementary Table 1 fordetails). Onset frames of evoked MUP (Figure 6E) had stronglypositive voltages in the two most superficial depths and neutralor negative voltages in the two deepest depths for each stimulusamplitude. Peak frames of evoked MUP (Figures 6F–H) againdemonstrated changes in response magnitude but not spatialprofile. In Figure 6G, again note the single, central peaks ofactivity at all recording depths except the deepest targeted at layer5. Supporting the observed change in response magnitude, themaximum value within peak frames was significantly differentacross stimulus amplitudes [F(3, 18) = 11.74, p < 0.001;Figure 6H, left]. Supporting the similarity of spatial profiles,
Frontiers in Neural Circuits | www.frontiersin.org 11 July 2015 | Volume 9 | Article 34

Jacobs et al. Ensemble-based invariance
PC1, PC2, and PC3 loadings were not significantly differentacross stimulus amplitudes [PC1, F(3, 18) = 1.36, p = 0.287;PC2, F(3, 18) = 0.68, p = 0.579; PC3, F(3, 18) = 0.25, p =
0.859; Figure 6H, middle]. Further supporting the similarity ofspatial profiles, peak frames of whisker array evoked MUP werealso highly correlated with each other (Figure 6H, right, closedcircles; grand mean r2 = 0.92 ± 0.02). Importantly, peak framesof whisker array evoked MUP were significantly less correlatedwith peak frames of single whisker evoked MUP [Figure 6H,right, open circles; grand mean r2 = 0.51± 0.06; F(1, 5) = 65.84,p = 0.001; for peak frames of single whisker evoked MUP seeFigure 4F), again indicating that correlations were sensitive toeven subtle changes in profiles of activity.
Together, results for the first single whisker and whiskerarray deflection suggest that major changes in whisker stimulusamplitude (up to > 200-fold) had a significant effect on themagnitude but not spatiotemporal profile of evoked activity. Thisfinding held for the relatively simple deflection of a single, centralwhisker (C2) and for themore complex whisker array stimulationinvolving simultaneous stimulation of all 24 large whiskers. Thesimilarity in profiles of activity was supported by highly sensitivequantitative measures that despite failing to detect differencesacross stimulus amplitudes could detect differences between twosimilar whisker stimuli- namely single whisker and whisker arrayresponses both characterized by a single, central peak of activity.Correlation results consistently passed this sensitivity test. PCAalso seemed to pass this sensitivity test when performed on acombined data set including both single whisker and whiskerarray responses (Supplementary Figure 5). Overall, results for thefirst single whisker and whisker array deflection suggested thatmajor changes in stimulus amplitude systematically affected themagnitude of evoked activity but did not produce any substantialchanges in the profile of evoked activity.
Invariance during Repeated Whisker DeflectionsRodents explore their environment with repetitive, simultaneousmovement of their whiskers. It was therefore important todetermine if results from the first deflection, analogs to asingle deflection of the whisker(s), extended to repeated whiskerdeflections 2–5. A similar set of analyses were performed onresults during repeated whisker deflections with a few importantdifferences. Now, a larger time window (−0.2–1.2 s post-stimulusonset) was used that included all five whisker deflections ofthe 5Hz stimulation. For each movie, the mean magnitudewithin each frame of activity was calculated and continuouslyplotted (Figures 7A–D, top panels). Similar to before, mean PC1loadings and mean r2-values for all possible stimulus amplitudecomparisons were continuously plotted (Figures 7A–D, middleand bottom panels, respectively). The gray shaded regionsin Figure 7 correspond to the 25ms time window used foranalysis of the first deflection (see Figures 3–6). Arrows inFigure 7 indicate time of peak responses (mean negative peaklatency within 50ms of stimulus onset for each deflection; seeSupplementary Table 1 for details). All further analyses focusedon peak frames of evoked activity (Figure 8).
Repeated single whisker deflections 2–5 continued to evokeLFP and MUP that increased in magnitude with increasing
stimulus amplitude but did not have major changes in itsspatiotemporal profile (Figures 8A–D). The maximum valuewithin peak frames was significantly different across stimulusamplitudes [LFP, Figure 8B, left, F(3, 15) = 8.43, p = 0.002;MUP, Figure 8D, left, F(3, 15) = 8.29, p = 0.002]. Thespatial profile of peak frames did not change noticeably acrossstimulus amplitudes (Figures 8A,C, right). For PCA results, PC1explained amajority of variance (79% for LFP and 67% forMUP),with PC2 and PC3 again explaining much less of the variance(between 5 and 11%). No significant differences in PC1, PC2, orPC3 loadings for LFP or MUP data were found across stimulusamplitudes except for PC3 for LFP which explained only 5% ofthe variance [F(3, 15) = 23.21, p < 0.001; Figure 8B, “PC3”in middle panel] and PC2 for MUP which explained only 11%of the variance [F(3, 15) = 3.53, p = 0.041; Figure 8D, “PC2”in middle panel], and overall no major differences in spatialprofiles were noticeable (see Figures 8A,C, right). Peak frameswere well-correlated with each other (LFP, r2 = 0.94± 0.01;MUP, r2 = 0.82± 0.03; grand mean of comparisons, deflections,and subjects) and were significantly less correlated with peakframes of whisker array evoked activity [LFP, r2 = 0.51 ± 0.05,F(1, 5) = 132.05, p < 0.001, Figure 8B, right; MUP, r2 = 0.36± 0.04, F(1, 5) = 142.00, p < 0.001, Figure 8D, right]. Thesedata suggest that stimulus amplitude continued to affect themagnitude but not the spatiotemporal profile of evoked LFP andMUP for repeated single whisker deflections.
In contrast to all previous results, repeated whisker arraydeflections evoked LFP and MUP that did not increase inmagnitude despite major increases in stimulus amplitude (up to>200-fold; Figures 8E,G, left). There were still some significantdifferences in the maximum value within peak frames [LFP,Figure 8F, left, F(3, 18) = 3.33, p < 0.043; MUP, Figure 8H,left, F(3, 18) = 4.47, p = 0.016], however all post-hoc testswere not significant [all F(1,6) < 15, all p > 0.008, Bonferronicorrection for 6 comparisons]. If anything, the largest stimulusamplitude appeared to evoke the weakest response magnitudes(Figures 8F–H, left, red lines). Similar to previous results, thespatial profile of peak frames did not show any major changesacross stimulus amplitudes (Figures 8E,G, right). For PCAresults, PC1 again explained the majority of variance (79% forLFP and 73% for MUP) with PC2 and PC3 again explainingmuch less of the variance (between 4 and 8%). No significantdifferences in PC1, PC2, or PC3 loadings for LFP or MUP datawere found across stimulus amplitudes except for PC2 for LFPwhich explained only 6% of variance [F(3, 18) = 5.76, p =
0.006; Figure 8F, “PC2” in middle panel] and PC3 for MUPwhich explained only 6% of variance [F(3, 18) = 5.28, p =
0.009; Figure 8H, “PC3” in middle panel], and overall no majordifferences in spatial profiles were noticeable (see Figures 8E,G,right). Peak frames were well-correlated with each other (LFP,r2 = 0.84± 0.04; MUP, r2 = 0.65± 0.05; grand mean ofcomparisons, deflections, and subjects) andwere significantly lesscorrelated with peak frames of single whisker evoked activity [LFP,r2 = 0.51± 0.05, F(1, 5) = 60.07, p = 0.001, Figure 8F, right;MUP, r2 = 0.36± 0.04, F(1, 5) = 46.98, p = 0.001, Figure 8H].These data suggest that the spatiotemporal profile of whiskerarray evoked LFP and MUP continued to be relatively invariant
Frontiers in Neural Circuits | www.frontiersin.org 12 July 2015 | Volume 9 | Article 34
Jacobs et al. Ensemble-based invariance
to even major changes in stimulus amplitude during repeateddeflections. Further, in contrast to all previous results, these dataalso suggest that the absolute magnitude of whisker array evokedLFP and MUP may also become invariant to stimulus amplitudefor repeated deflections.
Results from repeated whisker deflections indicate that thespatiotemporal profile of neuronal ensemble activity in rat barrelcortex continued to be notably invariant to evenmajor changes instimulus amplitude (up to >200-fold). The absolute magnitudeof responses, however, consistently increased with increasingstimulus amplitude except, notably, for the more naturalisticrepeated deflections of the whisker array.
Whisker Array Responses Faster, Less VariableAcross SubjectsTwo main differences between single whisker and whiskerarray responses were observed. First, whisker array responseswere faster than single whisker responses. LFP onset latencieswere significantly faster for whisker array compared to singlewhisker conditions (paired t-test of mean onset latencies forall stimulus amplitudes, t(5) = 5.76, p = 0.002; seeSupplementary Table 1 for all latency values). LFP peaklatencies were faster for whisker array compared to singlewhisker but not significantly so (paired t-test of mean peaklatencies for all stimulus amplitudes, t(5) = 2.37, p =
0.064). MUP onset and peak latencies were both significantlyfaster for whisker array compared to single whisker (pairedt-tests of mean onset and peak latencies; MUP onset latency,t(5) = 5.61, p = 0.003; MUP peak latency, t(5) = 4.59,p = 0.006).
In general, the onset latencies for trial averaged MUPdata were consistent but at the low end of previouslyreported latencies in barrel cortex using spike timestamps (e.g.,Armstrong-James et al., 1992). The shorter latencies in trialaveraged MUP could be explained by increased sensitivityto small amplitude signals which are necessarily excludedin thresholded data used for spike detection. Contributionsfrom small amplitude signals could originate from: the risingphase of action potentials, action potentials from smaller cellssuch as spiny stellate cells, and synchronized activation ofthalamocortical afferents (Kandel and Buzsáki, 1997; for detailedreview of origins of extra-cellular currents see Buzsáki et al.,2012).
The second main difference between single whisker andwhisker array responses was that maximum response magnitudeswere less variable across subjects for the first whisker arraydeflection. The coefficient of variance (COV, standard deviationdivided by mean) for whisker array evoked LFP for the firstdeflection was 0.19 (mean COV for all stimulus amplitudes),34% lower than the COV for single whisker evoked LFP forthe first deflection which was 0.29. The COV for whiskerarray evoked MUP for the first deflection was 0.28, 45% lowerthan the COV for single whisker evoked MUP for the firstdeflection which was 0.51. For repeated deflections, COVs werenot consistently different between single whisker and whiskerarray conditions.
Discussion
The current research investigated invariance in large, spatiallyorganized neuronal ensembles of rat barrel cortex. Severalmethods used here (e.g., combined analysis of continuous multi-site recordings) enabled direct comparison of spatial profilesof evoked activity with high temporal resolution over relativelylong periods of time. We found that neuronal ensemble activityhas a remarkable capacity for spatiotemporal invariance. Suchensemble-based spatiotemporal invariance was found for a singlewhisker stimulus as well as for a more complex whisker arraystimulus involving many whiskers and a distinct pattern ofsensory integration.
Emerging Invariance in Neuronal EnsemblesNeuronal invariance is typically studied at the level of singleneurons, which in “higher” sensory cortices can invariantlyrespond to abstract sensory information such as objects or items(Sáry et al., 1993; Lueschow et al., 1994; Li and DiCarlo, 2008;Rust and DiCarlo, 2010). In primary sensory cortices invariancehas been observed in more nuanced aspects of individual neuronresponses such as the width of tuning curves (Anderson et al.,2000; Sadagopan and Wang, 2008), yet very little is known aboutinvariance at the neuronal ensemble level in primary sensorycortex.
Here we analyzed a special case of neuronal ensemble: the“point spread,” which describes the rapid lateral spread of evokedactivity following point sensory stimulation (e.g., whisker).Point spreads are ubiquitous in sensory cortex (somatosensory,auditory, and visual) ranging from mice and rats to cats andmonkeys and are found in both anesthetized and awake behavinganimals (Grinvald et al., 1994; Barth et al., 1995; Das andGilbert, 1995; Bakin et al., 1996; Bringuier et al., 1999; Brett-Green et al., 2001; Kaur et al., 2005; Ferezou et al., 2006, 2007;Roland et al., 2006; Sharon et al., 2007; Frostig et al., 2008; Chen-Bee et al., 2012; Mohajerani et al., 2013). Interestingly, multiplesimultaneous point spreads propagating through presumablyoverlapping neuronal ensembles have been shown to summate(Chen-Bee et al., 2012; Gao et al., 2012). A potential criticismof studying point spreads in the anesthetized preparation isthat anesthesia may result in unnaturally large point spreads.However, this does not seem to be the case as single whiskerevoked point spreads in barrel cortex are equally as large or largerin awake vs. anesthetized rodents (Ferezou et al., 2006).
Point spreads in the rat barrel cortex are supported by arobust lateral connectivity based on long-range, roughly radiallysymmetric horizontal projections (e.g., Frostig et al., 2008;Mohajerani et al., 2013; Stehberg et al., 2014; Johnson and Frostig,2015). Just like the gradually tapering activity profile evoked bysingle whisker stimulation, it is apparent that the density of suchnon-specific horizontal fibers also gradually tapers with corticaldistance from an individual whisker barrel (see Johnson andFrostig, 2015). A recent study has directly linked large spatialprofiles of cortical activity with underlying spatial patterns oflateral structural connectivity in mice (Mohajerani et al., 2013).Recruitment of a larger proportion of the cells and horizontalfibers of this lateral network could explain why stronger stimulus
Frontiers in Neural Circuits | www.frontiersin.org 13 July 2015 | Volume 9 | Article 34

Jacobs et al. Ensemble-based invariance
intensities increase response magnitudes in a spatially uniformmanner, although this remains to be fully tested.
Why are point-spreads so ubiquitous, especially in light ofthe expensive metabolic support that cortex has to invest inorder to maintain them? We have previously shown, usingstimulus amplitude comparable to the largest stimulus amplitudein the current study, that single whiskers stimulation evokespoint spreads that have a considerable degree of spatial overlapeven for topographically distant whiskers (Chen-Bee et al.,2012). Importantly, summation of these overlapping point spreadaccurately predicts a single peak of evoked activity followingsimultaneous stimulation of all 24 large whiskers (Chen-Beeet al., 2012); and therefore point spreads could be describedas a “building block” of integrated cortical activity. Here weexpand the importance of point spreads by demonstrating theirspatiotemporal invariance. Specifically, spatiotemporal profilesof single whisker evoked activity were notably invariant despitemajor changes in whisker stimulus amplitude that exceeded 200-fold differences. Further, we reasoned that if point-spreads areindeed building blocks of cortical integrated activity, then thisspatiotemporal invariance should also extend to the patternsof multi-point integration they construct. Indeed, a similardegree of spatiotemporal invariance was also found for whiskerarray evoked neuronal ensemble activity across the same majorchanges in stimulus amplitude. These findings therefore seem togeneralize the critical role of interactions among single whiskerevoked point spreads across a wide range of ethologically relevantwhisker stimulus amplitudes. Taken together, the buildingblock function and its invariance suggest that point spreadsshould be considered as important players in cortical functionalorganization.
The ensemble-based invariance reported here alsodemonstrates how emergent properties of large neuronalensembles (e.g., the relative profile of activity across constituentneurons in the ensemble) can be independent of absoluteresponse magnitude. Sensory coding independent of responsemagnitude may allow simultaneous coding of stimulus intensity(e.g., stimulus amplitude) and other more nuanced stimulusfeatures (e.g., texture). Such simultaneous sensory codingcould help explain why stimulus intensity often does not affectrecognition of specific objects or items.
We further suggest that in primary sensory cortices ensemble-based invariance may be more biologically relevant thaninvariance at the individual neuron level. Invariant responsefeatures do exist at the individual neuron level in primarysensory cortex (e.g., the tuning curve widths mentioned earlier),but require comparing responses occurring at different timesand to different stimuli thus raising important questions abouthow exactly this information could be used in real time(Quiroga and Panzeri, 2009). In contrast, the ensemble-basedinvariance described here relies on emergent response features(e.g., the relative profile of activity) that can be used in real-timepresumably by so called “reader” cells in downstream corticalareas (Buzsáki, 2010). Combined with the current findings, theseobservations strongly suggest that neuronal ensembles are notonly capable of a remarkable degree of invariance but, giventheir emergent response properties which allow for continuous,
magnitude-independent sensory coding, appear better designedto perform this function than individual neurons.
Habituation during Repeated Whisker ArrayDeflectionsInterestingly it seems that for the more naturalistic stimulation,repeated deflections of the entire whisker array, an additionallevel of neuronal invariance may occur in the absolute magnitudeof responses. In a study of single unit responses in barrel cortex,it was reported that increasing the frequency of repeated whiskerarray deflections increases response magnitude (Mowery et al.,2011). Surprisingly, the current results suggest that this is notthe case for stimulus amplitude. We found that repeated whiskerarray deflections (i.e., beyond the first stimulation) seemedto equilibrate absolute response magnitudes for each stimulusamplitude. The same equilibration of response magnitudes wasnot observed for repeated single whisker deflections, suggestingthat the underlying mechanism may be specific to simultaneousstimulation of many whiskers. These findings, together withnoticeable differences in response latencies between the first andrepeated deflections (see Supplementary Table 1) and knownadaptation of responses in the rodent somatosensory system(Chung et al., 2002; Katz et al., 2006; Temereanca et al.,2008), suggest distinct differences in sensory coding for repeatedwhisker array deflections.
Relevance to Funneled Tactile PerceptionIt has been previously established that the spread of subthresholdevoked activity in the anesthetized sensory cortex could serve as acorrelate of perceptual phenomenon (Jancke et al., 2004). Couldour findings also relate to tactile perception?
The single, central peak of evoked cortical activity observedafter simultaneous stimulation of two or more adjacent pointsin the periphery has been suggested as the underlying neuronalcorrelate of “funneled” tactile perception (Chen et al., 2003;Chen-Bee et al., 2012), originally described by Békésy (1957,1958, 1959, 1967). Békésy and colleagues demonstrated thatmultiple oscillating tactile stimuli applied simultaneously atseveral discrete skin sites are perceived as a single centralstimulus, rather than as multiple points, leading him to describethe altered spatial profile of the perceived stimulus as being“funneled” into the central stimulus location.
The current findings show that a similarly “funneled” spatialprofile of evoked activity in barrel cortex is invariant across awide range of ethologically relevant whisker stimulus amplitudes,matching original observations that funneled tactile perceptionis amplitude-invariant (Békésy, 1959). These results furtherstrengthen our previous suggestion that the integrated, spatialprofile of evoked cortical activity following simultaneous multi-point stimulation could serve as the underlying neuronalcorrelate of funneled tactile perception. The current studyreplicates funneled profiles of cortical activity in superficialcortical layers (targeted at layers 1–4). However, funneledresponses were not observed in deeper cortical layers (targetedat layer 5), possibly due to differences in the spatial organizationof whisker evoked activity in infragranular layers of barrel cortex
Frontiers in Neural Circuits | www.frontiersin.org 14 July 2015 | Volume 9 | Article 34
Jacobs et al. Ensemble-based invariance
as compared to the other cortical layers (Armstrong-James et al.,1992; Sakata and Harris, 2009).
Similar to funneled tactile perception in humans whichimproves response latencies (Hashimoto et al., 1999), it is possiblethat simultaneous stimulation of multiple adjacent whiskers inthe rat is perceived as a single highly responsive “super whisker”facilitating neuronal and behavioral responses that are faster,more reliable, and less variable. Consistent with this notion,improved tactile discrimination accuracy and faster behavioralresponse latencies have been associated with simultaneous multi-whisker stimulation in rodents (Celikel and Sakmann, 2007).Furthermore, decreased variability in neuronal responses inbarrel cortex has also been associated with whisker arraystimulation (Chen-Bee et al., 2012). Here we also report thatneuronal responses in barrel cortex were also significantly fasterfor whisker array stimulation.
Summarizing the relationship to funneled tactile perception,evoked cortical activity in barrel cortex has a matchingspatial profile, has similar latency and variability improvementscompared to single point stimuli, and is also invariant tostimulus amplitude at the neuronal ensemble level. Together,these results provide a compelling case for the involvement ofmesoscopic, spatially organized ensembles in the robust codingand integration of tactile information in somatosensory cortex.
It is possible that similar emergent patterns of ensembleactivity have computational roles in other sensory regionssuch as primary visual and auditory cortices, which arealso spatially organized. Differences in coding properties andnetwork structure in these other sensory areas are likely tofacilitate differing computational contributions. For example,spatial integration in primary visual cortex could result in apeak of activity between simultaneously activated orientation
columns, rather than between whisker columns. However,general properties of ensemble-based sensory coding suchas its invariance to absolute response magnitudes and highinformation content on single trials are likely relevant to allspatially organized ensembles in sensory cortex. Future researchcan now be pursued to determine whether the emergence ofinvariance within large, spatially organized neuronal ensemblescan be generalized to other stimulus parameters and corticalareas.
Author Contributions
NJ and RF conceived and designed experiments. NJ performedall experiments and designed and performed all data analyses.NJ and RF wrote manuscript. CB assisted with data analysis andprovided comments and feedback on manuscript.
Acknowledgments
This work was supported by the National Institute ofNeurological Disorders and Stroke (grant numbers NS-055832 and NS 066001 to RF). We’d also like to thank Dr. RajuMetherate, Dr. Brett Johnson, Dr. Timothy Allen, Ellen Wann,
and Derrick Huffman who provided important feedback onvarious aspects of the manuscript.
Supplementary Material
The Supplementary Material for this article can be foundonline at: http://journal.frontiersin.org/article/10.3389/fncir.2015.00034
References
Anderson, J. S., Lampl, I., Gillespie, D. C., and Ferster, D. (2000). The contribution
of noise to contrast invariance of orientation tuning in cat visual cortex. Science
290, 1968–1972. doi: 10.1126/science.290.5498.1968
Armstrong-James,M., Fox, K., andDas-Gupta, A. (1992). Flow of excitation within
rat barrel cortex on striking a single vibrissa. J. Neurophysiol. 68, 1345–1358.
Bakin, J. S., Kwon, M. C., Masino, S. A., Weinberger, N. M., and Frostig, R. D.
(1996). Suprathreshold auditory cortex activation visualized by intrinsic signal
optical imaging. Cereb. Cortex 6, 120–130. doi: 10.1093/cercor/6.2.120
Bar-Gad, I., Ritov, Y., Vaadia, E., and Bergman, H. (2001). Failure in
identification of overlapping spikes from multiple neuron activity causes
artificial correlations. J. Neurosci. Methods 107, 1–13. doi: 10.1016/S0165-
0270(01)00339-9
Barth, D. S., Goldberg, N., Brett, B., and Di, S. (1995). The spatiotemporal
organization of auditory, visual, and auditory-visual evoked potentials in rat
cortex. Brain Res. 678, 177–190. doi: 10.1016/0006-8993(95)00182-P
Békésy, G. V. (1957). Neural volleys and the similarity between some sensations
produced by tones and by skin vibrations. J. Acoust. Soc. Am. 29, 1059–1072.
doi: 10.1121/1.1908698
Békésy, G. V. (1958). Funneling in the Nervous System and its Role in Loudness
and Sensation Intensity on the Skin. J. Acoust. Soc. Am. 30, 399–412. doi:
10.1121/1.1909626
Békésy, G. V. (1959). Neural funneling along the skin and between the inner
and outer hair cells of the cochlea. J Acoust. Soc. Am. 31, 1236–1249. doi:
10.1121/1.1907851
Békésy, G. V. (1967). Sensory Inhibition. Princeton, NJ: Princeton University Press.
Brett-Green, B. A., Chen-Bee, C. H., and Frostig, R. D. (2001). Comparing
the functional representations of central and border whiskers in rat primary
somatosensory cortex. J. Neurosci. 21, 9944–9954.
Bringuier, V., Chavane, F., Glaeser, L., and Frégnac, Y. (1999). Horizontal
propagation of visual activity in the synaptic integration field of
area 17 neurons. Science 283, 695–699. doi: 10.1126/science.283.
5402.695
Buzsáki, G. (2010). Neural syntax: cell assemblies, synapsembles, and readers.
Neuron 68, 362–385. doi: 10.1016/j.neuron.2010.09.023
Buzsáki, G., Costas, A. A., and Christof, K. (2012). “The origin of extracellular fields
and currents—EEG, ECoG, LFP and spikes.” Nat. Rev. Neurosci. 13, 407–420.
doi: 10.1038/nrn3241
Carvell, G. E., and Simons, D. J. (1990). Biometric analyses of vibrissal tactile
discrimination in the rat. J. Neurosci. 10, 2638–2648.
Celikel, T., and Sakmann, B. (2007). Sensory integration across space and in time
for decision making in the somatosensory system of rodents. Proc. Natl. Acad.
Sci. U.S.A. 104, 1395–1400. doi: 10.1073/pnas.0610267104
Chen, L. M., Friedman, R. M., and Roe, A. W. (2003). Optical imaging of a tactile
illusion in area 3b of the primary somatosensory cortex. Science 302, 881–885.
doi: 10.1126/science.1087846
Chen-Bee, C., Agoncillo, T., Lay, C., and Frostig, R. D. (2010). Intrinsic signal
optical imaging of brain function using short stimulus delivery intervals.
J. Neurosci. Methods 187, 171–182. doi: 10.1016/j.jneumeth.2010.01.009
Chen-Bee, C. H., Zhou, Y., Jacobs, N. S., Lim, B., and Frostig, R. D. (2012).Whisker
array functional representation in rat barrel cortex: transcendence of one-to-
one topography and its underlying mechanism. Front. Neural Circuits 6:93. doi:
10.3389/fncir.2012.00093
Frontiers in Neural Circuits | www.frontiersin.org 15 July 2015 | Volume 9 | Article 34
Jacobs et al. Ensemble-based invariance
Chung, S., Li, X., and Nelson, S. B. (2002). Short-term depression at
thalamocortical synapses contributes to rapid adaptation of cortical sensory
responses in vivo. Neuron 34, 437–446. doi: 10.1016/S0896-6273(02)00659-1
Das, A., and Gilbert, C. D. (1995). Long-range horizontal connections and their
role in cortical reorganization revealed by optical recording of cat primary
visual cortex. Nature 375, 780–784. doi: 10.1038/375780a0
Ferezou, I., Bolea, S., and Petersen, C. C. (2006). Visualizing the cortical
representation of whisker touch: voltage-sensitive dye imaging in freely moving
mice. Neuron 50, 617–629. doi: 10.1016/j.neuron.2006.03.043
Ferezou, I., Haiss, F., Gentet, L. J., Aronoff, R., Weber, B., and Petersen, C.
C. (2007). Spatiotemporal dynamics of cortical sensorimotor integration in
behaving mice. Neuron 56, 907–923. doi: 10.1016/j.neuron.2007.10.007
Frostig, R. D., Xiong, Y., Chen-Bee, C. H., Kvasnák, E., and Stehberg,
J. (2008). Large-scale organization of rat sensorimotor cortex based on
a motif of large activation spreads. J. Neurosci. 28, 13274–13284. doi:
10.1523/JNEUROSCI.4074-08.2008
Gao, X., Xu, W., Wang, Z., Takagaki, K., Li, B., and Wu, J. Y. (2012). Interactions
between two propagating waves in rat visual cortex. Neuroscience 216, 57–69.
doi: 10.1016/j.neuroscience.2012.04.062
Grinvald, A., Lieke, E. E., and Frostig, R. D. (1994). Cortical point-spread function
and long-range lateral interactions revealed by real-time optical imaging of
macaque monkey primary visual cortex. J. Neurosci. 14, 2545–2568.
Hashimoto, I., Yoshikawa, K., and Kimura, T. (1999). Sensory funneling of liminal
multiple-point air-puff stimulation produces dramatic reduction in reaction
time but relatively invariant P300 somatosensory evoked potential.Neuroreport
10, 3201–3205. doi: 10.1097/00001756-199910190-00014
Jadhav, S., Wolfe, J., and Feldman, D. (2009). Sparse temporal coding of elementary
tactile features during active whisker sensation.Nat. Neurosci. 12, 792–800. doi:
10.1038/nn.2328
Jancke, D., Chavane, F., Naaman, S., and Grinvald, A. (2004). Imaging cortical
correlates of illusion in early visual cortex. Nature 428, 423–426. doi:
10.1038/nature02396
Johnson, B. A., and Frostig, R. D. (2015). Photonics meets connectomics: case
of diffuse, long-range horizontal projections in rat cortex. Neurophotonics
2:041403. doi: 10.1117/1.NPh.2.4.041403
Kandel, A., and Buzsáki, G. (1997). Cellular-synaptic generation of sleep spindles,
spike-and-wave discharges, and evoked thalamocortical responses in the
neocortex of the rat. J. Neurosci. 17, 6783–6797.
Katz, Y., Heiss, J. E., and Lampl, I. (2006). Cross-whisker adaptation of
neurons in the rat barrel cortex. J. Neurosci. 26, 13363–13372. doi:
10.1523/JNEUROSCI.4056-06.2006
Kaur, S., Rose, H. J., Lazar, R., Liang, K., and Metherate, R. (2005).
Spectral integration in primary auditory cortex: laminar processing of
afferent input, in vivo and in vitro. Neuroscience 134, 1033–1045. doi:
10.1016/j.neuroscience.2005.04.052
Li, N., and DiCarlo, J. J. (2008). Unsupervised natural experience rapidly alters
invariant object representation in visual cortex. Science 321, 1502–1507. doi:
10.1126/science.1160028
Lueschow, A., Miller, E. K., and Desimone, R. (1994). Inferior temporal
mechanisms for invariant object recognition. Cereb. Cortex 4, 523–531. doi:
10.1093/cercor/4.5.523
MacEvoy, S. P., and Paradiso, M. A. (2001). Lightness constancy in
primary visual cortex. Proc. Natl. Acad. Sci. U.S.A. 98, 8827–8831. doi:
10.1073/pnas.161280398
Mohajerani, M. H., Chan, A.W., Mohsenvand, M., Ledue, J., Liu, R., McVea, D. A.,
et al. (2013). Spontaneous cortical activity alternates between motifs defined by
regional axonal projections.Nat. Neurosci. 16, 1426–1435. doi: 10.1038/nn.3499
Mowery, T. M., Harrold, J. B., and Alloway, K. D. (2011). Repeated whisker
stimulation evokes invariant neuronal responses in the dorsolateral striatum of
anesthetized rats: a potential correlate of sensorimotor habits. J. Neurophysiol.
105, 2225–2238. doi: 10.1152/jn.01018.2010
Nicolelis, M., and Lebedev, M. A. (2009). Principles of neural ensemble physiology
underlying the operation of brain–machine interfaces. Nat. Rev. Neurosci. 10,
530–540. doi: 10.1038/nrn2653
Quiroga, R. Q., and Panzeri, S. (2009). Extracting information from neuronal
populations: information theory and decoding approaches. Nat. Rev. Neurosci.
10, 173–185. doi: 10.1038/nrn2578
Quiroga, R. Q., Reddy, L., Kreiman, G., Koch, C., and Fried, I. (2005). Invariant
visual representation by single neurons in the human brain. Nature 435,
1102–1107. doi: 10.1038/nature03687
Roland, P. E., Hanazawa, A., Undeman, C., Eriksson, D., Tompa, T., Nakamura, H.,
et al. (2006). Cortical feedback depolarization waves: a mechanism of top-down
influence on early visual areas. Proc. Natl. Acad. Sci. U.S.A. 103, 12586–12591.
doi: 10.1073/pnas.0604925103
Rust, N. C., and DiCarlo, J. J. (2010). Selectivity and tolerance (“invariance”)
both increase as visual information propagates from cortical area V4 to IT.
J. Neurosci. 30, 12978–12995. doi: 10.1523/JNEUROSCI.0179-10.2010
Sadagopan, S., and Wang, X. (2008). Level invariant representation of sounds by
populations of neurons in primary auditory cortex. J. Neurosci. 28, 3415–3426.
doi: 10.1523/JNEUROSCI.2743-07.2008
Sakata, S., and Harris, K. D. (2009). Laminar structure of spontaneous and
sensory-evoked population activity in auditory cortex.Neuron 64, 404–418. doi:
10.1016/j.neuron.2009.09.020
Sáry, G., Vogels, R., and Orban, G. A. (1993). Cue-invariant shape selectivity
of macaque inferior temporal neurons. Science 260, 995–997. doi:
10.1126/science.8493538
Shadlen, M. N., and Newsome, W. T. (1998). The variable discharge of cortical
neurons: implications for connectivity, computation, and information coding.
J. Neurosci. 18, 3870–3896.
Sharon, D., Jancke, D., Chavane, F., Na’aman, S., and Grinvald, A. (2007). Cortical
response field dynamics in cat visual cortex. Cereb. Cortex 17, 2866–2877. doi:
10.1093/cercor/bhm019
Simons, D. J. (1978). Response properties of vibrissa units in rat SI somatosensory
neocortex. J. Neurophysiol. 41, 798–820.
Stehberg, J., Dang, P. T., and Frostig, R. D. (2014). Unimodal primary sensory
cortices are directly connected by long-range horizontal projections in the rat
sensory cortex. Front. Neuroanat. 8:93. doi: 10.3389/fnana.2014.00093
Temereanca, S., Brown, E. N., and Simons, D. J. (2008). Rapid changes in
thalamic firing synchrony during repetitive whisker stimulation. J. Neurosci.
28, 11153–11164. doi: 10.1523/JNEUROSCI.1586-08.2008
Temereanca, S., and Simons, D. J. (2003). Local field potentials and the encoding
of whisker deflections by population firing synchrony in thalamic barreloids.
J. Neurophysiol. 89, 2137–2145. doi: 10.1152/jn.00582.2002
Conflict of Interest Statement: The authors declare that the research was
conducted in the absence of any commercial or financial relationships that could
be construed as a potential conflict of interest.
Copyright © 2015 Jacobs, Chen-Bee and Frostig. This is an open-access article
distributed under the terms of the Creative Commons Attribution License (CC BY).
The use, distribution or reproduction in other forums is permitted, provided the
original author(s) or licensor are credited and that the original publication in this
journal is cited, in accordance with accepted academic practice. No use, distribution
or reproduction is permitted which does not comply with these terms.
Frontiers in Neural Circuits | www.frontiersin.org 16 July 2015 | Volume 9 | Article 34
Supplementary Table 1. Onset and peak latencies for each stimulus amplitude. Mean latencies (±
s.e.m) for each stimulus amplitude are provided as a reference for grand mean latencies reported
throughout the main text. Grand means are repeated at the top of each set of latencies for the sake of
comparison, and are the same values as reported in the main text. For s.e.m. calculations for grand
means here and in the main text, latencies were first average across stimulus amplitudes for each
subject, and then the s.e.m. calculated based on stimulus amplitude means for each subject. Below,
statistics are provided for each set of latencies. There was no consistent differences between stimulus
amplitudes and most effect sizes, whether significant or not, were small.
For single whisker evoked LFP for the first deflection, onset and peak latencies were not
significantly different between stimulus amplitudes (onset latency, F(3,15)=2.81, p=0.075; peak latency,
F(3,15)=1.39, p=0.284). For single whisker evoked MUP, significant differences between stimulus
amplitudes were found for onset but not peak latencies (main effects of stimulus amplitude; onset
latency, F(3,15)=9.60, p<0.05; peak latency, F(3,15)=0.91, p=0.460). For whisker array evoked LFP,
onset and peak latencies were not significantly different between stimulus amplitudes (main effects of
stimulus amplitude; onset latency, F(3,15)=2.15, p=0.13; peak latency, F(3,15)=1.96, p=0.157). For
whisker array evoked MUP, onset and peak latencies were not significantly different between stimulus
amplitudes (main effects of stimulus amplitude; onset latency, F(3,15)=3.12, p=0.052; peak latency,
F(3,15)=3.09, p=0.053). For repeated single whisker deflections 2-5, peak LFP and MUP latencies
were not significantly different between stimulus amplitudes (LFP, F(3,15)=2.87, p=0.071; MUP,
F(3,15)=0.35, p=0.791). For repeated whisker array deflections 2-5, there were significant differences
between stimulus amplitudes for peak LFP latencies (F(3,15)=4.32, p<0.05) but not peak MUP
latencies (F(3,15)=1.75, p=0.192).
Onset latencies were shorter for trial averaged MUP than is typically reported for suprathreshold spiking
activity in barrel cortex based on spike detection. This is due to differences in the sensitive and nature
of each signal. Timestamps of detected spikes are typically aligned with the negative peak of the spike
waveform. The negative peak of trial averaged MUP corresponds to overlap in the negative peak of
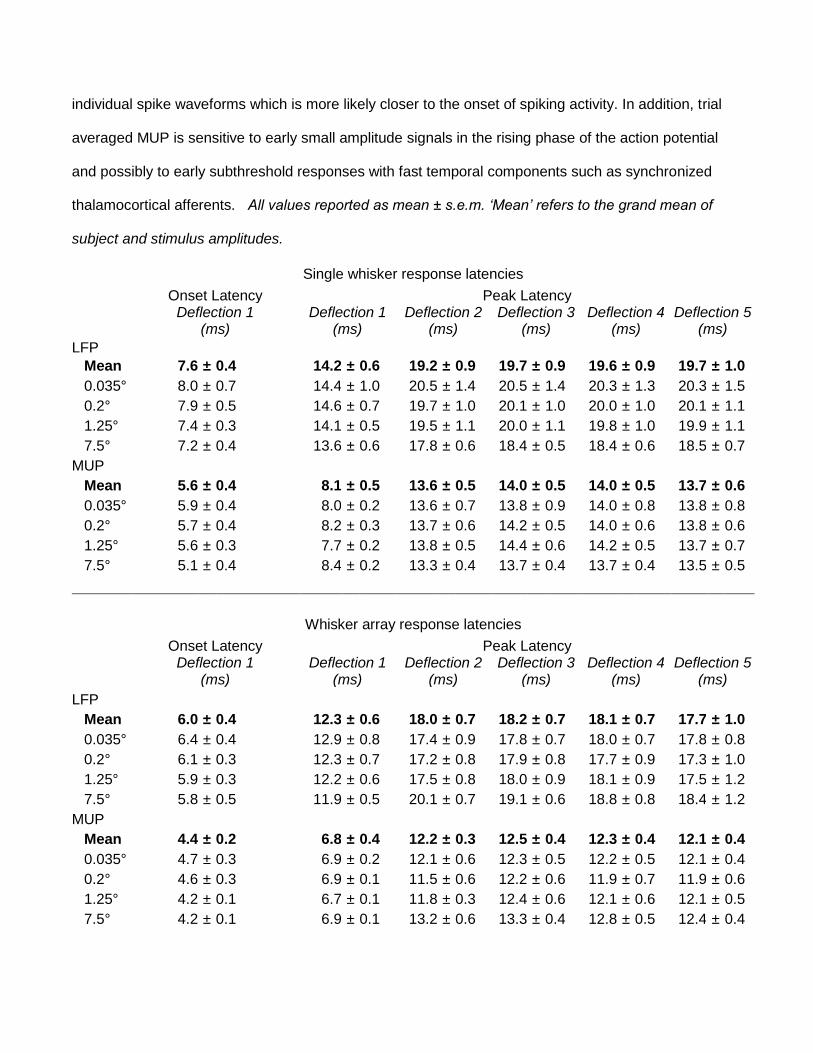
individual spike waveforms which is more likely closer to the onset of spiking activity. In addition, trial
averaged MUP is sensitive to early small amplitude signals in the rising phase of the action potential
and possibly to early subthreshold responses with fast temporal components such as synchronized
thalamocortical afferents. All values reported as mean ± s.e.m. ‘Mean’ refers to the grand mean of
subject and stimulus amplitudes.
Single whisker response latencies
Onset Latency Peak Latency Deflection 1
(ms) Deflection 1
(ms) Deflection 2
(ms) Deflection 3
(ms) Deflection 4
(ms) Deflection 5
(ms)
LFP
Mean 7.6 ± 0.4 14.2 ± 0.6 19.2 ± 0.9 19.7 ± 0.9 19.6 ± 0.9 19.7 ± 1.0
0.035° 8.0 ± 0.7 14.4 ± 1.0 20.5 ± 1.4 20.5 ± 1.4 20.3 ± 1.3 20.3 ± 1.5
0.2° 7.9 ± 0.5 14.6 ± 0.7 19.7 ± 1.0 20.1 ± 1.0 20.0 ± 1.0 20.1 ± 1.1
1.25° 7.4 ± 0.3 14.1 ± 0.5 19.5 ± 1.1 20.0 ± 1.1 19.8 ± 1.0 19.9 ± 1.1
7.5° 7.2 ± 0.4 13.6 ± 0.6 17.8 ± 0.6 18.4 ± 0.5 18.4 ± 0.6 18.5 ± 0.7
MUP Mean 5.6 ± 0.4 8.1 ± 0.5 13.6 ± 0.5 14.0 ± 0.5 14.0 ± 0.5 13.7 ± 0.6
0.035° 5.9 ± 0.4 8.0 ± 0.2 13.6 ± 0.7 13.8 ± 0.9 14.0 ± 0.8 13.8 ± 0.8
0.2° 5.7 ± 0.4 8.2 ± 0.3 13.7 ± 0.6 14.2 ± 0.5 14.0 ± 0.6 13.8 ± 0.6
1.25° 5.6 ± 0.3 7.7 ± 0.2 13.8 ± 0.5 14.4 ± 0.6 14.2 ± 0.5 13.7 ± 0.7
7.5° 5.1 ± 0.4 8.4 ± 0.2 13.3 ± 0.4 13.7 ± 0.4 13.7 ± 0.4 13.5 ± 0.5
Whisker array response latencies
Onset Latency Peak Latency Deflection 1
(ms) Deflection 1
(ms) Deflection 2
(ms) Deflection 3
(ms) Deflection 4
(ms) Deflection 5
(ms)
LFP Mean 6.0 ± 0.4 12.3 ± 0.6 18.0 ± 0.7 18.2 ± 0.7 18.1 ± 0.7 17.7 ± 1.0
0.035° 6.4 ± 0.4 12.9 ± 0.8 17.4 ± 0.9 17.8 ± 0.7 18.0 ± 0.7 17.8 ± 0.8
0.2° 6.1 ± 0.3 12.3 ± 0.7 17.2 ± 0.8 17.9 ± 0.8 17.7 ± 0.9 17.3 ± 1.0
1.25° 5.9 ± 0.3 12.2 ± 0.6 17.5 ± 0.8 18.0 ± 0.9 18.1 ± 0.9 17.5 ± 1.2
7.5° 5.8 ± 0.5 11.9 ± 0.5 20.1 ± 0.7 19.1 ± 0.6 18.8 ± 0.8 18.4 ± 1.2
MUP Mean 4.4 ± 0.2 6.8 ± 0.4 12.2 ± 0.3 12.5 ± 0.4 12.3 ± 0.4 12.1 ± 0.4
0.035° 4.7 ± 0.3 6.9 ± 0.2 12.1 ± 0.6 12.3 ± 0.5 12.2 ± 0.5 12.1 ± 0.4
0.2° 4.6 ± 0.3 6.9 ± 0.1 11.5 ± 0.6 12.2 ± 0.6 11.9 ± 0.7 11.9 ± 0.6
1.25° 4.2 ± 0.1 6.7 ± 0.1 11.8 ± 0.3 12.4 ± 0.6 12.1 ± 0.6 12.1 ± 0.5
7.5° 4.2 ± 0.1 6.9 ± 0.1 13.2 ± 0.6 13.3 ± 0.4 12.8 ± 0.5 12.4 ± 0.4

Supplementary Figure 1. Coincident spike waveforms in whisker evoked multi-unit
activity. Spontaneous (open arrows) and evoked (closed arrows) multi-unit activity at varying
distances from peak responses are plotted for 10 consecutive trials of whisker array stimulation. Note
the maximum amplitude of evoked multi-unit potentials which are denoted by dotted red lines in each
trace. In (A), far away from peak responses, evoked spike waveforms presumably from individual
neurons are comparable in amplitude to spontaneous spikes also presumably from individual neurons.
In (B), closer to peak responses, the amplitude of evoked spikes are consistently larger than the
amplitude of spontaneous spikes. In (C), the amplitude of evoked spikes are consistently larger than
the amplitude of spontaneous spikes and the amplitude of evoked spikes at locations further away from
peak responses (shown in (A) and (B)). Since spike amplitude should not change if produced by action
potentials from a single neuron, these data indicate that these variable spike waveforms are actually
produced by multiple coincident spike waveforms with varying numbers of contributing neurons. This
greatly constrains the interpretation of traditional spike counts and PSTHs since one “spike” can
indicate either a single neuron firing or many neurons firing simultaneously (for a general discussion of
this common issue see Bar-Gad, 2001).
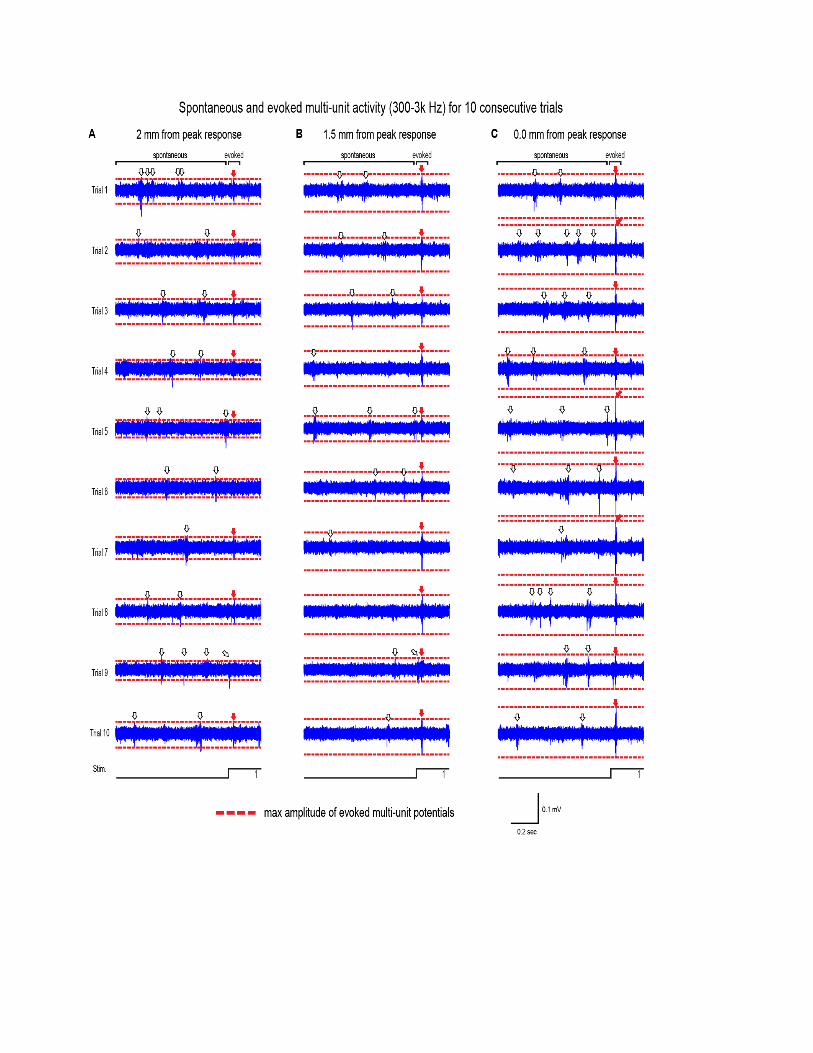
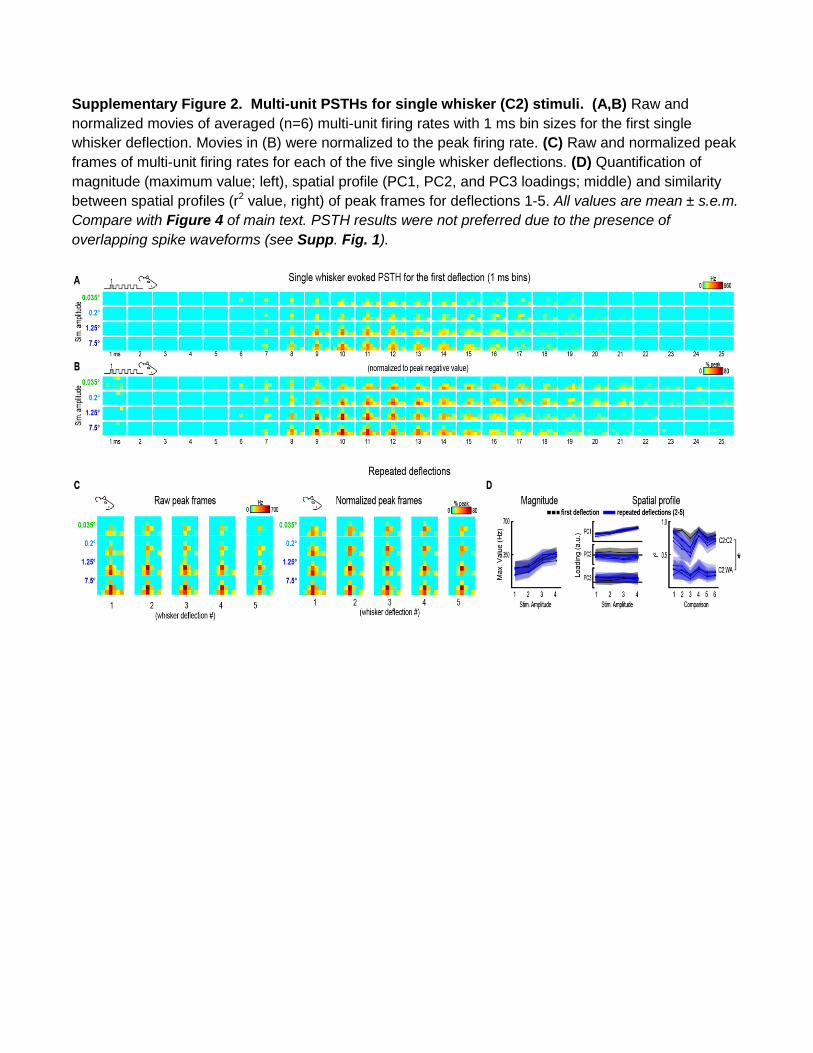
Supplementary Figure 2. Multi-unit PSTHs for single whisker (C2) stimuli. (A,B) Raw and
normalized movies of averaged (n=6) multi-unit firing rates with 1 ms bin sizes for the first single
whisker deflection. Movies in (B) were normalized to the peak firing rate. (C) Raw and normalized peak
frames of multi-unit firing rates for each of the five single whisker deflections. (D) Quantification of
magnitude (maximum value; left), spatial profile (PC1, PC2, and PC3 loadings; middle) and similarity
between spatial profiles (r2 value, right) of peak frames for deflections 1-5. All values are mean ± s.e.m.
Compare with Figure 4 of main text. PSTH results were not preferred due to the presence of
overlapping spike waveforms (see Supp. Fig. 1).
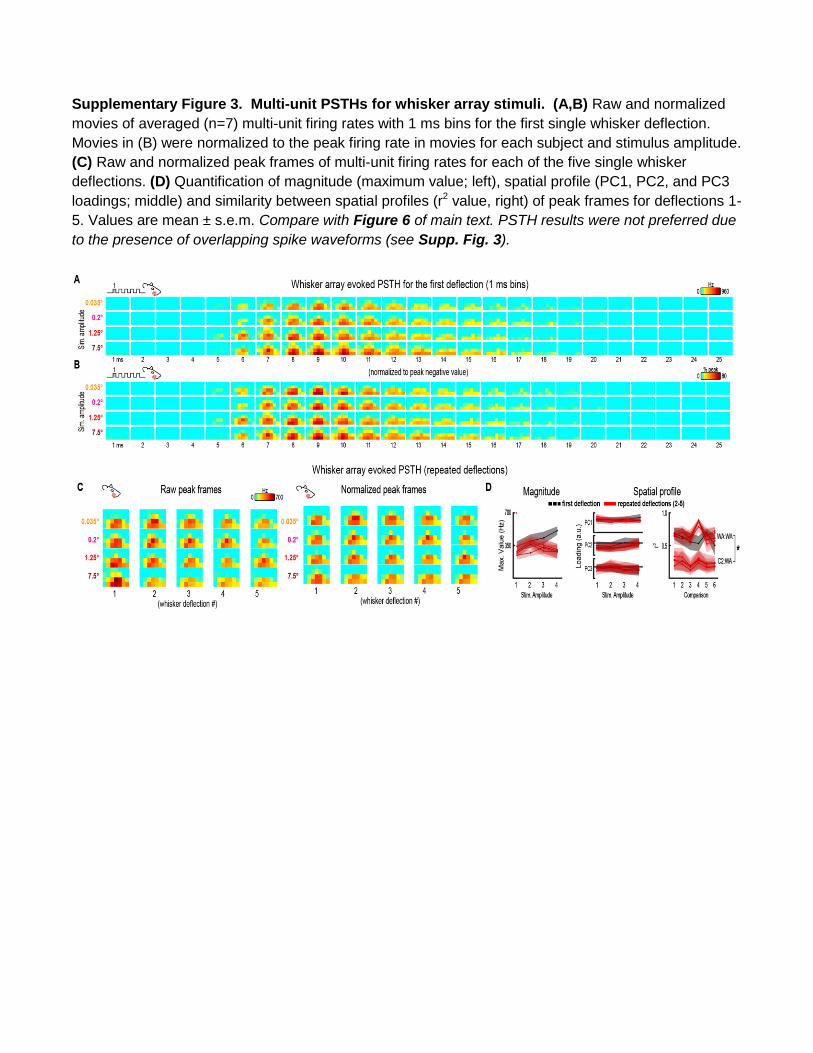
Supplementary Figure 3. Multi-unit PSTHs for whisker array stimuli. (A,B) Raw and normalized
movies of averaged (n=7) multi-unit firing rates with 1 ms bins for the first single whisker deflection.
Movies in (B) were normalized to the peak firing rate in movies for each subject and stimulus amplitude.
(C) Raw and normalized peak frames of multi-unit firing rates for each of the five single whisker
deflections. (D) Quantification of magnitude (maximum value; left), spatial profile (PC1, PC2, and PC3
loadings; middle) and similarity between spatial profiles (r2 value, right) of peak frames for deflections 1-
5. Values are mean ± s.e.m. Compare with Figure 6 of main text. PSTH results were not preferred due
to the presence of overlapping spike waveforms (see Supp. Fig. 3).
Supplementary Figure 4. Whisker stimulation engages entire mesoscopic field of view for each
stimulus amplitude. (A, B) Z-scores were calculated for raw single whisker evoked LFP and MUP at
each recording location by dividing by the standard deviation of voltages during the 50 ms period before
stimulus onset. Note that evoked LFP and MUP can be detected (> 3 standard deviations above pre-
stimulus data, warm colors in images) throughout the entire mesoscopic field of view. (C, D) For each
recording location, the maximum z-score within the 25 ms of stimulus onset (50 ms for deflections 2-5
since peak latencies tended to be delayed slightly) was calculated. Results for deflection 1, detailed in
(A,B), are framed. (E-H) Same as (A-D) but for whisker array data.
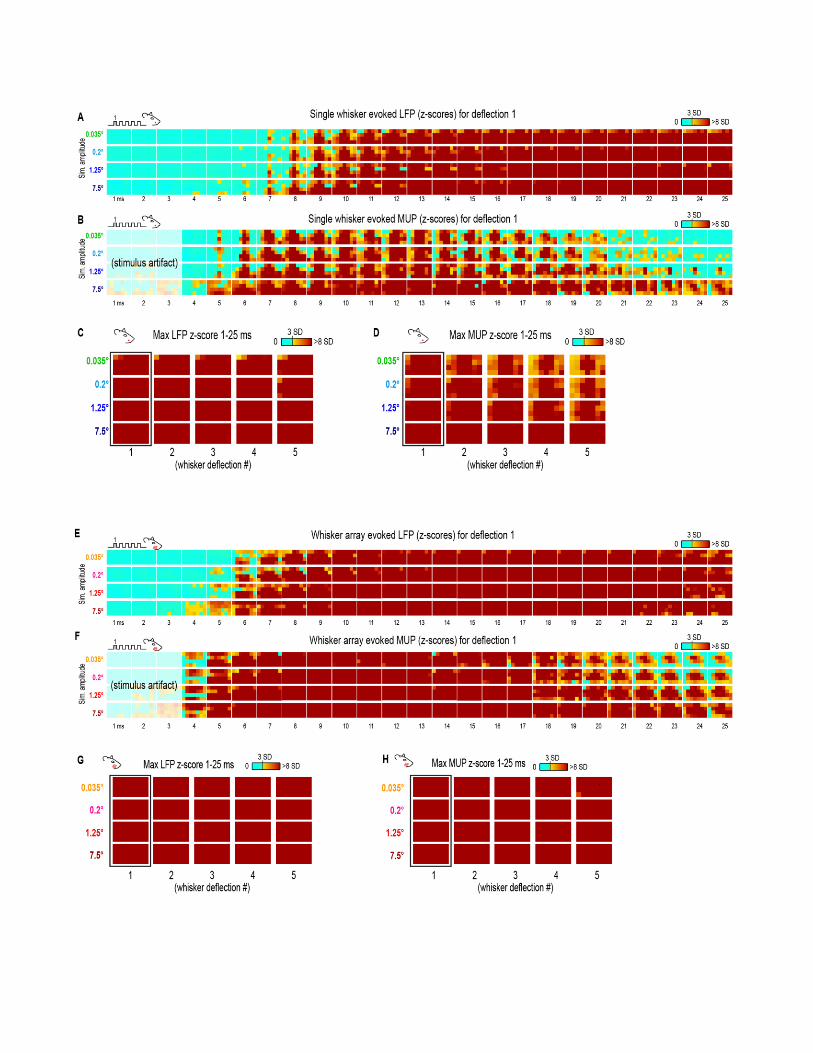

Supplementary Figure 5. PCA visualizes differences between single whisker and whisker array
evoked activity. PCA was performed on a combined data set with both single whisker and whisker
array evoked LFP (A) and MUP (B). Mean PC loadings (n=6), connected in chronological order for
each condition, are plotted. In each data set, note that paths for single whisker vs whisker array
conditions showed characteristic differences (e.g., in B peanut shaped path only occurs for whisker
array conditions). For each data set, the exact same axes are used for single whisker and whisker array
results which were separated for the sake of clarity.
Related Documents