Electrophysiological responses to visuospatial regularity ALEXIS D. J. MAKIN, a GIULIA RAMPONE, a ANNA PECCHINENDA, b and MARCO BERTAMINI a a Department of Psychological Sciences, University of Liverpool, Liverpool, UK b Department of Psychology, Sapienza University of Rome, Rome, Italy Abstract Humans are quicker to detect reflectional than rotational or translational symmetry, despite the fact that these patterns are equally regular. We were interested in the neural correlates of these perceptual effects. Participants viewed random, reflection, rotation, and translation patterns while we recorded EEG from the scalp. Half the participants classified the pattern regularity overtly, the other half did not explicitly attend to pattern regularity but reported rare oddball trials, where two squares were embedded among the dots. The amplitude of a symmetry-related ERP known as the sustained posterior negativity was most pronounced for reflection, then rotation and translation. We suggest that reflectional symmetry, despite its biological significance, may not be processed by unique visual mechanisms, but instead it could be a preferred stimulus for a more general regularity-sensitive network in the extrastriate visual cortex. Descriptors: Cognition, EEG/ERP, Sensation/Perception, Normal volunteers The universe is full of symmetrical objects at all scales, and the visual systems of many animals are tuned to symmetry (Treder, 2010; Tyler, 1995; Wagemans, 1995). At a perceptual level, it could be that symmetry is an important cue for figure-ground segmenta- tion (Machilsen, Pauwels, & Wagemans, 2009), but in addition it has also been suggested that symmetry is important because it signals reproductive fitness in other members of the species (Møller, 1992). When people use the word “symmetry,” they often mean bilateral reflectional symmetry; however, symmetry is present in any pattern that is identical after undergoing an isometric transformation. If we restrict ourselves to the two-dimensional (2D) plane, there are four possible symmetries: reflection, glide reflection, rotation, and translation (Palmer, 1991; Wagemans, 1995). The fact that people associate symmetry with reflection alone is probably not an accident—this is the regularity known to be most salient for the human visual system (Mach, 1886/1959; Makin, Pecchinenda, & Bertamini, 2012; Royer, 1981). Many psychophysical studies have empirically confirmed and expanded Mach’s early observations. It is known that reflectional symmetry with a vertical axis is detected more rapidly than when the axis is horizontal or oblique (Bertamini, Friedenberg, & Kubovy, 1997; Friedenberg & Bertamini, 2000), unless a particular orientation is anticipated (Wenderoth, 1994). Moreover, reflec- tional symmetry is detected more quickly than rotation or transla- tion, even when the patterns are equated in terms of mathematical regularity (Bertamini, 2010; Bertamini, Friedenberg, & Argyle, 2002; Koning & Wagemans, 2009; Palmer & Hemenway, 1978; Royer, 1981). The current study was designed to explore neural processing of images containing reflection, rotation, random, or translation configurations. There have been several neuroimaging studies on symmetry perception (reviewed in Treder, 2010). Sasaki, Vanduffel, Knutsen, Tyler, and Tootell (2005) recorded cerebral blood flow with fMRI while participants viewed reflection or random patterns. V1 and V2 were not differentially activated, but reflection produced more activity in the areas V3–V7 and the lateral occipital complex (see also Chen, Kao, & Tyler, 2007; Tyler etal., 2005). Most recently, Cattaneo, Mattavelli, Papagno, Herbert, and Silvanto (2011) disrupted the bilateral dorsal lateral occipital complex with transcranial magnetic stimulation (TMS), and discovered that this altered perception of reflectional symmetry. Most relevant to the current work, Jacobsen and Höfel (2003) recorded event-related potentials (ERPs) produced by symmetrical and random patterns. They reported an ERP component called the sustained posterior negativity (SPN). It should be noted that nega- tivity is a relative term here, referring to the fact that amplitude was more negative for the symmetrical than random patterns between 600 and 1,100 ms poststimulus. The SPN was replicated in subse- quent experiments when participants were not explicitly encour- aged to categorize the patterns in terms of their symmetry (Höfel & Jacobsen, 2007a), when participants deliberately misreported their responses (Höfel & Jacobsen, 2007b), and when they were attend- ing to symmetry in human faces (Roye, Höfel, & Jacobsen, 2008). More recently, Makin, Wilton, Pecchinenda and Bertamini (2012) again recorded the SPN and found that it was unaffected by whether participants processed the reflection or random patterns as targets. Given the special status of reflectional symmetry for human observers, one important issue is whether reflection is processed in a way that is unique and different from other regularities. The neuroimaging literature has not directly compared neural responses This project was sponsored by a Leverhulme Trust Grant awarded to MB and AP in 2010, and a Leverhulme Trust Early Career Fellowship awarded to AM in 2012. Address correspondence to: Alexis D. J. Makin, Department of Psycho- logical Sciences, Eleanor Rathbone Building, University of Liverpool, Liv- erpool, L69 7ZA, UK. E-mail: [email protected] Psychophysiology, •• (2013), ••–••. Wiley Periodicals, Inc. Printed in the USA. Copyright © 2013 Society for Psychophysiological Research DOI: 10.1111/psyp.12082 1

Welcome message from author
This document is posted to help you gain knowledge. Please leave a comment to let me know what you think about it! Share it to your friends and learn new things together.
Transcript

Electrophysiological responses to visuospatial regularity
ALEXIS D. J. MAKIN,a GIULIA RAMPONE,a ANNA PECCHINENDA,b and MARCO BERTAMINIa
aDepartment of Psychological Sciences, University of Liverpool, Liverpool, UKbDepartment of Psychology, Sapienza University of Rome, Rome, Italy
Abstract
Humans are quicker to detect reflectional than rotational or translational symmetry, despite the fact that these patterns areequally regular. We were interested in the neural correlates of these perceptual effects. Participants viewed random,reflection, rotation, and translation patterns while we recorded EEG from the scalp. Half the participants classified thepattern regularity overtly, the other half did not explicitly attend to pattern regularity but reported rare oddball trials,where two squares were embedded among the dots. The amplitude of a symmetry-related ERP known as the sustainedposterior negativity was most pronounced for reflection, then rotation and translation. We suggest that reflectionalsymmetry, despite its biological significance, may not be processed by unique visual mechanisms, but instead it could bea preferred stimulus for a more general regularity-sensitive network in the extrastriate visual cortex.
Descriptors: Cognition, EEG/ERP, Sensation/Perception, Normal volunteers
The universe is full of symmetrical objects at all scales, and thevisual systems of many animals are tuned to symmetry (Treder,2010; Tyler, 1995; Wagemans, 1995). At a perceptual level, it couldbe that symmetry is an important cue for figure-ground segmenta-tion (Machilsen, Pauwels, & Wagemans, 2009), but in addition ithas also been suggested that symmetry is important because itsignals reproductive fitness in other members of the species(Møller, 1992). When people use the word “symmetry,” they oftenmean bilateral reflectional symmetry; however, symmetry ispresent in any pattern that is identical after undergoing an isometrictransformation. If we restrict ourselves to the two-dimensional(2D) plane, there are four possible symmetries: reflection, glidereflection, rotation, and translation (Palmer, 1991; Wagemans,1995). The fact that people associate symmetry with reflectionalone is probably not an accident—this is the regularity known tobe most salient for the human visual system (Mach, 1886/1959;Makin, Pecchinenda, & Bertamini, 2012; Royer, 1981).
Many psychophysical studies have empirically confirmed andexpanded Mach’s early observations. It is known that reflectionalsymmetry with a vertical axis is detected more rapidly than whenthe axis is horizontal or oblique (Bertamini, Friedenberg, &Kubovy, 1997; Friedenberg & Bertamini, 2000), unless a particularorientation is anticipated (Wenderoth, 1994). Moreover, reflec-tional symmetry is detected more quickly than rotation or transla-tion, even when the patterns are equated in terms of mathematicalregularity (Bertamini, 2010; Bertamini, Friedenberg, & Argyle,2002; Koning & Wagemans, 2009; Palmer & Hemenway, 1978;
Royer, 1981). The current study was designed to explore neuralprocessing of images containing reflection, rotation, random, ortranslation configurations.
There have been several neuroimaging studies on symmetryperception (reviewed in Treder, 2010). Sasaki, Vanduffel, Knutsen,Tyler, and Tootell (2005) recorded cerebral blood flow with fMRIwhile participants viewed reflection or random patterns. V1 and V2were not differentially activated, but reflection produced moreactivity in the areas V3–V7 and the lateral occipital complex (seealso Chen, Kao, & Tyler, 2007; Tyler et al., 2005). Most recently,Cattaneo, Mattavelli, Papagno, Herbert, and Silvanto (2011)disrupted the bilateral dorsal lateral occipital complex withtranscranial magnetic stimulation (TMS), and discovered that thisaltered perception of reflectional symmetry.
Most relevant to the current work, Jacobsen and Höfel (2003)recorded event-related potentials (ERPs) produced by symmetricaland random patterns. They reported an ERP component called thesustained posterior negativity (SPN). It should be noted that nega-tivity is a relative term here, referring to the fact that amplitude wasmore negative for the symmetrical than random patterns between600 and 1,100 ms poststimulus. The SPN was replicated in subse-quent experiments when participants were not explicitly encour-aged to categorize the patterns in terms of their symmetry (Höfel &Jacobsen, 2007a), when participants deliberately misreported theirresponses (Höfel & Jacobsen, 2007b), and when they were attend-ing to symmetry in human faces (Roye, Höfel, & Jacobsen, 2008).More recently, Makin, Wilton, Pecchinenda and Bertamini (2012)again recorded the SPN and found that it was unaffected bywhether participants processed the reflection or random patterns astargets.
Given the special status of reflectional symmetry for humanobservers, one important issue is whether reflection is processed ina way that is unique and different from other regularities. Theneuroimaging literature has not directly compared neural responses
This project was sponsored by a Leverhulme Trust Grant awarded toMB and AP in 2010, and a Leverhulme Trust Early Career Fellowshipawarded to AM in 2012.
Address correspondence to: Alexis D. J. Makin, Department of Psycho-logical Sciences, Eleanor Rathbone Building, University of Liverpool, Liv-erpool, L69 7ZA, UK. E-mail: [email protected]
bs_b
s_ba
nner
Psychophysiology, •• (2013), ••–••. Wiley Periodicals, Inc. Printed in the USA.Copyright © 2013 Society for Psychophysiological ResearchDOI: 10.1111/psyp.12082
1
to different types of symmetry (reflection, rotation, and translation)with random patterns on the same participants. We therefore rec-orded ERPs produced by these patterns.
We assume that there are networks in the visual cortex that aresensitive to regularity, and that these networks generate the SPN(indeed, Makin, Wilton, Pecchinenda, & Bertamini, 2012, identi-fied extrastriate SPN generators with the LORETA source locali-zation procedure). With this in mind, we next considered severalexplanations for the well-documented salience differences betweenthe different regularities.
One possibility is that the SPN-generating networks are sensi-tive to reflectional symmetry, but not to rotation or translation. Ifthis is the case, the SPN would only be present for reflection, andthe waveforms in the random, rotation, and translation conditionwould be nearly identical. It is possible that specialized mecha-nisms would be dedicated to detection of reflectional symmetry,because reflection has a special evolutionary significance. Forexample, the body plan of animals has bilateral reflectional sym-metry, and specialized systems are certainly involved in face per-ception (see Tyler, 1995, for more on the biological significance ofreflectional symmetry).
A second possibility is that the SPN generators are equallysensitive to all regularities. If this is the case, the SPN waveformwould be similar for each regularity type, and the detection speeddifferences between the regularity types must arise from differen-tial processing elsewhere in the brain.
A third possibility is that the networks responsible for the SPNare most sensitive to reflection, but also respond to rotation andtranslation to some extent. In this case, the SPN would be mostpronounced for reflection, but also present for rotation and trans-lation. In this case, the networks that generate the SPN couldexplain the known detection speed differences. This would suggestthat there are no special mechanisms dedicated uniquely to reflec-tional symmetry, contrary to hypothesis one.
We compared ERPs in two different tasks that required differentlevels of engagement with the patterns. In the explicit discrimina-tion task, participants classified the patterns as reflection, rotation,random, or translation on every trial. Conversely, in the oddballdetection task, participants did not have to classify patterns overtly,but instead responded to rare oddball trials where some patternelements stood out from the rest. If the SPN is generated by rela-tively automatic, bottom-up visual processing, it would thus becomparable in both tasks despite different attentional requirements.However, the SPNs produced by different kinds of regularity mightbe affected by this manipulation in different ways.
Method
Participants
Forty-eight participants were involved in this study (16 male, 2left-handed, age 18–45). Participants had normal or corrected-to-normal vision. The study had local ethics committee approval andwas conducted in accordance with the Declaration of Helsinki(revised 2008).
Apparatus
Participants sat 140 cm from the 40 × 30 cm monitor and used theA,S, K, and L buttons of a computer keyboard to enter their responses.Stimuli were generated and presented on a CRT monitor using thePsychoPy software (Peirce, 2007). Electroencephalographic (EEG)
activity was recorded using a BioSemi Active-Two amplifier in anelectrically shielded and darkened room. EEG was sampled continu-ously at 512 Hz from 64 AgCl scalp electrodes arranged accordingto the International 10-20 system. Two additional electrodes, calledcommon mode sense (CMS) and driven right leg (DRL), were usedas reference and ground. Biopolar vertical (VEOG) and horizontal(HEOG) electrooculogram electrodes were positioned above andbelow the right eye, and on the outer canthi of both eyes, respec-tively. The EOG data were obtained from four external channels ofthe same BioSemi amplifier.
Stimuli
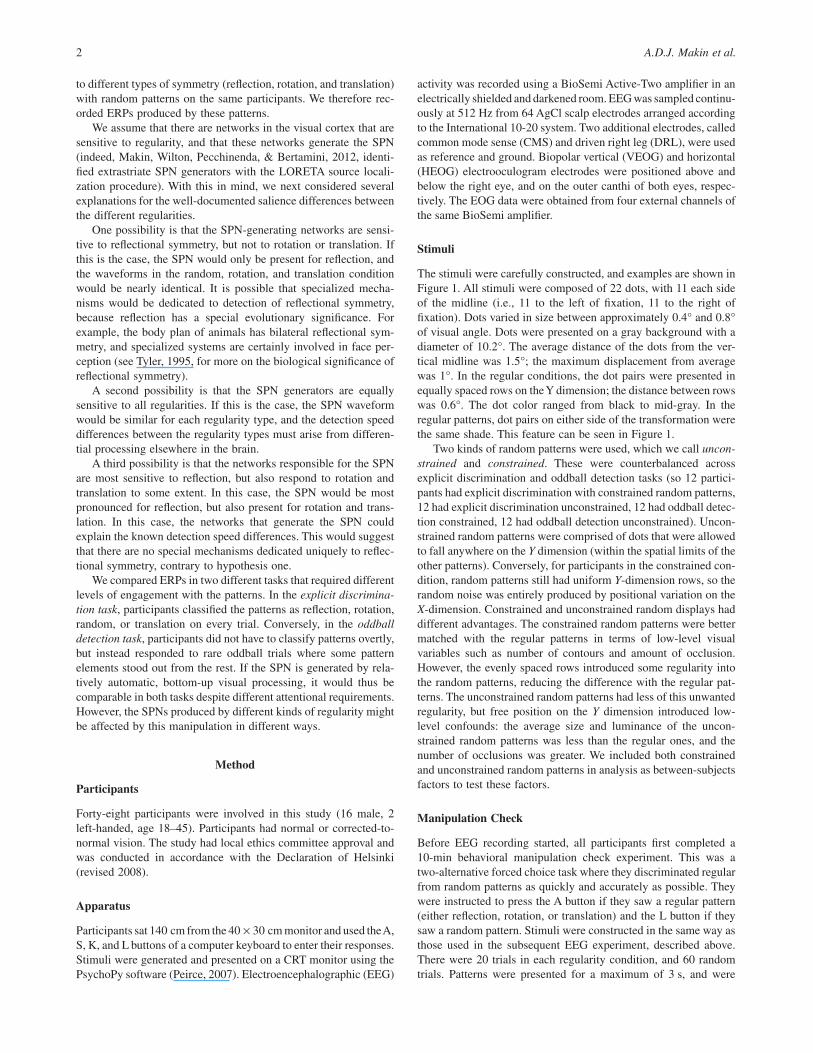
The stimuli were carefully constructed, and examples are shown inFigure 1. All stimuli were composed of 22 dots, with 11 each sideof the midline (i.e., 11 to the left of fixation, 11 to the right offixation). Dots varied in size between approximately 0.4° and 0.8°of visual angle. Dots were presented on a gray background with adiameter of 10.2°. The average distance of the dots from the ver-tical midline was 1.5°; the maximum displacement from averagewas 1°. In the regular conditions, the dot pairs were presented inequally spaced rows on theY dimension; the distance between rowswas 0.6°. The dot color ranged from black to mid-gray. In theregular patterns, dot pairs on either side of the transformation werethe same shade. This feature can be seen in Figure 1.
Two kinds of random patterns were used, which we call uncon-strained and constrained. These were counterbalanced acrossexplicit discrimination and oddball detection tasks (so 12 partici-pants had explicit discrimination with constrained random patterns,12 had explicit discrimination unconstrained, 12 had oddball detec-tion constrained, 12 had oddball detection unconstrained). Uncon-strained random patterns were comprised of dots that were allowedto fall anywhere on the Y dimension (within the spatial limits of theother patterns). Conversely, for participants in the constrained con-dition, random patterns still had uniform Y-dimension rows, so therandom noise was entirely produced by positional variation on theX-dimension. Constrained and unconstrained random displays haddifferent advantages. The constrained random patterns were bettermatched with the regular patterns in terms of low-level visualvariables such as number of contours and amount of occlusion.However, the evenly spaced rows introduced some regularity intothe random patterns, reducing the difference with the regular pat-terns. The unconstrained random patterns had less of this unwantedregularity, but free position on the Y dimension introduced low-level confounds: the average size and luminance of the uncon-strained random patterns was less than the regular ones, and thenumber of occlusions was greater. We included both constrainedand unconstrained random patterns in analysis as between-subjectsfactors to test these factors.
Manipulation Check
Before EEG recording started, all participants first completed a10-min behavioral manipulation check experiment. This was atwo-alternative forced choice task where they discriminated regularfrom random patterns as quickly and accurately as possible. Theywere instructed to press the A button if they saw a regular pattern(either reflection, rotation, or translation) and the L button if theysaw a random pattern. Stimuli were constructed in the same way asthose used in the subsequent EEG experiment, described above.There were 20 trials in each regularity condition, and 60 randomtrials. Patterns were presented for a maximum of 3 s, and were
2 A.D.J. Makin et al.
terminated upon button press. If participants pressed the wrongbutton, a beep sound was presented (800 Hz), and the patternremained on the screen for a further 2 s. Before the manipulationcheck, participants were shown three examples of the differentcategories to ensure they understood the task.
Based on previous literature, we predicted that participantswould be quicker to respond to reflectional symmetry compared torotation or translation. This allowed us to confirm that the detectionspeed differences reported in earlier work (e.g., Royer, 1981) alsoapplied to our participants.
EEG Experiment
We compared ERPs in two tasks that were completed by separategroups of 24 participants. One group were given an explicit dis-crimination task: They had to classify the patterns as reflection,rotation, random, or translation on each trial. The other group of 24participants were given an oddball detection task: 16.6% of thetrials were oddballs, in which two squares were added to patternscomposed of circles. Therefore, observers did not have to attend tothe different types of regularity and classify them. We were notinterested in ERP responses to the oddball trials, although weexpected to record a parietal P300 potential in these trials based onthe large oddball-ERP literature (e.g., Luck, 2005).
In all experiments, there were 60 trials of each regularity typeand 60 random trials. In the oddball detection task, there were anadditional 12 oddball trials in each condition, which were notincluded in the analysis of the other ERPs. The patterns werepresented in a unique random order for each participant, andcould not be anticipated. Trials began with a 1.5-s fixation base-line, and then patterns were presented on the screen for 3 s (theseparameters were chosen for consistency with previous symmetry-ERP literature, e.g., Jacobsen and Höfel, 2003, Makin, Wiltonet al., 2012). Participants were instructed to fixate throughout the
period when the pattern was on the screen, as well as during thebaseline period.
At the end of each trial, cue words appeared on the screen, withthe positioning of the words indicating the response mapping forthat trial (Figure 1). For example, in the explicit discriminationtask, the cue words REFLECTION, ROTATION, RANDOM, andTRANSLATION appeared, with the position of the words arrangedin an unpredictable way on each trial. Participants pressed left (A)and mid-left (S) keys with their left hand, and mid-right (K) andright (L) keys with their right hand. Participants understood that thekeys corresponded to the positioning of the cue words, so if the cueREFLECTION was positioned on the far left side, and it wasindeed a reflection trial, participants were required to press the farleft (A) key. Alternatively, if the cue RANDOM was positioned onthe far right, and it was a random trial, then participants wererequired to press the far right (L) key. In the oddball detection task,the words NORMAL and ODDBALL and the left (A) and right (L)buttons were used in the same way. The positioning of the cuewords was counterbalanced with pattern types. The advantage ofthis protocol was that it was impossible to know which hand wouldbe used to enter responses while the stimuli were on the screen, andtherefore ERPs were not influenced by lateralized preparation ofmotor responses (Makin, Poliakoff, Ackerley, & El-Deredy, 2012).
EEG Analysis
EEG data were processed using the EEGLAB toolbox in MATLAB.Raw signals from 64 scalp electrodes were referenced to an averagereference, and low-pass filtered at 25 Hz. Data were resampled at128 Hz to reduce file size, and segmented into −0.2 to +2 s epochs,with −200 to 0 ms baseline. After this, independent componentsanalysis (ICA; Jung et al., 2000) was used to remove artifactsproduced by blinks and eye movements. Data were reformed as 64components, and an average of 7.85 components were removed
Figure 1. Stimuli used in this experiment. In the EEG recording, all participants were presented with 60 repeats of each regular pattern and 60 repeats ofeither the constrained or unconstrained random patterns. Patterns were visible for 3 s before participants entered their judgment. Half the participantsexplicitly discriminated between reflection, rotation, random, and translation patterns. For the other participants, the task was to judge whether it was anormal trial (all dots) or an oddball trial (two squares among the dots).
Electrophysiological responses to visuospatial regularity 3

from each participant (min = 2, max = 16). After ICA, trials withamplitude beyond ± 100 μV at any electrode were excluded. Theaverage proportion of excluded trials did not differ significantlybetween regularities (reflection 9%, rotation 9%, translation 10%,random 10%; p = .505), between participants in the explicit dis-crimination and oddball detection tasks (9% vs. 10%; p = .561), orbetween participants in constrained and unconstrained conditions(10% vs. 9%; p = .603). Finally, there was no difference between theproportion of excluded trials in the normal and oddball trials of theoddball detection task (9% vs. 8%; p = .516).
The participants were instructed to fixate centrally and avoidblinking throughout the trials, and we used ICA to eliminate eyemovement artifacts. However, this procedure is imperfect, and itdoes not remove the cortical consequences of eye movements fromthe ERP signal. We therefore compared VEOG and HEOG activa-tion in all conditions, without excluding any trials, in order toestablish the prevalence of eye movements. We focused on EOGactivity during the first 1 s of the presentations, where the ERPs ofinterest were recorded. Horizontal and vertical eye electrode chan-nels were segmented into epochs (−0.2 to 1 s), and amplitude ateach time point was converted to an absolute value before averag-ing across the interval.
Mean HEOG activity did not differ between regularity condi-tions (reflection 16.11 μV, rotation 16.72 μV, random 17.15 μV,translation 16.37 μV; p = .100) or between participants presentedwith constrained or unconstrained random patterns (17.28 vs.15.90 μV; p = .419). Although HEOG activity was significantlygreater in the explicit discrimination task than the oddball detectiontask (18.88 vs. 14.29 μV; p = .01), there were no interactionsbetween regularity and task (p = .214) or regularity, task, andrandom constraints (p = .503). Finally, HEOG activity did notdiffer between normal and oddball trials (14.29 vs. 14.68 μV;p = .382) in the oddball detection task.
Mean VEOG activity differed between regularities (reflec-tion 30.68 μV, rotation 28.07 μV, random 28.61 μV, translation28.71 μV; p = .032), but not between participants in the constrainedand unconstrained conditions (28.34 vs. 29.70 μV; p = .737).VEOG activity was greater in the explicit discrimination task thanthe oddball detection task (34.40 vs. 23.64 μV; p = .011). Therewere no interactions between regularity and task (p = .105) orregularity, task, and random constraints (p = .896). VEOG activitydid not differ between normal and oddball trials in the oddballdetection task (23.64 vs. 24.28 μV; p = .516).
Ideally, the HEOG and VEOG activity would be equal in allconditions. Nevertheless, we note that the distribution of EOGactivity was fundamentally from the pattern of ERPs reportedbelow, providing confidence that these patterns do not themselvesresult from unwanted EOG activity or artifact rejectionprocedures.
Statistical Analysis
Electrophysiological data were analyzed using mixed analysis ofvariance (ANOVA) techniques, where the within-subject factorswere crossed with the between-subjects factors task and randomconstraints. The Greenhouse-Geisser correction factor was appliedwhen the assumption of sphericity was violated. In the Resultssection, we report the epsilon value used to adjust degrees offreedom, the uncorrected F values, and the corrected p values. Wereport the exact p value from effects unless they are less than .001(in which case we state that p < .001). Sometimes we summarizeseveral statistics without reporting each individually. In this case,
we give the smallest or largest effect of those summarized, asappropriate.
For significant results, effect sizes were estimated with partial η2,which gives the proportion of variance attributable to factor. Impor-tant effects were explored further with paired samples t tests, and testeffect sizes were estimated with Cohen’s d, which gives the size ofthe effect in standard deviation units ((Mean1 − Mean2) / pooledSD). Most of the analyzed variables did not deviate significantlyfrom the normal distribution shape according to Shapiro-Wilk test(p > .05, 3 out of 19 variables, none from the ERP analysis), andsecondary nonparametric analysis confirmed all effects where theassumption of normality was violated.
Results
Manipulation Check
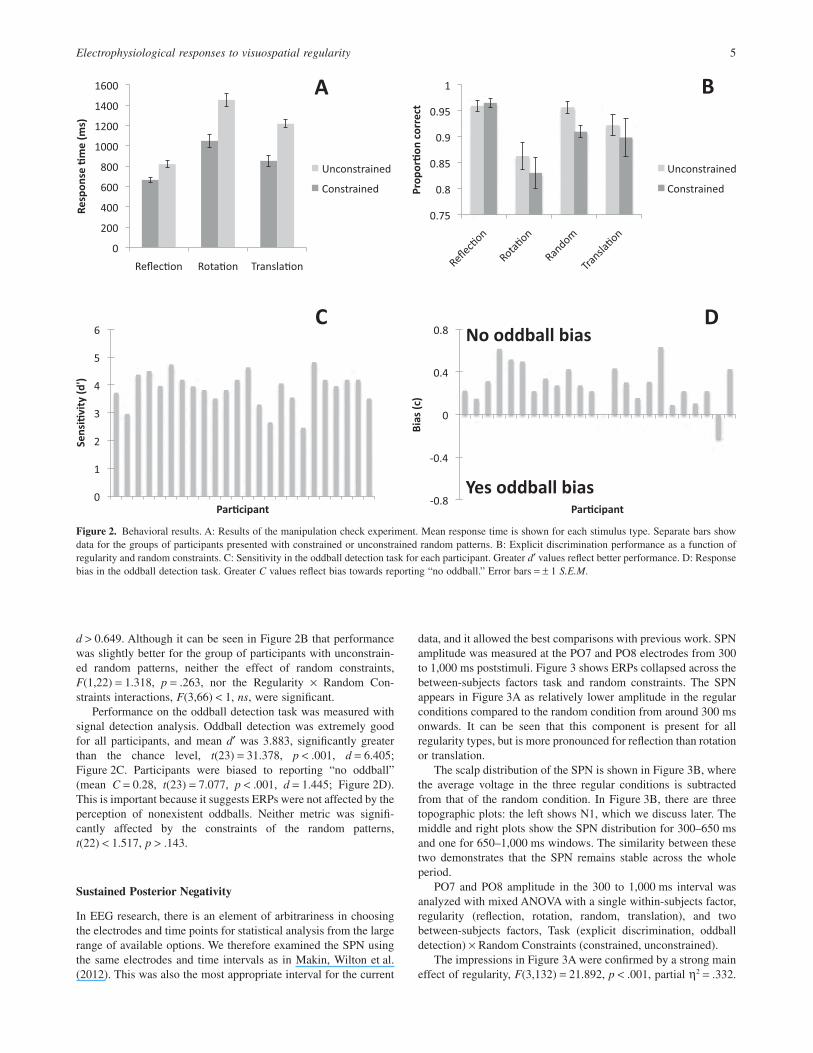
Before participants did the EEG experiment, they were presentedwith a short behavioral experiment, in which they had to discrimi-nate regular from random patterns as quickly as possible. Therewere 60 random patterns, and there were 20 of each regularity type(reflection, rotation, and translation). Trials where participantspressed the wrong button were excluded (8.0%). Results are shownin Figure 2A. Reaction times in each condition were comparedwith mixed ANOVA, with one within-subjects factor, regularity(reflection, rotation, translation), and two between-subjects factors,Subsequent Task (explicit discrimination, oddball detection) ×Random Constraints (constrained, unconstrained). There was amain effect of regularity, F(2,88) = 109.552, p < .001, partialη2 = .713, ε = .764, because participants were quickest to detectreflection, then translation, then rotation, with the differencesbetween all three being highly significant, t(47) > 5.831, p < .001,d > 0.63. There was also a between-subjects effect of random con-straints, because people were quicker to respond when they werepresented with unconstrained random patterns, F(1,44) = 26.895,p < .001, partial η2 = .379. Finally, there was a significant Regular-ity × Random Constraints interaction, F(2,88) = 7.588, p = .003,partial η2 = .147, ε = .764, partly because the reaction time (RT)difference between participants in the constrained and uncon-strained groups was smaller for reflection than rotation or transla-tion (although this difference was significant in all cases,t(46) > 3.470, p < .002, d > 1.0). The groups of participantsinvolved in explicit discrimination and oddball detection per-formed in a similar way during the manipulation check experiment.There was no main effect of subsequent task, and no interactionsinvolving this factor, F(2,88) < 1, ns.
EEG Experiment
Participants were presented with patterns of three different regu-larity types (reflection, rotation, and translation), along withrandom patterns (Figure 1). Half the participants explicitly classi-fied the patterns according to regularity, and for these participantsthe proportion of correct answers were analyzed with a mixedANOVA with one within-participants factor, regularity (reflection,rotation, random, translation) and one between-participants factor,random constraints (constrained, unconstrained). There was a maineffect of regularity, F(3,66) = 15.068, p < .001, partial η2 = .407,with best performance in the reflection condition, then random,translation, and worst performance for rotation (Figure 2B). Withthe exception of random and translation, the difference betweenall regularity conditions was significant, t(23) > 2.247, p < .024,
4 A.D.J. Makin et al.
d > 0.649. Although it can be seen in Figure 2B that performancewas slightly better for the group of participants with unconstrain-ed random patterns, neither the effect of random constraints,F(1,22) = 1.318, p = .263, nor the Regularity × Random Con-straints interactions, F(3,66) < 1, ns, were significant.
Performance on the oddball detection task was measured withsignal detection analysis. Oddball detection was extremely goodfor all participants, and mean d′ was 3.883, significantly greaterthan the chance level, t(23) = 31.378, p < .001, d = 6.405;Figure 2C. Participants were biased to reporting “no oddball”(mean C = 0.28, t(23) = 7.077, p < .001, d = 1.445; Figure 2D).This is important because it suggests ERPs were not affected by theperception of nonexistent oddballs. Neither metric was signifi-cantly affected by the constraints of the random patterns,t(22) < 1.517, p > .143.
Sustained Posterior Negativity
In EEG research, there is an element of arbitrariness in choosingthe electrodes and time points for statistical analysis from the largerange of available options. We therefore examined the SPN usingthe same electrodes and time intervals as in Makin, Wilton et al.(2012). This was also the most appropriate interval for the current
data, and it allowed the best comparisons with previous work. SPNamplitude was measured at the PO7 and PO8 electrodes from 300to 1,000 ms poststimuli. Figure 3 shows ERPs collapsed across thebetween-subjects factors task and random constraints. The SPNappears in Figure 3A as relatively lower amplitude in the regularconditions compared to the random condition from around 300 msonwards. It can be seen that this component is present for allregularity types, but is more pronounced for reflection than rotationor translation.
The scalp distribution of the SPN is shown in Figure 3B, wherethe average voltage in the three regular conditions is subtractedfrom that of the random condition. In Figure 3B, there are threetopographic plots: the left shows N1, which we discuss later. Themiddle and right plots show the SPN distribution for 300–650 msand one for 650–1,000 ms windows. The similarity between thesetwo demonstrates that the SPN remains stable across the wholeperiod.
PO7 and PO8 amplitude in the 300 to 1,000 ms interval wasanalyzed with mixed ANOVA with a single within-subjects factor,regularity (reflection, rotation, random, translation), and twobetween-subjects factors, Task (explicit discrimination, oddballdetection) × Random Constraints (constrained, unconstrained).
The impressions in Figure 3A were confirmed by a strong maineffect of regularity, F(3,132) = 21.892, p < .001, partial η2 = .332.
Figure 2. Behavioral results. A: Results of the manipulation check experiment. Mean response time is shown for each stimulus type. Separate bars showdata for the groups of participants presented with constrained or unconstrained random patterns. B: Explicit discrimination performance as a function ofregularity and random constraints. C: Sensitivity in the oddball detection task for each participant. Greater d′ values reflect better performance. D: Responsebias in the oddball detection task. Greater C values reflect bias towards reporting “no oddball.” Error bars = ± 1 S.E.M.
Electrophysiological responses to visuospatial regularity 5
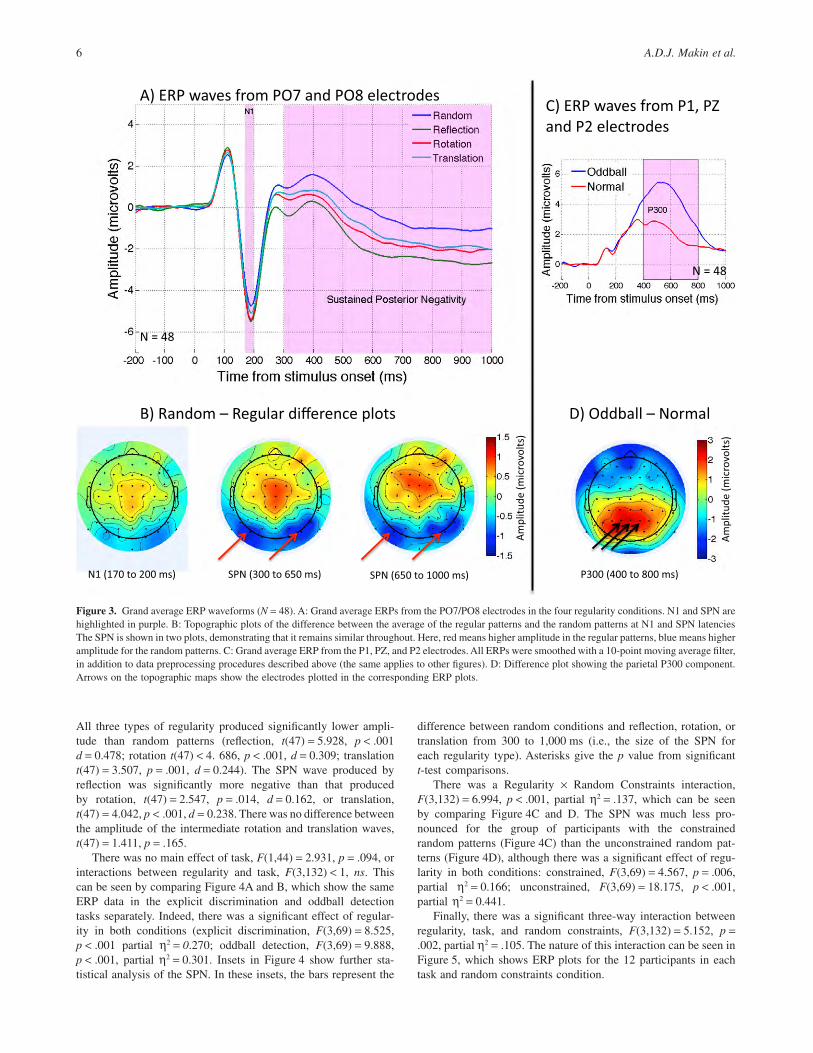
All three types of regularity produced significantly lower ampli-tude than random patterns (reflection, t(47) = 5.928, p < .001d = 0.478; rotation t(47) < 4. 686, p < .001, d = 0.309; translationt(47) = 3.507, p = .001, d = 0.244). The SPN wave produced byreflection was significantly more negative than that producedby rotation, t(47) = 2.547, p = .014, d = 0.162, or translation,t(47) = 4.042, p < .001, d = 0.238. There was no difference betweenthe amplitude of the intermediate rotation and translation waves,t(47) = 1.411, p = .165.
There was no main effect of task, F(1,44) = 2.931, p = .094, orinteractions between regularity and task, F(3,132) < 1, ns. Thiscan be seen by comparing Figure 4A and B, which show the sameERP data in the explicit discrimination and oddball detectiontasks separately. Indeed, there was a significant effect of regular-ity in both conditions (explicit discrimination, F(3,69) = 8.525,p < .001 partial η2 = 0.270; oddball detection, F(3,69) = 9.888,p < .001, partial η2 = 0.301. Insets in Figure 4 show further sta-tistical analysis of the SPN. In these insets, the bars represent the
difference between random conditions and reflection, rotation, ortranslation from 300 to 1,000 ms (i.e., the size of the SPN foreach regularity type). Asterisks give the p value from significantt-test comparisons.
There was a Regularity × Random Constraints interaction,F(3,132) = 6.994, p < .001, partial η2 = .137, which can be seenby comparing Figure 4C and D. The SPN was much less pro-nounced for the group of participants with the constrainedrandom patterns (Figure 4C) than the unconstrained random pat-terns (Figure 4D), although there was a significant effect of regu-larity in both conditions: constrained, F(3,69) = 4.567, p = .006,partial η2 = 0.166; unconstrained, F(3,69) = 18.175, p < .001,partial η2 = 0.441.
Finally, there was a significant three-way interaction betweenregularity, task, and random constraints, F(3,132) = 5.152, p =.002, partial η2 = .105. The nature of this interaction can be seen inFigure 5, which shows ERP plots for the 12 participants in eachtask and random constraints condition.
Figure 3. Grand average ERP waveforms (N = 48). A: Grand average ERPs from the PO7/PO8 electrodes in the four regularity conditions. N1 and SPN arehighlighted in purple. B: Topographic plots of the difference between the average of the regular patterns and the random patterns at N1 and SPN latenciesThe SPN is shown in two plots, demonstrating that it remains similar throughout. Here, red means higher amplitude in the regular patterns, blue means higheramplitude for the random patterns. C: Grand average ERP from the P1, PZ, and P2 electrodes. All ERPs were smoothed with a 10-point moving average filter,in addition to data preprocessing procedures described above (the same applies to other figures). D: Difference plot showing the parietal P300 component.Arrows on the topographic maps show the electrodes plotted in the corresponding ERP plots.
6 A.D.J. Makin et al.
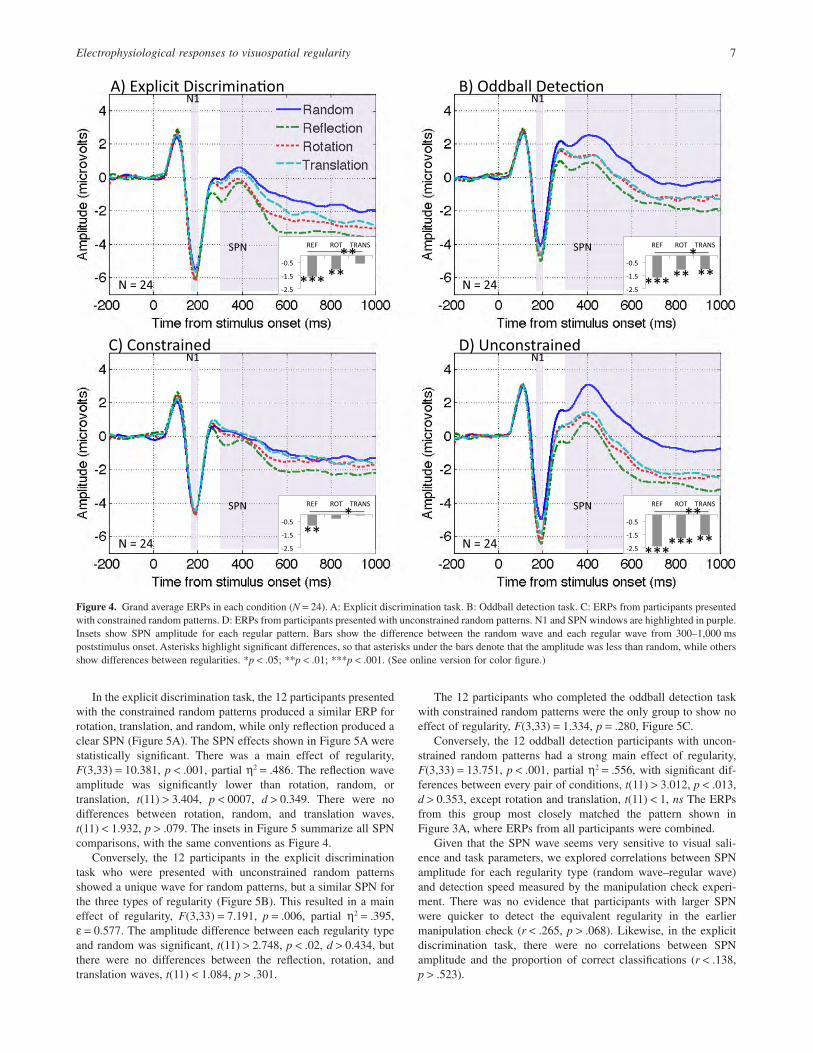
In the explicit discrimination task, the 12 participants presentedwith the constrained random patterns produced a similar ERP forrotation, translation, and random, while only reflection produced aclear SPN (Figure 5A). The SPN effects shown in Figure 5A werestatistically significant. There was a main effect of regularity,F(3,33) = 10.381, p < .001, partial η2 = .486. The reflection waveamplitude was significantly lower than rotation, random, ortranslation, t(11) > 3.404, p < 0007, d > 0.349. There were nodifferences between rotation, random, and translation waves,t(11) < 1.932, p > .079. The insets in Figure 5 summarize all SPNcomparisons, with the same conventions as Figure 4.
Conversely, the 12 participants in the explicit discriminationtask who were presented with unconstrained random patternsshowed a unique wave for random patterns, but a similar SPN forthe three types of regularity (Figure 5B). This resulted in a maineffect of regularity, F(3,33) = 7.191, p = .006, partial η2 = .395,ε = 0.577. The amplitude difference between each regularity typeand random was significant, t(11) > 2.748, p < .02, d > 0.434, butthere were no differences between the reflection, rotation, andtranslation waves, t(11) < 1.084, p > .301.
The 12 participants who completed the oddball detection taskwith constrained random patterns were the only group to show noeffect of regularity, F(3,33) = 1.334, p = .280, Figure 5C.
Conversely, the 12 oddball detection participants with uncon-strained random patterns had a strong main effect of regularity,F(3,33) = 13.751, p < .001, partial η2 = .556, with significant dif-ferences between every pair of conditions, t(11) > 3.012, p < .013,d > 0.353, except rotation and translation, t(11) < 1, ns The ERPsfrom this group most closely matched the pattern shown inFigure 3A, where ERPs from all participants were combined.
Given that the SPN wave seems very sensitive to visual sali-ence and task parameters, we explored correlations between SPNamplitude for each regularity type (random wave–regular wave)and detection speed measured by the manipulation check experi-ment. There was no evidence that participants with larger SPNwere quicker to detect the equivalent regularity in the earliermanipulation check (r < .265, p > .068). Likewise, in the explicitdiscrimination task, there were no correlations between SPNamplitude and the proportion of correct classifications (r < .138,p > .523).
Figure 4. Grand average ERPs in each condition (N = 24). A: Explicit discrimination task. B: Oddball detection task. C: ERPs from participants presentedwith constrained random patterns. D: ERPs from participants presented with unconstrained random patterns. N1 and SPN windows are highlighted in purple.Insets show SPN amplitude for each regular pattern. Bars show the difference between the random wave and each regular wave from 300–1,000 mspoststimulus onset. Asterisks highlight significant differences, so that asterisks under the bars denote that the amplitude was less than random, while othersshow differences between regularities. *p < .05; **p < .01; ***p < .001. (See online version for color figure.)
Electrophysiological responses to visuospatial regularity 7

N1
Figure 3A suggests that the regularity-related amplitude differ-ences are present as early as the N1 wave, with N1 less pronouncedfor random patterns (see left topographic plot in Figure 3B). N1amplitude was calculated as mean amplitude between 170 and200 ms in the PO8/PO8 electrodes. These data were analyzed usingthe same factors as the SPN.
There was a main effect of regularity, F(3,132) = 6.033, p = .002,partial η2 = .121, ε = .841. Paired-sample t tests revealed significantdifferences between reflection and random, t(47) = 2.925, p = .005,d = 0.186; rotation and random, t(47) = 3.195, p = .002, d = 0.173;reflection and translation, t(47) = 2.752, p = .008, d = 0.117; androtation and translation, t(47) = 2.146, p = .037, d = 0.102; but notbetween reflection and rotation, t(47) < 1, ns, or translation andrandom, t(47) = 1.236, p = .223.
There was also a Regularity × Constraints interaction,F(1,132) = 3.091, p = .038, partial η2 = .066, ε = .841, which canbe seen by comparing N1 in Figures 4C and 4D. In the constrainedcondition, there was no effect of regularity on N1 amplitude,F(3.69) = 1.106, p = .353 (Figure 4C). Conversely, there was a
strong effect of regularity on N1 amplitude in the unconstrainedcondition, F(3,69) = 5.927, p = .001, partial η2 = .205 (Figure 4D).There were no other main effects or interactions, F(1,44) < 2.892,p > .097.
P300
It is well known that rare oddballs produce a positive wave inparietal electrodes compared to higher frequency nonoddball trialsfrom 300 ms onwards (the parietal P300, e.g., Luck, 2005). We thuscompared ERP waveforms on the oddball trials (with squares) tothe normal trials (without squares) in our oddball detection task. Ascan be seen in Figures 3C and D, the oddball trials produced theexpected P300 response, that is, greater amplitude in the oddballtrials from 300–800 ms poststimuli at the P1, PZ, and P2. ERP dataat this interval were analyzed with mixed ANOVA with a singlewithin-subjects factor, trial type (oddball, normal) and a singlebetween-subjects factor, random constraints (constrained, uncon-strained). The difference between normal and oddball trials wassignificant, F(1,22) = 44.630, p < .001, partial η2 = .670. There wasno difference between constrained and unconstrained conditions,
Figure 5. Grand average ERPs in each subcondition (N = 12). A: Explicit discrimination task with constrained random patterns. B: Explicit discriminationtask with unconstrained random patterns. C: Oddball detection task with constrained random patterns. D: Oddball detection task with unconstrained randompatterns. Insets are based on the same conventions as Figure 4. (See online version for color figure.)
8 A.D.J. Makin et al.
F(1,22) = 2.360, p = .139, and no interaction, F(1,22) < 1, ns.There was no correlation between the size of the P300 response andsensitivity (d′) in the oddball detection task (r = −.325, p = .121).
Discussion
This experiment was designed to measure electrophysiologicalresponses to different kinds of spatial regularity. Previous studieshave demonstrated that reflectional symmetry is more salient andmore rapidly detected than rotational symmetry or translation, eventhough all these patterns are equally regular in terms of isometrictransformations (Mach, 1886/1959; Makin, Wilton et al., 2012;Makin, Pecchinenda et al., 2012; Royer, 1981). Before EEG rec-ording began, we presented our participants with a discriminationtask, in which they had to classify patterns as regular or random.In a replication of previous work, they were quickest to detectreflection, then translation, then 180° rotation. We explored theelectrophysiological correlates of the saliency difference betweenregularities.
Sustained Posterior Negativity (SPN)
Previous ERP research has found an SPN, which differs betweensymmetrical and asymmetrical patterns (Höfel & Jacobsen,2007a, 2007b; Jacobsen & Höfel, 2003; Makin, Wilton et al.,2012); however, no previous work has explored the neuralcorrelates of the salience differences between the differentregularities.
We considered three possibilities. First, The SPN could beuniquely associated with reflectional symmetry. In this case, thewaveforms for random, rotation, and translation patterns should besimilar to each other, and all different from reflection. Secondly, theneural generators of the SPN could be equally sensitive to allregularity types, and therefore the waveforms for reflection, rota-tion, and translation should be the same, but different from random.Third, the SPN could follow the ordinal sequence of visual sali-ence, that is, largest for reflection, translation, then rotation (assuggested by our RT data). This result would suggest that the neuralgenerators that produce the SPN are also responsible for the RTdifferences.
Considering the combined results of all experiments shown inFigure 3A, it seems that our results are not compatible with the firsthypothesis (that neural populations uniquely sensitive to reflec-tional symmetry generate the SPN). We found that reflection, rota-tion, and translation patterns all produced a posterior ERPcomponent that was significantly lower amplitude than the randomwaveform. Instead, our combined data were consistent with thethird hypothesis: we found that the SPN was larger for reflectionthan rotation or translation. This result suggests that the visualsystem does not have unique reflection detectors, but rather thatreflectional symmetry is the preferred stimulus for more generalregularity sensitive networks.
The SPN was similar in the explicit discrimination task, whereparticipants were overtly classifying the patterns as reflection, rota-tion, random, or translation on every trial, and in the oddballdetection task, where the participants were not actively classifyingthe patterns in terms of their regularity (instead they were lookingfor rare oddball trials, defined by the presence of a square, i.e., anorthogonal visual dimension). This result alone suggests that rela-tively automatic, bottom-up visual processes generated SPN(although there are other reasons to doubt this conclusion, dis-cussed below). However, before considering these caveats, we first
acknowledge that pretraining on the manipulation check experi-ment may have enhanced our regularity-related ERPs. We leavethis topic for future work, although we note that Höfel andJacobsen (2007a) recorded an SPN in an oddball detection task, sowe do not think the SPN in our oddball detection task was purelyan aftereffect of training in the manipulation check experiment.
In the explicit discrimination task, participants could accuratelydiscriminate all the patterns from each other. Given this, one mightexpect an ERP that also distinguishes between these patterns, butwe found no difference between rotation and translation waves. Wethink these differences become apparent later in the epoch;however, the data become noisier the further from the baselineperiod, so we did not explore this in detail. There are other inter-esting questions about the SPN latency. In our experiments, theSPN began at around 300 ms, if not earlier, while Höfel andJacobsen (2007a) defined the SPN as lower amplitude from 600 to1,100 ms (although the component does appear to begin earlierthan 600 ms judging by their Figure 2). We note that in Höfel andJacobsen’s experiment, a high contrast black and white backgroundappeared simultaneously with the regular and random elements,and this may have masked differences at earlier latencies.
Random Constraints
The SPN was altered by the characteristics of the random patternsin different ways depending on whether people were engaged inexplicit discrimination or oddball detection (Figure 5). These inter-actions were not anticipated but are instructive nevertheless. In theoddball detection task, the SPN was more pronounced when therandom patterns were unconstrained. This is perhaps not surpris-ing, because the difference between unconstrained random patternsand the regular patterns is more visually salient.1
In the explicit discrimination task, when the random patternswere constrained (and less obviously different from the regularones), the SPN was unique to reflectional symmetry, and the wave-forms for rotation, random, and translation were similar(Figure 5A). Conversely, when the random patterns were uncon-strained, SPN was similar for all kinds of regularity (Figure 5B).This interaction suggests that the SPN is sensitive not only tostimulus characteristics, but also to the different classification strat-egies employed under different conditions. It cannot, therefore, beconcluded that the SPN is generated by purely bottom-up, auto-matic visual regularity detection.
Any explanation for the interactions involving random con-straints in the explicit discrimination task are admittedly specula-tive. However, we venture the following: Neurocognitive processesthat respond to deviation from expected regularity contribute to theSPN. We note that reflection patterns appeared uniquely regularcompared to random, rotation, and translation when the randompatterns were constrained. Conversely, when random patterns wereunconstrained, they appeared uniquely irregular compared to theother three. The SPN was clearly influenced by these contingen-cies, so they must result from expectations developed over the
1. However, ERP power was reduced throughout the epoch for thisgroup (i.e., the visual evoked potential was smaller), so we interpret thisdifference with some caution. Normalizing according to the overall ampli-tude variations of ERPs eliminates this difference. In an earlier analysis ofthe oddball detection task data, amplitude at each time point (t) was recal-culated as a proportion of the difference between maximum and minimumamplitude for that condition: [Amplitude(t) = Amplitude(t) / (max − min)],and there was no significant difference between constrained and uncon-strained random conditions.
Electrophysiological responses to visuospatial regularity 9

course of the experiment. Moreover, this account is consistent withthe known architecture of visual systems, where prediction errorsignals are involved at a very early stage in the ascending visualhierarchy (Summerfield & Koechlin, 2008; Van de Cruys &Wagemans, 2011). This is a topic for future work.
Visual Evoked Potentials
P1 was not reliably affected by regularity in our experiment, sug-gesting that the SPN was probably produced by extrastriate visualactivity and not by neurons in the primary visual cortex.2 This is inline with the fMRI studies of Tyler et al. (2005), Sasaki et al.(2005), and Chen et al. (2007), where V1 was equally activated byreflection and random images, and by the TMS study of Cattaneoet al. (2011), who found no effect of V1 disruption on symmetryprocessing. Despite this converging evidence against V1 involve-ment, it is worth remembering that van der Zwan, Leo, Joung,Latimer, and Wenderoth (1998) found that axis of symmetry infor-mation could be coded by orientation-sensitive cells in V1.
Makin, Wilton et al. (2012) also found no difference in P1amplitude produced by reflectional or random patterns in anexplicit discrimination task—a finding consistent with the currentresults. However, in Experiment 3 of that paper rotational symme-try produced a larger P1 than random patterns. The current workfound no special P1 for rotation, so the reliability of the previousresult must be questioned.
Unlike some previous ERP symmetry experiments, (Jacobsen &Höfel, 2003; Norcia, Candy, Pettet, Vildavski, & Tyler, 2002; Oka,Victor, Conte, & Yanagida, 2007), we found that regularity alteredN1 amplitude, with greater N1 for reflection and rotation patternsthan random or translation patterns. N1 effects were unique to thegroup of participants where random patterns were unconstrained.However, Makin, Wilton et al. (2012) reported an effect of N1when reflection and random patterns were well controlled for low-level visual variables, and other kinds of perceptual grouping alsoalter N1 (Shpaner, Murray, & Foxe, 2009), so it can be concludedregularity detection often begins at this latency.
Summary
This study investigated the neural substrates of visual regularityperception. We found that a previously reported ERP component,the SPN, was not uniquely generated by reflectional symmetry, butis produced by rotational symmetry and translation as well. More-over, the amplitude of the SPN indexed the relative perceptualsalience of these regularities. In light of this result, we suggest thatthe same or overlapping extrastriate mechanisms are sensitive to allvisual regularities, rather than being specific to reflection. Althoughreflectional symmetry seems to be the preferred stimulus for thisnetwork under most conditions, expectation about the range ofregularities presented and task demands also affected the SPN. Weconclude that SPN is sensitive to top-down influences as well asbottom-up stimulus characteristics.
This work goes some way to characterizing electrophysio-logical responses to different forms of visual regularity. Given thatthe SPN component seems robust and sensitive to experimentalmanipulations, we finish by considering how it could be used infuture studies of visual symmetry perception. For example, it ispossible that the SPN is produced by interhemispheric connectionsbetween receptive fields on either side of the midline. Accordingto this hypothesis, the SPN would be absent if the symmetricalpatterns were presented to one hemisphere only. However,psychophysical studies have shown that peripheral and foveal sym-metry detection are comparable once the images are size-scaled foracuity differences, so interhemispheric connections may not be soimportant (e.g., Barrett, Whitaker, McGraw, & Herbert, 1999).Second, it is worth considering that our symmetrical patterns pro-duced symmetrical 2D retinal images, but symmetry can still berecognized in 3D objects when they are tilted so that the 2D retinalimage is no longer symmetrical (Koning & Wagemans, 2009;Wagemans, 1993). It is not known whether this kind of tilted 3Dsymmetry recruits the same symmetry detectors in the visualsystem. If it does, then tilted 3D objects would produce an SPN,perhaps with a later onset due to time required for mental objectrotation. Thirdly, we note that the SPN is spread over both hemi-spheres, and is thus different from the sustained posteriorcontralateral negativity (SPCN), which is a lateralized negativepotential generated by the focus of spatial attention to the leftor right hemifield (e.g., Lefebvre, Dell’acqua, Roelfsema, &Jolicoeur, 2011). However, it is possible that the SPN is producedby rapidly shifting attention from left to right as part of a point-to-point matching strategy, so these potentials may have a commonorigin.
References
Barrett, B. T., Whitaker, D., McGraw, P. V., & Herbert, A. M. (1999).Discriminating mirror symmetry in foveal and extra-foveal vision.Vision Research, 39, 3737–3744. doi: 10.1016/s0042-6989(99)00083-8
Bertamini, M. (2010). Sensitivity to reflection and translation is modulatedby objectness. Perception, 39, 27–40. doi: 10.1068/p6393
Bertamini, M., Friedenberg, J., & Argyle, L. (2002). No within-objectadvantage for detection of rotation. Acta Psychologica, 111, 59–81. doi:10.1016/s0001-6918(02)00043-4
Bertamini, M., Friedenberg, J. D., & Kubovy, M. (1997). Detection ofsymmetry and perceptual organization: The way a lock-and-key processworks. Acta Psychologica, 95, 119–140. doi: 10.1016/s0001-6918(96)00038-8
Cattaneo, Z., Mattavelli, G., Papagno, C., Herbert, A., & Silvanto, J. (2011).The role of the human extrastriate visual cortex in mirror symmetrydiscrimination: A TMS-adaptation study. Brain and Cognition, 77, 120–127. doi: 10.1016/j.bandc.2011.04.007
Chen, C. C., Kao, K. L. C., & Tyler, C. W. (2007). Face configurationprocessing in the human brain: The role of symmetry. Cerebral Cortex,17, 1423–1432. doi: 10.1093/cercor/bhl054
Friedenberg, J., & Bertamini, M. (2000). Contour symmetry detection: Theinfluence of axis orientation and number of objects. Acta Psychologica,105, 107–118. doi: 10.1016/S0001-6918(00)00051-2
Höfel, L., & Jacobsen, T. (2007a). Electrophysiological indices of process-ing aesthetics: Spontaneous or intentional processes? InternationalJournal of Psychophysiology, 65, 20–31. doi: 10.1016/j.ijpsycho.2007.02.007
Höfel, L., & Jacobsen, T. (2007b). Electrophysiological indices of process-ing symmetry and aesthetics: A result of judgment categorization orjudgment report? Journal of Psychophysiology, 21, 9–21. doi: 10.1027/0269-8803.21.1.9
Jacobsen, T., & Höfel, L. (2003). Descriptive and evaluative judgmentprocesses: Behavioral and electrophysiological indices of processing
2. There were some P1 differences centered on the PO3, POZ, and PO4electrodes; however, it was unclear whether this reflected differences in theamplitude of the P1 peak or differences during the baseline period, so we donot overinterpret this.
10 A.D.J. Makin et al.

symmetry and aesthetics. Cognitive Affective & Behavioral Neurosci-ence, 3, 289–299. doi: 10.1027/0269-8803.21.1.9
Jung, T. P., Makeig, S., Humphries, C., Lee, T. W., McKeown, M. J., Iragui,V., & Sejnowski, T. J. (2000). Removing electroencephalographic arti-facts by blind source separation. Psychophysiology, 37, 163–178. doi:10.1017/S0048577200980259
Koning, A., & Wagemans, J. (2009). Detection of symmetry and repetitionin one and two objects structures versus strategies. Experimental Psy-chology, 56, 5–17. doi: 10.1027/1618-3169.56.1.5
Lefebvre, C., Dell’acqua, R., Roelfsema, P. R., & Jolicoeur, P. (2011).Surfing the attentional waves during visual curve tracing: Evidencefrom the sustained posterior contralateral negativity. Psychophysiology,48, 1509–1515. doi: 10.1111/j.1469-8986.2011.01228.x
Luck, S. (2005). An introduction to the event-related potential technique.Cambridge, MA: MIT Press.
Mach, E. (1886/1959). The analysis of sensations and the relation of thephysical to the psychical. New York, NY: Dover.
Machilsen, B., Pauwels, M., & Wagemans, J. (2009). The role of verticalmirror symmetry in visual shape detection. Journal of Vision, 9, 1–11.doi: 10.1167/9.12.11
Makin, A. D. J., Pecchinenda, A., & Bertamini, M. (2012). Implicit affec-tive evaluation of visual symmetry. Emotion, 12, 1021–1030.
Makin, A. D. J., Poliakoff, E., Ackerley, R., & El-Deredy, W. (2012).Covert tracking: A combined ERP and fixational eye movement study.PloS ONE, 7, e38479. doi: 10.1371/journal.pone.0038479
Makin, A. D. J., Wilton, M. M., Pecchinenda, A., & Bertamini, M.(2012). Symmetry perception and affective responses: A combinedEEG/EMG study. Neuropsychologia,50, 3250–3261. doi: 10.1016/j.neuropsychologia.2012.10.003
Møller, A. P. (1992). Female swallow preference for symmetrical malesexual ornaments. Nature, 357, 238–240.
Norcia, A. M., Candy, T. R., Pettet, M. W., Vildavski, V. Y., & Tyler, C. W.(2002). Temporal dynamics of the human response to symmetry.Journal of Vision, 2, 132–139. doi: 10.1167/2.2.1
Oka, S., Victor, J. D., Conte, M. M., & Yanagida, T. (2007). VEPs elicitedby local correlations and global symmetry: Characteristics and inter-actions. Vision Research, 47, 2212–2222. doi: 10.1016/j.visres.2007.03.020
Palmer, S. E. (1991). On goodness, Gestalt, groups, and Garner: Localsymmetry subgroups as a theory of figural goodness. In G. Lockhead &J. Pomerantz (Eds.), The structure of perception. Washington, DC: APA.
Palmer, S. E., & Hemenway, K. (1978). Orientation and symmetry: Theeffects of multiple, rotational and near symmetries. Journal of Experi-mental Psychology: Human Perception and Performance, 4, 691–702.doi: 10.1037//0096-1523.4.4.691
Peirce, J. W. (2007). PsychoPy—Psychophysics software in Python.Journal of Neuroscience Methods, 162, 8–13. doi: 10.1016/j.jneumeth.2006.11.017
Roye, A., Höfel, L., & Jacobsen, T. (2008). Aesthetics of faces: Behavioraland electrophysiological indices of evaluative and descriptive judgmentprocesses. Journal of Psychophysiology, 22, 41–57. doi: 10.1027/0269-8803.22.1.41
Royer, F. L. (1981). Detection of symmetry. Journal of Experimental Psy-chology: Human Perception and Performance, 7, 1186–1210. doi:10.1037/0096-1523.7.6.1186
Sasaki, Y., Vanduffel, W., Knutsen, T., Tyler, C., & Tootell, R. (2005).Symmetry activates extrastriate visual cortex in human and nonhumanprimates. Proceedings of the National Academy of Sciences ofthe United States of America, 102, 3159–3163. doi: 10.1073/pnas.0500319102
Shpaner, M., Murray, M. M., & Foxe, J. J. (2009). Early processing in thehuman lateral occipital complex is highly responsive to illusory con-tours but not to salient regions. European Journal of Neuroscience, 30,2018–2028. doi: 10.1111/j.1460-9568.2009.06981.x
Summerfield, C., & Koechlin, E. (2008). A neural representation of priorinformation during perceptual inference. Neuron, 59, 336–347. doi:10.1016/j.neuron.2008.05.021
Treder, M. S. (2010). Behind the looking glass: A review on human sym-metry perception. Symmetry, 2, 510–543. doi: 10.3390/sym2031510
Tyler, C. W. (1995). Empirical aspects of symmetry perception. SpatialVision, 9, 1–7. doi: 10.1163/156856895X00089
Tyler, C. W., Baseler, H. A., Kontsevich, L. L., Likova, L. T., Wade, A. R.,& Wandell, B. A. (2005). Predominantly extra-retinotopic corticalresponse to pattern symmetry. Neuroimage, 24, 306–314. doi: 10.1016/j.neuroimage.2004.09.018
Van de Cruys, S., & Wagemans, J. (2011). Putting reward in art: A tentativeprediction error account of visual art. i-Perception, 2, 1035–1062. doi:10.1068/i0466aap
van der Zwan, R., Leo, E., Joung, W., Latimer, C., & Wenderoth, P. (1998).Evidence that both area V1 and extrastriate visual cortex contribute tosymmetry perception. Current Biology, 8, 889–892. doi: 10.1016/S0960-9822(07)00353-3
Wagemans, J. (1993). Skewed symmetry: A nonaccidental property used toperceive visual forms. Journal of Experimental Psychology: HumanPerception & Performance, 19, 364–380. doi: 10.1016/0042-6989(93)90241-n
Wagemans, J. (1995). Detection of visual symmetries. Spatial Vision, 9,9–32. doi: 10.1163/156856895X00098
Wenderoth, P. (1994). The salience of vertical symmetry. Perception, 23,221–236. doi: 10.1068/p230221
(Received August 11, 2012; Accepted May 17, 2013)
Electrophysiological responses to visuospatial regularity 11
Related Documents