Electricity Life-Cycle Analysis: Issues, Results, and Case Simulations: Amgad Elgowainy Systems Assessment Group Center for Transportation Research Argonne National Laboratory GREET Training Workshop University of Chicago May 18, 2012

Welcome message from author
This document is posted to help you gain knowledge. Please leave a comment to let me know what you think about it! Share it to your friends and learn new things together.
Transcript

Electricity Life-Cycle Analysis: Issues, Results, and Case Simulations:
Amgad Elgowainy Systems Assessment Group Center for Transportation Research Argonne National Laboratory GREET Training Workshop University of Chicago May 18, 2012

Outline
Electricity generation (fuel cycle)
Plug-in hybrid electric vehicles (WTW analysis)
Electricity generation (infrastructure)
2

Supporting Document: Journal Article and Technical Reports
A. Elgowainy, J. Han, L. Poch, M. Wang, A. Vyas, M. Mahalik, A. Rousseau, 2010, “Well-to-Wheels Analysis of Energy Use and Greenhouse Gas Emissions of Plug-In Hybrid Electric Vehicles,” http://greet.es.anl.gov/publication-xkdaqgyk J. Sullivan, C. Clark, J. Han, M. Wang, 2010, “Life-Cycle Analysis Results of Geothermal Systems in Comparison to Other Power Systems,” http://greet.es.anl.gov/publication-geothermal_and_other_power

GREET Fuel Cycle and Power Plant Construction
4
Material
Steel, Iron, Al, Co, Si, Glass, Plastic, Concrete, …
Production Mining
Fuel
Cyc
le
Power Plant Infrastructure
Emissions
Energy

Electricity Generation Fuel Cycle Key Stages:
5
Fuels Electricity
T&D
Upstream (recovery, processing, T&D)
Power Plant (fuel conversion, infrastructure)

Electricity Generation Technology Mix:
6
By fuel type and generation technology NG: steam, simple combustion, CC Coal: steam, IGCC Nuclear: LWR Oil: steam cycle Biomass: steam, IGCC Renewable: geothermal, wind, solar, hydro
By region U.S. average California Northeastern User defined (specific)
By application Stationary applications (process use) Transportation (marginal) applications (e.g., EVs)
9.2) Electricity Generation Mix 9.2.a) Selection of Electricity Generation Mix for Transportation Use
Mix for transportation use 1 1 -- U.S. Mix 4 -- User Defined Mix 7 -- Nuclear Power Plants (transportation only) Mix for stationary use 1 2 -- NE U.S. Mix 5 -- NG Power Plants (transportation only) 8 -- Hydro Power Plants (transportation only)
3 -- CA Mix 6 -- Coal Power Plants (transportation only) 9 -- NGCC Turbine (transportation only)
Electricity
Electric sheet in GREET

Electricity Generation Technology Mix:
7
GREET uses EIA projections for future generation mixes in different regions (AEO 2011)
U.S. Mix: Stationary Use
1.0% 22.9% 46.4% 20.3% 0.2% 9.2%
5-year period Residual Oil Natural Gas Coal Nuclear Biomass Others 1990 4.2% 12.3% 52.5% 19.0% 1.1% 10.9% 1995 2.2% 14.8% 51.0% 20.1% 1.2% 10.7% 2000 2.9% 15.8% 51.7% 19.8% 1.1% 8.7% 2005 2.9% 15.7% 51.7% 20.3% 1.2% 8.2% 2010 1.0% 22.9% 46.4% 20.3% 0.2% 9.2% 2015 0.9% 21.5% 44.2% 21.0% 0.5% 11.8% 2020 0.9% 20.2% 45.1% 21.1% 0.9% 11.7%
CA Mix: Stationary Use
0.0% 41.0% 8.1% 23.1% 0.9% 26.8%
5-year period Residual Oil Natural Gas Coal Nuclear Biomass Others 1990 2.3% 40.0% 11.2% 19.2% 1.6% 25.7% 1995 0.2% 37.5% 8.6% 17.3% 1.6% 34.8% 2000 0.2% 42.1% 14.5% 17.1% 1.6% 24.5% 2005 0.8% 35.2% 15.9% 21.5% 1.6% 25.0% 2010 0.0% 41.0% 8.1% 23.1% 0.9% 26.8% 2015 0.0% 37.4% 7.5% 22.5% 0.5% 32.2% 2020 0.0% 36.2% 7.6% 21.4% 1.4% 33.3%

8
WTW Analysis of PHEVs

PHEVs WTW Pathway
Upstream
Oil1%
Gas20%
Coal47%
Nuclear21%
Renewable11%
9
PHEV Emissions
Crude Recovery
Crude Transportation
Fuel Transportation
Crude Refining
Gasoline
Electricity Generation Mix
Electricity Transmission
and Distribution
Electricity

10
0
0.2
0.4
0.6
0.8
1
1.2
0 0.2 0.4 0.6 0.8 1 1.2
GH
G E
mis
sion
s (r
elat
ive
to G
V)
Petroleum Use (relative to GV)
Regular HEV
Baseline Gasoline ICE Vehicle (GV)
Combined CD and CS OperationsCD operation only
PHEV10
PHEV30 PHEV40
PHEV20 Power-Split
Design
Series (EREV) Design
PHEV30
PHEV40 PHEV10 and PHEV20
GREET Estimates WTW Petroleum Savings and GHG Emissions for PHEVs Relative to ICEV and HEVs (Figure Shown for Charging in WECC)

11
LCA of Power Plants Construction
John Sullivan ANL

Three Steps
12
Gather power plant infrastructure data for each power plant type (geothermal, coal, solar, etc.)
1) Plant and equipment material composition
For geothermal power, this includes the well
2) Develop material to power ratios (MPRs)
3) Construction energy (diesel for excavators, cranes) added where data available

Aluminum
Cement
Concrete
Copper
Glass
Iron
Lead
Oil
Plastic
Silicon
Steel
100
1,000
10,000
100,000
1,000,000
0.100 1.000 10.000 100.000 1,000.000 10,000.000
Carb
on In
tens
ity (k
g/to
n)≈ E
nerg
y Int
ensit
y
Material Uses per TWh of Lifetime Generation (ton/TWh)
Impact of Materials on Life Cycle Analysis Results
13
Most Significant
PV only
Significant
PV requires significantly larger amount of energy/carbon intense materials (Si, Al, and glass) than other power plants
Steel and concrete are widely used for various power plants 30 years lifetime
14
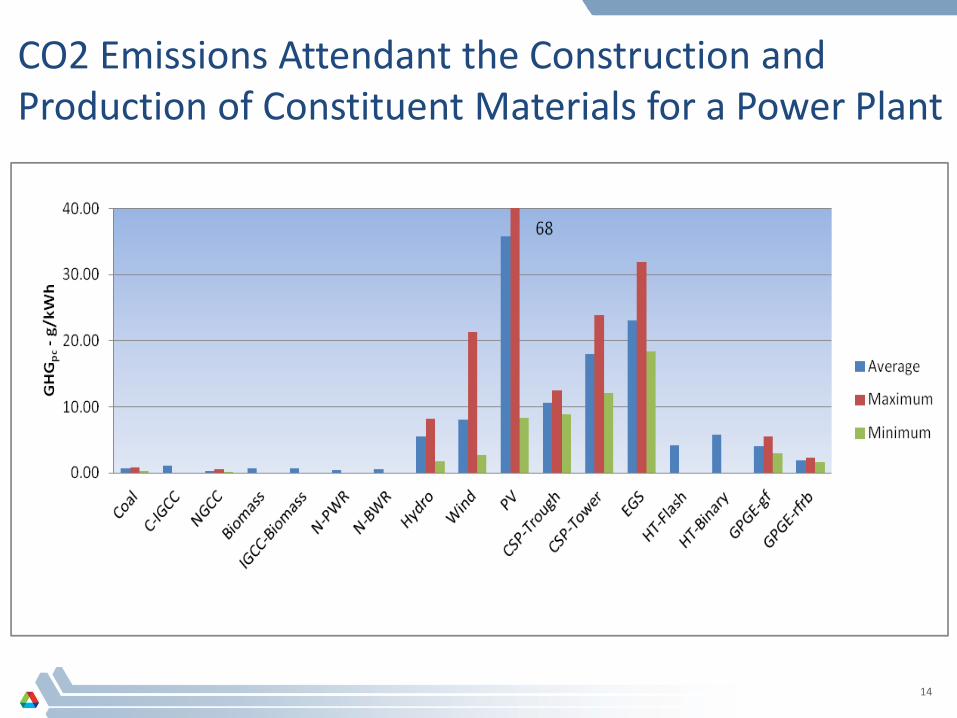
CO2 Emissions Attendant the Construction and Production of Constituent Materials for a Power Plant

15
GHGs for Various Power Plant Technologies
g

16
Demonstration of Case Simulations
Vehicle Technologies
Electricity Mix
Include Infrastructure
Case 1 PHEV 40, BEV U.S. Mix No Case 2 BEV CA Mix No Case 3 BEV Coal No Case 4 BEV Wind No Case 5 BEV Wind Yes
Related Documents