1 2 3 4 5 6 7 8 9 10 11 12 13 14 15 16 17 18 19 20 21 22 23 24 25 26 27 28 29 30 31 32 33 34 35 36 37 38 39 40 41 42 43 44 45 46 47 48 49 50 51 52 53 54 55 56 57 58 59 60 61 62 63 64 65 Life Cycle Assessment of electricity production from renewable energies: review and results harmonization Francesco Asdrubali*, Giorgio Baldinelli, Francesco D’Alessandro, Flavio Scrucca Università degli Studi di Perugia,Italy * e-mail address: [email protected] , Tel.: +39 0755853716, postal address: Via G. Duranti 67, 06125 Perugia, Italy Abstract A significant number of Life Cycle Assessment (LCA) analyses of renewable energy technologies is available in the literature, even though there is a lack of consistent conclusions about the life cycle impacts of the different technologies. The reported results vary consistently, according to the size and the technology of the considered plant, thus limiting the utility of LCA to inform policy makers and constituting a barrier to the deployment of a full awareness on sustainable energies. This variability in LCA results, in fact, can generate confusion regarding the actual environmental consequences of implementing renewable technologies. The paper reviews approximately 50 papers, related to more than 100 different case studies regarding solar energy (Concentrated Solar Power, Photovoltaic), wind power, hydropower and geothermal power. A methodology for the harmonization of the results is presented. The detailed data collection and the results normalization and harmonization allowed a more reliable comparison of the various renewable technologies. For most of the considered environmental indicators, wind power technologies turn out to be the low end while geothermal and PV technologies the high end of the impact range where all the other technologies are positioned. Keywords: electricity production, solar, wind, hydro, geothermal, LCA. Contents 1. Introduction 2. Life Cycle Assessment methodology 3. Literature data collection 3.1. Screening approach 3.2. Data collected 4. Review results by technology 4.1. Concentrated Solar Power 4.2. Wind power 4.3. Geothermal power 4.4. Hydropower 4.5. Photovoltaic 5. Data harmonization 6. Harmonization procedure results 7. Conclusions Acknowledgements References *Manuscript Click here to view linked References

Welcome message from author
This document is posted to help you gain knowledge. Please leave a comment to let me know what you think about it! Share it to your friends and learn new things together.
Transcript

1 2 3 4 5 6 7 8 9 10 11 12 13 14 15 16 17 18 19 20 21 22 23 24 25 26 27 28 29 30 31 32 33 34 35 36 37 38 39 40 41 42 43 44 45 46 47 48 49 50 51 52 53 54 55 56 57 58 59 60 61 62 63 64 65
Life Cycle Assessment of electricity production from renewable energies: review and results harmonization
Francesco Asdrubali*, Giorgio Baldinelli, Francesco D’Alessandro, Flavio Scrucca
Università degli Studi di Perugia,Italy
* e-mail address: [email protected], Tel.: +39 0755853716, postal address: Via G. Duranti 67, 06125 Perugia, Italy
Abstract
A significant number of Life Cycle Assessment (LCA) analyses of renewable energy technologies is available
in the literature, even though there is a lack of consistent conclusions about the life cycle impacts of the
different technologies. The reported results vary consistently, according to the size and the technology of the
considered plant, thus limiting the utility of LCA to inform policy makers and constituting a barrier to the
deployment of a full awareness on sustainable energies. This variability in LCA results, in fact, can generate
confusion regarding the actual environmental consequences of implementing renewable technologies. The
paper reviews approximately 50 papers, related to more than 100 different case studies regarding solar
energy (Concentrated Solar Power, Photovoltaic), wind power, hydropower and geothermal power. A
methodology for the harmonization of the results is presented. The detailed data collection and the results
normalization and harmonization allowed a more reliable comparison of the various renewable technologies.
For most of the considered environmental indicators, wind power technologies turn out to be the low end
while geothermal and PV technologies the high end of the impact range where all the other technologies are
positioned.
Keywords: electricity production, solar, wind, hydro, geothermal, LCA.
Contents
1. Introduction
2. Life Cycle Assessment methodology
3. Literature data collection
3.1. Screening approach
3.2. Data collected
4. Review results by technology
4.1. Concentrated Solar Power
4.2. Wind power
4.3. Geothermal power
4.4. Hydropower
4.5. Photovoltaic
5. Data harmonization
6. Harmonization procedure results
7. Conclusions
Acknowledgements
References
*ManuscriptClick here to view linked References

1 2 3 4 5 6 7 8 9 10 11 12 13 14 15 16 17 18 19 20 21 22 23 24 25 26 27 28 29 30 31 32 33 34 35 36 37 38 39 40 41 42 43 44 45 46 47 48 49 50 51 52 53 54 55 56 57 58 59 60 61 62 63 64 65
1. Introduction
Over the past 40 years the world energy final consumption approximately doubled and the growth in global
energy demand, in a scenario with no change in government policies, is projected to rise sharply over the
coming years [1]. The total primary energy supply reached the value of 13,113 Mtoe in 2011 [2]; fossil fuels
remain the main source of energy supply, with a share of 81.9% of total final consumption in 2010, even
though the contributions of renewables are increasing.
In this context, the environmental impact associated to different energy technologies is becoming more and
more a key issue to support policy decisions; carbon footprinting, other GHG accounting approaches and
Life Cycle Assessment (LCA) are commonly used in this regard [3 – 6].
Evaluation approaches with a single indicator, such as Carbon Footprint, are certainly more attractive than
LCA due to their simplicity [7], but may result in oversimplification. With particular regard to electricity
generation technologies, recent studies [8] confirm that focusing only on GHG emissions may lead to wrong
conclusions concerning their environmental consequences. As a matter of fact, many renewable energy
technologies do have an impact on water, ground, wildlife, landscape, therefore the mere evaluation of CO2
emissions results limitative. Thus, a range of key indicators must be considered to evaluate the sustainability
of energy generation technologies [9] and a LCA approach is desirable to avoid impact shifting from one life
cycle phase to another [10]. In this regard, also the utilization of a Life Cycle Sustainability Assessment
(LCSA) model is considered a valid supporting tool [11].
Several literature studies deal with LCA of renewable energy technologies as well as with the review of
literature results [8, 12 – 17]. Although different tools to ensure a correct implementation of LCA have been
developed [18 – 20], the individual interpretation of methodological aspects plays a key role, generating
different and inconsistent results. Furthermore, renewable energies plants are characterized by a wide range
of power, technologies, configurations and applications. This paper focuses on the set of environmental
indicators generally used to carry out LCA of power plants, in order to take into account all the issues related
to the electricity production with the most common renewable energy technologies (solar, wind, hydro,
geothermal). Bioenergies were excluded because of the great number of existing typologies (biofuels,
biogas, solid biomass) and technologies (direct combustion, co-combustion with fossil fuels, gasification)
and, therefore, because of the consequent impossibility to obtain a significant number of data for each one of
these typologies. Literature regarding wave power, even if many projects have been implemented leading to
interesting insights and innovations [21], did not allow to obtain a significant number of data about
environmental impacts. Therefore, also this renewable technology was excluded from the study.
The paper also proposes a simple and straightforward methodology to harmonize the LCA studies results on
the basis of the main parameters on which the output of each renewable energy power plant depends (e.g.
resource availability, capacity factor, efficiency, lifetime, etc.). The main purpose of the paper is therefore to
suggest a methodological approach to perform a more reliable comparison of the various renewable
technologies, thus making the best use of LCA results to inform policy makers.
2. Life Cycle Assessment methodology
LCA methodology allows the evaluation of the environmental impact of products and services across all life
cycle stages, modeling their interaction with the environment and accounting for all steps from raw material
extraction to final disposal or recycling. According to LCA guidelines provided by ISO 14040 and 14044 [18,

1 2 3 4 5 6 7 8 9 10 11 12 13 14 15 16 17 18 19 20 21 22 23 24 25 26 27 28 29 30 31 32 33 34 35 36 37 38 39 40 41 42 43 44 45 46 47 48 49 50 51 52 53 54 55 56 57 58 59 60 61 62 63 64 65
19], a LCA analysis is carried out by iterating four phases: goal and scope definition of the study, life cycle
inventory, life cycle impact assessment and interpretation.
The goal and scope definition phase specifies the overall aim of the study, the system boundaries, the
sources of data, and the functional unit to which refer all input and output flows. The Life Cycle Inventory
(LCI) phase includes a detailed description of all the environmental inputs (material and energy flows) and
outputs (air, water, and solid emissions), while the Life Cycle Impact Assessment (LCIA) phase quantifies the
relative magnitude of all the environmental impacts by using several environmental indicators. Finally, the
results from the LCI and LCIA phases are interpreted to identify critical aspects, to evaluate alternative
options, and to implement optimizations.
There are many evaluation methods used in LCA analyses and various different commercial codes for the
implementation. Among the most used, the following are: the IPCC method, which expresses the impact in
terms of CO2 equivalent emissions, the CED method, which evaluates the energy used during the entire life
cycle of the product or service, and the scoring method Ecoindicator 99 that considers a total of eleven
impact categories regarding human health, ecosystem quality and resources depletion.
Regarding energy technologies, LCA provides a clearly defined and comprehensive framework to facilitate
comparative studies and allows to evaluate the environmental consequences ―from cradle to grave".
Furthermore, LCA is recognized to be an effective tool to evaluate the sustainability of various renewable
energy sources and to help policy makers to choose the best energy source for a specific purpose [22].
3. Literature data collection
3.1. Screening approach
In order to obtain a high research quality standard and to select only relevant and high quality information,
the definition of screening criteria to filter literature studies and to include data was the first, crucial step of
the study. According to previous similar literature studies [23], a preliminary screening based on several
rough discriminators was set to eliminate a part of references. All the documents listed below were excluded
from the data collection:
- documents published before 1980;
- posters and abstracts;
- journal articles with a number of pages less than or equal to three;
- conference papers with a number of pages less than or equal to five;
- documents regarding technologies that do not produce electricity as a final product; if electricity is a
co-product, the document was considered only if the LCA results were clearly separable;
- documents regarding not full LCA studies (less than two life cycle phases evaluated).
A secondary screening was then set to further narrow the group of references by defining the quality of the
studies. Specifically, this screening step assessed the parameters following described [24]:
- quality: the study had to follow currently accepted LCA methodologies, such as ISO 14040 series
standards. The study had also to consider impacts from materials extraction and component
manufacturing stages, since they contribute significantly to the life cycle impact of renewable
energies;
1 2 3 4 5 6 7 8 9 10 11 12 13 14 15 16 17 18 19 20 21 22 23 24 25 26 27 28 29 30 31 32 33 34 35 36 37 38 39 40 41 42 43 44 45 46 47 48 49 50 51 52 53 54 55 56 57 58 59 60 61 62 63 64 65
- transparency and completeness of reporting: the study had to present an adequate description of the
inputs and methods, thus, the results could be traced and trusted. In particular, it was requested:
- a reasonably description of the study (goal and scope, system boundaries and other
assumptions, such as system lifetime and end of life scenario characteristics);
- a description, numerical where possible, of the power system studied (capacity, site
description or location);
- the citation of primary or secondary data sources used for the analysis;
- the specification of the software and database used (SimaPro, Ecoinvent, etc.);
- the modern or future relevance of the technology: existing and future technologies were included.
3.2. Data collected
Our data collection focused on six environmental impact categories usually included into LCAs of power
plants: Acidification Potential (AP), Eutrophication Potential (EP), Global Warming Potential (GWP),
Photochemical Ozone Creation Potential (POCP), Land Use (LU) and Water Consumption (WC). In addition,
two other significant parameters were taken into account: Cumulative Energy Demand (CED) and Energy
Pay-Back Time (EPBT). Most of data used in this study were gathered directly from summary life cycle
impact tables, but some assumptions were necessary to obtain uniform data. Firstly, when only the outputs
of the LCI of the system in terms of emissions were available, equivalent factor tables were used to refer
each emission to its impact category. Table 1, in particular, shows the factors used to convert common
pollutants emissions in SO2 equivalent emissions into the AP category, while Table 2 summarize the PO43-
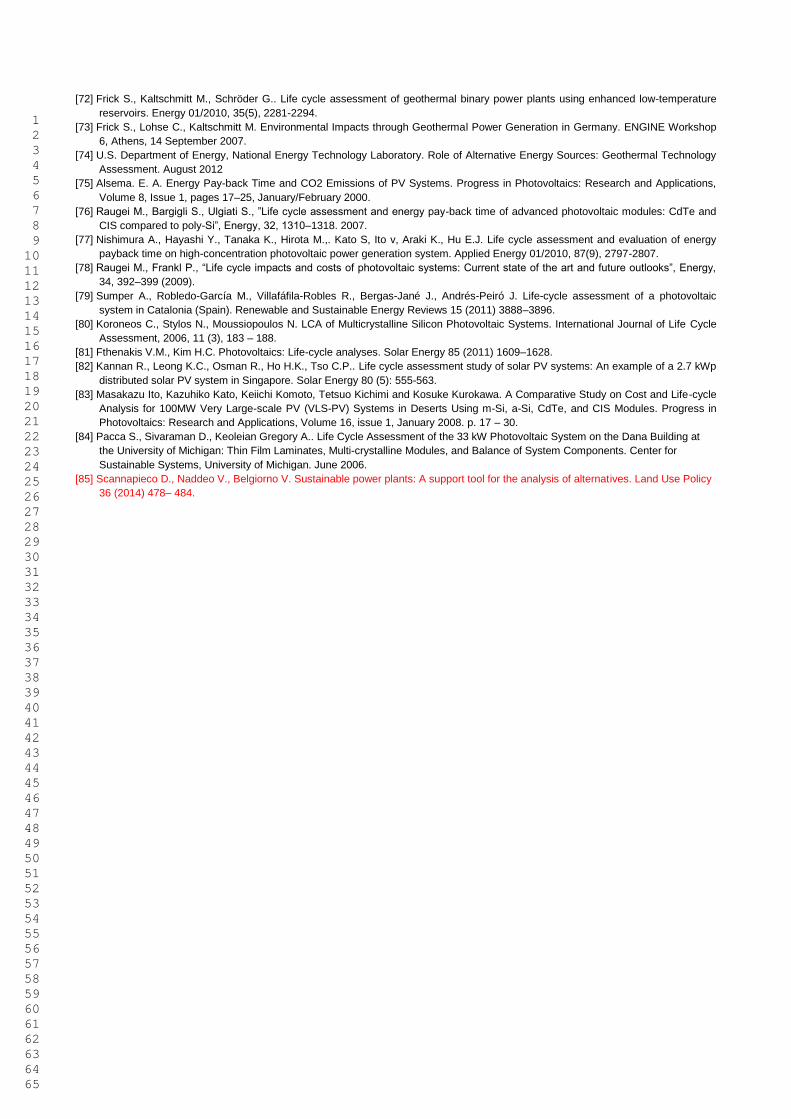
equivalent factor for the EP category. Table 3, instead, shows the well known GWP values of different GHG
and Table 4 reports the factors used to convert pollutants emissions in Ethylene equivalent emissions into
the POCP category. Secondly, regarding the water consumption in hydropower plants, the evaporation of
water from the reservoir was not taken into account. Therefore, according to literature data [25], we
considered an evaporation of 25 kg/kWh to be subtracted from the data that included it. A similar assumption
was made for the CED data of hydropower plants. In fact, some studies included both the energy used
during the plant construction and the potential energy embodied in water, presenting CED values 10 times
higher than those given in other studies. We proceeded considering an embodied energy of 3.79 MJ/kWh
[26, 27] to calculate the value to be subtracted and to obtain comparable CED data. Finally, with regard to
EPBT, we found some studies presenting a value in terms of primary energy and other studies which supply
only the ratio between the primary energy consumption during the whole life cycle and the electricity
produced by the plant (not accounting the utilization grade of primary energy source to produce electricity,
g). In our study, we chose to consider the ―primary‖ EPBT and we set a value of g equal to 0.365 [28]
(average world value) for the data adaptation. The total number of data collected and processed is
summarized in Table 5.
4. Review results by technology
4.1. Concentrated Solar Power
Five papers [42, 44–48] and two technical documents [41, 43] related to 15 case studies (Fig. 1) were
included according to the selection criteria for Concentrated Solar Power (CSP). 9 case studies regarded

1 2 3 4 5 6 7 8 9 10 11 12 13 14 15 16 17 18 19 20 21 22 23 24 25 26 27 28 29 30 31 32 33 34 35 36 37 38 39 40 41 42 43 44 45 46 47 48 49 50 51 52 53 54 55 56 57 58 59 60 61 62 63 64 65
Parabolic Trough (PT) applications, while 6 case studies were related to Central Tower (CT) plants. All the
reviewed documents included data regarding GWP, CED and EPBT; 6 studies contained data on LU,
whereas data on AP, EP and WC were gathered from 4 studies and data on POCP from 3 documents.
Results regarding GWP and CED included in [41, 42, 44, 45, 48] were presented by life cycle phases and
showed that hybrid plants (i.e. plants with gas boiler integration) have an impact during the operation one
order of magnitude higher than the impact of the construction. On the contrary, 100% ―sun-fired‖ plants are
characterized by an impact of the construction phase comparable with the impact of the operating phase.
The minimum and maximum values observed for GWP were respectively equal to 14.2 and 203 g
CO2eq/kWh, while CED values ranged between 0.16 and 2.78 MJ/kWh. The same high variability connected
to the plant typology was observed for AP, EP and POCP values. WC vary significantly, with values in the
range 294 – 4,710 g/kWh, and this is essentially due the cooling option used (high water consumption values
in water cooled plants and low values in air cooled plants, where the consumption of water is associated only
to cleaning activities). LU values were in the range 2.89E-05 – 7.92E-04 m2/kWh.
4.2. Wind power
Regarding wind power, fourteen documents (5 papers [49–53] and 9 technical documents [54–62]) dealing
with 20 case studies were included following the selection criteria (Fig. 1). All the applications considered are
comparable in terms of size, with a minimum value of 0.25 MW, a maximum value of 6.00 MW and 13 plants
in the range 1.50 – 4.00 MW. All the reviewed studies included data regarding GWP, CED and EPBT, while
data regarding AP and POCP were gathered from 11 of the documents considered. 12 documents contained
data on AP, 10 documents data on WC and only 1 document data on LU. POCP data showed a high
variability (values in the range 0.85 – 16.10 mg C2H4eq/kWh), as well as CED data (values in the range 0.01
– 1.20 MJ/kWh) and EPBT data (values in the range 2.4 – 27.5 months). This variability is basically due to
different operating conditions (Capacity Factor varying between 19% and 53%) and to different assumptions
in LCA modeling (e.g. conservative or non-conservative estimates regarding the maintenance activities). A
quite low variability was observed for AP, EP and GWP data: AP values were in the range 28.0 – 115.2 mg
SO2eq/kWh, EP values in the range 2.7 – 12.2 mg PO43-
eq/kWh, while GWP values in the range 6.2 – 46.0 g
CO2eq/kWh. All studies, with the exception of [51, 52, 53, 56], presented the results by life cycle phases,
showing that the construction phase gives the highest contribution to the overall impact (one order of
magnitude higher than the operation phase).
4.3. Geothermal power
Three papers [15, 71, 72] and two technical documents [73, 74], related to 20 case studies, were included
according to the selection criteria for geothermal power (Fig. 1). All the reviewed studies included data
regarding GWP, while data regarding CED and EPBT were gathered from 4 documents. Only two studies
included data on LU and WC and the same applies for POCP, whereas data regarding AP and EP were
included in 4 documents.
AP values were in the range 212 – 662 mg SO2eq/kWh, CED values in the range 0.27 – 1.27 MJ/kWh and
EPBT values in the range 8.2 – 46.5 months. A quite low variability was observed for POCP (values ranging
between 13.1 and 43.7 mg C2H4eq/kWh) and for EP (values in the range 27.5 – 88.7 mg PO43-
eq/kWh),

1 2 3 4 5 6 7 8 9 10 11 12 13 14 15 16 17 18 19 20 21 22 23 24 25 26 27 28 29 30 31 32 33 34 35 36 37 38 39 40 41 42 43 44 45 46 47 48 49 50 51 52 53 54 55 56 57 58 59 60 61 62 63 64 65
while CO2 emissions factors showed a high variability (GWP values ranging between 16.9 and 142.0 g
CO2eq/kWh), essentially due to the characteristics of the used technology. Moreover, one paper [72] showed
that the environmental impacts result significantly influenced by the geological conditions at a specific site.
Only three studies [72, 73, 74] allowed to analyze the impact by life cycle phases, and also in this case the
construction phase impact resulted one order of magnitude higher than the impact of the other phases.
4.4. Hydropower
Eleven case studies, contained in 4 papers [63, 64, 68, 69] and 4 other documents [65, 66, 67, 70] were
included for hydropower (Fig. 1). These studies encompass dams with reservoir plants and run-of-river
plants, large and small size installations. Data regarding GWP, CED and EPBT were included in all the
documents considered, while data regarding AP, EP and POCP were gathered from 7 of them. Only 5
studies included data on LU and WC. Due to the consistent differences characterizing the plants considered,
and also to the different approaches used (e.g. regarding/disregarding water evaporation from the reservoir
and the potential energy embodied in water), a high variability (one order of magnitude) was observed for all
the environmental indicator considered. In particular, AP values ranged from 7.6 to 129.4 mg SO2eq/kWh,
EP values from 0.4 – 30.0 mg PO43-
eq/kWh and POCP values from 1 to 30 mg C2H4eq/kWh; GWP data were
in the range 2.2 – 74.8 g CO2eq/kWh, CED data in the range 0.01 – 0.90 MJ/kWh and EPBT in the range 2.9
– 37.1 months. Data regarding LU varied from 4.87E-05 – 2.58E-03 m2/kWh and data on WC from 1 to 75
l/kWh). All studies, except for [67], presented the results by life cycle phases.
4.5. Photovoltaic
The reviewed papers about photovoltaic (PV) applications were 11 [47, 48, 75–83], regarding 33 case
studies; also 1 technical document [84] concerning 3 case studies was included according to the selection
criteria (Fig. 1). Data regarding GWP and CED were gathered from 11 documents, while data regarding CED
were included in 10 documents. 5 studies contained data regarding LU, 4 studies data on AP and EP and
only 1 paper included data on WC. AP, EP, GWP and LU values showed a high variability (the range was
respectively 78.7 – 979.7 mg SO2eq/kWh, 4.0 – 92.5 mg PO43-
eq/kWh, 9.4 – 167.0 g CO2eq/kWh and
1.02E-04 – 1.01E-03 m2/kWh), while POCP data were in the range 29.8 – 125.0 mg C2H4eq/kWh, CED data
in the range 0.36 – 1.80 MJ/kWh and EPBT values in the range 9.6 – 43.9 months. The documents include
both ―upstream‖ and ―downstream‖ processes (raw materials production, fabrication of system components,
transportation and installation) and both ground and roof mounted systems. It is evident that during the life
cycle of PV, emissions mainly occur from the use of fossil-fuel-based energy in generating the materials for
cells, modules, and systems [81], with the production of the PV modules accounting for more than the 84%
of the total primary energy consumption of the whole PV system [79]. It also emerged that a tracking system
may increase significantly the impact of the construction phase and that the tracking system itself may
account for 65-70% of the overall impact of the PV application [77]. An interesting projection of GWP for
some PV technologies in the years 2025 and 2050 is given in [78].
5. Data harmonization
The harmonization process goal consists of reducing the data variability, aligning methodological
inconsistencies in published LCAs, such as not coherent system boundaries, the use of outdated data,

1 2 3 4 5 6 7 8 9 10 11 12 13 14 15 16 17 18 19 20 21 22 23 24 25 26 27 28 29 30 31 32 33 34 35 36 37 38 39 40 41 42 43 44 45 46 47 48 49 50 51 52 53 54 55 56 57 58 59 60 61 62 63 64 65
variations on similar energy process chains, and even simple differences in reporting of results. Capacity
Factor (CF), which is the ratio of average output power to peak power that a plant could deliver, was chosen
as harmonization parameter for wind power and hydropower, thus normalizing data to a similar operation
scenario. For geothermal power, Conversion Efficiency (CE) was selected in addition to CF, as it represents
a characteristic parameter of plant operation. As far as solar energy technologies, Direct Normal Irradiance
(DNI), expressing the amount of solar energy available, was chosen as the main harmonization parameter.
In addition, for CSP, Solar-to-electric Efficiency (SE) and Solar Fraction (SF) were selected, while for PV the
other parameters indicated were Performance Ratio (PR) and Module Efficiency (ME). Regarding some
technologies (CSP, wind power, PV), previous harmonization reviews were found and the same values of
these literature studies were chosen for the analysis; on the other hand, for all the other technologies
(hydropower, geothermal power) the harmonization parameters values were set equal to the median values
of data collected.
Finally, since the resulting life cycle impacts of a power plant are closely related to the lifetime period used to
carry out its LCA, a reference value of the lifetime for each technology (equal to the median value resulting
from published data) was also selected for the data harmonization of all technologies considered. Different
technologies are characterized by different lifetimes.
The parameters are listed in Table 6, with the related harmonization formula. With regard to CSP data, it
must be stressed that the contribution associated to the gas boiler integration in hybrid plants was excluded
in the harmonization procedure.
6. Harmonization procedure results
Looking at the central tendency of the harmonized AP values (Fig. 2a), hydropower seems to be the best
technology (median value equal to 12.8 mg SO2eq/kWh), immediately followed by wind (median value equal
to 48.9 mg SO2eq/kWh). CSP, with a median value of 91.2 mg SO2eq/kWh, is positioned at a medium level
of impact, while PV and geothermal have the highest impact values.
The central tendency of harmonized EP data (Fig. 2b) shows wind and hydropower as the best technologies,
with a comparable median value of the impact (4.9 and 4.8 mg PO43-
eq/kWh respectively). CSP has a
median EP impact quite comparable with wind and hydro (6.8 mg PO43-
eq/kWh), while PV assumes a
medium value (22.4 mg PO43-
eq/kWh for PV). Geothermal is the technology with the highest euthropication
potential.
The harmonized GWP data (Fig. 2c) are characterized by a low variability, due to the larger sample of data
found for each technology, and the central tendency of the estimates shows wind and hydropower as the
best technologies (median value of the impact equal to 9.4 and 11.6 g CO2eq/kWh respectively). The other
three technologies, instead, present a higher and comparable value of the impact. In particular, PV has a
median value equal to 29.2 g CO2eq/kWh, CSP a median value of 30.9 g CO2eq/kWh and geothermal is
characterized by a median equal to 33.6 g CO2eq/kWh.
Looking at the central tendency of the harmonized POCP values (Fig. 2d), hydropower and wind seems to
be the best technologies, with a median value of 1.5 and 4.6 mg C2H4eq/kWh respectively. CSP and
geothermal power have a quite similar impact (respectively 16.4 and 22.1 mg C2H4eq/kWh), while PV is the
technology with the highest Photochemical Ozone Creation Potential.

1 2 3 4 5 6 7 8 9 10 11 12 13 14 15 16 17 18 19 20 21 22 23 24 25 26 27 28 29 30 31 32 33 34 35 36 37 38 39 40 41 42 43 44 45 46 47 48 49 50 51 52 53 54 55 56 57 58 59 60 61 62 63 64 65
The harmonized CED data (Fig. 2e) show wind as the best of all the technologies, with a median value of the
impact equal to 0.13 MJ/kWh, followed by hydropower (0.16 MJ/kWh), CSP (0.44 MJ/kWh), geothermal
power (0.52 MJ/kWh) and PV (0.61 MJ/kWh).
Comparing Fig. 2 with Fig. 1, it is evident that the main effect of the proposed harmonization methodology is
a general reduction in the variability of the previously published estimates, increasing the precision and
aligning common system parameters to a consistent set of values.
However, some exceptions emerged. In particular, the increase of the variability range of the environmental
indicators values observed for Geothermal power is due to 2 case studies included in [72], with a CE higher
than the one set for the harmonization and the same lifetime. The same applies for the raise observed in the
variability range of AP values regarding PV: 2 case studies included in [79] were characterized by a lifetime
and a ME higher than the ones set to harmonize (in detail, 40 years and 16% and 50 years and 18%). The
increase observed in the variability range of POCP values regarding wind power is the consequence of a
case study included in [40] with a DNI higher than the one used for the harmonization.
Regarding LU and WC, only published estimates were analyzed, since, after the screening approach, the
number of data available was not sufficient to carry out the harmonization. Data regarding EPBT, on the
contrary, were not harmonized because this parameter strongly depends on local economic policies (e.g.
feed-in tariff, incentives on capital investments, etc.) and data regarding this aspect were lacking.
7. Conclusions
The evaluation of the environmental impact associated to different energy technologies and, in particular, to
renewable energies, is becoming a key issue in policy making. Different evaluation approaches are used in
this regard and a LCA approach is considered as one of the most appropriate and comprehensive methods.
However, published LCA results vary significantly, creating confusion on the actual environmental
consequences of implementing renewable technologies.
In the present paper, a selected and critical review of more than 100 different case studies - regarding solar
energy (CSP, PV), wind power, hydropower and geothermal power - was performed, which clearly showed
this data variability and its causes. Furthermore, a methodological approach to harmonize LCA results was
proposed. In fact, even if the energy production from renewable sources is ―resource-dependent‖, a more
reliable comparison of the environmental consequences of the different technologies is desirable. A
comprehensive set of environmental indicators was selected for the comparison and a set of parameters to
harmonize published LCA data was suggested.
Comparing the harmonized results, wind power emerged as the renewable technology with a lower overall
environmental impact (it had the lowest impact values and the narrowest ranges of variability). For instance,
wind power had the lowest CO2eq emissions and the lowest embodied energy. Geothermal power and PV
power, instead, came out as the renewable technologies with the highest overall environmental impact
values and the widest ranges of variability. Within the other technologies considered, CSP was positioned at
a medium level of environmental impact, resulting better than PV, geothermal and hydropower plants in
almost all the impact categories considered.
Extending the comparison of the harmonized results to conventional power systems (e.g. hard coal or
natural gas power station) the analysis of all impact categories demonstrates that renewable energy
technologies show significant environmental advantages. Considering for example GWP values, a combined

1 2 3 4 5 6 7 8 9 10 11 12 13 14 15 16 17 18 19 20 21 22 23 24 25 26 27 28 29 30 31 32 33 34 35 36 37 38 39 40 41 42 43 44 45 46 47 48 49 50 51 52 53 54 55 56 57 58 59 60 61 62 63 64 65
cycle natural gas plant has a mean emission of 350 – 400 g CO2eq/kWh and a hard coal plant with direct
combustion has an emission range of 750 – 1050 g CO2eq/kWh [8], while all the analyzed technologies are
characterized by values lower than 100 g CO2eq/kWh. Moreover, while an old hard coal plants with direct
combustion has an AP range of 2 – 7 g SO2/kWh [8], all the analyzed technologies are characterized by
values lower than 1 g SO2/kWh. As a further example, whereas for conventional fossil fuels-fired power plant
it is possible to consider a CED impact in the order of magnitude of 10 MJ/kWh [85], the harmonized CED
values of all the considered renewable energy technologies result below 1.3 MJ/kWh.
Acknowledgements
The authors are indebted to Álvaro Martínez Malo for the significant contribution given in data collection and
elaboration.
Nomenclature
AP Acidification Potential IQR Inter Quartile Range
a-Si Amorphous Silicon ISO International Organization for Standardization
CdTe Cadmium Telluride LCI Life Cycle Inventory
CE Conversion Efficiency LCIA Life Cycle Impact Assessment
CED Cumulative Energy Demand LCA Life Cycle Assessment
CF Capacity Factor LCSA Life Cycle Sustainability Assessment
CIGS Copper Indium Gallium Selenide LU Land Use
CSP Concentrated Solar Power ME Module Efficiency
Di,harm Harmonized data related to the environmental indicator i
Mono-Si Monocristalline Silicon
Di,pub Published data related to the environmental indicator i
Multi-Si Multicristalline Silicon
Di Lifetime harmonized data related to the environmental indicator i
POCP Photochemical Ozone Creation Potential
DNI Direct Normal Irradiance PR Performance Ratio
EP Eutrophication Potential PV Photovoltaic
EPBT Energy Pay-Back Time SE Solar-to-electric Efficiency
GHG Greenhouse Gas SF Solar Fraction
GWP Global Warming Potential WC Water Consumption
IPCC International Panel on Climate Change
References
[1] Moncada Lo Giudice G., Asdrubali F., Rotili A. Influence of new factors on global energy prospects in the medium term: comparison
among the 2010, 2011 and 2012 editions of the IEA’s World Energy Outlook reports. Economics and Policy of Energy and the
Environment 3 (2013) 67-89.
[2] International Energy Agency (IEA), ―Key World Energy Statistics 2013‖,
http://www.iea.org/publications/freepublications/publication/KeyWorld2013.pdf.
[3] Xi, Fengming, Geng, Yong, Chen, Xudong, Zhang, Yunsong, Wang, Xinbei, Xue, Bing, Dong, Huijuan, Liu, Zhu, Ren, Wanxia,
Fujita,Tsuyoshi, Zhu, Qinghua.Contributing to local policy making on GHG emission reduction through inventorying and attribution:
a case study of Shenyang. China Energy Policy 39 (2011) 5999–6010.
[4] Vázquez-Rowe I., Marvuglia A., Rege S., Benetto E. Applying consequential LCA to support energy policy: Land use change effects
of bioenergy production. Science of the Total Environment 472 (2014) 78–89.
[5] Blengini G.A. , Brizio E., Cibrarioa M., Genona G. LCA of bioenergy chains in Piedmont (Italy): A case study to support public
decision makers towards sustainability. Resources, Conservation and Recycling 57 (2011) 36–47.

1 2 3 4 5 6 7 8 9 10 11 12 13 14 15 16 17 18 19 20 21 22 23 24 25 26 27 28 29 30 31 32 33 34 35 36 37 38 39 40 41 42 43 44 45 46 47 48 49 50 51 52 53 54 55 56 57 58 59 60 61 62 63 64 65
[6] Asdrubali F., Presciutti A., Scrucca F. Development of a greenhouse gas accounting GIS-based tool to support local policy making—
application to an Italian municipality. Energy Policy 61(2013) 587–594.
[7] Weidema BP,Thrane M,Christensen P,Schmidt J,Løkke S. Carbonfootprint. Journal of Industrial Ecology 12 (2008) 3–6.
[8] Turconi R., Boldrin A., Astrup T. Life cycle assessment (LCA) of electricity generation technologies: Overview, comparability and
limitations. Renewable and Sustainable Energy Reviews 28 (2013) 555–565.
[9] Evans A., Strezov V., Evans T. J. Assessment of sustainability indicators for renewable energy technologies. Renewable and
Sustainable Energy Reviews 13 (2009) 1082–1088.
[10] Asdrubali F., Baldassarri C., Fthenakis V., Life cycle analysis in the construction sector: Guiding the optimization of conventional
Italian buildings, Energy and Buildings 64 (2013) 73–89.
[11] Traverso M., Asdrubali F., Francia A., Finkbeiner M.: ―Towards Life Cycle Sustainability Assessment: an implementation to
photovoltaic modules‖, International Journal of Life Cycle Assessment 17 (2012) 1068-1079.
[12] Sherwani A.F., Usmani J.A., Varun. Life cycle assessment of solar PV based electricity generation systems: A review. Renewable
and Sustainable Energy Reviews 14 (2010) 540–544.
[13] Hanne Lerche Raadal, Luc Gagnon, Ingunn Saur Modahl, Ole Jørgen Hanssen. Life cycle greenhouse gas (GHG) emissions from
the generation of wind and hydro power. Renewable and Sustainable Energy Reviews 15 (2011) 3417– 3422.
[14] Jinqing Peng,LinLu , HongxingYang. Review on life cycle assessment of energy payback and greenhouse gas emission of solar
photovoltaic systems.
[15] Bayer P., Rybach L., Philipp Blum P., Brauchler R. . Review on life cycle environmental effects of geothermal power generation.
Renewable and Sustainable Energy Reviews 26 (2013) 446–463.
[16] Varun I.K. Bhat, Ravi Prakash. LCA of renewable energy for electricity generation systems—A review. Renewable and Sustainable
Energy Reviews 13 (2009) 1067–1073.
[17] Marimuthu C., Kirubakarann V. Carbon payback period for solar and wind energy project installed in India: A critical review.
Renewable and Sustainable Energy Reviews 23 (2013) 80–90.
[18] ISO, EN ISO14040 Environmental management — Life cycleassessment— Principles andframework (2006).
[19] ISO, EN ISO14044 Environmental management — Life cycle assessment — Requirements and guidelines (2006).
[20] European Commission—Joint Research Centre—Institute for Environment and Sustainability, EC JRC, International Reference Life
Cycle Data System (ILCD) Handbook— general guide for Life Cycle Assessment—detailed guidance. Luxembourg, Publications
Office of the European Union (2010).
[21] Arqam Ilyas, Syed A.R. Kashif, Muhammad A. Saqib, Muhammad M. Asad. Wave electrical energy systems: Implementation,
challenges and environmental issues. Renewable and Sustainable Energy Reviews 40 (2014) 260–268
[22] Anoop Singh, Stig Irving Olsen, Deepak Pant. Importance of Life Cycle Assessment of Renewable Energy Sources. Life Cycle
Assessment of Renewable Energy Sources. Green Energy and Technology (2013) 1-11, Springer London. ISBN: 978-1-4471-
5363-4 (Print) 978-1-4471-5364-1 (Online).
[23] Burkhardt III John J., Heath Garvin, Cohen Elliot. Life Cycle Greenhouse Gas Emissions of Trough and Tower Concentrating Solar
Power Electricity Generation: Systematic Review and Harmonization. Journal of Industrial Ecology, Volume 16, Issue Supplement
s1, (2012).
[24] Dolan Stacey L., Heath Garvin A. Life Cycle Greenhouse Gas Emissions of Utility-Scale Wind Power Systematic Review and
Harmonization. Journal of Industrial Ecology, Volume 16, Issue Supplement s1(2012).
[25] Pfister S., Saner D., Koehler A. The environmental relevance of freshwater consumption in global power production. International
Journal of Life Cycle Assessment, Volume 16, Pages 580-591 (2011).
[26] Twidell J., Weir T. Renewable Energy Resources. 2nd Edition. Taylor & Francis (2005).
[27] Hanne Lerche Raadal H., Saur Modahl I. (Ostfold Research), Haakon Bakken T.(SINTEF Energy Research). Energy indicators for
electricity production - Comparing technologies and the nature of the indicators Energy Payback Ratio (EPR), Net Energy Ratio
(NER) and Cumulative Energy Demand (CED). Report OR.09.12 (2012).
[28] International Energy Agency (IEA). The world energy outlook 2008.
[29] Wenzel H., Hauscild M., Alting L.. Environmental Assessment of Products. Vol.1. Methodology, tools and case studies in product
development. London Chapman and Hall (1997).
[30] Lindfors L.G., Christiansen K., Hoffmann L., Virtanen Y., Juntilla V., Hanssen O.J., Rønning A., Ekvall T., Finnveden G. LCA-Nordic
Technical Reports No. 1 - 9. TemaNord 1995:502. Copenhagen: Nordic Council of Ministers. ISBN 92 9120 608 3, ISSN 0908-
6692.
[31] Intergovernmental Panel on Climate Change (IPCC) GWPs 100 yr (2007).
[32] Gantner U., Hofstetter P. Ökoinventare für Energiesysteme: Teil VI Kohle. Zürich, Switzerland: Laboratorium für Energiesysteme,
The Swiss Federal Institute of Technology (ETH) (1996).
[33] IEA (International Energy Agency). Technology roadmap: Concentrating solar power. Paris, France: IEA (2010).
[34] Wiser R., Bolinger M. 2010 Wind Technologies Market Report. DOE/GO-102011-3322. Washington, DC: U.S. Department of
Energy Office of Energy Efficiency and Renewable Energy (2011).
[35] Hsu David D., O’Donoughue P., Fthenakis V, Heath Garvin A., Kim H. C. Sawyer P., Choi Jun-Ki, Turney Damon E. Life Cycle
Greenhouse Gas Emissions of Crystalline Silicon Photovoltaic Electricity Generation - Systematic Review and Harmonization.
Journal of Industrial Ecology, Volume 16, Issue Supplement s1, pages S122–S135 (2012).
[36] KimH. C., Fthenakis V., Choi Jun-Ki, Turney Damon E. Life Cycle Greenhouse Gas Emissions of Thin-film Photovoltaic Electricity
Generation - Systematic Review and Harmonization. Journal of Industrial Ecology, Volume 16, Issue Supplement s1, pages S110–
S121(2012).
[37] Alsema, E. A., Fraile D., Frischknecht R., Fthenakis V. M., Held M., Kim H. C., Polz W., Raugei M., De Wild-Scholten M. J.
Methodology guidelines on life cycle assessment of photovoltaic electricity. IEA-PVPS T12 01:2009. Paris: International Energy
Agency (2009).
[38] Alsema E.A., De Wild-Scholten M.J., Fthenakis V.M., Environmental impacts of PV electricity generation - a critical comparison of
energy supply options, 21th European Photovoltaic Solar Energy Conference, Dresden, Germany, 4-8 September 2006.

1 2 3 4 5 6 7 8 9 10 11 12 13 14 15 16 17 18 19 20 21 22 23 24 25 26 27 28 29 30 31 32 33 34 35 36 37 38 39 40 41 42 43 44 45 46 47 48 49 50 51 52 53 54 55 56 57 58 59 60 61 62 63 64 65
[39] De Wild-Scholten M.J., Alsema E.A. Environmental Life Cycle Inventory of Crystalline Silicon Photovoltaic System Production:
status 2005/2006.
[40] Granata, J. E., Boyson, W. E., Kratochvil, J. A., and Quintana, M. A. Long-term performance and reliability assessment of 8 PV
arrays at Sandia National Laboratories. 34th IEEE-PVSC Proceedings, Philadelphia, PA (2009).
[41] U.S. Department of Energy, Office of fossil energy. Role of Alternative Energy Sources: Solar Thermal Technology Assessment.
August 2012.
[42] Lechón Y., De la Rúa C., Sáez R.. Life Cycle Environmental Impacts of Electricity Production by Solar thermal Power Plants in
Spain. Journal of Solar Energy Engineering, Volume 130 (2008).
[43] Viebahn P., Kronshage S., Trieb F.(DLR), Lechon Y.(CIEMAT). Final report on technical data, costs, and life cycle inventories of
solar thermal power plants. NEEDS Project (2008).
[44] Burkhardt III John J., Heath Garvin A, Turchi Craig S. Life Cycle Assessment of a Parabolic Trough Concentrating Solar Power
Plant and the Impacts of Key Design Alternatives. Environmental Science and Technology 45 (2011), pp 2457–2464.
[45] Michael B. Whitaker, Garvin A. Heath, John J. Burkhardt , III, Craig S. Turchi. Life Cycle Assessment of a Power Tower
Concentrating Solar Plant and the Impacts of Key Design Alternatives. Environmental Science and Technology, 2013, 47 (11), pp
5896–5903.
[46] Weinrebe G., Böhnke M., Trieb F. Life Cycle Assessment of an 80 MW SEGS Plant and a 30 MW PHOEBUS Power Tower.
International Solar Energy Conference proceedings. ISBN: 0-7918-1856-X. 1998.
[47] Desideri U., Zepparelli F., Morettini V., Garroni E. Comparative analysis of concentrating solar power and photovoltaic
technologies: Technical and environmental evaluations. Applied Energy 102 (2013) 765–784.
[48] Asdrubali F., Baldinelli G., Presciutti A., Baldassarri C., Scrucca F. Comparative analysis of solar power technologies through life
cycle assessment approach. 3rd International Exergy, Life Cycle Assessment and Sustainability Workshop & Symposium
(ELCAS3) Proceedings (2013).
[49] Ardente F., Beccali M., Cellura M., Lo Brano V. Energy performances and life cycle assessment of an Italian wind farm. Renewable
and Sustainable Energy Reviews, 12 (1), (2008) 200–217.
[50] Tremeac B., Meunier F. Life cycle analysis of 4.5 MW and 250 W wind turbines. Renewable and Sustainable Energy Reviews 13
(2009) 2104–2110.
[51] Weinzettel J., Reenaas M., Solli, C., Hertwich Edgar G. Life cycle assessment of a floating offshore wind turbine. Renewable
Energy 34 (2009) 742–747.
[52] Schleisner L. Life cycle assessment of a wind farm and related externalities. Renewable Energy 20 (2000) 279–288.
[53] Begoña Guezuraga, Rudolf Zauner, Werner Pölz. Life cycle assessment of two different 2 MW class wind turbines. Renewable
Energy 37 (2012) 37–44.
[54] Vestas, (2011). Life Cycle Assessment of Electricity Production from a V80-2.0MW Gridstreamer Wind Plant. December 2011.
Vestas Wind Systems A/S, Alsvej 21, 8900 Randers, Denmark.
[55] Elsam, (2004). Life Cycle Assessment of offshore and onshore sited wind farms. October 2004. Elsam Engineering A/S.
[56] Vestas, (2006). Life cycle assessment of electricity produced from onshore sited wind power plants based on Vestas V82-1.65 MW
turbines. December 2006. Vestas Wind Systems A/S, Alsvej 21, 8900 Randers, Denmark.
[57] Vestas, (2011). Life Cycle Assessment of Electricity Production from a V90-2.0MW Gridstreamer Wind Plant. December 2011.
Vestas Wind Systems A/S, Alsvej 21, 8900 Randers, Denmark.
[58] Vestas, (2012). Life Cycle Assessment of Electricity Production from an onshore V90-3.0MW Wind Plant. September 2012. Vestas
Wind Systems A/S, Alsvej 21, 8900 Randers, Denmark.
[59] Vestas, (2011). Life Cycle Assessment of Electricity Production from a V100-1.8MW Gridstreamer Wind Plant. December 2011.
Vestas Wind Systems A/S, Alsvej 21, 8900 Randers, Denmark.
[60] Vestas, (2012). Life Cycle Assessment of Electricity Production from an onshore V100-2.6MW Wind Plant. September 2012. Vestas
Wind Systems A/S, Alsvej 21, 8900 Randers, Denmark.
[61] Vestas, (2011). Life Cycle Assessment of Electricity Production from a V112 Turbine Wind Plant. February 2011. Vestas Wind
Systems A/S, Alsvej 21, 8900 Randers, Denmark.
[62] U.S. Department of Energy, National Energy Technology Laboratory. Role of Alternative Energy Sources: Wind Technology
Assessment. August 2012.
[63] Pascale A., Urmee T., Moore A. Life cycle assessment of a community hydroelectric power system in rural Thailand. Renewable
Energy 36 (2011) 2799–2808.
[64] Flávio de Miranda Ribeiro, Gil Anderi da Silva. Life-cycle inventory for hydroelectric generation: a Brazilian case study. Journal of
Cleaner Production 18 (2010) 44–54.
[65] Flávio de Miranda Ribeiro . Inventário de ciclo de vida da geração hidrelétrica no Brasil-Usina de Itaipu: primeira aproximação.
Master Thesis (2004).
[66] Silje Arnøy, Ingunn Saur Modahl. Life Cycle Data for Hydroelectric Generation at Embretsfoss 4 (E4) Power Station. Background
Data for Life Cycle Assessment (LCA) and Environmental Product Declaration (EPD) (2013).
[67] Karin Flury, Rolf Frischknecht. Life Cycle Inventories of Hydroelectric Power Generation. ESU-services Ltd., fair consulting in
sustainability (2012).
[68] Varun, I. K. Bhat and Ravi Prakash. Life Cycle Analysis of Run-of River Small Hydro Power Plants in India. The Open Renewable
Energy Journal, 2008, 1, 11-16.
[69] Wall J., Passer A. Harvesting factor in hydropower generation. Life-Cycle and Sustainability of Civil Infrastructure Systems.
Proceedings of the Third International Symposium on Life-Cycle Civil Engineering (IALCCE'12), Vienna, Austria, October 3-6,
2012. Edited by Strauss, Frangopol & Bergmeister (Eds). 2013. Taylor & Francis Group, London, ISBN 978-0-415-62126-7.
[70] U.S. Department of Energy, National Energy Technology Laboratory. Role of Alternative Energy Sources: Hydropower Technology
Assessment. August 2012
[71] Lacirignola M., Blanc I. Environmental analysis of practical design options for enhanced geothermal systems (EGS) through life-
cycle assessment. Renewable Energy, 50 (2013), 901-914.
1 2 3 4 5 6 7 8 9 10 11 12 13 14 15 16 17 18 19 20 21 22 23 24 25 26 27 28 29 30 31 32 33 34 35 36 37 38 39 40 41 42 43 44 45 46 47 48 49 50 51 52 53 54 55 56 57 58 59 60 61 62 63 64 65
[72] Frick S., Kaltschmitt M., Schröder G.. Life cycle assessment of geothermal binary power plants using enhanced low-temperature
reservoirs. Energy 01/2010, 35(5), 2281-2294.
[73] Frick S., Lohse C., Kaltschmitt M. Environmental Impacts through Geothermal Power Generation in Germany. ENGINE Workshop
6, Athens, 14 September 2007.
[74] U.S. Department of Energy, National Energy Technology Laboratory. Role of Alternative Energy Sources: Geothermal Technology
Assessment. August 2012
[75] Alsema. E. A. Energy Pay-back Time and CO2 Emissions of PV Systems. Progress in Photovoltaics: Research and Applications,
Volume 8, Issue 1, pages 17–25, January/February 2000.
[76] Raugei M., Bargigli S., Ulgiati S., ‖Life cycle assessment and energy pay-back time of advanced photovoltaic modules: CdTe and
CIS compared to poly-Si‖, Energy, 32, 1310–1318. 2007.
[77] Nishimura A., Hayashi Y., Tanaka K., Hirota M.,. Kato S, Ito v, Araki K., Hu E.J. Life cycle assessment and evaluation of energy
payback time on high-concentration photovoltaic power generation system. Applied Energy 01/2010, 87(9), 2797-2807.
[78] Raugei M., Frankl P., ―Life cycle impacts and costs of photovoltaic systems: Current state of the art and future outlooks‖, Energy,
34, 392–399 (2009).
[79] Sumper A., Robledo-García M., Villafáfila-Robles R., Bergas-Jané J., Andrés-Peiró J. Life-cycle assessment of a photovoltaic
system in Catalonia (Spain). Renewable and Sustainable Energy Reviews 15 (2011) 3888–3896.
[80] Koroneos C., Stylos N., Moussiopoulos N. LCA of Multicrystalline Silicon Photovoltaic Systems. International Journal of Life Cycle
Assessment, 2006, 11 (3), 183 – 188.
[81] Fthenakis V.M., Kim H.C. Photovoltaics: Life-cycle analyses. Solar Energy 85 (2011) 1609–1628.
[82] Kannan R., Leong K.C., Osman R., Ho H.K., Tso C.P.. Life cycle assessment study of solar PV systems: An example of a 2.7 kWp
distributed solar PV system in Singapore. Solar Energy 80 (5): 555-563.
[83] Masakazu Ito, Kazuhiko Kato, Keiichi Komoto, Tetsuo Kichimi and Kosuke Kurokawa. A Comparative Study on Cost and Life-cycle
Analysis for 100MW Very Large-scale PV (VLS-PV) Systems in Deserts Using m-Si, a-Si, CdTe, and CIS Modules. Progress in
Photovoltaics: Research and Applications, Volume 16, issue 1, January 2008. p. 17 – 30.
[84] Pacca S., Sivaraman D., Keoleian Gregory A.. Life Cycle Assessment of the 33 kW Photovoltaic System on the Dana Building at
the University of Michigan: Thin Film Laminates, Multi-crystalline Modules, and Balance of System Components. Center for
Sustainable Systems, University of Michigan. June 2006.
[85] Scannapieco D., Naddeo V., Belgiorno V. Sustainable power plants: A support tool for the analysis of alternatives. Land Use Policy
36 (2014) 478– 484.

Figure 1Click here to download high resolution image

Figure 2Click here to download high resolution image

Tab. 1 – Acidification Potential equivalent factors [29]
Emission SO2 equivalent factor
1 kg SOx as SO2 1 kg eq SO2
1 kg NOx as NO2 0.7 kg eq SO2
1 kg NH3 1.88 kg eq SO2
1 kg H2S 1.88 kg eq SO2
1 kg HF 1.6 kg eq SO2
1 kg HCl 0.88 kg eq SO2
1 kg SO3 0.8 kg eq SO2
1 kg NO 1.07 kg eq SO2
1 kg H2SO4 0.65 kg eq SO2
1 kg HNO3 0.51 kg eq SO2
1 kg H3PO4 0.98 kg eq SO2
Table 1

Tab. 2– Eutrophification Potential equivalent factors [30]
Emission PO4 3-
equivalent factor
1 kg PO4 3-
1 kg eq PO4 3-
1 kg COD
(Chemical O2 Demand) 0.022 kg eq PO4 3-
1 kg NOx as NO2 0.13 kg eq PO4 3-
1 kg NH3 0.35 kg eq PO4 3-
1 kg NO3 - 0.1 kg eq PO4
3-
1 kg NH4 + 0.33 kg eq PO4
3-
1 kg N 0.42 kg eq PO4 3-
1 kg P 3.06 kg eq PO4 3-
Table 2

Tab. 3 – Global Warming Potential equivalent factors [31]
Emission CO2 equivalent factor
1 kg CO2 1 kg eq CO2
1 kg CH4 25 kg eq CO2
1 kg N2O 298 kg eq CO2
1 kg SF6 22,800 kg eq CO2
1 kg CF4 5,700 kg eq CO2
1 kg C2F6 11,900 kg eq CO2
Table 3
Tab. 4 – Photochemical Ozone Creation Potential equivalent factors [32]
Emission C2H4 equivalent factor
Alkane 0.398 kg eq C2H4
Alkene 0.906 kg eq C2H4
Butane 0.363 kg eq C2H4
CH4 0.007 kg eq C2H4
CO 0.036 kg eq C2H4
Ethane 0.082 kg eq C2H4
Ethylene 1 kg eq C2H4
Ethylbenzol 0.593 kg eq C2H4
Formaldehyde 0.421 kg eq C2H4
Heptane 0.529 kg eq C2H4
Hexane 0.421 kg eq C2H4
NMVOC 0.416 kg eq C2H4
Pentane 0.352 kg eq C2H4
Propane 0.42 kg eq C2H4
Propene 1.03 kg eq C2H4
Toluol 0.563 kg eq C2H4
Xyloles 0.849 kg eq C2H4
Aromatic CHs 0.761 kg eq C2H4
Table 4

Tab. 5 – Number of data collected and processed
Environmental indicator n° of data
Acidification Potential 57
Eutrophication Potential 58
Global Warming Potential 99
Photochemical Ozone Creation Potential 41
Land Use 39
Water Consumption 32
Cumulative Energy Demand 93
Energy Pay-back Time 94
Table 5

Tab. 6 - Harmonization parameters for each technology and related harmonization formula
CSP Technology Harmonization Parameter Parameter value used Notes Solar Fraction, SF 1 The harmonization value for SF was chosen to be
100% to better estimate the emissions resulting from a “solar only” CSP plant.
Direct Normal Irradiance, DNI 2,400 kWh/m2 The value is representative of a high quality solar resource that is incident upon thousands of square kilometers in several global locations. CSP developers typically require about 2000 kWh/m2/yr to justify construction [33].
Solar-to-electric Efficiency, SE Parabolic trough plants: 15% These SE values are representative of current state-of-the-art designs for CSP technologies [33]. Central Tower plants: 20%
Lifetime, LT 30 years Median value resulting from data collection.
Harmonization formula:
, , ∙ ∙ ∙ ∙
∙ ∙ ∙
Wind power Harmonization Parameter Parameter value used Notes Capacity Factor, CF On-shore turbines: 35% Values suggested for modern turbines [34] and also
more consistent with the median values obtained from data collection. Off-shore turbines: 45%
Lifetime, LT 20 years Median value resulting from data collection.
Harmonization formula:
, , ∙ ∙
∙
Hydropower Harmonization Parameter Parameter value used Notes Capacity Factor, CF 70% Median value resulting from data collection.
Lifetime, LT 70 years Median value resulting from data collection.
Harmonization formula:
, , ∙ ∙
∙
Geothermal power Harmonization Parameter Parameter value used Notes
Capacity Factor, CF 70% Median value resulting from data collection. .
Conversion Efficiency, CE 11% Median value resulting from data collection
Lifetime, LT 30 years Median value resulting from data collection.
Harmonization formula:
, , ∙ ∙ ∙
∙ ∙
PV technology Harmonization Parameter Parameter value used Notes Direct Normal Irradiance, DNI 1,700 kWh/m2 Published literature data [35, 36], corresponding to
the average irradiation in southern Europe.
Performance Ratio, PR Rooftop and building integrated systems: 0.75
Performance ratios recommended in the IEA guidelines [37].
Ground mounted systems: 0.8
Modules Efficiency, ME Mono-Si: 20% Values representative of current state-of-the-art [35, 36, 38, 39, 40]. Multi-Si: 15%
a-Si: 6.3% CdTe: 10.9% CIGS: 11.5% Lifetime, LT 30 years Median value resulting from data collection.
Harmonization formula:
, , ∙ ∙ ∙ ∙
∙ ∙ ∙
Table 6
Related Documents